Article

Numerical Study on Stratigraphic and Structural Deformation Patterns Considering Surface Load with Pile-Beam-Arch Method Construction

1
School of Mechanics and Civil Engineering, China University of Mining and Technology, Beijing 100083, China
2
School of Architecture and Civil Engineering, Anhui Polytechnic University, Wuhu 241000, China
*
Author to whom correspondence should be addressed.
Symmetry 2022, 14(9), 1892; https://doi.org/10.3390/sym14091892
Submission received: 15 August 2022 / Revised: 2 September 2022 / Accepted: 6 September 2022 / Published: 9 September 2022

Abstract

:
Due to soil disturbance during the construction of metro stations, the initial stress of the stratum is modified, leading to ground settlement within a particular range, fracturing the surrounding buildings and even causing significant ground deformation and building collapse. This paper employed the Pile-Beam-Arch method to assemble the Daguanying Station of Beijing Metro Line 7 as the engineering background. The numerical calculation method was used to study the regulations of ground settlement and structural deformation throughout the construction stage. Meanwhile, the effect of surface loading was taken into account and surface settlement control strategies were suggested. Finally, the Stochastic medium theory was used to predict surface settlement. It was evident from the study’s findings that the pilot tunnels excavation and the arches installation accounted for 67% and 23.1% of the total surface settlement, respectively, and produced the most surface settlement. Surface settlement can be significantly reduced by utilizing grouting reinforcement technology and the pilot tunnels excavation approach of “upper first, then lower and side first, then middle”. The structure was much less stressed during the pre-construction stage, with the maximum principal stress ranging from 1 to 5 MPa; after construction was finalized, the maximum principal stress reached 14.203 MPa, concentrating mostly in the middle column part, which was the consequence of the combined action of the upper load and the lower soil uplift. Additionally, there was a linear relationship between the surface load and ground settlement. The bottom slab and the middle column were situated where the structure’s most unfavorable components were concentrated. The conclusions of the surface settlement prediction demonstrated that there were discrepancies between the theoretical calculation and the simulated; thus, the prediction results were more conservative. The study results can serve as a reference for construction sites.

1. Introduction

Experts and scholars from home and abroad have increasingly focused on the development of underground space in order to accommodate the traffic demand brought on by the expanding urban population, with the construction of subway stations and tunnels being one of the highest priorities [1,2,3,4]. Urban subway stations and tunnels are expanding at a rapidly increasing rate, but this presents a variety of issues, including complicated geological conditions and the consequences of structural features. The three most commonly used conventional construction techniques are the open-cut method, the underground excavation method, and the shield method. Engineers have explored and developed a range of subway tunnel construction methods in conjunction with engineering practice to address these issues [5,6,7]. The PBA method has gained popularity by combining the advantages of open-cut and underground excavation methods. It is frequently utilized to construct metropolitan metro stations with substantial ground traffic due to its extensive applicability and minimal environmental impact, as well as several engineering practices, that have demonstrated its vast application prospects [8,9,10].
Many scholars have studied the effects bobbing up by the construction method and the use of the PBA method, with the most detailed understanding concerning the excavation stage of the pilot tunnels [11]. The excavation of the pilot tunnels is the key stage of surface settlement. The results of a large variety of studies suggested that the excavation sequence of the pilot tunnels had a significant effect on the development of the surface settlement. In addition, the number of pilot tunnels can also have an effect on the surface settlement [12,13]. The Stratigraphic deformation is precipitated by way of the soil disturbance caused by excavation, which leads to the redistribution of stresses and varies from location to location. In addition, the excavation of multiple adjacent pilot tunnels will result in a “group tunnel effect”, and the ultimate surface settlement will be greater than the superimposed impact of individual settlement [14,15,16]. In addition to the deformation influence regulation of the soil during construction, an evaluation of the structural deformation and stress of the station itself exhibited that growing the pile diameter is an effective solution when the deformation manipulation of the side piles is required [17,18].
During the construction of subway stations, in addition to the deformation caused by the disturbance of the soil around the station, the deformation of the station structure cannot be ignored. It has been found that during the construction process [19,20,21,22,23], the top arch of the primary lining and the center column of the subway station is subjected to large axial forces, and the side piles are subjected to more obvious lateral forces. Many scholars have studied the structural optimization of subway stations to make the structural arrangement more reasonable. However, due to practical reasons, the data obtained from the field and test are always limited. With the rapid development of computers, numerical computation is widely used in engineering practice [24,25,26,27,28,29] and the use of the finite element method to study engineering problems has become indispensable. A considerable number of scholars have achieved good results by using the numerical computation method to study engineering problems.
Considering the hazards of surface settlement caused by subway tunnel construction, it is necessary to predict the surface settlement in order to minimize their negative effects. Initially, empirical methods were typically used to predict surface settlement [30]; however, their origin is partly from engineering practice and their accuracy is more influenced by geological conditions. This led to another theoretical prediction method of surface settlement, the stochastic medium theory, which is one of the most widely used and effective methods. Later scholars established the theory on the basis of not affecting the final prediction results, thus simplifying the process without affecting the final prediction results [31]. The theory provides an approximate prediction of surface settlement, which allows construction to proceed safely and effectively.
So far, most of the studies on the PBA construction method are still focused on a specific stage, and there are limited analyses on the deformation law of ground and structure during the whole construction stages, and even fewer studies on the influence of surface load on the deformation of ground and structure. However, in the actual project, the importance of surface load is self-evident. Therefore, this paper conducts research on the basis of reference [32], which takes Beijing Metro Line 7 as the engineering background, establishes a numerical analysis model by FLAC3D software, and studies the ground and structural deformation law of the subway station constructed by the PBA method in different stages, considering the influence of surface load and structural deformation, respectively. Finally, it uses the stochastic medium theory to predict the ground settlement and horizontal displacement. The conclusions obtained can be used to guide similar construction in the future.

2. Project Overview

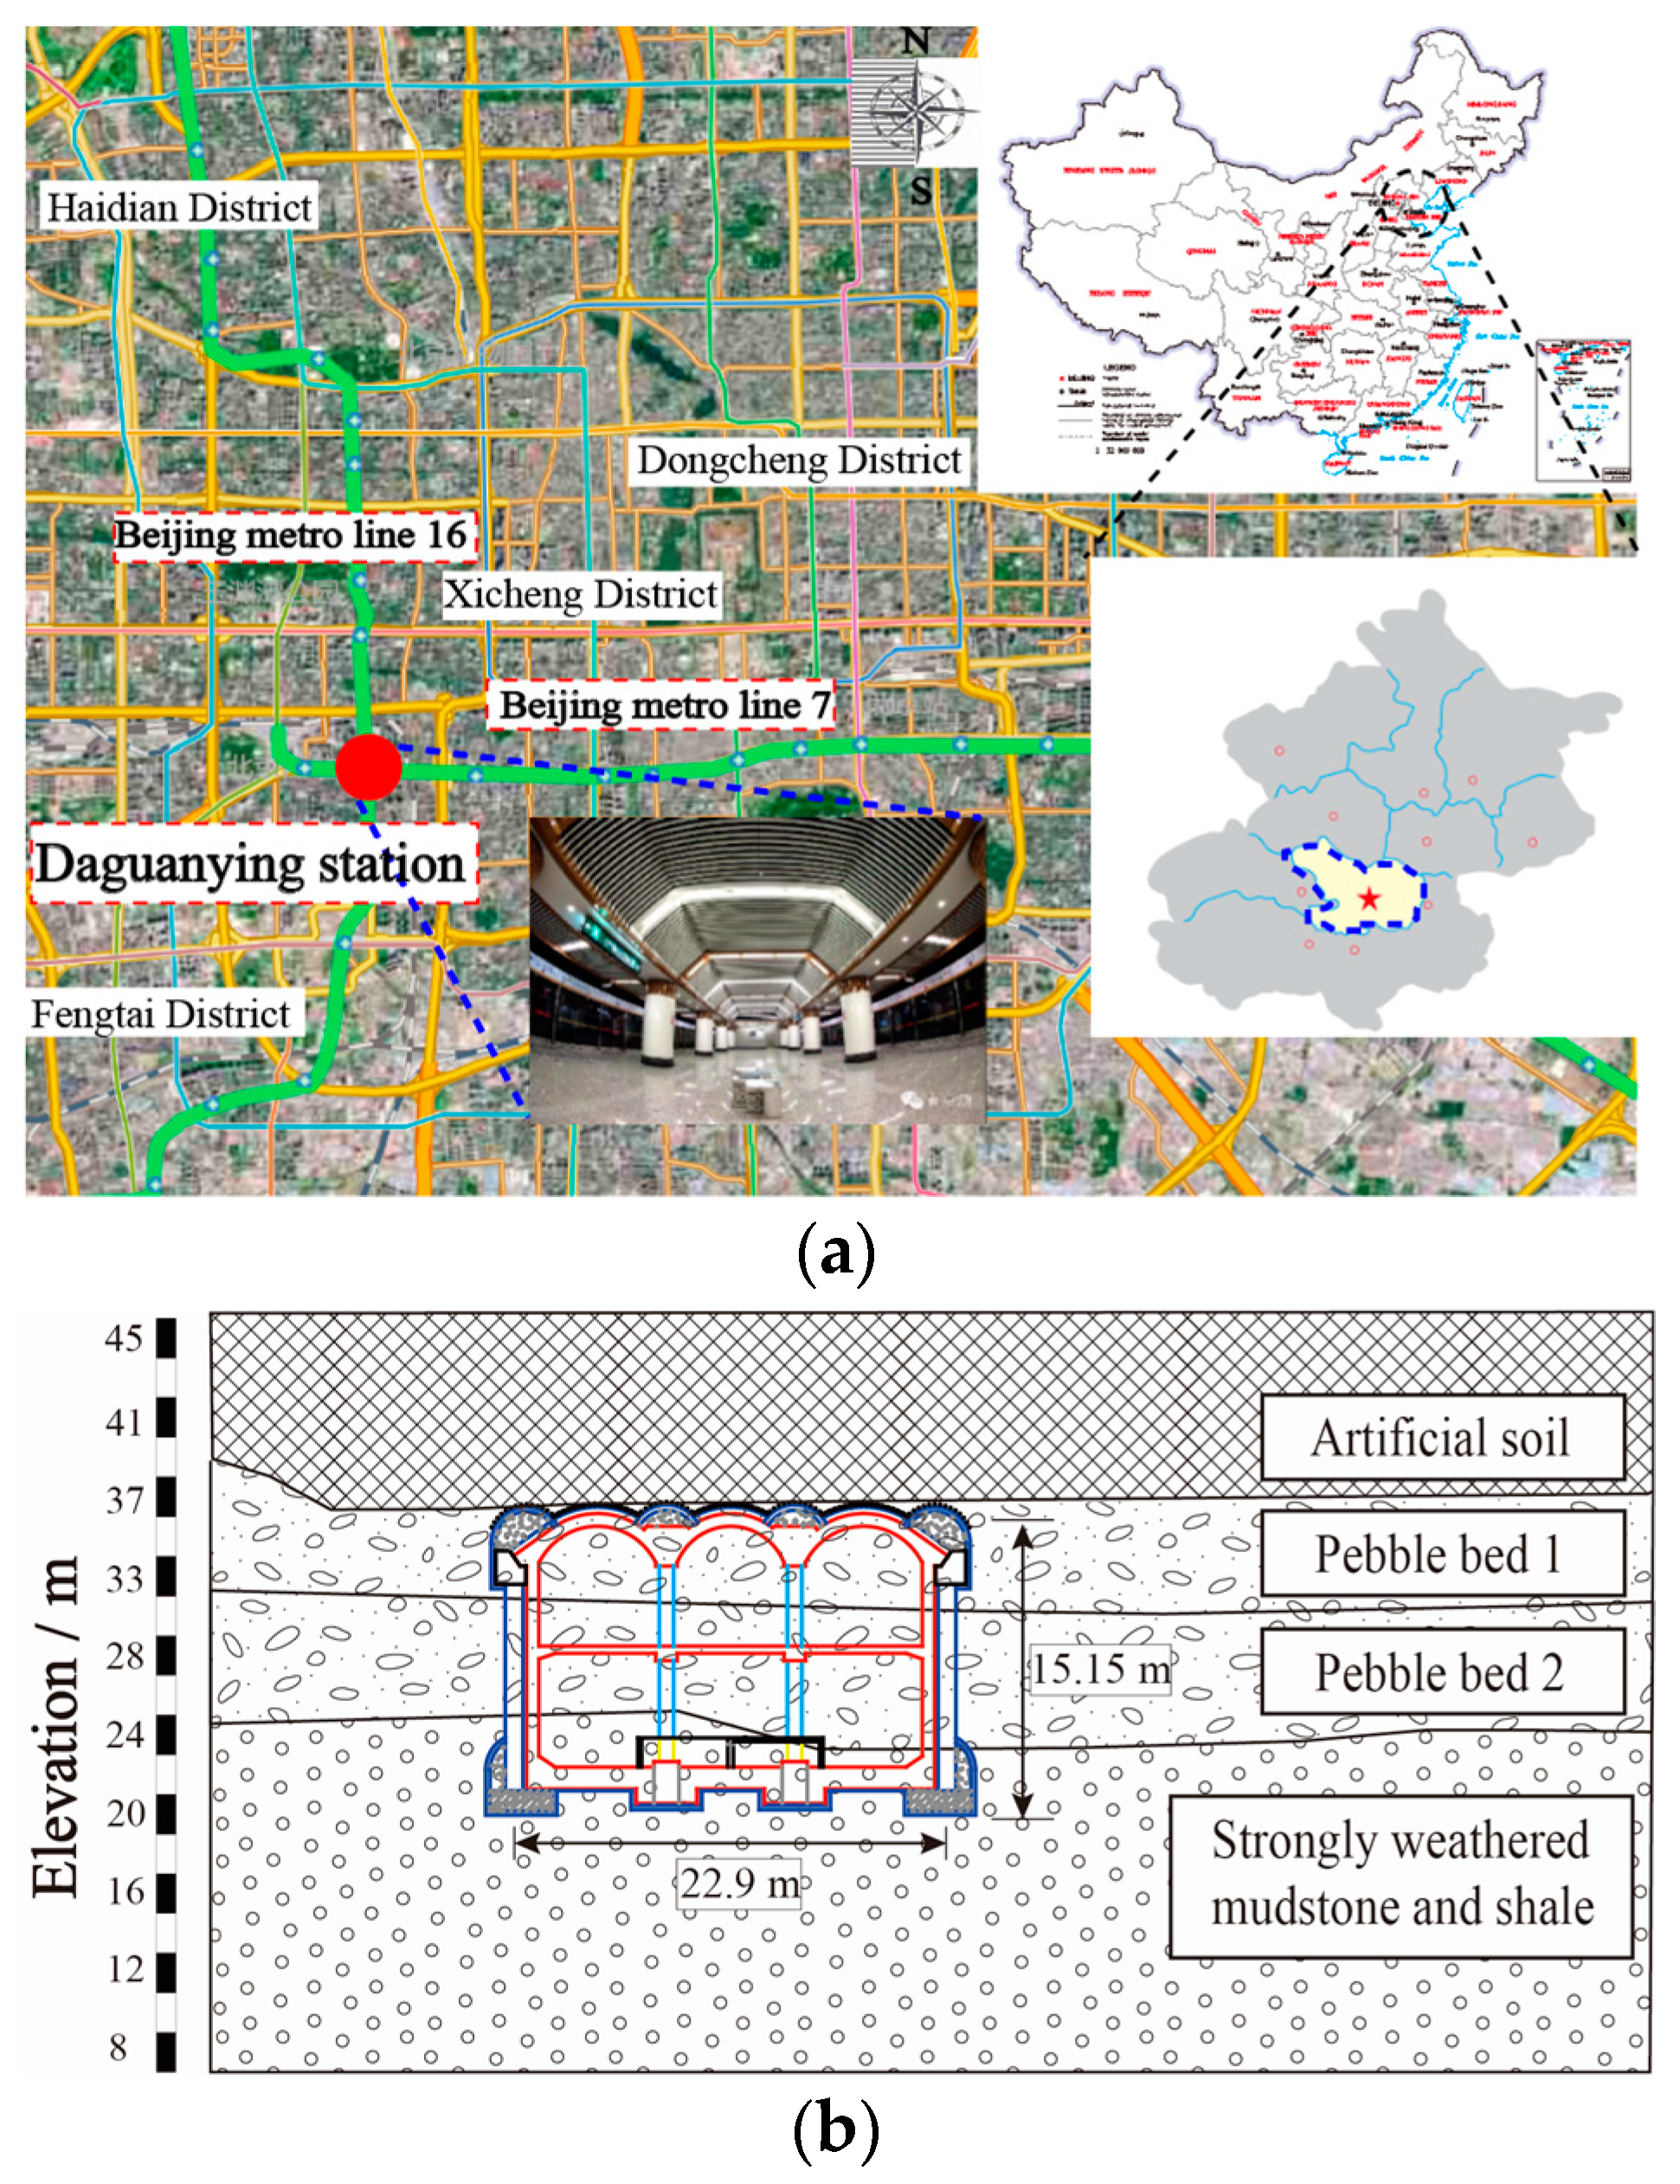
2.1. Engineering Background

Daguanying station is an interchange station between Beijing Metro Line 7 and Beijing Metro Line 16, which is located at the intersection of Guang’anmenwai Avenue and the planned Sanlihe Road South Extension. (Figure 1a) The station of Beijing Metro Line 7 is located on the east side of the intersection and is arranged in an east–west direction, while the station of Line 16 is on the north side and in a north–south direction. Due to the complex geological environment, busy ground traffic, and many environmental risks such as pipelines and rivers, the PBA method was finally adopted for concealed excavation construction after considering various factors.
Daguangying station is an underground double-decker three-span station with an island platform design. The station size is long × wide × high = 236 m × 22.9 m × 15.15 m, with an overburden thickness of about 9 m. The station mainly traverses four soil layers, which are artificial filled soil, pebble bed 1, pebble bed 2, and strongly weathered mudstone and shale, (Figure 1b) and the mechanical parameters of the rock and soil are shown in Table 1. In this work, the construction process of this station is chosen as the engineering background for analysis, and the deformation of the strata and station structure at some stage in the construction process is analyzed.

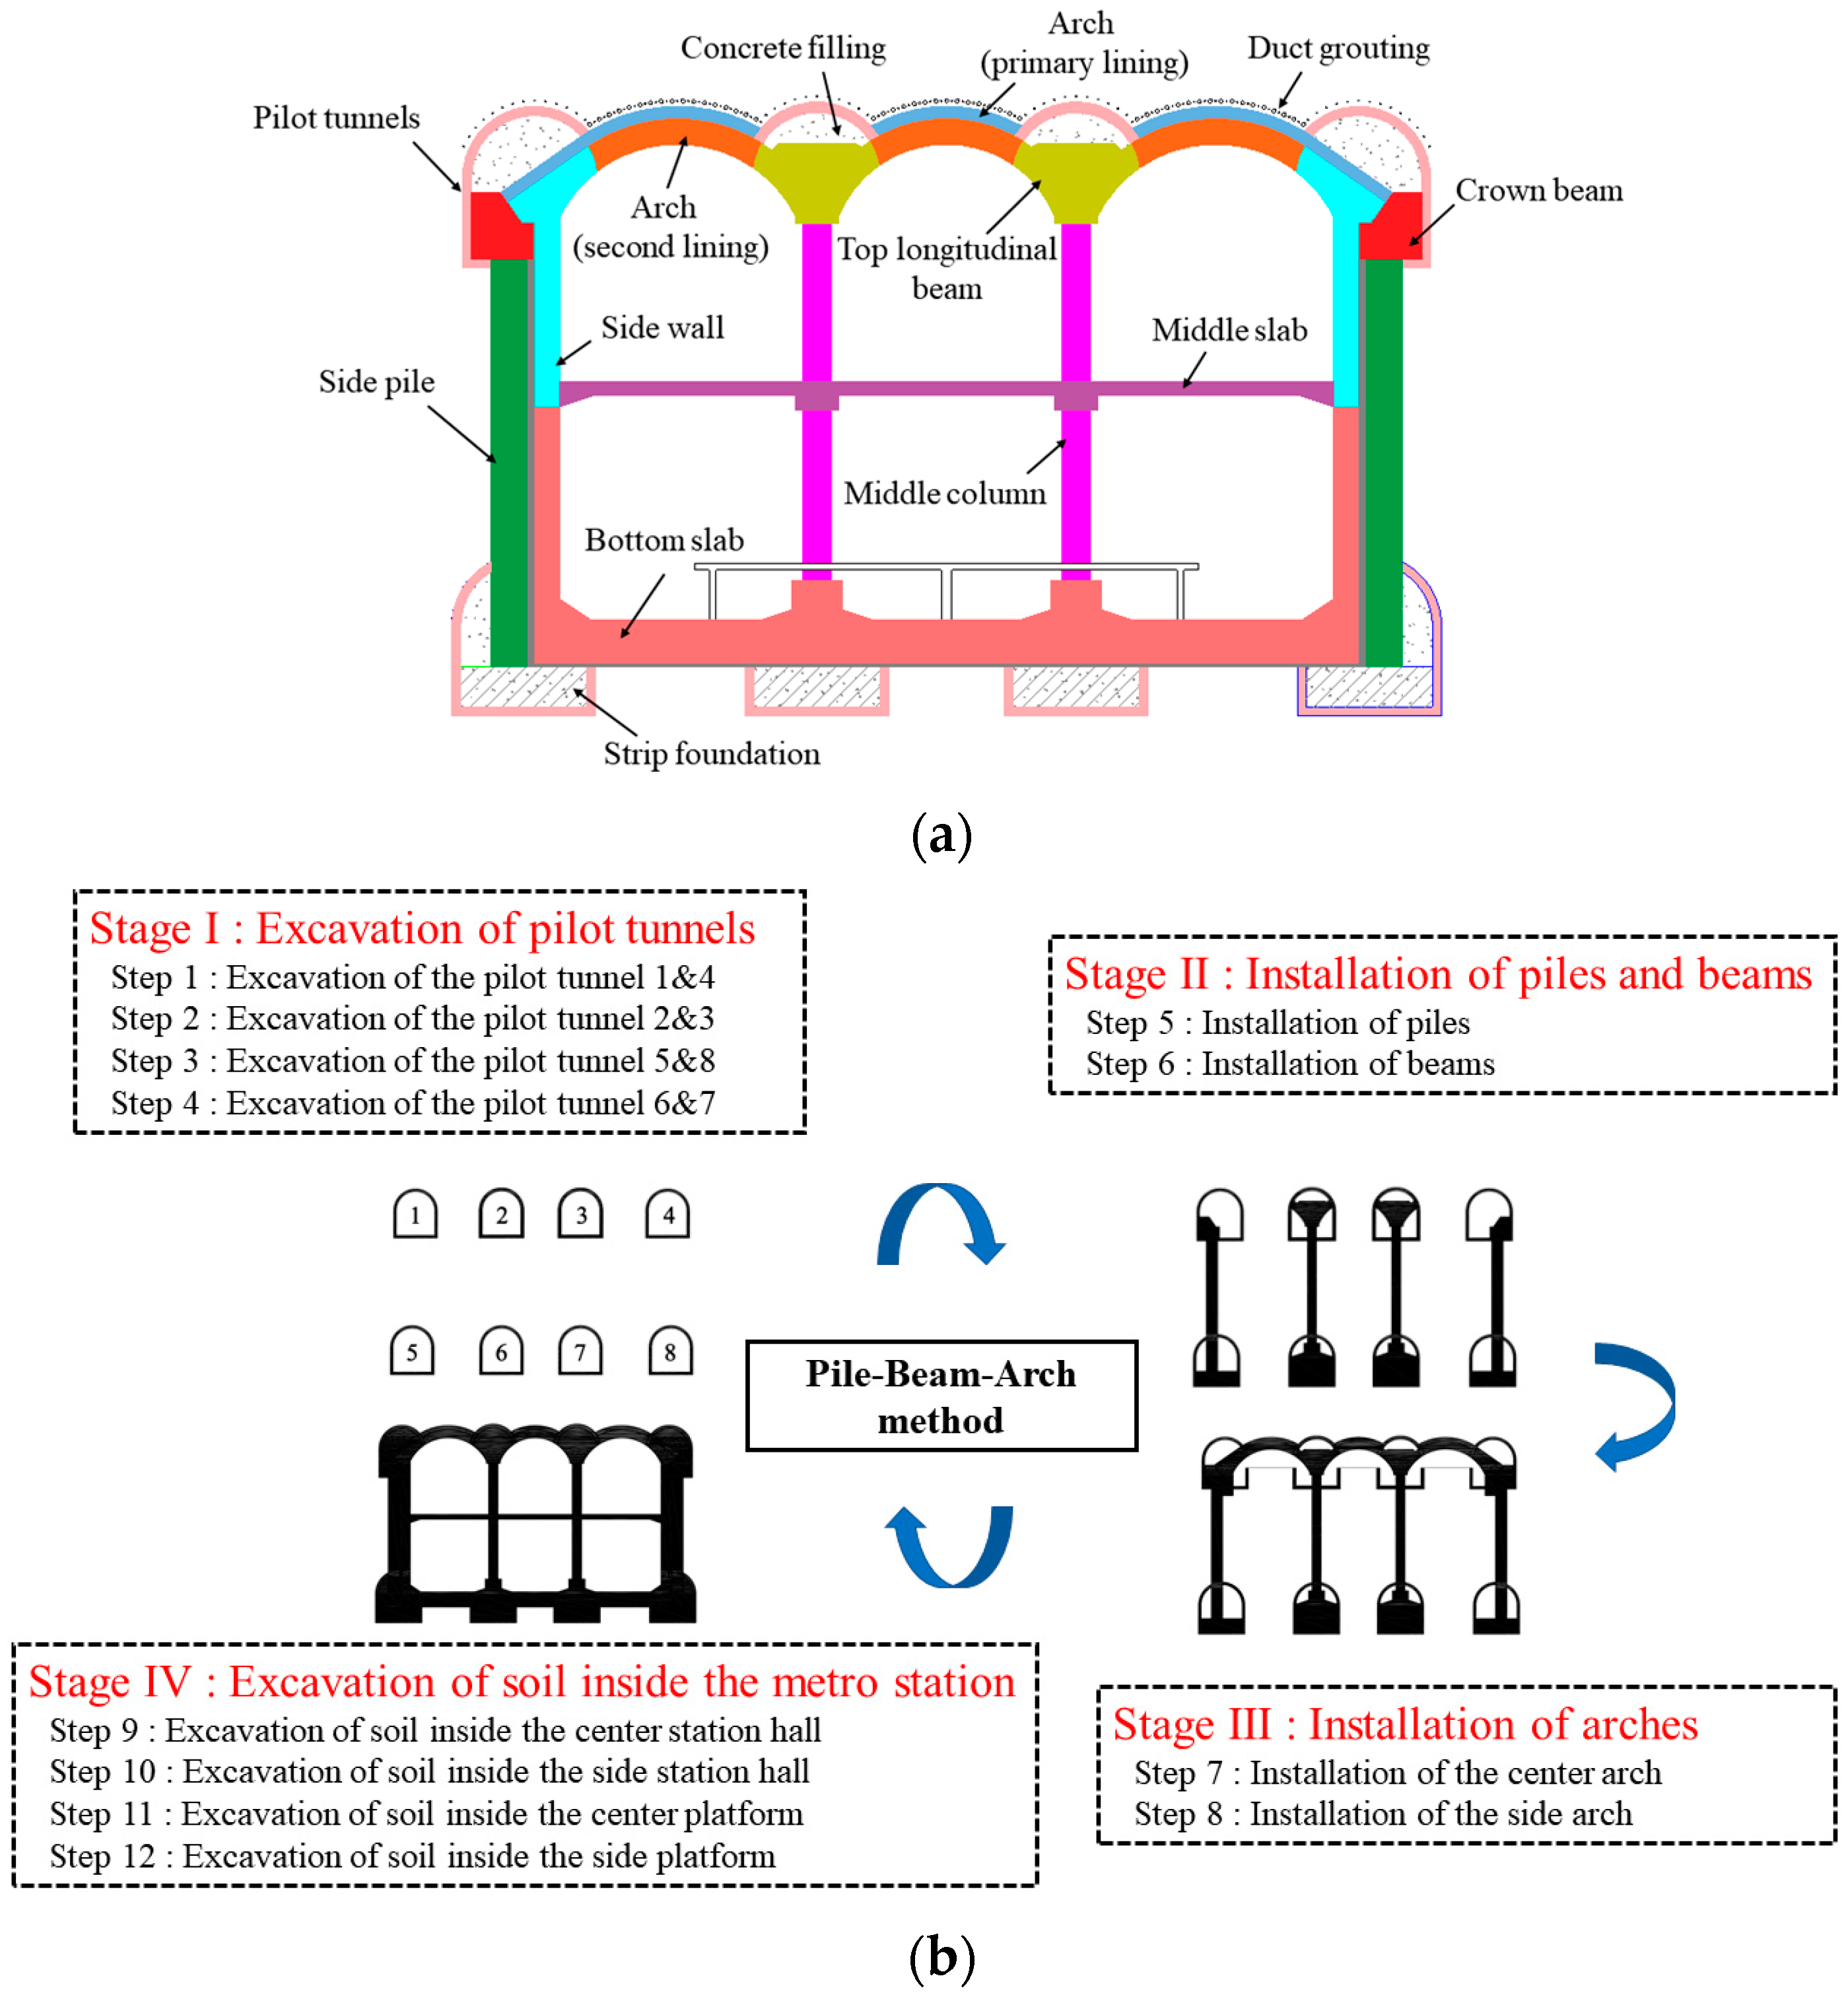
2.2. Introduction to the PBA Method

The PBA method, additionally acknowledged as the hole-pile method, is an organic combination of the typical ground frame structure and underground excavation method. Firstly, pilot tunnels are dug in advance underground, and then structural supports such as side piles, middle columns, bottom beams, top beams, and an arch are installed in the pilot tunnels to structure a pile, beam, and arch support frame system to bear the external load all through construction. Protected by means of the arch and side piles, the soil is the excavated layer with the aid layer from top to bottom to shape the inner structure. Finally, a system of permanent bearing is formed (Figure 2a).
The PBA method of construction can reduce ground settlement, a smaller workload of removing temporary support, safer excavation of the main cavern, higher work efficiency, and mechanical excavation can be implemented. However, the process of conversion is complicated and is mainly divided into four stages, as shown in Figure 2b, and each stage contains several steps. Due to the high requirements for the connection and organization of each process, it is very important to master the ground and structural deformation of each stage node for safe construction.

3. Ground and Structure Deformation Analysis

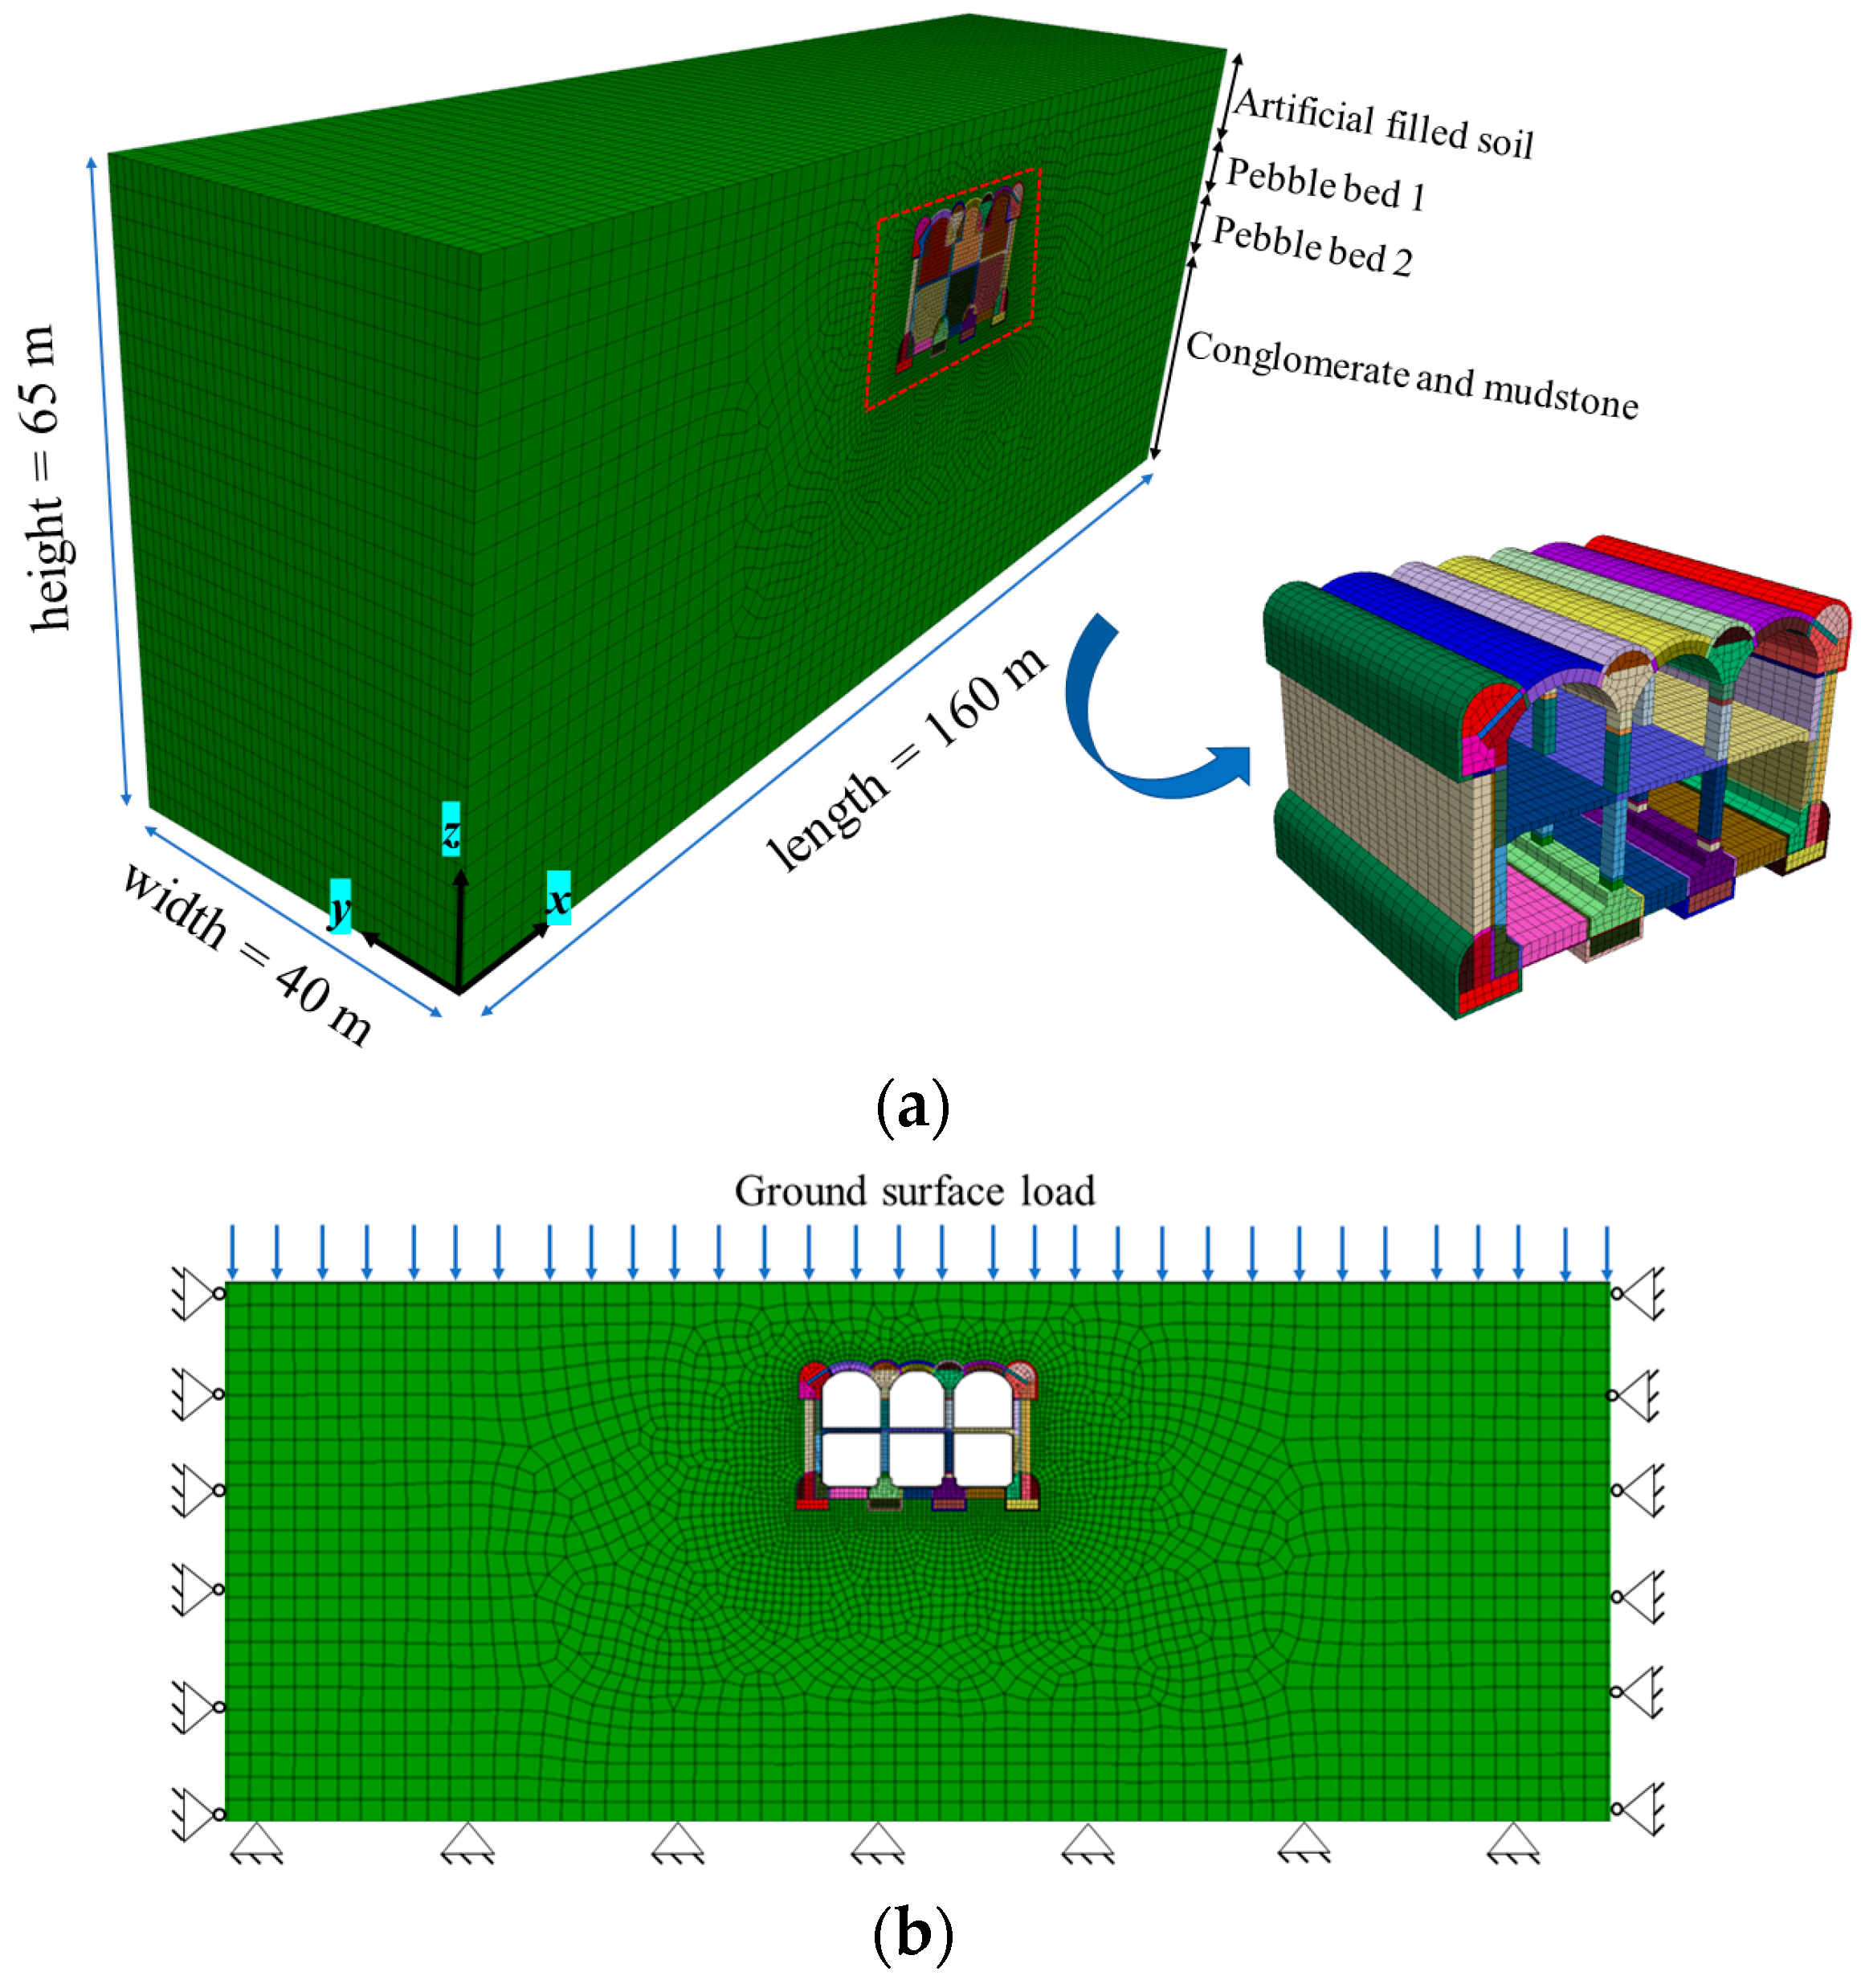
3.1. Establishment of Numerical Model

According to the geological conditions and structural dimensions of the subway station provided by the construction site, a three-dimensional numerical calculation model was established using the finite element software FLAC3D, as shown in Figure 3a. In order to reduce the influence of boundary conditions, and improve the efficiency of numerical calculation, the model was built with a length × width × height = 180 m × 40 m × 65 m. The thickness of each soil layer was 9 m, 4 m, 7 m, and 45 m from top to bottom, and all soil layers were assumed to be horizontal. To make the calculation results more accurate, the grid of the key study area is encrypted. At the same time, displacement boundary conditions need to be imposed on the model: the model is fixed with roller supports around the perimeter, pinned supports at the bottom of the model, and the ground is set as a free surface. (Figure 3b) In the numerical calculation, the ground is considered as the ideal elastoplastic material, and the Mohr–Coulomb constitutive model is used; the required parameters are shown in Table 1. For the structural part of the subway station, the linear elastic constitutive model is used, and the required parameters are shown in Table 2. In addition, the effect of applying different magnitudes of surface loads on the construction of the metro station can be considered in the subsequent simulation of excavation.
Since the complicated construction method of the PBA method, in the technique of performing numerical calculations, this paper solely studies the consequences of the predominant construction approaches of the subway station on the deformation of the ground and the station structure, i.e., the 12 specific steps in Figure 2b can be simplified into 4 stages: stage I with the excavation of the pilot tunnels; stage II with the installation of piles and beams; stage III with the installation of the arch; and stage IV with the excavation of the interior soil of the station and the construction of the inside structures.

3.2. Stratigraphic Deformation Pattern Analysis

The monitoring point (x = 80 m, y = 20 m, z = 65 m) was set in the middle of the ground surface to acquire the settlement records curve throughout construction, as shown in Figure 4. Plastic deformation of the stratum occurred during construction, and the ground settlement was divided into 4 stages: stage I included the excavation of eight pilot tunnels, and the surface settlement at this time reached 19.7 mm; stage II included the construction of side piles and central columns, a smaller settlement of 2.9 mm was produced; and stage III included the primary and secondary linings of the arch construction, and the settlement at this stage was 6.8 mm. After the completion of the first three stages of construction, the station shape was initially formed, and at some points during the excavation of the inner soil of the station in the stage IV, the surface settlement used to be minimal due to the support of the outer structure, and in the late stage of construction, the surface settlement seemed to “rebound” with a rebound value of 1.6 mm. The ultimate settlement for the ground surface used to be 27.8 mm.
The displacement statistics of all monitoring points at the surface y = 20 m and z = 65 m have been extracted, and the surface displacement curves have been drawn as shown in Figure 5. Among them, Figure 5a indicates the surface vertical settlement trough, and Figure 5b indicates the surface horizontal displacement.
From Figure 5a, it can be viewed that the surface settlement troughs have the same form at specific construction stages and are allotted axially symmetrically alongside the center of the surface, which is approximately Gaussian distribution. The settlement value at the surface center is the largest, and step by step decreases as the distance from the center increases, and the affected range of surface settlement reaches 80 m, which is about four times the width of the station. With the continuous construction, the width of the surface settlement trough and the surface settlement gradually increased, and the maximum settlement values of every stage corresponded to Figure 4. It is noteworthy that after the fourth stage, the surface settlement seems to “rebound”, and the last surface settlement and the width of the settlement trough are smaller than the 3rd stage.
From Figure 5b, it can be viewed that, unlike the distribution of the surface settlement trough curve, the horizontal displacement curve of the surface has an antisymmetric distribution alongside the center point of the surface during the special construction stages. With the traits of double-peaked curve distribution, the horizontal displacement of the center point of the surface is 0, and with the increase in the distance from the center point, its horizontal displacement increased first and then decreased, and the peak seemed at about 15 m from the center point of the surface, and its impact on the range was about 80 m. During construction, horizontal displacement of the surface typically occurs in the first three stages, and the last horizontal displacements produced are 7 mm, 7.9 mm, and 10.0 mm, respectively. Furthermore, nearly no new horizontal displacements are produced in the fourth stage; however, it does decrease.
The vertical displacement distribution of the strata at different construction stages is shown in Figure 6. From the figure, it can be seen that taking the floor of the station structure as the boundary, above the floor, the strata produce downward displacement, i.e., “settlement”, and below the floor, the strata produce upward displacement, i.e., “uplift”. symmetrical distribution along the center of the model. The final settlement value in the first stage is 44.4 mm and the augmentation value is 24.8 mm; the second stage is 43.7 mm and 30.3 mm; the third stage is 43.3 mm and 35.3 mm; and the fourth stage is 49.1 mm and 41.7 mm. It can be seen that the settlement and the augmentation produced in the first stage are larger.
The vertical displacement data of all monitoring points at the vertical center point of the model (x = 80 m, y = 20 m) were extracted, and the vertical displacement curves at different construction stages were drawn, as shown in Figure 7. It can be seen that the vertical displacement curves are different for the four stages. Above the base slab, the ground displacement has a negative value, i.e., “settlement”, and below the base slab, the ground displacement has a positive value, i.e., “uplift”. The largest displacements occurred near the station floor. During the first three stages of construction, the ground settlement above the base slab gradually increased as the construction progressed, while the ground displacement below the base slab remained almost constant. In the fourth stage, the ground displacement above the bottom slab decreased, while the ground displacement below the bottom slab began to increase.
The maximum displacement of the ground surface determines the ground building’s safety. From the above study, it can be determined that the surface settlement mostly takes place in stages I, II, and III, and the settlement in these three stages accounts for 67%, 9.9%, and 23.1% of the maximum settlement, respectively. The horizontal displacement of the surface likewise commonly takes place in stages I, II and III, and the horizontal displacement in these three stages accounts for 70%, 9% and 21% of the most horizontal displacement, respectively. It can be viewed that surface settlement and horizontal displacement account for the biggest percentage in stages I and III, so the excavation of the pilot tunnels and the installation stage of the arch are the key hyperlinks of surface displacement control.
In addition, it can be observed that the ground displacement rebounded after the completion of the fourth stage of construction. The important reason is that after the completion of the arch in stage III, the frame system of “pile-beam-column-arch” is formed, which bears the stress between the inside and exterior soil and forms a common system of “structure-soil” with the interior soil. However, with the further excavation of the station, the interior soil decreases and the self-weight of the “structure-soil” system decreases, which leads to the “rebound” of the surface settlement. The rebound mechanism is proven in Figure 8.

3.3. Structural Deformation Pattern Analysis

During the construction process, the station structure can be affected by the surrounding soil pressure in addition to its own load, resulting in stress concentration in a certain part of the structure, which is very unfavorable to the structural stability. The maximum principal stress distribution of the station structure in different construction stages is shown in Figure 9. In the first stage of excavation, the maximum principal stress was mainly distributed in the footing and arch waist of the pilot tunnels, and the maximum principal stress value was 1.283 MPa (compressive stress). The maximum principal stress distribution in the second stage was similar to that in the first stage, with the maximum principal stress value of 1.287 MPa. In the third stage, the maximum principal stress was mainly distributed above the primary lining of the arch, crown beam, and center column, and the maximum principal stress value is 4.530 MPa. In the fourth stage, the maximum principal stress was mainly distributed in the middle column; under the middle column especially, the maximum principal stress value reached 14.203 MPa. It can be seen that in different construction stages, the maximum principal stress distribution was different and the value was also different; in the fourth stage especially, the maximum principal stress value increased significantly, so in the construction stage, reinforcement measures should be taken in the obvious parts of the stress concentration.

4. Ground and Structure Deformation Analysis Considering Surface Load

This section analyzes the fourth stage of the PBA construction method in addition to the impact of surface loading. In fact, in true engineering, the impact of surface loading is inevitable; in dense traffic areas especially, the impact of surface loading is particularly obvious. Therefore, it is integral to study the deformation traits of the ground and structure under the motion of surface load.

4.1. Ground Deformation Law under Surface Load

The surface center settlement history curves under different surface loads are shown in Figure 10. As can be seen in the figure, the surface center settlement trend under the action of the surface load is the same as the distribution of the no-load case, and the surface center settlement value increases gradually with the increase in surface load, which has good regularity. In addition, as shown in Figure 11, which compares the surface displacement curves after construction completion under different surface loads, it can be seen that the surface displacement curves have the same distribution form and the same width of settlement trough, and their maximum settlement and maximum displacement increase with the increase in surface load. Moreover, for every 10 kPa increase in surface load, the surface settlement increases about 1.76 mm and the horizontal displacement of the surface increases about 0.5 mm.
As shown in Figure 12, the relationship between the surface load and the surface displacement at different construction stages is linearly correlated, with a correlation of R2 > 0.9. The surface displacement changes with the surface load can be divided into two parts. The first part is the first and second stages, at which the surface displacement changes with the load at the same rate, and the amount of displacement increase by different loads is also the same. The second part is the third and fourth stages; compared with the first and second stages, the rate of change in surface displacement with load is larger in this stage, and with the increase in load, the amount of change in displacement in the third and fourth stages gradually decreases. It can be seen that the surface load has an influence on the surface displacement of different stages of construction, and it has a greater influence on the construction of the third and fourth stages, and the difference in the surface displacement produced by different stages becomes more and more obvious with the increase in the load.
The vertical displacement curves under different loads are proven in Figure 13. It can be considered that with the increase in surface load, the settlement value above the station vault will increase gradually, whilst the ground displacement below the station floor will stay nearly unchanged. It is indicated that the surface load has a higher impact on the settlement at the top of the station vault and has little effect on the floor displacement below the bottom slab.

4.2. Structure Deformation Law under Surface Load

The maximum principal stress distribution of the station structure under different surface loads is shown in Figure 14. It can be seen that the maximum principal stress increases gradually with the increase in the surface load, and the maximum principal stress values generated by the four surface loads are 14.951 MPa, 15.849 MPa, 16.632 MPa, and 17.455 MPa, which are all mainly concentrated in the middle column part. It can be found that with the increase in the surface load, tensile stresses appear at the bottom plate of the structure, and the values of tensile stresses corresponding to the four surface loads are 1.567 MPa, 1.722 MPa, 1.721 MPa, and 1.787 MPa, respectively. For the structure, its compressive strength is much larger than the tensile strength; therefore, during the construction, when the overlying load changes, the bottom plate of the structure as the most unfavorable location should take effective preventive measures in time.
The construction of an underground station makes the settlement of the ground surface uneven and forms a settlement trough. The influence of various factors on the surface displacement should be considered during the construction of subway stations so as to minimize the surface displacement and ensure the safety of the third building. For the station structure itself, the stress concentration area should be reinforced in time to optimize the structural arrangement and ensure the safety of the construction process.

4.3. Key Measures for Stratigraphic Deformation Control
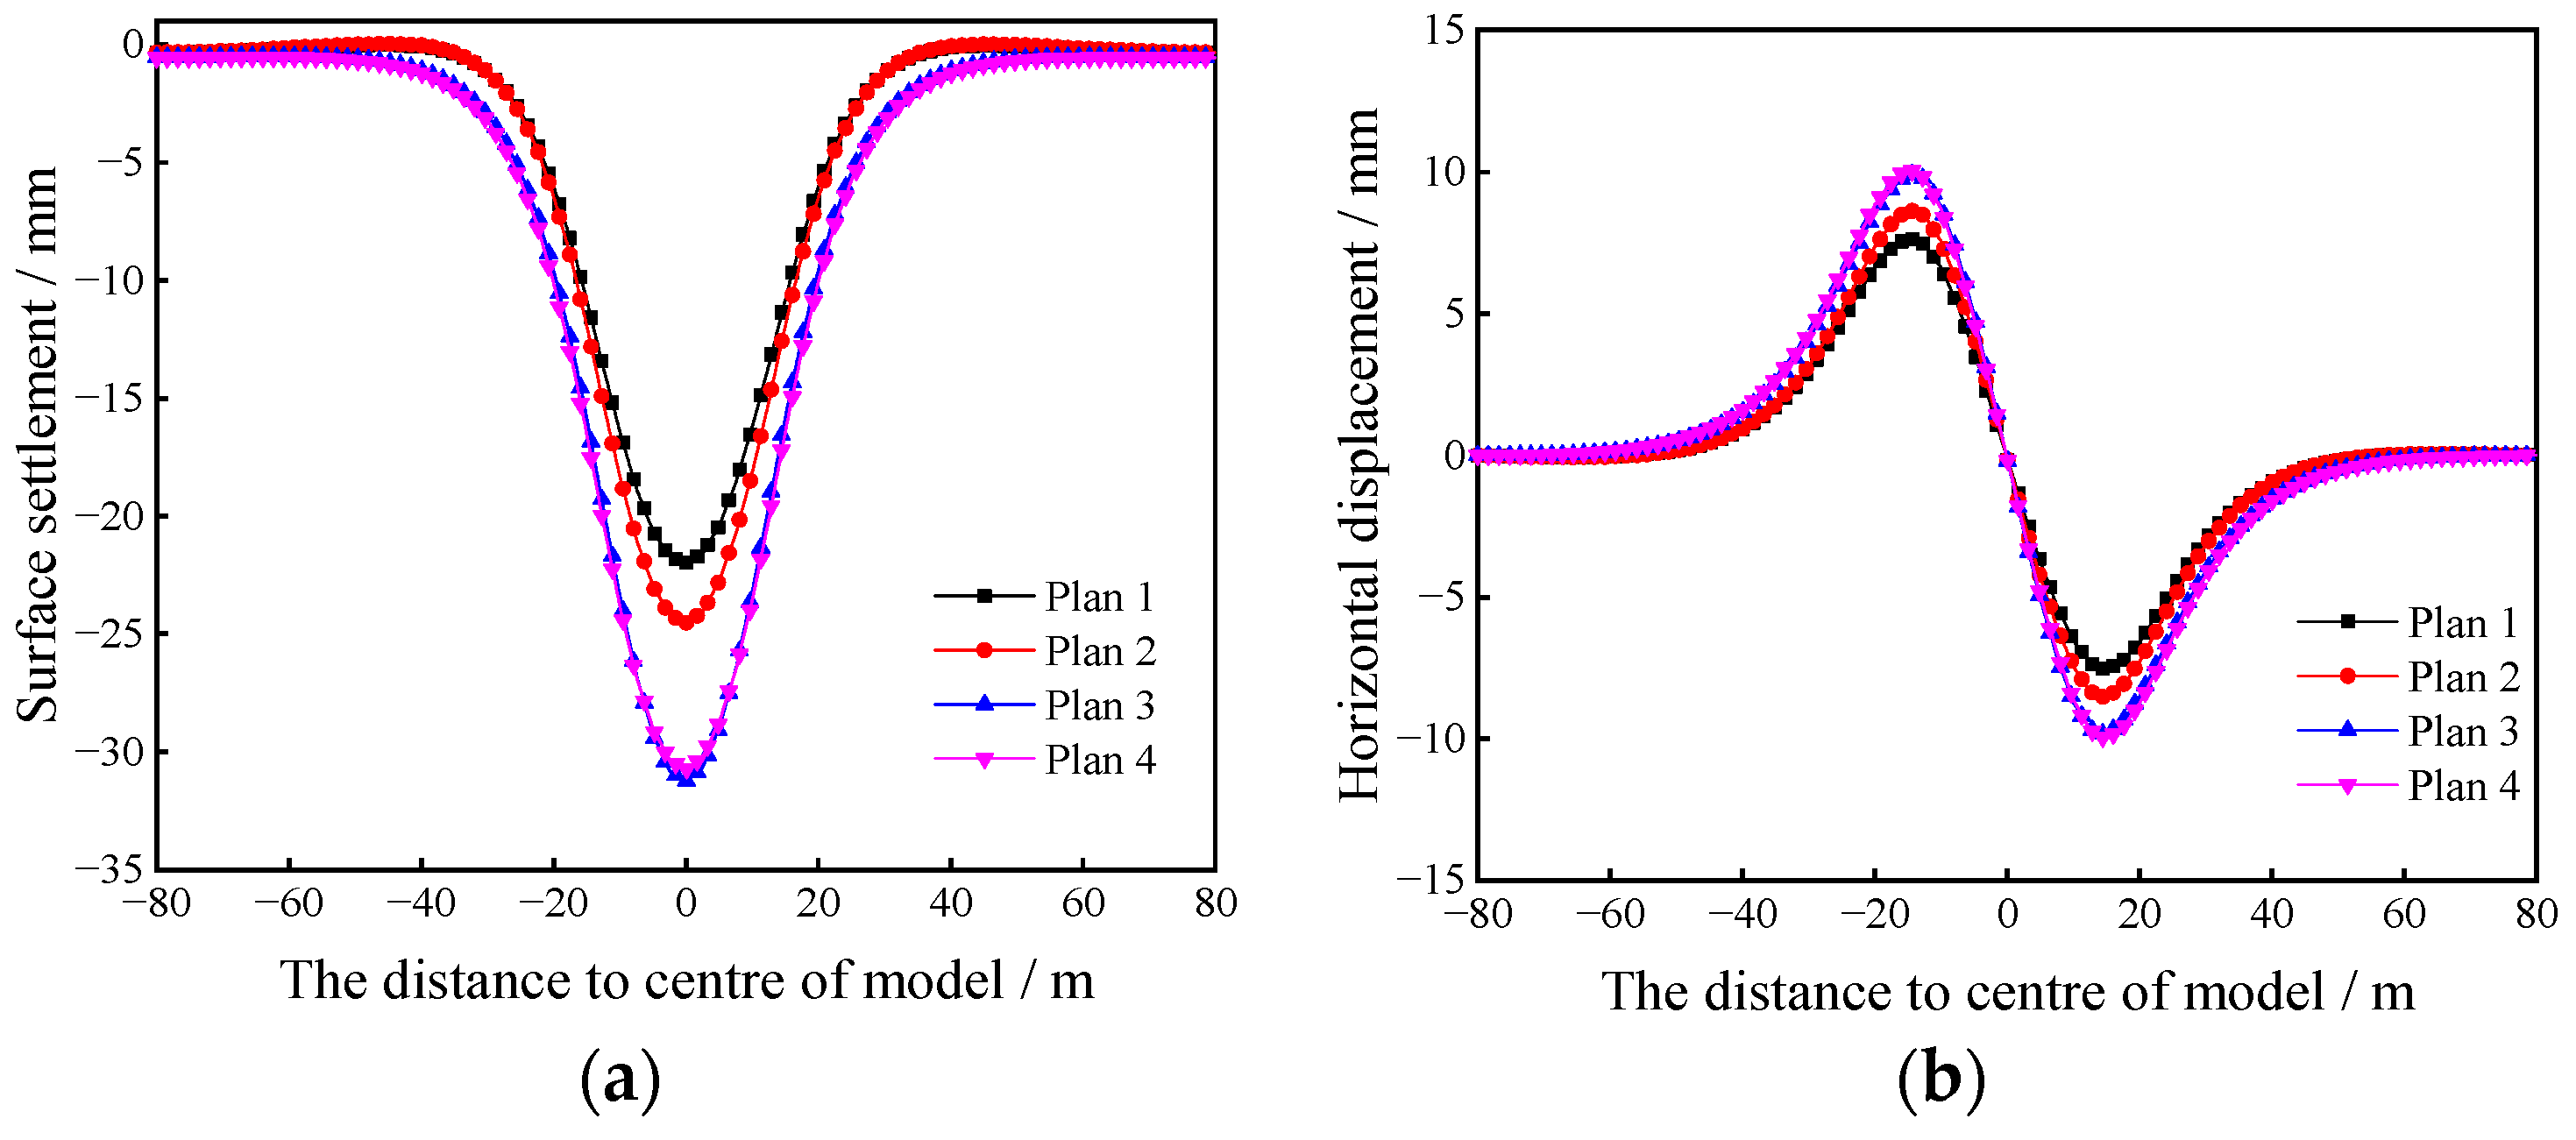
From Figure 4 and Figure 10, it can be found that the surface settlement and horizontal displacement mainly occur in the first and third stages, so in order to control the ground deformation, the excavation of the pilot tunnels and the arch installation are the key links. For the excavation stage of the pilot tunnels, in addition to measures such as reducing the number and strengthening the support of pilot tunnels, the influence of a reasonable excavation sequence of pilot tunnels on ground deformation cannot be ignored. Taking the surface load P = 20 kPa as an example, four pilot tunnel excavation schemes are designed as follows:
  • Plan 1: 1&4 2&3 5&8 6&7
  • Plan 2: 2&3 1&4 6&7 5&8
  • Plan 3: 5&8 6&7 1&4 2&3
  • Plan 4: 6&7 5&8 2&3 1&4
The surface displacement curves obtained according to different pilot tunnel excavation schemes are shown in Figure 15. For surface settlement, different excavation sequences produced different settlement trough curves when other conditions were the same. The smallest surface settlement is 21.9 mm for plan 1, 24.5 mm for plan 2, and 31.2 and 30.7 mm for plans 3 and 4, respectively. Similarly, for the horizontal surface displacement, the smallest horizontal surface displacement of 7.7 mm is produced by using plan 1, while the other plans are 8.6 mm, 10 mm and 10.1 mm, respectively. The excavation plan of “upper first and then lower, sides first and then middle” was considered the best construction plan, as it can effectively reduce the surface displacement.

5. Settlement Prediction Based on Stochastic Medium Theory

5.1. Stochastic Medium Theory Analysis

The stochastic medium theory (SM method) was once proposed by Polish scholar J. Litwiniszyn to determine the movement of rock strata and surface prompted by coal mining. This theory was then improved by Chinese scholars to gradually make this concept mature. The theory is to think about the rock and soil as a stochastic medium, and the ground movement process as a random system obeying the statistical law, which can be used to study the surface movement through the probability integral method. According to the stochastic medium theory, the influence of tunnel excavation on the surface can be equated to the sum of the effect of every microelement excavation that constitutes this excavation. As proven in Figure 16, the preliminary part of the tunnel excavation is Ω, and after finishing, the excavation area shrinks from Ω to w. According to the superposition principle, it is recognized that the actual amount of surface subsidence W(x) is equal to the difference between the subsidence caused by the excavation range Ω and the subsidence caused by the excavation range w, that is
W ( x ) = W Ω ( x ) W ω ( x ) = Ω ω tan β η exp { π tan 2 β η 2 ( x ξ ) 2 } d ξ d η
Similarly, the surface horizontal displacement U(x) caused by the tunnel construction should be equal to the difference between the horizontal displacement caused by the excavation range Ω and the horizontal displacement caused by the excavation range w, i.e.,
U ( x ) = U Ω ( x ) U ω ( x ) = Ω ω ( x ξ ) tan β η 2 exp { π tan 2 β η 2 ( x ξ ) 2 } d ξ d η
where Ω is the initial tunnel cross-section, w is the tunnel cross-section after deformation, and β is the ground settlement influence angle determined by the ground conditions. It can be obtained from the following equation.
tan β = H / 2.5 i
i = H 2 π tan ( 45 ° ϕ ¯ / 2 )
where i is the width coefficient of the settlement trough, which is the distance between the inverse bend and the origin of the ground settlement curve, ϕ ¯ represents the weighted average of the ground friction angle, and H represents the burial depth from the ground surface to the center of the tunnel.
According to the above equations, the surface displacement of a tunnel with an arbitrary shape area can be calculated. However, it can be considered from Equations (1) and (2) that the quadratic integration is challenging to achieve the original function, and the integration place is complicated and difficult to calculate. Yang and Wang [33] proposed a simplified formula for predicting settlement in circular tunnel excavation based on a uniform convergence displacement model under plane strain conditions.
W ( x ) 2 π R Δ A tan β H exp { π tan 2 β H 2 x 2 }
U ( x ) 2 π R Δ A tan β x H 2 exp { π tan 2 β H 2 x 2 }
In Equations (5) and (6), it can be assumed that the convergence of the tunnel radial displacements is the same and the convergence value Δ A = Ω − w is a constant. where R is the initial radius of the tunnel.
Due to the large difference in the structure of the upper and lower pilot tunnels, it is more difficult to choose a uniform convergence. Therefore, the upper and lower pilot tunnels are equated as circular tunnels based on the area where the center of the upper and lower pilot tunnels is the center of the circular tunnel, as shown in Figure 17.
The radius RA, RB, RC, and RD of the equivalent circular tunnel can be obtained from Equations (7) and (8).
S A = S B = S C = S D = 2 S
R A = R B = R C = R D = S A π = S B π = S C π = S D π
where SA, SB, SC, and SD are the areas of the circular tunnel after equivalence, and S is the area of the original pilot tunnel.
Based on the simplified formula for circular tunnel excavation and the superposition principle, the formula for surface settlement due to the excavation of multiple pilot tunnels is given as
W ( x ) = W A ( x ) + W B ( x ) + W C ( x ) + W D ( x ) = 2 π R A Δ A tan β H exp { π tan 2 β H 2 ( x L 2 ) 2 } + 2 π R B Δ B tan β H exp { π tan 2 β H 2 ( x L 6 ) 2 } + 2 π R C Δ C tan β H exp { π tan 2 β H 2 ( x + L 6 ) 2 } + 2 π R D Δ D tan β H exp { π tan 2 β H 2 ( x + L 2 ) 2 }
Surface horizontal displacement is given as
U ( x ) = U A ( x ) + U B ( x ) + U C ( x ) + U D ( x ) = 2 π R A Δ A tan β ( x L 2 ) H 2 exp { π tan 2 β H 2 ( x L 2 ) 2 } + 2 π R B Δ B tan β ( x L 6 ) H 2 exp { π tan 2 β H 2 ( x L 6 ) 2 } + 2 π R C Δ C tan β ( x + L 6 ) H 2 exp { π tan 2 β H 2 ( x + L 6 ) 2 } + 2 π R D Δ D tan β ( x + L 2 ) H 2 exp { π tan 2 β H 2 ( x + L 2 ) 2 }

5.2. Prediction Results Analysis

According to the stochastic medium theory, combined with the construction data of similar projects in Beijing Metro Line 7, the average convergence value between the top and bottom of the tunnel vault is taken as 0.020 m, which are assigned as ΔA, ΔB, ΔC, and ΔD. Then, the maximum surface settlement is calculated as 32.7 mm, and the maximum horizontal displacement is 12.73 mm. The calculated surface displacement trough is shown in Figure 18.
From the figure, it can be seen that the effects of different pilot tunnel excavation schemes on surface settlement vary without considering surface load. The surface displacements predicted by stochastic media theory are larger than the simulation results, both the width of the settlement trough and the maximum displacement. For surface settlement, the predicted values are higher than 68.0%, 49.7%, 14.9%, and 16.9% of the four scenarios, respectively. For surface horizontal displacement, the predicted values are higher than 79.0%, 59.2%, 34.6%, and 34.8% of the four scenarios, respectively. It can be seen that the error magnitude varies with different excavation sequences of the pilot tunnel. The prediction results are on the conservative side but still have a guiding effect on the construction site.

6. Discussion

In general, this paper has studied the characteristics of ground and structural deformation during construction using the PBA method, and the results of the study are useful as a guide for a construction site. However, in the process of construction using the PBA method, there were many steps and complex structural force transformations, so there is still a need for further research in the future.
As the excavation of pilot tunnels causes soil loss and thus large ground deformation, in addition to changing the order of excavation of pilot tunnels, the number of pilot tunnels will also have a greater effect on the ground deformation. It was found that the excavation of eight pilot tunnels results in more displacement than six. Therefore, choosing the right number of pilot tunnels and excavation sequence may effectively reduce ground deformation.
In the third stage, the side piles and the column mainly bear the load transferred from the arch and the top longitudinal beam, which are the bearing structures of the station, and their bearing capacity determines the stability of the whole metro station structure, so the design of the side piles and the column is extremely important. In the subsequent study, the dimensions of the pile-column system, such as spacing and cross-sectional area, can be optimized to meet the premise of safety, while also taking into account the economic needs.
There are currently two main calculation methods for surface settlement prediction. One is the Peck empirical formula method, and the other is the stochastic medium theory method used in this paper. From the research of this paper, it can be seen that the surface settlement formula derived by using the stochastic medium theory is affected by several parameters. The variation in the parameters affects the accuracy of the prediction results. Taking the effect of different surface loads on surface displacements studied in this paper as an example, the surface displacements changed when the surface loads were changed when other conditions were the same. Therefore, in subsequent research, a sensitivity analysis of the parameters in the stochastic medium theory should be carried out to establish the connection between different influencing factors and the parameters in the theory, and to make the prediction results more accurate by improving the formula of the stochastic medium theory.
In addition, the problem of the accumulation and growth of track settlements is typical for transportation objects such as tunnels and bridges. These areas are characterized by intensive differential settlement due to dynamic interactions before, during, and after construction [34,35]. The accumulation and growth of track settlements in the station operation phase after construction should be equally considered, and this is the focus of the author’s research in the next phase of work.

7. Conclusions

In this paper, the ground and structural deformation patterns of metro stations constructed by the PBA method in different stages are studied using the numerical calculation method, and the influence of the presence of surface load on the ground and structural deformation is focused on. Finally, for the surface displacement law, the ground settlement and horizontal displacement were predicted by using the stochastic medium theory, and finally, a comparison between theoretical and numerical calculations was made, which is of guiding significance for on-site construction. For the above study, the following conclusions were obtained:
(a)
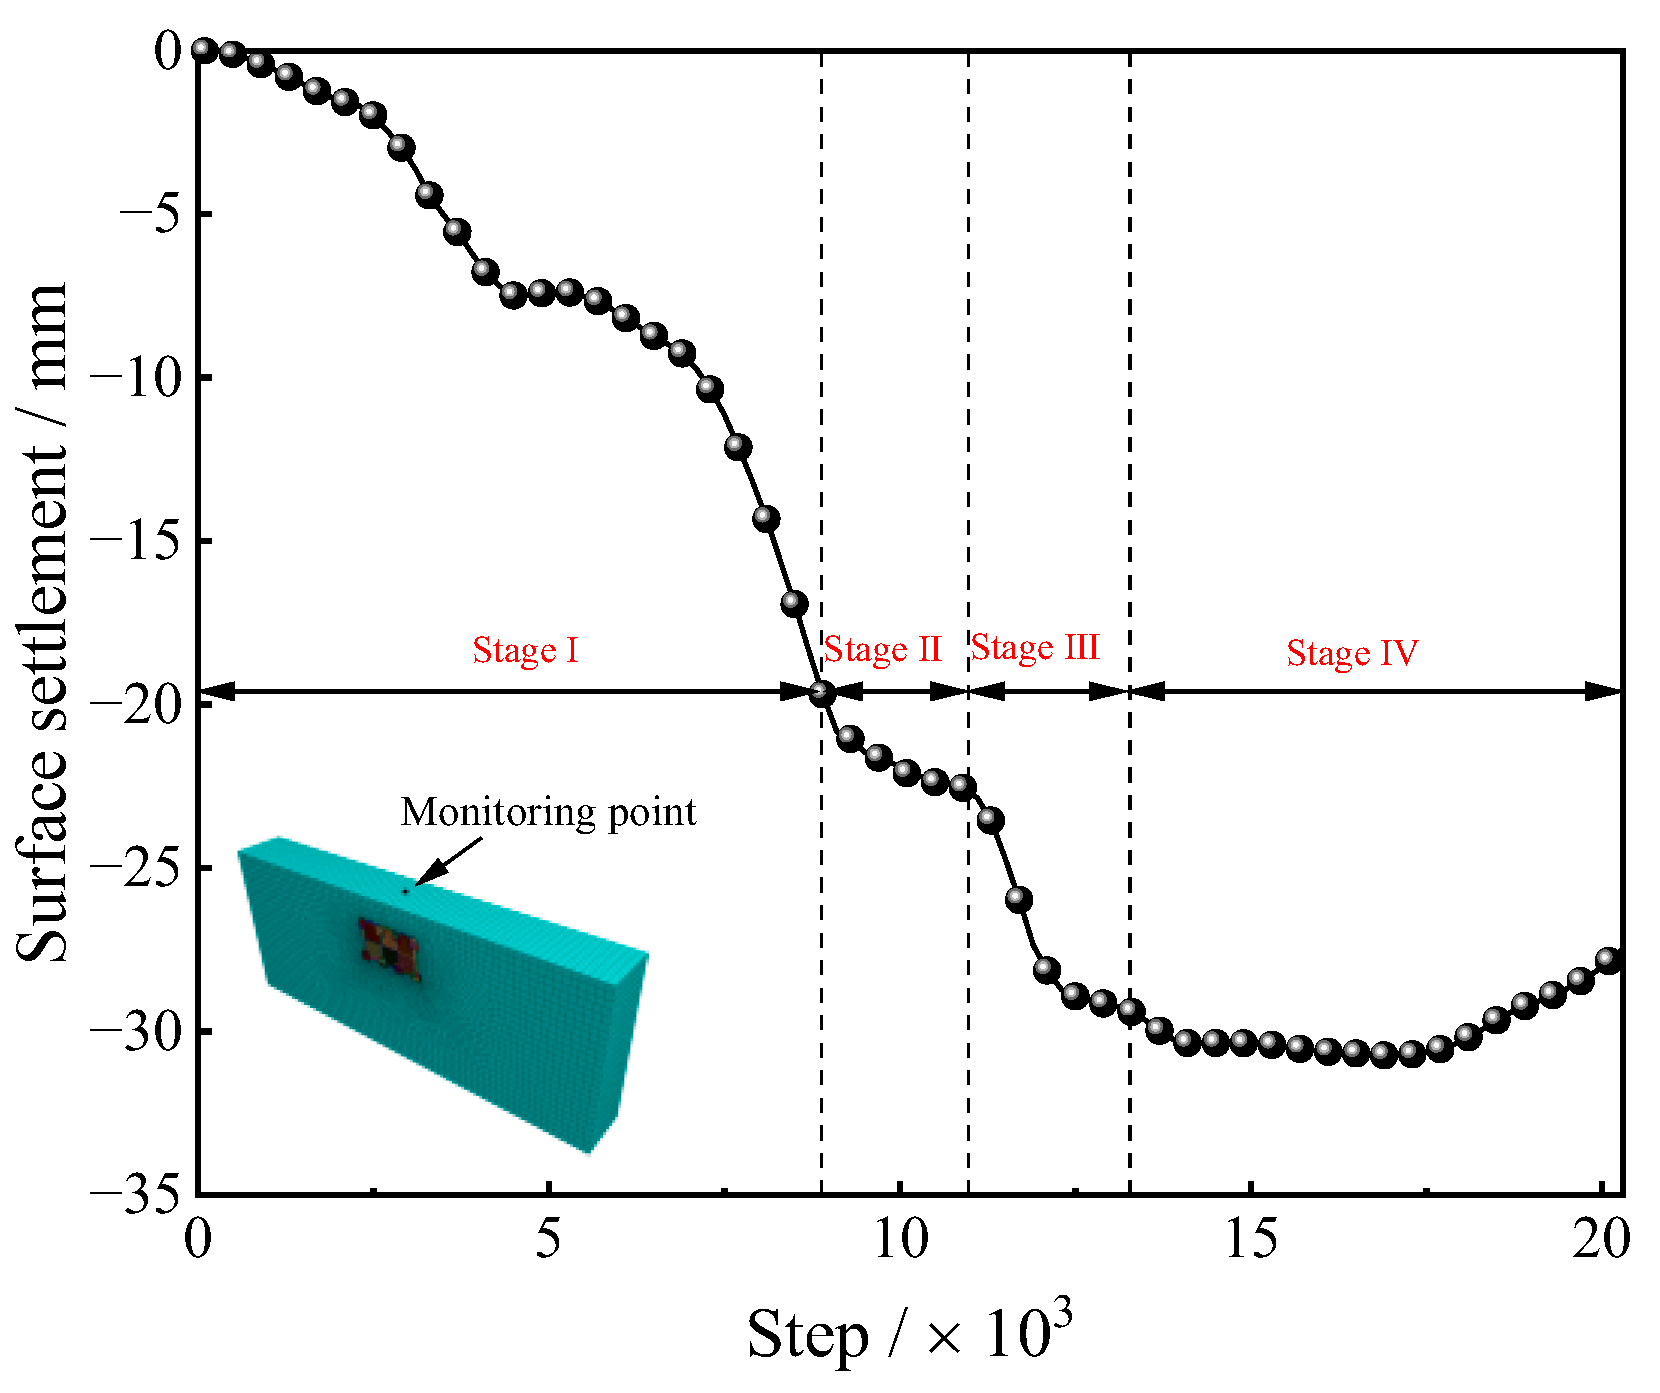
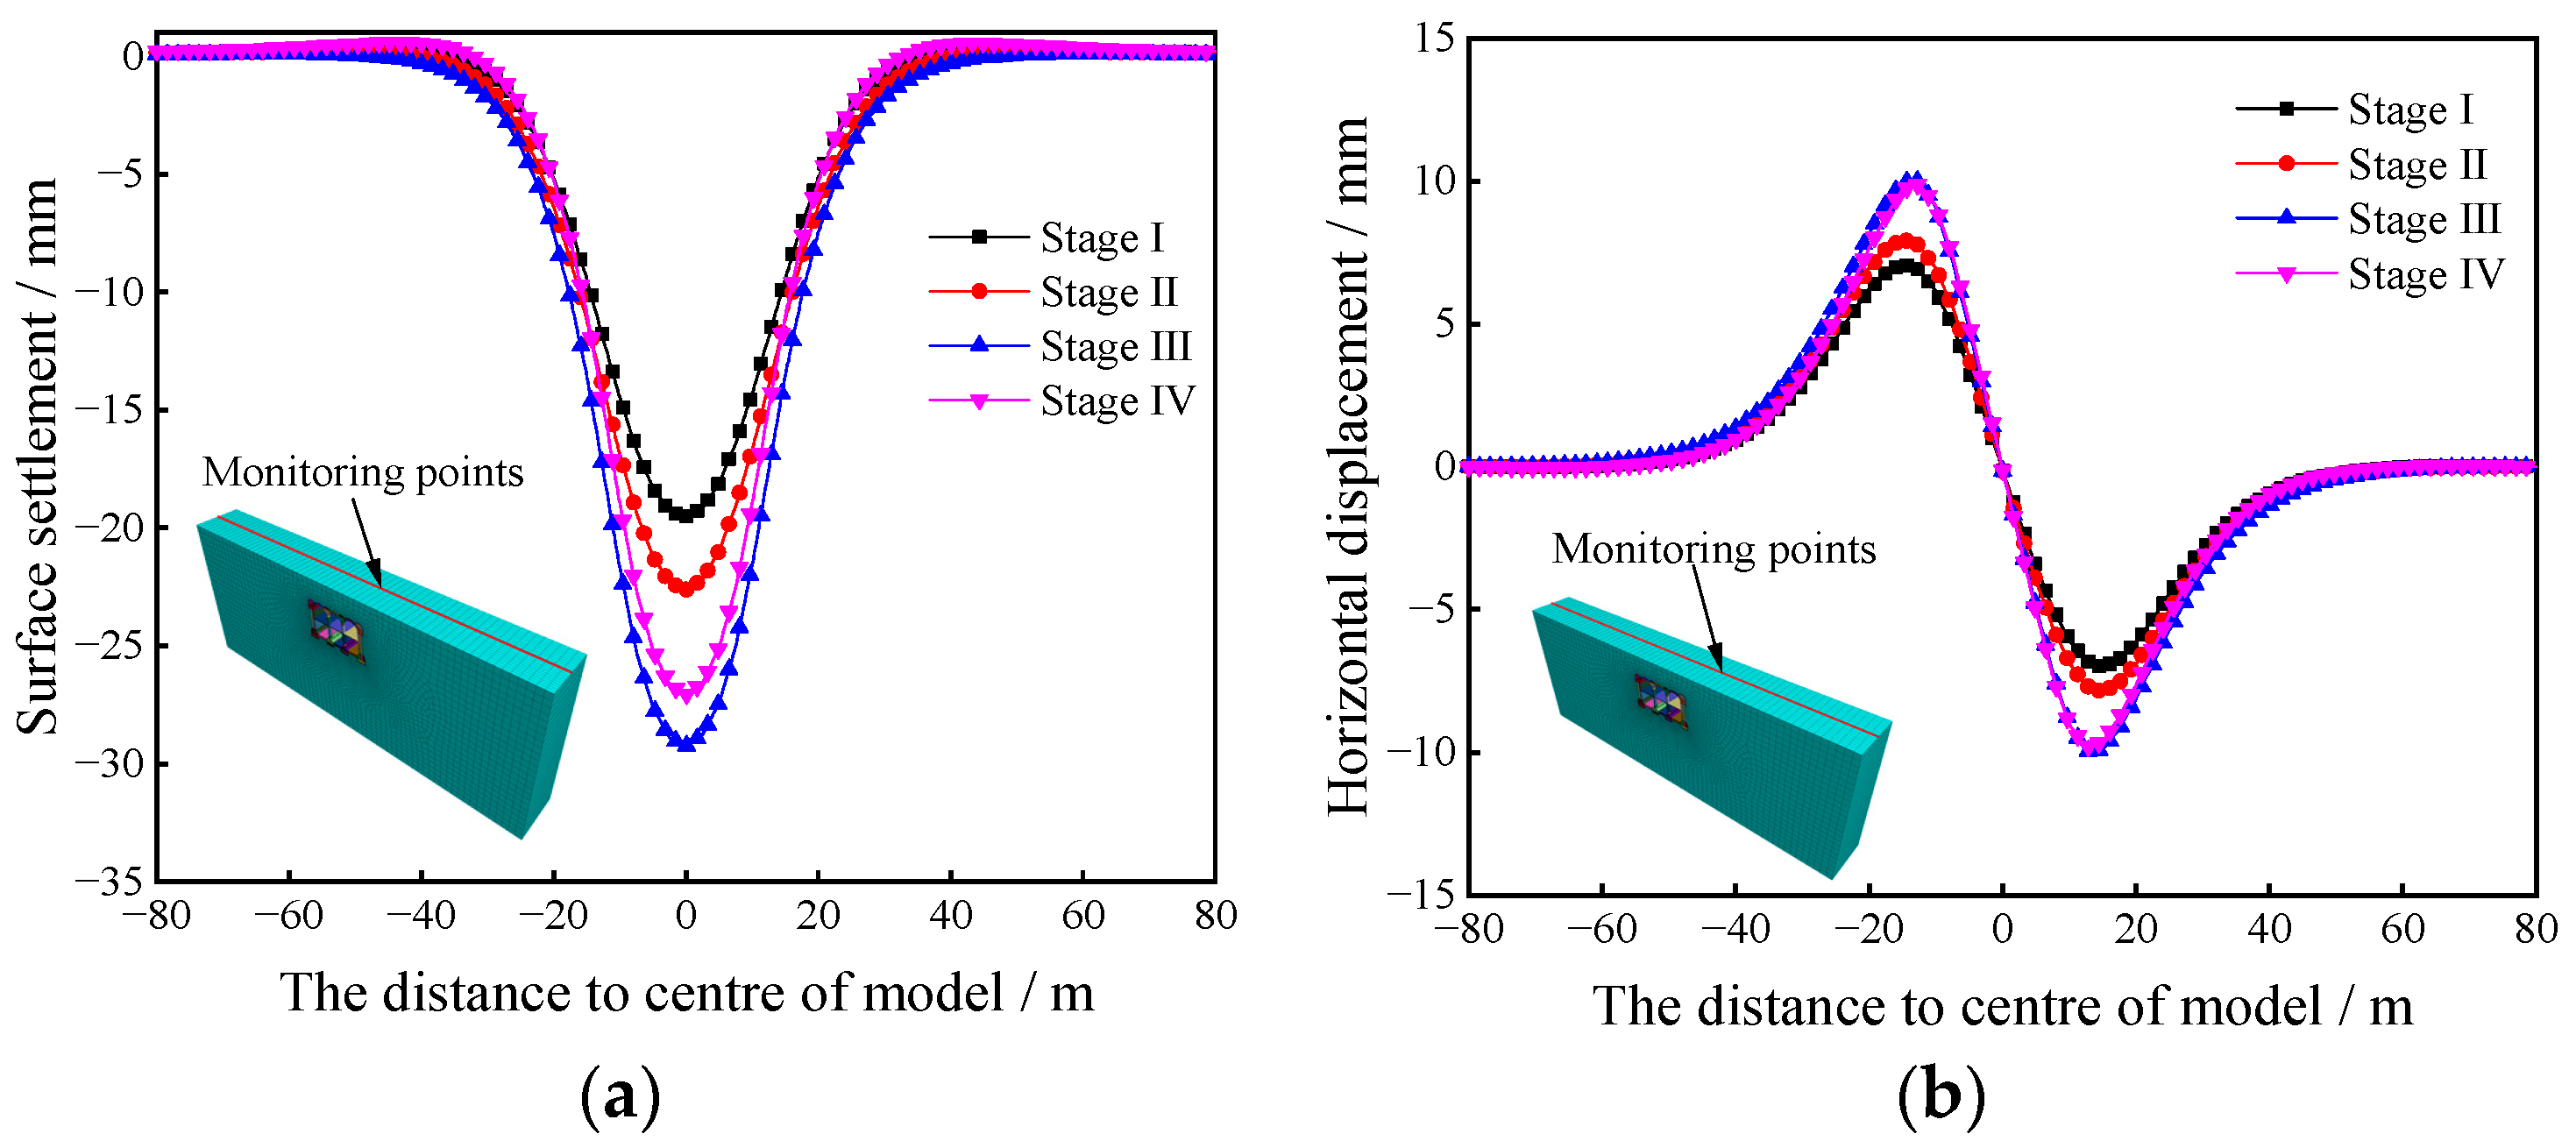
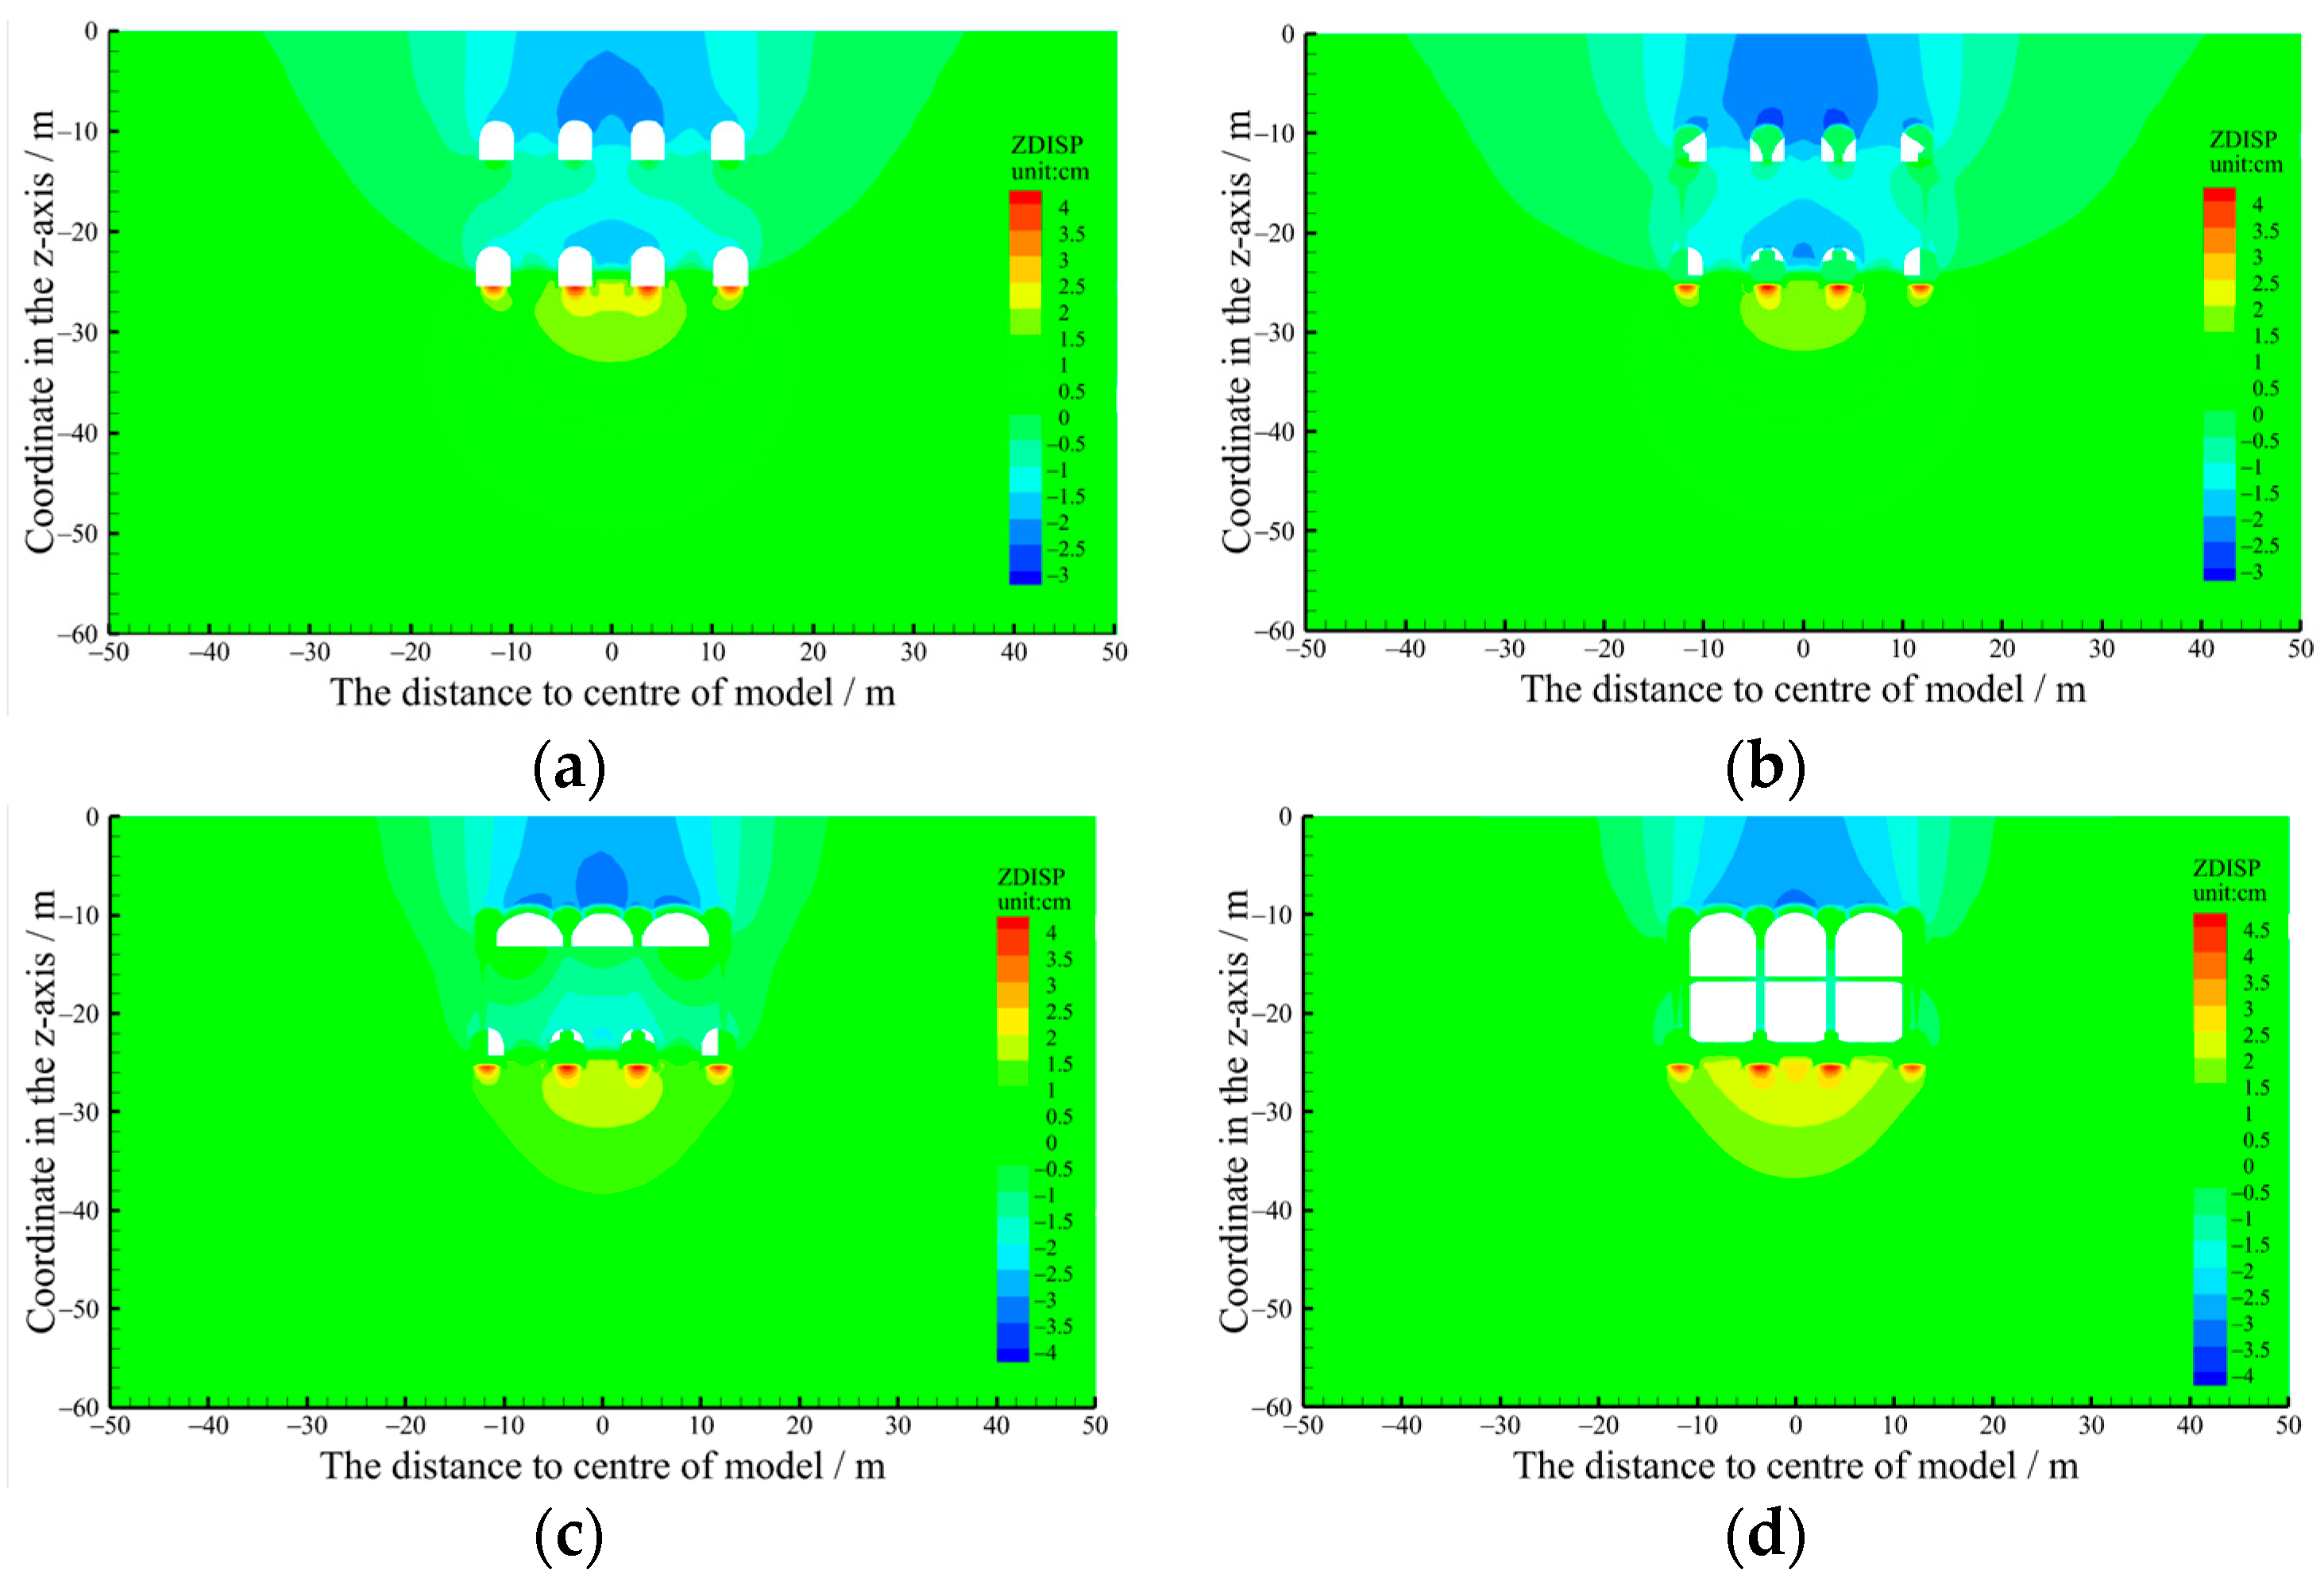
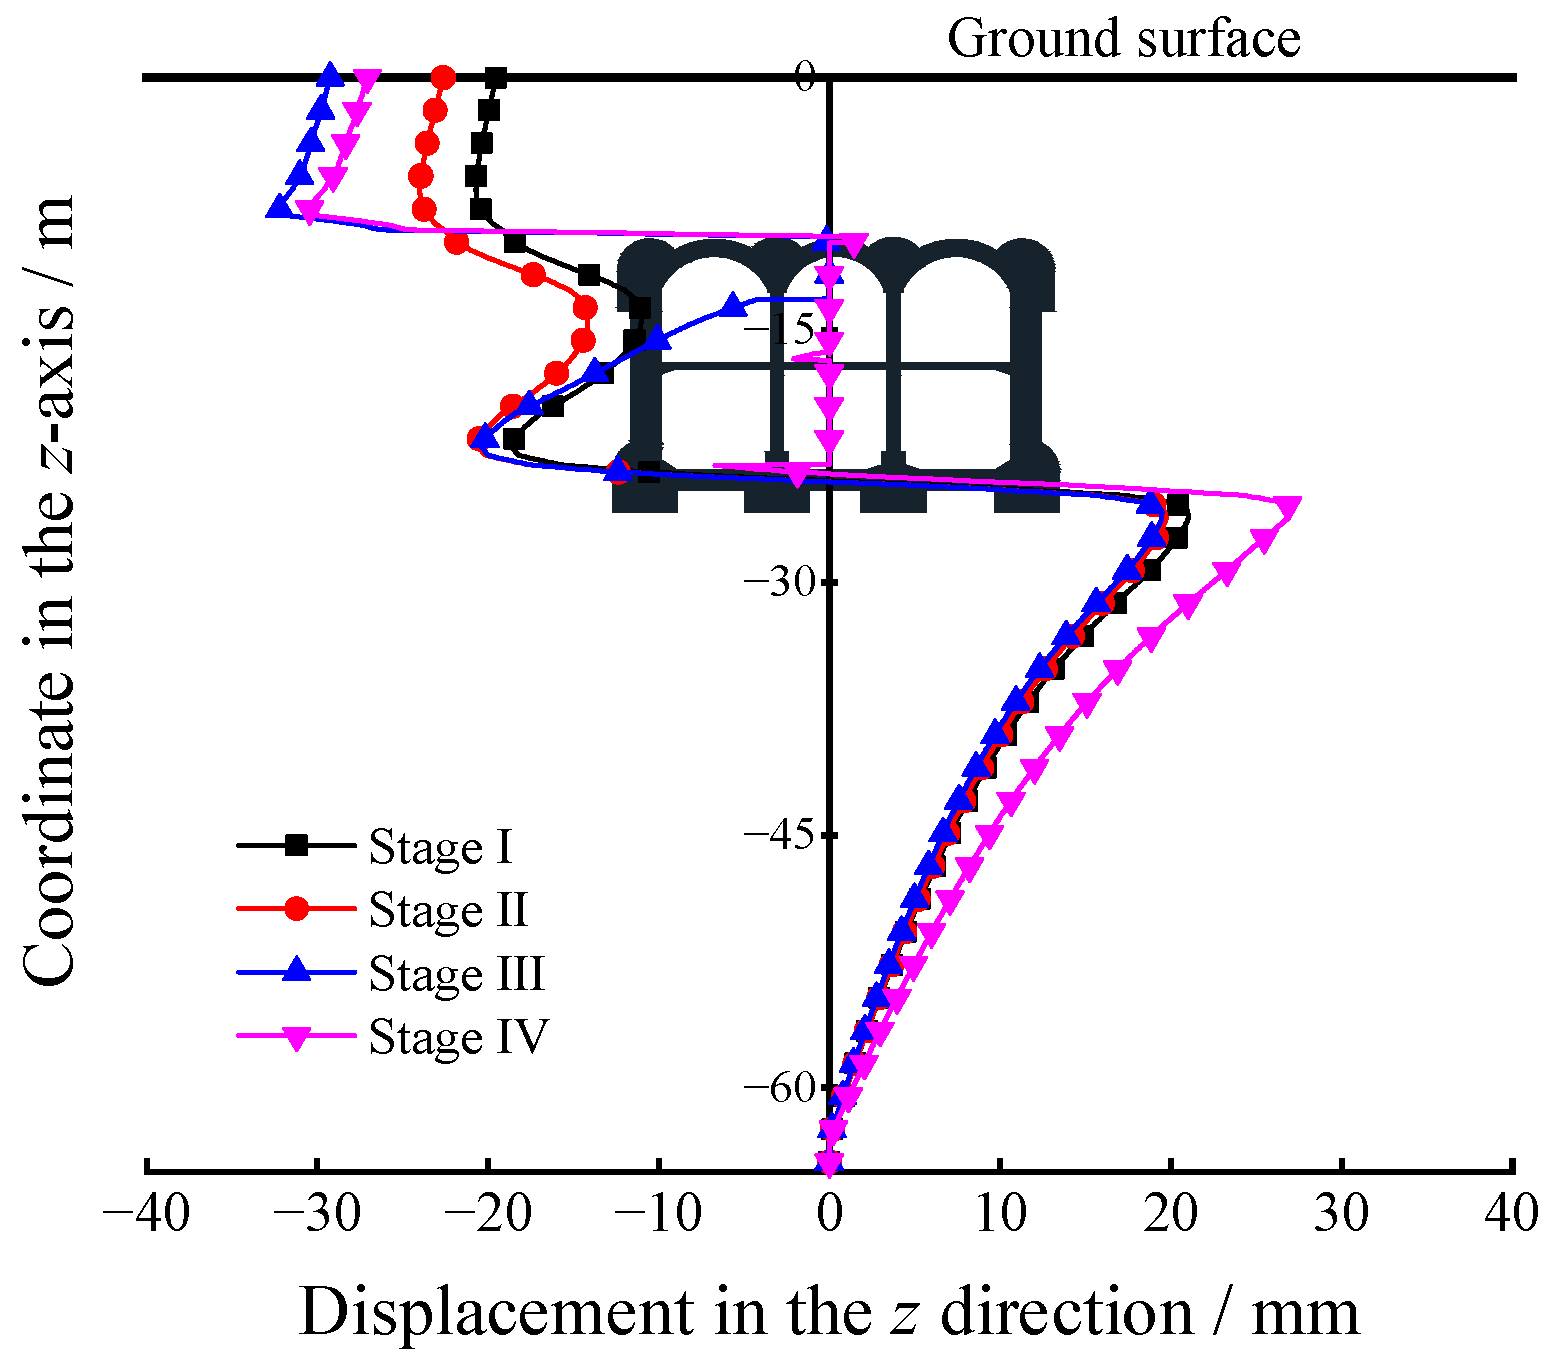
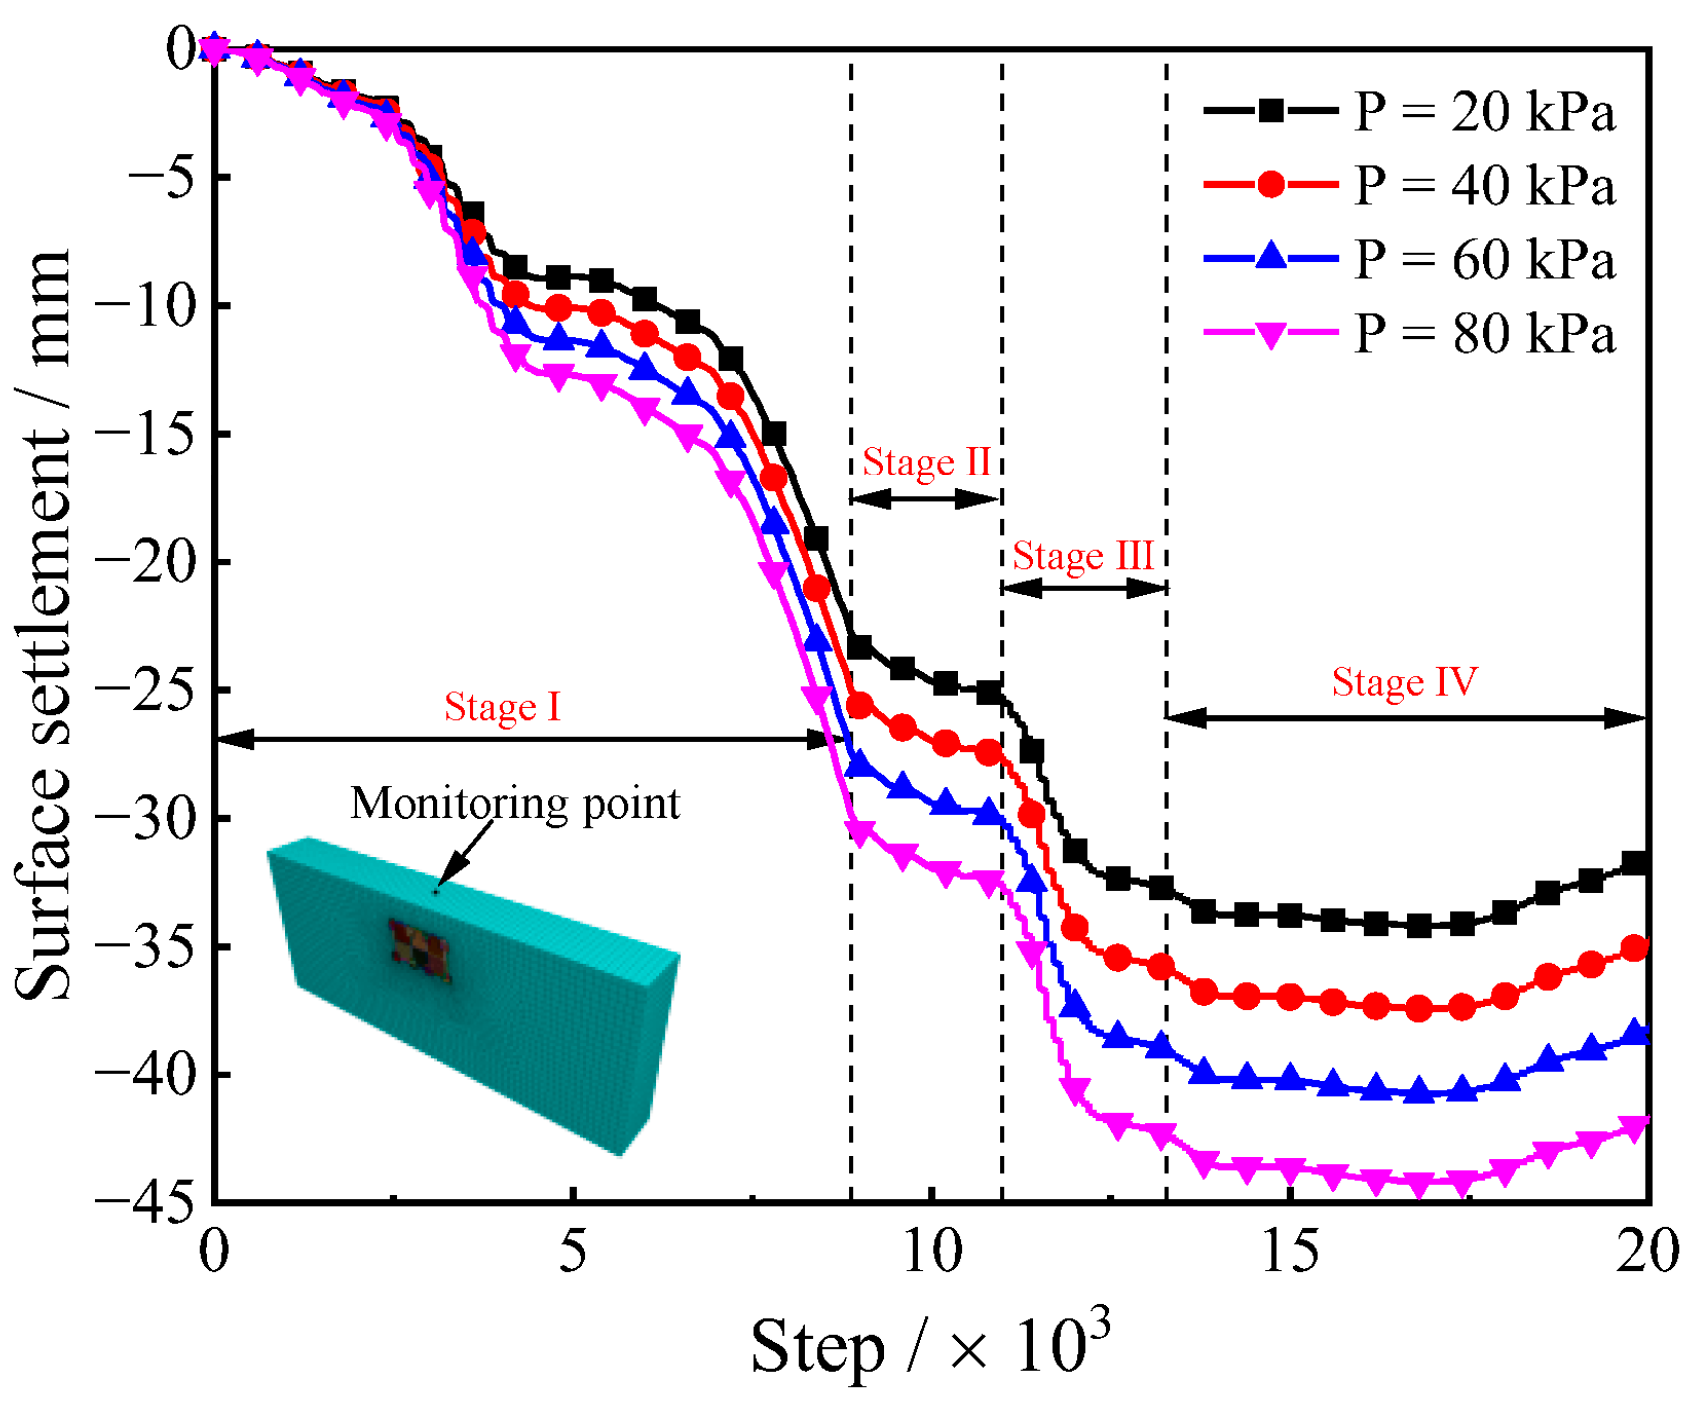
The construction of subway stations using the PBA method can usually be divided into four stages. The ground deformation mainly occurs in the excavation of the pilot tunnels and the arch installation. For the ground settlement, the settlement in these two stages accounts for 67% and 23.1% of the maximum settlement, respectively; the horizontal displacement of the ground surface in these two stages accounts for 70% and 21% of the maximum horizontal displacement, respectively. The excavation of the pilot tunnels and the arch installation stage are key to ground surface displacement control.
(b)
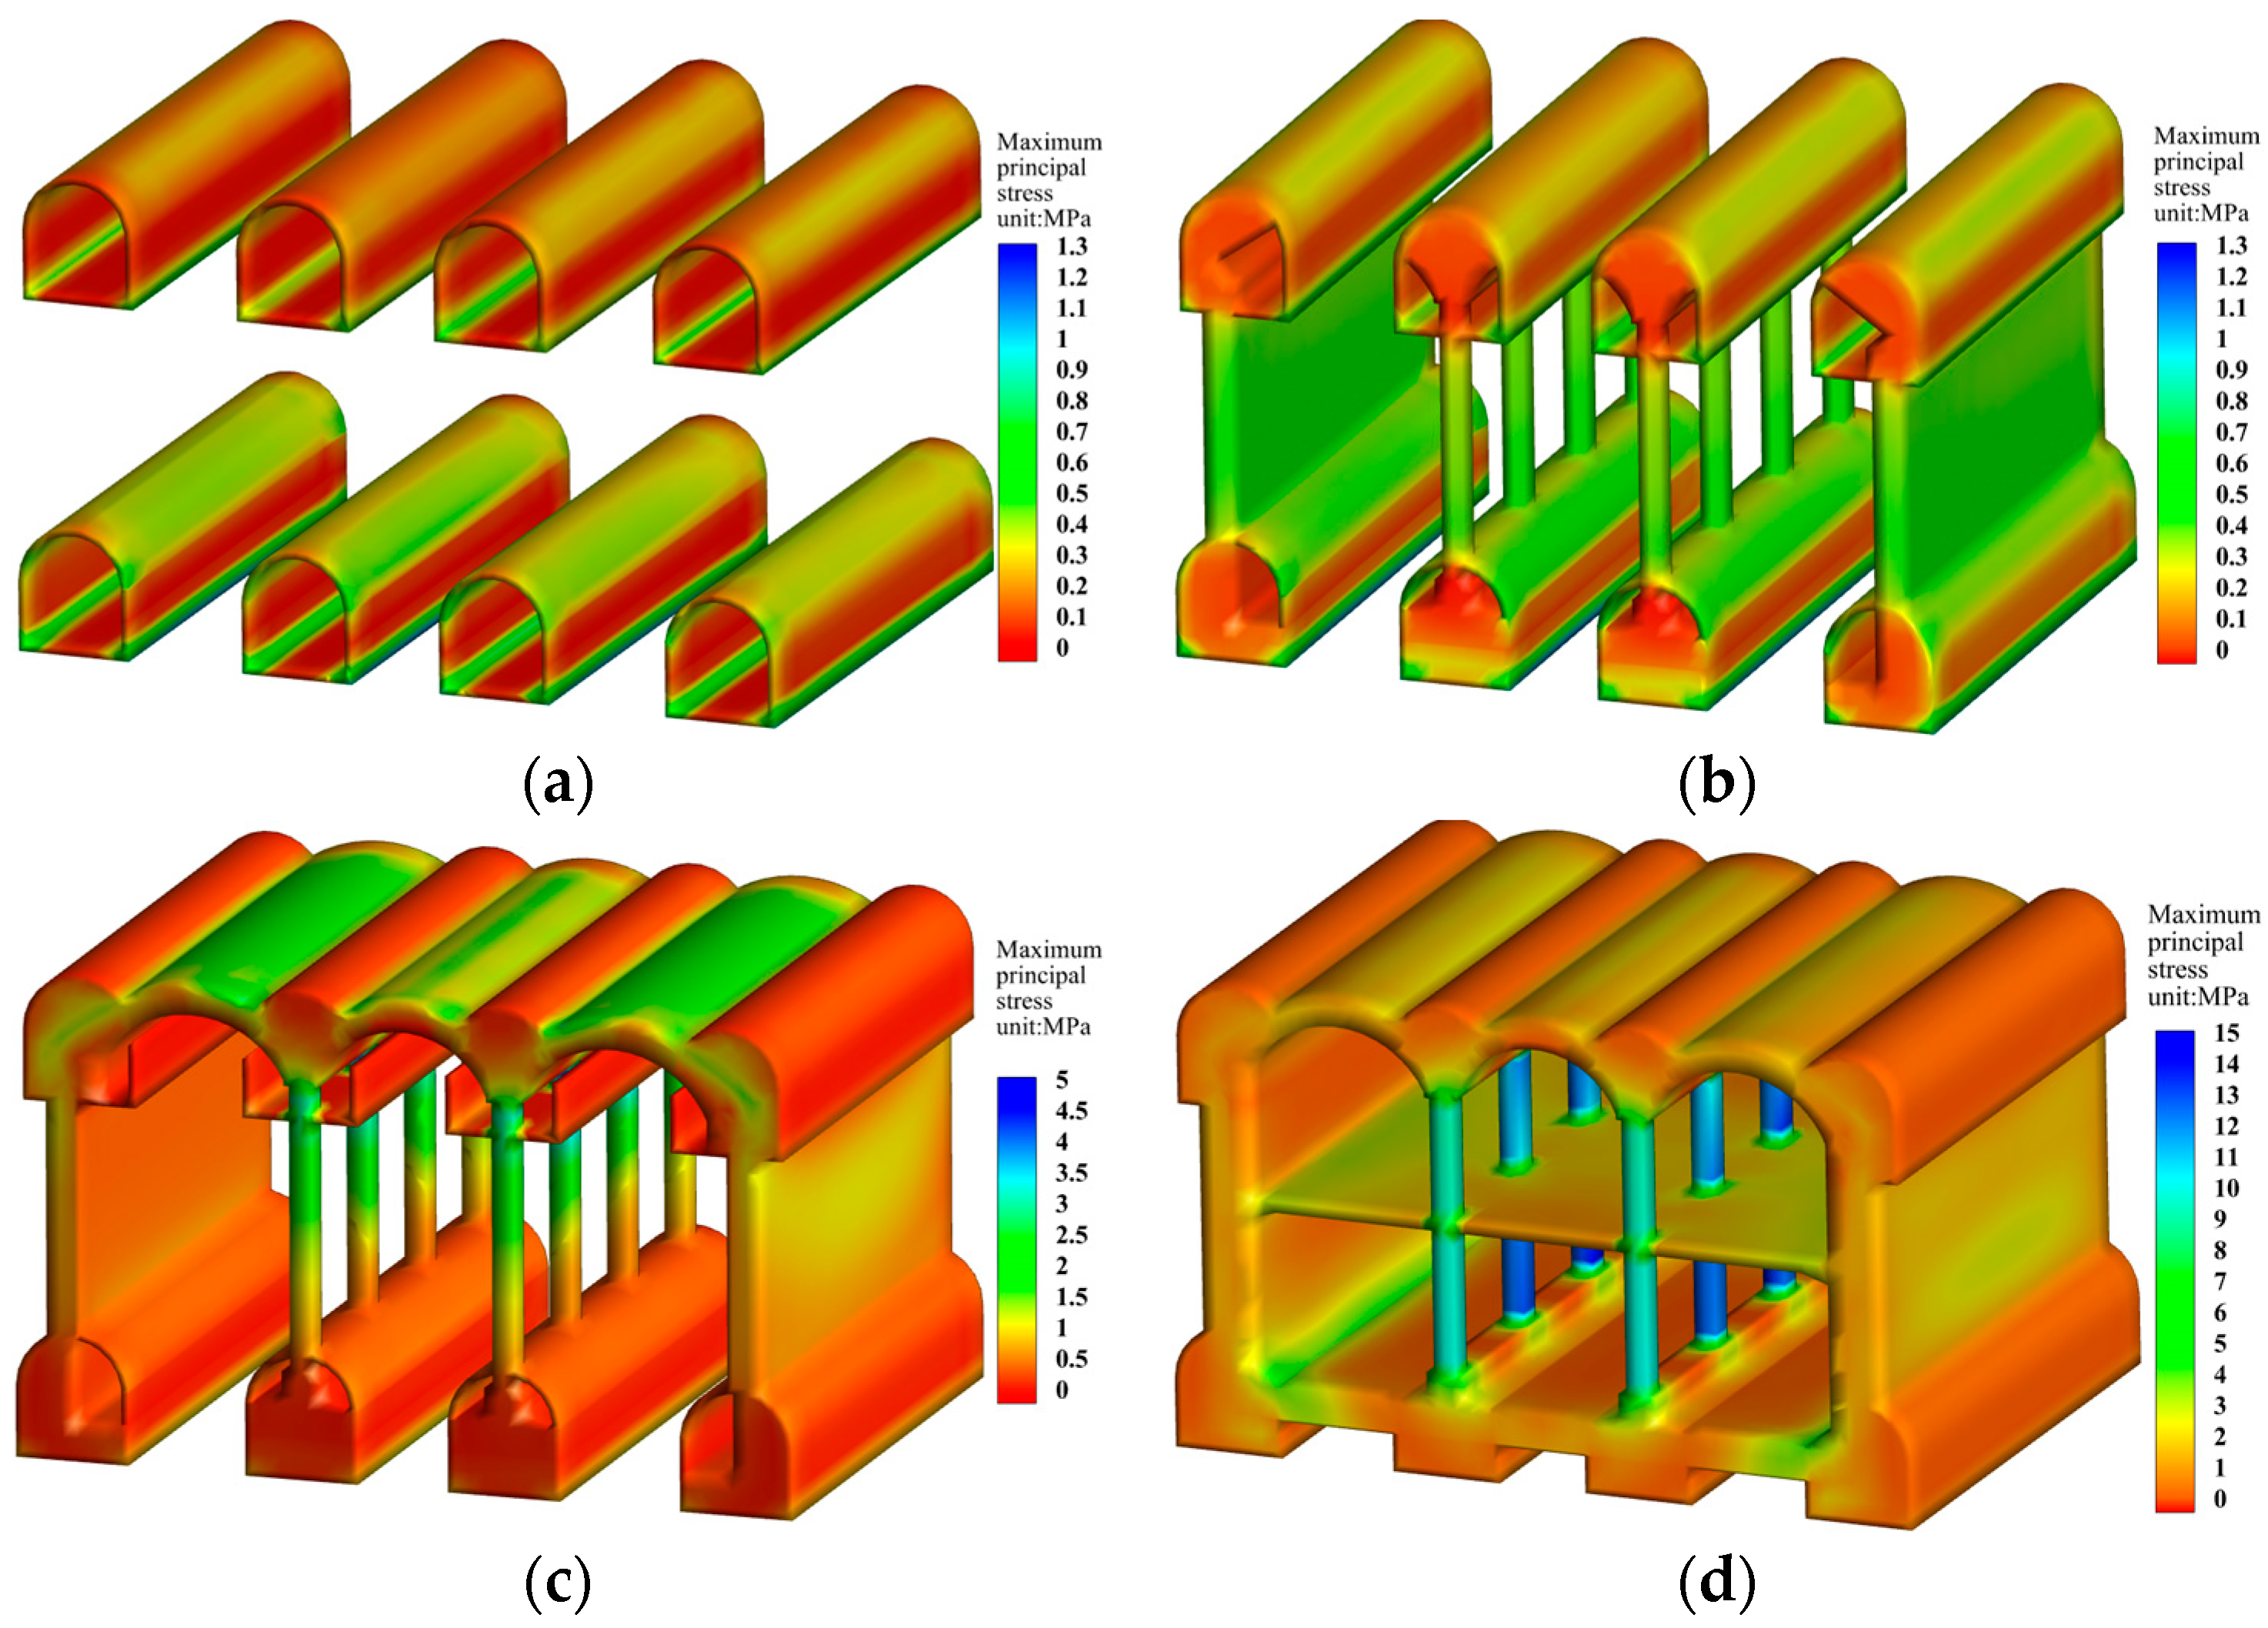
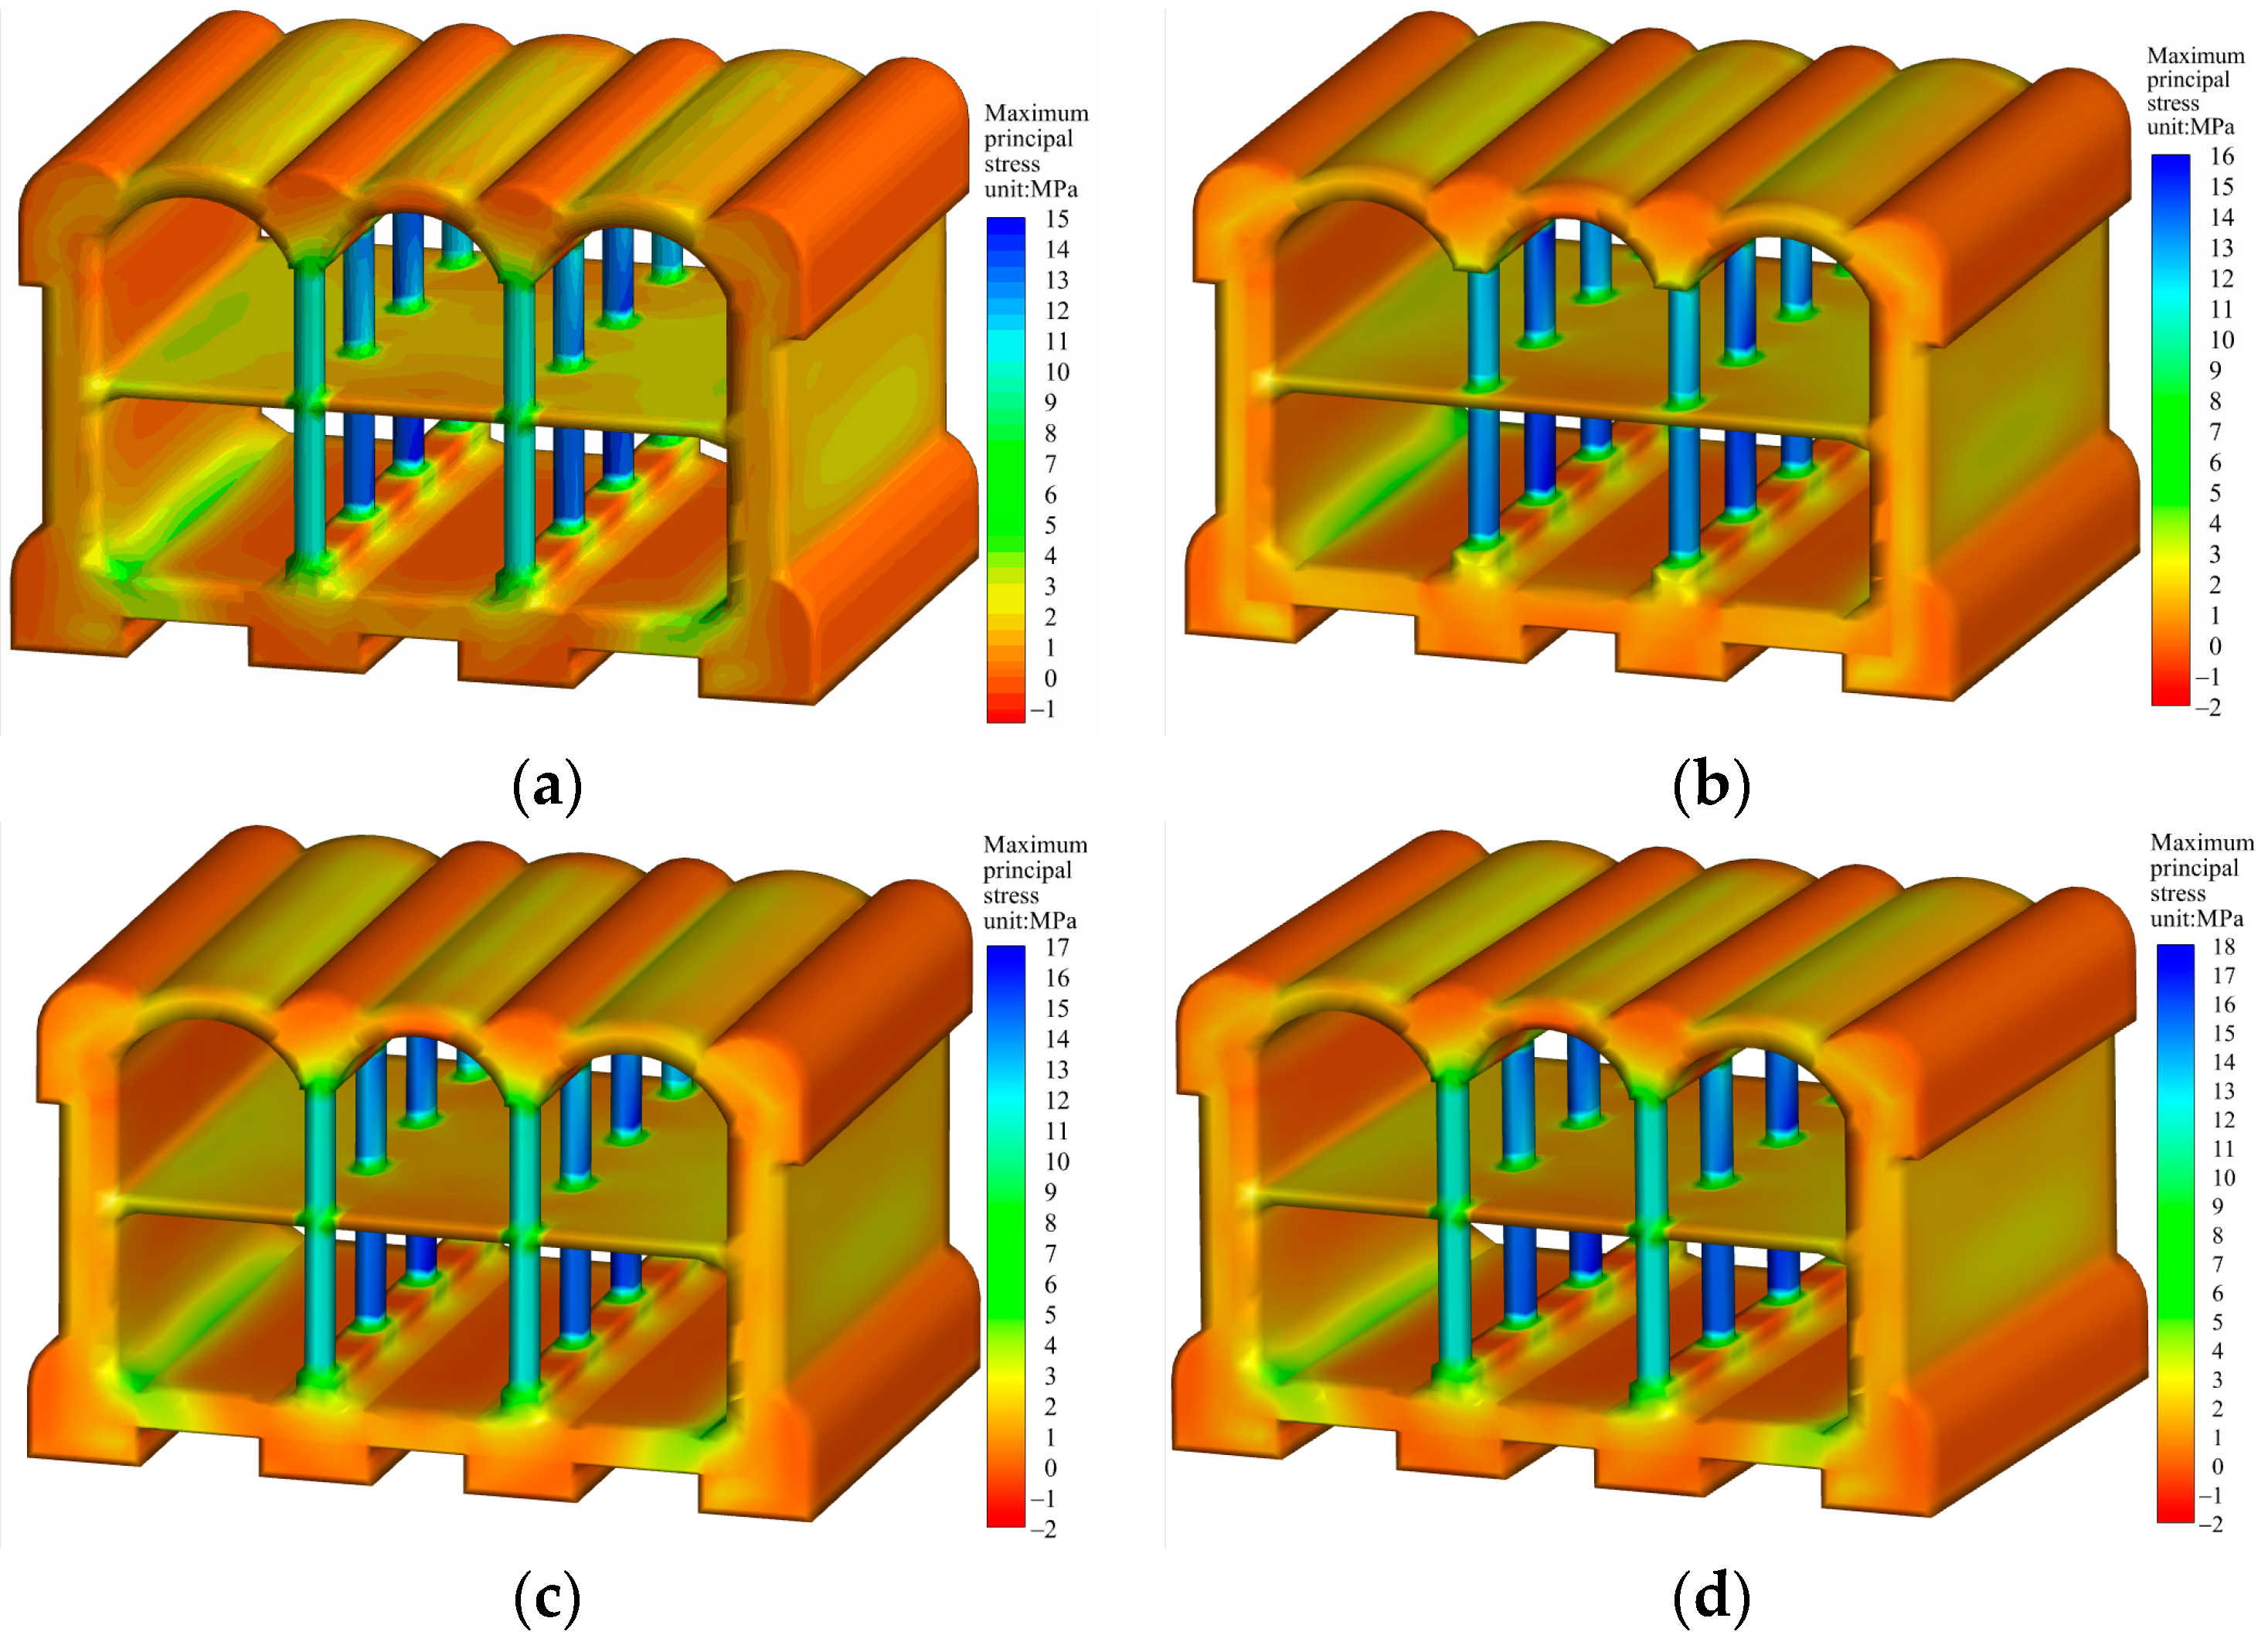
During the construction process, structural deformation is also an important part that cannot be ignored. In stage I, the maximum principal stress is mainly distributed in the footing and arch waist of the pilot tunnels. In the installation stage of the arch, the maximum principal stress is mainly distributed in the primary lining, crown beam, and the part above the column. In the fourth stage, the maximum principal stress is mainly distributed in the middle column part, and the maximum principal stress value reaches 14.203 MPa, and the maximum principal stress increases obviously. In different construction stages, attention should be paid to the possible deformation damage of the key parts and obvious stress concentration and appropriate reinforcement measures should be taken.
(c)
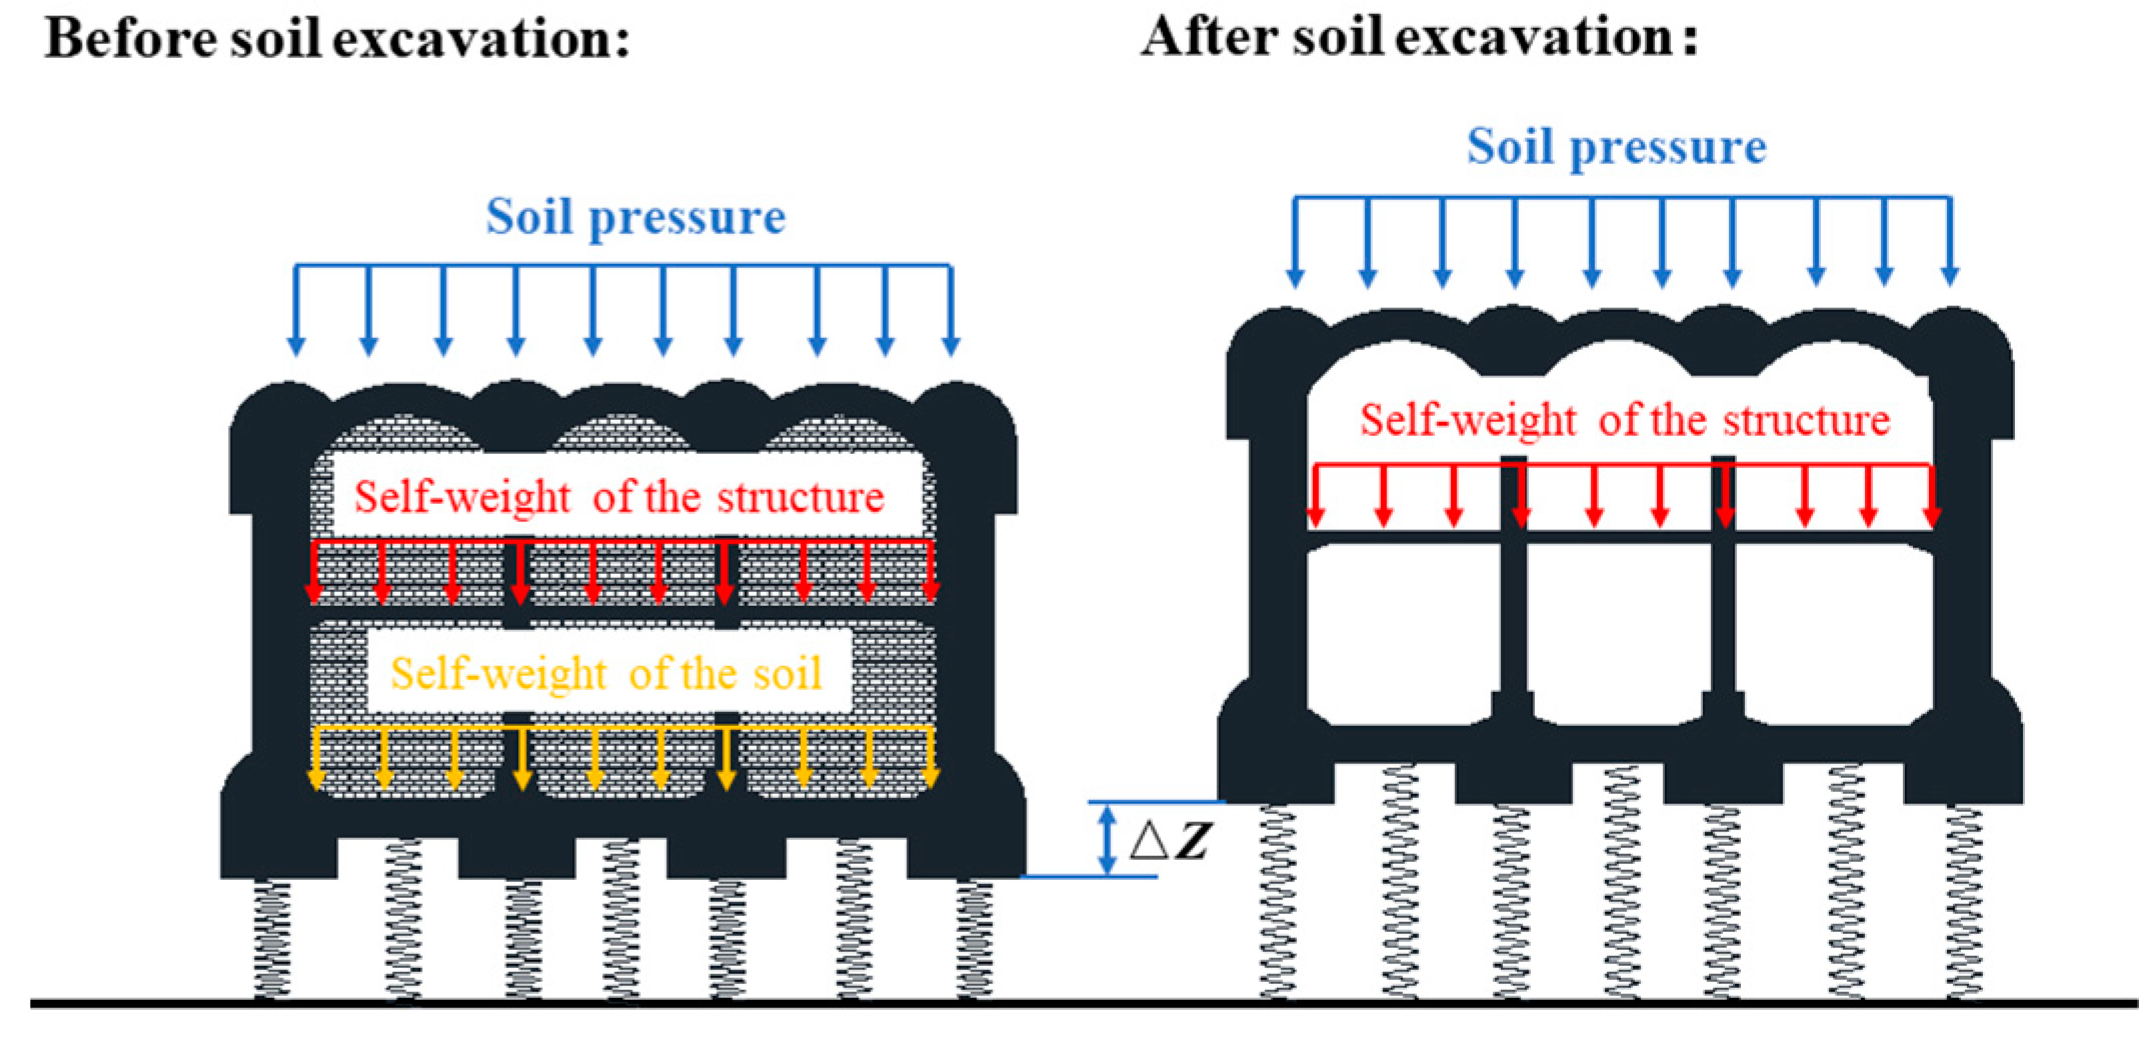
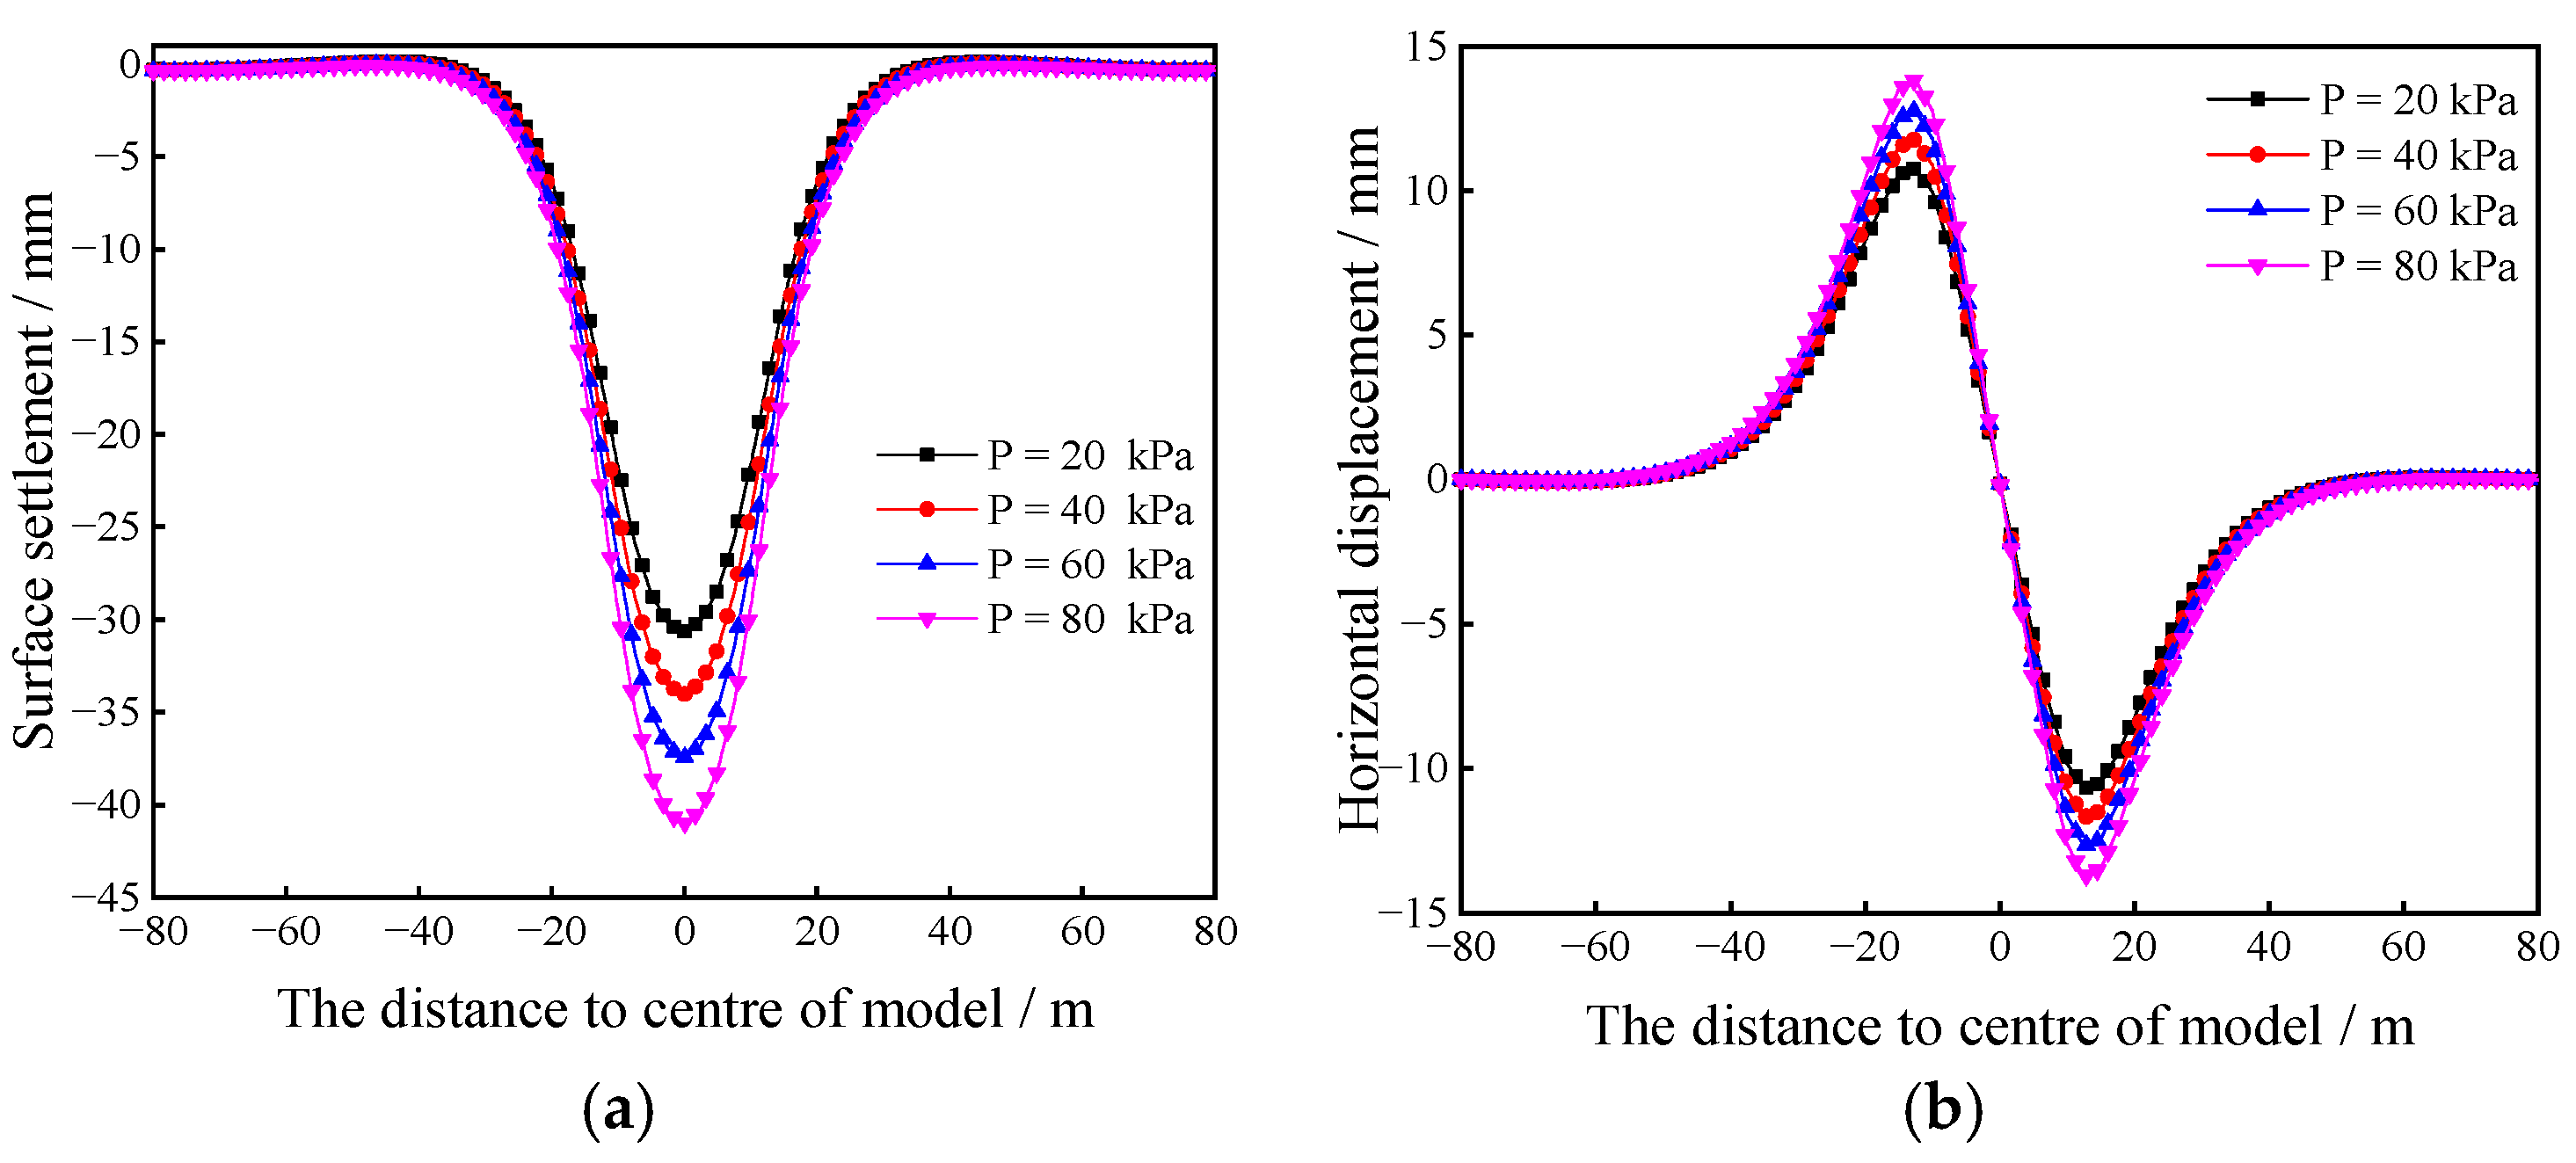
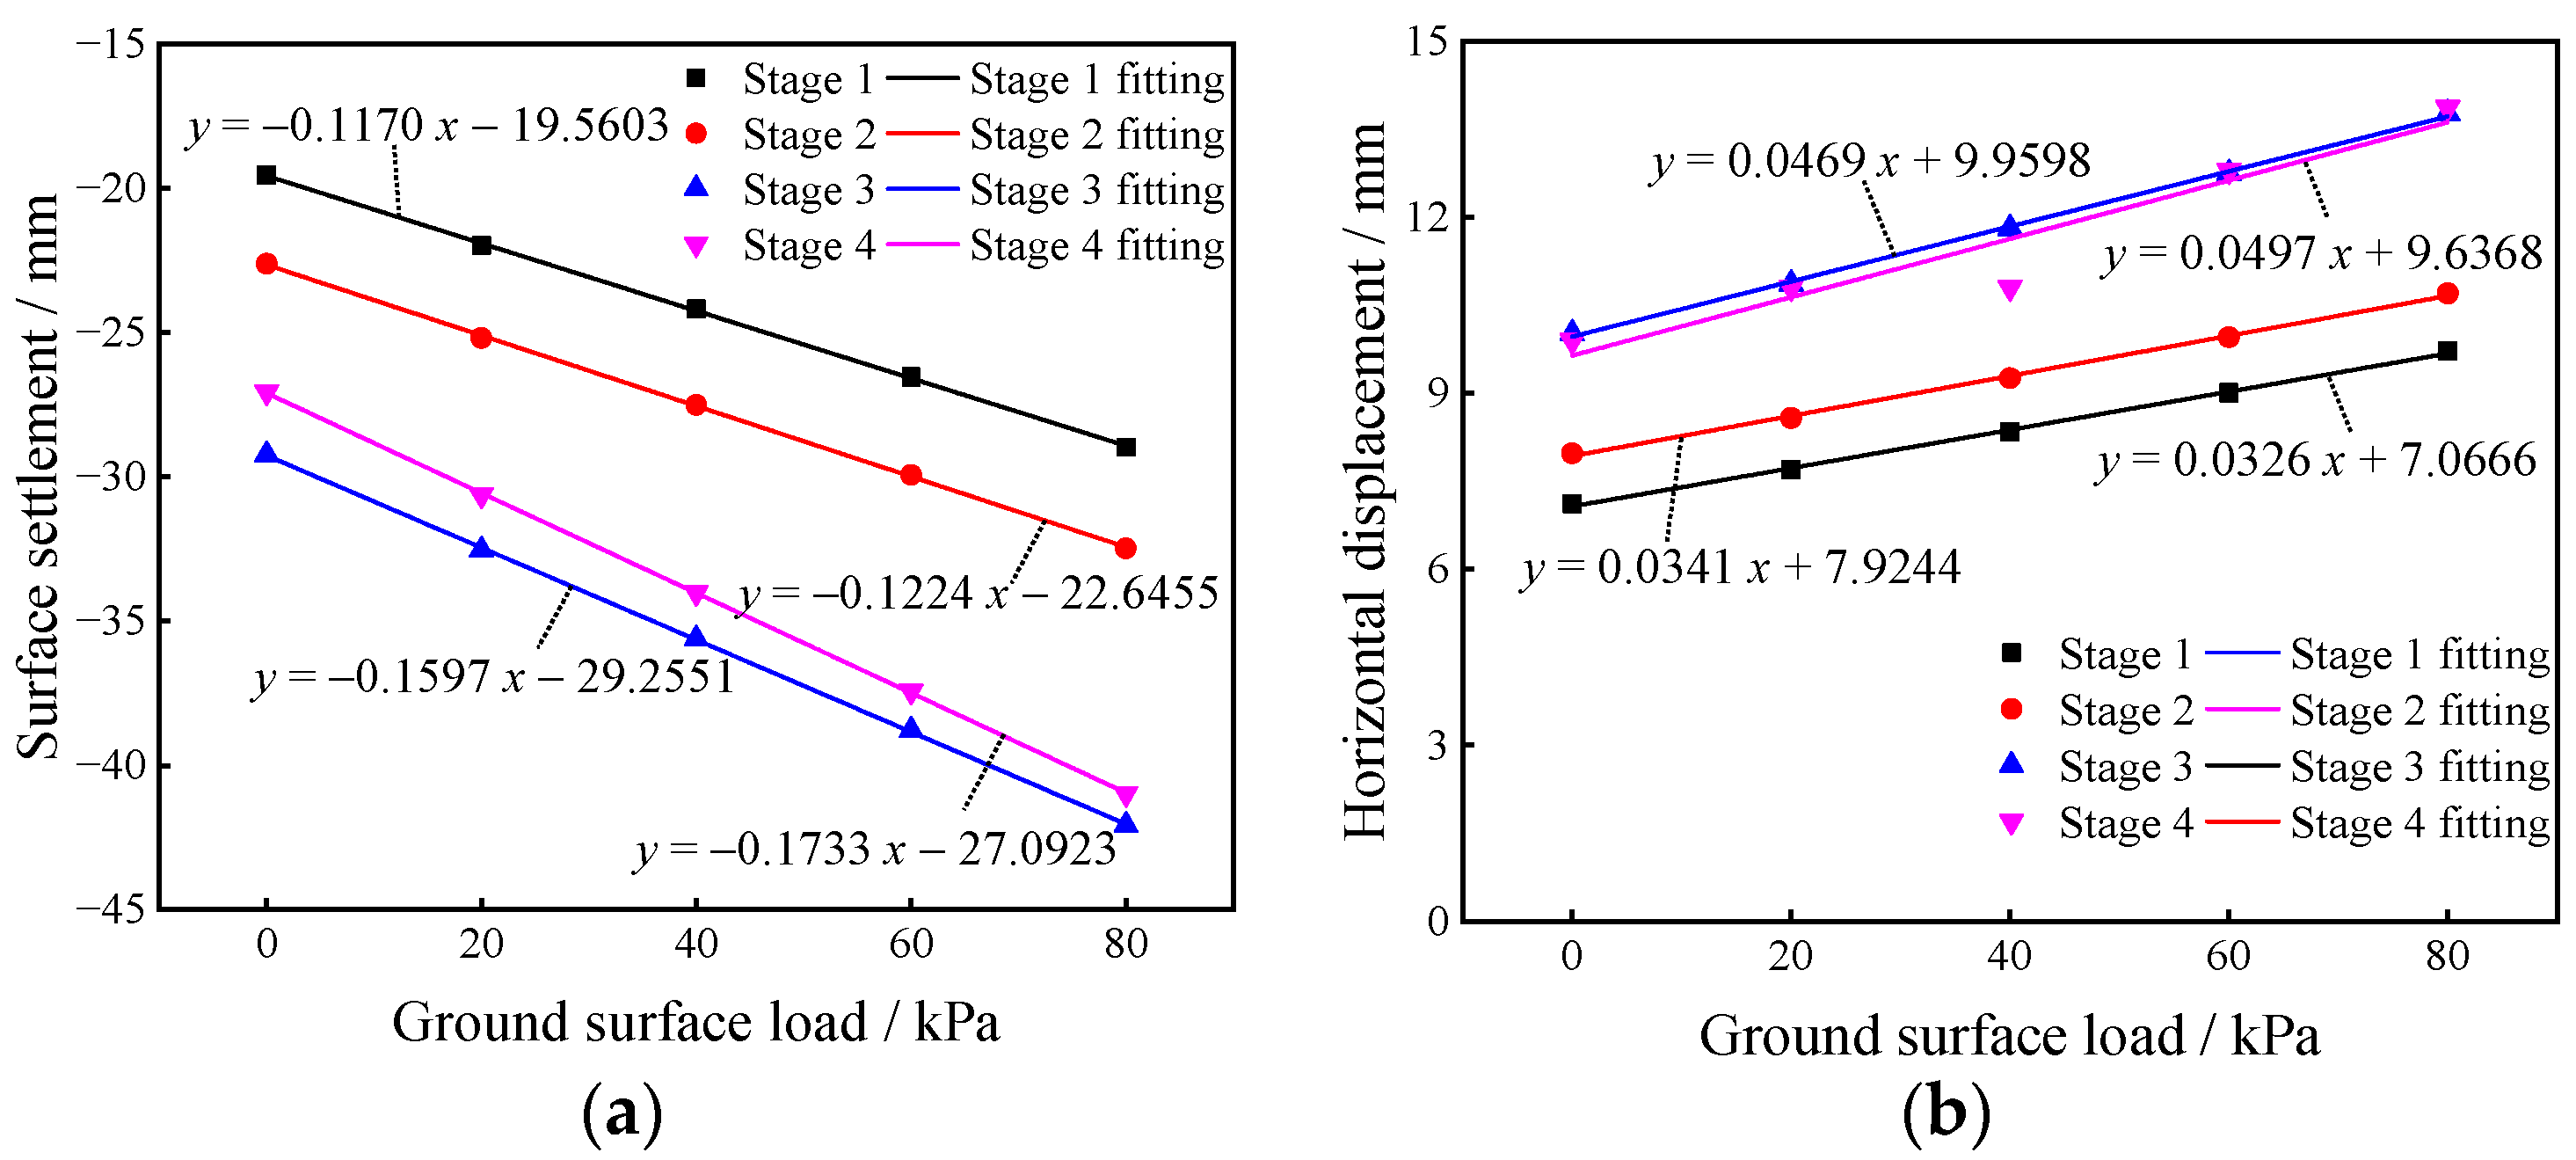
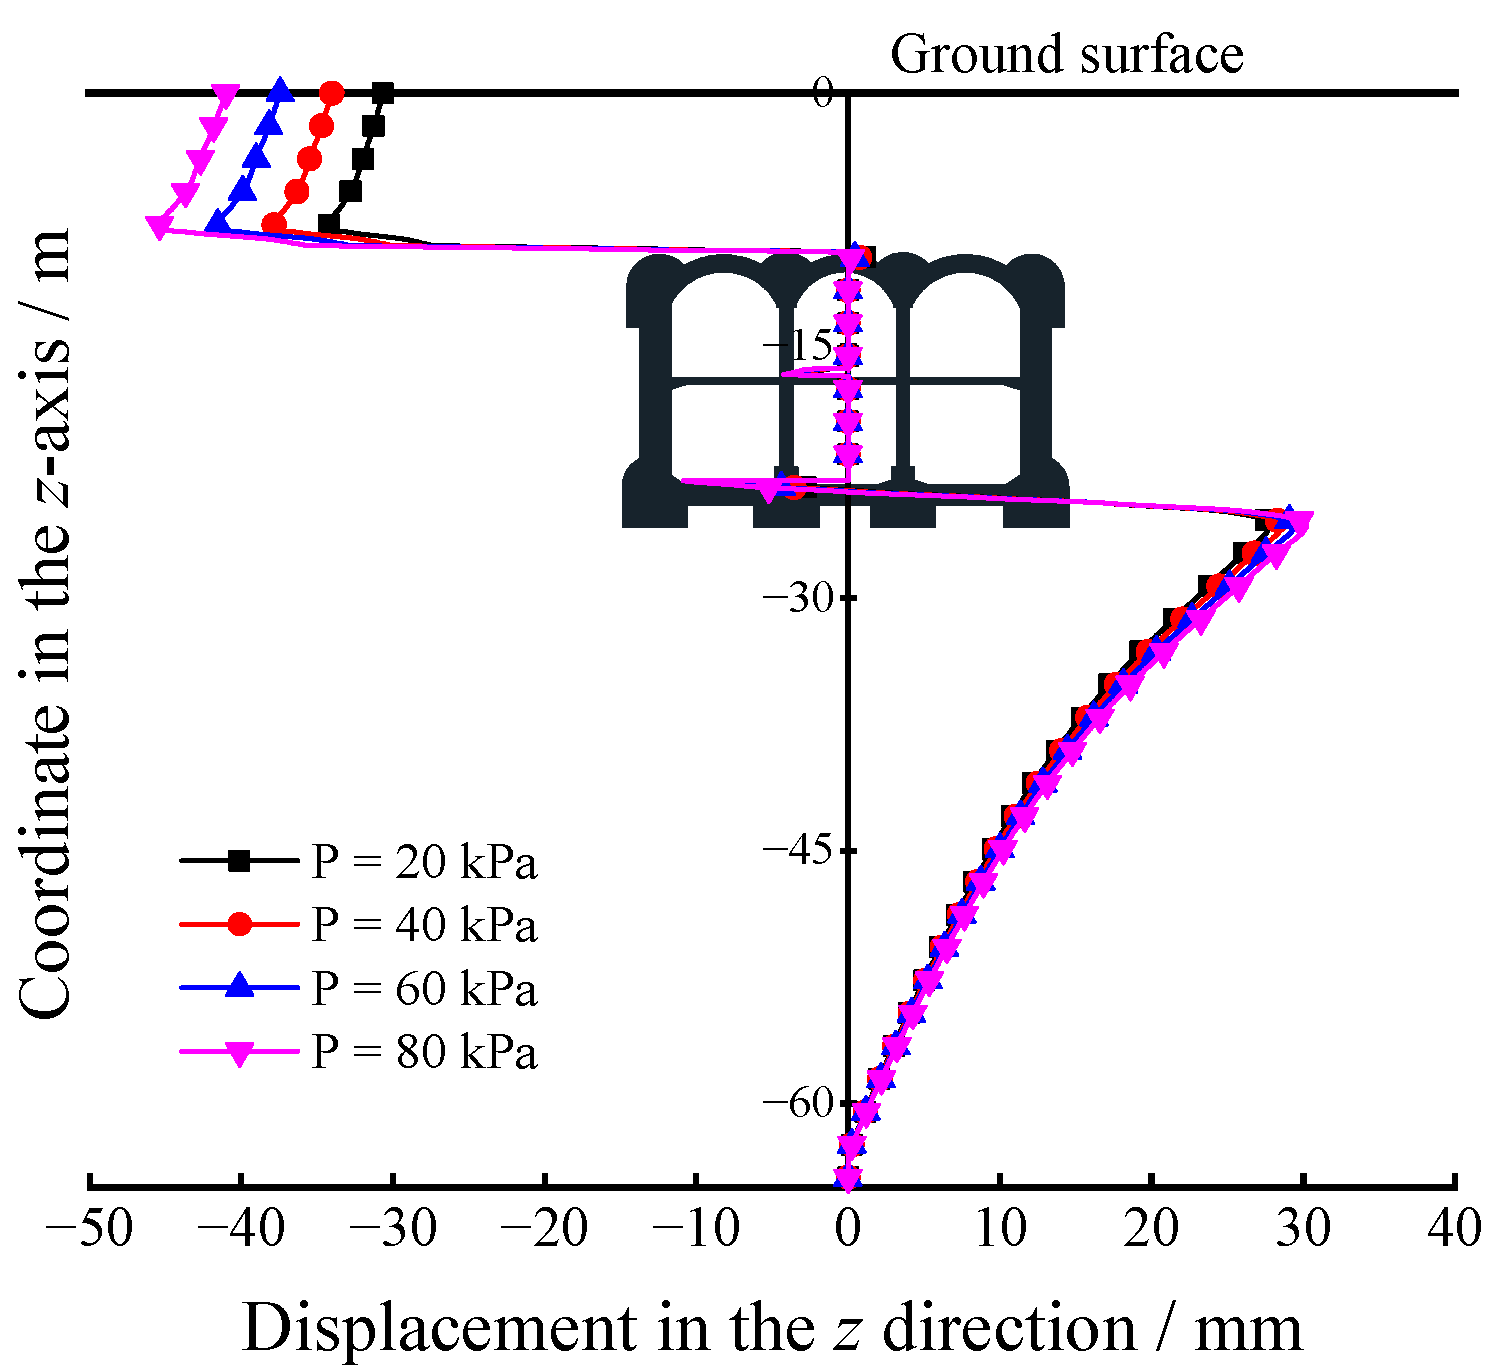
When considering the surface load, with the increase in surface load, the ground displacement also increases gradually, and the two are positively correlated and well correlated. In view of the ground deformation law, the excavation plan of “upper first then lower and first side then middle” can effectively reduce the surface settlement. The maximum principal stress of the station structure increases with the increase in the surface load. In addition, tensile stress appears in the bottom plate of the structure, which has a negative impact on the structure and should be considered to strengthen the support.
(d)
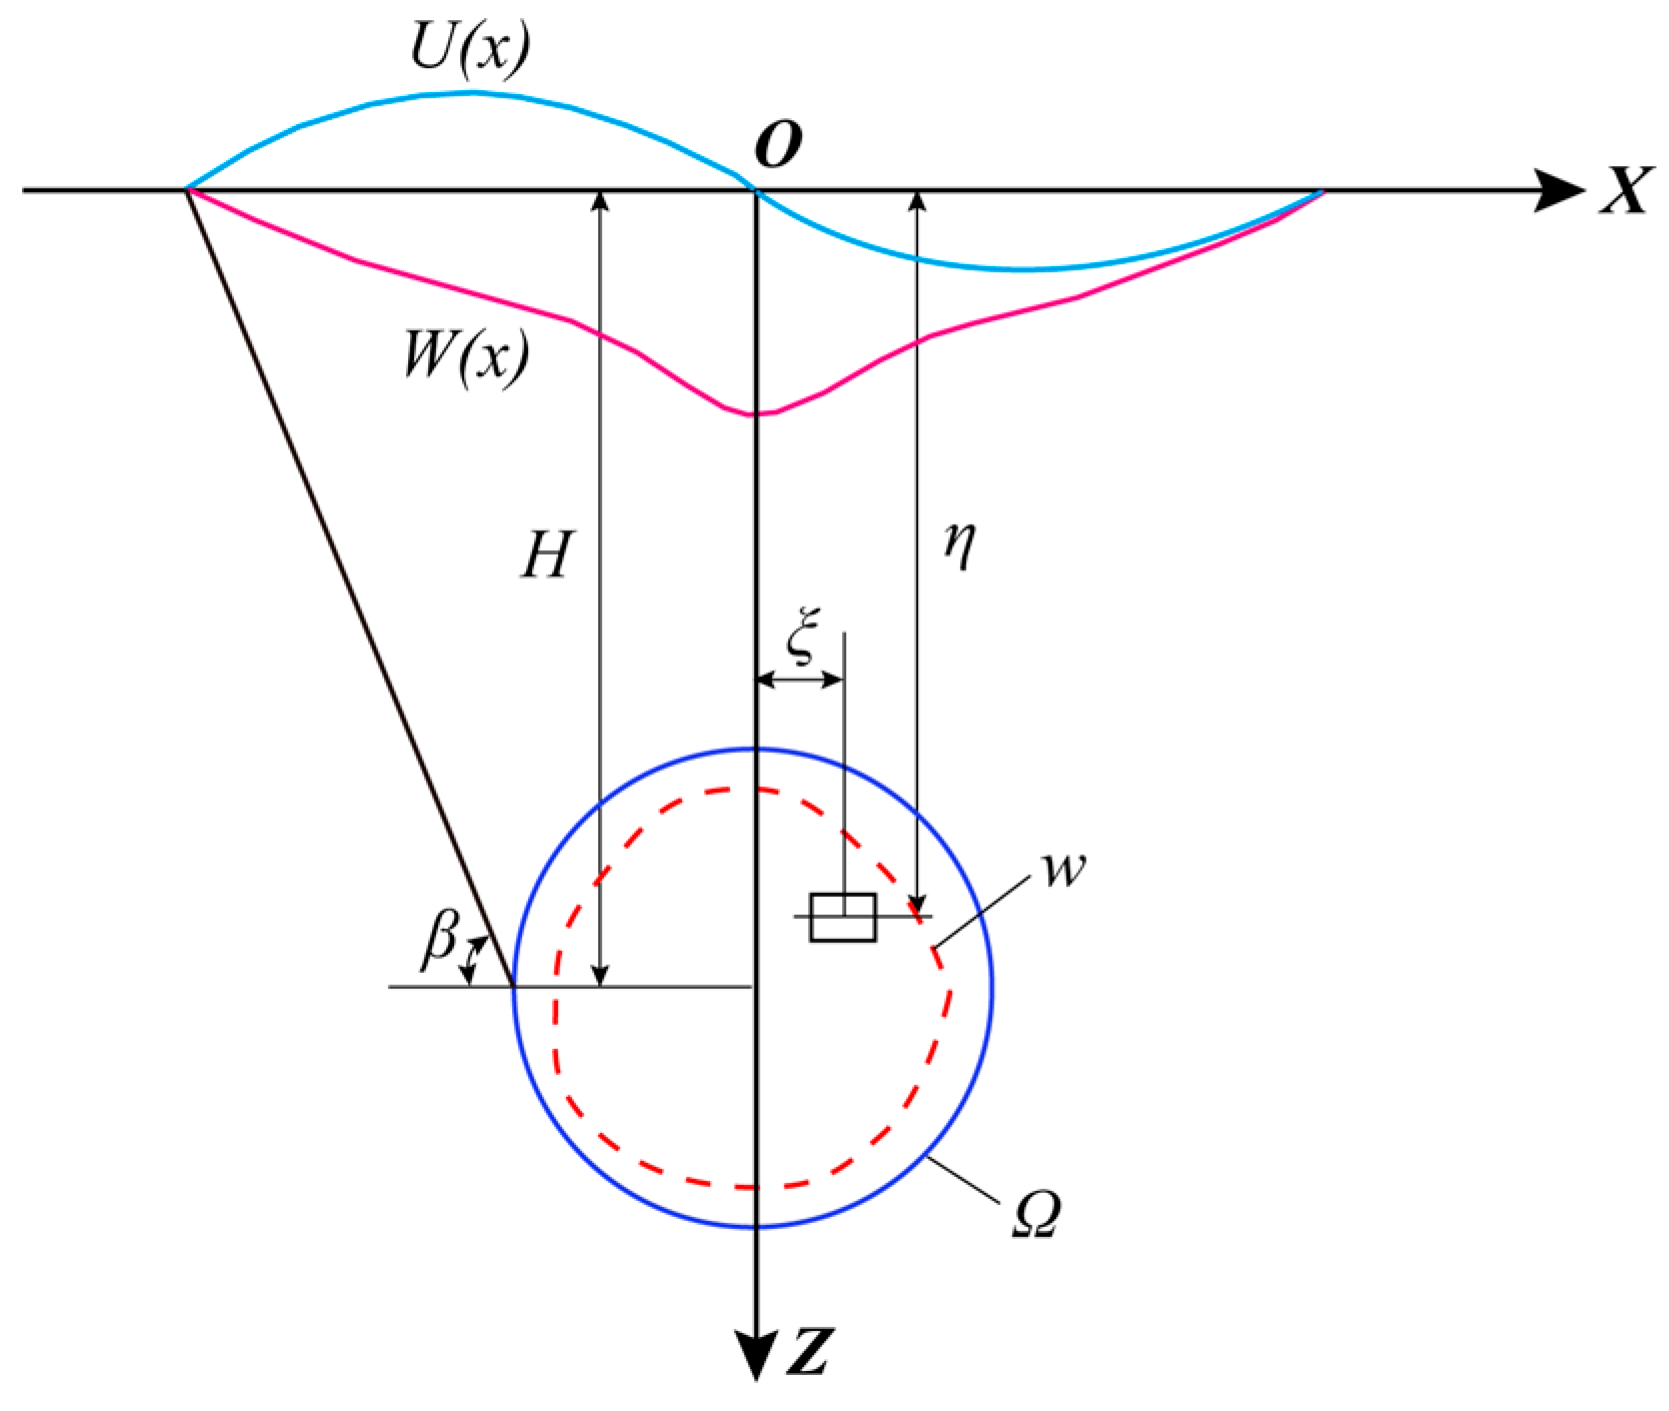
In the excavation stage of the pilot tunnels, the prediction results of surface displacement based on the stochastic medium theory are large compared with the numerical calculation results, the error size varies for different excavation schemes, and the prediction results are conservative. The results show that there is some significance for the prediction of surface displacement in the construction site.
In general, the results of this paper are useful as a guide for field construction, but there is still room for further research based on this paper. In addition to considering the influence of surface load, it should be noted that using the PBA method for construction results in more construction nodes and the nodes are relatively weak and therefore more likely to produce damage and affect the stability of the structure under earthquake action. Therefore, the effect of seismic action on the station structure should be considered in future research.

Author Contributions

Conceptualization, B.H. and Y.B.; Software, Y.Z. (Yu Zeng); Validation, B.H. and Y.Z. (Yu Zou); Investigation, B.H.; Data curation, B.H. and Y.Z. (Yu Zou); Writing—original draft preparation, B.H.; Writing—review and editing, B.H. and Y.Z. (Yu Zeng); Visualization, Y.Z. (Yu Zeng). All authors have read and agreed to the published version of the manuscript.

Funding

This research was funded by the Fundamental Research Funds for the Central Universities, grant No. 2022XJLJ01. by the Natural Science Research Project of Colleges and Universities in Anhui Province, grant No. KJ2018A0118; by the Scientific Research Project of Anhui Polytechnic University, grant No. Xjky110201912.

Data Availability Statement

Not applicable.

Conflicts of Interest

The authors declare no conflict of interest.

References

  1. Tao, L.J.; Ding, P.; Lin, H.; Wang, H.L.; Kou, W.F.; Shi, C.; Li, S.C.; Wu, S. Three-dimensional seismic performance analysis of large and complex underground pipe trench structure. Soil Dyn. Earthq. Eng. 2021, 150, 106904. [Google Scholar] [CrossRef]
  2. Tao, L.J.; Ding, P.; Shi, C.; Wu, X.W.; Wu, S.; Li, S.C. Shaking table test on seismic response characteristics of prefabricated subway station structure. Tunn. Undergr. Space Technol. 2019, 91, 102994. [Google Scholar] [CrossRef]
  3. Lv, J.B.; Li, X.L.; Li, Z.R.; Fu, H.L. Numerical simulations of construction of shield tunnel with small clearance to adjacent tunnel without and with isolation pile reinforcement. KSCE J. Civ. Eng. 2020, 24, 295–309. [Google Scholar] [CrossRef]
  4. Shakeel, M.; Charles, W.W.N. Settlement and load transfer mechanism of a pile group adjacent to a deep excavation in soft clay. Comput. Geotech. 2018, 96, 55–72. [Google Scholar] [CrossRef]
  5. Cao, L.; Fang, Q.; Zhang, D.; Chen, T. Subway station construction using combined shield and shallow tunnelling method: Case study of Gaojiayuan station in Beijing. Tunn. Undergr. Space Technol. 2018, 82, 627–635. [Google Scholar] [CrossRef]
  6. Guo, X.; Jiang, A. Study on the stability of a large-span subway station constructed by combining with the shaft and arch cover method. Tunn. Undergr. Space Technol. 2022, 127, 104582. [Google Scholar] [CrossRef]
  7. Liu, X.R.; Liu, Y.Q.; Yang, Z.P.; He, C.M. Numerical analysis on the mechanical performance of supporting structures and ground settlement characteristics in construction process of subway station built by pile-beam-arch method. KSCE J. Civ. Eng. 2017, 21, 1690–1705. [Google Scholar] [CrossRef]
  8. Fang, Q.; Zhang, D.; Wong, L.N.Y. Shallow tunnelling method (STM) for subway station construction in soft ground. Tunn. Undergr. Space Technol. 2012, 29, 10–30. [Google Scholar] [CrossRef]
  9. Guan, Y.; Zhao, W.; Li, S.; Zhang, G. Key Techniques and Risk Management for the Application of the Pile-Beam-Arch (PBA) Excavation Method: A case study of Zhongjie subway station. Sci. World J. 2014, 2014, 275362. [Google Scholar] [CrossRef]
  10. Liu, W.; Luo, F.; Mei, J. A new construction method for a metro station in Beijing. Tunn. Undergr. Space Technol. 2000, 15, 409–413. [Google Scholar] [CrossRef]
  11. Liu, J.; Wang, F.; He, S.; Wang, E.; Zhou, H. Enlarging a large-diameter shield tunnel using the Pile-Beam-Arch method to create a metro station. Tunn. Undergr. Space Technol. 2015, 49, 130–143. [Google Scholar] [CrossRef]
  12. Li, B.; Wang, Z.Z. Numerical study on the response of ground movements to construction activities of a metro station using the pile-beam-arch method. Tunn. Undergr. Space Technol. 2019, 88, 209–220. [Google Scholar] [CrossRef]
  13. Ma, S.; Shao, Y.; Liu, Y.; Jiang, J.; Fan, X. Responses of pipeline to side-by-side twin tunnelling at different depths: 3D centrifuge tests and numerical modelling. Tunn. Undergr. Space Technol. 2017, 66, 157–173. [Google Scholar] [CrossRef]
  14. Ren, J.; Cao, X. Research on the Surface Settlement of Subway Station Induced by PBA Construction Method. J. Railw. Eng. Soc. 2018, 35, 88–92. [Google Scholar]
  15. Guo, X.; Jiang, A.; Wang, S.; Gui, Y. Study on the Applicability of an Improved Pile-Beam-Arch Method of Metro Station Construction in the Upper-Soft and Lower-Hard Stratum. Adv. Civ. Eng. 2021, 2021, 6615016. [Google Scholar] [CrossRef]
  16. Hong, Y.; Soomro, M.A.; Ng, C.W.W. Settlement and load transfer mechanism of pile group due to side-by-side twin tunnelling. Comput. Geotech. 2015, 64, 105–119. [Google Scholar] [CrossRef]
  17. Liu, X.; Liu, Y.; Qu, W.; Tu, Y. Internal force calculation and supporting parameters sensitivity analysis of side piles in the subway station excavated by Pile- Beam-Arch method. Tunn. Undergr. Space Technol. 2016, 56, 186–201. [Google Scholar] [CrossRef]
  18. Poulos, H.; Chen, L.; Hull, T. Model Tests on Single Piles Subjected to Lateral Soil Movement. Soils Found. 1995, 35, 85–92. [Google Scholar] [CrossRef]
  19. Bobet, A.; Yu, H.T. Full stress and displacement fields for steel-lined deep pressure tunnels in transversely anisotropic rock. Tunn. Undergr. Space Technol. 2016, 56, 125–135. [Google Scholar] [CrossRef]
  20. Li, S.; Jianie, Y.C.; Ho, I.H.; Ma, L.; Wang, Q.C.; Yu, B.T. Experimental and numerical analyses for earth pressure distribution on high-filled cut-an-cover tunnels. KSCE J. Civ Eng. 2017, 24, 1903–1913. [Google Scholar] [CrossRef]
  21. Sadaghiani, M.H.; Dadizadeh, S. Study on the effect of a new construction method for a large span metro underground station in Tabriz-Iran. Tunn. Undergr. Space Technol. 2010, 25, 63–69. [Google Scholar] [CrossRef]
  22. Sharifzadeh, M.; Kolivand, F.; Ghorbani, M.; Yasrobi, S. Design of sequential excavation method for large span urban tunnels in soft ground-Niayesh tunnel. Tunn. Undergr. Space Technol. 2013, 35, 178–188. [Google Scholar] [CrossRef]
  23. Budarapu, P.R.; Sudhir Sastry, Y.B.; Natarajan, R. Design concepts of an aircraft wing: Composite and morphing airfoil with auxetic structures. Front. Struct. Civ. Eng. 2016, 10, 394–408. [Google Scholar] [CrossRef]
  24. Likitlersuang, S.; Surarak, C.; Wanatowski, D.; Oh, E.; Balasubramaniam, A. Finite element analysis of a deep excavation: A case study from the Bangkok MRT. Soils Found. 2013, 53, 756–773. [Google Scholar] [CrossRef]
  25. Duenser, C.; Beer, G. Simulation of sequential excavation with the Boundary Element Method. Computers and Geotechnics. Comput. Geotech. 2012, 44, 157–166. [Google Scholar] [CrossRef]
  26. Migliazza, M.; Chiorboli, M.; Giani, G.P. Comparison of analytical method, 3D finite element model with experimental subsidence measurements resulting from the extension of the Milan underground. Comput. Geotech. 2009, 36, 113–124. [Google Scholar] [CrossRef]
  27. Valizadeh Kivi, A.; Sadaghiani, M.H.; Ahmadi, M.M. Numerical modeling of ground settlement control of large span underground metro station in Tehran Metro using Central Beam Column (CBC) structure. Tunn. Undergr. Space Technol. 2012, 28, 1–9. [Google Scholar] [CrossRef]
  28. Miehe, C.; Hofacker, M.; Welschinger, F. A phase field model for rate-independent crack propagation: Robust algorithmic implementation based on operator splits. Comput. Methods Appl. Mech. Eng. 2010, 199, 2765–2778. [Google Scholar] [CrossRef]
  29. Miehe, C.; Welschinger, F.; Hofacker, M. Thermodynamically consistent phase-field models of fracture: Variational principles and multi-field FE implementations. Int. J. Numer. Methods Eng. 2010, 83, 1273–1311. [Google Scholar] [CrossRef]
  30. Chakeri, H.; Ozcelik, Y.; Unver, B. Effects of important factors on surface settlement prediction for metro tunnel excavated by EPB. Tunn. Undergr. Space Technol. 2013, 36, 14–23. [Google Scholar] [CrossRef]
  31. Zhuang, X.; Zhou, S.; Sheng, M.; Li, G. On the hydraulic fracturing in naturally-layered porous media using the phase field method. Eng. Geol. 2020, 266, 105306. [Google Scholar] [CrossRef]
  32. Huang, B.; Du, Y.; Zeng, Y.; Cao, B.; Zou, Y.; Yu, Q. Study on Stress Field Distribution during the Construction of a Group of Tunnels Using the Pile-Beam-Arch Method. Buildings 2022, 12, 300. [Google Scholar] [CrossRef]
  33. Yang, X.; Wang, J. Ground movement prediction for tunnels using simplified procedure. Tunn. Undergr. Space Technol. 2011, 26, 462–471. [Google Scholar] [CrossRef]
  34. Sysyn, M.; Przybylowicz, M.; Nabochenko, O.; Liu, J. Mechanism of Sleeper–Ballast Dynamic Impact and Residual Settlements Accumulation in Zones with Unsupported Sleepers. Sustainability 2021, 13, 7740. [Google Scholar] [CrossRef]
  35. Sysyn, M.; Przybylowicz, M.; Nabochenko, O.; Kou, L. Identification of Sleeper Support Conditions Using Mechanical Model Supported Data-Driven Approach. Sensors 2021, 21, 3609. [Google Scholar] [CrossRef]
Figure 1. Daguanying subway station: (a) Location; (b) Structure profile.
Symmetry 14 01892 g001
Figure 2. PBA method introduction: (a) structure composition; (b) Construction process.
Symmetry 14 01892 g002
Figure 3. Numerical model: (a) Finite element mesh; (b) Boundary conditions.
Symmetry 14 01892 g003
Figure 4. Surface center settlement process.
Symmetry 14 01892 g004
Figure 5. Surface displacement curves: (a)surface settlement; (b) surface horizontal displacement.
Symmetry 14 01892 g005
Figure 6. Vertical displacement of strata in different stages: (a) Stage I; (b) Stage II; (c) Stage III; and (d) Stage IV.
Symmetry 14 01892 g006
Figure 7. Vertical displacement of model center in different stages.
Symmetry 14 01892 g007
Figure 8. Strata displacement rebound mechanism.
Symmetry 14 01892 g008
Figure 9. The maximum principal stress distribution of structure in different stages: (a) Stage I; (b) Stage II (c); Stage III; and (d) Stage IV.
Symmetry 14 01892 g009
Figure 10. Surface center settlement process under different loads.
Symmetry 14 01892 g010
Figure 11. Surface displacement curves under different loads: (a)surface settlement; and (b) surface horizontal displacement.
Symmetry 14 01892 g011
Figure 12. Fitting curves of surface displacement under different loads: (a) surface settlement; and (b) surface horizontal displacement.
Symmetry 14 01892 g012
Figure 13. Vertical displacement of the model center under different loads.
Symmetry 14 01892 g013
Figure 14. The maximum principal stress distribution of structure under different loads: (a) P = 20 kPa; (b) P = 40 kPa; (c) P = 60 kPa; and (d) P = 80 kPa.
Symmetry 14 01892 g014
Figure 15. Surface displacement curves in different plans: (a) surface settlement; and (b) surface horizontal displacement.
Symmetry 14 01892 g015
Figure 16. Analysis of ground deformation and section shrinkage in tunnel excavation.
Symmetry 14 01892 g016
Figure 17. Equivalent pilot tunnels to circular tunnels.
Symmetry 14 01892 g017
Figure 18. Surface Displacement Curves Caused by pilot tunnel excavation: (a) surface settlement, and (b) surface horizontal displacement.
Symmetry 14 01892 g018
Table 1. Material properties of the stratum.
ItemsElastic Modulus
(MPa)
Poisson’s RatioCohesion
(kPa)
Internal Friction Angle
(°)
Density
(kg·m−3)
Artificial soil230.310181950
Pebble bed 1630.250.5402070
Pebble bed 2750.230.8322000
weathered mudstone and shale1050.260352150
Table 2. Material properties of structures.
StructuresBulk Modulus
(GPa)
Shear Modulus
(GPa)
Density
(kg·m−3)
Pilot tunnels lining230011.17.14
Primary lining230011.17.14
Second lining250019.1712.32
Pile250016.712.5
Beam250018.512
Column460019.514.58
Middle plate250019.514.58
Concrete filling244021.6710.83
Publisher’s Note: MDPI stays neutral with regard to jurisdictional claims in published maps and institutional affiliations.

