Article

Machine Learning in Conventional Tunnel Deformation in High In Situ Stress Regions

1
Key Laboratory for Urban Underground Engineering of the Ministry of Education, Beijing Jiaotong University, Beijing 100044, China
2
School of Architecture and Transportation, Ningbo University of Technology, Ningbo 315016, China
*
Author to whom correspondence should be addressed.
Symmetry 2022, 14(3), 513; https://doi.org/10.3390/sym14030513
Submission received: 22 January 2022 / Revised: 22 February 2022 / Accepted: 28 February 2022 / Published: 2 March 2022

Abstract

:
Deformation prediction of extremely high in situ stress in soft-rock tunnels is a complex problem involving many parameters, and traditional analytical solutions and numerical simulations have difficulty achieving satisfactory results. This paper proposes the MIC-LSTM algorithm based on machine learning methods to predict the deformation of soft-rock tunnels under extremely high in situ stress conditions caused by construction. The study first analyzed the difficulties of engineering construction and the construction plan; then, numerical simulation was used to verify the modified construction plan. To prove that the construction plan was reasonable, machine learning was used to analyze the correlation of the various parameters that cause tunnel deformation; then, the future deformation of the tunnel was predicted. The study found that: (1) the new construction scheme contains symmetrical arrangement of bolts and two support structures along the tunnel vault can effectively control the deformation of the tunnel, and meet the requirements of the specification; (2) the rock uniaxial compressive strength had the greatest impact on tunnel deformation, and the rock humidity had the least influence on tunnel deformation; and (3) the prediction curve based on the deep learning model had a higher similarity to the monitoring curve compared with the traditional numerical analysis software. The MIC-LSTM machine algorithm provides a new approach to predicting the deformation of extremely high in situ stress soft-rock tunnels.

1. Introduction

With the continuous improvement of China’s road network and the implementation of the strategy of strengthening the country’s transportation, a large amount of transportation infrastructure projects will be built in the western mountainous areas. The Qinghai–Tibet Plateau area in the western region is affected by a series of effects, such as the subduction of oceanic plates and the mutual extrusion of continental plates, and the geological structure is complex, which brings huge challenges to tunnel construction. Tunnel construction is often faced with a series of unfavorable factors, such as extreme cold, high altitude, high in situ stress, etc. There have been a large number of high-stress, soft-rock large deformation tunnels [1,2,3,4]. Complex and changeable geological conditions, high in situ stress and other factors have caused great difficulties in tunnel construction. With high in situ stress, rock bursts and large deformations in the surrounding rock of a tunnel can easily cause construction difficulties, threaten the safety of workers, delay the project and have other adverse effects [5,6,7,8,9].
Many scholars have studied deformation prediction and the control technology of high in situ stress soft-rock tunnels [10,11,12,13,14,15,16,17,18,19,20,21,22,23,24,25,26,27,28,29,30]. Regarding the deformation prediction, Hoek and Paul [10] and Jethwa et al. [11] used the tunnel deformation and strength/stress ratio as the grading index, and proposed a large-deformation prediction grading method for the high in situ stress tunnel based on the curve change rule of the tunnel deformation and the tunnel strength/stress ratio. Wood [12] proposed using the ratio of the uniaxial compressive strength of the rock to the gravity of the overlying stratum as an index to predict the deformation of the high in situ stress soft-rock tunnel. Saari [13] took the tangential strain strength of the tunnel as a parameter for evaluating the degree of deformation of the surrounding rock, and considered that the critical value of the tangential strain strength when deformation occurred was 1%. Aydan et al. [14] proposed a method to predict the deformation of high in situ stress in a soft-rock tunnel by using the tangential relative strain based on the rock constitutive curve obtained under uniaxial compression. Regarding the deformation control technology, Hoek [15] put forward supporting measures, such as strengthening the surrounding rock and improving the self-supporting capacity and stability of the arch foot, on the basis of studying the compression degree of the surrounding rock. Barla [16] described the “squeezing” phenomena that may occur during the excavation of tunnels in high in situ stress soft rock, when instability in both the tunnel and the face may take place. Attention was focused on the numerical analyses and design methods presently available and used in design practice. Hu et al. [17] analyzed the interaction mechanism between the long bolt and the surrounding rock in high in situ stress soft rock, and verified the effectiveness of the long bolt in the deformation control of the weak surrounding rock in the Baima Tunnel through monitoring data. Li et al. [18] found that high in situ stress soft-rock tunnels should adopt multi-layer and multiple support methods, which would properly release the surrounding rock stress to ensure that the deformation of the tunnel meets the requirements of the specification. Jia et al. [19] discussed the effect of prestressed bolts and bolt-cable support technology in controlling the deformation of surrounding high in situ stress soft rock through the finite difference numerical software FLAC3D. There are still some shortcomings in the current research. First, the study of the correlation between some parameters, which could cause the deformation parameters of high-stress soft-rock tunnels and the tunnel deformation itself, is insufficient, and so cannot effectively guide tunnel construction. Second, due to the complexity, diversity and variability of geological conditions, the prediction of deformation in tunnels mainly relies on traditional analytical solutions or numerical analyses. Since these analyses made certain simplifications or assumptions, there were a certain differences between the predicted values and the actual monitoring values. With the development of machine learning technology, more and more algorithms are used in civil engineering for prediction research [31,32,33,34,35,36,37,38,39]. As a representative neural network algorithm, LSTM considers the temporal characteristics of data and can effectively mine the data characteristics. Combined with the temporal characteristics of the tunnel deformation in this project and the rich database, this study used the LSTM algorithm to replace the traditional method to predict the deformation of the tunnel.
In this paper, a case of a two-way four-lane highway tunnel in the west is presented. First, the deformations under the different construction plans are discussed. Then, the numerical simulation used to model the proposed tunnel construction scheme is presented, as well as how the construction scheme was further optimized. Finally, this paper proposes that the MIC-LSTM algorithm be used to analyze the correlation of the relevant factors that cause tunnel deformation, and predicts the deformation of the tunnel to provide guidance for construction.

2. Project Overview and Construction Plan

This section mainly introduces the general situation of the project studied, which is mainly divided into the geographical location of the project, the geological conditions of the project and the construction scheme adopted in the project.

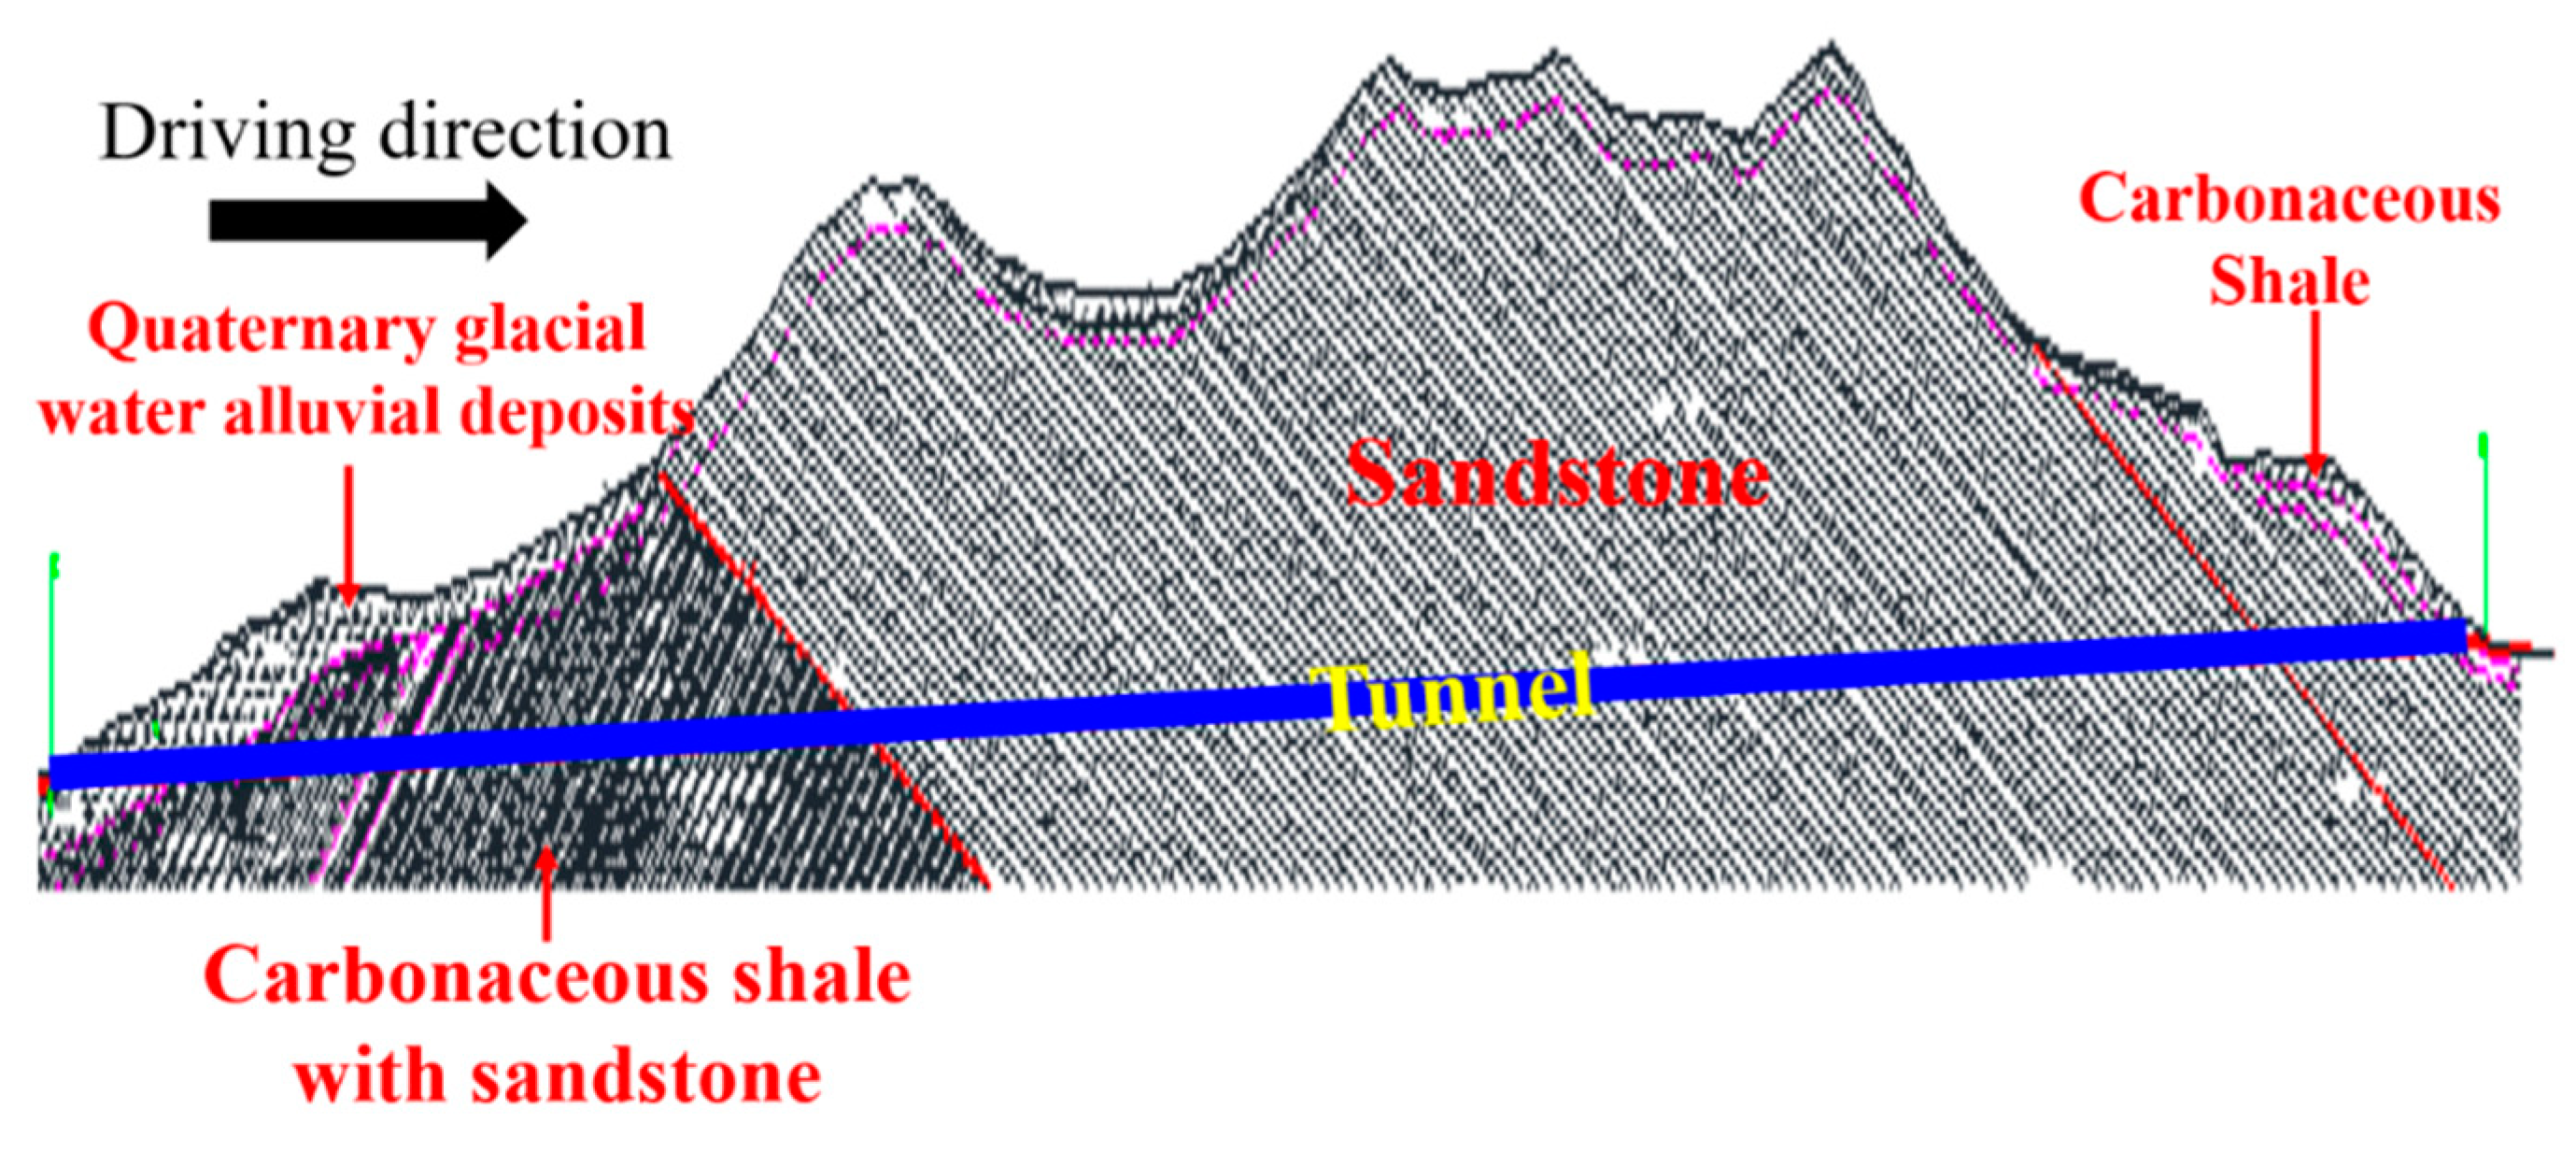
2.1. Project Overview

This paper takes a two-way four-lane highway tunnel in the hinterland of the Qinghai–Tibet Plateau as an example. It is an important branch in the planning of highway traffic to the Qinghai–Tibet Plateau. The tunnel is located in an area of tectonic denudation and mountainous landforms. The tunnel site area is at a high altitude with great topographic relief and a maximum relative height difference of 662 m. The natural slope of the inlet and outlet end of the tunnel is 30~35 degrees, the slope vegetation is not developed, a small number of herbaceous plants grow, the slope fixation ability is poor, and the natural slope is stable.
The lengths of the left and right lines of the tunnel are about 2000 m and 1993 m, respectively. The main strata in the tunnel area are Quaternary glacial-water-diluvial deposits, Lower Carboniferous carbonaceous shale (coal line) interbedded with Devonian sandstone and carbonaceous shale interbedded with sandstone, as shown in Figure 1. The groundwater in the tunnel site area is mainly bedrock fissure water, which is mainly distributed in sandstone and coal-measure strata aquifers, and atmospheric precipitation is the main recharge source. The structure in the area is relatively developed, the bedrock is damaged by different degrees of compression, and joints and fissures are developed, leading to the pore water in the overlying slope deposits generally communicating with and complementing each other. In the area, except for the generally developed joints and fissures, the most influential structures are fault fracture zones. According to the in situ stress test of the tunnel left line, the measured average maximum horizontal principal stress is 18.91 MPa, the average minimum horizontal principal stress is 10.31 MPa, the dominant direction of the maximum horizontal principal stress is NW 64°, and the average saturated compressive strength of the rock is 13.04 MPa. The strength-to-stress ratio RC/σmax = 0.71 < 4, according to the “Standard for engineering classification of rock mass” (GB/T 50218-2014) [40], is judged to be an extremely high in situ stress.

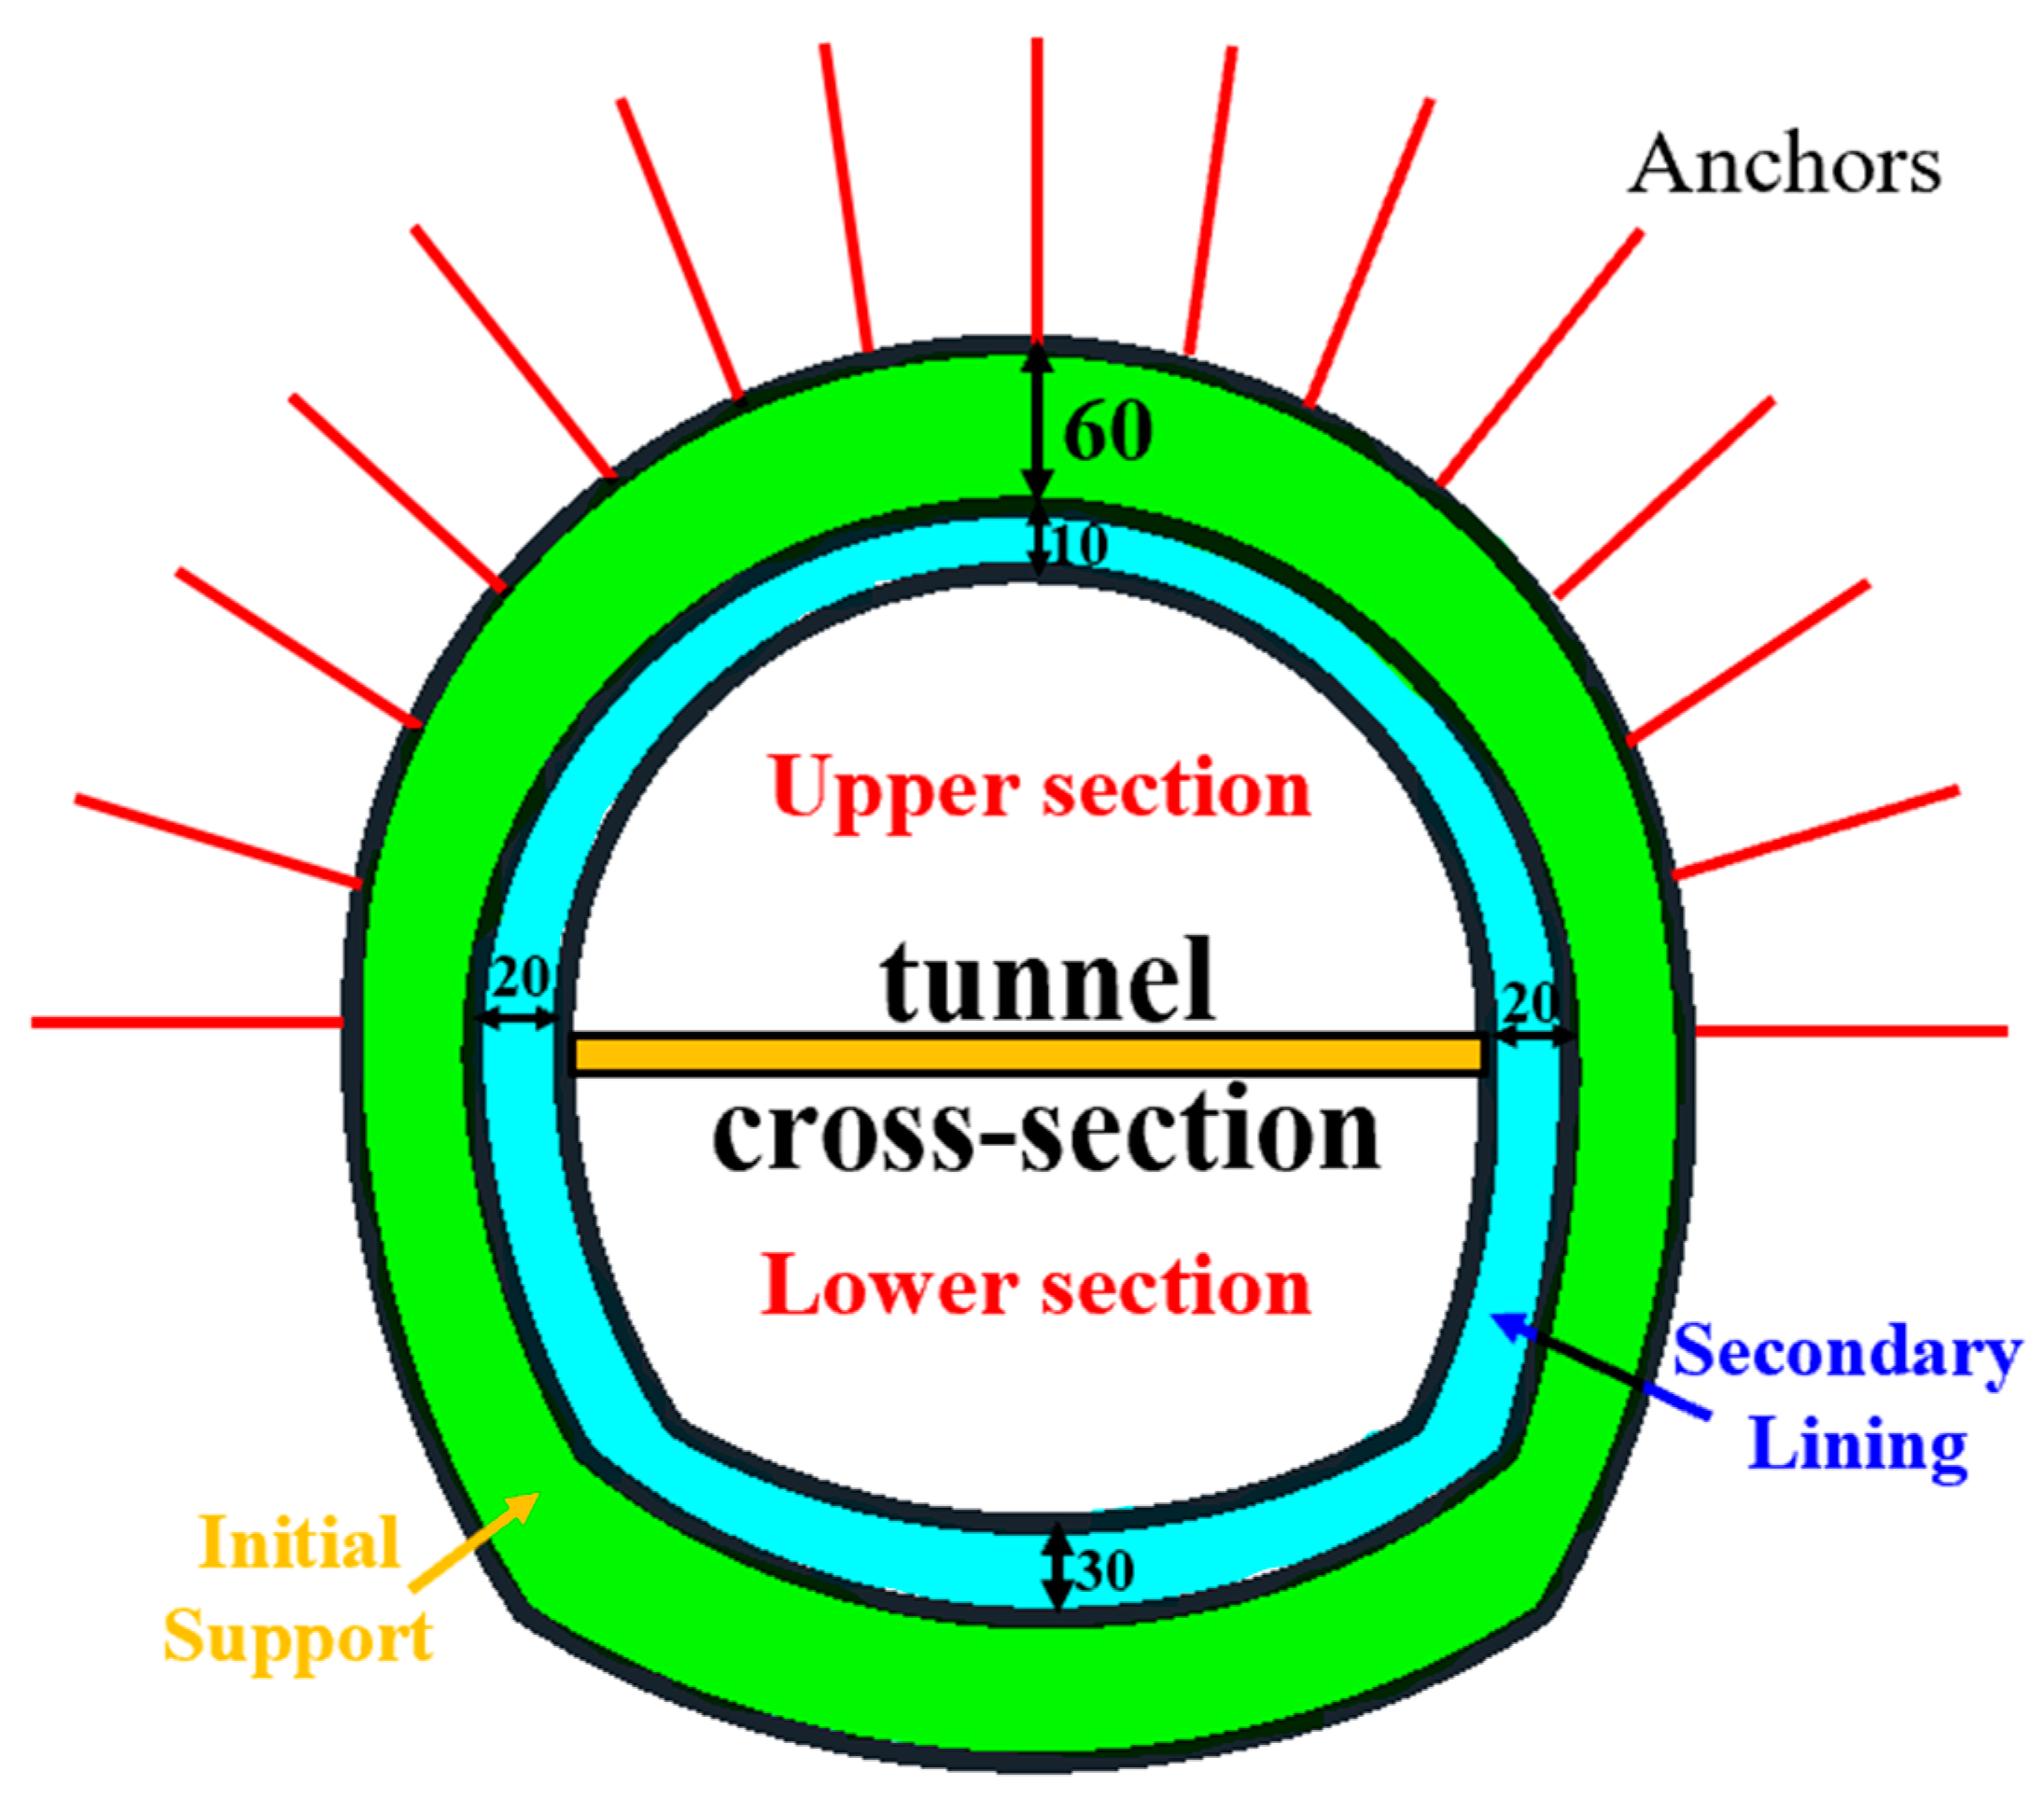
2.2. Construction Plan

The excavation of the left line is 60 m, and the right line is excavated for 49 m. The properties and occurrence structure of the surrounding rock have changed significantly. The lithology has gradually changed from gray sandstone to Lower Carboniferous calcareous siltstone and argillaceous siltstone interlayers intercalated with carbonaceous mudstone and carbonaceous shale. The occurrence structure gradually changes from a medium-coarse-grained structure and a medium-thick layered structure, locally mixed with thin layers, to an imbricate structure. In the new strata, small folds are developed, the occurrence is messy, the joints and fissures are extremely developed, the rock strength is reduced and the self-stability is poor. The original single-layer initial lining could not suppress the problem of tunnel deformation. After the initial support construction on both sides of the tunnel, there were ring and longitudinal cracks, the sprayed concrete partially fell off and the arch frame was twisted and deformed, as shown in Figure 2 and Figure 3. Radial grouting reinforcement, arch protection and other methods were adopted on the site, but the problem of initial support invasion was still not controlled, and the maximum invasion reached 48 cm.
Considering the characteristics of the tunnel, such as its large buried depth, large deformation of the surrounding rock, crumpling, small folds, dense structure, messy occurrence and rapid change, combined with previous engineering experience and expert opinions, it is proposed to adopt the scheme of adding advanced support +S5DBX1 composite lining, that is, double the initial support. Advanced support adopts a grouting bolt form; the size of the bolt is φ 42 (mm) × 4 (m); the range of the bolt layout is the upper half of the tunnel, which employs a 180° layout with a spacing of 1 m. The upper and lower steps are used to excavate the face of the hand, and the excavation length of the upper step is controlled within 3~5 m. After excavation, the outer layer of the upper step is supported with a thickness of 60 mm. The length of the lower step is approximately 5–8 m. A temporary invert of the upper step is applied before the excavation of the lower step. After the completion of the temporary invert, the excavation of the lower step is carried out. After the excavation is completed, the initial support of the lower step is applied, which is enclosed with the initial support of the upper step. According to the “Guidelines for Design of Highway Tunnel” (JTG/T D70-2010) [41], for the large deformation section of high in situ stress soft rock, when the change rate is less than 2 mm/d, the surrounding rock is considered to be basically stable, and secondary lining can be carried out. After the excavation of the upper and lower steps is completed, the initial stage and the second lining support are enclosed and formed into a ring as a complete construction sequence, as shown in Figure 4, bolts and two support structures are distributed symmetrically along the tunnel vault, they can enhance the stability of the tunnel.

3. Numerical Simulation of Tunnel Deformation

Based on the above section on the basis of the adjustment of the tunnel construction scheme, this section uses the finite difference software FLAC3D to simulate the construction of the left line, analyzes the deformation of the tunnel structure caused by the excavation after the adjustment of the construction scheme and compares the numerical simulation results with the standard control value to verify the rationality of the construction scheme.

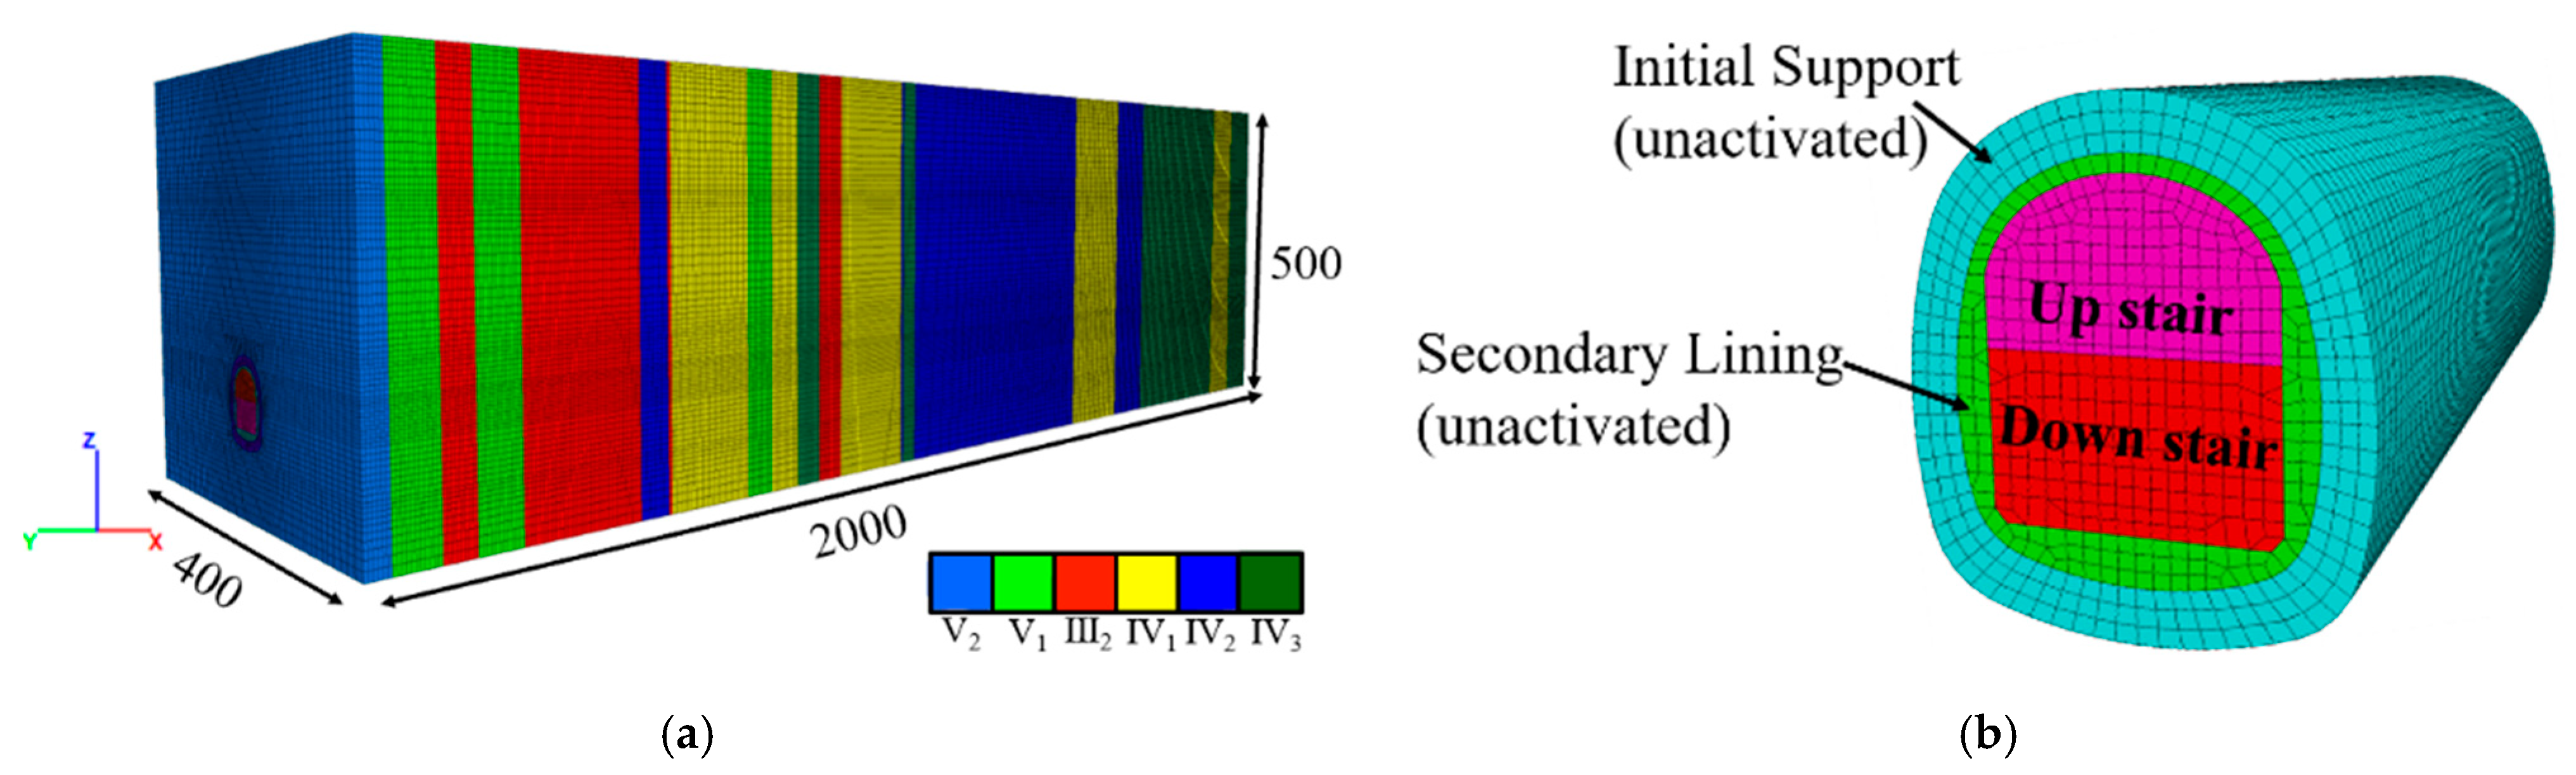
3.1. The Establishment of Three-Dimensional Numerical Model

The classification standard of the rock surrounding the tunnel was implemented in accordance with the “Code for Design of Road Tunnel” (JTGD70-2018) [42] and “Guidelines for Design of Highway Tunnel” (JTG/T D70-2010) [41]. According to the mechanical properties of different rocks in the tunnel site area, the rock grade was divided first; then, considering the influence of the geological structure on the surrounding rock and the development degree of the surrounding rock joints and fissures, and taking into account the influence of the weathering characteristics of the surrounding rock on the surrounding rock’s strength and the harm of groundwater to the surrounding rock, the comprehensive classification of the surrounding rock was made at the same time. Through field exploration tests and relevant specification calculations, the classification of the surrounding rock and physical and mechanical indices are shown in Table 1 and Table 2.
Based on the actual situation, the positive direction of the x-axis is the tunneling direction, the positive direction of the z-axis is the vertical upward direction, and the positive direction of the y-axis is the left direction of the tunnel excavation section. Taking into account the simplicity of the modeling, the influence of the boundary size of the model and the convergence of the calculation, the model adopts the cubic form. As shown in Figure 5, the dimensions are 2000 m (400 construction steps) in the x-direction, 400 m in the y-direction and 500 m in the z-direction, and excavation starts from x = 0. The model is divided into 1,573,840 units and 1,642,201 nodes. According to the actual situation, the boundary condition of the top surface of the model was set as a free boundary, and other interfaces were set according to the normal constraint. Then, the initial stress was applied, and the stress balance was calculated. When the initial stress is applied, according to the geological stress survey data, the average burial depth of the tunnel is 350 m. At the bottom of the model, σxx = σyy = 21.34 MPa, σzz is 15.08 MPa and the distribution is linear from the bottom to the surface. According to the geological survey, the groundwater in the tunnel construction area is fissure water, with a small amount of water and poor fluidity, so the effect of the groundwater was ignored.

3.2. Material Parameters

In the numerical simulation, the Mohr–Coulomb elastic–plastic model were used for the rock mass, and the NULL model were used for the excavation part. The parameters of the rock mass are shown in Table 2, and the structural parameters of the tunnel are shown in Table 3.

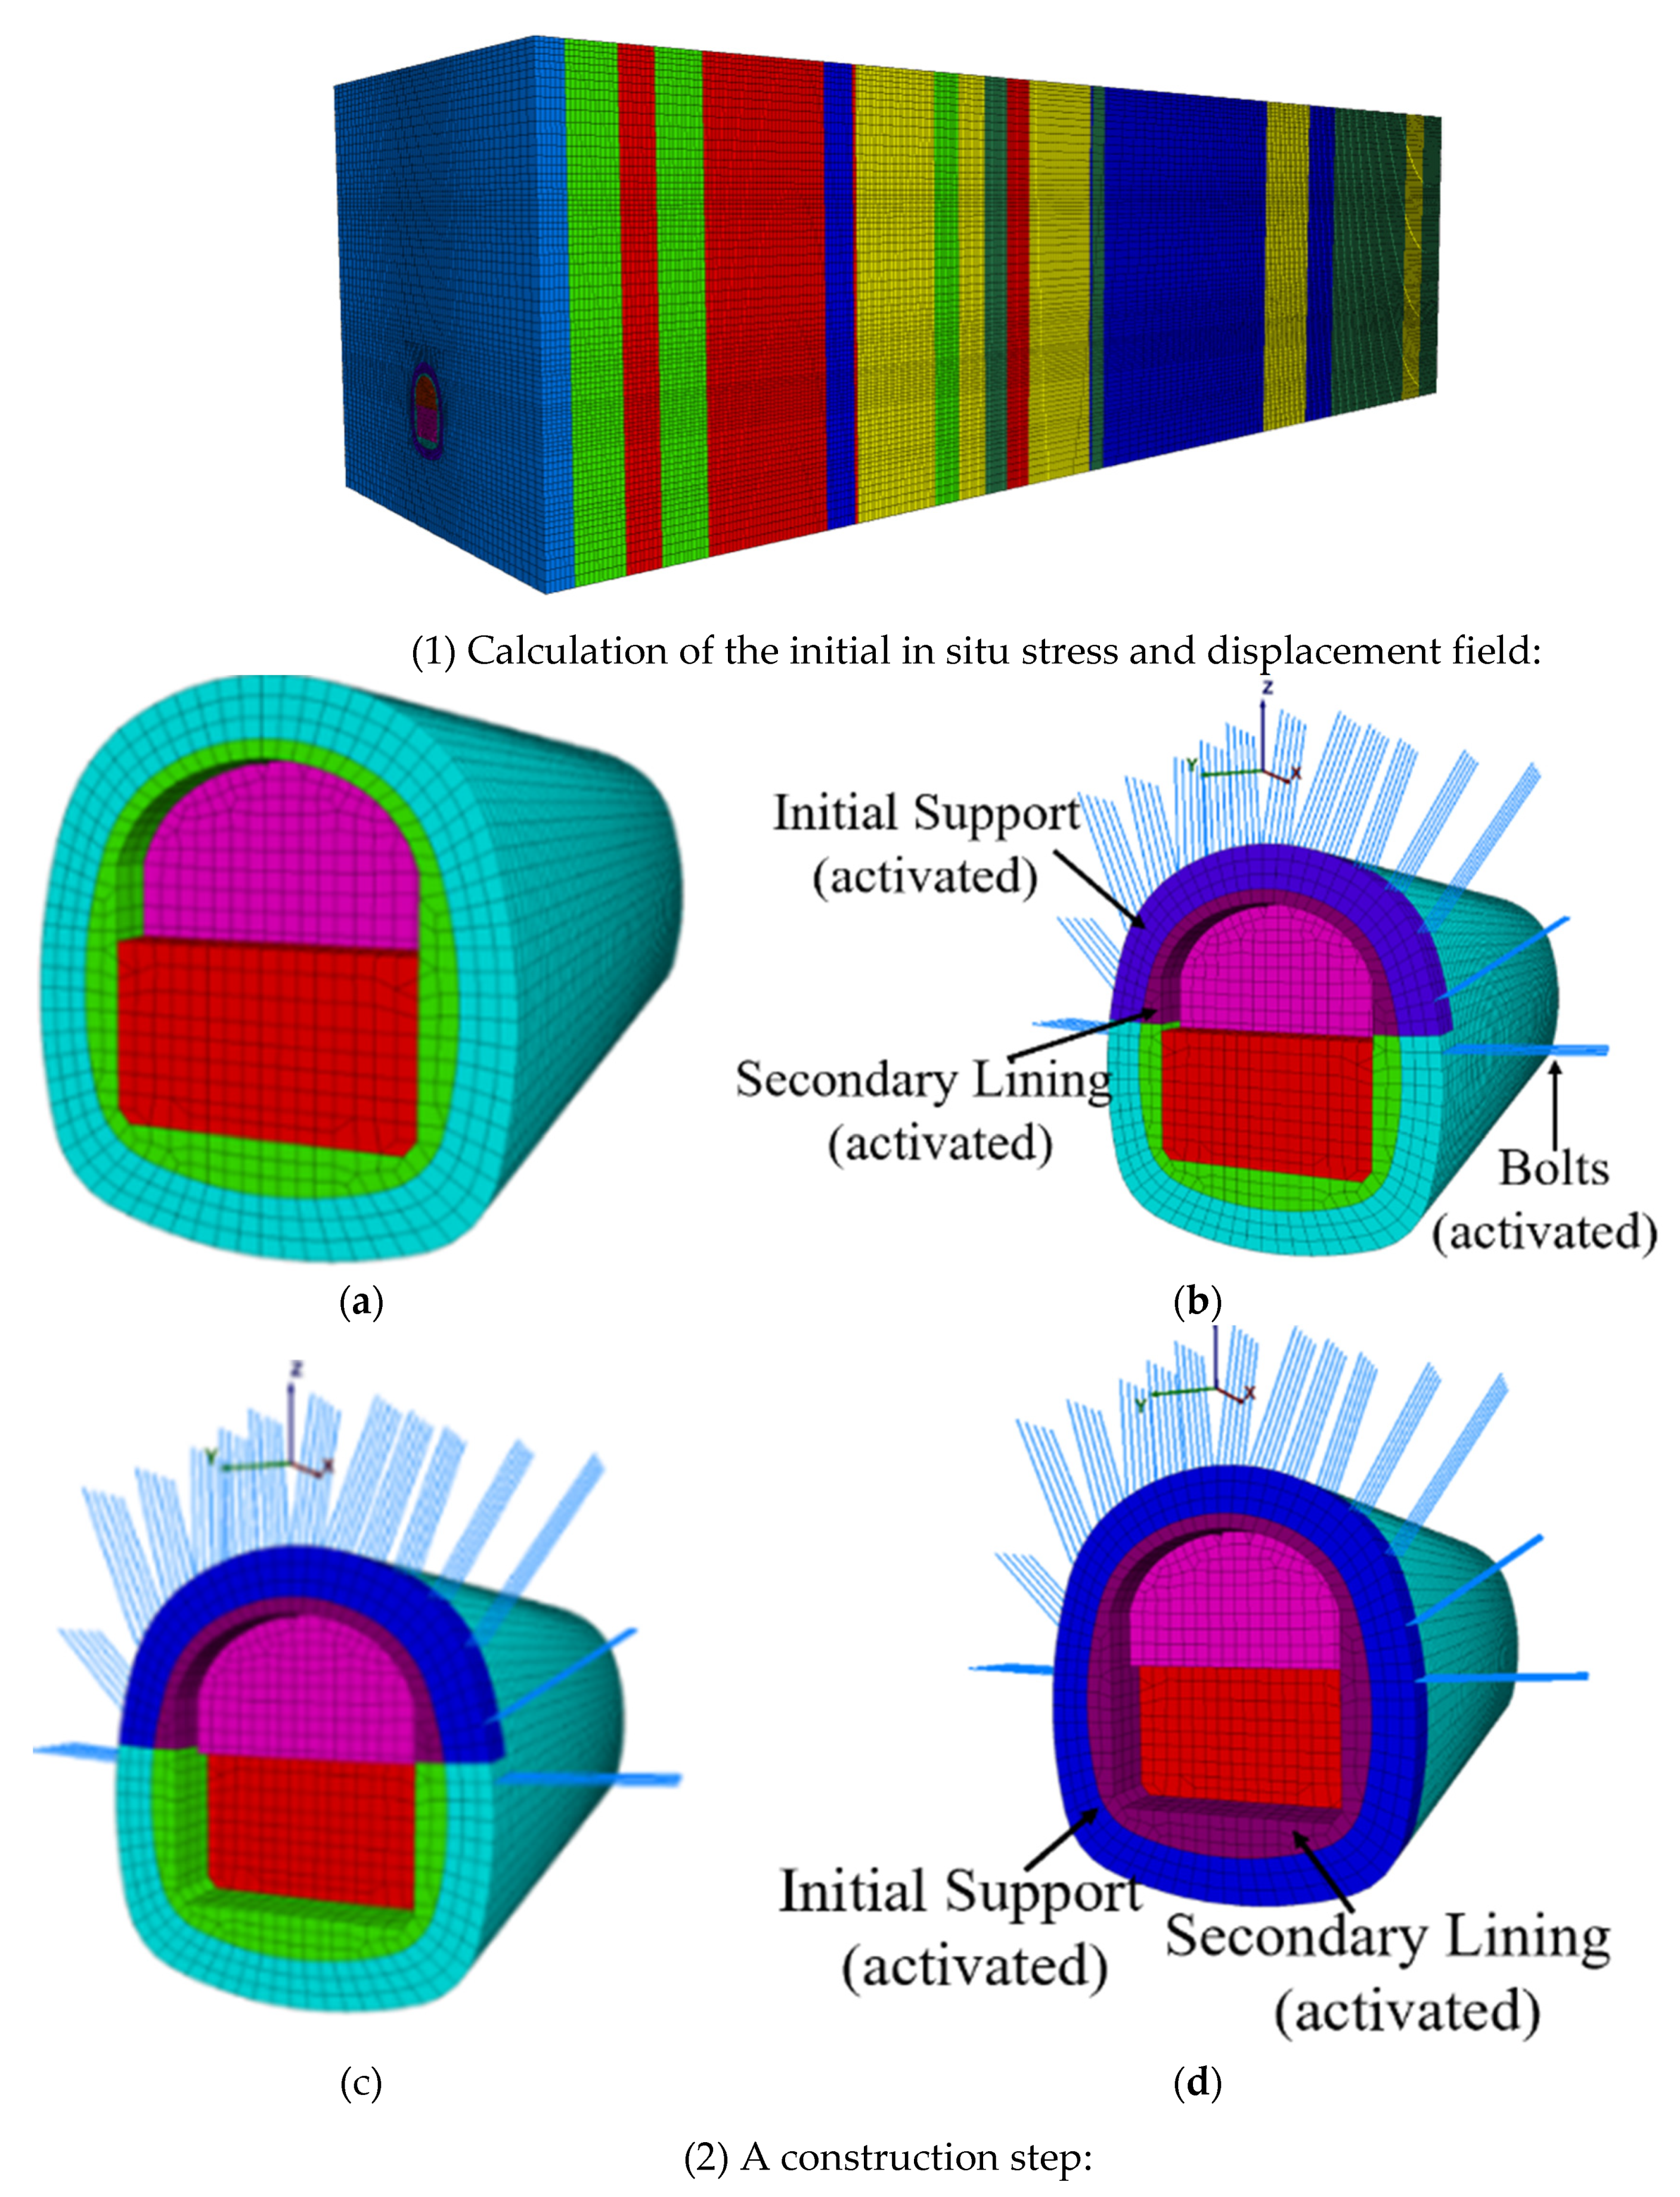
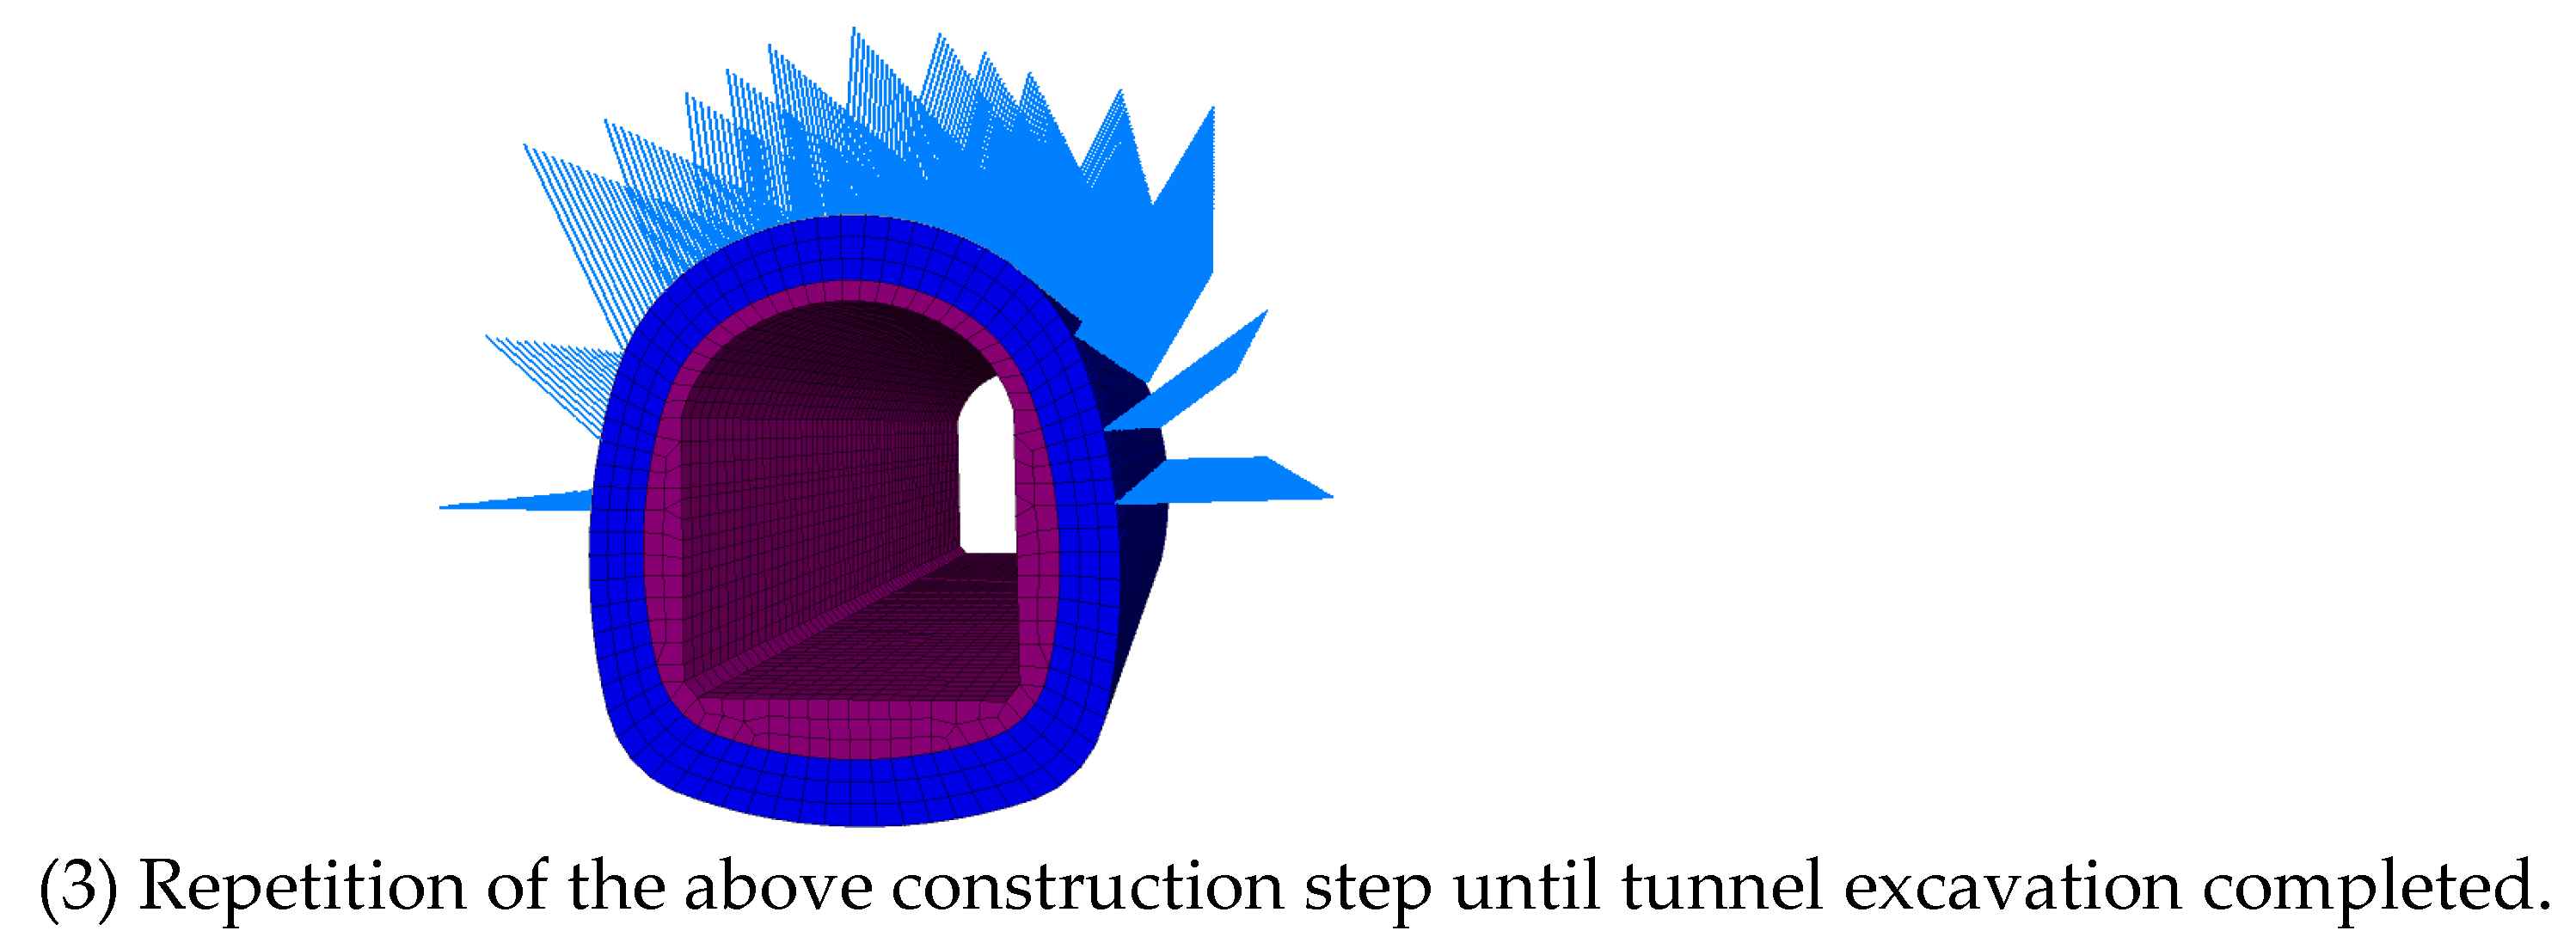
3.3. Numerical Simulation Steps

First, the initial in situ stress of the model was calculated, and the displacement field was cleared. A complete construction step includes the completion of the upper and lower excavation steps, and the second lining is closed into a ring. Then, the tunnel deformation caused by different construction steps was calculated. The specific simulation steps are shown in Figure 6.

3.4. Result Analysis

The cloud diagram of tunnel settlement in two excavation stages was selected, as shown in Figure 7. If the tunnel were excavated, there would be uneven settlement and uplift of the vault and the bottom of the tunnel. The deformation of the vault and the bottom of the tunnel would gradually increase as the tunnel excavation continued, and in the process of tunnel excavation, the maximum deformation would always be located at the excavation hole. When the tunnel excavation was completed, the maximum settlement of the vault would be 10.5 cm, and the maximum uplift of the bottom of the tunnel would be 11 cm.
According to the numerical simulation results, the change curve of the maximum deformation value of the tunnel vault and bottom under the different excavation steps was drawn. Figure 8 shows that with the continuous excavation of the tunnel, the surrounding rock stress would be released, the settlement of the vault and the uplift of the bottom would gradually increase, and, with the implementation of the supporting structure, the deformation amplitude would gradually slow. When the tunnel excavation was completed, the maximum settlement of the tunnel vault would be 10.5 cm, and the maximum uplift of the tunnel floor would be 11 cm, which is less than the specified value (20 cm) in the existing specification. The numerical simulation results verify that the deformation of the tunnel under the new excavation and support scheme could meet the relevant requirements.

3.5. Optimization of Bolt Parameters

Considering that the numerical simulation simplified many parameters and the actual construction would be easily affected by many uncertain factors, it would be easy for the tunnel deformation to exceed the limit value, so some construction parameters were optimized to further reduce the tunnel deformation. As is well known, the bolt can play a huge role in the support of the broken surrounding rock, so it is proposed to optimize the parameters of the bolt. This section mainly discusses the influence of the length and spacing of the bolts on the tunnel support effect. The numerical simulation includes four working conditions, as shown in Table 4.
Figure 9 shows the change in the maximum settlement and the uplift value of the tunnel under the four schemes. It can be seen that with the increase in the bolt length and the decrease in the spacing, the maximum deformation of the tunnel gradually would decrease. Under the four schemes, the maximum settlement value of the tunnel vault and the maximum uplifts at the bottom of the tunnel are shown in the Table 5, all of which would meet the requirements of the specification. However, the numerical changes between schemes 2 and 3 are larger, indicating that the settlement control effect is more obvious. Considering factors such as the construction difficulty and the project’s cost, the length selected for the bolt was 5 m, and the spacing between the bolts selected was 1 m.

4. Algorithm Introduction

4.1. Maximal Information Coefficient (MIC)

MIC [43] can measure the correlation of two variables, and is often used for feature selection in machine learning. MIC is universal, fair and symmetrical. The MIC calculation is divided into three steps.
(1) First, the dataset D is divided into an m × n grid G, and the corresponding probability distribution is DG. The maximum mutual information is:
N ( D , x , y ) = max   N ( D G )
where x and y are the distribution ranges of dataset D, m and n are positive integers, and N(DG) is the mutual information under probability distribution DG.
(2) Then, the largest mutual information value is normalized:
M ( D ) x , y = N ( D , x , y ) l o g m i n ( x , y )
(3) Then, the maximum value of mutual information at different scales is selected as the MIC value:
M I C ( D ) = max x y B ( n ) { M ( D ) x , y }
where B ( n ) is an empirical value, n 0.6.

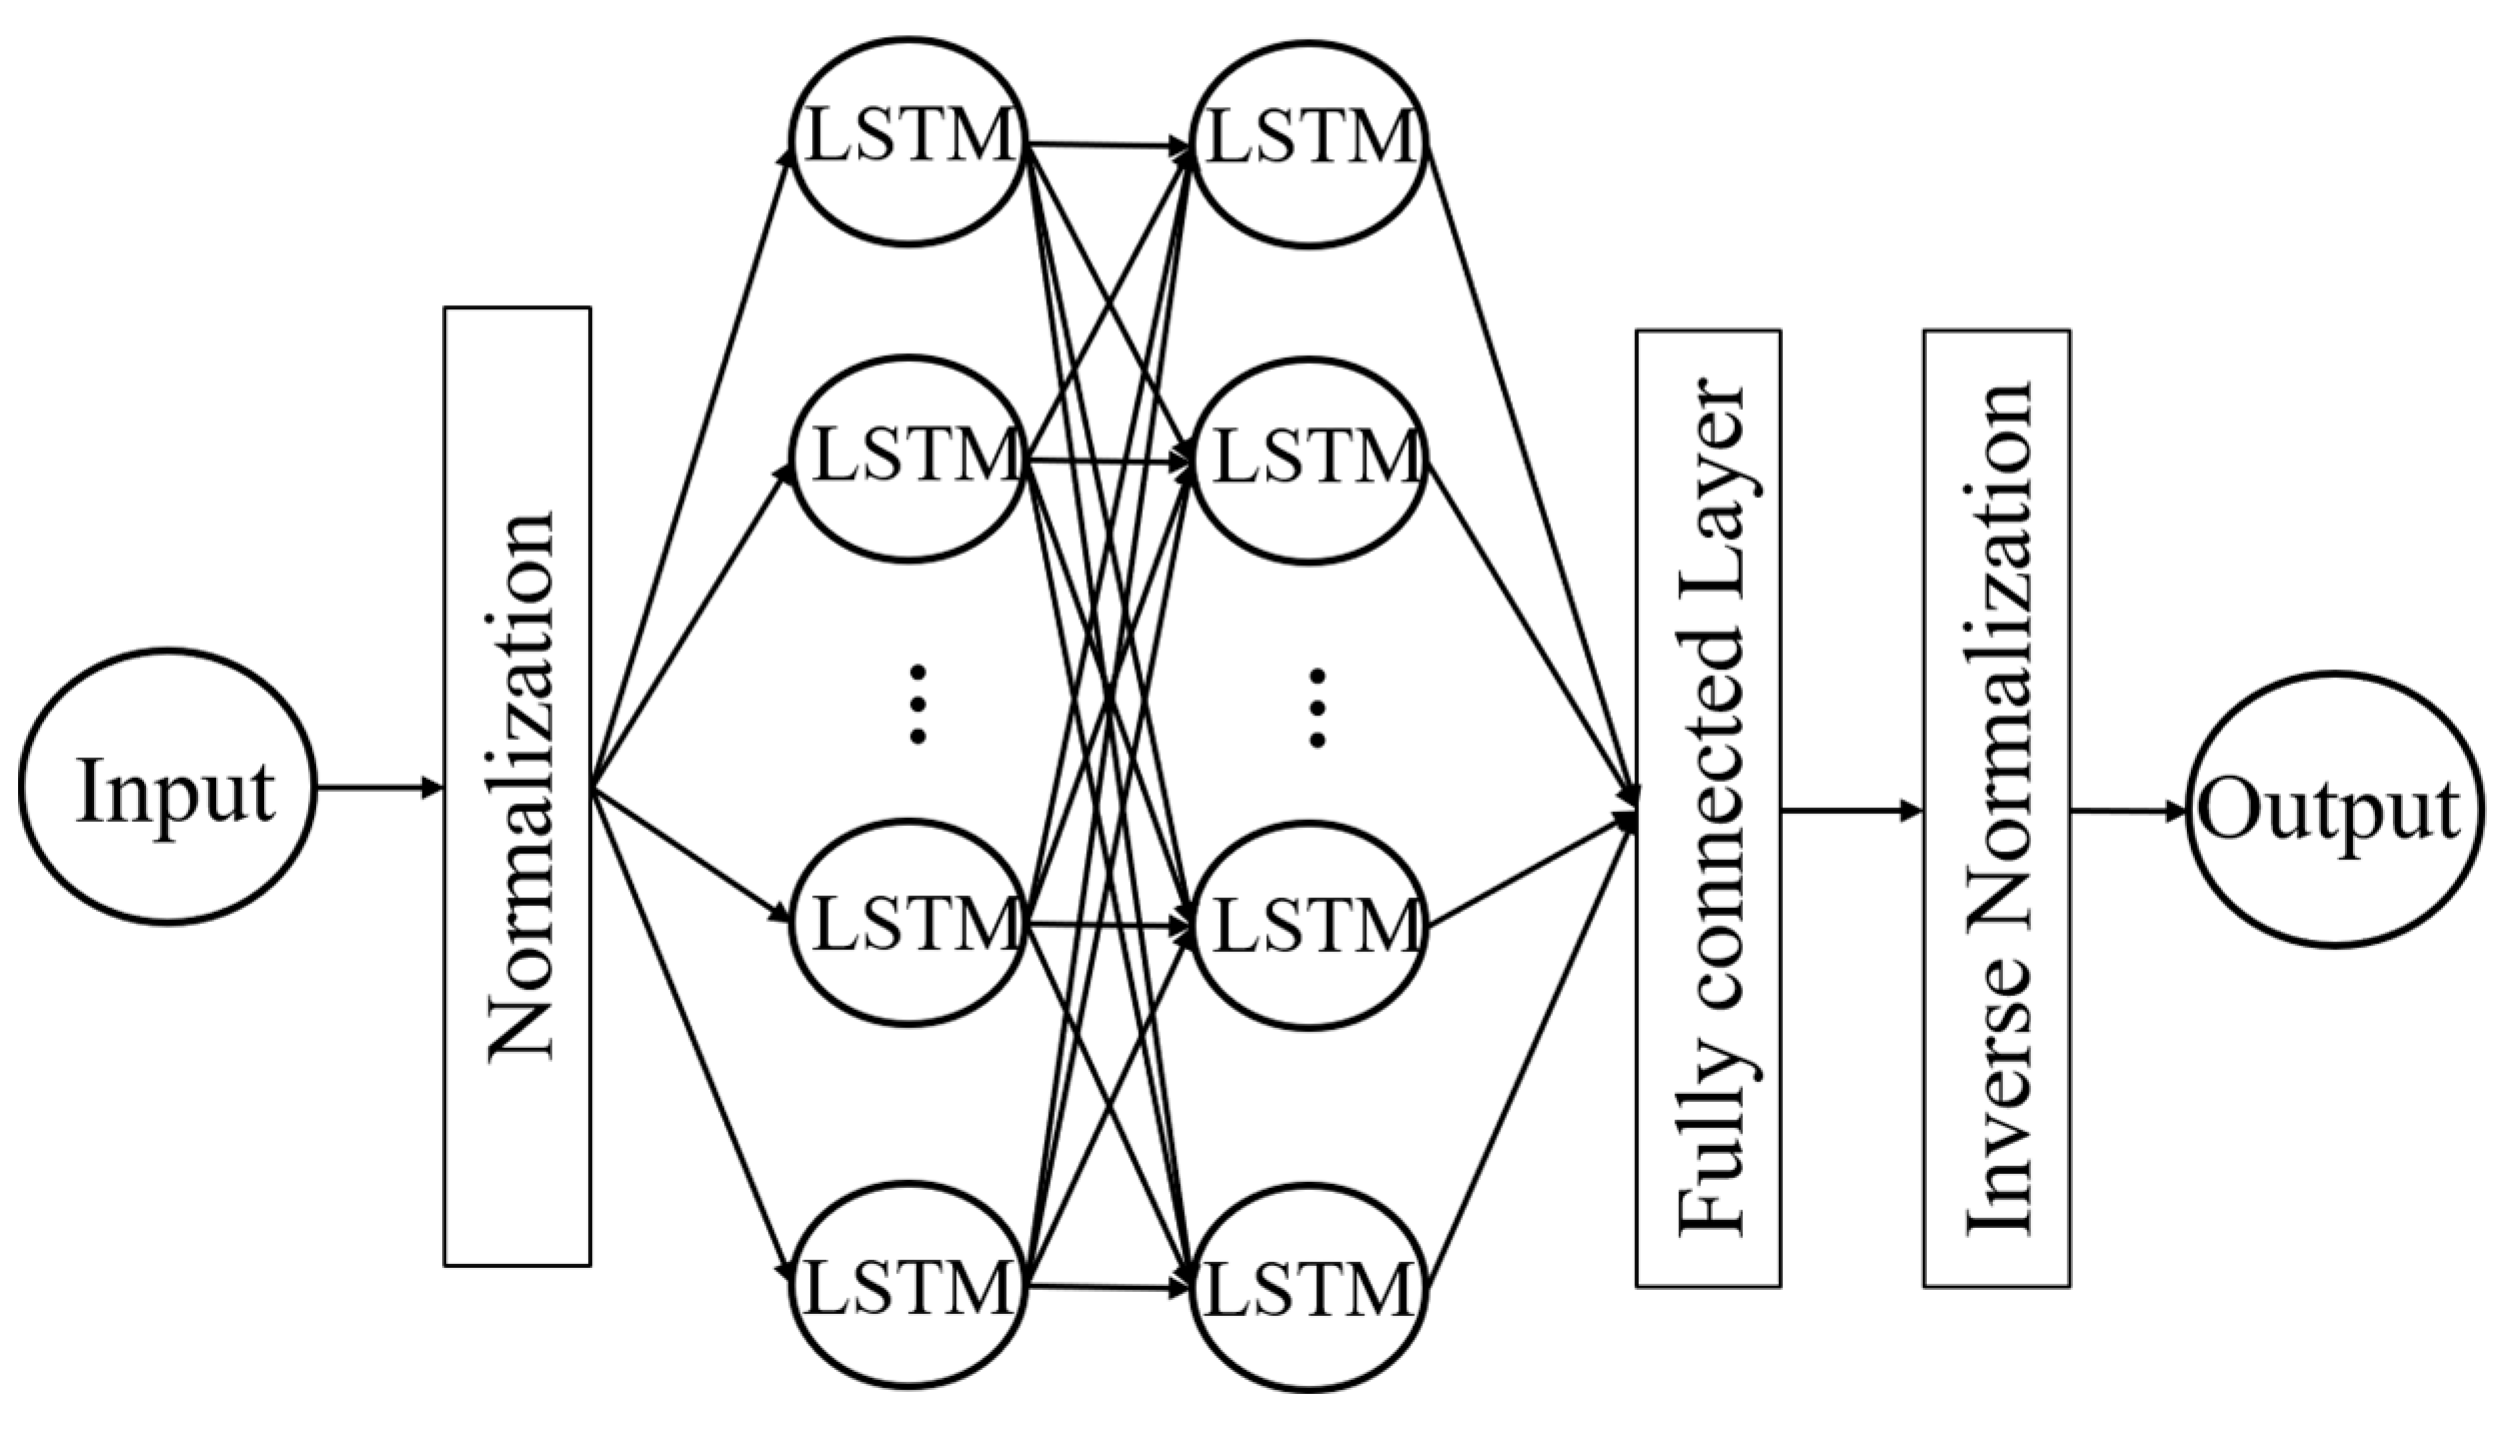
4.2. Long Short-Term Memory (LSTM)

Recurrent neural networks (RNNs) appeared in the 1980s, and have a strong processing capability for variable-length sequence data [44,45]. RNNs can effectively deal with data with time series characteristics, and they can mine the time series information in the data. A RNN neural network consists of an input layer, a hidden layer and an output layer. The basic structure is shown in the Figure 10.
LSTM is a special recurrent neural network (RNN) that is mainly used to solve the problem of gradient disappearance and gradient explosion during the process of long sequence training [46,47,48]. LSTM is mainly composed of a forget gate, an input gate and an output gate, as shown in Figure 11. It studies the internal relationship of existing information by retaining and discarding information, then further predicts future trends. LSTM has a better prediction performance than traditional machine learning.
(1) The calculation formulas for the input gate, forget gate and output gate are:
I t = σ ( W x i x t + W h i h t 1 + b i )
F t = σ ( W x f x t + W h f h t 1 + b f )
O t = σ ( W x o x t + W h o h t 1 + b o )
where W x i , W x f and W x o are the weight values of the input parameter x t and gate units, respectively; W h i , W h f and W h o are the weight values of the input parameter   h t 1 and gate units; b i , b f and b o are bias vectors of the three gate units; and σ is a sigmoid function with values from 0 to 1
(2) The update status in the neural unit cell is:
c t = t a n h ( W x c x t + W h c h t 1 + b c )
c t = F t c t 1 + c t I t
where x t is the input value at the current moment; h t 1 is the output of the previous neural unit; W x c is the weight value of the input parameter x t and the memory unit; W h c is the weight value of h t 1 and the memory unit; b c is the bias vector; and c t 1 is the stored value at the previous moment.
(3) The output value of the LSTM unit is:
h t = O t tanh ( c t )
where h t is the output value of the neural unit at the current moment.

5. Case Study

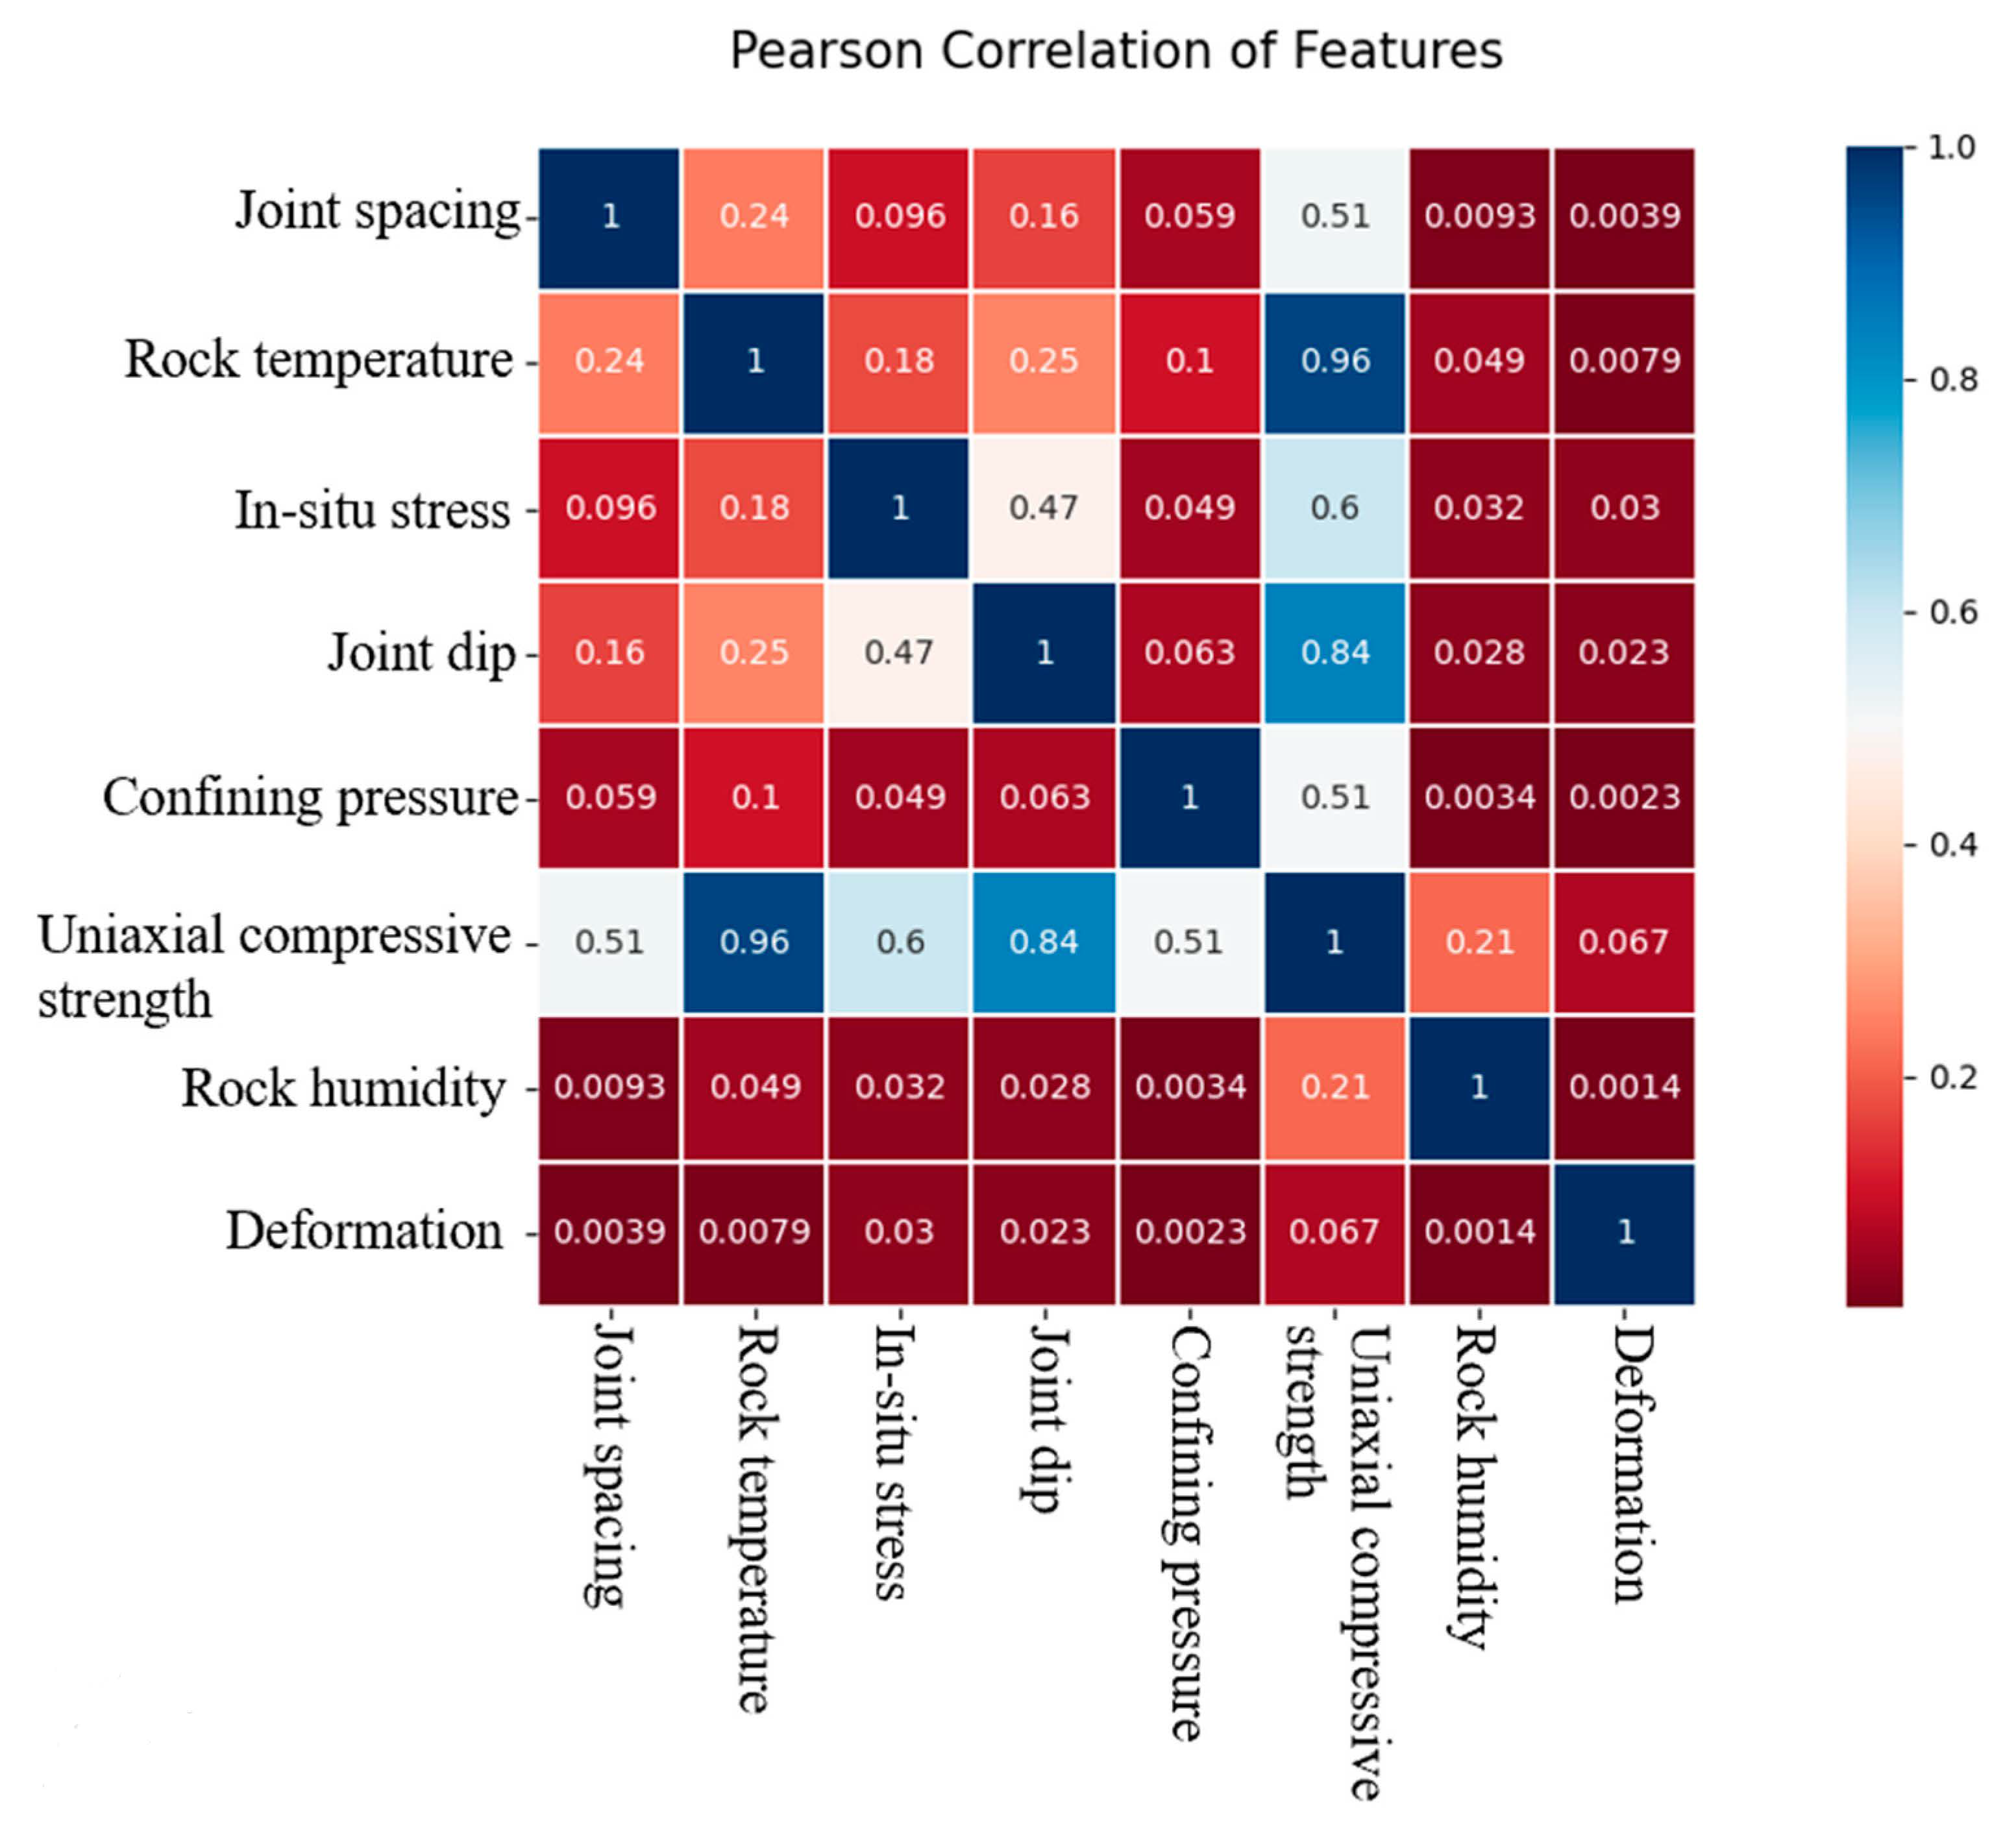
5.1. Parameter Correlation Analysis

Based on tunnel and geology expert opinions from the Chinese Academy of Sciences and engineering experience, this study selected the rock uniaxial compressive strength, confining pressure, in situ stress, rock temperature, rock humidity, joint spacing and joint dip as the main influencing factors on tunnel deformation. A total of 15,000 sets of data were selected as input data, and the MIC algorithm was used to study the correlation between these parameters and tunnel deformation. The calculation results are shown in Figure 12.
From high to low, the tunnel’s deformation was correlated with the input parameters rock uniaxial compressive strength, in situ stress, joint dip, rock temperature, joint spacing, confining pressure and rock humidity. The uniaxial compressive strength of rock would have the greatest influence on the deformation of the tunnel. Therefore, the stability and strength of the rock could be improved by advanced support, which also proves the rationality of setting bolts in the construction plan.

5.2. Tunnel Deformation Prediction

To predict the tunnel deformation using LSTM, the tunnel deformation needs to meet the following conditions. First, it must consider that the tunnel deformation is related to time, so the tunnel deformation is a time series problem. Second, the amount of data needs to meet the requirements of the deep learning model training.

5.2.1. Data Preparation

This section discusses the study’s use of the long short-term memory neural network (LSTM) as the prediction model, which used rock uniaxial compressive strength, confining pressure, in situ stress, rock temperature, rock humidity, joint spacing, and joint dip as input parameters and the deformation of the vault of the tunnel as the output parameter.
According to the numerical simulation research results, the maximum settlement of the vault would be located at the excavation hole, so the monitoring data would be from the monitoring point YK40 + 800 (the YK40 + 800 monitoring point is located at the excavation hole in the modified construction plan). There are 60,000 sets of data on the deformation of the tunnel, including the settlement of the tunnel vault, the uplift of the tunnel bottom and the settlement of the left and right arch waists of the tunnel. Eighty percent of the data in each dataset were used as the training set; the remaining data were used as the test set, and the RMSE (root mean square error), MAE (mean absolute error) and R2 (coefficient of determination) of the test set were used as the model evaluation indicators:
α M A E = 1 n i = 1 n | y i y ^ i |
α RMSE = [ 1 n i = 1 n ( y i y ^ i ) 2 ] 1 / 2
R 2 = 1 i = 1 n ( y i y ^ i ) 2 i = 1 n ( y i y ¯ i ) 2
To improve the prediction accuracy of the model and speed up the convergence speed of the model training, this study first normalized the raw data:
x = x x m i n x m a x x m i n
where x is the raw data and x m a x ,   x m i n are the maximum and minimum values of the raw data, respectively.

5.2.2. Model Training

For the hyperparameters involved in the prediction model, the experimental method was used to choose the corresponding value range, and the parameters were adjusted by a cross validation grid search, which helped us to obtain the optimal hyperparameter combination. The final hyperparameter combinations by parameter adjustment and optimization are as shown in Table 6.
The architecture of the LSTM for predicting the tunnel deformation is shown in Figure 13.
After the hyperparameter optimization of the LSTM model in this study, it used the first 60 data to predict the 61st data in the training set, calculated the loss value and then iterated down in turn; through this process it got the smallest loss value by continuously updating and optimizing to get the best model. The optimal model was then validated on the test set. The predicted value of a given day could be obtained through the monitoring value of the 60 days before the that day. For example, to predict the deformation of tomorro, the actual monitoring data of today and the 59 days before today are required, and LSTM would give the predicted value of the next day daily. The new monitoring values obtained every day would be updated to the database to train the model.

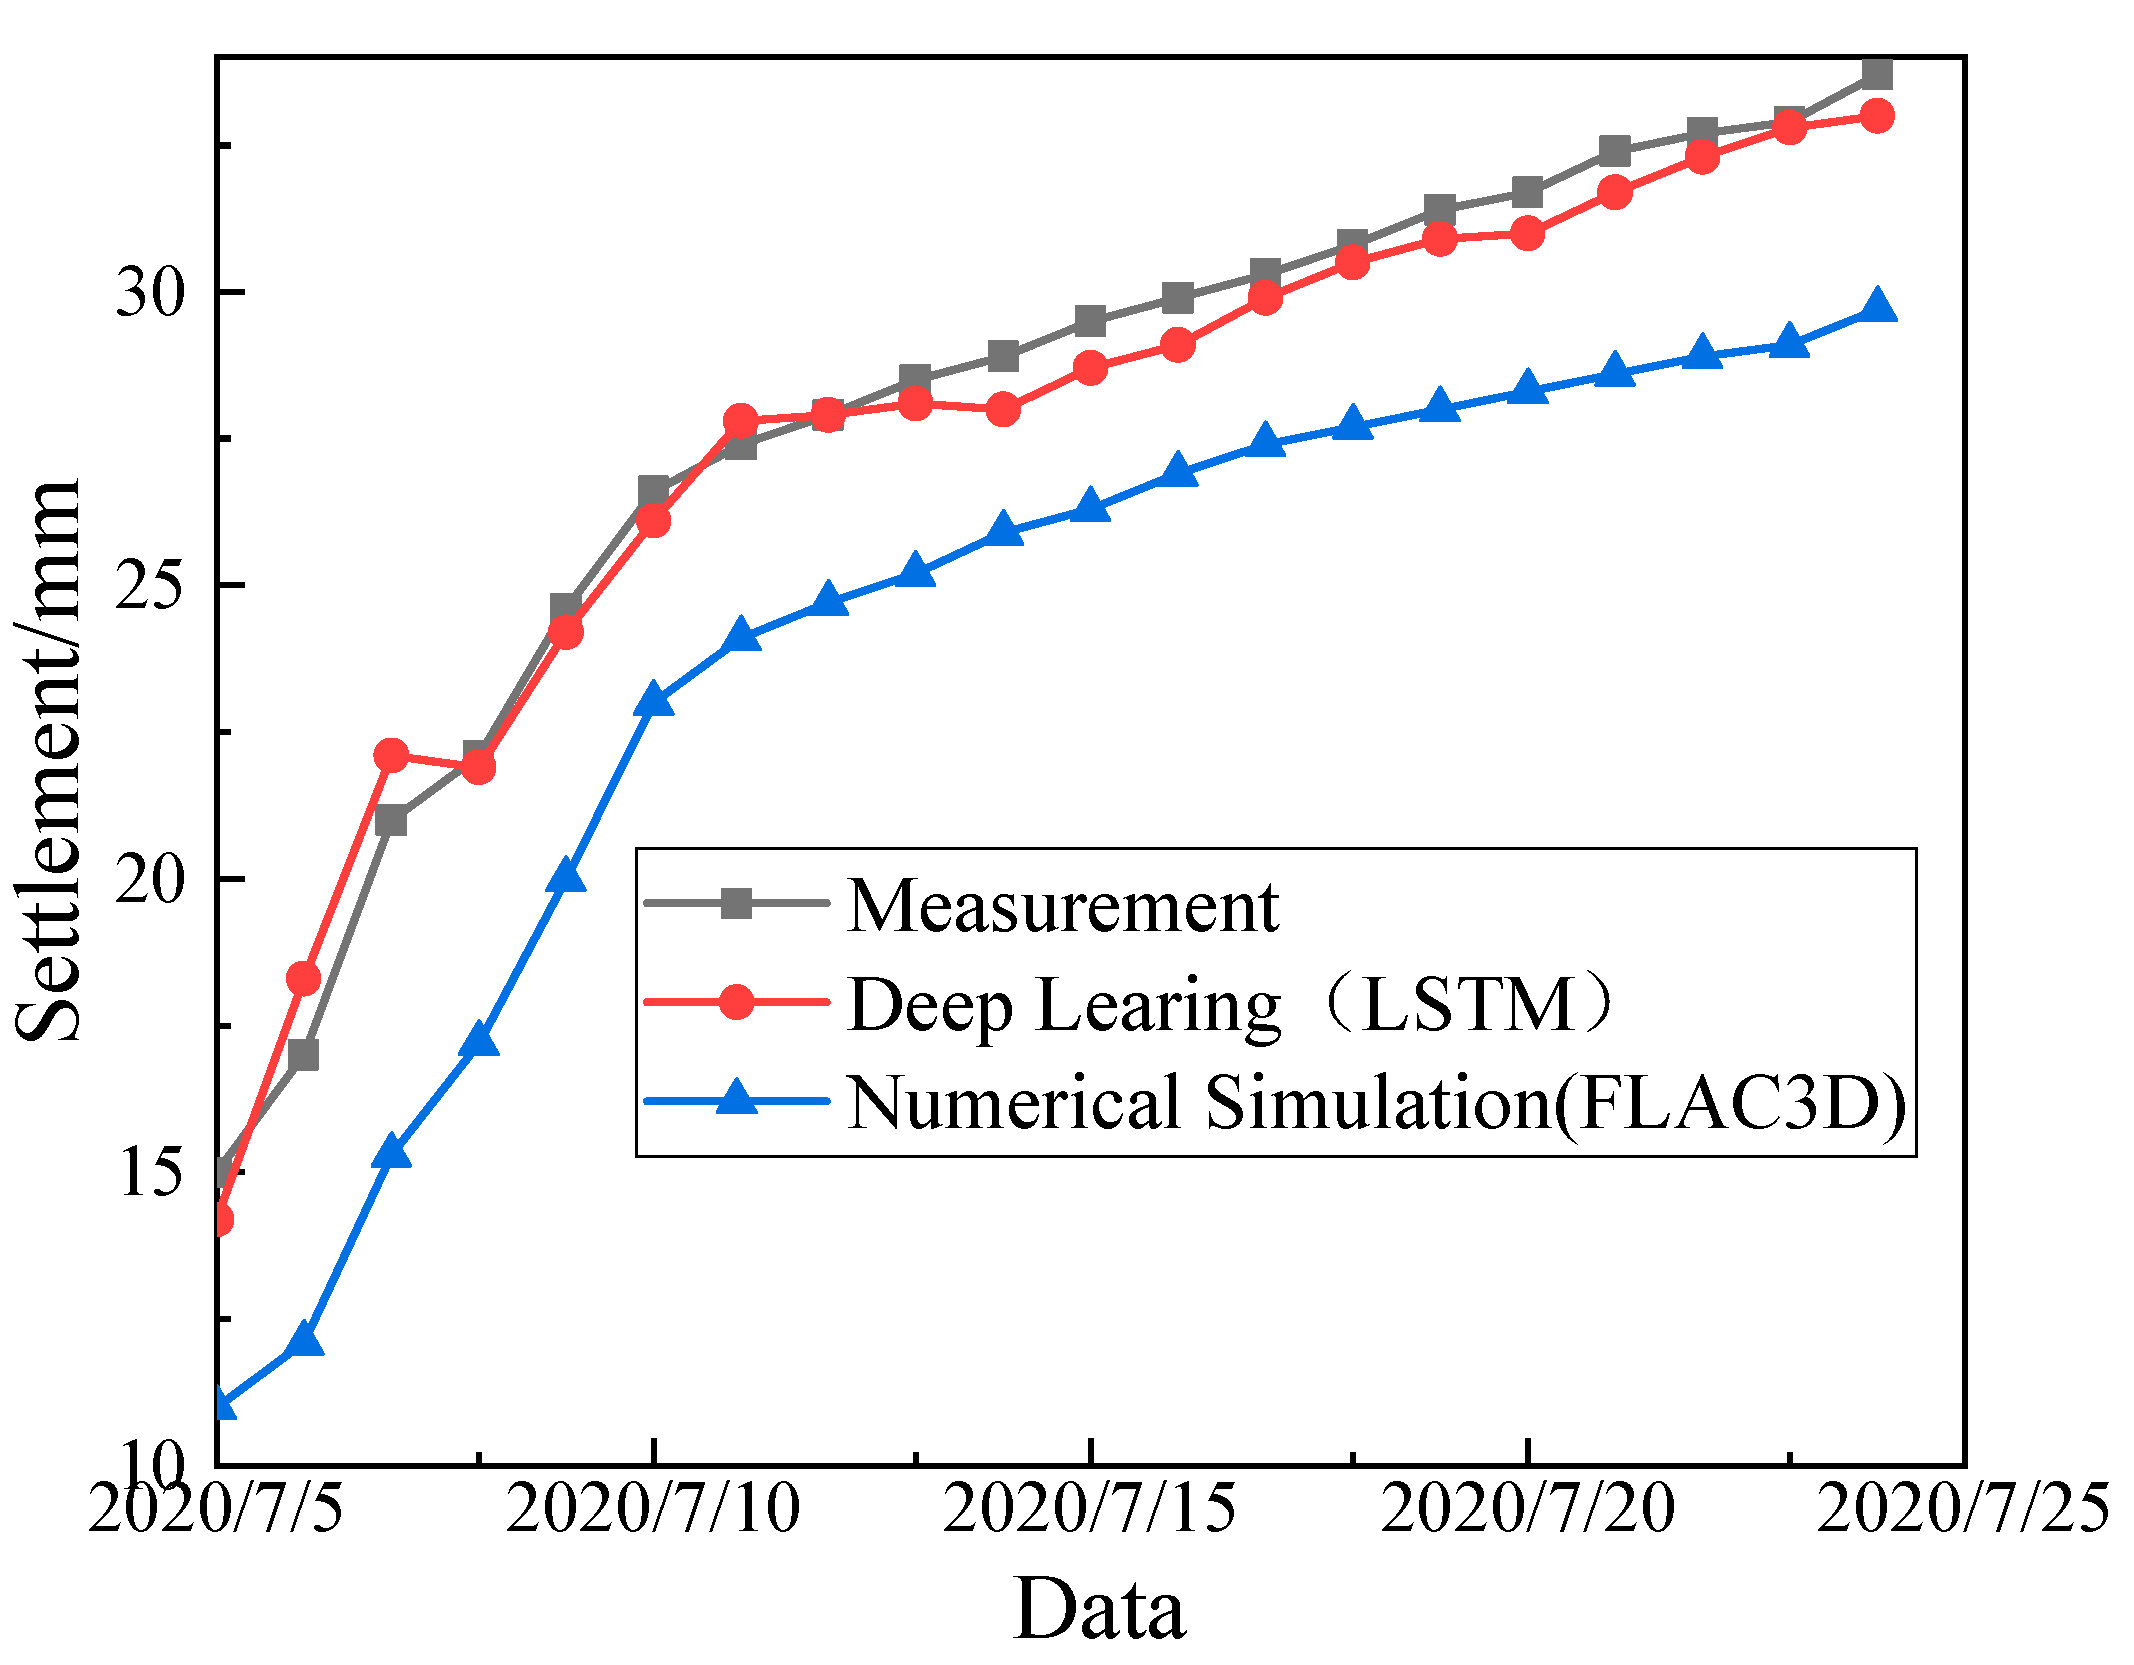
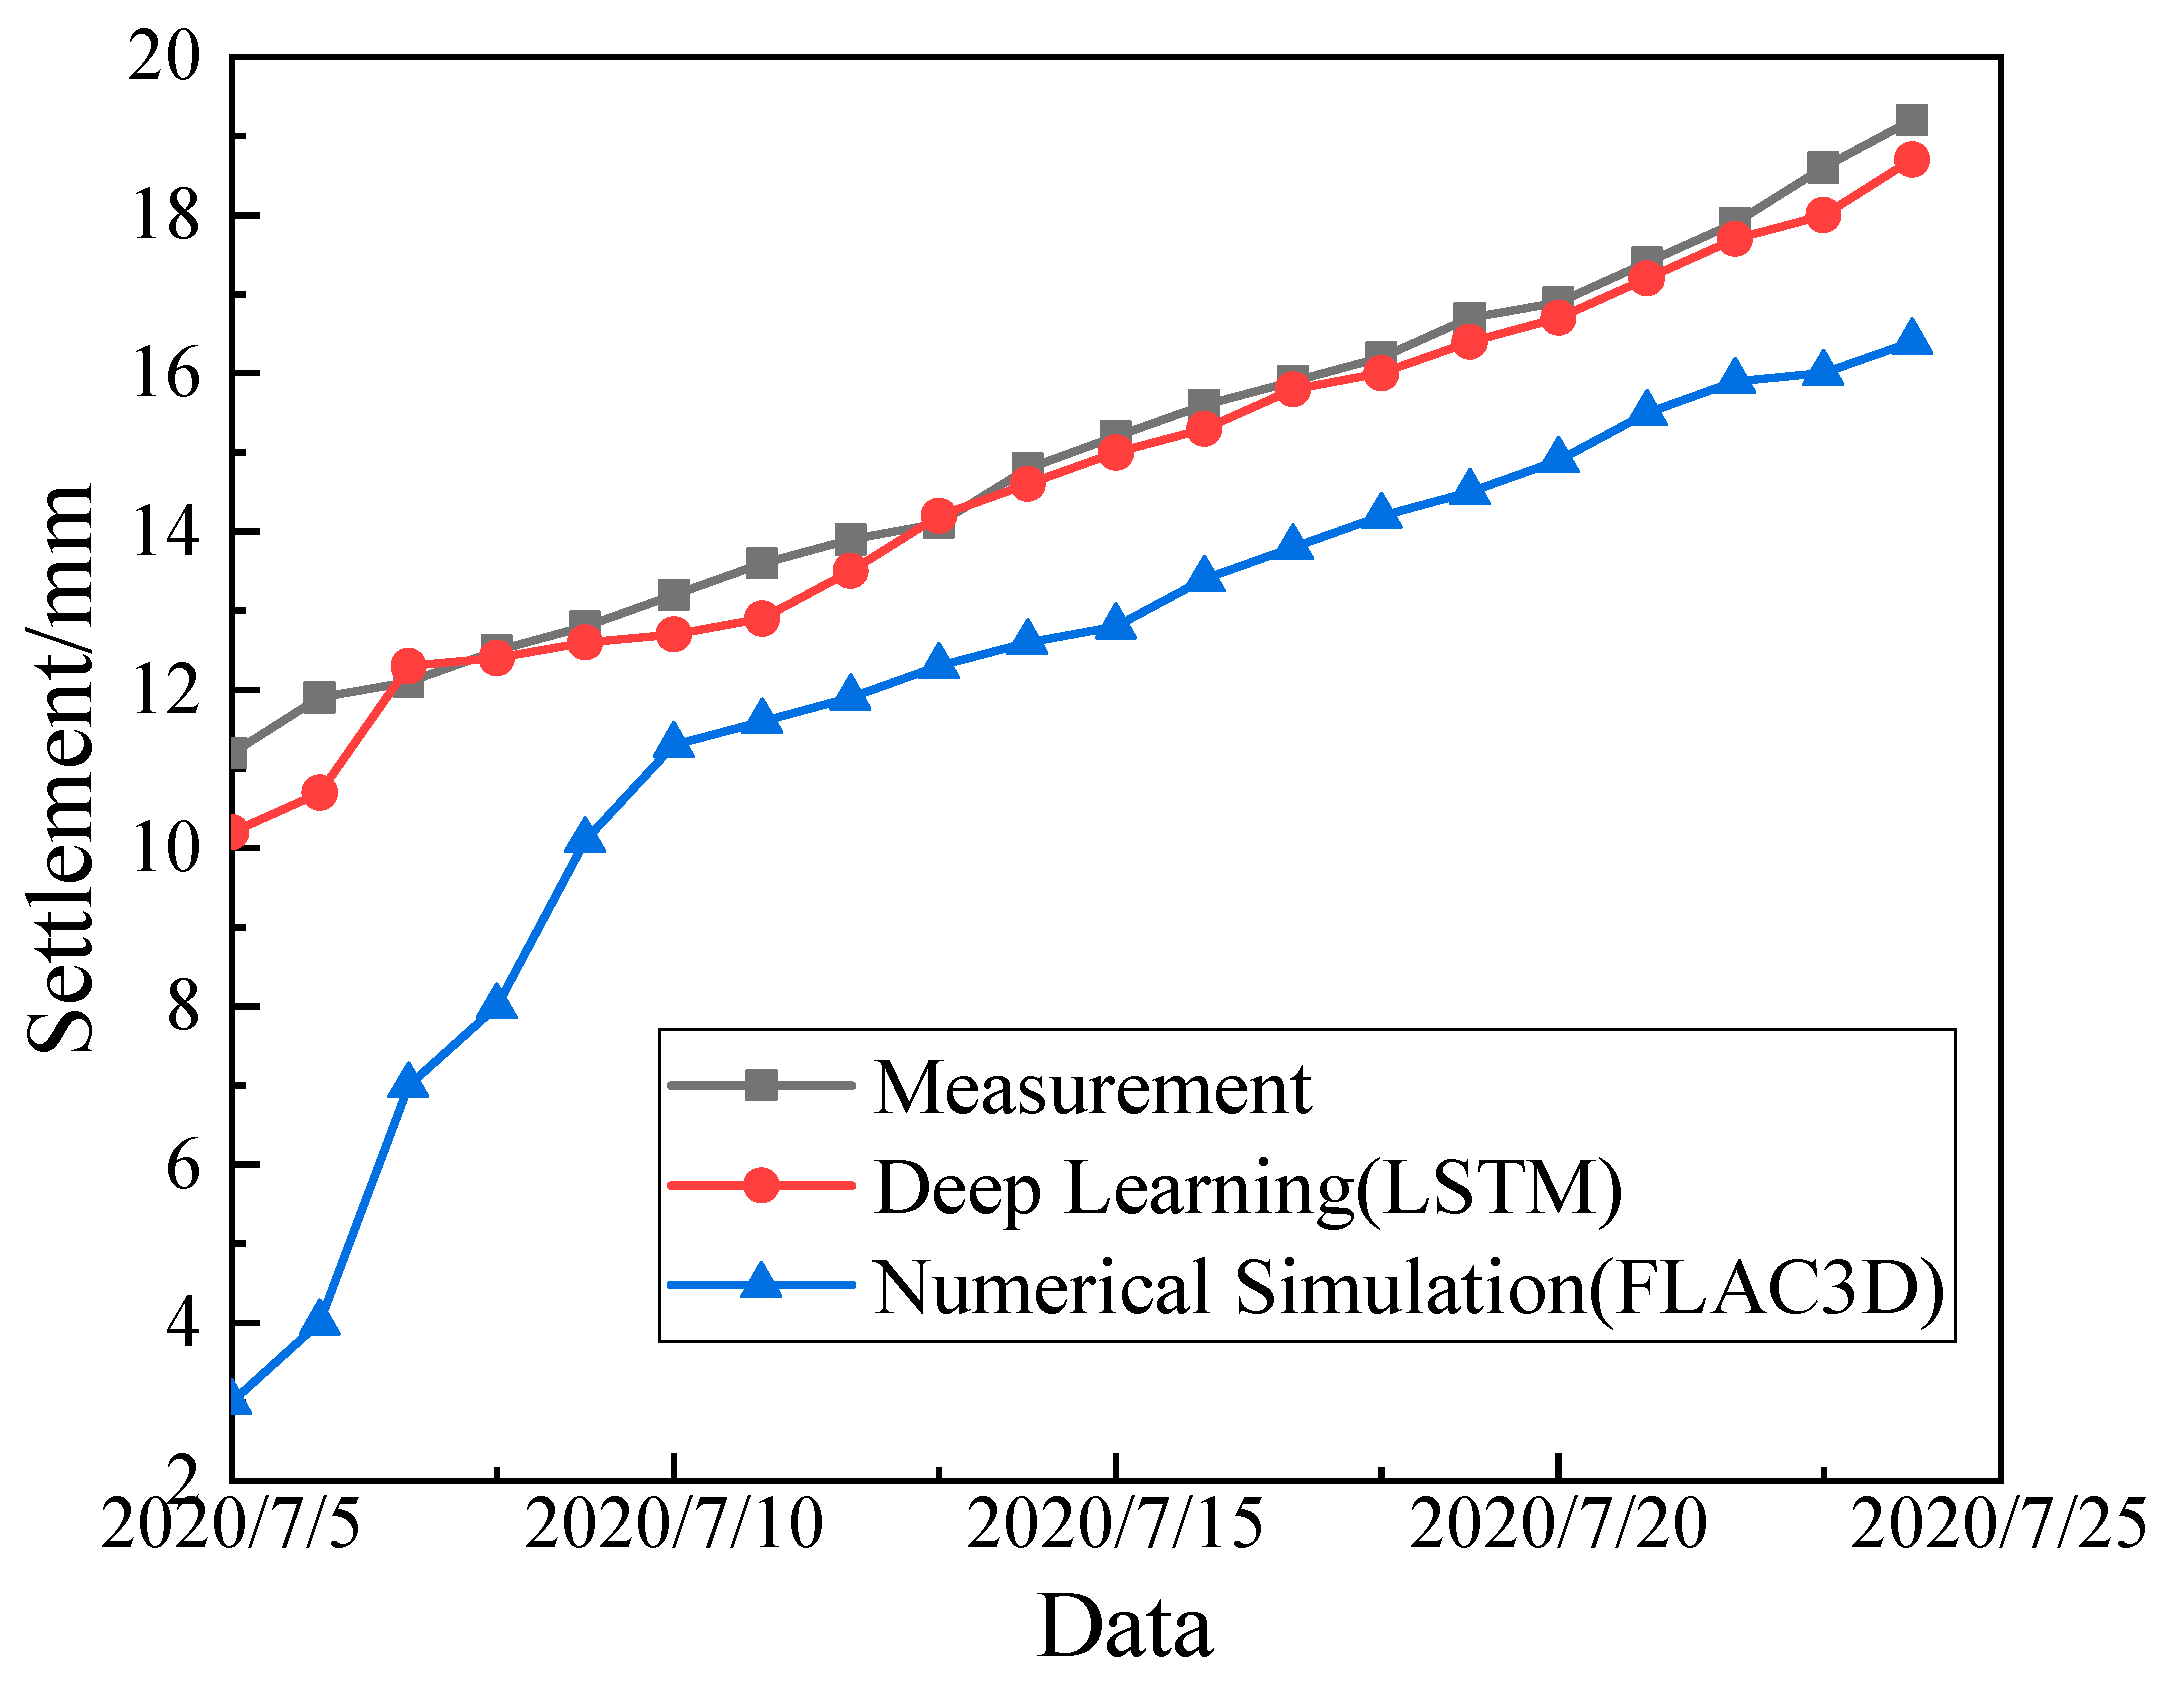
5.2.3. Result Analysis

As shown in Table 7, Table 8, Table 9 and Table 10, the values of MAE and RMSE were small, and R2 values were both greater than 90%, indicating that the model achieved better results on the training and test sets. The data set before 5 July 2020 was used for creating Table 7, Table 8, Table 9 and Table 10. Table 7, Table 8, Table 9 and Table 10 were used to verify the accuracy of the model. Those results correspond to the first day in the next figures. Then, the model was used to predict the values on the 5 July 2020, and the monitoring values on the 5 July 2020 would be updated to the database to train the model to predict the values on the next day.
To observe the prediction accuracy of the model more intuitively, 20 deep learning prediction data, numerical simulation data and actual measurement data were selected. As shown in Figure 14, Figure 15, Figure 16 and Figure 17, along with the excavation of the tunnel, the deformation at the monitoring point would gradually increase, and the numerical simulation value is smaller than the actual measurement data and deep learning prediction data. The main reason is that there are many assumptions and simplification processes in the numerical simulation, so there are many factors that may be neglected. Compared with the three curves, we found that the prediction curve based on the deep learning model had a higher similarity with the monitoring curve, because deep learning could better study the internal characteristics of data and then predict future changes. The results verify the effectiveness and utility of the deep learning model.

6. Conclusions

This study took a two-way four-lane highway tunnel as the research object, and this paper introduces the general situation and construction plan of the project in detail. Based on the construction plan, machine learning was used to predict the tunnel deformation. The main conclusions are as follows:
(1)
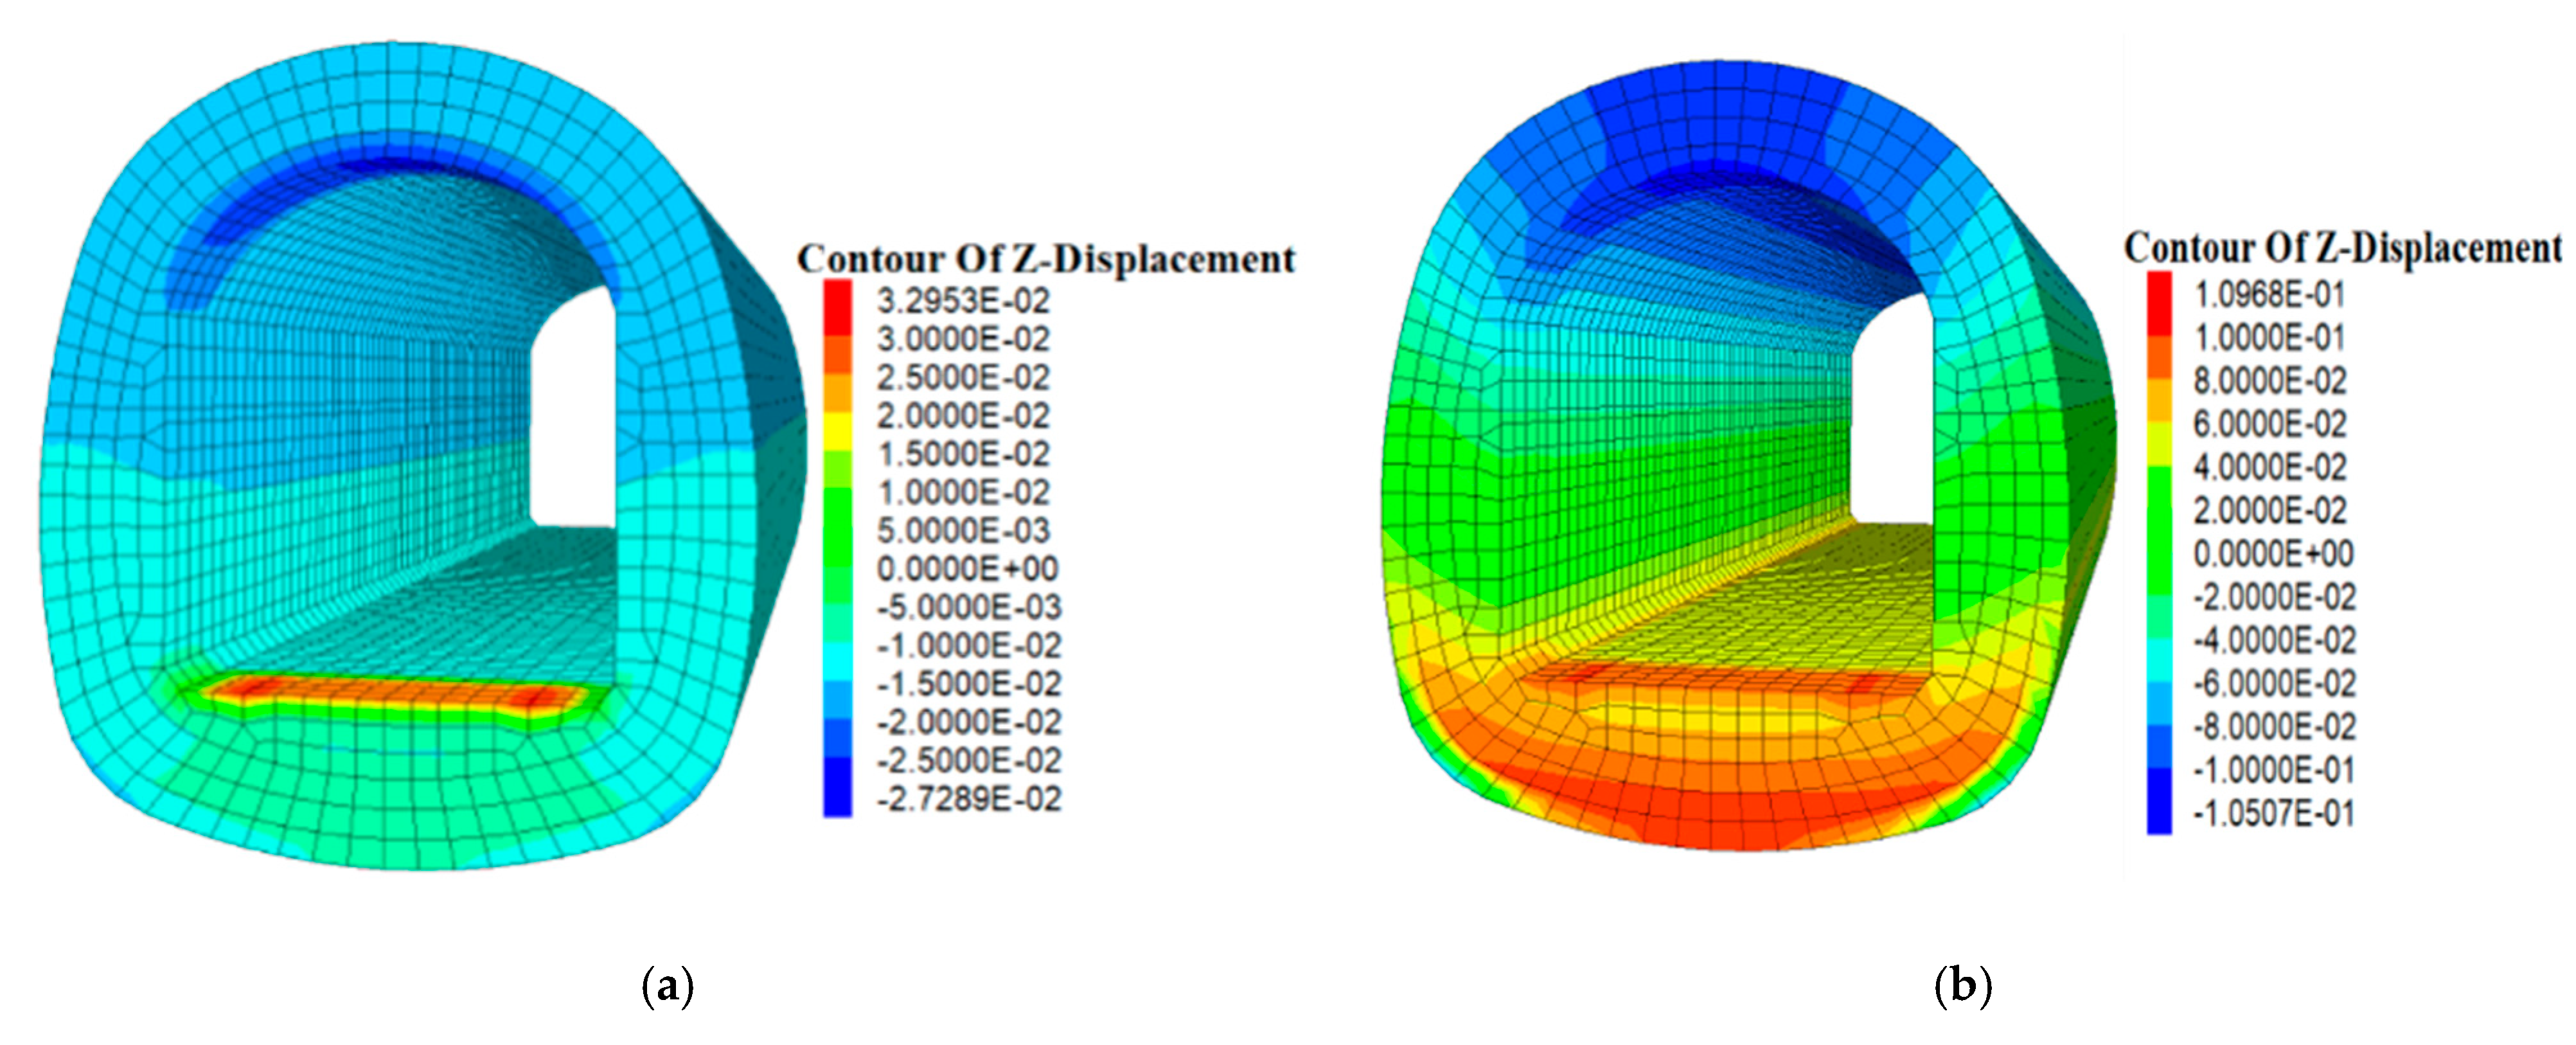
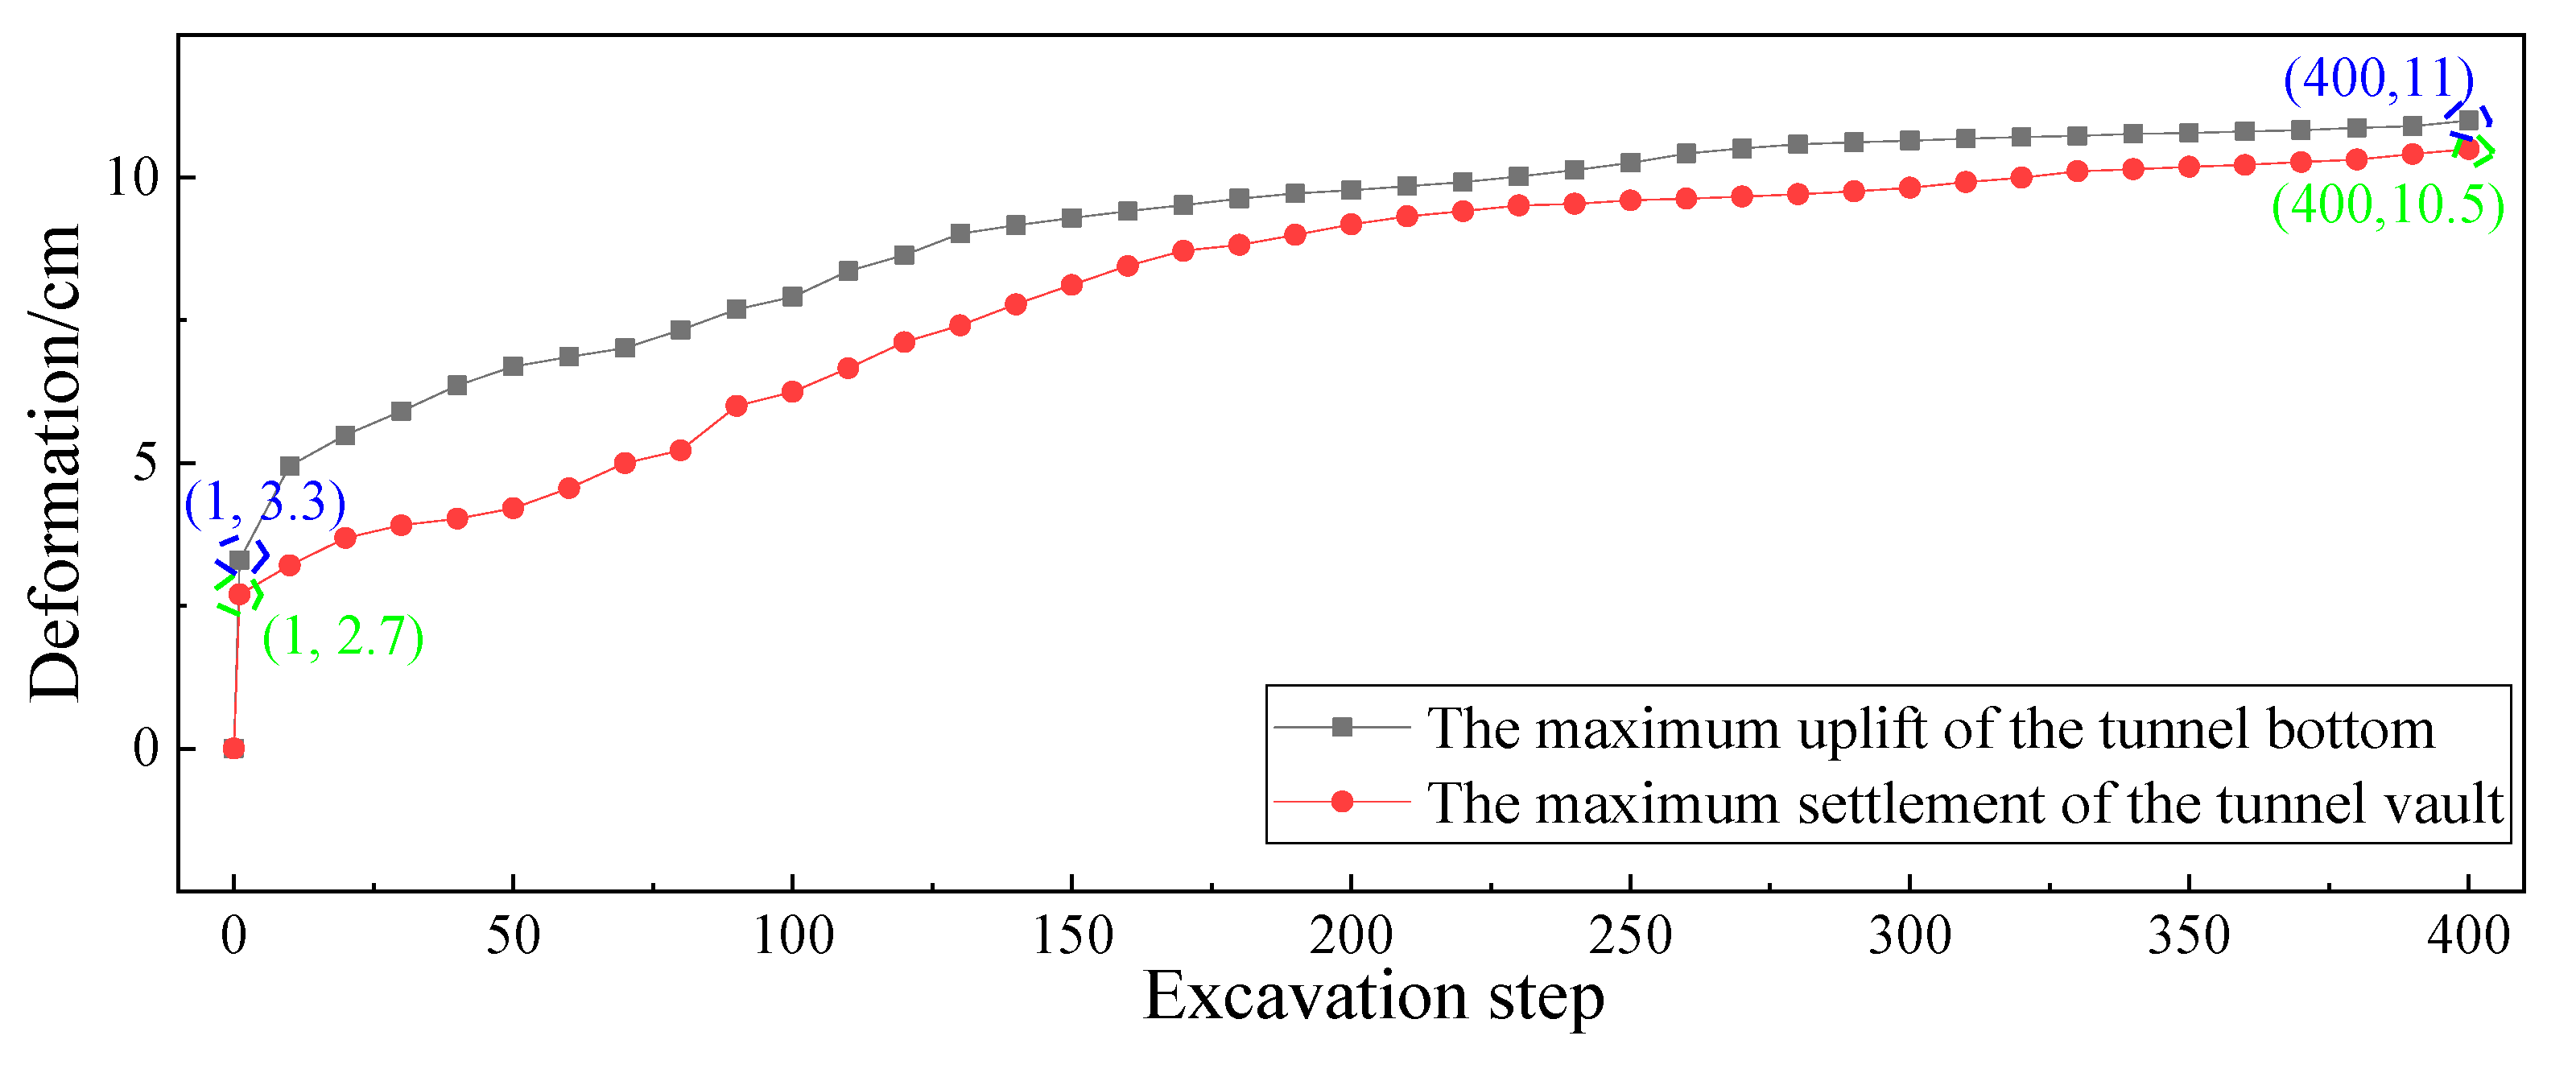
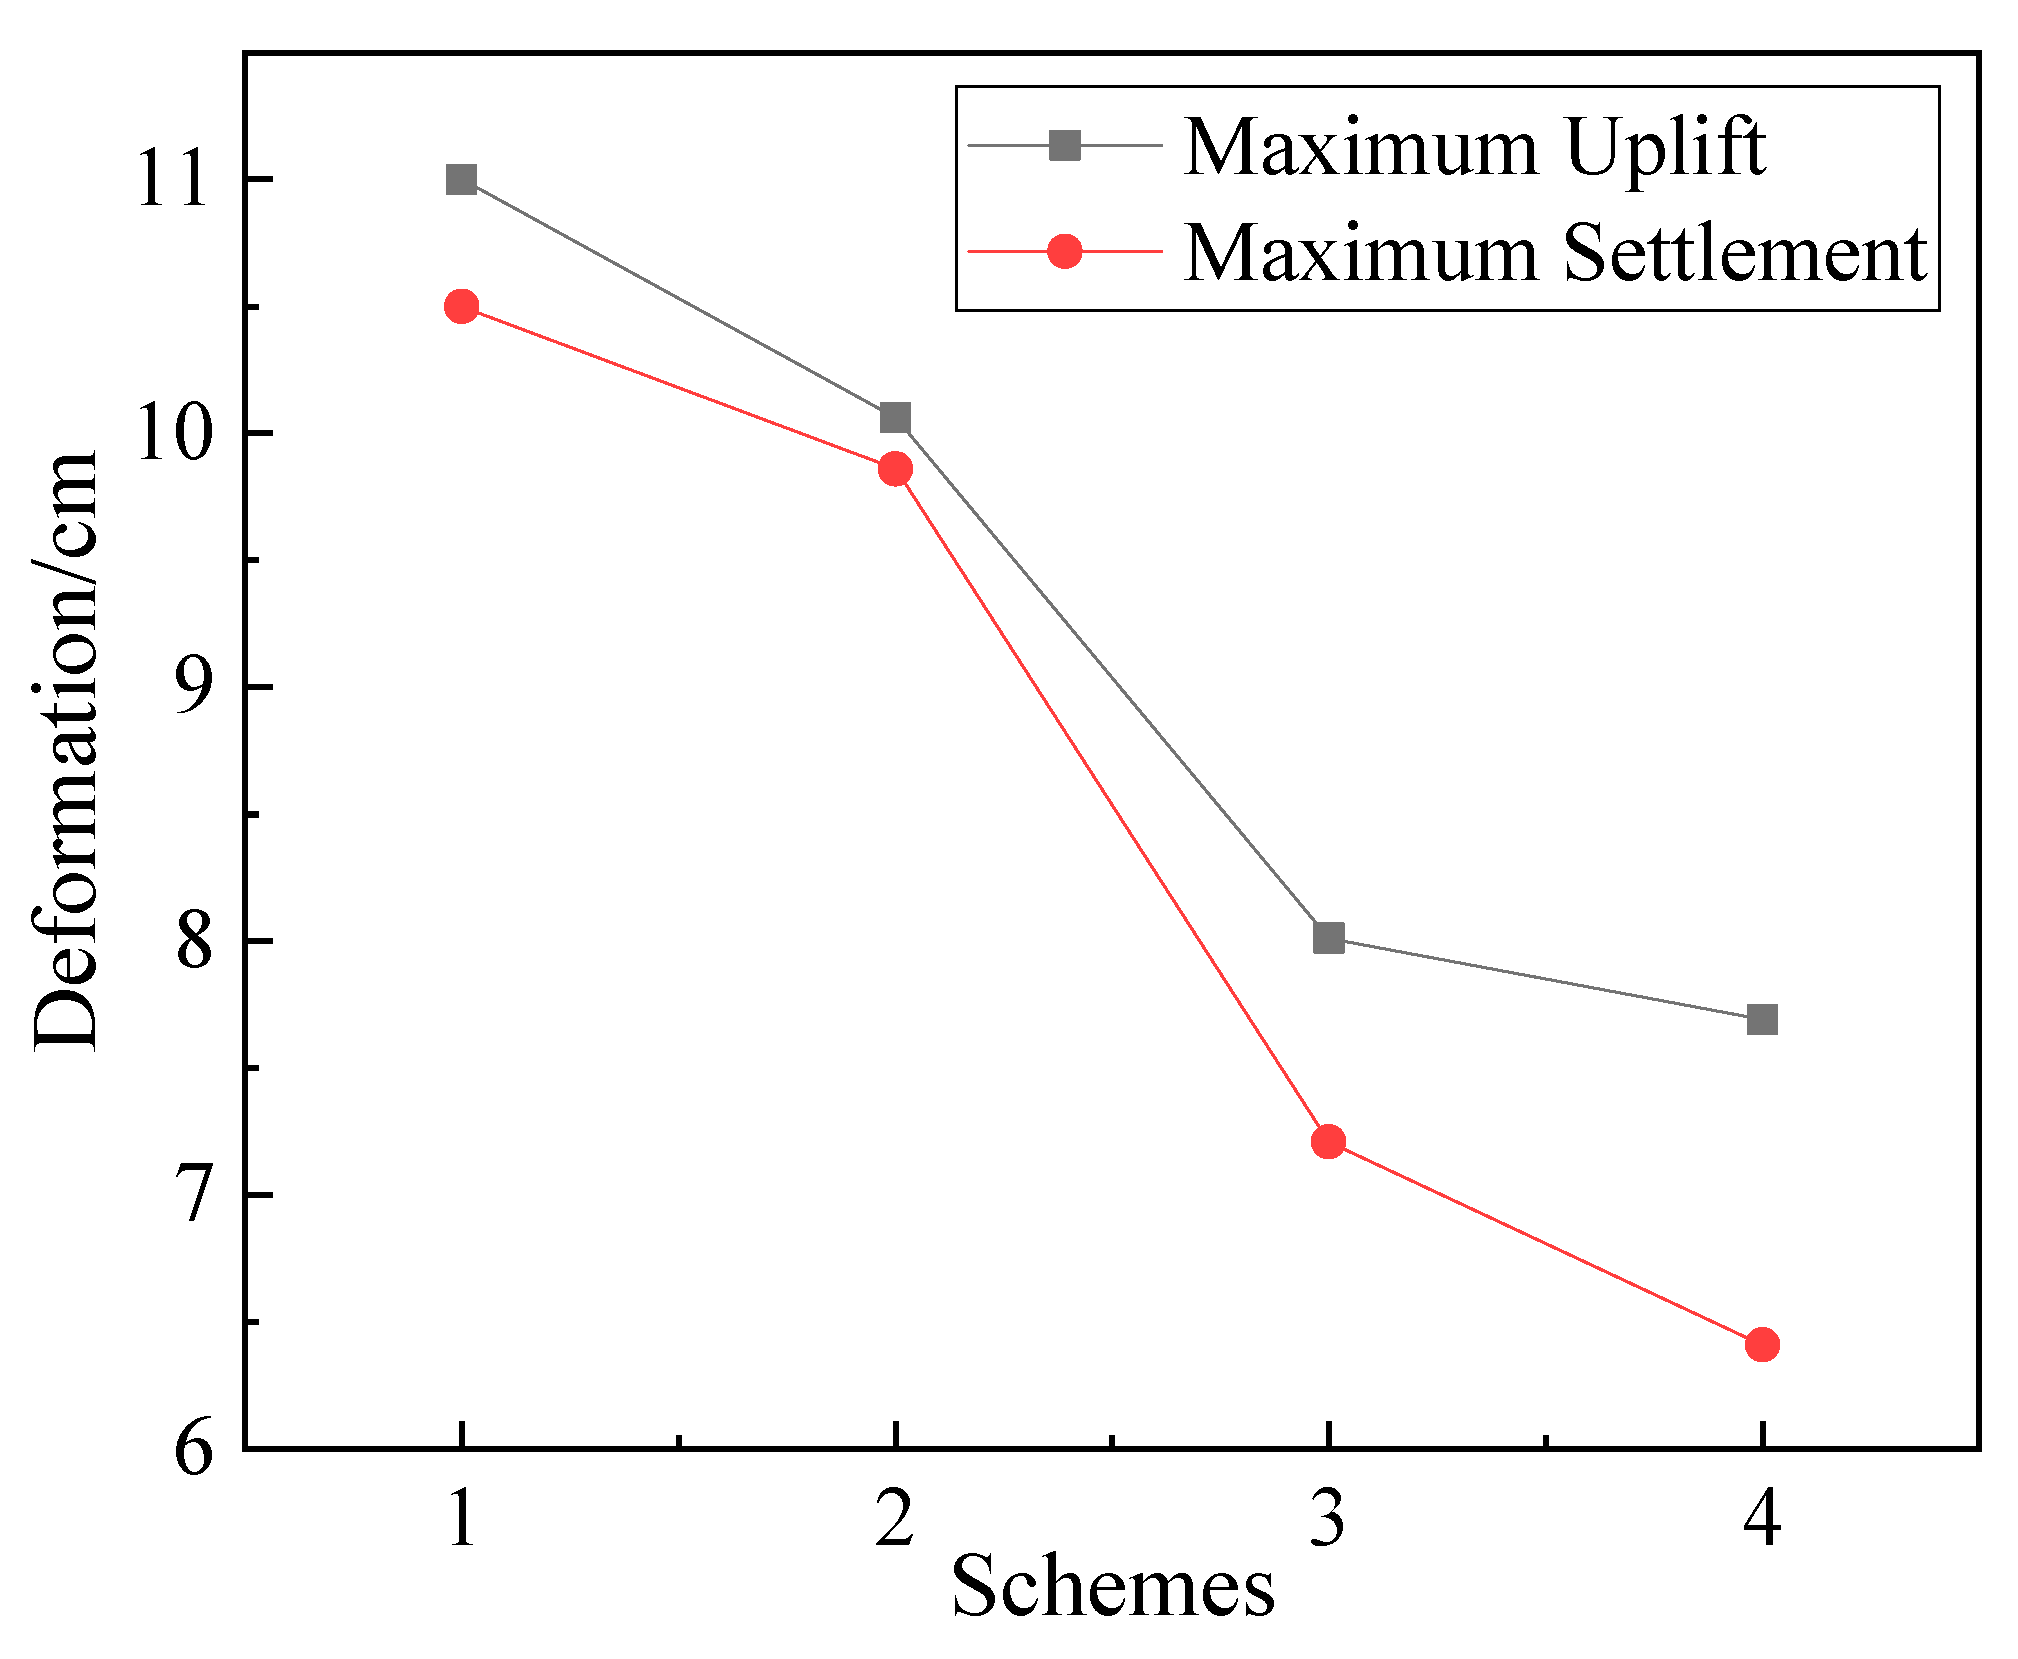
Through the FLAC3D numerical simulation, we found that along with the excavation of the tunnel, the settlement of the vault would gradually increase, and the maximum value would be located at the excavation hole. The new construction plan could effectively control the deformation of the tunnel and meet the specification requirements. Then, the parameters of the bolt were further optimized, and finally, the optimal parameters of the bolt were selected for construction.
(2)
The MIC algorithm was used to obtain the correlations of the parameters by studying the monitoring data. We found that the parameters correlated with tunnel deformation were rock uniaxial compressive strength, in situ stress, joint dip, rock temperature, joint spacing, confining pressure, and rock humidity, respectively, from high to low.
(3)
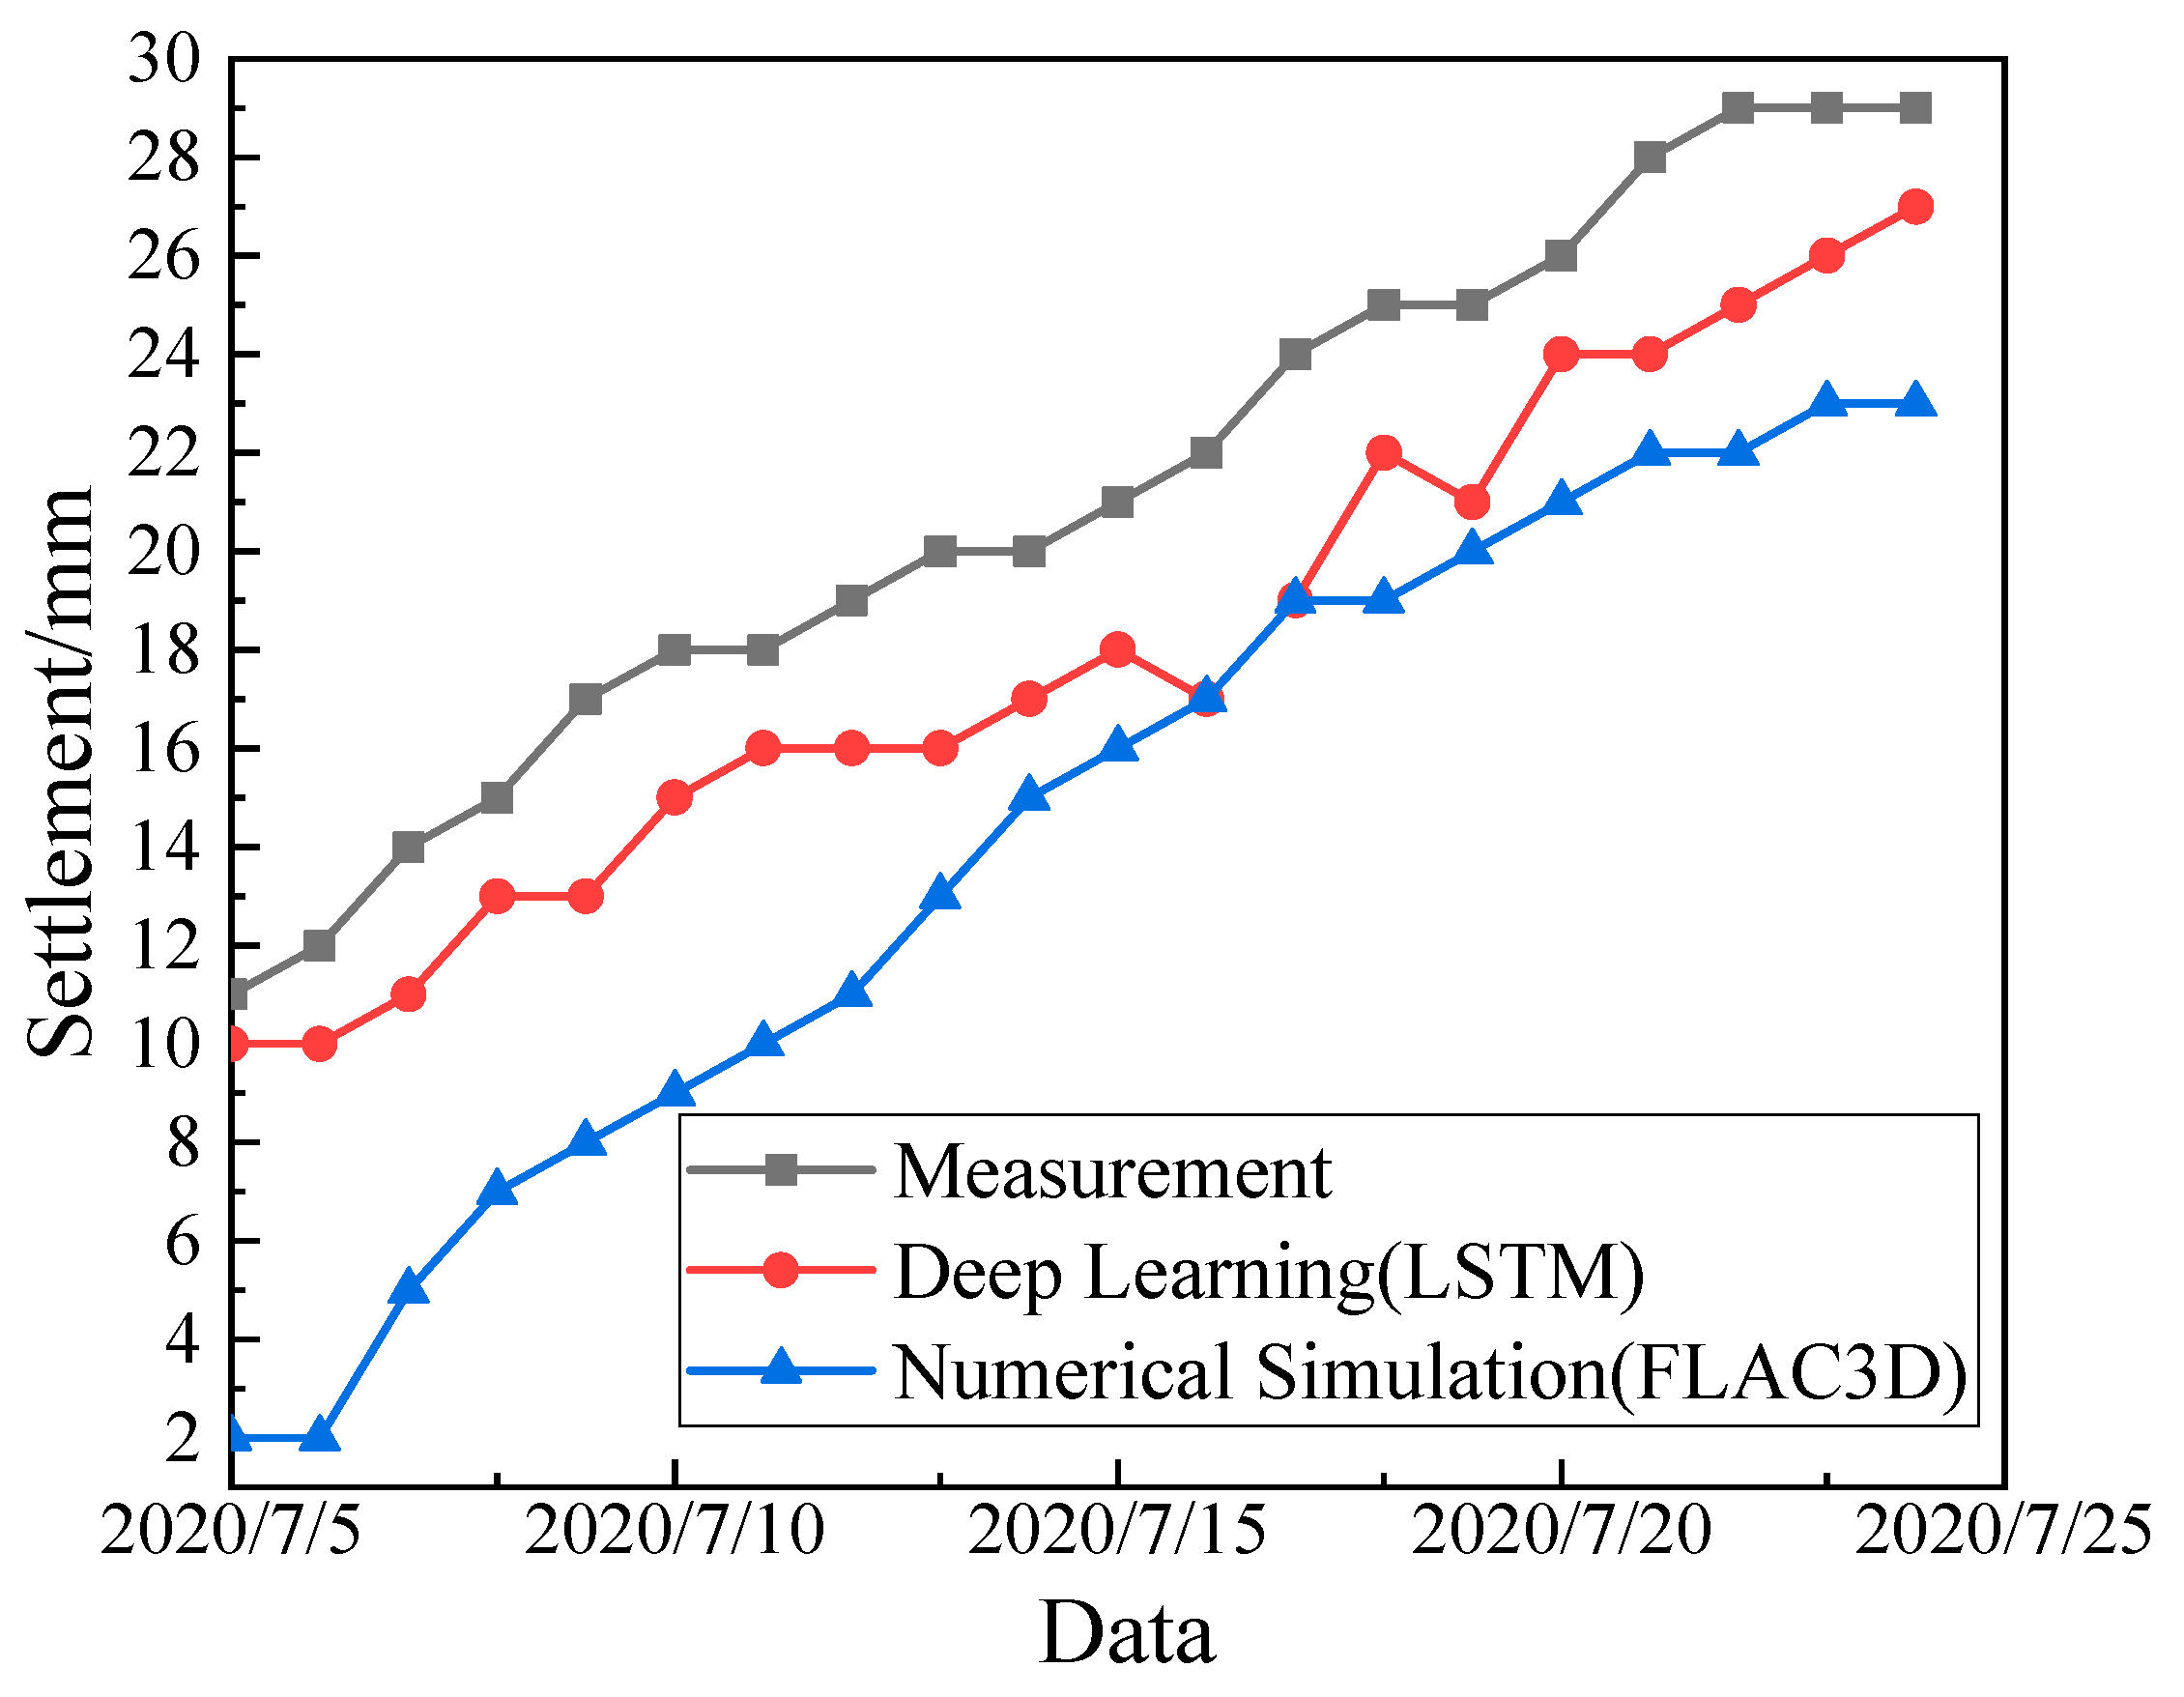
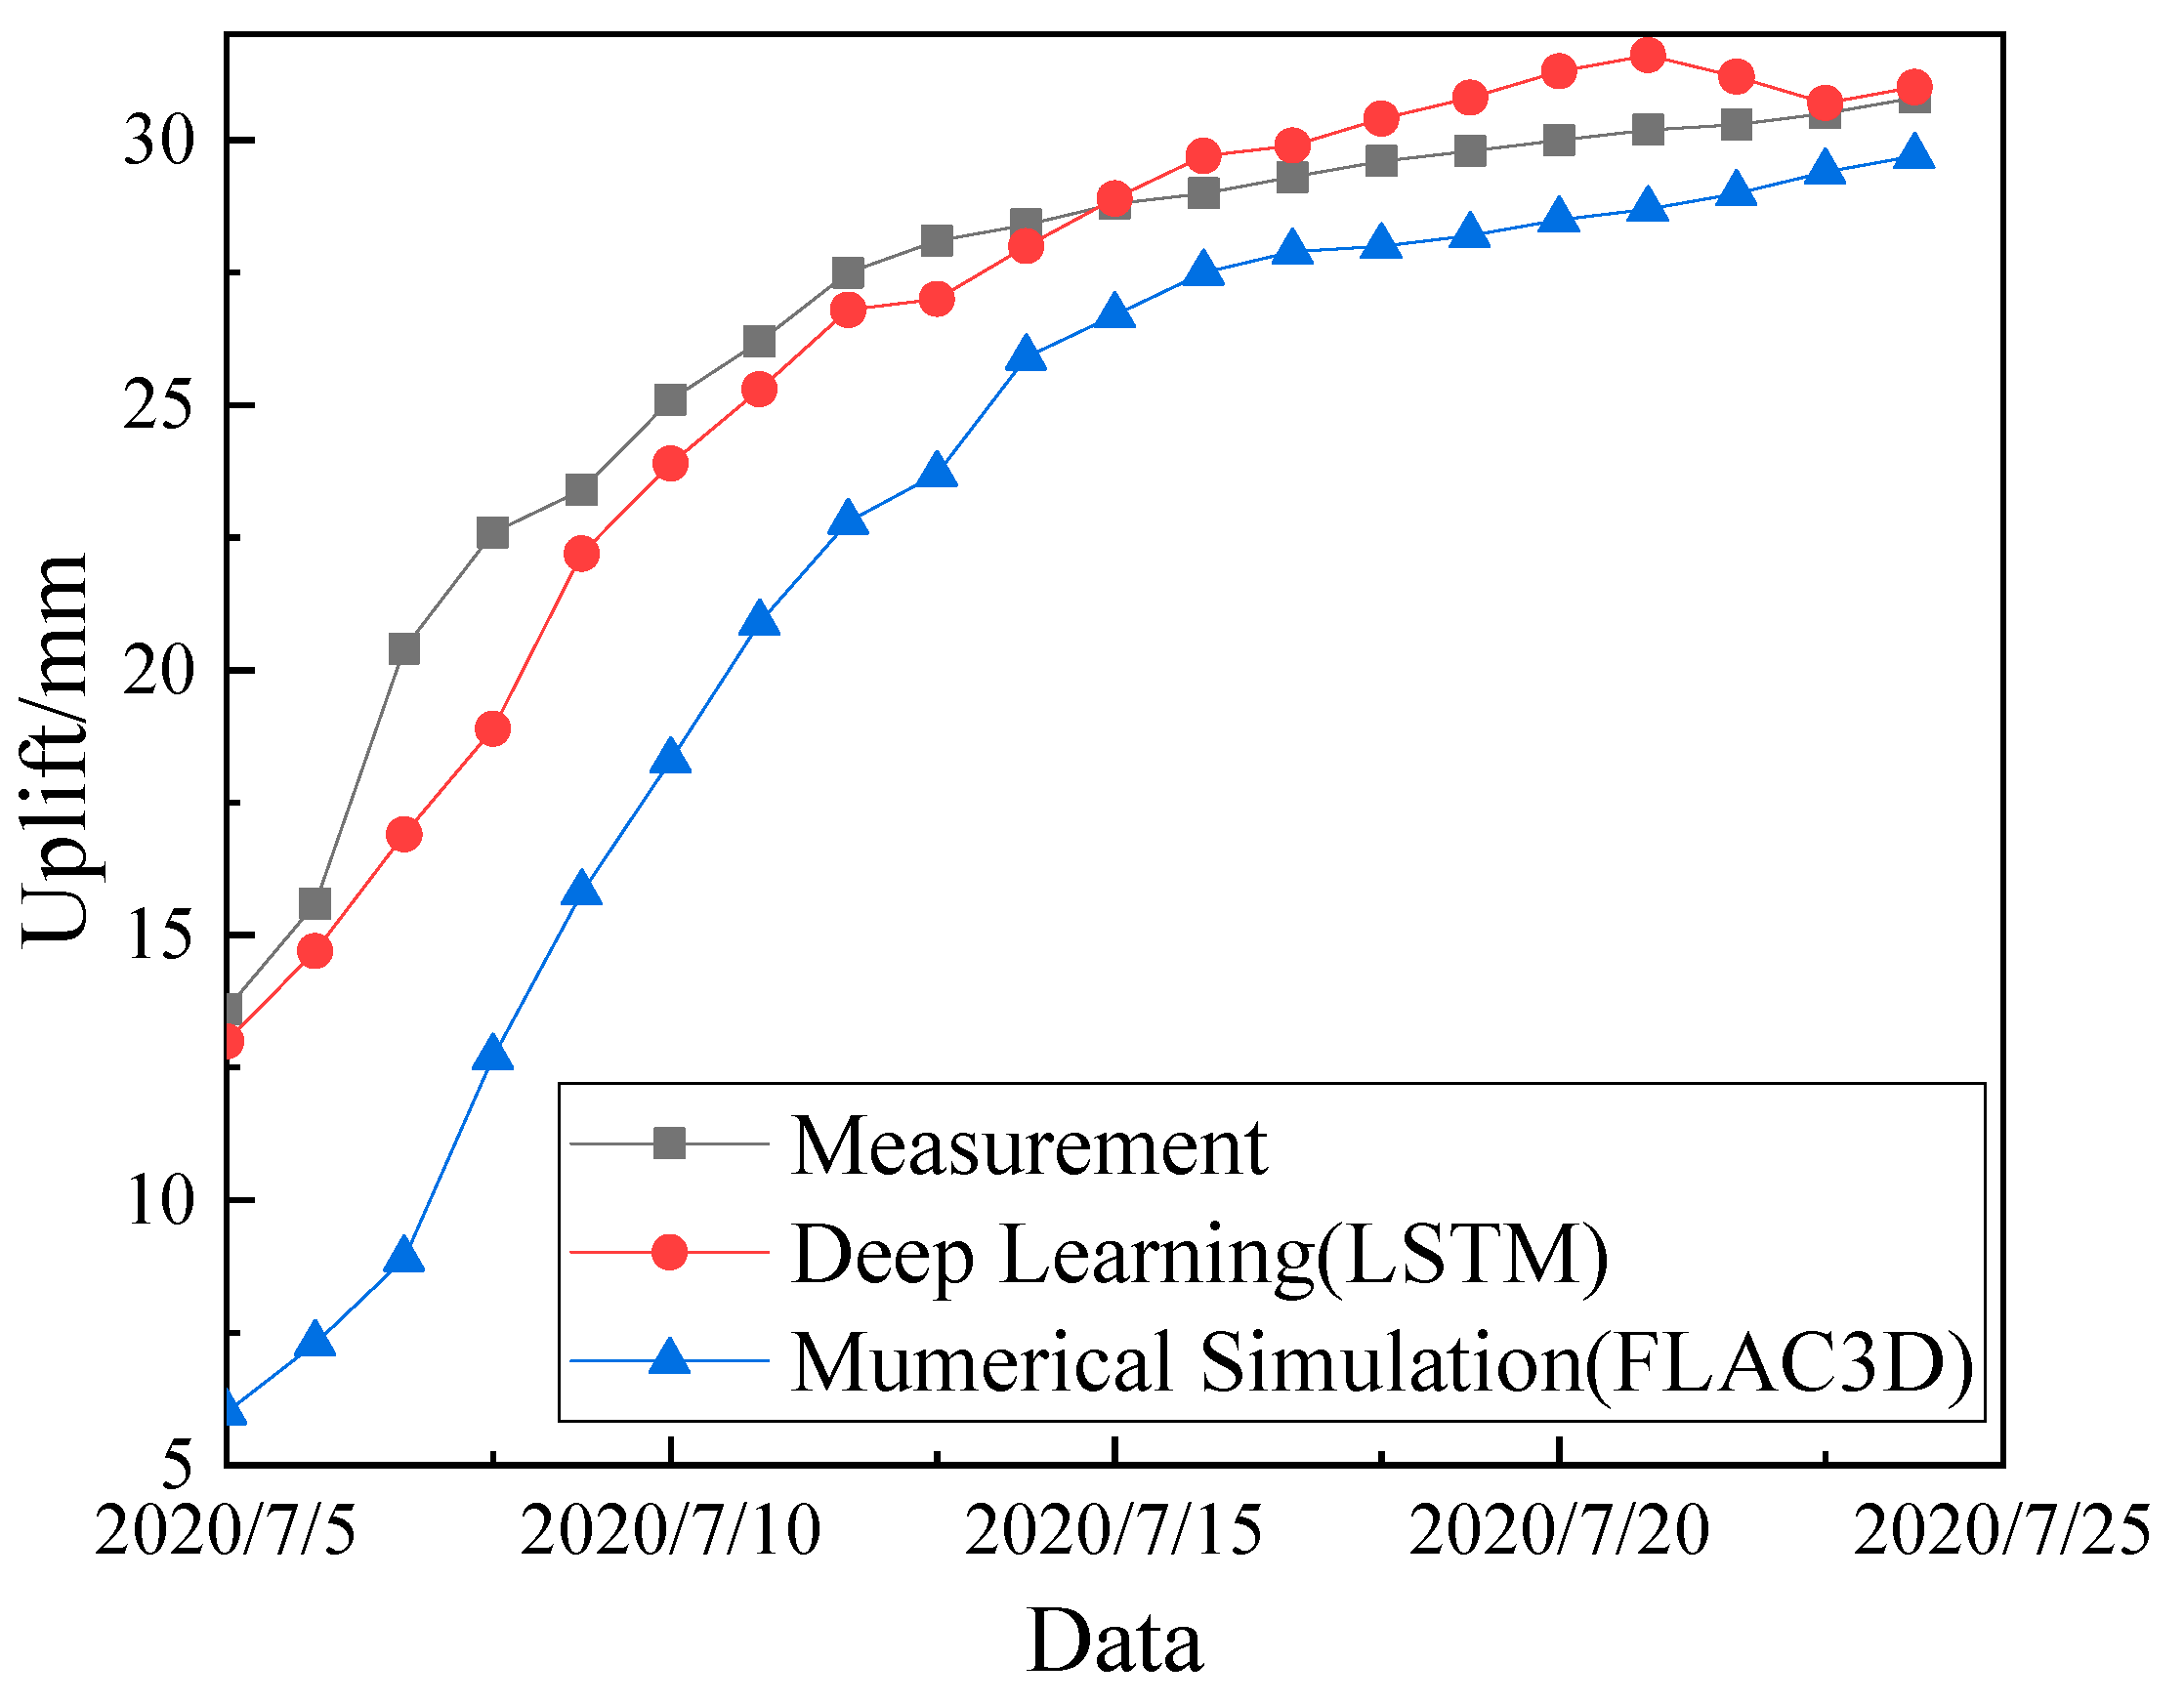
The LSTM algorithm was used to analyze the temporal characteristics of monitoring data. We found that the MAE and RMSE values of the prediction model were small, and the values of R2 were all greater than 90%, indicating that the model achieved good results on the training and test sets. The results show that the prediction curve based on the deep learning model had a higher similarity to the monitoring curve compared to the numerical analysis. The MIC-LSTM machine algorithm provides a new idea for the deformation prediction of the tunnels.

Author Contributions

Conceptualization, K.M. and L.-P.C.; methodology, K.M.; software, Q.F.; validation, X.-F.H., Q.F. and L.-P.C.; formal analysis, K.M.; investigation, L.-P.C.; resources, K.M.; data curation, Q.F.; writing—original draft preparation, K.M.; writing—review and editing, L.-P.C.; visualization, Q.F.; supervision, X.-F.H.; project administration, K.M.; funding acquisition, L.-P.C. All authors have read and agreed to the published version of the manuscript.

Funding

This research was funded by the Open Research Fund of the Engineering Research Center of the Ministry of Education of Bei-jing Jiaotong University Tunnel, Underground Engineering grant number [TUC2020-02] And the Science and Technology Program of Zhejiang Provincial Communications Department grant number [2019040].

Conflicts of Interest

The authors declare no conflict of interest.

References

  1. Chen, Z.Q.; He, C.; Xu, G.W. A Case Study on the Asymmetric Deformation Characteristics and Mechanical Behavior of Deep Buried Tunnel in Phyllite. Rock Mech. Rock Eng. 2019, 52, 4527–4545. [Google Scholar] [CrossRef]
  2. Chen, Z.Q.; He, C.; Xu, G.W. Supporting mechanism and mechanical behavior of a double primary support method for tunnels in broken phyllite under high geo-stress: A case study. Bull. Eng. Geol. Environ. 2019, 78, 5253–5267. [Google Scholar] [CrossRef]
  3. Zhang, C.; Feng, X.T.; Zhou, H. Estimation of in situ stress along deep tunnels buried in complex geological conditions. Int. J. Rock Mech. Min. Sci. 2012, 52, 139–162. [Google Scholar] [CrossRef]
  4. Meng, L.B.; Li, T.B.; Jiang, Y.; Wang, R.; Li, Y.R. Characteristics and mechanics of large deformation in the Zhegu mountain tunnel on the Sichuan-Tibet highway. Tunn. Undergr. Space Technol. 2013, 37, 157–164. [Google Scholar] [CrossRef]
  5. Bobet, A. Lined circular tunnels in elastic transversely anisotropic rock at depth. Rock Mech. Rock Eng. 2011, 44, 149–167. [Google Scholar] [CrossRef]
  6. Cao, C.Y.; Shi, C.H.; Lei, M.F. Squeezing failure of tunnels: A case study. Tunn. Undergr. Space Technol. 2018, 77, 188–203. [Google Scholar] [CrossRef]
  7. Wang, Y. Study on the Initial Support’s Mechanical Effects of Soft Rock Tunnel under High Geo-Stress; Chongqing University: Chongqing, China, 2013. [Google Scholar]
  8. Xu, F.; Li, S.C.; Zhang, Q.Q. A new type support structure introduction and its contrast study with traditional support structure used in tunnel construction. Tunn. Undergr. Space Technol. 2017, 63, 171–182. [Google Scholar] [CrossRef]
  9. Yin, L.Z.; Yang, W. Topology optimization for tunnel support in layered geological structures. Int. J. Numer. Methods Eng. 2015, 47, 1983–1996. [Google Scholar] [CrossRef]
  10. Hoek, E.; Paul Marinos, P. Predicting tunnel squeezing problems in weak heterogeneous rock masses. Tunn. Tunn. Int. 2000, 32, 45–51. [Google Scholar]
  11. Jethwa, J.L.; Singh, B.; Singh, B. Estimation of ultimate rock pressure for tunnel linings under squeezing rock conditions—A new approach. In Design and Performance of Underground Excavations; ISRM Symposium: Cambridge, UK, 1984. [Google Scholar]
  12. Wood, A.M.M. Tunnels for roads and motorways. Q. J. Eng. Geol. 1972, 5, 111–126. [Google Scholar] [CrossRef]
  13. Saari, K. Analysis of Plastic Deformation (Squeezing) of Layers Intersecting Tunnels and Shafts in Rock [Dissertation]; Berkeley University of California: Berkeley, CA, USA, 1982. [Google Scholar]
  14. Aydan, Ö.; Akagi, T.; Kawamoto, T. The squeezing potential of rocks around tunnels: Theory and prediction. Rock Mech. Rock Eng. 1993, 26, 137–163. [Google Scholar] [CrossRef]
  15. Hoek, E. Big Tunnels in Bad Rock. J. Geotech. Geoenviron. Eng. 2001, 127, 726–740. [Google Scholar] [CrossRef]
  16. Barla, G.B. Design analyses for tunnels in squeezing rock//International Conference of Iacmag. In Proceedings of the 11th International Conference of IACMAG, Torino, Italy, 19–24 June 2005. [Google Scholar]
  17. Hu, P.; Song, L.; Zhang, H. Baima Tunnel Soft Rock Large Deformation Mechanism and Evaluation of Deformation Control Effect of Long Bolt. Mod. Tunn. Technol. 2019, 56, 239–246. [Google Scholar]
  18. Li, L.; Tan, Z.S.; Yu, Y. Experimental study on primary lining form of tunnels in phyllite on Chengdu-Lanzhou railway. China Civ. Eng. J. 2017, 50, 19. [Google Scholar]
  19. Jia, J.Q.; Zheng, W.F.; Chen, G.Z. Numerical analysis of prestressed bolt flexible retaining method. Chin. J. Rock Mech. Eng. 2005, 24, 3798–3982. [Google Scholar]
  20. Li, J.; Yian, T.; Liu, Q. Study on Excavation Disturbance Characteristics of High Ground Stress Soft Rock Tunnels. IOP Conf. Series Earth Environ. Sci. 2020, 455, 012172. [Google Scholar] [CrossRef]
  21. Liu, W.; Zhao, Y.; Shi, P.X. Face stability analysis of shield driven tunnels shallowly buried in dry sand using 1 g large-scale model tests. Acta Geotech. 2018, 13, 693–705. [Google Scholar] [CrossRef]
  22. Liu, W.; Wu, B.; Shi, P.X.; Xu, X.Y. Analysis on face stability of rectangular cross-sectional shield tunneling based on an improved two-dimensional rotational mechanism. Acta Geotech. 2021, 16, 3725–3738. [Google Scholar] [CrossRef]
  23. Chen, R.P.; Tang, L.J.; Yin, X.S.; Chen, Y.M.; Bian, X.C. An improved 3D wedge-prism model for the face stability analysis of the shield tunnel in cohesionless soils. Acta Geotech. 2015, 10, 683–692. [Google Scholar] [CrossRef]
  24. Idinger, G.; Aklik, P.; Wu, W.; Borja, R. Centrifuge model test on the face stability of shallow tunnel. Acta Geotech. 2011, 6, 105–117. [Google Scholar] [CrossRef] [Green Version]
  25. Lv, X.L.; Zeng, S.; Zhao, Y.; Huang, M.; Zhang, Z. Physical model tests and discrete element simulation of shield tunnel face stability in anisotropic granular media. Acta Geotech. 2020, 15, 3017–3026. [Google Scholar]
  26. Zhang, J.W.; Zhao, C.L.; Ma, X.J. Mechanism and Control Technology Study of Large Deformation for Soft Rock Tunnel. Electron. J. Geotech. Eng. 2014, 19, 2643–2656. [Google Scholar]
  27. Pan., F.; Cheng, S.G.; Pan., F.; Cheng, S.G. Analysis of Deformation Mechanism and Control Technology of Soft Rock Tunnel with High Geostress. Appl. Mech. Mater. 2014, 638-640, 794–797. [Google Scholar] [CrossRef]
  28. Tao, Z.G.; Zhao, F.; Wang, H.J.; Zhang, H.J.; Peng, Y.Y. Innovative constant resistance large deformation bolt for rock support in high stressed rock mass. Arab. J. Geosci. 2017, 10, 341–355. [Google Scholar]
  29. Anagnostou, G. A model for swelling rock in tunnelling. Rock Mech. Rock Eng. 1993, 26, 307–331. [Google Scholar] [CrossRef]
  30. Zhou, M.Z.; Fang, Q.; Peng, C. A mortar segment-to-segment contact method for stabilized total-Lagrangian smoothed particle hydrodynamics. Appl. Math. Model. 2022, in press. [CrossRef]
  31. Jin, Y.F.; Yin, Z.Y. An intelligent multiobjective EPR technique with multistep model selection for correlations of soil properties. Acta Geotech. 2020, 15, 2053–2073. [Google Scholar] [CrossRef]
  32. Atangana Njock, P.G.; Shen, S.L.; Zhou, A.; Lyu, H.M. Evaluation of soil liquefaction using AI technology incorporating a couples ENN/t-SNE model. Soil Dyn. Earthq. Eng. 2020, 130, 105988. [Google Scholar] [CrossRef]
  33. Elbaz, K.; Shen, S.-L.; Sun, W.-J.; Yin, Z.-Y.; Zhou, A. Prediction model of shield performance during tunneling by incorporating improved Particle Swarm Optimization into ANFIS. IEEE Access 2020, 8, 39659–39671. [Google Scholar] [CrossRef]
  34. Jin, Y.F.; Yin, Z.Y.; Zhou, W.H.; Liu, X.F. Intelligent model selection with updating parameters during staged excavation using optimization method. Acta Geotech. 2020, 15, 2473–2491. [Google Scholar] [CrossRef]
  35. Zhang, P.; Wu, H.N.; Chen, R.P.; Dai, T.; Meng, F.Y.; Wang, H.B. A critical evaluation of machine learning and deep learning in shield-ground interaction prediction. Tunn. Undergr. Space Technol. 2020, 99, 103383. [Google Scholar] [CrossRef]
  36. Zhu, H.H.; Wang, X.; Chen, X.Q.; Zhang, L.L. Similarity search and performance prediction of shield tunnels in operation through time series data mining. Autom. Constr. 2020, 114, 103178. [Google Scholar] [CrossRef]
  37. Lin, S.-S.; Shen, S.L.; Zhang, N.; Zhou, A. Modelling the performance of EPB shield tunnelling using machine and deep learning algorithms. Geosci. Front. 2021, 12, 101177. [Google Scholar] [CrossRef]
  38. Elbaz, K.E.A. Performance Prediction of Tunnel Boring Machine by Using Machine Learning Techniques; Shanghai Jiao Tong University: Shanghai, China, 2019. [Google Scholar]
  39. Zhou, C.; Xu, H.; Ding, L.; Wei, L.; Zhou, Y. Dynamic prediction for attitude and position in shield tunneling: A deep learning method. Autom. Constr. 2019, 105, 102840. [Google Scholar] [CrossRef]
  40. GB/T 50218-2014; Standard for Engineering Classification of Rock Mass. Ministry of Housing and Urban-Rural Development of the People’s Republic of China: Beijing, China, 2014. (In Chinese)
  41. JTG/T D70-2010; Guidelines for Design of Highway Tunnel. Ministry of Transport of the People’s Republic of China: Beijing, China, 2010. (In Chinese)
  42. JTGD70-2018; Code for Design of Road Tunnel. Ministry of Transport of the People’s Republic of China: Beijing, China, 2018. (In Chinese)
  43. Reshef, D.N.; Reshef, Y.A.; Finucane, H.K.; Grossman, S.R.; McVean, G.; Turnbaugh, P.J.; Lander, E.S.; Mitzenmache, M.; Sabeti, P.C. Detecting novel associations in large data sets. Science 2011, 334, 1518–1524. [Google Scholar] [CrossRef] [Green Version]
  44. Lipton, Z.C.; Berkowitz, J.; Elkan, C. A Critical Review of Recurrent Neural Networks for Sequence Learning. arXiv 2015, arXiv:1506.00019.cience. [Google Scholar]
  45. Schuster, M.; Paliwal, K.K. Bidirectional recurrent neural networks. IEEE Trans. Signal Processing 1997, 45, 2673–2681. [Google Scholar] [CrossRef] [Green Version]
  46. Hochreiter, S.; Schmidhuber, J. Long short⁃term memory. Neural Comput. 1997, 9, 1735–1780. [Google Scholar] [CrossRef]
  47. Hua, Y.X.; Zhao, Z.F.; Li, R.P. Deep learning with long short-term memory for time series prediction. IEEE Commun. Mag. 2019, 57, 114–119. [Google Scholar] [CrossRef] [Green Version]
  48. Greff, K.; Srivastava, R.K.; Koutnik, J. LSTM: A search space odyssey. IEEE Trans. Neural Netw. Learn. Syst. 2017, 28, 2222–2232. [Google Scholar] [CrossRef] [Green Version]
Figure 1. The distribution map of rock strata.
Symmetry 14 00513 g001
Figure 2. Deformation of the initial support.
Symmetry 14 00513 g002
Figure 3. Deformation of tunnel face arch.
Symmetry 14 00513 g003
Figure 4. Construction scheme (units: mm).
Symmetry 14 00513 g004
Figure 5. 3D model diagram. (a) The numerical model. (b) The tunnel structure.
Symmetry 14 00513 g005
Figure 6. Construction steps. (a) excavated upper soil (L = 5 m); (b) activated bolt, upper initial support and secondary lining; (c) excavated lower soil (L = 5 m); (d) activated lower initial support and secondary lining.
Symmetry 14 00513 g006aSymmetry 14 00513 g006b
Figure 7. Cloud image of tunnel deformation (units: m). (a) Excavation step = 1. (b) Excavation step = 400.
Symmetry 14 00513 g007
Figure 8. Relationship between deformation of tunnel vault and excavation steps (units: cm).
Symmetry 14 00513 g008
Figure 9. The maximum deformation of the tunnel under different schemes (units: cm).
Symmetry 14 00513 g009
Figure 10. A diagram of an RNN. x n is the input value at the current moment; h n is the hidden value at the current moment; y n is the output value at the current moment; A is the RNN model.
Symmetry 14 00513 g010
Figure 11. A diagram of LSTM.
Symmetry 14 00513 g011
Figure 12. Heat map of correlation coefficient.
Symmetry 14 00513 g012
Figure 13. Architecture of the LSTM.
Symmetry 14 00513 g013
Figure 14. Settlement of the tunnel vault.
Symmetry 14 00513 g014
Figure 15. Settlement of the left arch waist of tunnel.
Symmetry 14 00513 g015
Figure 16. Settlement of the right arch waist of tunnel.
Symmetry 14 00513 g016
Figure 17. Uplift of the tunnel bottom.
Symmetry 14 00513 g017
Table 1. The surrounding rock classification.
ClassificationV2V1IV3IV2IV1III2
Tunnel
Left line1.6%8.4%21.1%22.4%35.1%11.4%
Right line1.7%8.1%22.1%22.7%30.8%14.6%
Table 2. The parameters of the surrounding rock.
ClassificationV2V1IV3IV2IV1III2
Parameters
ρ/(kg/m−3)160018002000220024002600
E/(GPa)1.32.02.43.87.010.7
υ0.450.390.350.330.310.30
ϕ/°222535455055
c/(MPa)2510152025–30
Table 3. The structural parameters.
ParametersE/(GPa)υC/(MPa)ϕ/(°)ρ/(kg/m−3)
Concrete lining230.22.5452500
Bolt2060.3--7850
Table 4. Bolt parameters under different schemes.
SchemesBolt Length (m)Bolt Spacing (m)
14.01.0
24.00.5
35.01.0
45.00.5
Table 5. The maximum deformation values.
Schemes1234
Maximum uplift (cm)1110.068.017.69
Maximum settlement (cm)10.59.867.216.41
Table 6. The parameters of the model.
Model ParametersLSTM
Layers
UnitsDenseBatch_SizeEpochActivate FunctionOptimizerLoss
Number/Type2321100200ReluAdamMse
Table 7. The model evaluation (tunnel vault).
Data SetMAERMSER2
Train0.1240.1410.931
Test0.2010.1880.922
Table 8. The model evaluation (left arch waist of tunnel).
Data SetMAERMSER2
Train0.1140.1330.953
Test0.1970.2020.901
Table 9. The model evaluation (right arch waist of tunnel).
Data SetMAERMSER2
Train0.1070.1290.927
Test0.2150.2210.908
Table 10. The model evaluation (tunnel bottom).
Data SetMAERMSER2
Train0.1210.1460.926
Test0.2130.1930.917
Publisher’s Note: MDPI stays neutral with regard to jurisdictional claims in published maps and institutional affiliations.

