Article

Similarity Analysis of Methods for Objective Determination of Weights in Multi-Criteria Decision Support Systems

by
Bartosz Paradowski
1,
Andrii Shekhovtsov
2,
Aleksandra Bączkiewicz
3,4,
Bartłomiej Kizielewicz
2 and
Wojciech Sałabun
2,*
1
Machine Learning Group, Department of Artificial Intelligence and Applied Mathematics, Faculty of Computer Science and Information Technology, West Pomeranian University of Technology in Szczecin, ul. Żołnierska 49, 71-210 Szczecin, Poland
2
Research Team on Intelligent Decision Support Systems, Department of Artificial Intelligence and Applied Mathematics, Faculty of Computer Science and Information Technology, West Pomeranian University of Technology in Szczecin, ul. Żołnierska 49, 71-210 Szczecin, Poland
3
Institute of Management, University of Szczecin, ul. Cukrowa 8, 71-004 Szczecin, Poland
4
Doctoral School of University of Szczecin, ul. Mickiewicza 16, 70-383 Szczecin, Poland
*
Author to whom correspondence should be addressed.
Symmetry 2021, 13(10), 1874; https://doi.org/10.3390/sym13101874
Submission received: 12 August 2021 / Revised: 29 September 2021 / Accepted: 30 September 2021 / Published: 5 October 2021
(This article belongs to the Special Issue Uncertain Multi-Criteria Optimization Problems II)

Abstract

:
Decision support systems (DSS) are currently developing rapidly and are increasingly used in various fields. More often, those systems are inseparable from information-based systems and computer systems. Therefore, from a methodical point of view, the algorithms implemented in the DSS play a critical role. In this aspect, multi-criteria decision support (MCDA) methods are widely used. As research progresses, many MCDA methods and algorithms for the objective identification of the significance of individual criteria of the MCDA models were developed. In this paper, an analysis of available objective methods for criteria weighting is presented. Additionally, the authors presented the implementation of the system that provides easy and accessible weight calculations for any decision matrix with the possibility of comparing results of different weighting methods. The results of weighting methods were compared using carefully selected similarity coefficients to emphasise the correlation of the resulting weights. The performed research shows that every method should provide distinctive weights considering input data, emphasising the importance of choosing the correct method for a given multi-criteria decision support model and DSS.

1. Introduction

The continuous development of digitalization causes information-based systems to become an integral part of many companies and provide helpful software for application in various domains. Furthermore, the increasing amount of information increases the importance of the decision-making factor. Nowadays, decision-making processes can be supported by the application of decision support systems. The mentioned tools are more and more prominently used among numerous fields, for instance, sustainable energy development [1,2,3,4], business [5,6], scientific [7] or information processing [8].
Such decision support systems have been widely used for many years. However, the DSSs that make up information management systems are constantly being improved and developed [9]. Decision support systems were created for supply e-commerce [10], chain improvement [11], new employee recruitment [12], human resources [13], accounting support [14] or even for water resource management [15,16].
Complex decision problems considering many conflicting criteria require that the decision support system work with suitable methods for such problems [17]. For example, multi-criteria decision analysis (MCDA) methods are especially appropriate techniques in the context of compound decision problems. MCDA works based on predefined alternatives and criteria that characterize them. The most popular MCDA methods, such as TOPSIS, VIKOR and COPRAS require weights to determine the significance of the considered criteria [18,19,20].
The determination of criteria preference in the multi-criteria problem being solved, performed by determining weights, is one of the critical steps of MCDA methods because it significantly affects the final results [21]. Currently, many methods for determining criteria weights are available. The challenge is that no specific guidelines indicate which weighting method is most appropriate for a given problem. The purpose of weighting techniques is to reflect stakeholder preferences concerning the considered criteria. Weighting techniques vary in their ease of use by the decision-maker. There are reports that people with higher numerical ability prefer to use numerical techniques, while decision-makers with dominant fluency favour non-numerical methods.
Criteria weighting techniques are divided into subjective and objective. Subjective techniques require the participation of the decision-maker in the weighting procedure. The values of the weights are then solely dependent on the opinion of the decision-maker [22]. Subjective criteria weighting techniques include Analytic Hierarchy Processes (AHP) [23,24], Simple Multi-Attribute Rating Techniques (SMART) [25], Simultaneous Evaluation of Criteria and Alternatives (SECA) [26]. Subjective weighting techniques are characterized by uncertainty due to varying interpretations of the decision problem by different decision-makers [27].
The different weighting techniques have various degrees of compoundness. The pairwise comparison procedure executed in AHP (Analytic Hierarchy Process) is less complicated than the SWING technique that considers a range of criteria values or the DCE (Discrete Choice Experiment) that requires considering alternatives concerning multiple criteria [28]. Despite its apparent simplicity, the AHP algorithm has high complexity due to the necessity of performing many pairwise comparisons [29]. Furthermore, the AHP method has some disadvantages such as the co-dependence of criteria, inconsistencies and sensitivities to the ranking reversal phenomenon [30].
On the other hand, objective weighting methods determine criterion weights based on mathematical formulas. They are readily and widely used because they do not require expert knowledge of the problem being solved and allow for better automation and streamlining of DSS systems. However, in many real decision problems, as well as existing DSS systems (e.g., economic studies [31] or company strategy assessments [32]), there is a need to develop objective rankings [33]. The objective identification of the significance of the decision model criteria plays a critical role in DSSs which are based on MCDA and considerably affects the final results. Due to some limitations of subjective weighting techniques, and the advantages and usefulness of objective methods identified above, the authors decided to present a system including implementation of objective weighting techniques. This paper aims to present and compare seven objective weighting methods using comprehensive analyses. The weighting techniques selected for the purpose of this analysis are considered to be the most commonly used and most promising methods. Among the techniques chosen by the authors are: standard deviation method, statistical variance method, entropy method, mean method, CRITIC method [34,35], CILOS method [36,37] and IDOCRIW method [38]. Each method provides a different approach to considering data and calculating weights. They are unbiased methods, so the results depend solely on the input data, its range, how it changes, or its differences among particular alternatives considered in the decision problem.
Because of the large number of weighing techniques available, a reliable comparative analysis requires establishing a special, suitable methodology for comparing the results. For this purpose, four different approaches were chosen and presented by different equations that consider the data differently. The euclidean distance and three ranking coefficients were chosen to check how each method prefers different criteria. Those coefficients are Pearson’s correlation coefficient, weighted Spearman’s rank correlation coefficient [39,40,41] and W S rank correlation coefficient [42].
Furthermore, a computer system has been developed, which allows criteria weight calculations for any decision matrix, together with the possibility of comparing the results of different weighting methods for a given matrix. A market analysis was also carried out to see if such a system had already been developed. The presented system allows the user to easily apply the methods described in the article without much programming knowledge, requiring only a basic knowledge of multi-criteria decision-making analysis.
The rest of the paper is organized as follows. In Section 2, the fundamentals and assumptions of MCDA are given. This section also provides the following stages of objective weighting methods considering customizing them to the specifics of the decision problem. Section 3 introduces the basics and formulas of techniques applied for performing a comparison. Section 4 presents the implemented system with the exact flow of the application and a description of its main features. Section 5 provides the results of a comparison of the discussed methods. Then the discussion about obtained results is drawn. The last Section 6 summarizes this paper and provides conclusions and future work directions.

2. Preliminaries

At first, this section introduces a general scheme of MCDA structure and execution, necessary for its proper understanding. Further, the weighting methods are presented with the particular stages required for appropriate performance.

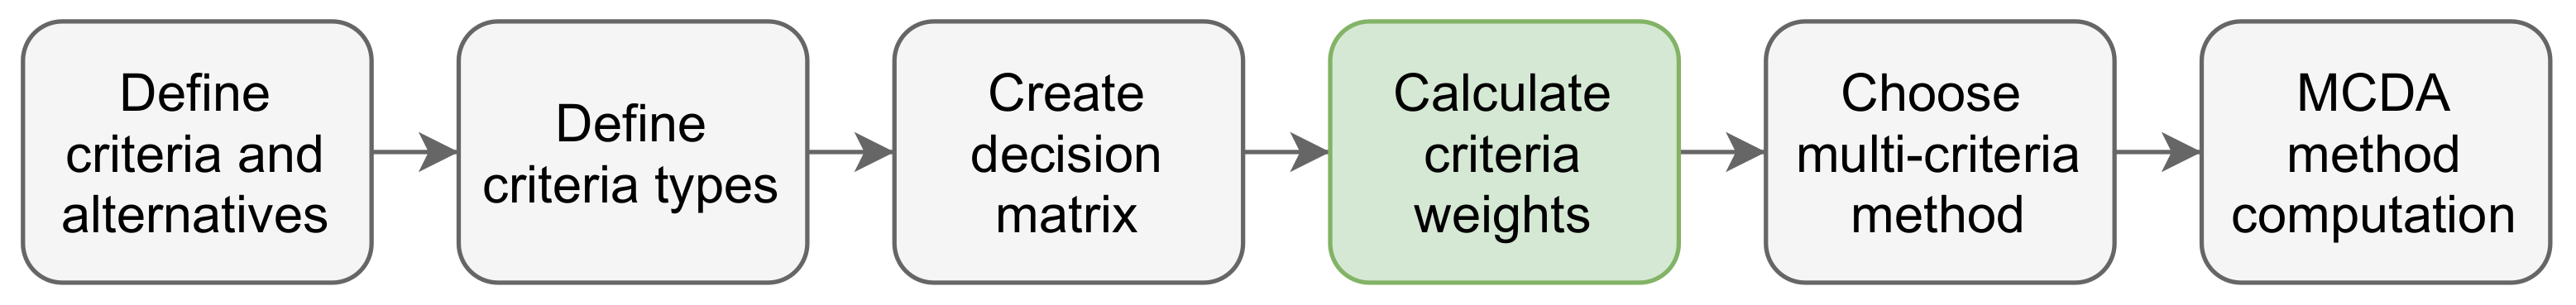
2.1. Multi-Criteria Decision Analysis

The multi-criteria decision-making process performed using MCDA methods consists of several sequential phases. These steps include determining the structure of the considered problem by creating a decision matrix with assessed m alternatives and n evaluation criteria represented by (1), determining criteria preferences, and applying an algorithm that provides a recommendation in the form of a ranking of alternatives [43].
X = x 11 x 12 x 13 x 1 n x 21 x 22 x 13 x 2 n x m 1 x m 2 x m 3 x m n m × n
Depending on the chosen method, differences in the procedure of solving the problem might include various steps and a number of specifics of algorithm execution. The flow of the typical procedure of MCDA is designed based on [43] as shown below in Figure 1. The step of calculating criteria weights was highlighted, as this is the main focus of the performed analysis.

2.2. Standard Deviation Method

The standard deviation method focuses solely on the mathematical approach, which describes a measure of the volatility of the given values. This method is highly similar to the entropy method, as both assign smaller weights to an attribute with similar values across different alternatives. However, standard deviation analyses process data, considering a different aspect which ensures that results might differ depending on the provided data [18]. The following steps of this method are provided below, based on [44].
Step 1. First, we calculate the standard deviation of the given decision matrix according to Equation (2).
σ j = i = 1 m X i j X j ¯ ) 2 m i { 1 , 2 , , m } j { 1 , 2 , , n }
Step 2. The standard deviation values are used for the calculation of criteria weights as shown in Equation (3).
w j = σ j j = 1 n σ j

2.3. Statistical Variance Method

The statistical variance procedure is a method in which objective weights are derived using mathematical-statistical variance, which describes the spread of variables from their mean value. This method was chosen because of its strict mathematical approach. Statistical variance is often used to describe the spread of variables in a data set [45]. Since this method is well-known, it is supposed to provide weights that are suitable for solving a considered problem. The following steps of this procedure are given below, based on [46].
Step 1. Initially, the decision matrix needs to be normalized. Several methods are used to normalize the input data provided in the form of a matrix; for example, the minimum-maximum method and sum and vector methods [18]. The normalization procedure is represented by Equation (4),
X i j * = n o r m a l i z e ( X i j ) i { 1 , 2 , , m } j { 1 , 2 , , n }
where normalize denotes an arbitrary normalization technique.
Step 2. The following step calculates the statistical variance of information, as shown in Equation (5), based on the normalized matrix obtained in the previous stage.
V j = 1 n i = 1 n X i j * X i j * ¯ 2
Step 3. The result of the previous step allows one to calculate the weights of the criteria in accordance with Equation (6).
w j = V j i = 1 m V j

2.4. Entropy Method

The main objective of the entropy method is to take into account the measure of uncertainty in the information formulated using probability theory [47]. This method was chosen for its vast popularity among decision-makers [48,49]. It is used in numerous scientific articles even though it is not always appropriate. At first, the entropy method was glorified in terms of provided information about data. That is why it is still one of the most used for different problems, including weight determination. Subsequent steps of this technique are given as follows, on the basis of [50].
Step 1. The first step of this technique includes normalization of the decision matrix to eliminate differences related to units and scales. Normalization is performed using the sum method, as displayed in Equation (7).
X i j * = X i j i = 1 m X i j i { 1 , 2 , , m } j { 1 , 2 , , n }
where m is the number of alternatives and n represents the number of criteria.
Step 2. The second stage involves calculating the information entropy for every particular criterion. Equation (8) demonstrates this procedure.
e j = i = 1 m X i j * ln X i j * ln ( m ) j { 1 , 2 , , n }
Step 3. Finally, criteria weights are computed using information entropy according to Equation (9).
w j = 1 e j i = 1 n 1 e j j { 1 , 2 , , n }

2.5. Mean Weighting Method

This method provides equal weights for each criterion [18]. This weighting technique is considered to be the simplest method. Therefore, its use is recommended for decision problems in which all criteria are equally important to the decision-maker, and there is a lack of statistical or empirical evidence to suggest another strategy. Due to its low complication and easy adoption, this strategy has been applied to develop sustainability indices, for example, the Human Development Index [51]. Despite the simplicity of this method, its use has raised some controversy focused on the validity and transparency of indexes applying this procedure [52].
The equation used to execute this method is provided in Equation (10).
w j = 1 n j { 1 , 2 , , n }
where n is the number of considered criteria.

2.6. The CRITIC Method

The Criteria Importance Through Inter-criteria Correlation (CRITIC) method is especially interesting because its analytical approach enables us to utilize all information included in the criteria under evaluation. Diakoulaki introduced this technique at the National Technical University of Athens [34]. This method provides a broader view of the decision matrix, because it takes other criteria into consideration, to provide more distinctive weights for each of them. That is why, through years, it became popular among many researchers [53,54,55]. The CRITIC method provides objective values of weights, taking into account the intensity of contrast and conflict included in the decision problem. Thus, the method is applicable in state-of-the-art procedures for measuring the effectiveness of solutions. The weight values are obtained by quantifying the internal information for each evaluation criterion. The standard deviations of the criteria and the correlations measured between the criteria are used in this technique [55,56]. The following steps of this method are provided as follows [25].
Step 1. At first, for every criterion of the decision matrix, a membership function is defined that will map the values of the matrix to the interval [0, 1], in the normalization process given in the following Equation (11), which represents minimum-maximum normalization for benefit criteria. In this procedure, criteria are not split into profit and cost types:
r i j = x i j x j m i n x j m a x x j m i n i { 1 , 2 , , m } j { 1 , 2 , , n }
where m represents the number of evaluated alternatives and n expresses the number of considered criteria.
Step 2. In the following stage, the correlation between particular criteria in the normalized matrix is calculated. The result is a symmetric matrix R j k , with size n × n . The Spearman’s correlation coefficient is enabled to be used as a general measure. Next, the result vector is received using the obtained matrix and the calculation of the standard deviation of every criterion C j . This step is performed as Equation (12) demonstrates.
C j = σ j k = 1 m 1 R j k
where C j is the information quantity included in the j-th criterion, σ j means the standard deviation of the j-th criterion and R j k represents the correlation coefficient calculated for j-th and k-th criteria.
Step 3. Finally, criteria weights are calculated using the sum normalization of a previously computed vector according to Equation (13).
w j = C j j = 1 n C j

2.7. The CILOS Method

The Criterion Impact Loss Method is another promising objective weighting approach first introduced by Mirkin in 1976, then further developed in other studies [36,38]. This method considers each criterion’s significant (impact) loss when other criteria obtain the optimal largest or smallest value. It was chosen because it showed promising results that none of the other methods could provide because of its differing approach. The algorithm of this method is provided below, based on [57].
Step 1. At the beginning, minimized (cost) criteria are transformed into maximizing (profit) types like are presented in Equation (14).
X ¯ i j = min i X i j X i j i { 1 , 2 , , m } j { 1 , 2 , , n }
Step 2. Next, maximum values are found for each criterion. Based on that, a square matrix A is formed. Each row of the new matrix corresponds to a row in which given criteria have the highest value. It means that the maximum values of every criterion will be placed in the matrix’s main diagonal. With the use of matrix A, the relative loss—P matrix needs to be constructed, as Equation (15) shows.
P i j = A i i A i j A i i P i i = 0 i , j { 1 , 2 , , n }
Step 3. Finally, the matrix F is created with the use of a matrix of the relative loss according to Equation (16).
F = i = 1 m P i 1 P 12 P 1 m P 21 i = 1 m P i 2 P 2 m P m 1 P m 2 i = 1 m P i m
Step 4. The final stage includes calculation of weights that are normalized in Equation (17).
F w T = 0
where w is the weights vector.

2.8. Aggregate Objective Criteria Weights: The IDOCRIW Method

The IDOCRIW method aggregates weights acquired to the procedure of the CILOS method and the entropy method. This novelty approach attempts to combine methods with various objectives into new ones that provide a new direction in considering provided data [38]. This technique allows the limitations of one method to be compensated for by the advantages of another. Aggregated weights are generated according to Equation (18), based on [58].
w j = q j W j j = 1 m q j W j j { 1 , 2 , , n }
where q j is result of CILOS and W j represents Entropy weights.

3. Methods for Comparative Analysis of Criteria Weighting Techniques

This section introduces the description of methods used for the comparative analysis of weighting methods which is the main objective of this work. Two of the presented techniques calculate the correlation of raw values, while the other two focus on ranking weights and compare them in terms of criterion importance provided by the weighting method.

3.1. Pearson Correlation Coefficient

The term correlation refers to the relationship between phenomena, objects or values defining a particular phenomenon that have a tendency to differ. Pearson’s correlation coefficient is used to investigate whether there is a linear relationship between the data for the two variables considered [59]. The Pearson correlation coefficient is used to implement various indicators in statistics in areas such as data analysis, classification methods, clustering, decision support systems and the development of particle filters [60]. Pearson’s correlation coefficient is based on the method of covariance, which means that it measures the association of two continuous variables X and Y. It is used to determine the correlation between two continuous variables [61]. It gives information about correlation, which in this case, helps distinguish differences between weights calculated by different weighting methods. Moreover, it provides information about the magnitude of association and the direction of the relationship of given variables. This coefficient was chosen because of its wide usage as in numerous scientific articles [39,62,63] as it is well known and recognizable by many people. This coefficient is calculated according to Equation (19). In the equation presented below, the covariance of X and Y is divided by the product of standard deviations calculated for these variables [60].
r X Y = cov ( X , Y ) σ X σ Y

3.2. Euclidean Distance

Euclidean distance is a metric used to determine the distance between two points by calculating the square root of the sum of squares of the differences. This metric is applied in the distance-based MCDA method algorithm, which is TOPSIS. The calculated distance is used to determine the preference values of the evaluated alternatives. This technique is used for calculating the distance between two points X A and X B as Equation (20) demonstrates [64].
d = i = 1 n x i A x i B 2
This method has been selected for comparative analysis performed in this study as it provides the raw distance between two sets of variables. It helps distinguish the differences between those sets and check how much the exact value differs from each other. Euclidean distance has many applications in various fields. This metric is applied to measure the similarity between data sets using quantum algorithms [65] for face detection and recognition in combination with Viola-Jones, PCA-LDA [66] and clustering [67] and for gene identification in combination with PCA (Principal Component Analysis) [68]. When the Euclidean distance between the vectors being compared is smaller, they are more similar.

3.3. WS Rank Correlation Coefficient

This method is fairly new, as it was introduced in 2020 [42]. The main aim of this coefficient is to choose values that are closer to the top of the considered ranking. Thus, it ensures a typical ranking scenario where the three first places are the most significant. Moreover, it targets differences in the provided rankings depending on which positions changes were noticed. This coefficient is used in many decision problems, such as evaluating the convergence of the rankings provided by the MCDA methods, the sensitivity analysis of the resulting rankings, and the compromise ranking procedure to obtain a reliable solution from the results provided by different MCDA methods [10,69]. The described coefficient is calculated as shown in Equation (21).
W S = 1 i = 1 N 2 R x i · R x i R y i max 1 R x i , N R x i

3.4. Weighted Spearman Rank Correlation Coefficient

The last measure selected for performing a comparative analysis of criteria weighting methods in this study can be described as one of the most used rank correlation coefficients used nowadays to target multi-criteria decision analysis problems [40,41]. Spearman’s correlation coefficient was developed to provide a measure of the strength and direction of correlation between two ranked variables R and Q [19,42]. Its weighted equivalent helps to ensure that the ranks near the podium are more important than those at the bottom of the ranking because it is most important in a typical ranking scenario. This coefficient is computed according to Equation (22).
r w = 1 6 i = 1 n R i Q i 2 n R i + 1 + n Q i + 1 n 4 + n 3 n 2 n

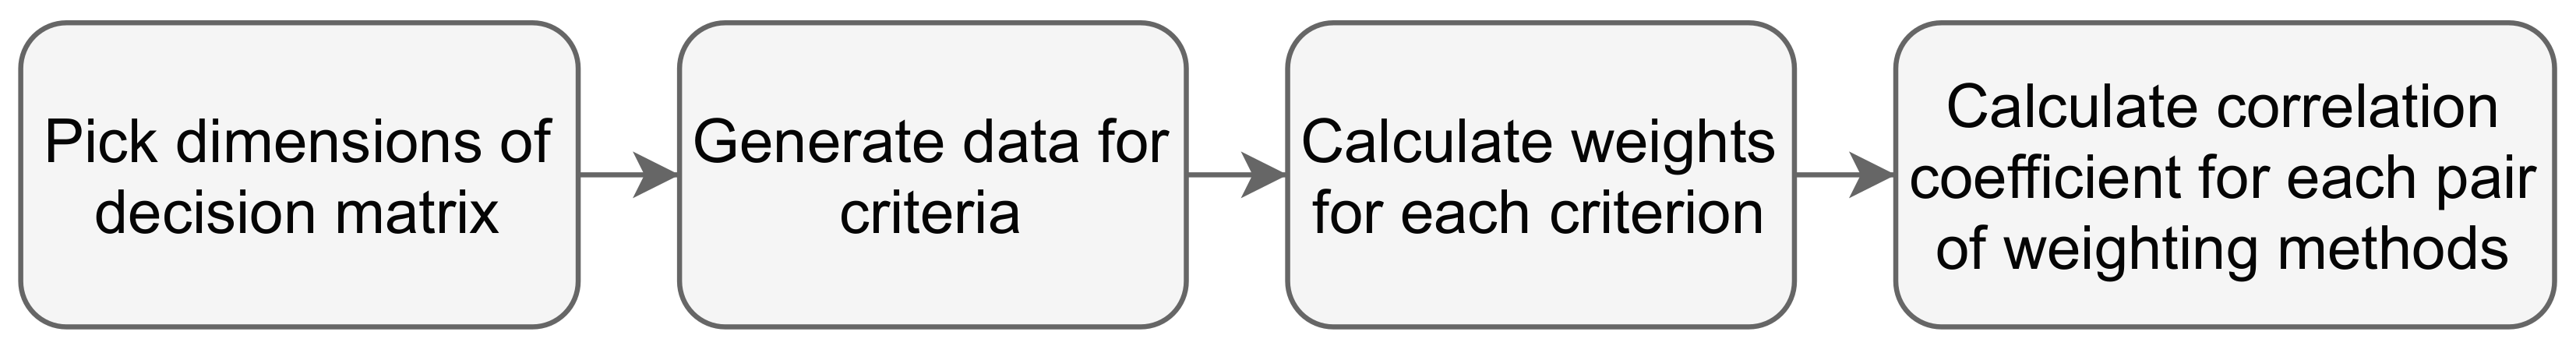
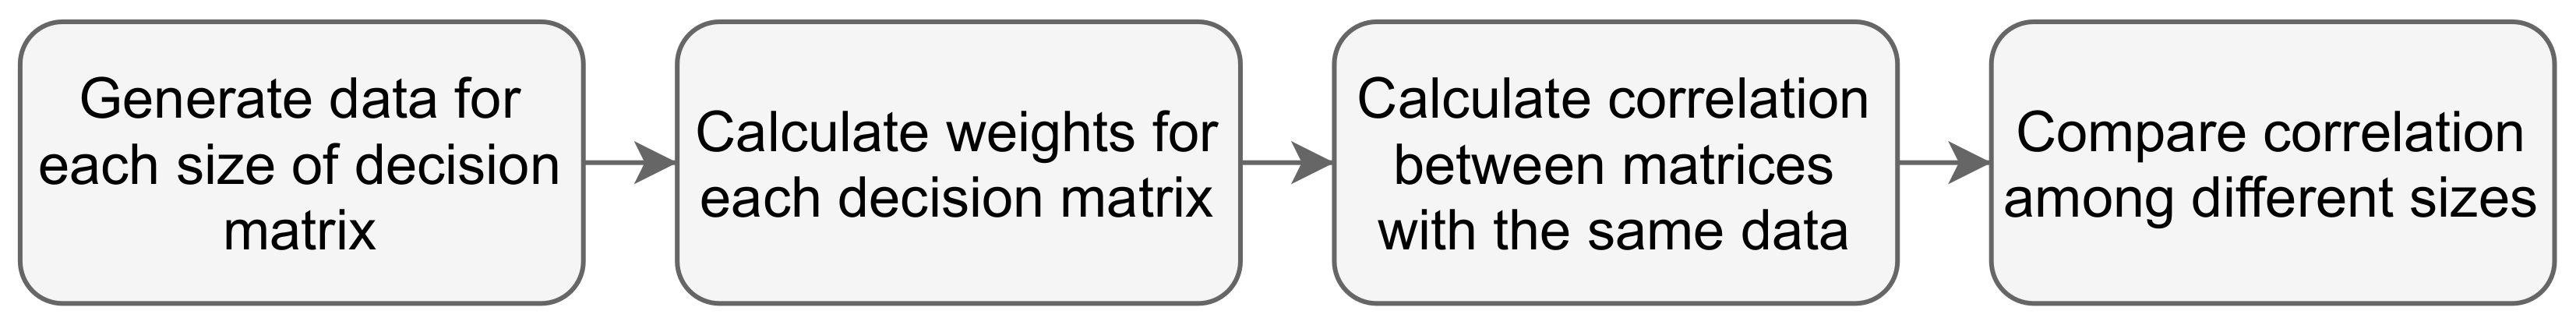
3.5. Methodology of Comparative Analysis of Weighting Methods

This section presents the author’s approach for conducting a comparative analysis of the effects of the investigated weighting techniques. For the purpose of the analysis, the authors conducted the experiment by generating new matrices for a varying number of alternatives and a range of criteria. For each matrix, the criteria weights were calculated using the seven weighting methods described above. The resulting weights were then used in four different comparative methods that allow certain aspects of information to be described through correlation coefficients. The complete analysis was performed in the Python language. For this particular comparison, tests were carried out, and the results were obtained according to the chosen specification:
  • Number of tests for each size of matrix: 100;
  • Number of alternatives: [3, 4, 5, 6, 7];
  • Number of criteria: [3, 4, 5, 6, 7];
  • Decision matrix size was drawn as a pair of numbers from the Cartesian product;
  • Each matrix had randomized values with range (1, 300).
The analysis was performed in two ways. In each way, the results overlapped across the different correlation methods, so the most representative results were chosen to present them graphically in charts.
In the first approach, the coefficients were used to highlight the differences between the weighting methods themselves. This approach ensured that the matrices being compared were the same size. The values of each criterion were generated for each test, meaning that there were 100 matrices of the same size but different inputs. The weights for each matrix were calculated and then compared with other matrices whose number of criteria was the same. This approach shows which weighting methods can calculate similar weights for the same input data. A flow chart of this approach is shown in Figure 2.
The second approach aimed to investigate how the criteria weights change depending on the size of the decision matrix. The aim was to create hundreds of matrices of the same size, each time with different data. Then the comparison between two weighting methods was conducted. Finally, the results were displayed in charts showing the correlation of weights determined for different sizes of tested matrices for careful and insightful analysis. The described approach is presented in Figure 3.

4. Proposed Framework

The computer system that is the subject of this paper is developed to provide a tool for easily determining the weights of criteria required in decision problems solved using MCDA. Moreover, this application provides values of coefficients presented in this paper and, at the same time, enables comparing results for specific decision matrices given by the selected methods. Thus, the implemented system containing the described functionalities completes the gap that was not filled by the applications introduced earlier.

4.1. Similar Systems

This section is devoted to presenting systems that converge to the application presented in this work. There are many similar systems available. The highest similarity is that all the systems aim towards MCDA method computations, which leads to the point that some of them provide criteria weights calculation, but often the implemented methods are subjective. The systems that provide similar usage are inter alia:
  • Diviz;
  • Paramount Decisions;
  • D-Sight.
A common feature of the systems presented above is that they are more focused on the MCDA methods used to solve the problem rather than the criteria weighting techniques. These systems typically provide the option for subjective determination of weights by the user, who acts as the decision-maker. Thus, the system proposed in this paper, that provides seven different objective weighting methods, has no significant competitor among them. This system seems to be helpful and suitable for users attempting to solve a decision problem with sufficient knowledge of the problem domain. The weights determined by the objective techniques implemented in this system can be helpful to obtain a satisfactory and reliable solution to problems in various fields.

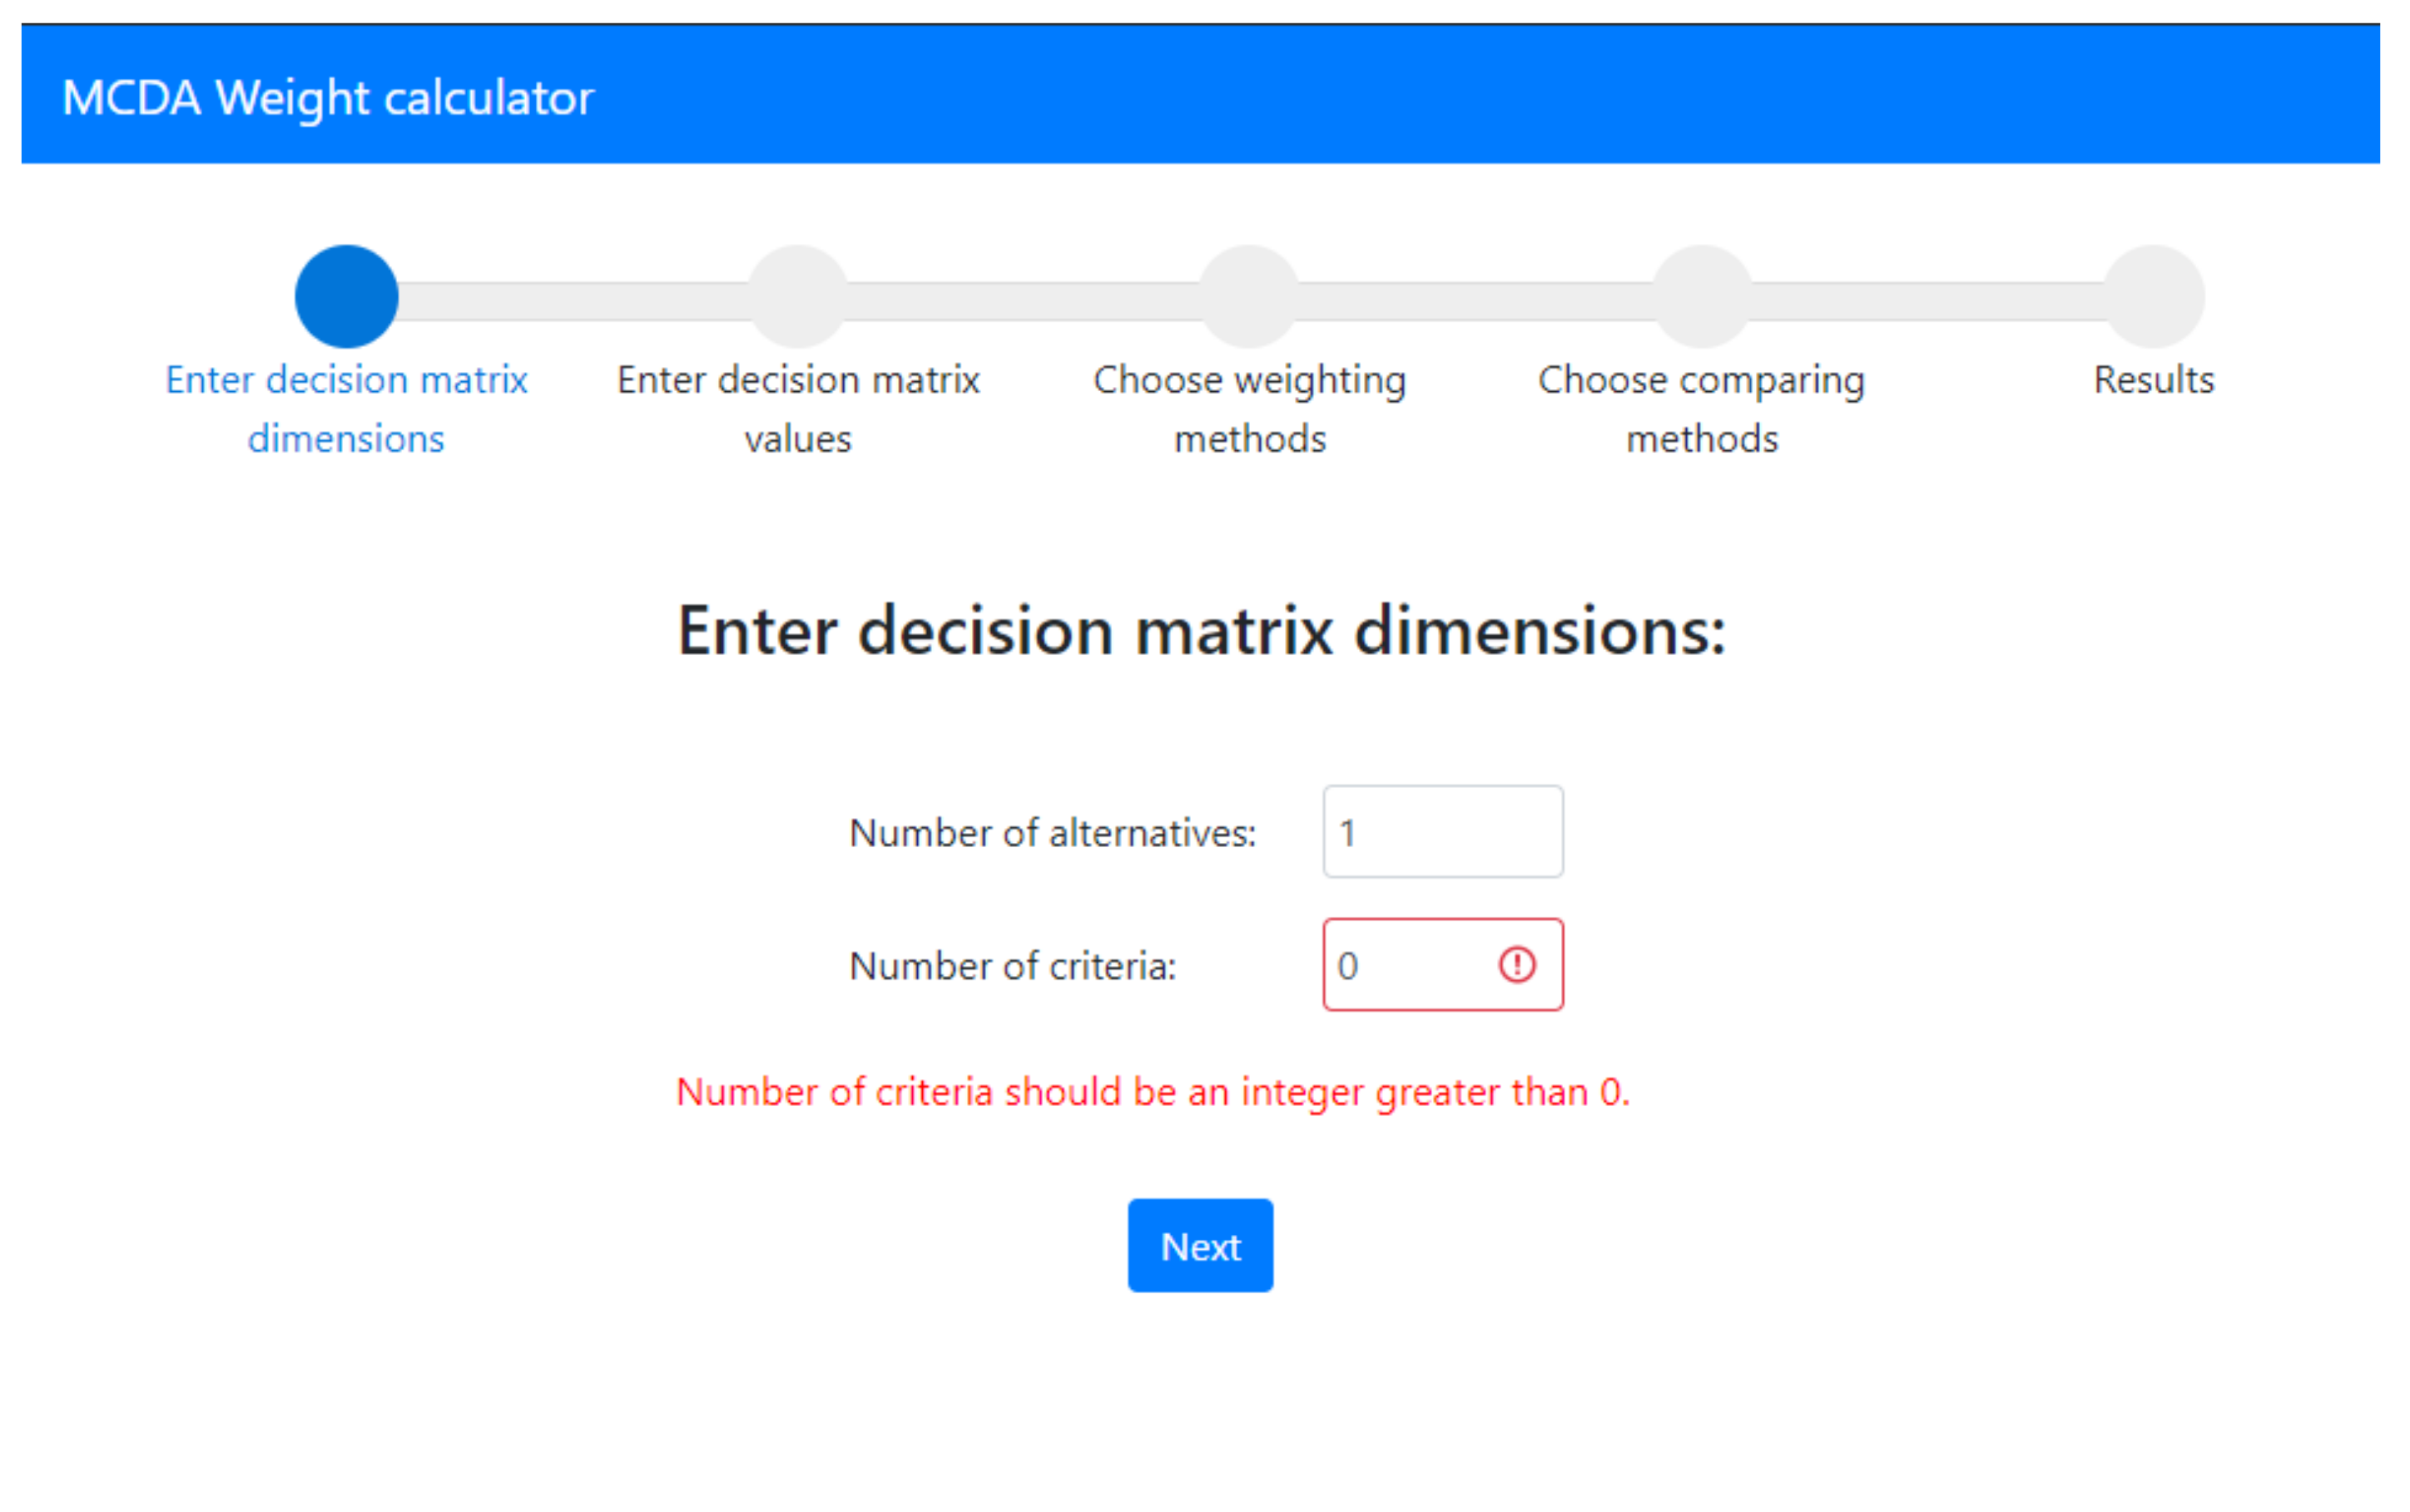
4.2. System Development and Implementation

The presented system was implemented in Python language, in a Flask framework. Its main goal was to develop a system that is easy to navigate and use without any special knowledge. Complete implementation of the application is available for use at the GitLab repository (https://vezrix.pythonanywhere.com/ (accessed on 1 August 2021)).

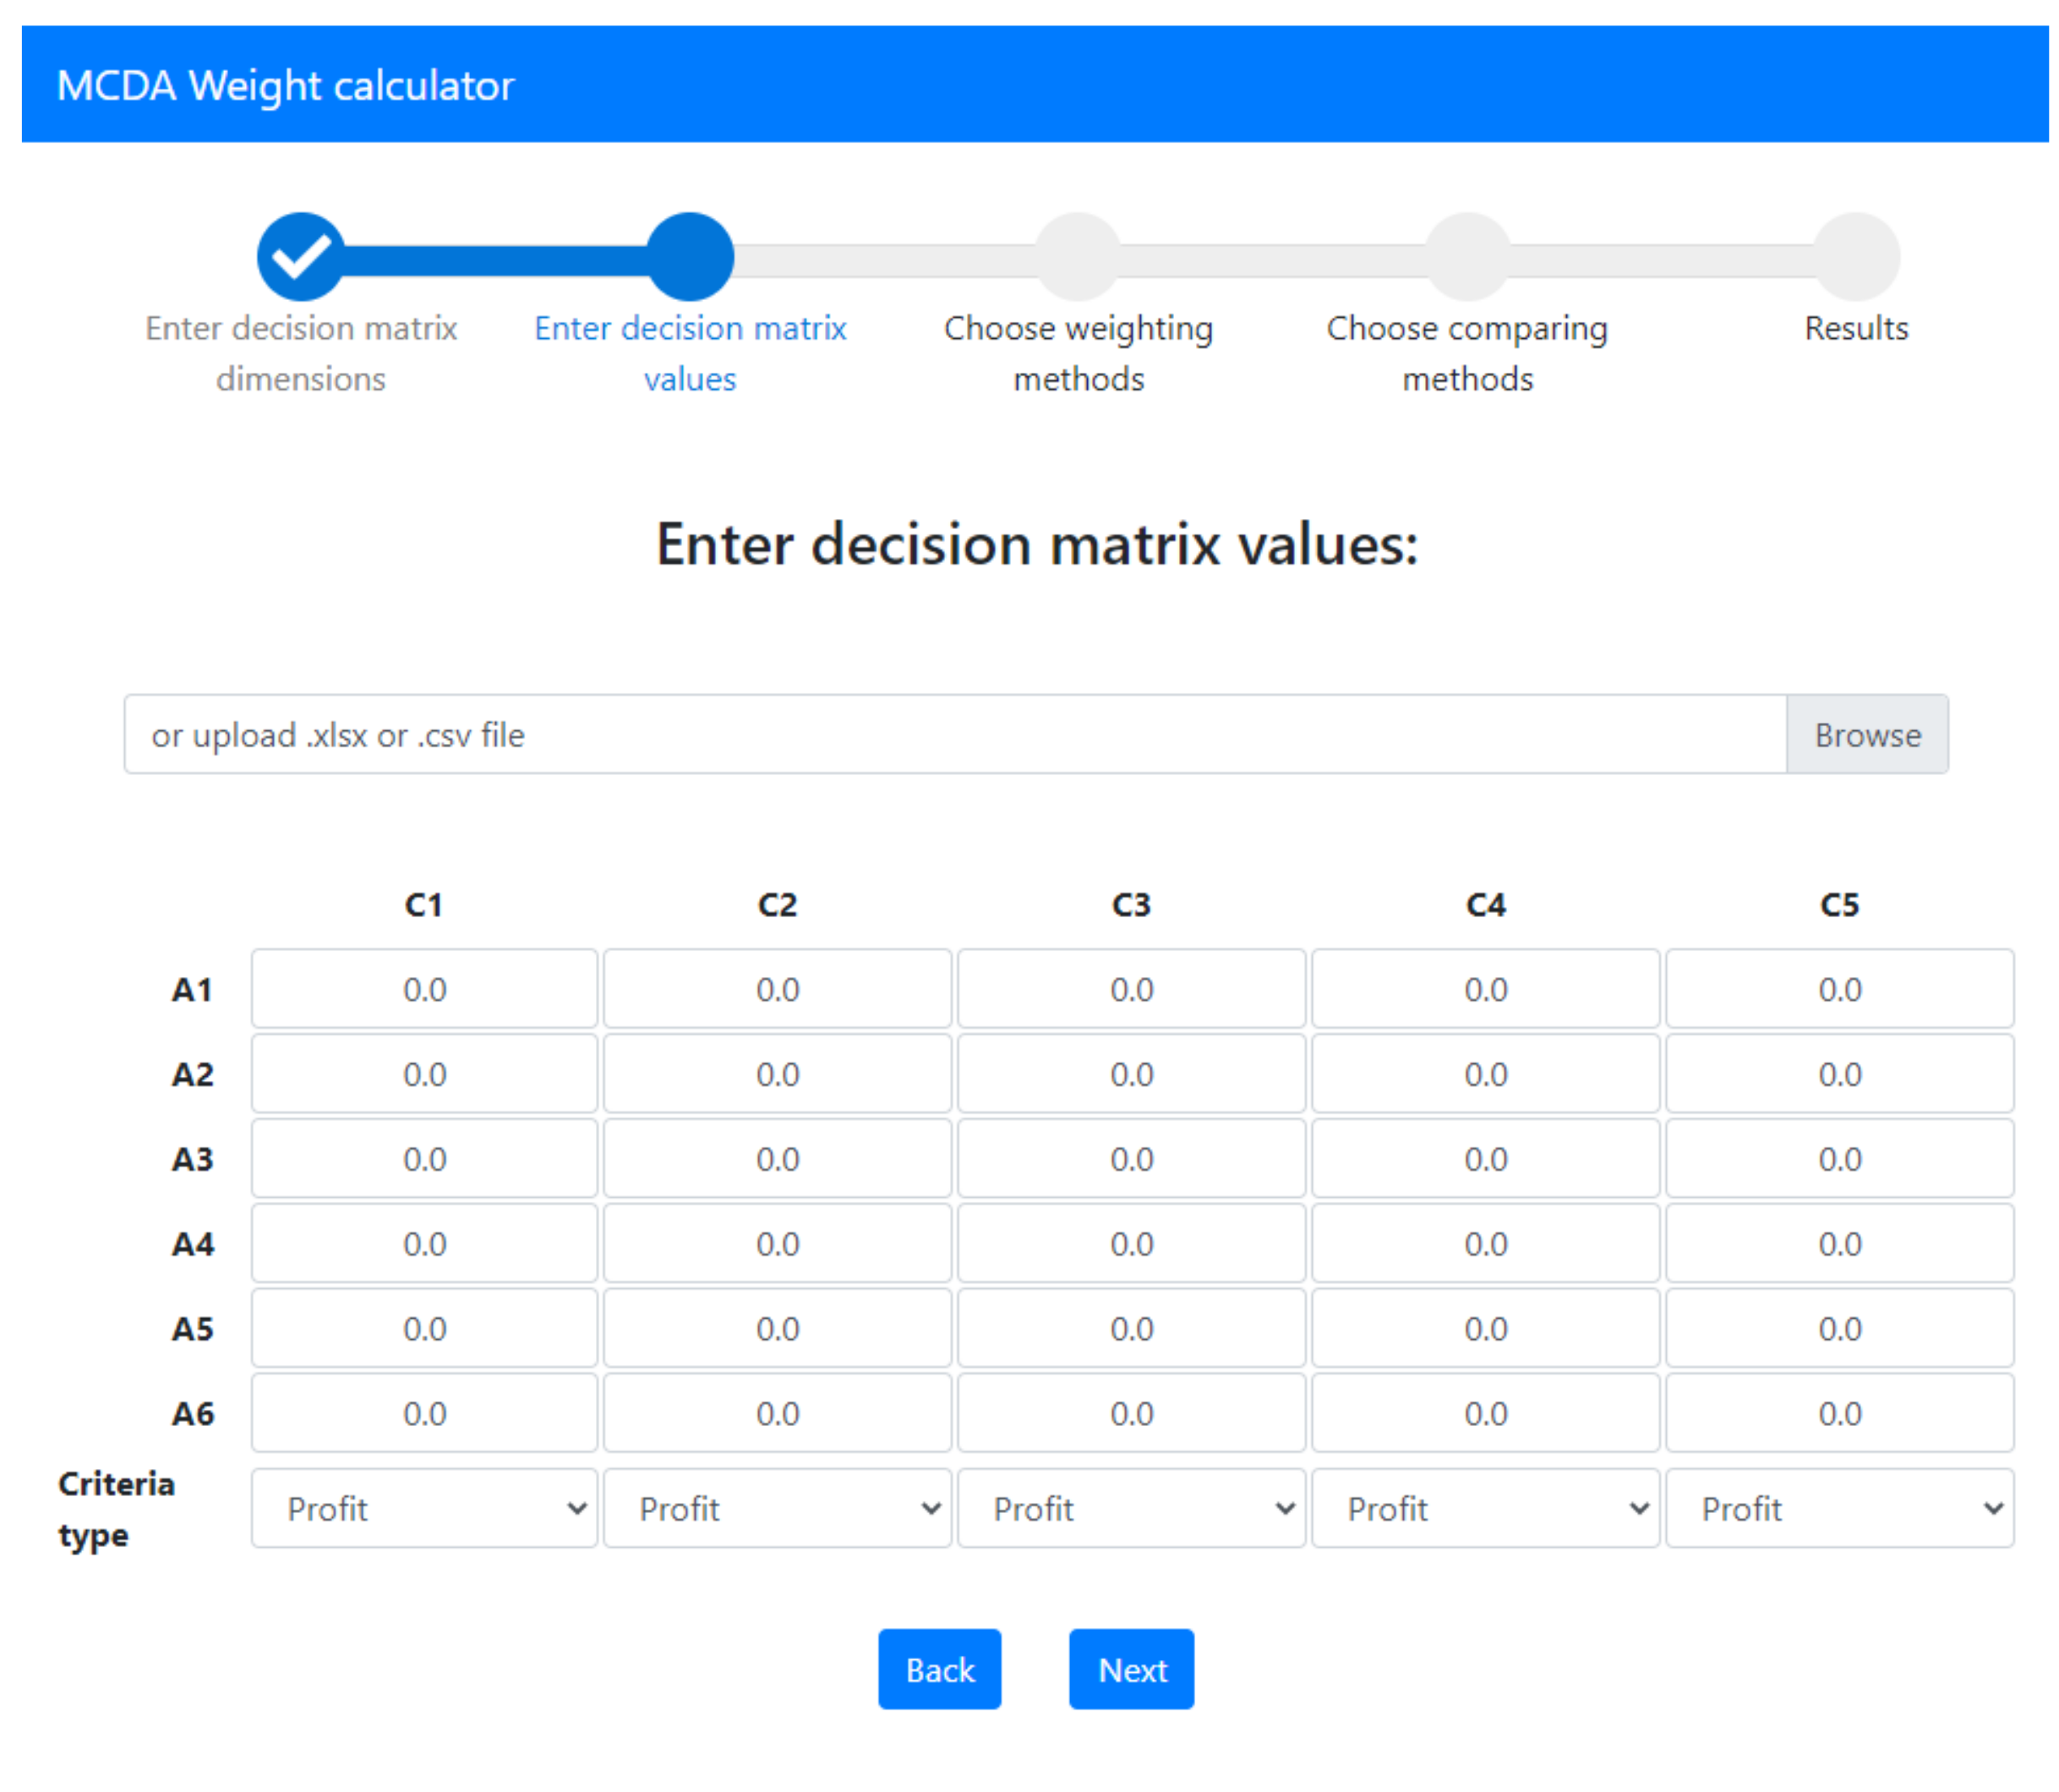
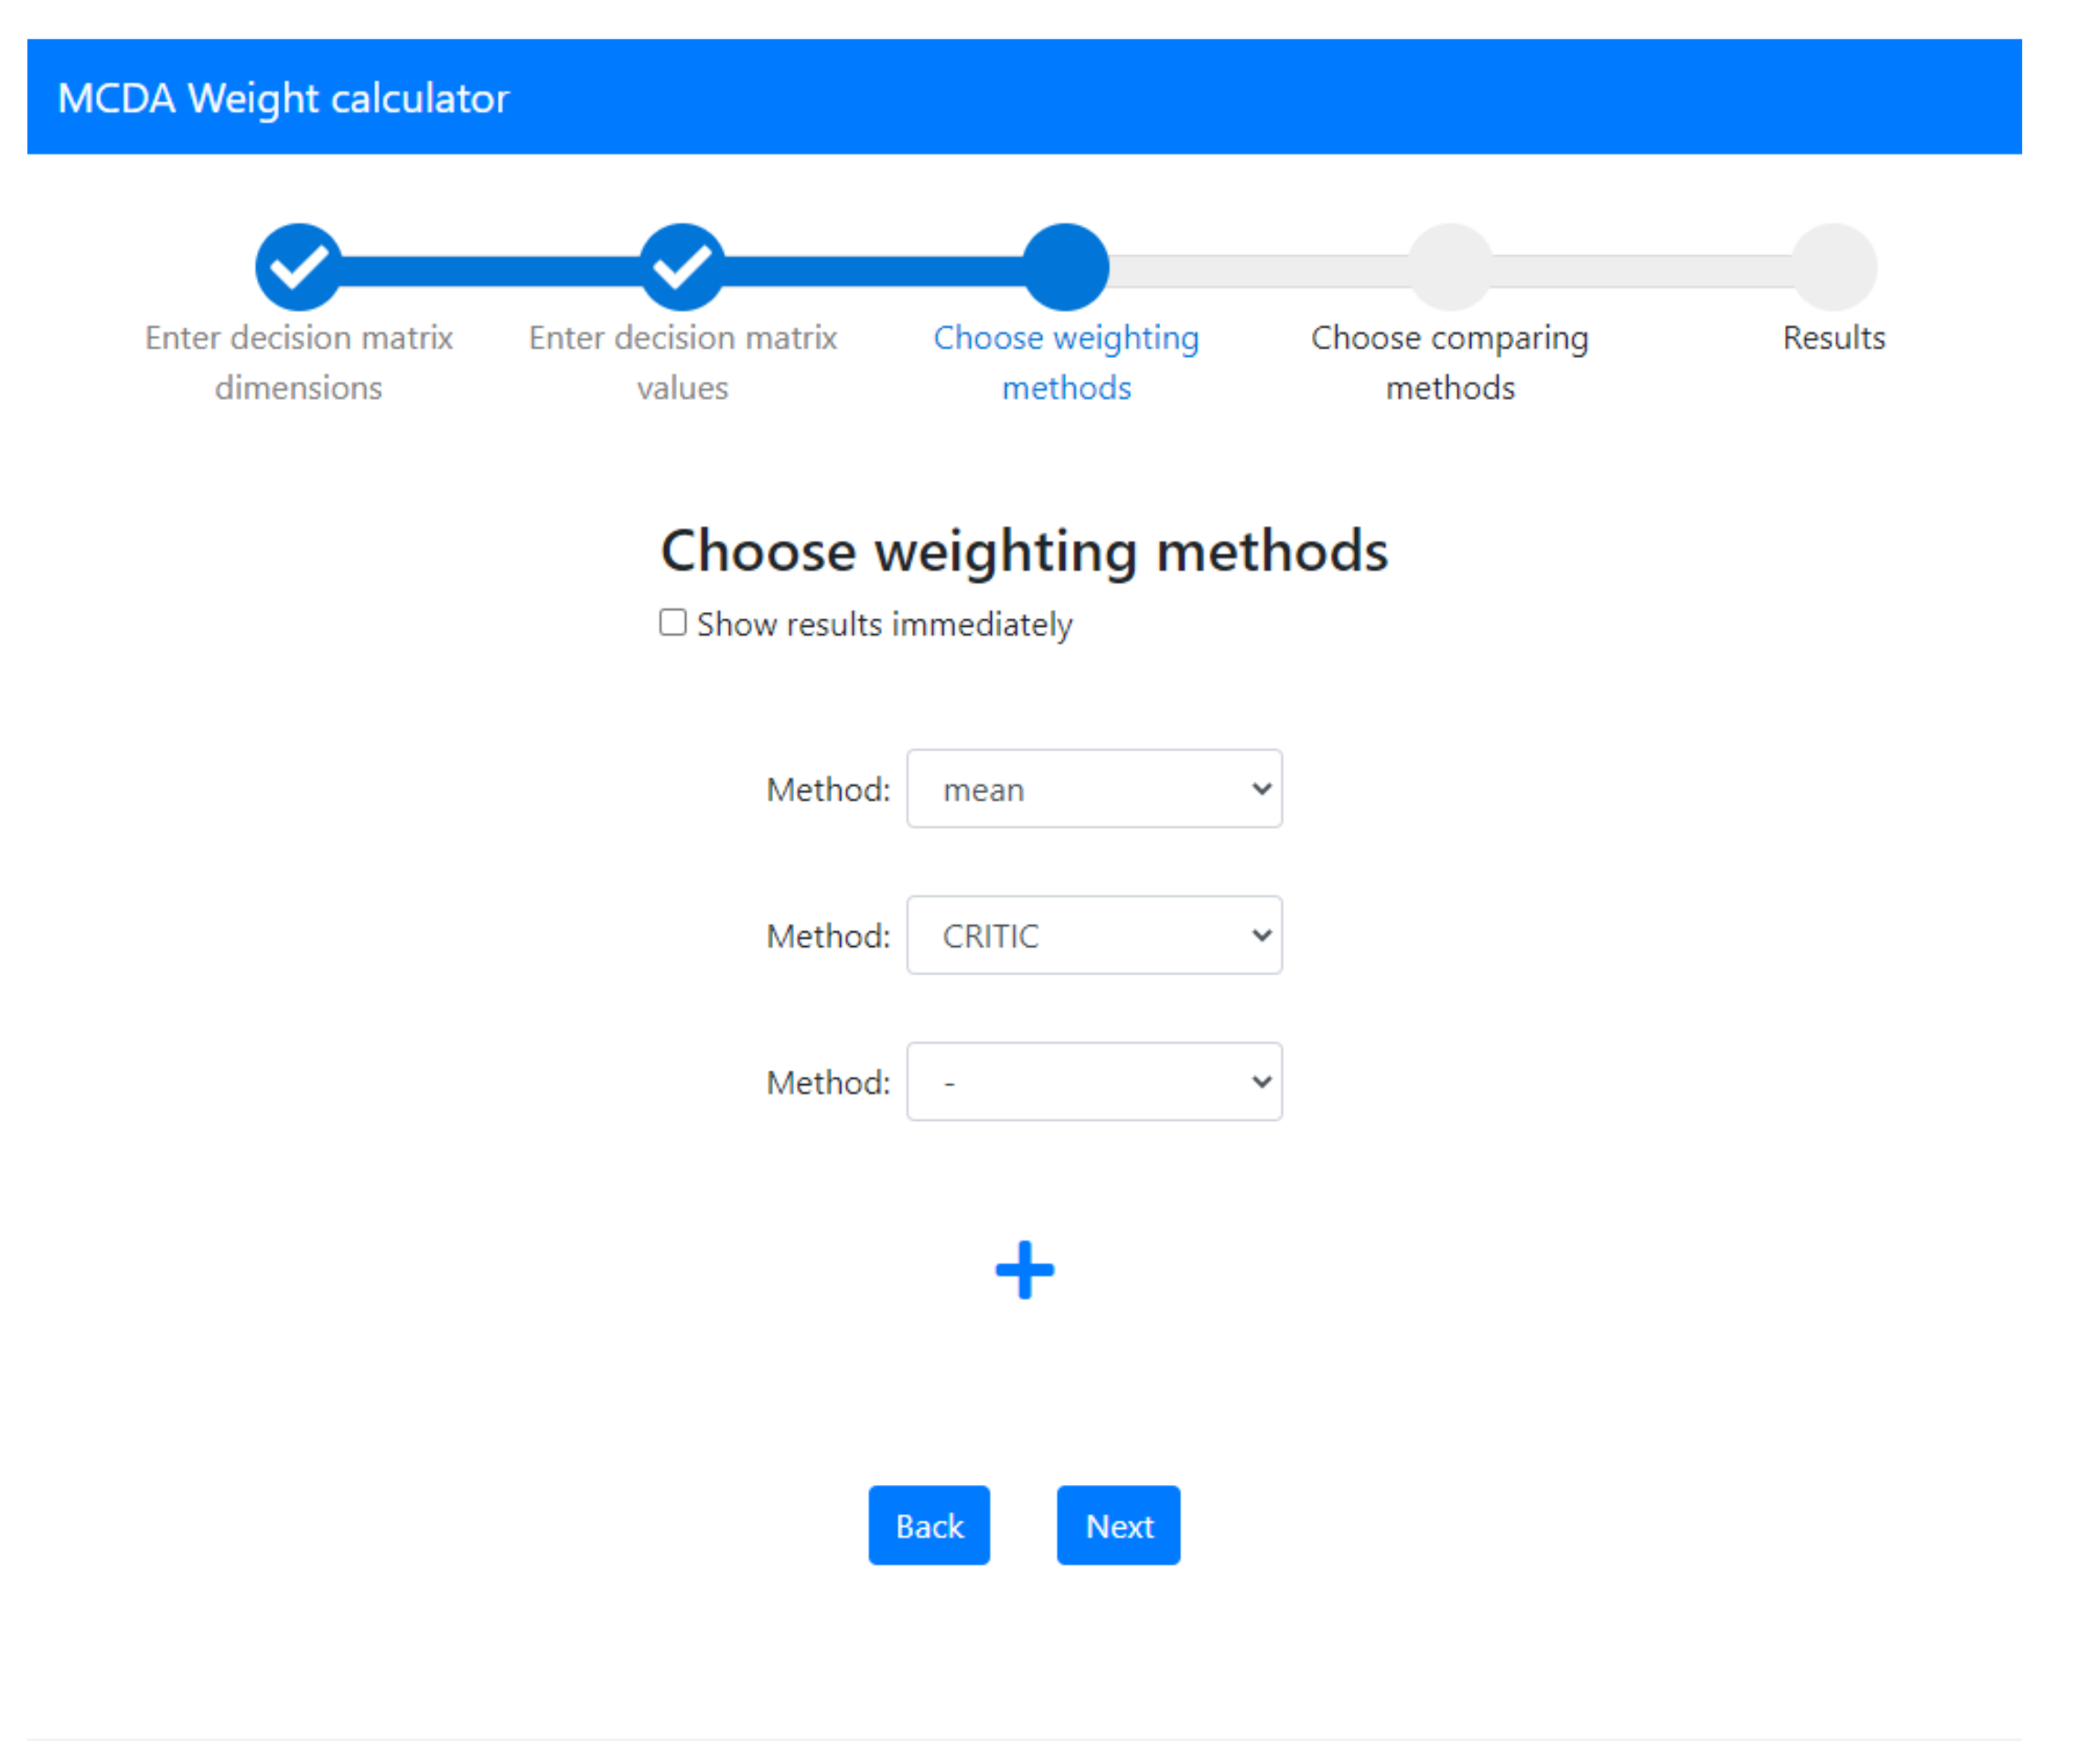
4.3. Flow of Application

The flow of the application is designed in a minimalist style, so it is easy to navigate on the website. Every functionality provided by this system is reachable with the first look at the page. In addition, a Stepper mechanism was implemented to show the user the appropriate steps needed to reach expected results.
Step 1. First, Figure 4 presents an initial screen where the user needs to enter dimensions of the decision matrix. If a user enters values that are not supported, an appropriate message is displayed in real-time.
Step 2. Afterward, the page shown in Figure 5 is intended for entering decision matrix values and the type of each criterion. The values can be entered by hand or imported from an Excel or .csv file, but the type must be completed by hand. When a file is loaded correctly, the appropriate message is displayed, which applies to possible errors.
Step 3.Figure 6 presents the next screen, which is for selecting weighting methods. Users can add them one by one and choose which one should be computed. There is a possibility of showing results immediately for a given method, which shows the value for each criterion. After that, an identical screen was designed for choosing comparison methods. Similarly, the results are shown immediately.
Step 4. The last screen displayed in Figure 7 was created to merge the results of every step executed by a user. The results are shown in tables on this screen, so it is easier to compare by viewing them. Comparative methods were shown as correlation matrices to make the results easier to read. Users can easily go back to any previous stage using a stepper located in the top section of the page to choose different methods or change the decision matrix.

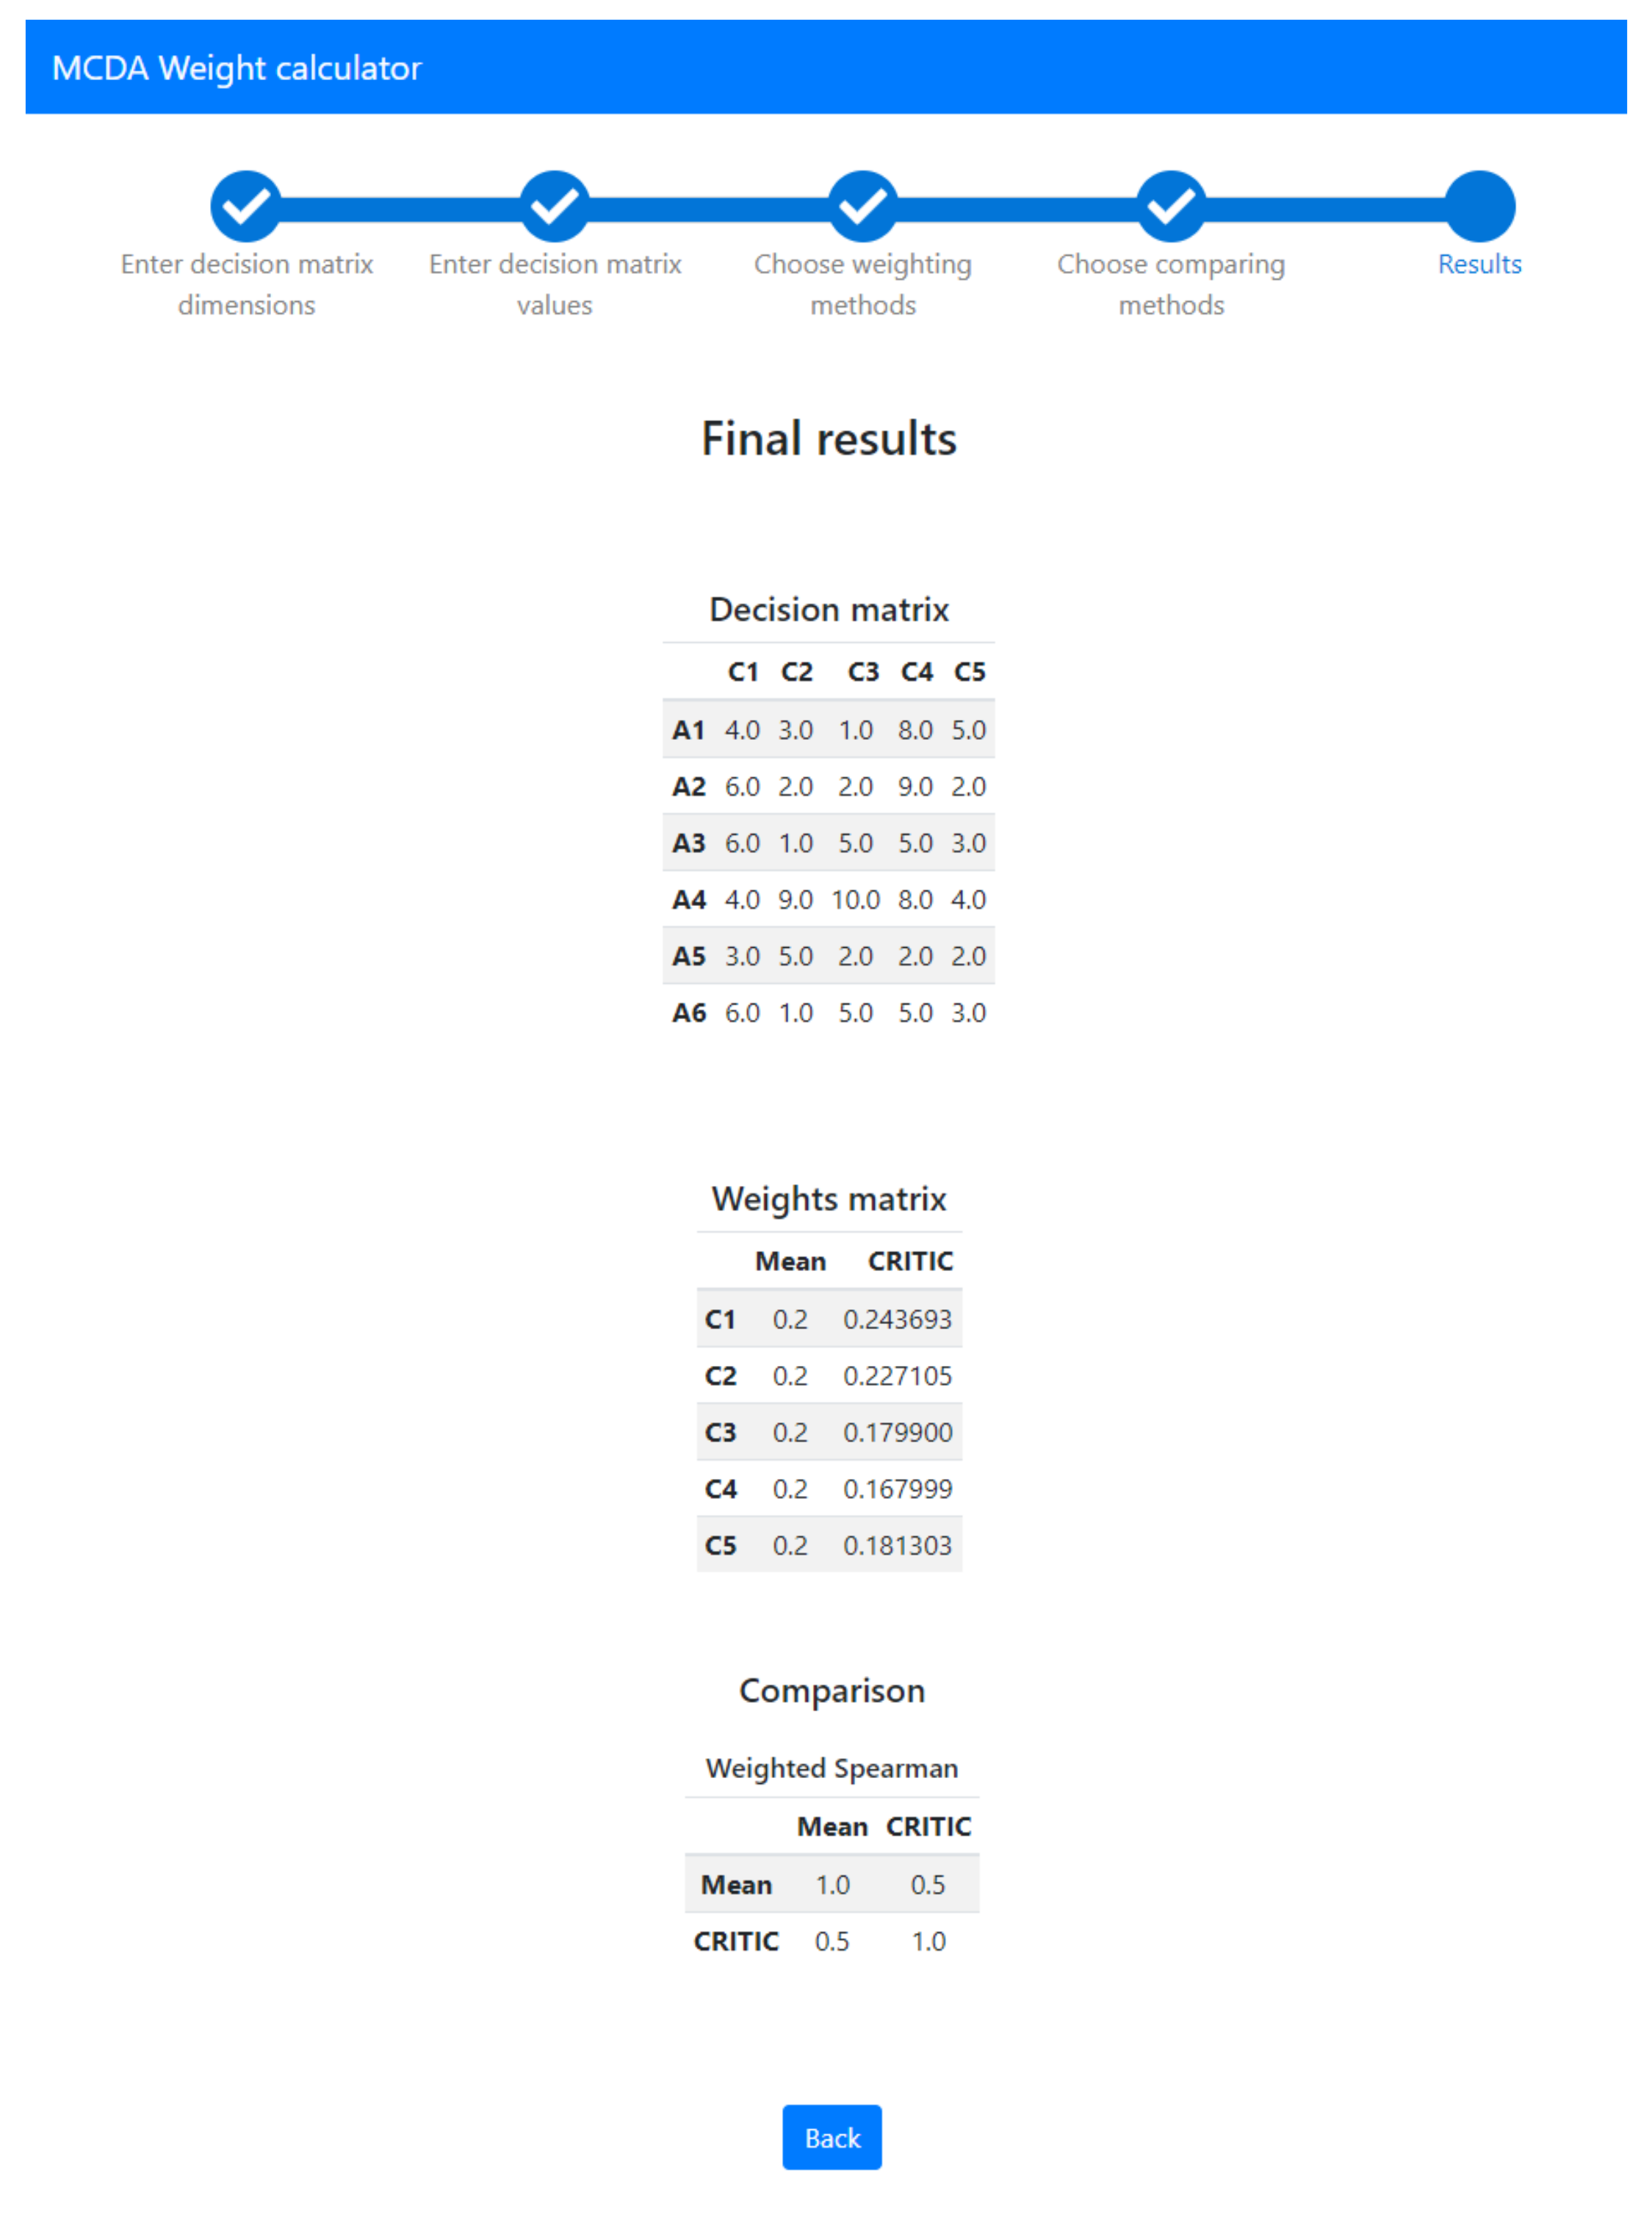
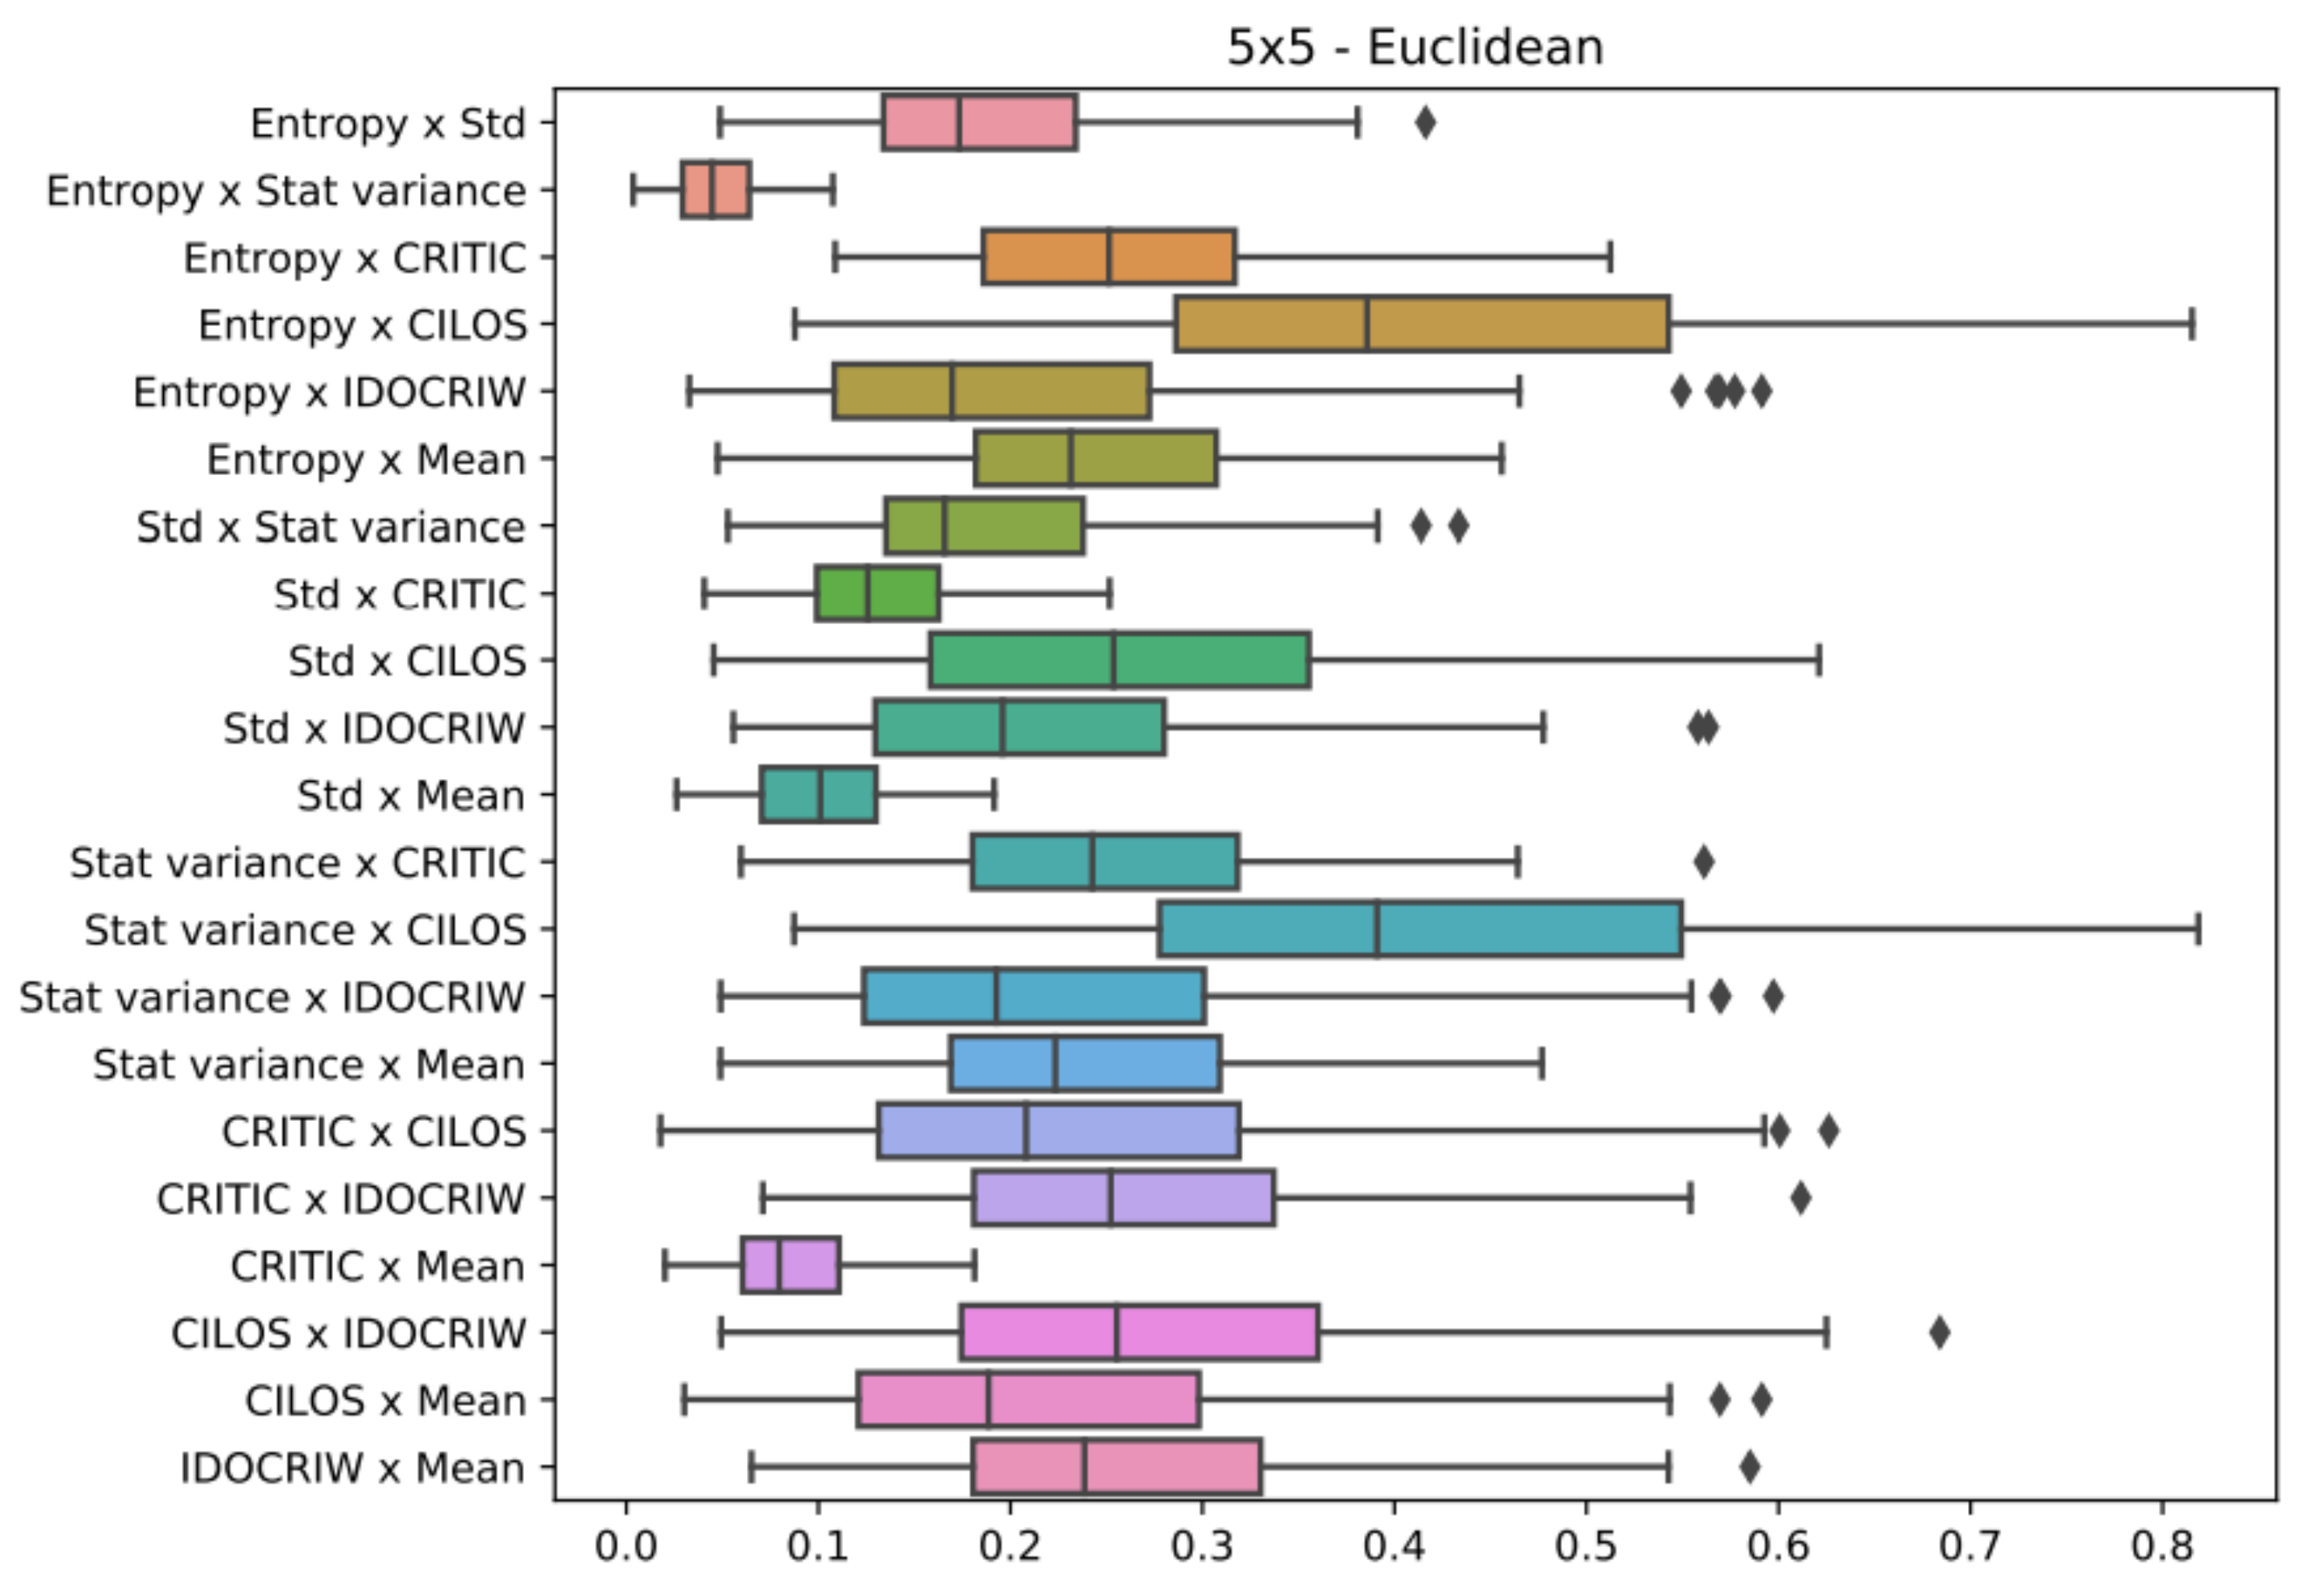
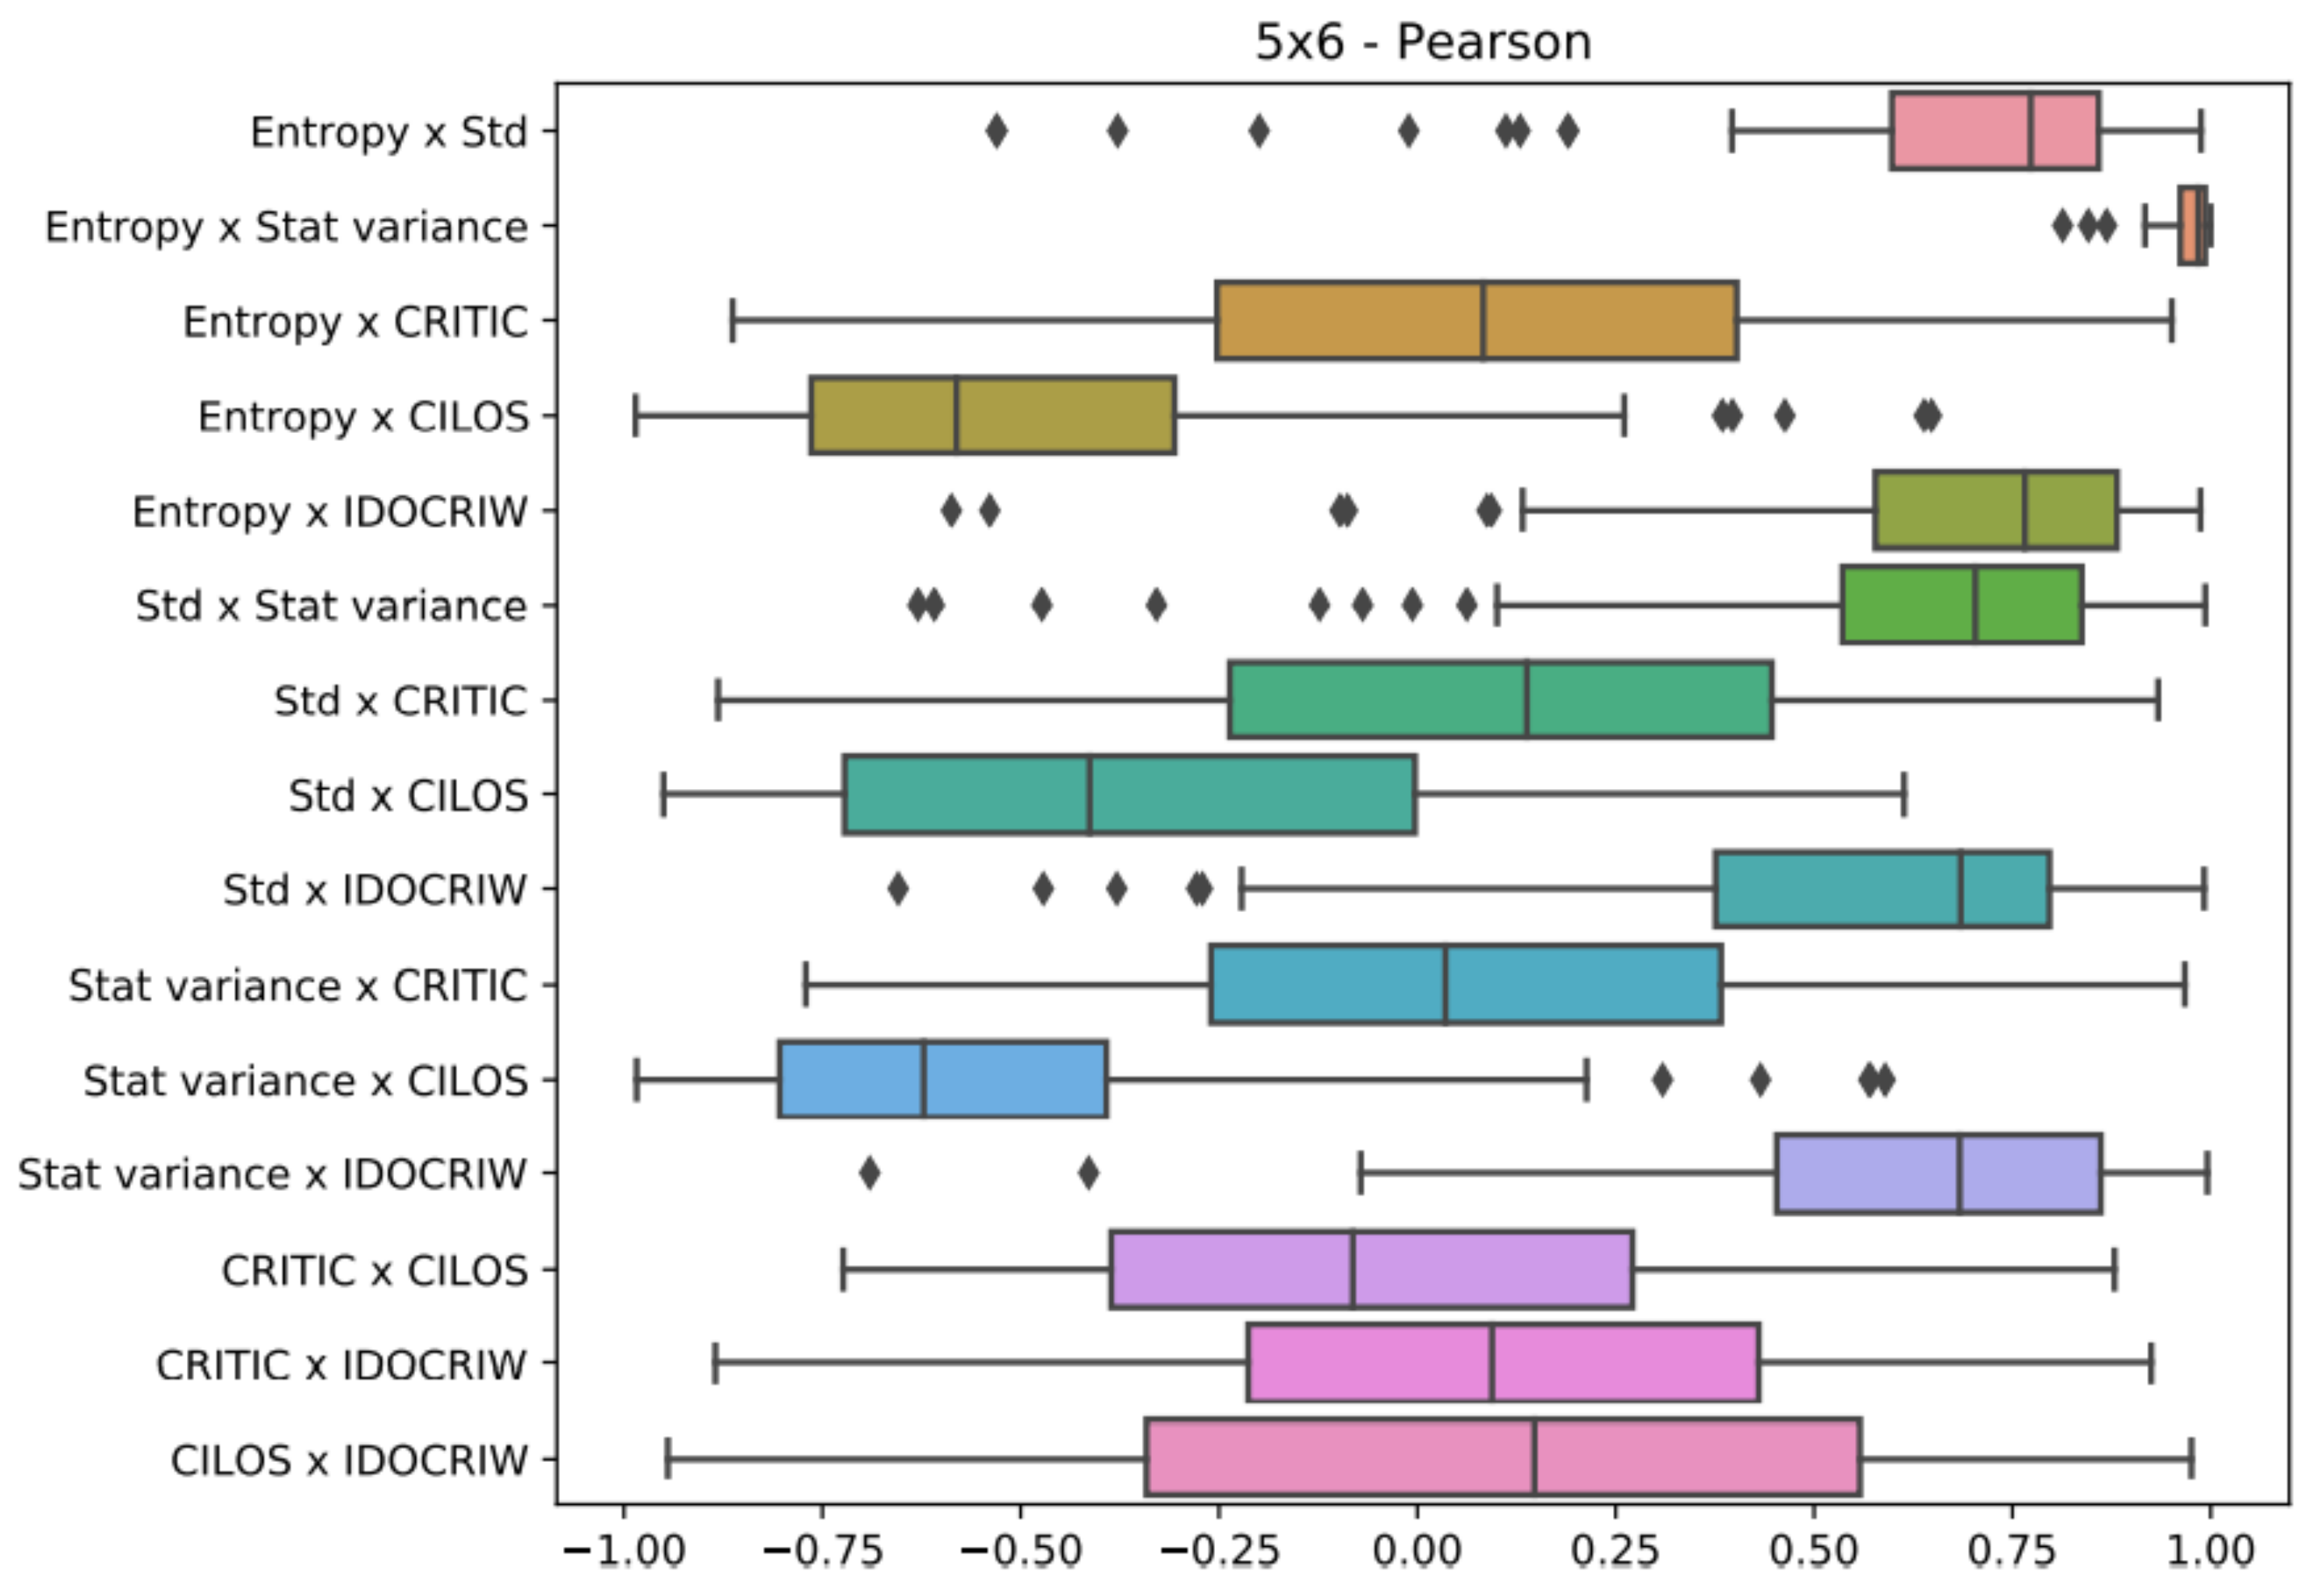
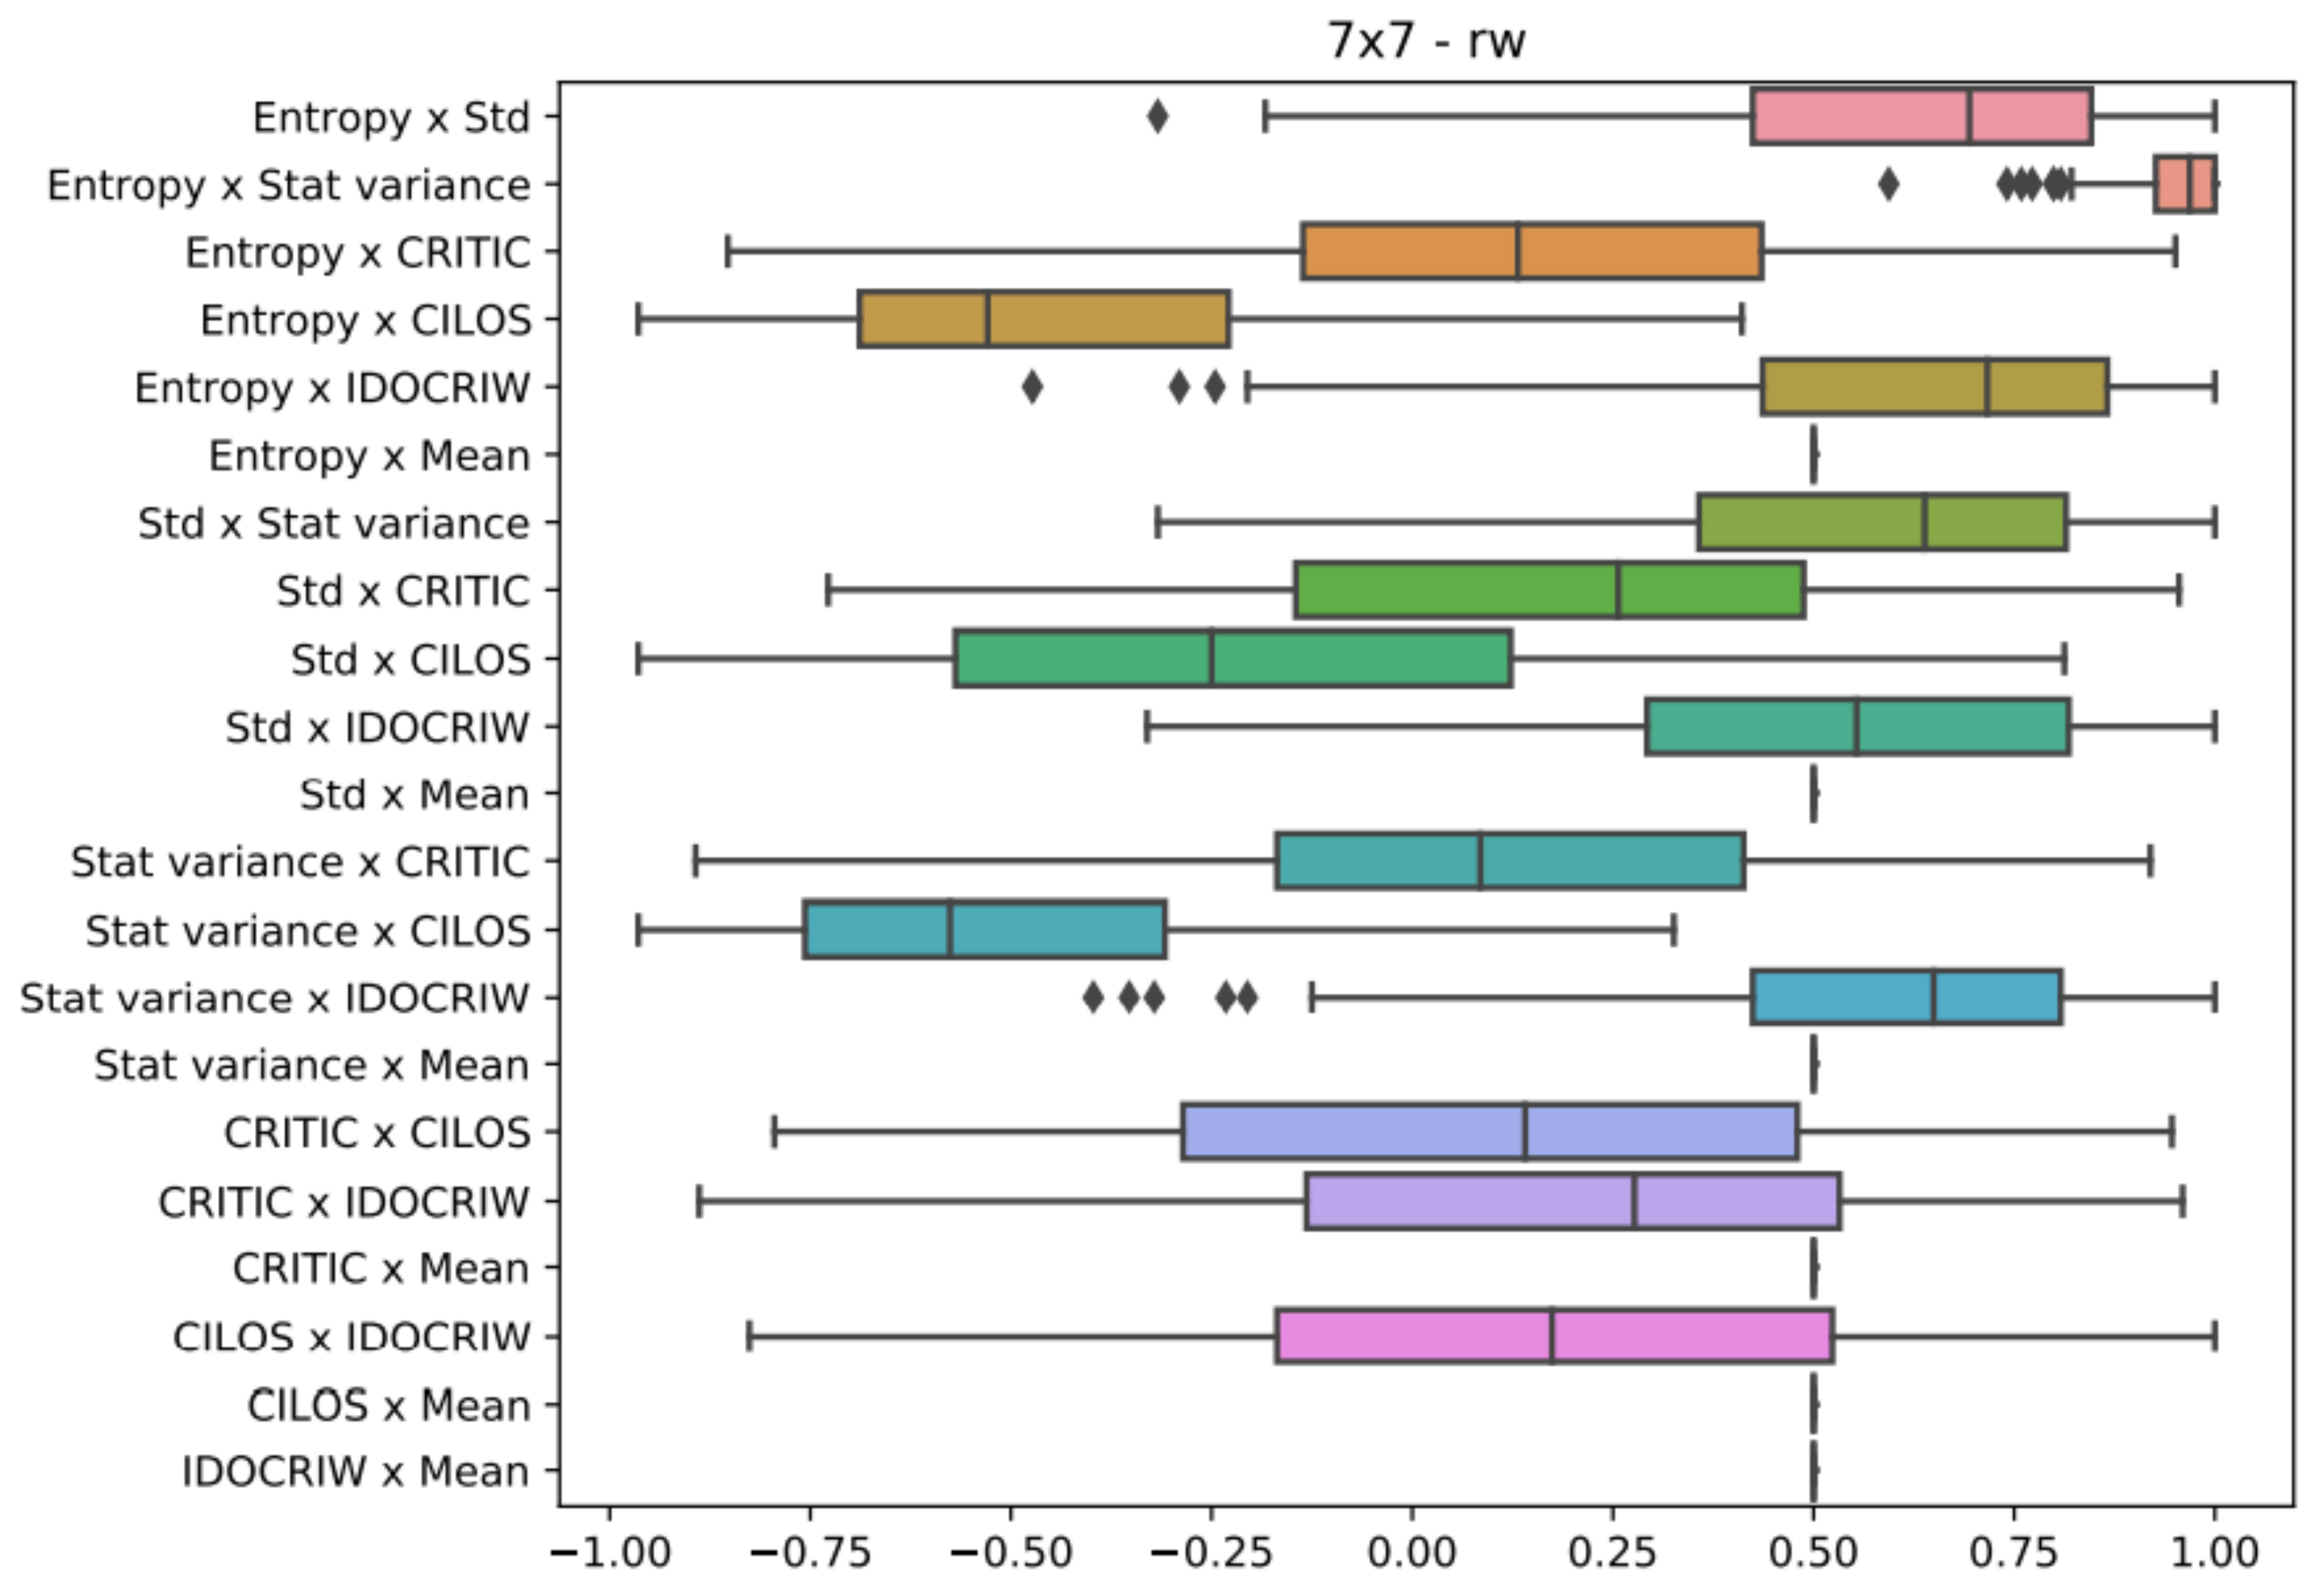
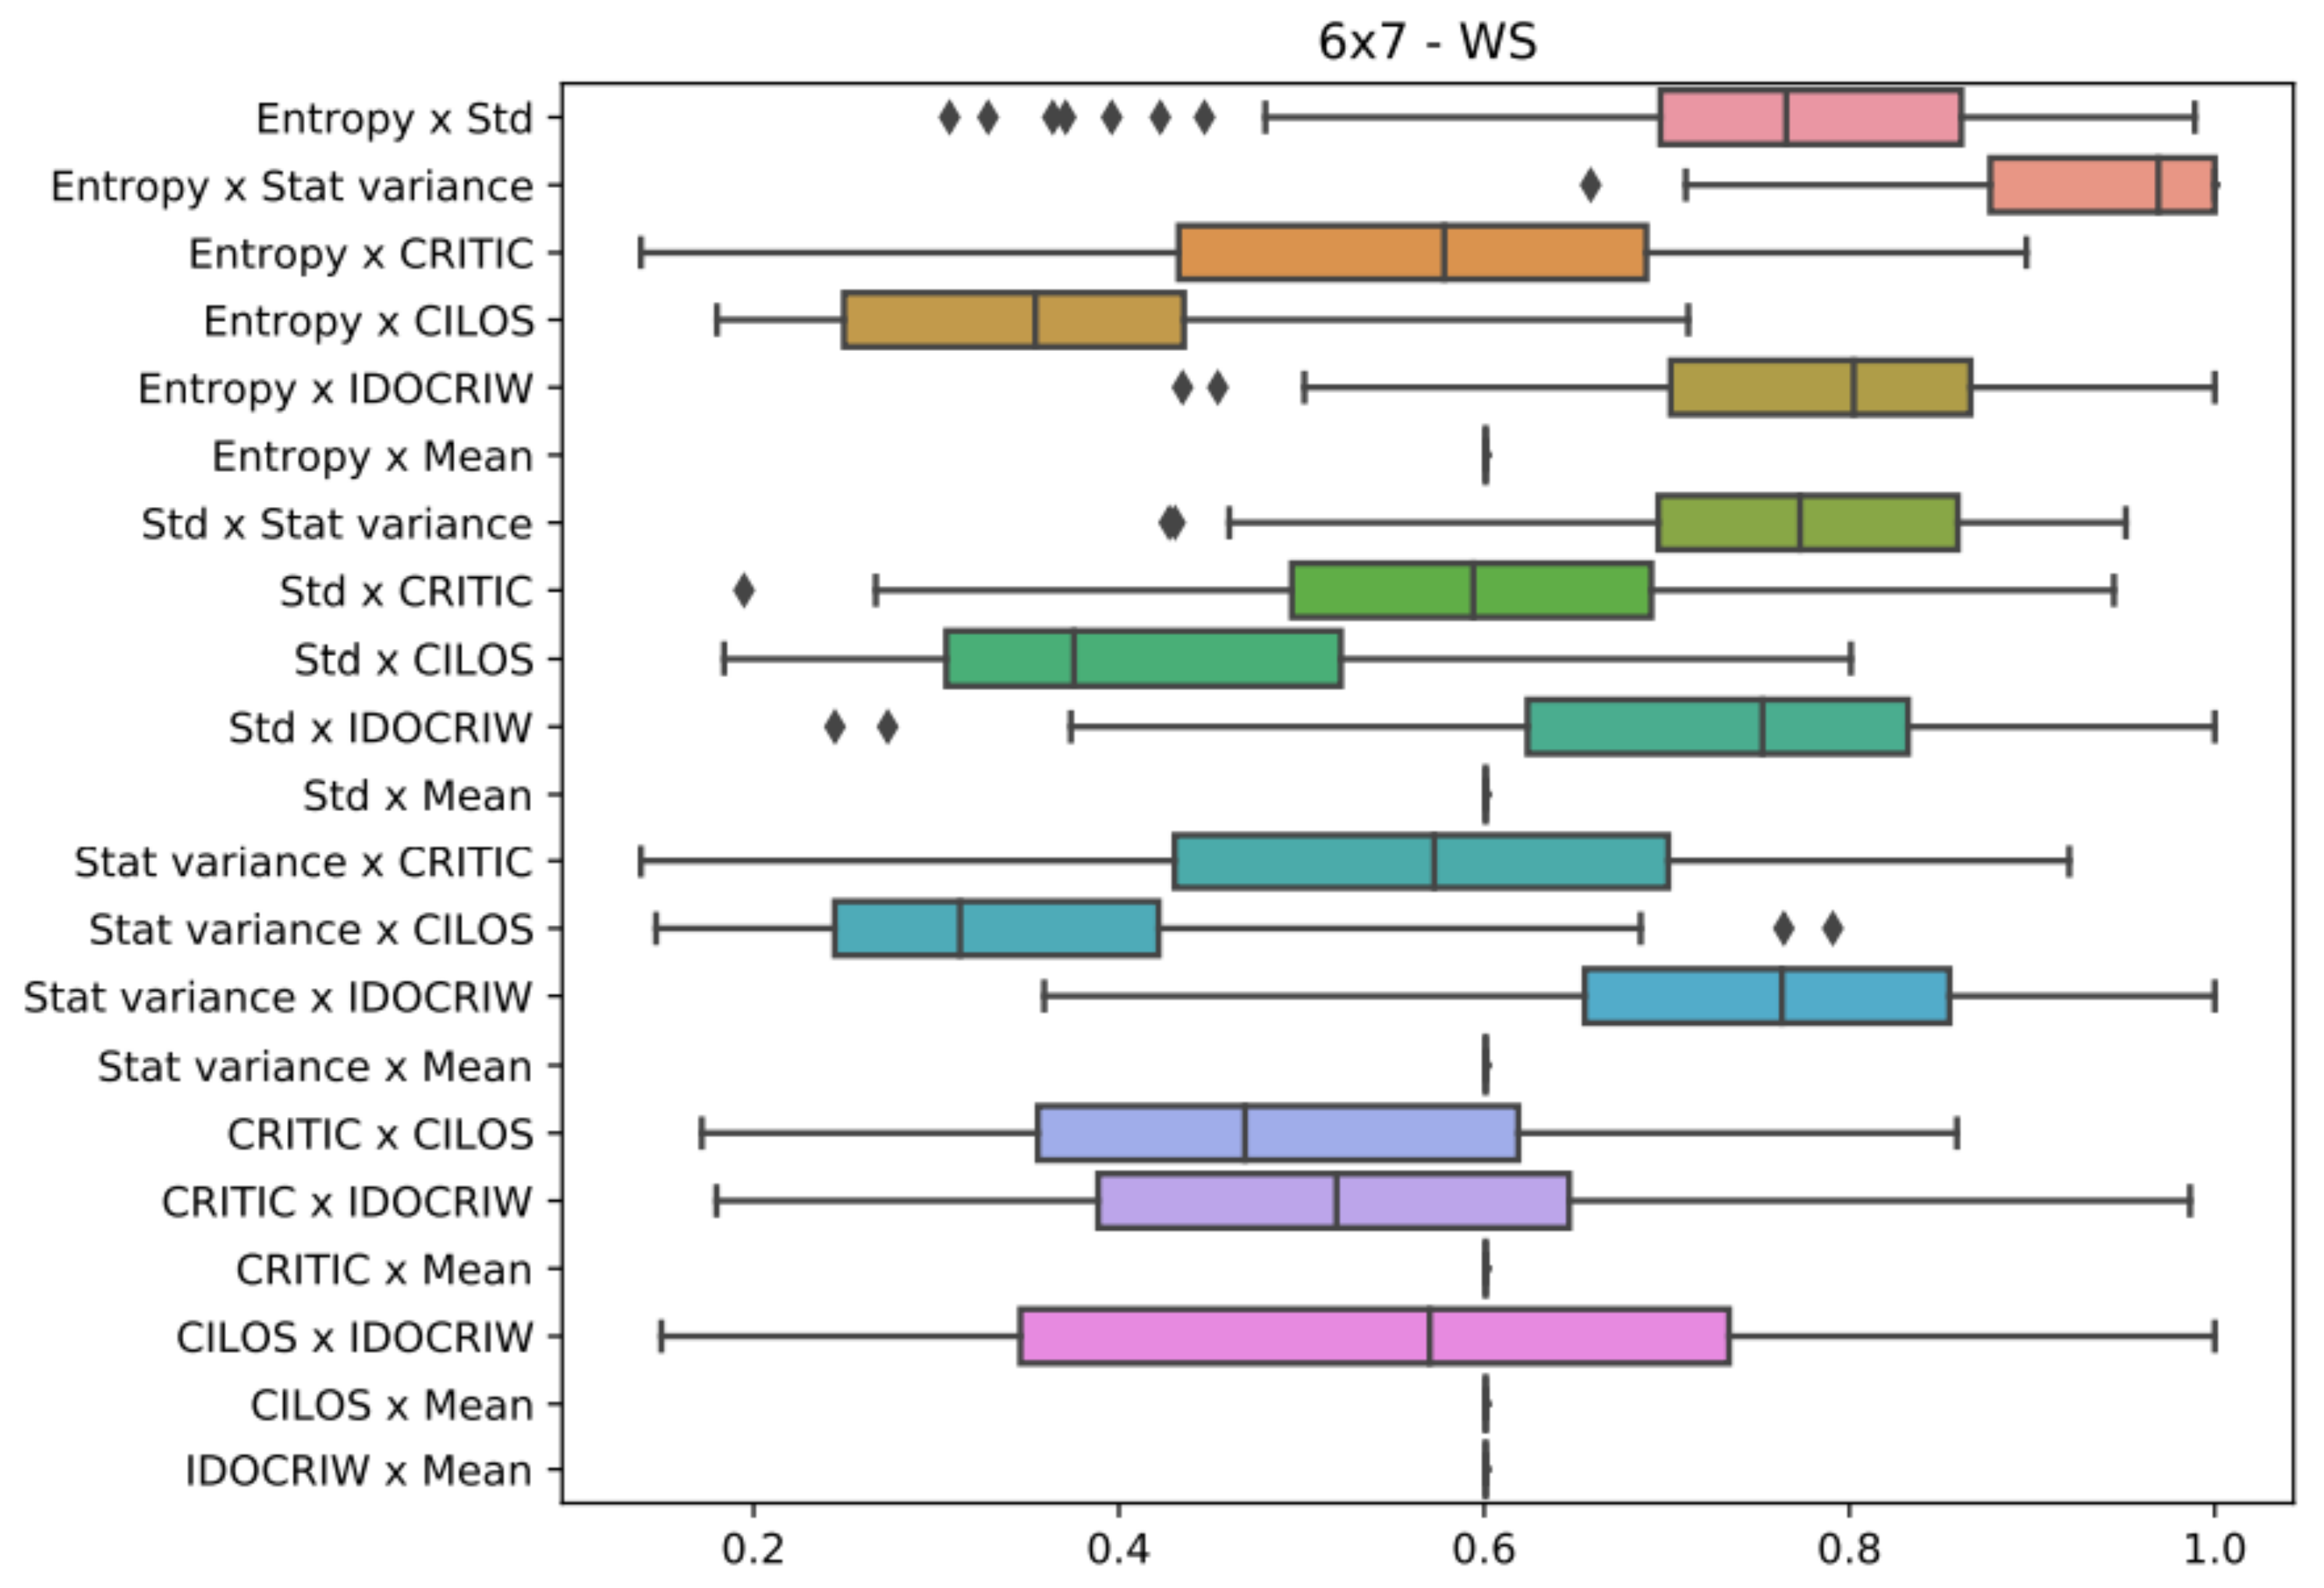
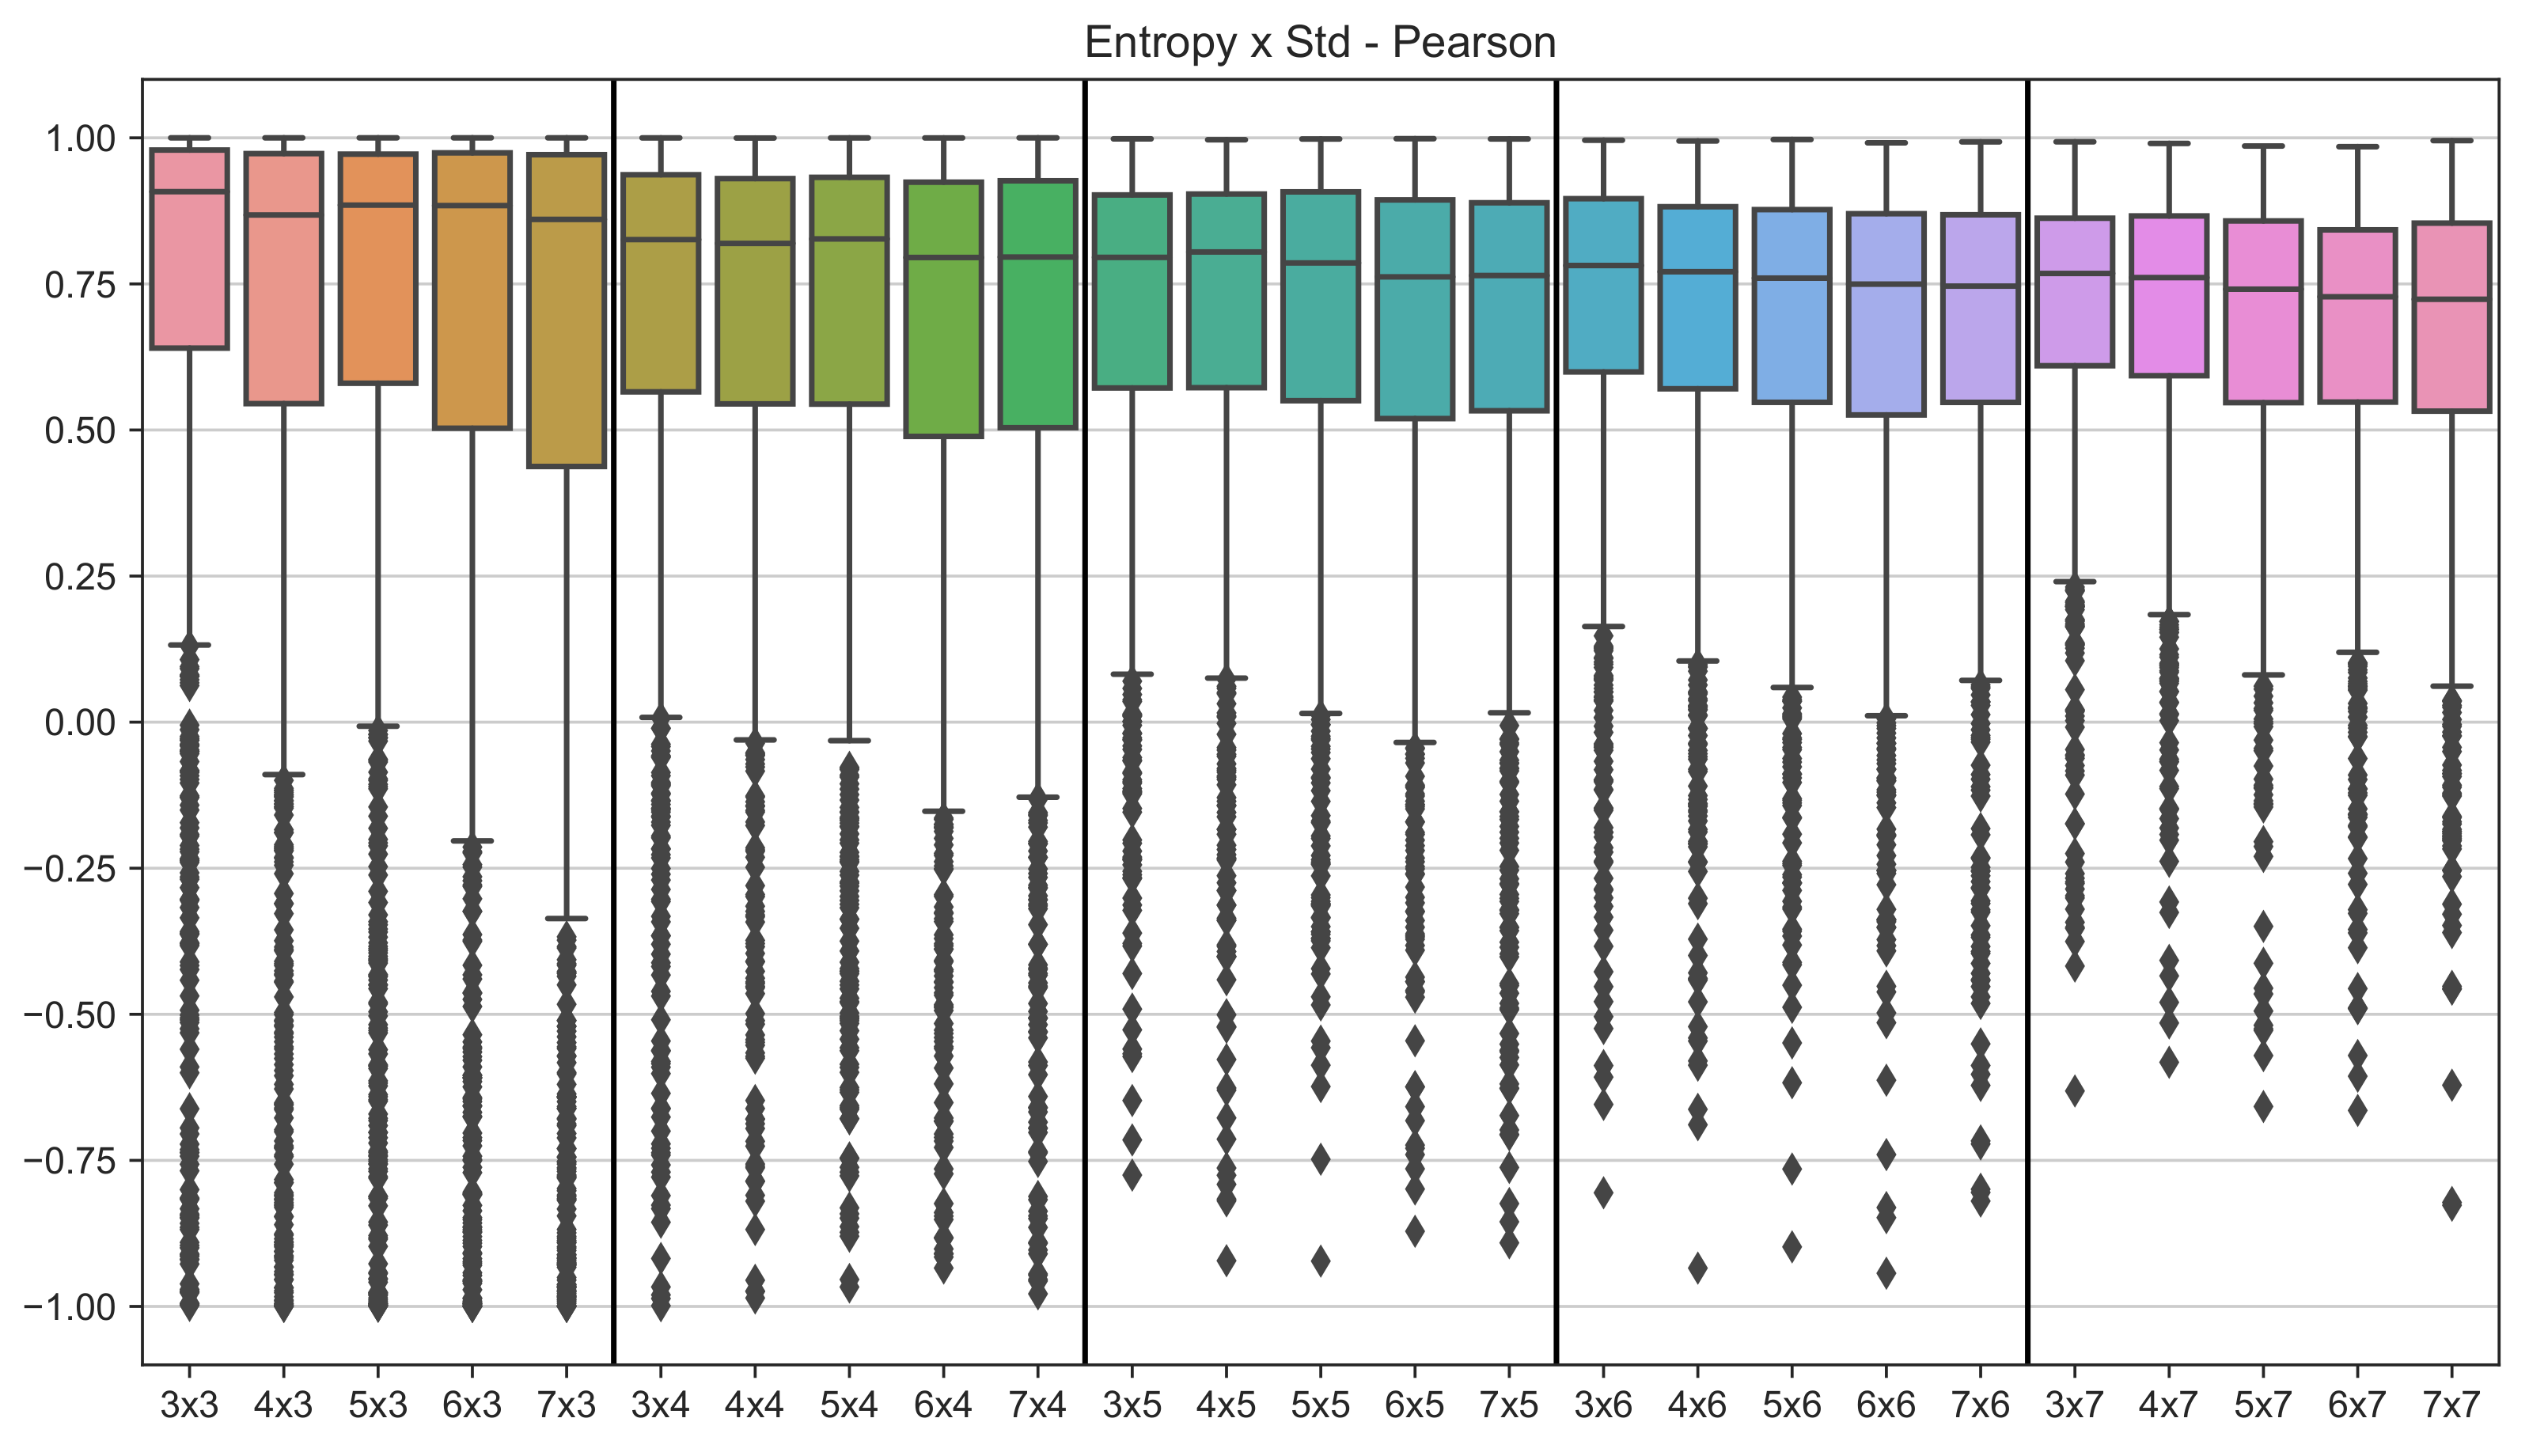
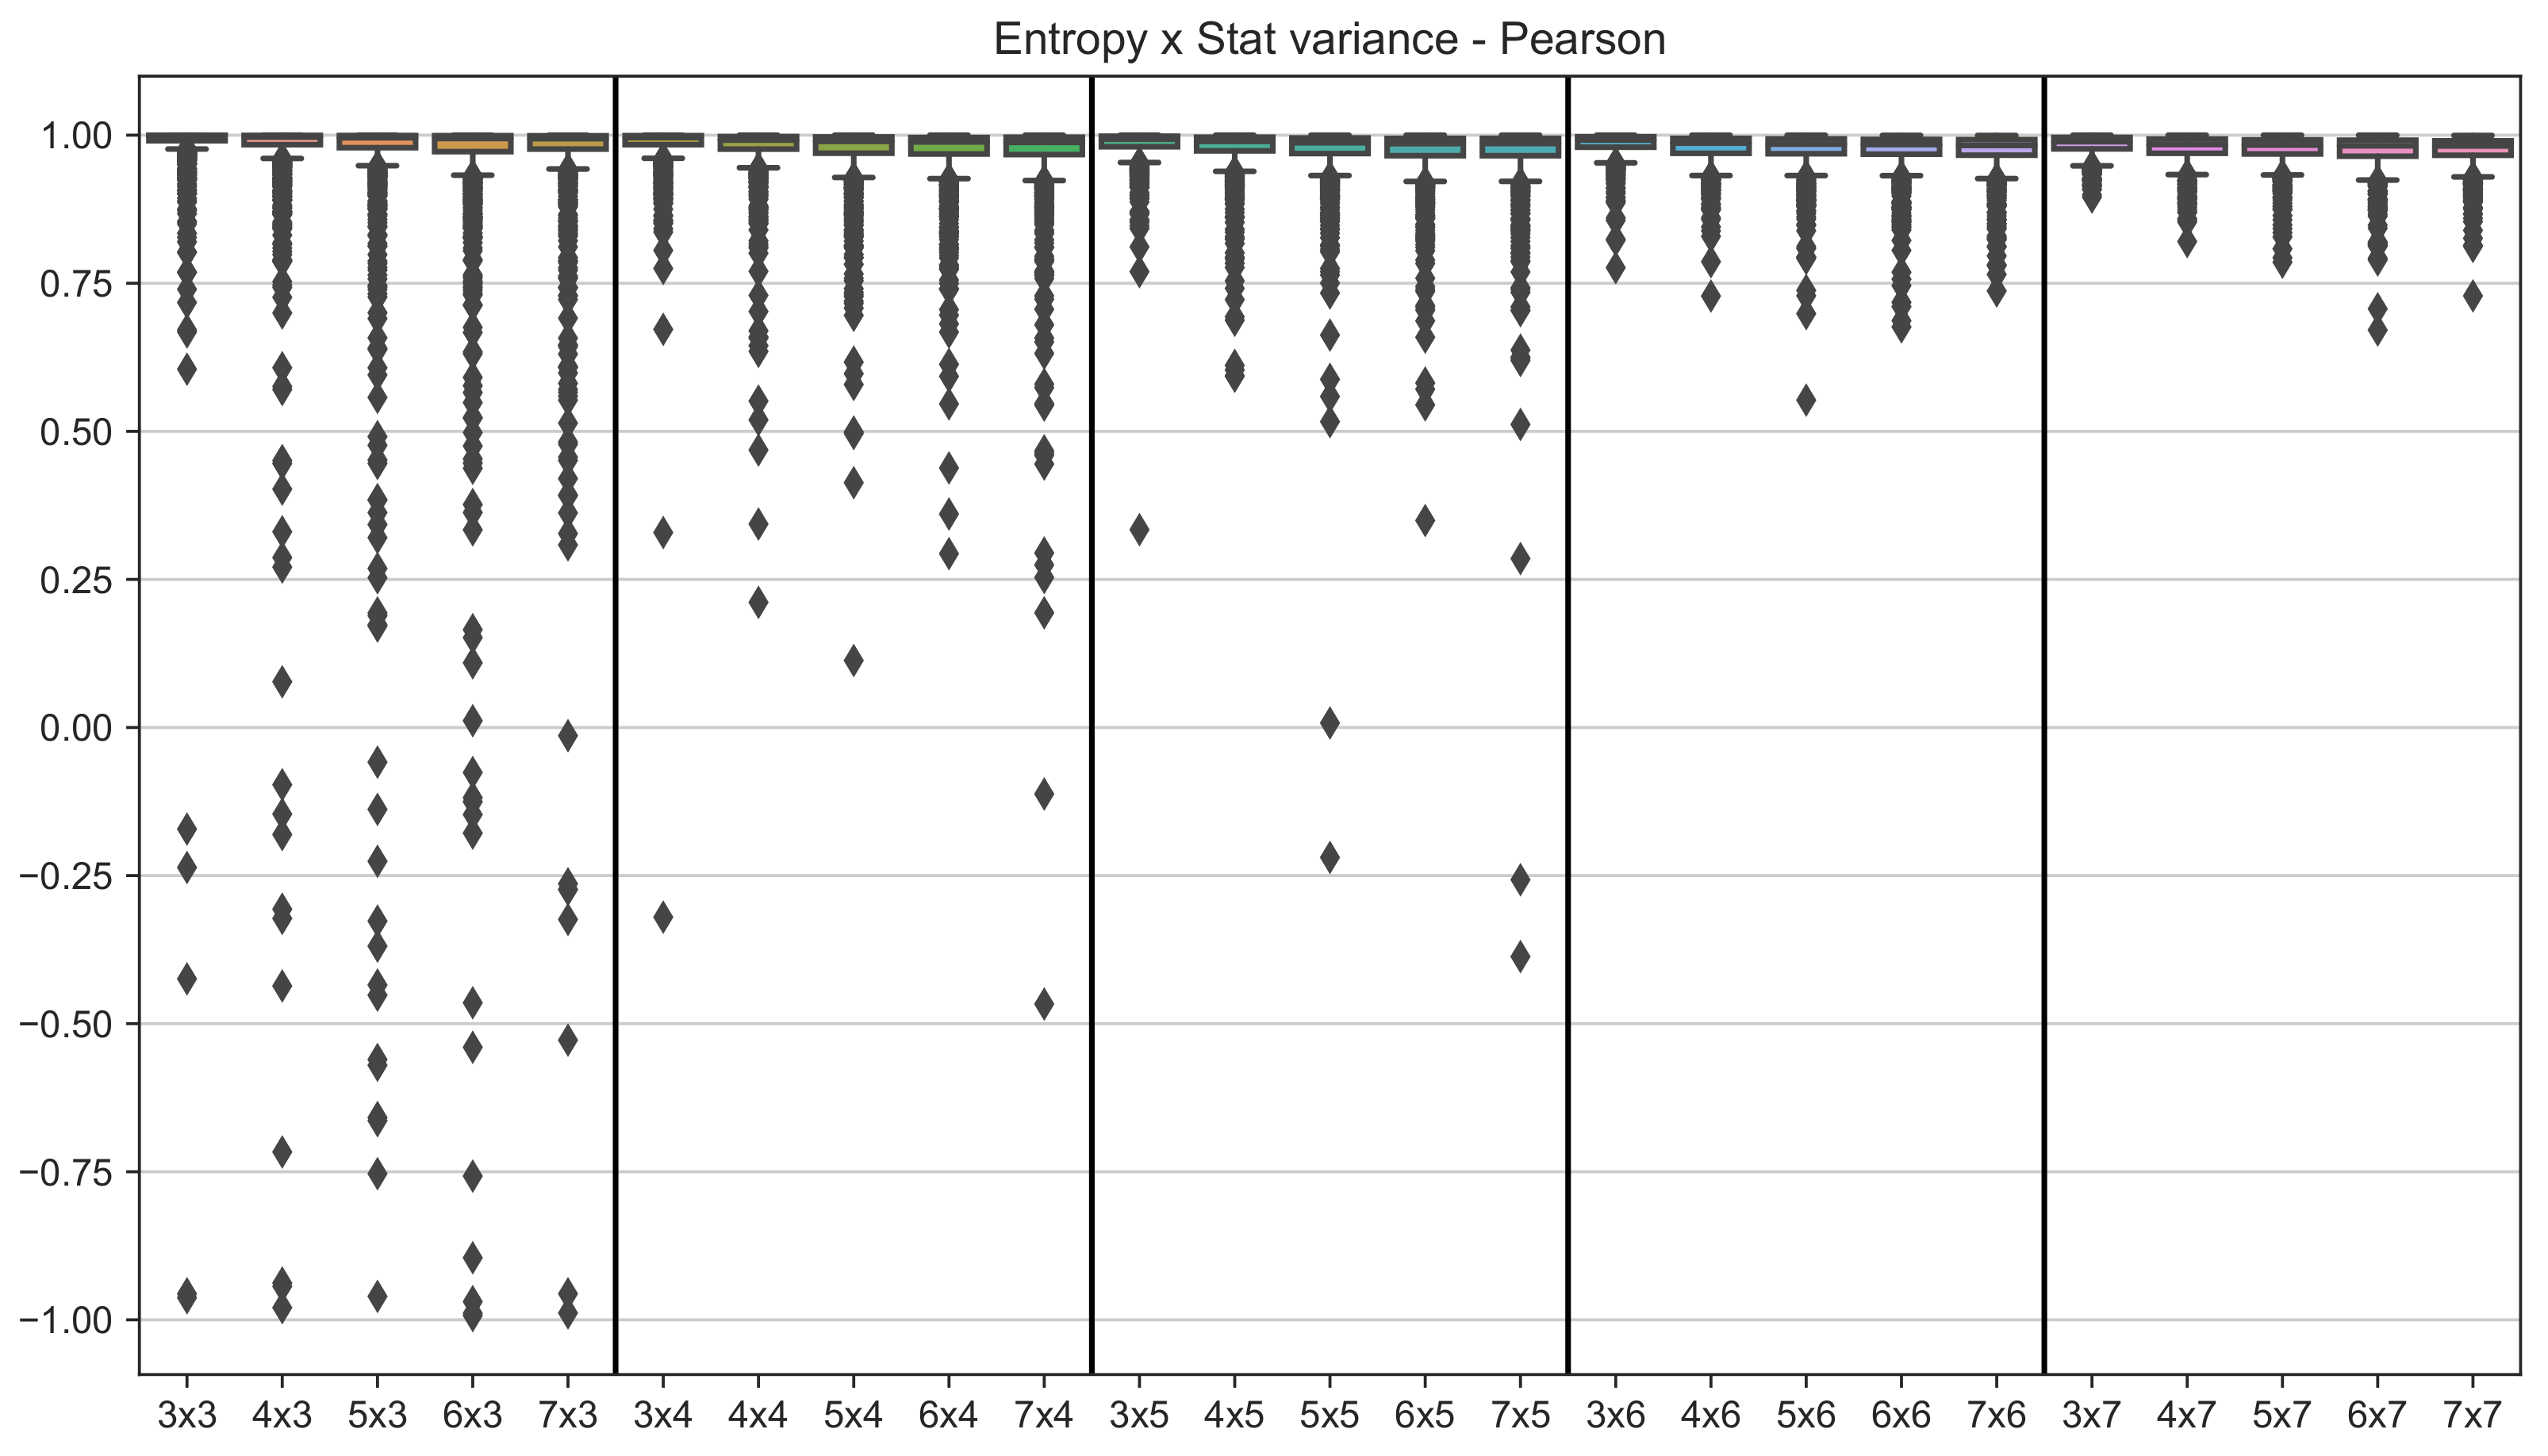
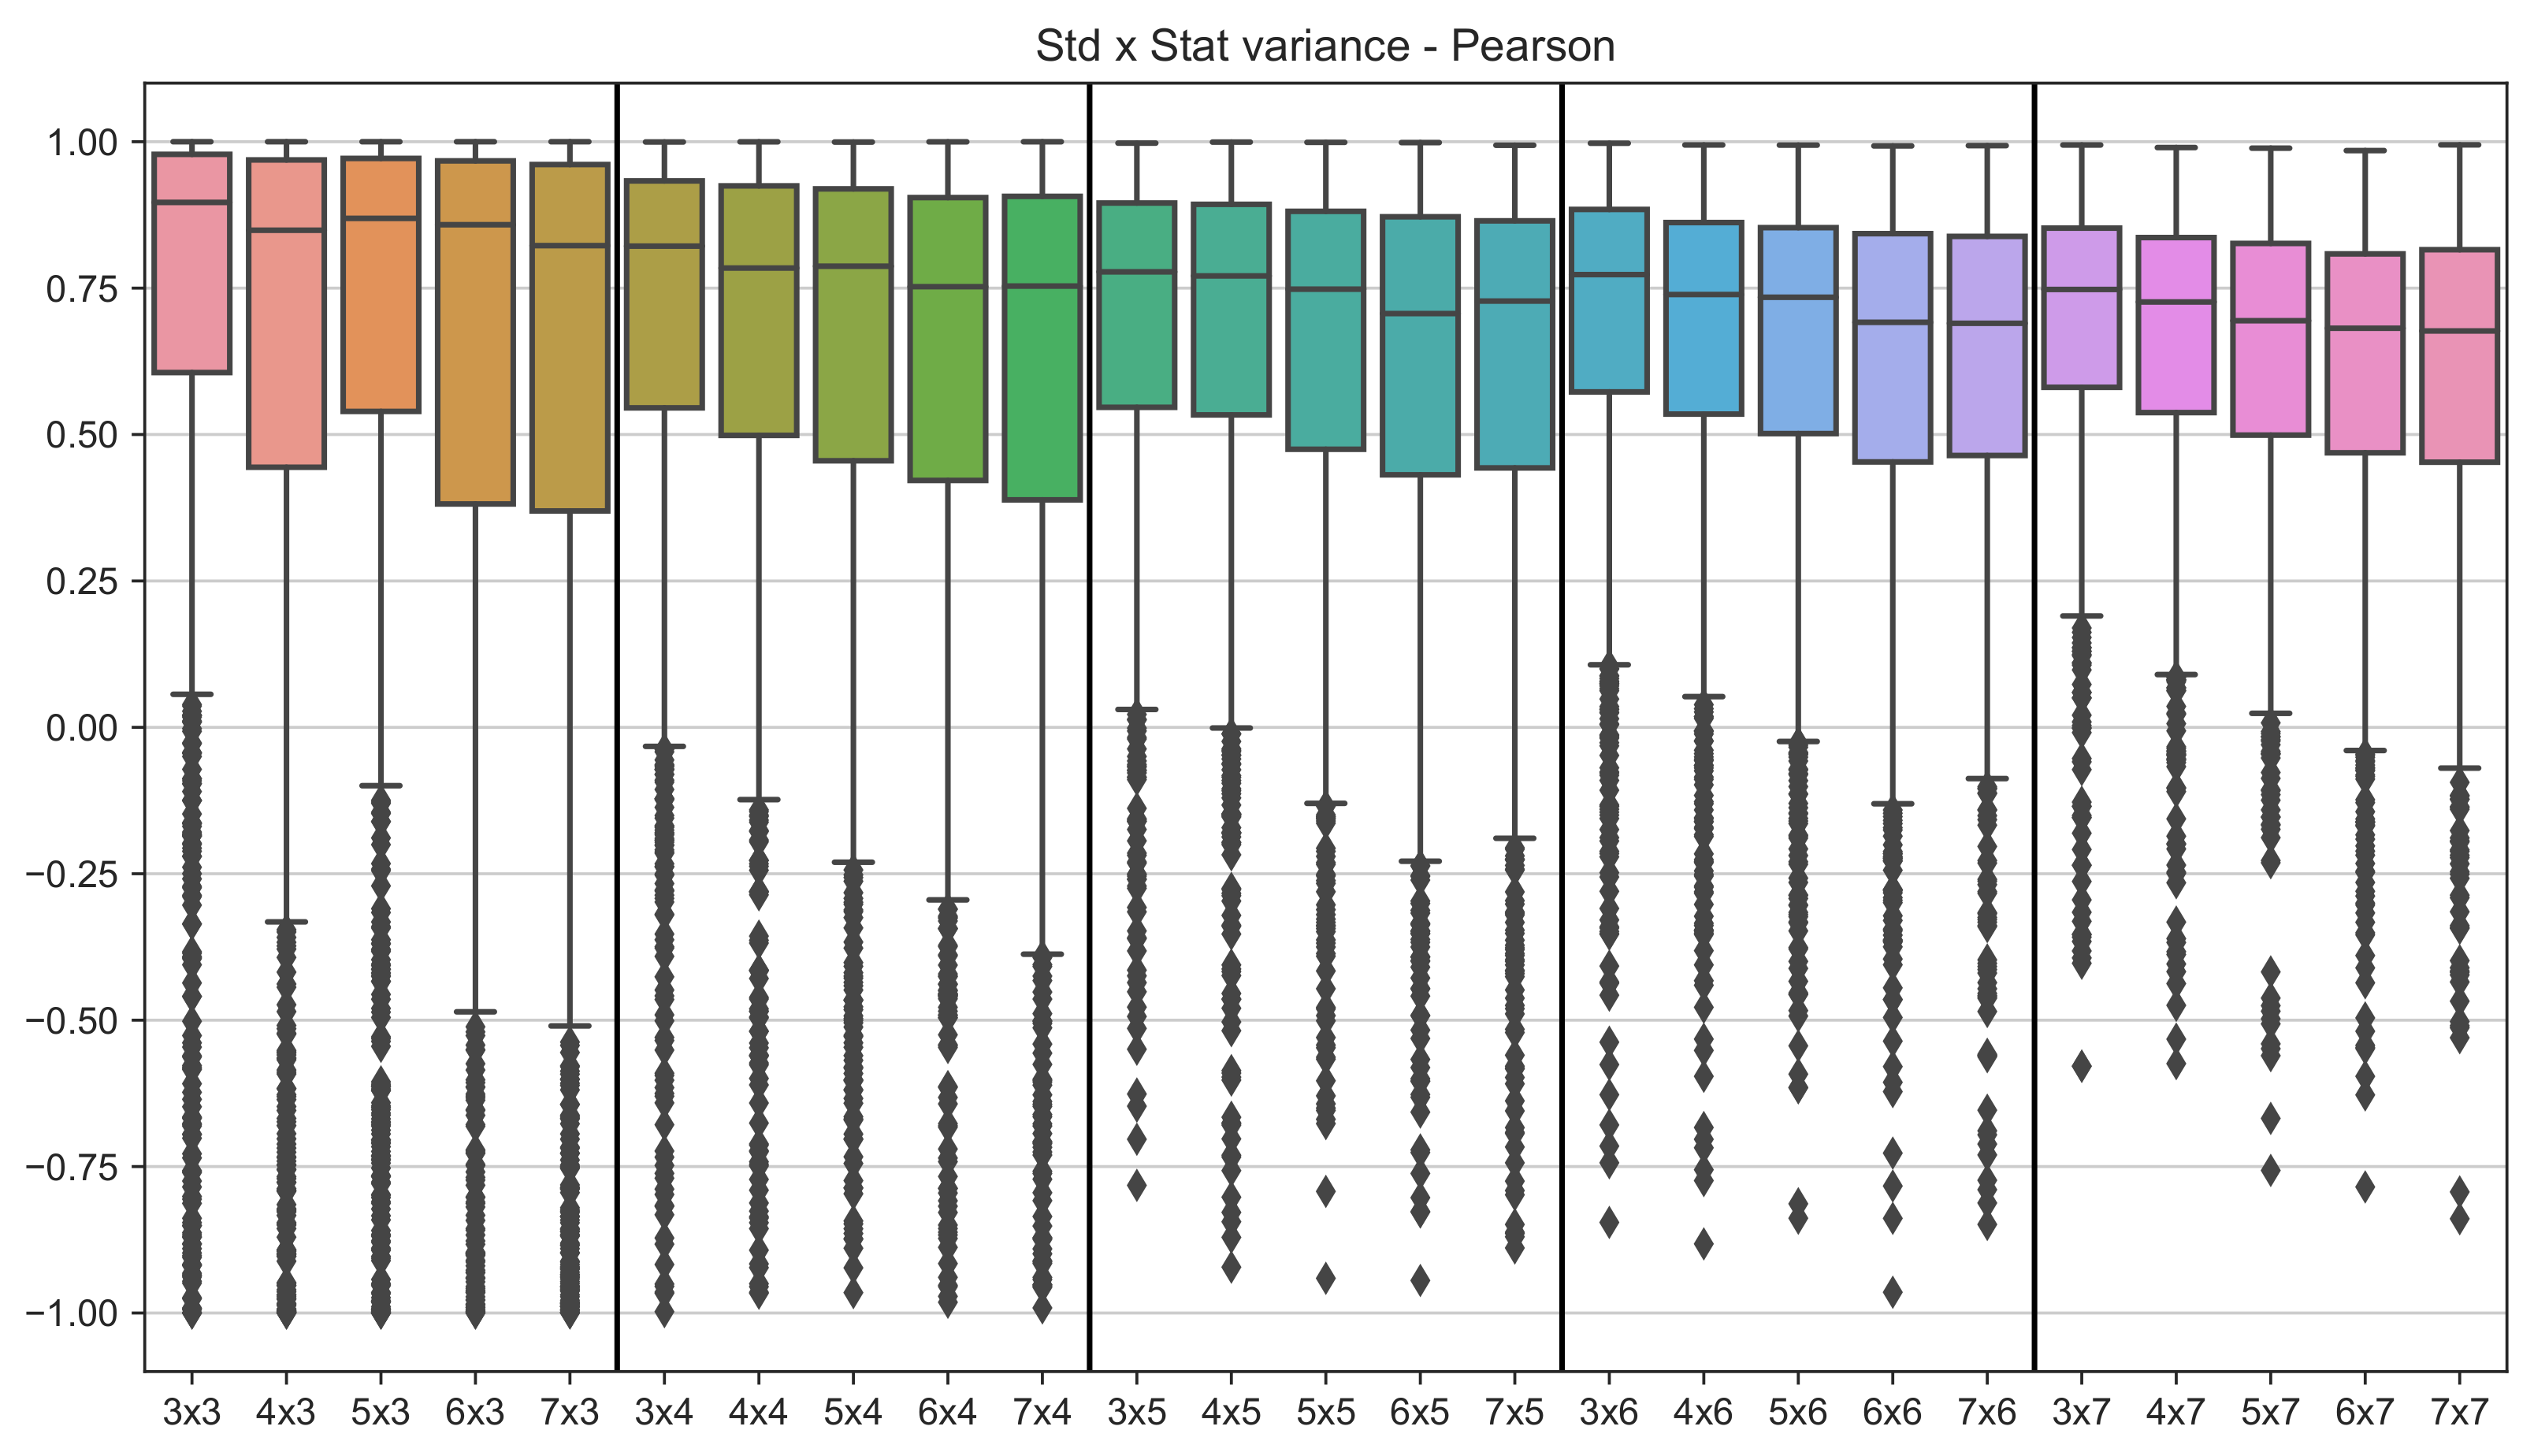
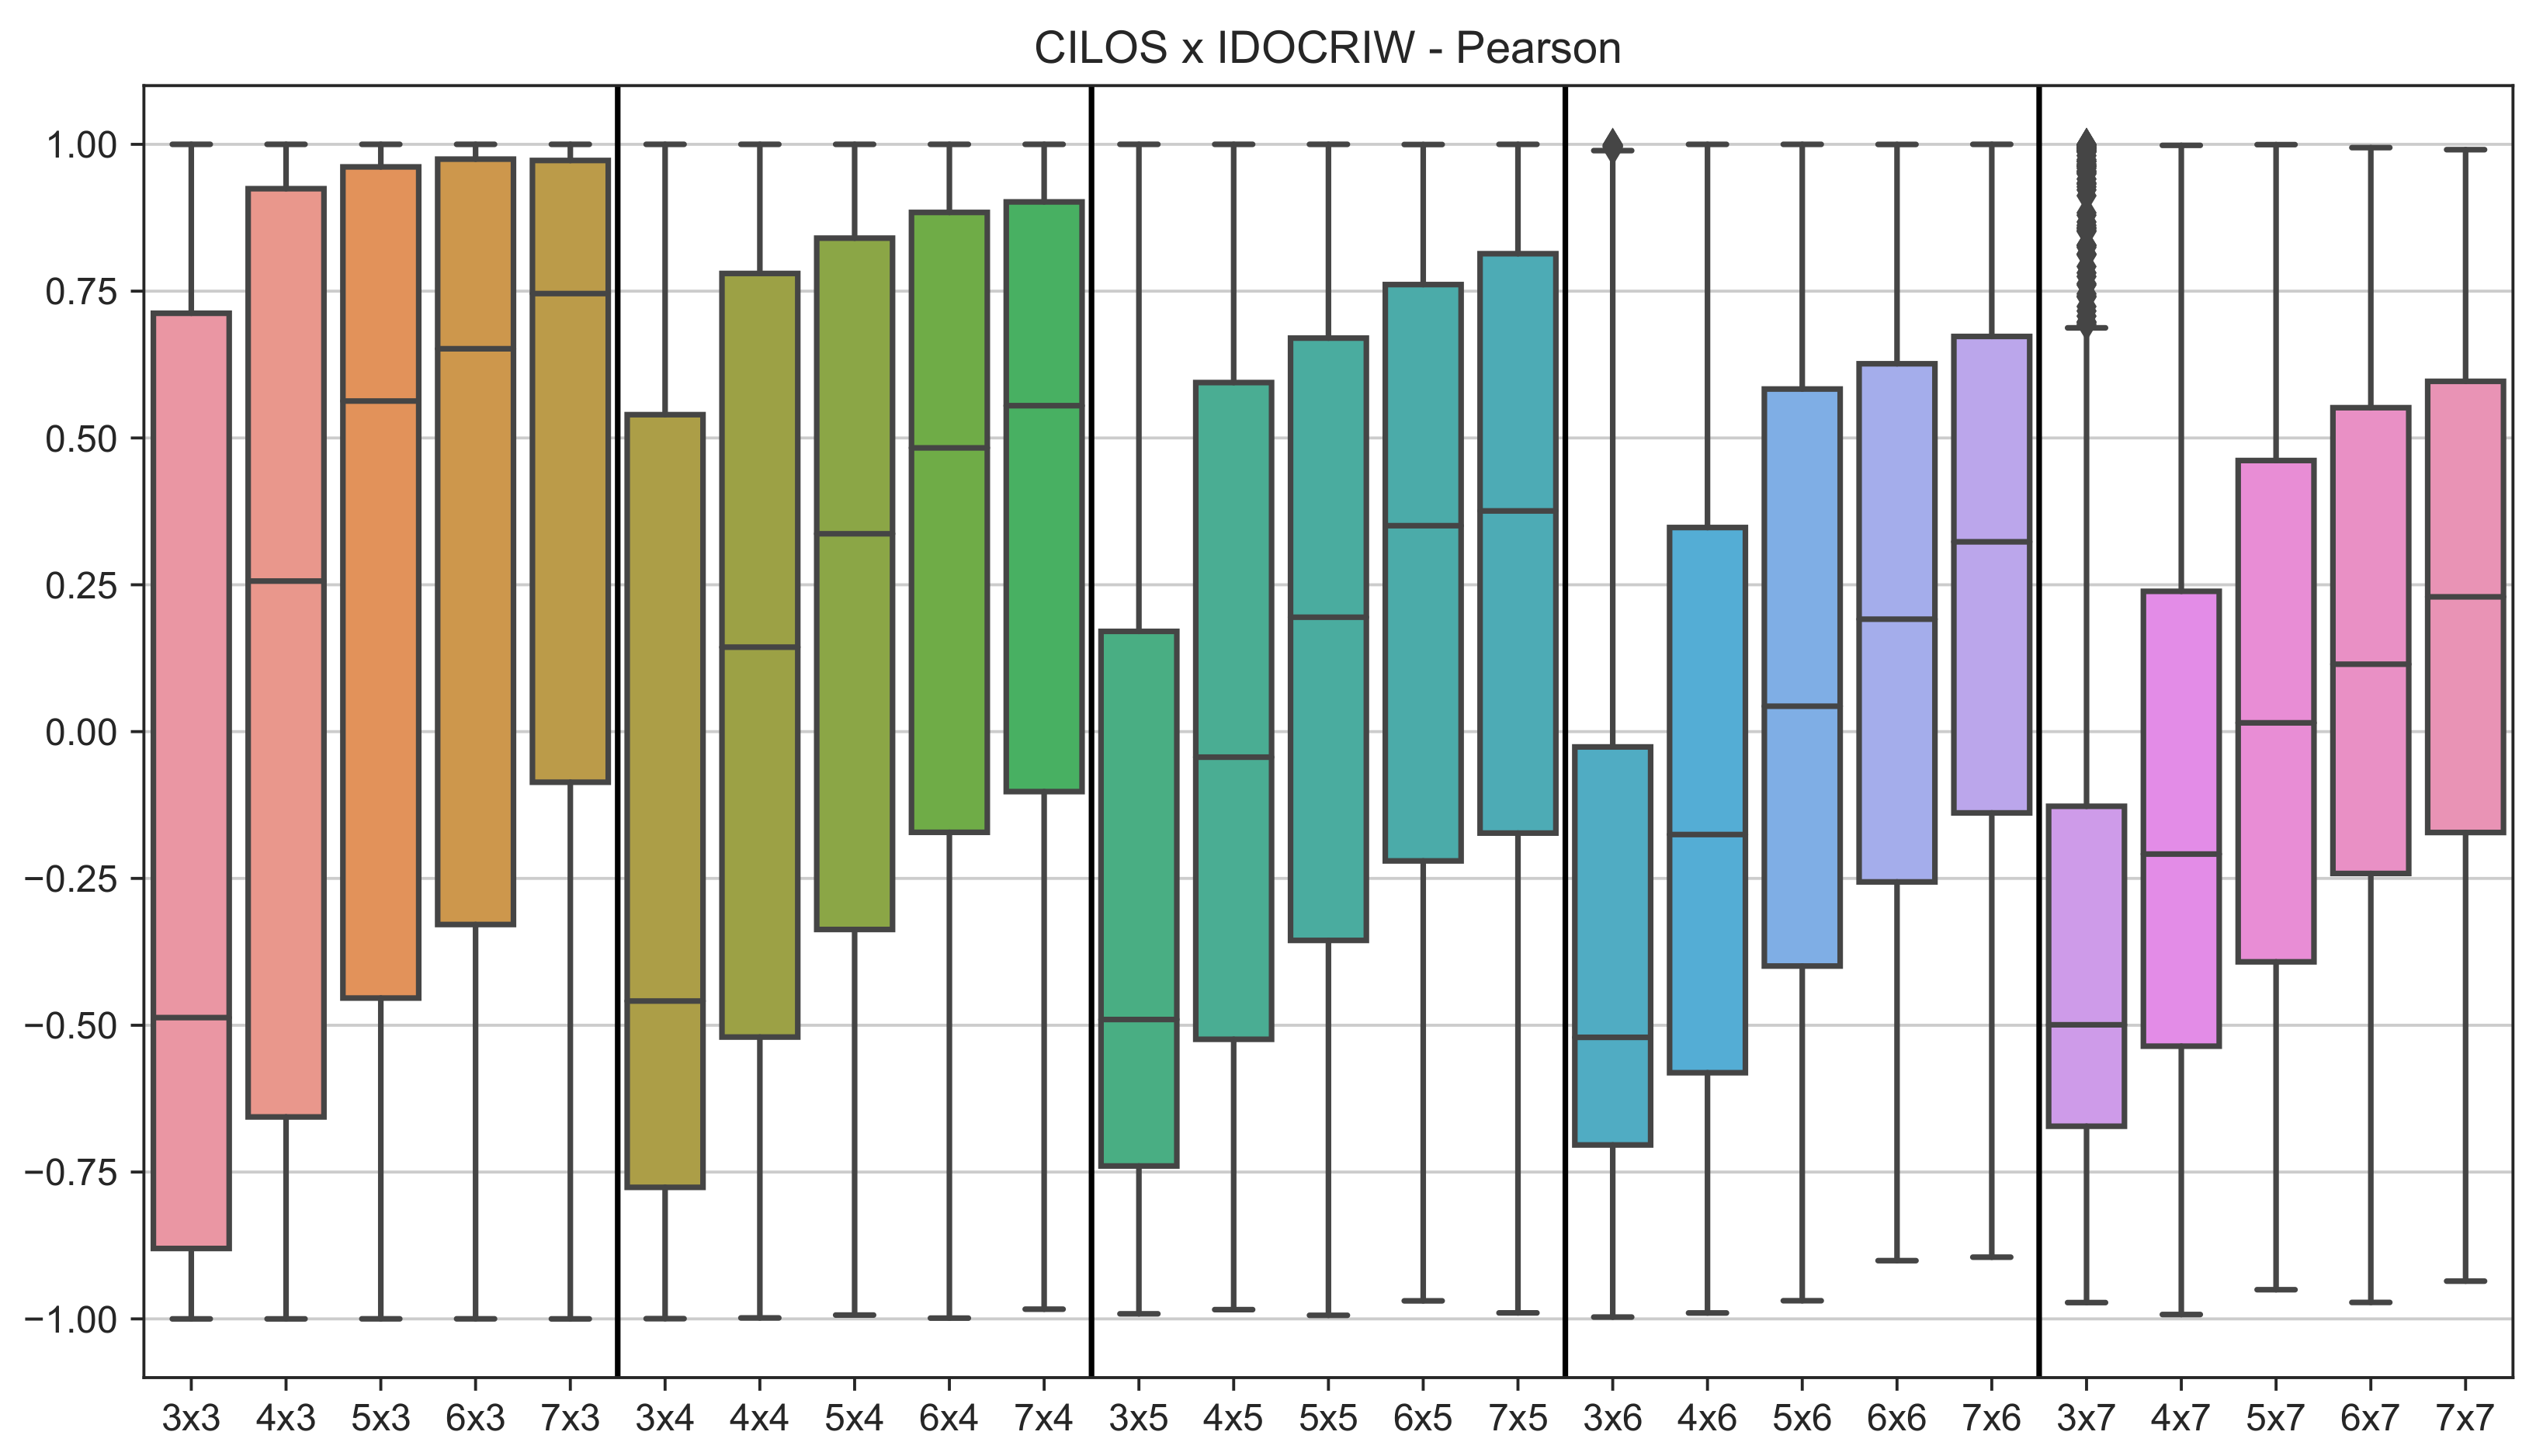
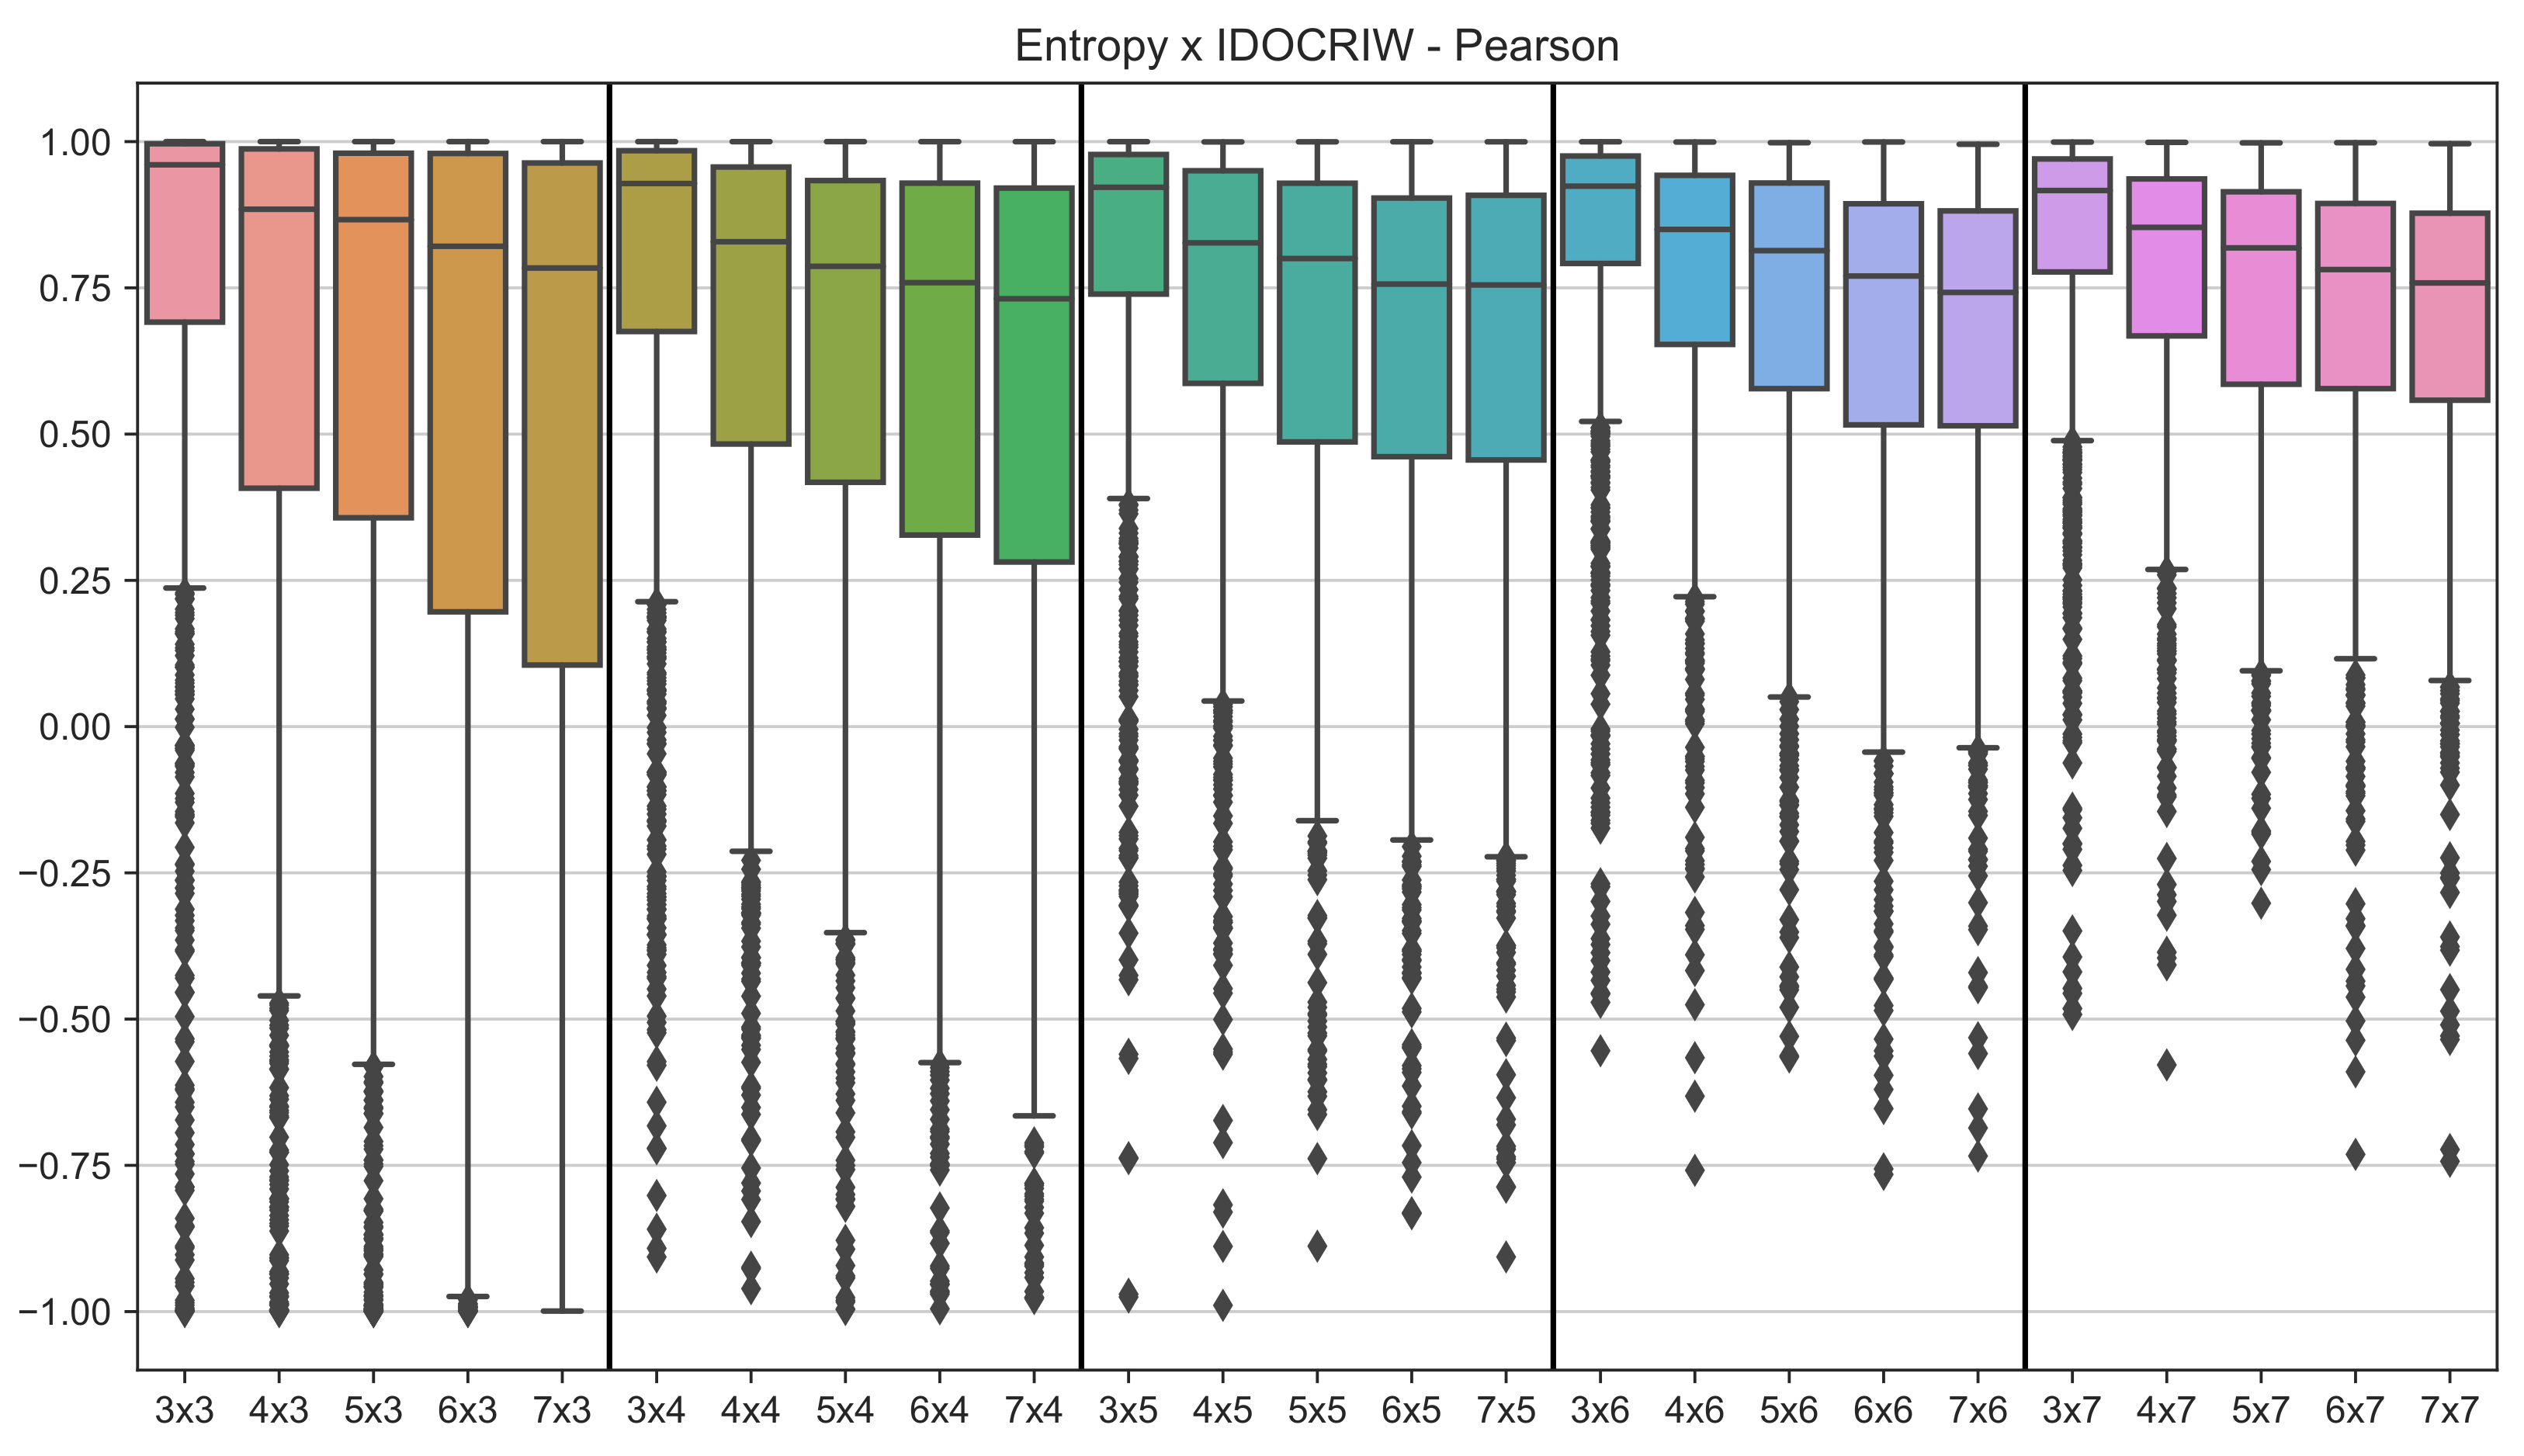
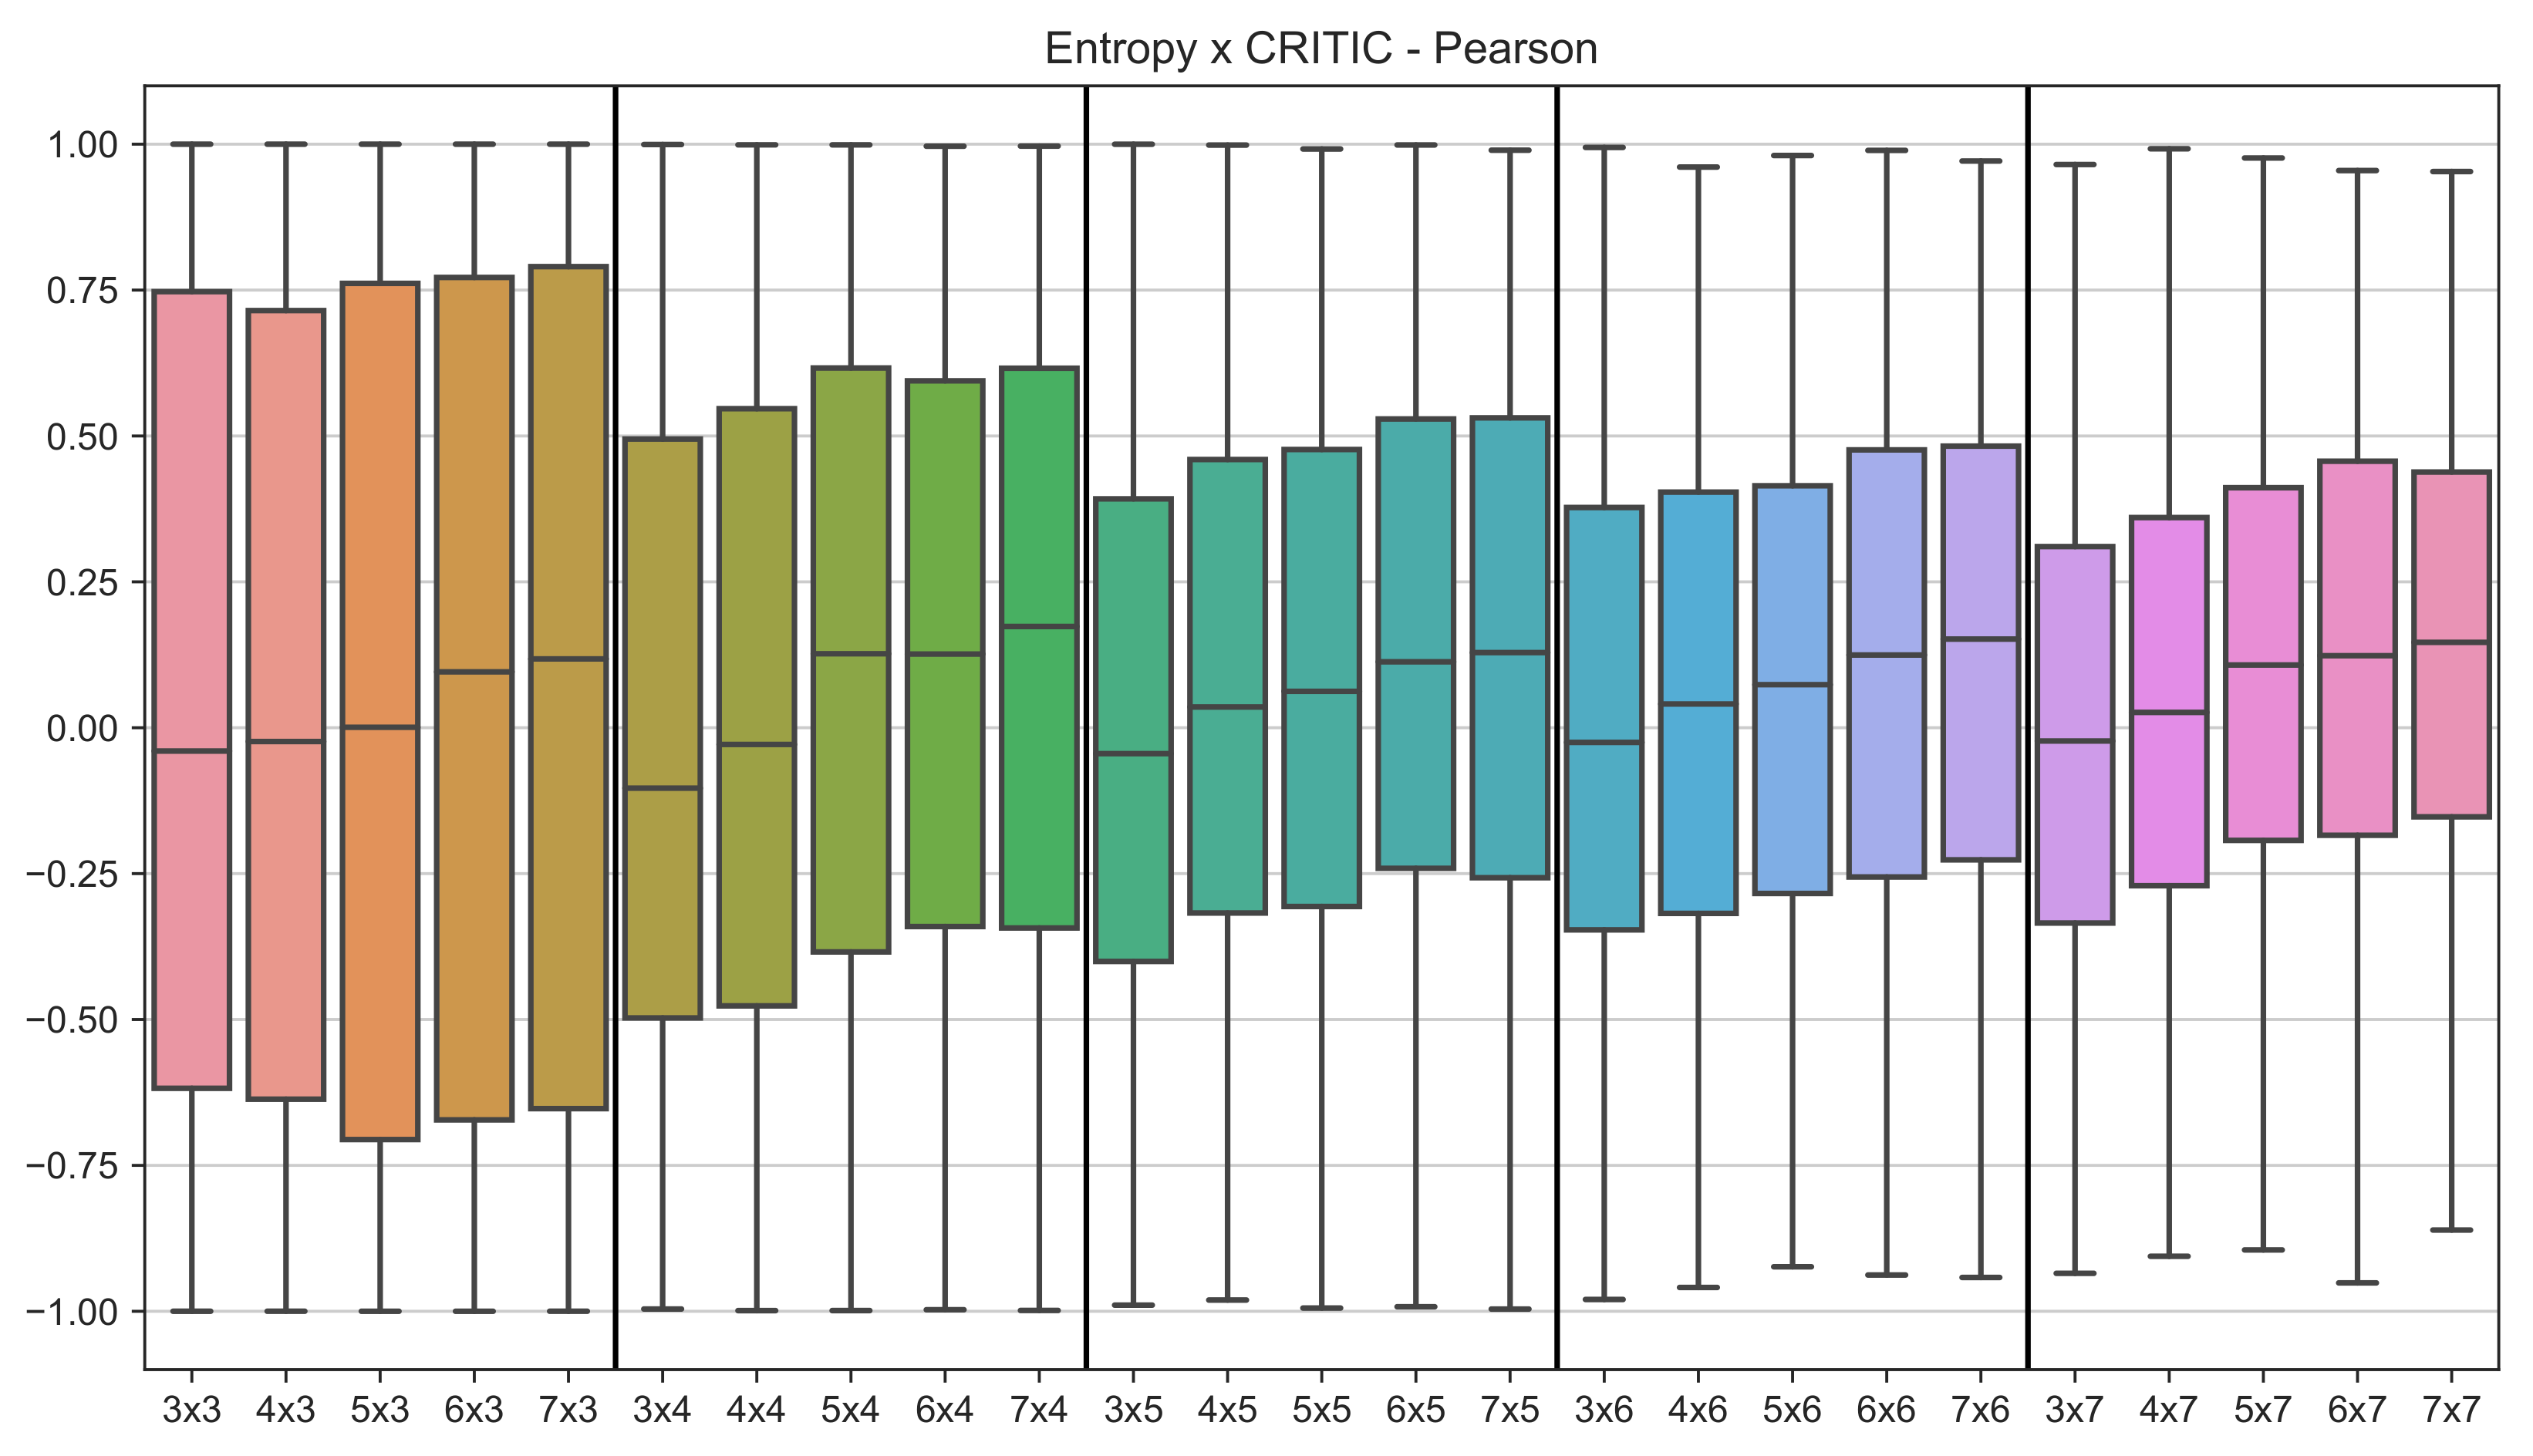
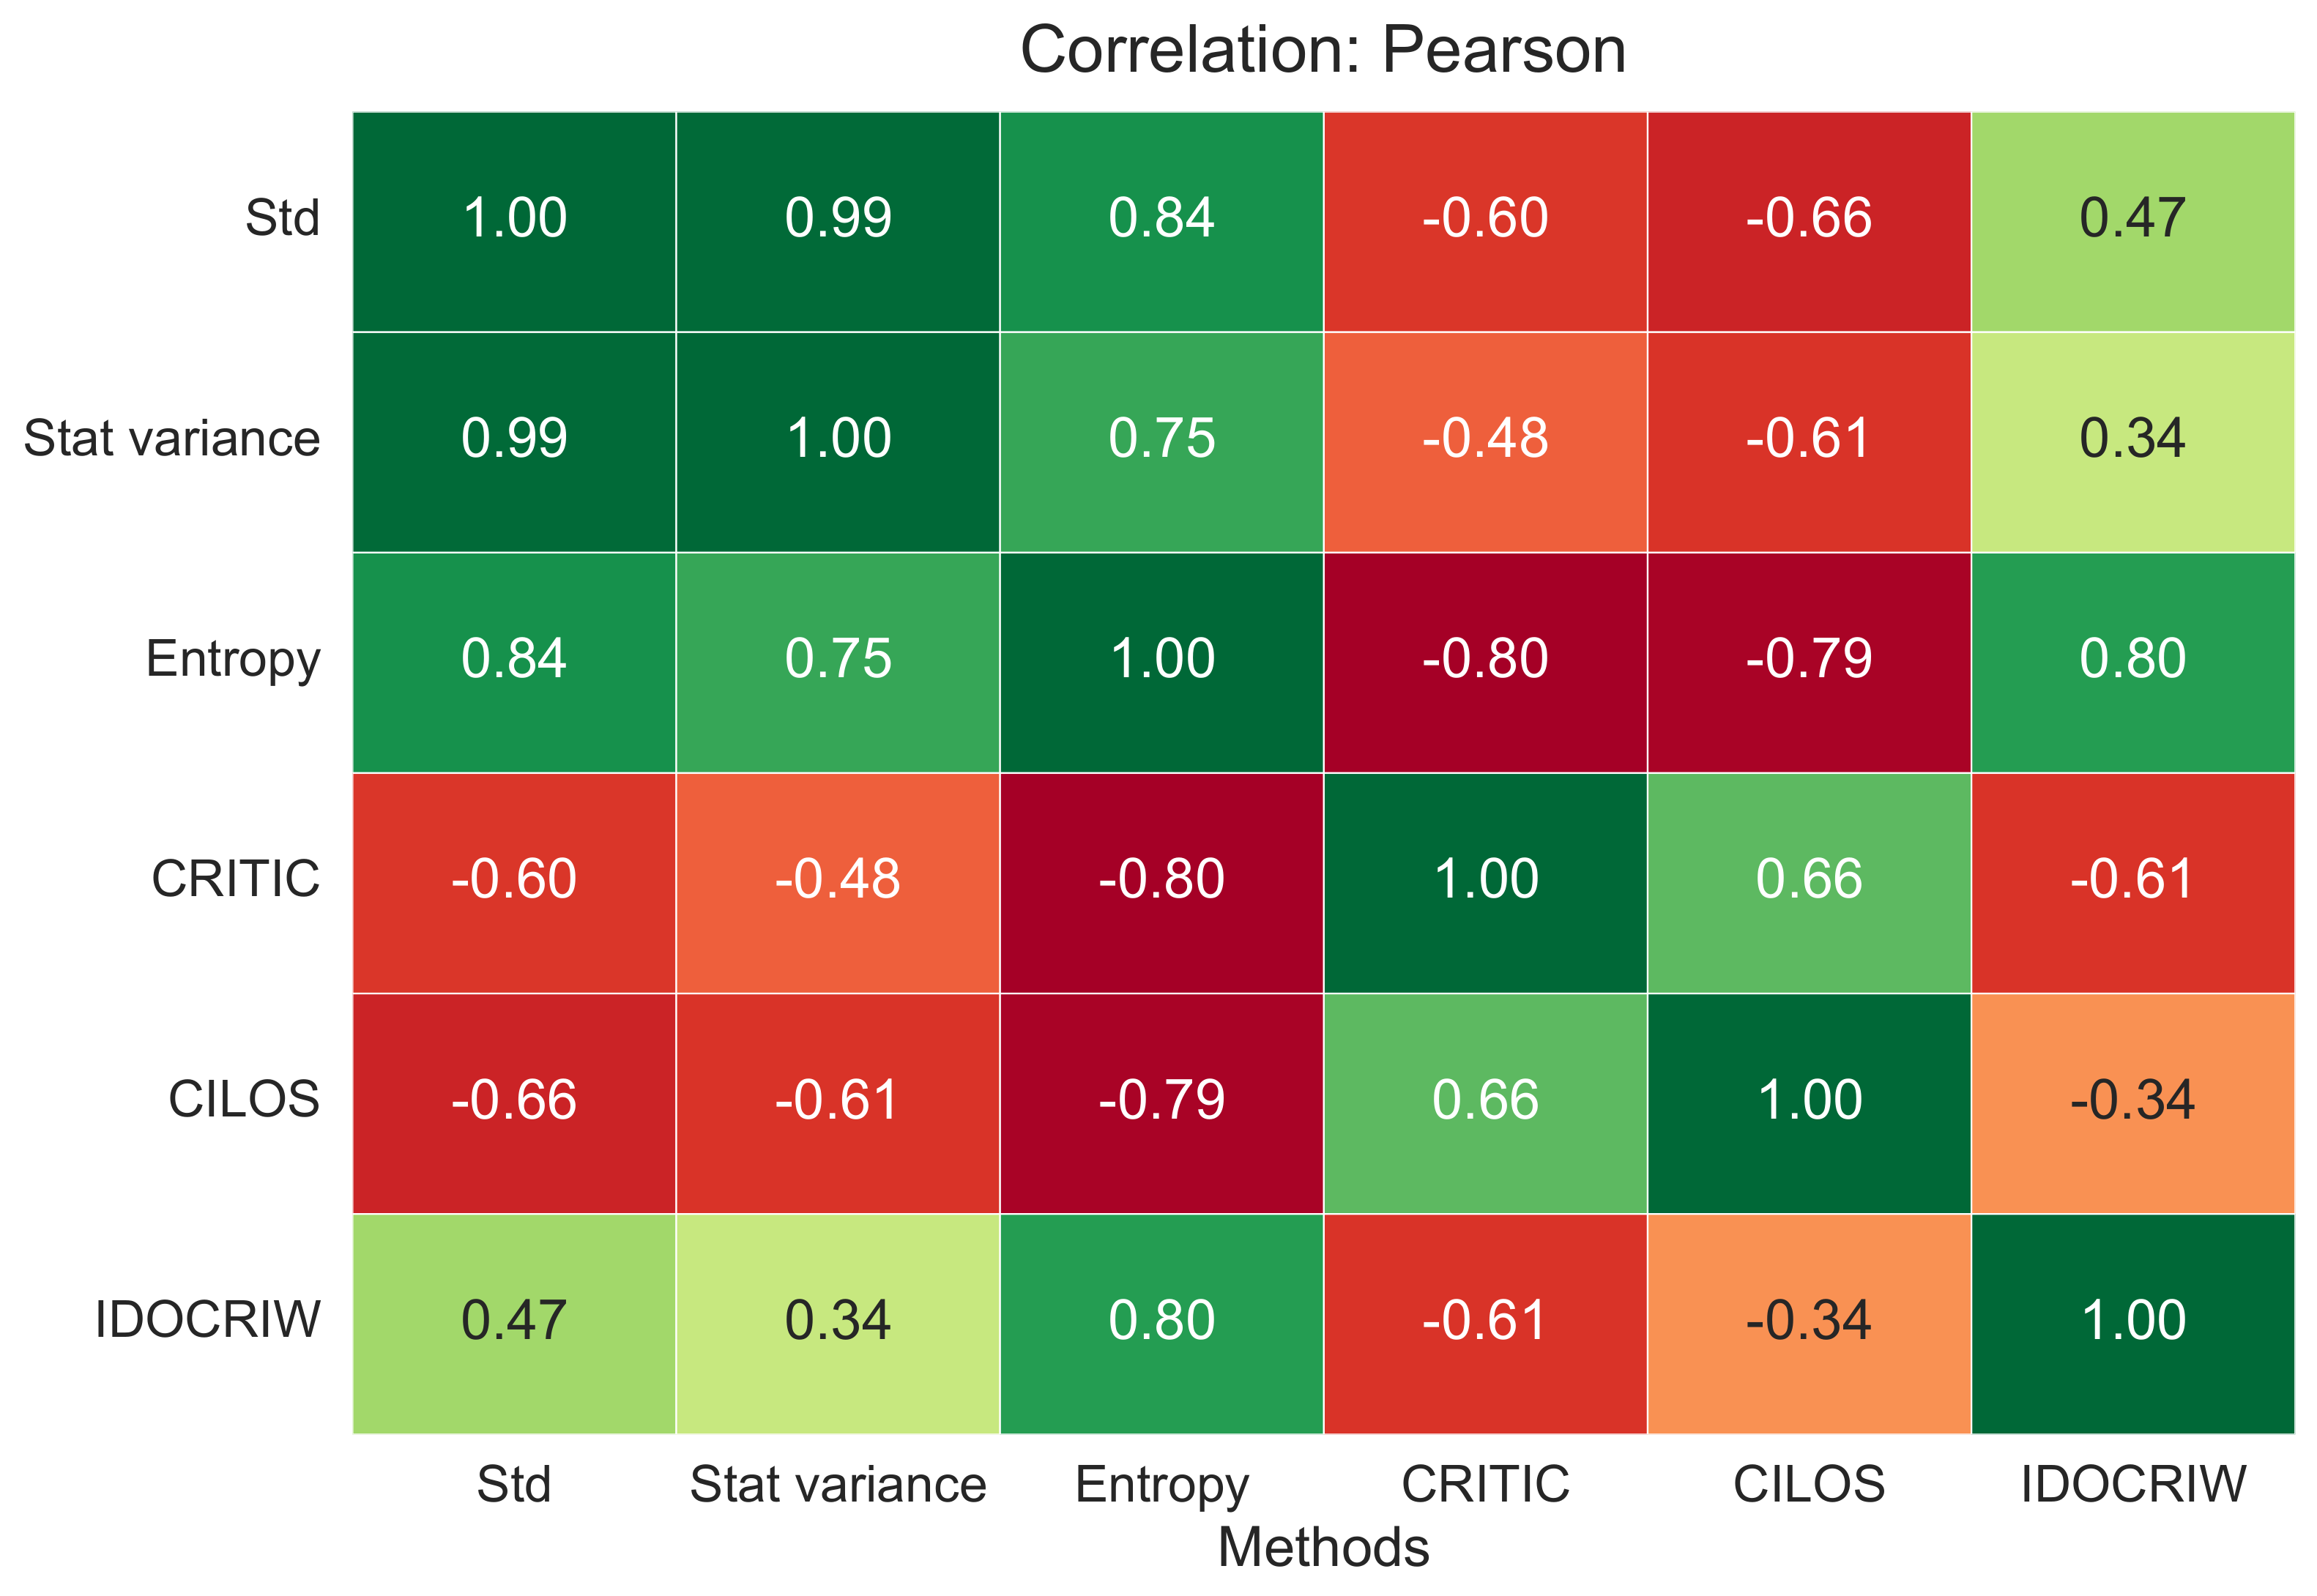
5. Results and Discussion

This section focuses mainly on presenting the results obtained, from which specific conclusions can then be drawn. In the first stage of analysis, a pairwise comparison of the correlation between weights provided by different weighting techniques for selected matrix sizes is presented. The results are displayed in separate box plots for the selected matrix dimensions and correlation measures tested.
The results obtained by calculating the Euclidean distance shown in Figure 8 for the size of five alternatives by five criteria show that most methods allow for obtaining relatively different criterion weights. The comparisons of the entropy and statistical variance methods, the CRITIC and mean methods, and the standard deviation and mean methods seem most interesting. The comparisons of these particular methods show that the results can be slightly correlated, but not in such a significant way that the methods provide the same results. The most significant similarity is between the entropy method and the statistical variance method. Even so, it cannot be said that these methods produce the same weights. The remaining methods do not show sufficient correlation to conclude even partial similarity.
Similar to the previous method, Pearson’s coefficient results demonstrate the highest similarity between the entropy method and the statistical variance method. This is presented in Figure 9 for the example of five alternatives and six criteria. All other weighting methods with the usage of this coefficient provided less correlated results. This method might present results similar to the Euclidean distance as both methods treat weights as raw values.
The results of the weighted Spearman correlation coefficient are shown in Figure 10 for the size of seven alternatives by seven criteria. For this coefficient, the similarity between the entropy method and the statistical variance method is less noticeable. This may be due to the introduction of the weighted aspect of this correlation method. In considering this observation, the methods may have similar values, but there may be a change in the position of these values, which may be essential in the final MCDA method and should be taken into account when choosing a method to solve the problem.
Finally, the W S correlation coefficient presented in Figure 11 presents results for matrices of six alternatives by seven criteria.
It shows that the entropy and the statistical variance methods are not as similar as they seem. This method strictly focuses on the position of each value, considering weights vectors as rankings. It exactly shows that even though those values are similar, they correspond to different criteria. Given that, the result of the chosen MCDA method might differ.
In the second approach, box plots show the correlations for the various matrix dimensions studied, for which, weights were determined using selected weighting techniques. The results were similar in most methods for each correlation coefficient, so only representative pairs were selected. The most interesting results of the performed analysis compared with the Pearson coefficient are displayed and discussed below.
As a first case, a comparison of weights determined for different matrix dimensions using entropy and the standard deviation is presented. The weighting techniques presented were chosen because of their popularity and frequent use, to determine objective criteria weights for MCDA methods [70,71,72]. The results are displayed in Figure 12. It can be observed that the discrepancies between the two methods are not significant and do not vary significantly between the matrix dimensions studied. This means that entropy and standard deviation can be used interchangeably to determine objective criterion weights in multi-criteria problems.
In the case of the comparison made for entropy and statistical variance, displayed in Figure 13, a very high convergence of results can be observed; the correlation measures being practically identical for all the matrix dimensions studied.
The following case, shown in Figure 14, compares the results of two weighting techniques, which are statistical measures: standard deviation and statistical variance. The convergence of the obtained results, in this case, is similar to the comparison of entropy and standard deviation. Thus, the results obtained in the three experiments presented above show a high similarity among the entropy, standard deviation and statistical variance methods applied for criteria weighting for MCDA techniques.
The subsequent three experiments, which demonstrate the comparison of selected weighting techniques for different matrix dimensions, were performed using IDOCRIW, CILOS and entropy methods. The motivation for their selection was that the CILOS method is based on IDOCRIW and entropy. Thus, it is worth investigating which of the base methods, namely IDOCRIW and entropy, with the results provided by CILOS, will be more similar.
Figure 15 displays the comparison results for CILOS and IDOCRIW, while Figure 16 shows the comparison of entropy and IDOCRIW. Much more convergent results can be observed for entropy and IDOCRIW than for CILOS and IDOCRIW. This observation confirms the significant contribution of entropy to the results provided by IDOCRIW.
Finally, the experiment for entropy and CRITIC is presented. Figure 17 shows the significant discrepancies between the weights provided by the compared methods. The results are much less correlated than was observed when comparing entropy with standard deviation, statistical variance and IDOCRIW. Thus, it is to be expected that the criteria weights provided by the CRITIC method will have outliers compared to the other weighting techniques.

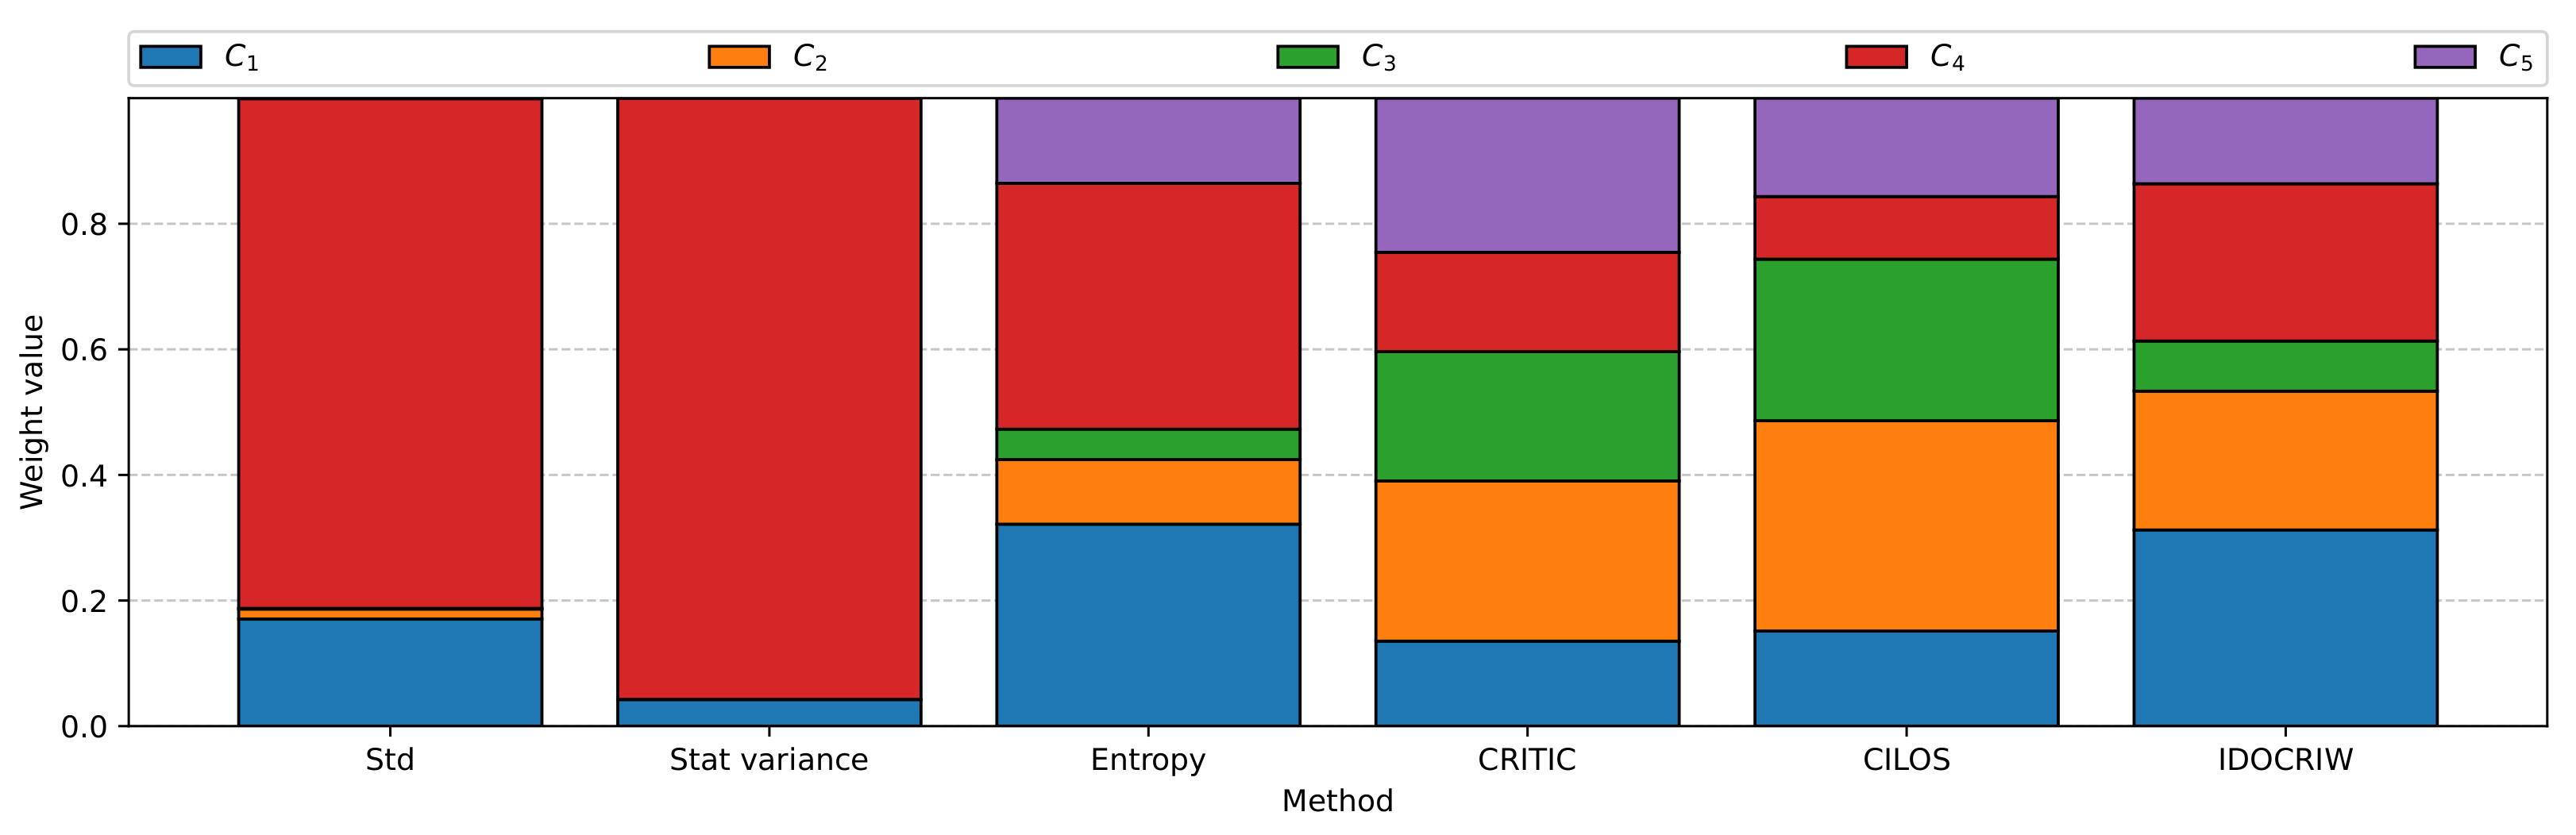
A Real-Life Example of the Application of the Presented Methodology

The final step of the research was to demonstrate the application of the proposed approach using different weighting techniques on a real-world example. In this illustrative case, the results of determining the weights of the electric scooter selection criteria using the weighting techniques provided by the presented system were presented. The mean weighting technique was excluded from this part of the study because, due to its nature, it was obvious that the weights it provided would differ from those supplied by other methods. The correlations between the weights provided by the different techniques were then calculated using Pearson’s coefficient. Data including electric scooter parameter values were obtained from paper [73], focused on evaluating electric scooters using COMET, which is one of the MCDA methods. The alternatives names and values of the five criteria for their assessment are provided in Table 1.
Table 2 displays the values of the criteria weights determined using the compared weighting techniques.
The obtained vectors of weights were compared using the Pearson correlation coefficient. The results are displayed in Figure 18 as a correlation matrix. The highest correlation was observed between the weights calculated by the statistical variance procedure and standard deviation method (0.99). High convergences were noted for the entropy method and the standard deviation method (0.84), IDOCRIW and entropy weighting (0.80) and entropy weighting and statistical variance procedure (0.75). The standard deviation method, statistical variance procedure and entropy method gave the most similar weight values. In contrast, CRITIC and CILOS showed the lowest correlation compared to the other methods. The values of criteria weights provided by these methods had the most outliers among the other methods. The results obtained for the real-life example confirm the conclusions of the experiments performed previously, which showed a high convergence of weights among entropy, standard deviation, statistical variance and outlier results of CILOS and CRITIC.
Figure 19 displays cumulative column plots showing the weight values for each electric scooter selection criteria. It can be observed that the standard deviation, statistical variance and entropy indicated C 4 as the most critical criterion. CRITIC and CILOS assigned the highest weight to C 2 and IDOCRIW to C 1 . The results obtained confirm the diversity of results of the different weighting techniques and the similarity between standard deviation and statistical variance, as well as entropy, CRITIC and CILOS.

6. Conclusions

Information based systems play a significant role in simplifying many complex procedures. MCDA is one tool that can provide answers to decision problems that may occur with large amounts of different types of data. Given the growing popularity of using MCDA methods, it would be helpful to attempt to make them easier to apply. In solving decision-making problems, it is critical to select appropriate criteria and determine their relevance. The methods presented in this paper can help prioritize criteria, making it easier to perform MCDA methods, and obtain the results expected, by the decision-maker even without expert knowledge of the problem being solved.
Various weighting techniques differ in their algorithms, so their weights may show differences for a given decision problem. Weight values for each criterion may vary depending on the weighting technique used. In such a situation, consideration may be given to using the information provided by all the weighting techniques used in the chosen procedure for determining the compromise values. Such a technique may select the method whose results are closest to the averaged results from all methods.
The performed research shows that this system may serve as a helpful tool in solving multi-criteria decision-making problems using MCDA, ensuring that there is a need for such a framework. Furthermore, providing different weighting methods, with the possibility to compare them for users without specialized knowledge, may increase interest in such a system. The presented system is fully functional and delivers something not available in any other framework.
Other methods, not only objective but also subjective or hybrid, can be used in future directions. Furthermore, it would be good practice to compare the results of objective methods with expert assessment. Additionally, more comparative methods could be presented, providing an even broader spectrum of data analysis.

Author Contributions

Conceptualization, B.P., A.S., A.B., B.K. and W.S.; methodology, B.P., A.S., A.B., B.K. and W.S.; software, B.P., A.S., A.B., B.K. and W.S.; validation, B.P., A.S., A.B., B.K. and W.S.; formal analysis, B.P., A.S., A.B., B.K. and W.S.; investigation, B.P., A.S., A.B., B.K. and W.S.; resources, B.P., A.S., A.B., B.K. and W.S.; data curation, B.P., A.S., A.B., B.K. and W.S.; writing—original draft preparation, B.P., A.S., A.B., B.K. and W.S.; writing—review and editing, B.P., A.S., A.B., B.K. and W.S.; visualization, B.P., A.S., A.B., B.K. and W.S.; supervision, W.S.; project administration, W.S.; funding acquisition, W.S. All authors have read and agreed to the published version of the manuscript.

Funding

The work was supported by the National Science Centre, Decision number UMO-2018/ 29/B/HS4/02725 (A.S., B.K. and W.S.).

Institutional Review Board Statement

Not applicable.

Informed Consent Statement

Not applicable.

Data Availability Statement

Not applicable.

Acknowledgments

The authors would like to thank the editor and the anonymous reviewers, whose insightful comments and constructive suggestions helped us to significantly improve the quality of this paper.

Conflicts of Interest

The authors declare no conflict of interest.

Abbreviations

The following abbreviations are used in this manuscript:
AHPAnalytic Hierarchy Process
CILOSCriterion Impact Loss
COPRASComplex Proportional Assessment
CRITICCriteria Importance Through Inter-criteria Correlation
DCEDiscrete Choice Experiment
DSSDecision Support Systems
IDOCRIWIntegrated Determination of Objective CRIteria Weights
MCDAMultiple-criteria decision analysis
rwWeighted Spearman’s Rank Correlation Coefficient
SECASimultaneous Evaluation of Criteria and Alternatives
SMARTSimple Multi-Attribute Rating Technique
STDStatistical Variance Procedure
SWSwing Weighting
TOPSISTechnique for Order Performance by Similarity to Ideal Solution
VIKORVlseKriterijumska Optimizacija I Kompromisno Resenje
WS coefficientWeighted Similarity coefficient

References

  1. Bączkiewicz, A.; Kizielewicz, B.; Shekhovtsov, A.; Yelmikheiev, M.; Kozlov, V.; Sałabun, W. Comparative Analysis of Solar Panels with Determination of Local Significance Levels of Criteria Using the MCDM Methods Resistant to the Rank Reversal Phenomenon. Energies 2021, 14, 5727. [Google Scholar] [CrossRef]
  2. Gigović, L.; Pamučar, D.; Božanić, D.; Ljubojević, S. Application of the GIS-DANP-MABAC multi-criteria model for selecting the location of wind farms: A case study of Vojvodina, Serbia. Renew. Energy 2017, 103, 501–521. [Google Scholar] [CrossRef]
  3. Riaz, M.; Sałabun, W.; Athar Farid, H.M.; Ali, N.; Wątróbski, J. A robust q-rung orthopair fuzzy information aggregation using Einstein operations with application to sustainable energy planning decision management. Energies 2020, 13, 2155. [Google Scholar] [CrossRef]
  4. Bączkiewicz, A.; Wątróbski, J.; Sałabun, W. Towards MCDA Based Decision Support System Addressing Sustainable Assessment. In Proceedings of the Information Systems Development: Crossing Boundaries between Development and Operations (DevOps) in Information Systems (ISD2021 Proceedings), Valencia, Spain, 8–10 September 2021; Available online: https://aisel.aisnet.org/cgi/viewcontent.cgi?article=1363&context=isd2014 (accessed on 11 September 2021).
  5. Turban, E.; Sharda, R.; Delen, D. Decision Support and Business Intelligence Systems (Required); Prentice Hall: Hoboken, NJ, USA, 2010. [Google Scholar]
  6. Sajfert, Z.; Atanaskovic, P.; Pamucar, D.; Nikolic, M. Application of fuzzy logic into process of decision making regarding selection of managers. Afr. J. Bus. Manag. 2012, 6, 3221–3233. [Google Scholar]
  7. Sharda, R.; Barr, S.H.; McDonnell, J.C. Decision support system effectiveness: A review and an empirical test. Manag. Sci. 1988, 34, 139–159. [Google Scholar] [CrossRef]
  8. Robey, D.; Taggart, W. Human information processing in information and decision support systems. MIS Q. 1982, 6, 61–73. [Google Scholar] [CrossRef]
  9. McLeod, R.; Schell, G.P. Management Information Systems; Pearson/Prentice Hall: Upper Saddle River, NJ, USA, 2007; Volume 104. [Google Scholar]
  10. Bączkiewicz, A.; Kizielewicz, B.; Shekhovtsov, A.; Wątróbski, J.; Sałabun, W. Methodical Aspects of MCDM Based E-Commerce Recommender System. J. Theor. Appl. Electron. Commer. Res. 2021, 16, 2192–2229. [Google Scholar] [CrossRef]
  11. Kristianto, Y.; Gunasekaran, A.; Helo, P.; Sandhu, M. A decision support system for integrating manufacturing and product design into the reconfiguration of the supply chain networks. Decis. Support Syst. 2012, 52, 790–801. [Google Scholar] [CrossRef]
  12. Setyawan, A.; Arini, F.Y.; Akhlis, I. Comparative Analysis of Simple Additive Weighting Method and Weighted Product Method to New Employee Recruitment Decision Support System (DSS) at PT. Warta Media Nusantara. Sci. J. Inform. 2017, 4, 34–42. [Google Scholar] [CrossRef] [Green Version]
  13. Beckers, A.; Bsat, M. A DSS classification model for research in human resource information systems. Inf. Syst. Manag. 2002, 19, 41–50. [Google Scholar] [CrossRef]
  14. Schaltegger, S.; Burritt, R.L. Sustainability accounting for companies: Catchphrase or decision support for business leaders? J. World Bus. 2010, 45, 375–384. [Google Scholar] [CrossRef]
  15. Mysiak, J.; Giupponi, C.; Rosato, P. Towards the development of a decision support system for water resource management. Environ. Model. Softw. 2005, 20, 203–214. [Google Scholar] [CrossRef]
  16. Riaz, M.; Razzaq, A.; Kalsoom, H.; Pamučar, D.; Athar Farid, H.M.; Chu, Y.M. q-Rung orthopair fuzzy geometric aggregation operators based on generalized and group-generalized parameters with application to water loss management. Symmetry 2020, 12, 1236. [Google Scholar] [CrossRef]
  17. Sałabun, W.; Shekhovtsov, A.; Pamučar, D.; Wątróbski, J.; Kizielewicz, B.; Więckowski, J.; Bozanić, D.; Urbaniak, K.; Nyczaj, B. A Fuzzy Inference System for Players Evaluation in Multi-Player Sports: The Football Study Case. Symmetry 2020, 12, 2029. [Google Scholar] [CrossRef]
  18. Sałabun, W.; Wątróbski, J.; Shekhovtsov, A. Are MCDA Methods Benchmarkable? A Comparative Study of TOPSIS, VIKOR, COPRAS, and PROMETHEE II Methods. Symmetry 2020, 12, 1549. [Google Scholar] [CrossRef]
  19. Shekhovtsov, A.; Kozlov, V.; Nosov, V.; Sałabun, W. Efficiency of Methods for Determining the Relevance of Criteria in Sustainable Transport Problems: A Comparative Case Study. Sustainability 2020, 12, 7915. [Google Scholar] [CrossRef]
  20. Kizielewicz, B.; Więckowski, J.; Shekhovtsov, A.; Ziemba, E.; Wątróbski, J.; Sałabun, W. Input Data Preprocessing for the MCDM Model: COPRAS Method Case Study. Available online: https://aisel.aisnet.org/amcis2021/data_science_decision_support/data_science_decision_support/11 (accessed on 11 September 2021).
  21. Wątróbski, J.; Jankowski, J.; Ziemba, P.; Karczmarczyk, A.; Zioło, M. Generalised framework for multi-criteria method selection. Omega 2019, 86, 107–124. [Google Scholar] [CrossRef]
  22. Alemi-Ardakani, M.; Milani, A.S.; Yannacopoulos, S.; Shokouhi, G. On the effect of subjective, objective and combinative weighting in multiple criteria decision making: A case study on impact optimization of composites. Expert Syst. Appl. 2016, 46, 426–438. [Google Scholar] [CrossRef]
  23. Shekhovtsov, A.; Rehman, N.; Faizi, S.; Sałabun, W. On the Analytic Hierarchy Process Structure in Group Decision-Making Using Incomplete Fuzzy Information with Applications. Symmetry 2021, 13, 609. [Google Scholar]
  24. Bobar, Z.; Božanić, D.; Djurić, K.; Pamučar, D. Ranking and assessment of the efficiency of social media using the fuzzy AHP-Z number model-fuzzy MABAC. Acta Polytech. Hung. 2020, 17, 43–70. [Google Scholar] [CrossRef]
  25. Yalçin, N.; Ünlü, U. A multi-criteria performance analysis of Initial Public Offering (IPO) firms using CRITIC and VIKOR methods. Technol. Econ. Dev. Econ. 2018, 24, 534–560. [Google Scholar] [CrossRef]
  26. Ecer, F. A consolidated MCDM framework for performance assessment of battery electric vehicles based on ranking strategies. Renew. Sustain. Energy Rev. 2021, 143, 110916. [Google Scholar] [CrossRef]
  27. Groothuis-Oudshoorn, C.G.; Broekhuizen, H.; van Til, J. Dealing with uncertainty in the analysis and reporting of MCDA. In Multi-Criteria Decision Analysis to Support Healthcare Decisions; Springer: Berlin/Heidelberg, Germany, 2017; pp. 67–85. [Google Scholar]
  28. Tervonen, T.; Gelhorn, H.; Sri Bhashyam, S.; Poon, J.L.; Gries, K.S.; Rentz, A.; Marsh, K. MCDA swing weighting and discrete choice experiments for elicitation of patient benefit-risk preferences: A critical assessment. Pharmacoepidemiol. Drug Saf. 2017, 26, 1483–1491. [Google Scholar] [CrossRef]
  29. Marsh, K.; Thokala, P.; Mühlbacher, A.; Lanitis, T. Incorporating preferences and priorities into MCDA: Selecting an appropriate scoring and weighting Technique. In Multi-Criteria Decision Analysis to Support Healthcare Decisions; Springer: Berlin/Heidelberg, Germany, 2017; pp. 47–66. [Google Scholar]
  30. Németh, B.; Molnár, A.; Bozóki, S.; Wijaya, K.; Inotai, A.; Campbell, J.D.; Kaló, Z. Comparison of weighting methods used in multicriteria decision analysis frameworks in healthcare with focus on low-and middle-income countries. J. Comp. Eff. Res. 2019, 8, 195–204. [Google Scholar] [CrossRef] [PubMed] [Green Version]
  31. Giordano, J.; Fricke, P.; Wiltbank, M.; Cabrera, V. An economic decision-making support system for selection of reproductive management programs on dairy farms. J. Dairy Sci. 2011, 94, 6216–6232. [Google Scholar] [CrossRef] [Green Version]
  32. Hallstedt, S.; Ny, H.; Robèrt, K.H.; Broman, G. An approach to assessing sustainability integration in strategic decision systems for product development. J. Clean. Prod. 2010, 18, 703–712. [Google Scholar] [CrossRef]
  33. Wierzbicki, A.P. The need for and possible methods of objective ranking. In Trends in Multiple Criteria Decision Analysis; Springer: Berlin, Germany, 2010; pp. 37–56. [Google Scholar]
  34. Diakoulaki, D.; Mavrotas, G.; Papayannakis, L. Determining objective weights in multiple criteria problems: The critic method. Comput. Oper. Res. 1995, 22, 763–770. [Google Scholar] [CrossRef]
  35. Žižović, M.; Miljković, B.; Marinković, D. Objective methods for determining criteria weight coefficients: A modification of the CRITIC method. Decis. Making Appl. Manag. Eng. 2020, 3, 149–161. [Google Scholar] [CrossRef]
  36. Zavadskas, E. Integrated Resource Assessment and Selection Decisions in Construction; Mokslas Vilnius: Vilnius, Lithuania, 1987. [Google Scholar]
  37. Podvezko, V.; Zavadskas, E.K.; Podviezko, A. An Extension of The New Objective Weight Assessment Methods CILOS and IDOCRIW to Fuzzy MCDM. Econ. Comput. Econ. Cybern. Stud. Res. 2020, 54, 59–75. [Google Scholar] [CrossRef]
  38. Zavadskas, E.K.; Podvezko, V. Integrated determination of objective criteria weights in MCDM. Int. J. Inf. Technol. Decis. Mak. 2016, 15, 267–283. [Google Scholar] [CrossRef]
  39. Benesty, J.; Chen, J.; Huang, Y.; Cohen, I. Pearson correlation coefficient. In Noise Reduction in Speech Processing; Springer: Berlin/Heidelberg, Germany, 2009; pp. 1–4. [Google Scholar]
  40. Hatefi, S.; Torabi, S. A common weight MCDA–DEA approach to construct composite indicators. Ecol. Econ. 2010, 70, 114–120. [Google Scholar] [CrossRef]
  41. Zhou, P.; Ang, B.W. Comparing MCDA aggregation methods in constructing composite indicators using the Shannon-Spearman measure. Soc. Indic. Res. 2009, 94, 83–96. [Google Scholar] [CrossRef]
  42. Sałabun, W.; Urbaniak, K. A new coefficient of rankings similarity in decision-making problems. In International Conference on Computational Science; Springer: Berlin/Heidelberg, Germany, 2020; pp. 632–645. [Google Scholar]
  43. Kizielewicz, B.; Wątróbski, J.; Sałabun, W. Identification of relevant criteria set in the MCDA process—Wind farm location case study. Energies 2020, 13, 6548. [Google Scholar] [CrossRef]
  44. Deepa, N.; Ganesan, K.; Srinivasan, K.; Chang, C.Y. Realizing sustainable development via modified integrated weighting MCDM model for ranking agrarian dataset. Sustainability 2019, 11, 6060. [Google Scholar] [CrossRef] [Green Version]
  45. Dixon, W.J.; Massey, F.J., Jr. Introduction to Statistical Analysis; McGraw-Hill: New York, NJ, USA, 1951. [Google Scholar]
  46. Odu, G. Weighting methods for multi-criteria decision making technique. J. Appl. Sci. Environ. Manag. 2019, 23, 1449–1457. [Google Scholar] [CrossRef] [Green Version]
  47. Lotfi, F.H.; Fallahnejad, R. Imprecise Shannon’s entropy and multi attribute decision making. Entropy 2010, 12, 53–62. [Google Scholar] [CrossRef] [Green Version]
  48. Shemshadi, A.; Shirazi, H.; Toreihi, M.; Tarokh, M.J. A fuzzy VIKOR method for supplier selection based on entropy measure for objective weighting. Expert Syst. Appl. 2011, 38, 12160–12167. [Google Scholar] [CrossRef]
  49. Zhang, H.; Gu, C.L.; Gu, L.W.; Zhang, Y. The evaluation of tourism destination competitiveness by TOPSIS & information entropy—A case in the Yangtze River Delta of China. Tour. Manag. 2011, 32, 443–451. [Google Scholar]
  50. Liu, L.; Zhou, J.; An, X.; Zhang, Y.; Yang, L. Using fuzzy theory and information entropy for water quality assessment in Three Gorges region, China. Expert Syst. Appl. 2010, 37, 2517–2521. [Google Scholar] [CrossRef]
  51. Ranis, G.; Stewart, F.; Samman, E. Human development: Beyond the human development index. J. Hum. Dev. 2006, 7, 323–358. [Google Scholar] [CrossRef]
  52. Gan, X.; Fernandez, I.C.; Guo, J.; Wilson, M.; Zhao, Y.; Zhou, B.; Wu, J. When to use what: Methods for weighting and aggregating sustainability indicators. Ecol. Indic. 2017, 81, 491–502. [Google Scholar] [CrossRef]
  53. Rostamzadeh, R.; Ghorabaee, M.K.; Govindan, K.; Esmaeili, A.; Nobar, H.B.K. Evaluation of sustainable supply chain risk management using an integrated fuzzy TOPSIS-CRITIC approach. J. Clean. Prod. 2018, 175, 651–669. [Google Scholar] [CrossRef]
  54. Madic, M.; Radovanović, M. Ranking of some most commonly used nontraditional machining processes using ROV and CRITIC methods. UPB Sci. Bull. Ser. D 2015, 77, 193–204. [Google Scholar]
  55. Abdel-Basset, M.; Mohamed, R. A novel plithogenic TOPSIS-CRITIC model for sustainable supply chain risk management. J. Clean. Prod. 2020, 247, 119586. [Google Scholar] [CrossRef]
  56. Tuş, A.; Adalı, E.A. The new combination with CRITIC and WASPAS methods for the time and attendance software selection problem. Opsearch 2019, 56, 528–538. [Google Scholar] [CrossRef]
  57. Čereška, A.; Zavadskas, E.K.; Cavallaro, F.; Podvezko, V.; Tetsman, I.; Grinbergienė, I. Sustainable assessment of aerosol pollution decrease applying multiple attribute decision-making methods. Sustainability 2016, 8, 586. [Google Scholar] [CrossRef] [Green Version]
  58. Alao, M.A.; Popoola, O.M.; Ayodele, T.R. Selection of waste-to-energy technology for distributed generation using IDOCRIW-Weighted TOPSIS method: A case study of the City of Johannesburg, South Africa. Renew. Energy 2021, 178, 162–183. [Google Scholar] [CrossRef]
  59. Akoglu, H. User’s guide to correlation coefficients. Turk. J. Emerg. Med. 2018, 18, 91–93. [Google Scholar] [CrossRef]
  60. Zhou, H.; Deng, Z.; Xia, Y.; Fu, M. A new sampling method in particle filter based on Pearson correlation coefficient. Neurocomputing 2016, 216, 208–215. [Google Scholar] [CrossRef]
  61. Xu, H.; Deng, Y. Dependent evidence combination based on shearman coefficient and pearson coefficient. IEEE Access 2017, 6, 11634–11640. [Google Scholar] [CrossRef]
  62. Benesty, J.; Chen, J.; Huang, Y. On the importance of the Pearson correlation coefficient in noise reduction. IEEE Trans. Audio Speech Lang. Process. 2008, 16, 757–765. [Google Scholar] [CrossRef]
  63. Diaby, V.; Campbell, K.; Goeree, R. Multi-criteria decision analysis (MCDA) in health care: A bibliometric analysis. Oper. Res. Health Care 2013, 2, 20–24. [Google Scholar] [CrossRef]
  64. Kizielewicz, B.; Więckowski, J.; Wątrobski, J. A Study of Different Distance Metrics in the TOPSIS Method. In Intelligent Decision Technologies; Springer: Berlin/Heidelberg, Germany, 2021; pp. 275–284. [Google Scholar]
  65. Yu, K.; Guo, G.D.; Li, J.; Lin, S. Quantum algorithms for similarity measurement based on Euclidean distance. Int. J. Theor. Phys. 2020, 59, 3134–3144. [Google Scholar] [CrossRef]
  66. Barnouti, N.H.; Al-Dabbagh, S.S.M.; Matti, W.E.; Naser, M.A.S. Face detection and recognition using Viola-Jones with PCA-LDA and square euclidean distance. Int. J. Adv. Comput. Sci. Appl. (IJACSA) 2016, 7, 371–377. [Google Scholar]
  67. Bouhmala, N. How good is the euclidean distance metric for the clustering problem. In Proceedings of the 2016 5th IIAI International Congress on Advanced Applied Informatics (IIAI-AAI), Kumamoto, Japan, 10–14 July 2016; pp. 312–315. [Google Scholar]
  68. Ghosh, A.; Barman, S. Application of Euclidean distance measurement and principal component analysis for gene identification. Gene 2016, 583, 112–120. [Google Scholar] [CrossRef]
  69. Shekhovtsov, A.; Więckowski, J.; Kizielewicz, B.; Sałabun, W. Towards Reliable Decision-Making in the Green Urban Transport Domain. In Facta Universitatis, Series: Mechanical Engineering; University of Niš: Niš, Serbia, 2021. [Google Scholar]
  70. Zeng, S.; Hu, Y.; Balezentis, T.; Streimikiene, D. A multi-criteria sustainable supplier selection framework based on neutrosophic fuzzy data and entropy weighting. Sustain. Dev. 2020, 28, 1431–1440. [Google Scholar] [CrossRef]
  71. Li, H.; Wang, W.; Fan, L.; Li, Q.; Chen, X. A novel hybrid MCDM model for machine tool selection using fuzzy DEMATEL, entropy weighting and later defuzzification VIKOR. Appl. Soft Comput. 2020, 91, 106207. [Google Scholar] [CrossRef]
  72. Vavrek, R. Evaluation of the Impact of Selected Weighting Methods on the Results of the TOPSIS Technique. Int. J. Inf. Technol. Decis. Mak. 2019, 18, 1821–1843. [Google Scholar] [CrossRef]
  73. Kizielewicz, B.; Dobryakova, L. How to choose the optimal single-track vehicle to move in the city? Electric scooters study case. Procedia Comput. Sci. 2020, 176, 2243–2253. [Google Scholar] [CrossRef]
Figure 1. MCDA problem solving flowchart.
Symmetry 13 01874 g001
Figure 2. First approach flowchart.
Symmetry 13 01874 g002
Figure 3. Second approach flowchart presenting steps taken to achieve results for changing alternative and criteria numbers in different weighting methods.
Symmetry 13 01874 g003
Figure 4. Application initial screen, where user inserts decision matrix dimensions.
Symmetry 13 01874 g004
Figure 5. Screen where decision matrix values are entered with related criteria type.
Symmetry 13 01874 g005
Figure 6. Screen where weighting methods are chosen—with mean and CRITIC methods chosen for example.
Symmetry 13 01874 g006
Figure 7. Final screen presenting results of weighting methods with weighted Spearman coefficient chosen for comparison.
Symmetry 13 01874 g007
Figure 8. First approach: Euclidean distance results—5 alternatives × 5 criteria, as example.
Symmetry 13 01874 g008
Figure 9. First approach: Pearson’s coefficient results—5 alternatives × 6 criteria, for example.
Symmetry 13 01874 g009
Figure 10. First approach: weighted Spearman’s coefficient results—7 alternatives × 7 criteria, for example.
Symmetry 13 01874 g010
Figure 11. First approach: W S coefficient results—6 alternatives × 7 criteria, for example.
Symmetry 13 01874 g011
Figure 12. Second approach: Pearson results—entropy × standard deviation, for example.
Symmetry 13 01874 g012
Figure 13. Second approach: Pearson results—entropy × statistical variance as example.
Symmetry 13 01874 g013
Figure 14. Second approach: Pearson results—standard deviation × statistical variance as example.
Symmetry 13 01874 g014
Figure 15. Second approach: Pearson results—CILOS × IDOCRIW, as example.
Symmetry 13 01874 g015
Figure 16. Second approach: Pearson results—entropy × IDOCRIW, as example.
Symmetry 13 01874 g016
Figure 17. Second approach: Pearson results—entropy × CRITIC, as example.
Symmetry 13 01874 g017
Figure 18. Correlation results between the investigated criterion weighting techniques.
Symmetry 13 01874 g018
Figure 19. Values of real-life example criteria weights determined using the weighting techniques investigated.
Symmetry 13 01874 g019
Table 1. Alternatives table A 1 A 17 .
A i ModelPriceMotorSpeedBatteryWeight
A 1 ENERO Spark6491501526008.5
A 2 Skymaster Monster Lemon Squeeze14293502552008
A 3 Kawasaki KX-FS6.5A1281.4025025400010.7
A 4 Spokey Venom182535025600010
A 5 Xiaomi MiJia 365 Pro22993002512,80014.2
A 6 Ninebot by Segway MAX G3034993503015,30019.1
A 7 Blaupunkt ESC91024993502510,00015
A 8 Fiat F500-80R114925025600011
A 9 Razor E200126920019700017
A 10 FRUGAL PERFECT13732502544009.2
A 11 ESC808 Blaupunkt199935025520013.5
A 12 SPOKEY FENIKS164935025520012.5
A 13 SPOKEY Ghost1393.9930025780013.5
A 14 Motus Scooty 8.5’119925025780012.5
A 15 FRUGAL PASSION186925025750012.5
A 16 KUGOO M2 PRO16773003075008.5
A 17 SNAKE A999935030600010
Table 2. Criteria C 1 C 5 weights determined with weighting techniques implemented in presented system.
Method C 1 C 2 C 3 C 4 C 5
Std0.1706270.0158230.0009290.8118297.922084 × 10 4
Stat variance0.0422900.0003640.0000010.9573449.116287 × 10 7
Entropy0.3216050.1028810.0483860.3915581.355704 × 10 1
CRITIC0.1353300.2551400.2058140.1582562.454594 × 10 1
CILOS0.1514250.3348730.2572890.0997091.567043 × 10 1
IDOCRIW0.3124000.2210070.0798610.2504511.362815 × 10 1
Publisher’s Note: MDPI stays neutral with regard to jurisdictional claims in published maps and institutional affiliations.

