Article

Discussion on the Optimization Method of Public Service Facility Layout from the Perspective of Spatial Equity: A Study Based on the Central City of Shanghai

Institute of Urban and Demographic Studies, Shanghai Academy of Social Sciences, Shanghai 200020, China
Land 2023, 12(9), 1780; https://doi.org/10.3390/land12091780
Submission received: 21 August 2023 / Revised: 7 September 2023 / Accepted: 11 September 2023 / Published: 14 September 2023

Abstract

:
Equity is one of the fundamental principles in the planning of public service facilities. In recent years, many cities have started to promote the construction of 15 min community living circles with the aim of providing residents with more equitable access to basic public services. Based on this background, this study explores an equity-oriented spatial quantitative analysis method to assist in the planning of public service facility layouts. The node centrality measurement index, such as betweenness from spatial syntax and social network analysis is introduced into the analysis method in order to consider the potential activity paths and flows of people at the community scale. Selecting the central city of Shanghai as a case study, the research presents results regarding spatial equity based on the relationship between public service demand and public service facilities supply. Building on this foundation, various approaches to enhancing equity are discussed: (1) optimizing the layout of public service facilities; (2) optimizing residential spatial patterns; and (3) optimizing pedestrian transportation networks.

1. Introduction

In urban-scale territorial spatial planning, the layout planning of public service facilities is an important task. Public services generally include education, medical care, culture, sports, and elderly care, which are the basic services that must be guaranteed for all citizens. The supply of resources with public attributes must strive to achieve the maximum well-being of all residents, promote equitable distribution of resources, and ensure equal opportunities for users [1]. Since the planning of public service facilities needs to be laid out in geographic space, this principle of equity needs to be reflected at the spatial level [2,3,4]. Hay (1995) fully discussed the concepts of equity, fairness, and justice in geographic studies [5]. Comparatively speaking, equity places a stronger emphasis on allocating resources according to individual needs. Fairness and justice are broader concepts that encompass moral, social, legal, and other dimensions. In the field of public service facility planning, the equitable distribution of resources forms the foundational safeguard for achieving fairness and justice. Therefore, this paper predominantly focuses on the concept of spatial equity. In general, the research in this field has undergone a process from a unilateral focus on spatial equity to a comprehensive consideration of both population needs and spatial equity [6,7,8,9,10,11,12]. For instance, Wicks et al. (1986) discussed issues of equity in park resources allocation, asserting that parks should be distributed equally among all regions [13]; Erkip et al. (1997) recognized that the equitable allocation of public services in geographical space differs from group-oriented effective distribution [14]; Wolch et al. (2005) argued for strategies to reduce inequalities in the levels of public service accessibility across different communities [15]; and Wang et al. (2022) proposed the implementation of strategic planning policies to ensure equity for specific groups [16].
In order to better ensure urban residents’ equitable access to basic public services in spatial terms and enhance the spatial allocation efficiency of public service facility resources, many cities in China and other countries have been committed to achieving equitable distribution of basic public services within a 15 min walking distance range in recent years [17,18,19,20,21,22]. In its latest round of urban master planning, Shanghai has introduced the concept of urban community living circles within a 15-min walking radius, aiming to enhance the service of education, culture, medical care, elderly care, sports, recreation, employment, and business, creating an all-age ideal educational environment, an elderly friendly city, and a 24 h city, to form a community living circle that combines the functions of living, business, learning, and leisure [23]. Based on various local practices, the Ministry of Natural Resources of the People’s Republic of China released the spatial planning guidance for community life units in 2021 to normatively guide the allocation of public service elements in different types of community living circles [24].
Quantitative spatial analysis methods can provide effective support for rational layout planning decisions of public service facilities [25]. Since the 1960s, many scholars have engaged in discussions on the optimal facility location problem, such as the p-center problem [26], p-median problem [26], the maximum covering location problem [27], the location set-covering problem [28], and the uncapacitated facility location problem [29]. With the development of geographic information systems, applications of facility location problems with a focus on equity have gradually become widespread since the 1990s [30,31]. These application studies commonly address the spatial accessibility of facilities and services [32,33,34,35,36,37,38,39,40], as well as the spatial equity of residents’ access to public services [41,42,43]. Common methods for measuring the service coverage of facilities include the service radius analysis method and the network service area analysis method. The first method involves drawing circles centered around facilities according to the service radius to analyze spatial coverage, which is relatively simple and convenient [44]. The second method takes into account the influence of the urban road network, defining the service area based on traffic network paths and service distance (spatial or temporal), yielding results that are closer to reality [45]. To identify weak areas in the layout of public service facilities, it is generally necessary to separately calculate facility coverage and the spatial distribution of residents (users). Based on this, supply–demand relationship analysis is conducted to determine which areas have “supply exceeding demand”, which areas have “supply falling short of demand”, and which areas are relatively balanced [19,46].
Despite their widespread application for calculating the service range of facilities, the service radius analysis method and the network service area analysis method still exhibit certain limitations, which manifest in the following aspects: (1) solely considering individual facility locations for service range calculation neglects the assessment of accessibility for groups of people to reach these facilities; (2) relying exclusively on Euclidean distance or predetermined paths to measure facility accessibility disregards the potential influence of spatial (or network) configurations on trip routes; and (3) overlooking the variations in the significance of different spatial nodes within the network fails to capture the disparities in importance across various locations. Grounded in the theory of spatial syntax, the combination of urban transportation networks or open spaces can profoundly shape human activity flow within a given space [47,48,49,50]. This phenomenon is indeed observable in urban contexts. Similar spatial areas often display divergent levels of pedestrian traffic and commercial vitality, closely tied to the layout of the spatial network. For instance, referencing Figure 1, roads 1–5 serve as integral arteries within the consolidated area, intersecting with nearly all other roads. Situated at the heart of the region, Location A stands adjacent to these main arteries, and its surroundings comprise a dense network of roads, inherently designating it as a focal point for pedestrian traffic throughout the region. In contrast, Location B deviates slightly from this central region, and road sections 17 and 12 in its vicinity are cul-de-sacs, typically associated with diminished pedestrian movement. Further removed from the core area, Location C’s proximity to road 14 connects it with road sections 4, 5, 13, 11, and 15, effectively positioning it as a potential passageway for pedestrian movement in the northeastern part of the area.
An equity-oriented spatial layout of public service facilities requires a comprehensive consideration of the potential flow of pedestrian activities when addressing issues of facility coverage and supply–demand relationships. The location and scale of the public service facility layout should ideally be aligned with the potential magnitude of pedestrian activities within the spatial network, facilitating the enhancement of efficiency in the allocation of public service resources. Against this backdrop, building upon research into the layout of public service facilities at the scale of community life circles, this study introduces a node centrality assessment method from spatial syntax, presenting a spatial quantitative analysis approach that better promotes equitable distribution of public service resources. The research objectives primarily encompass three aspects: (1) proposing a feasible analytical assessment method; (2) utilizing Shanghai as a case study for conducting a current status assessment; and (3) drawing on the case study results to explore various avenues for further enhancing the equity of public service facility layout.

2. Materials and Methods
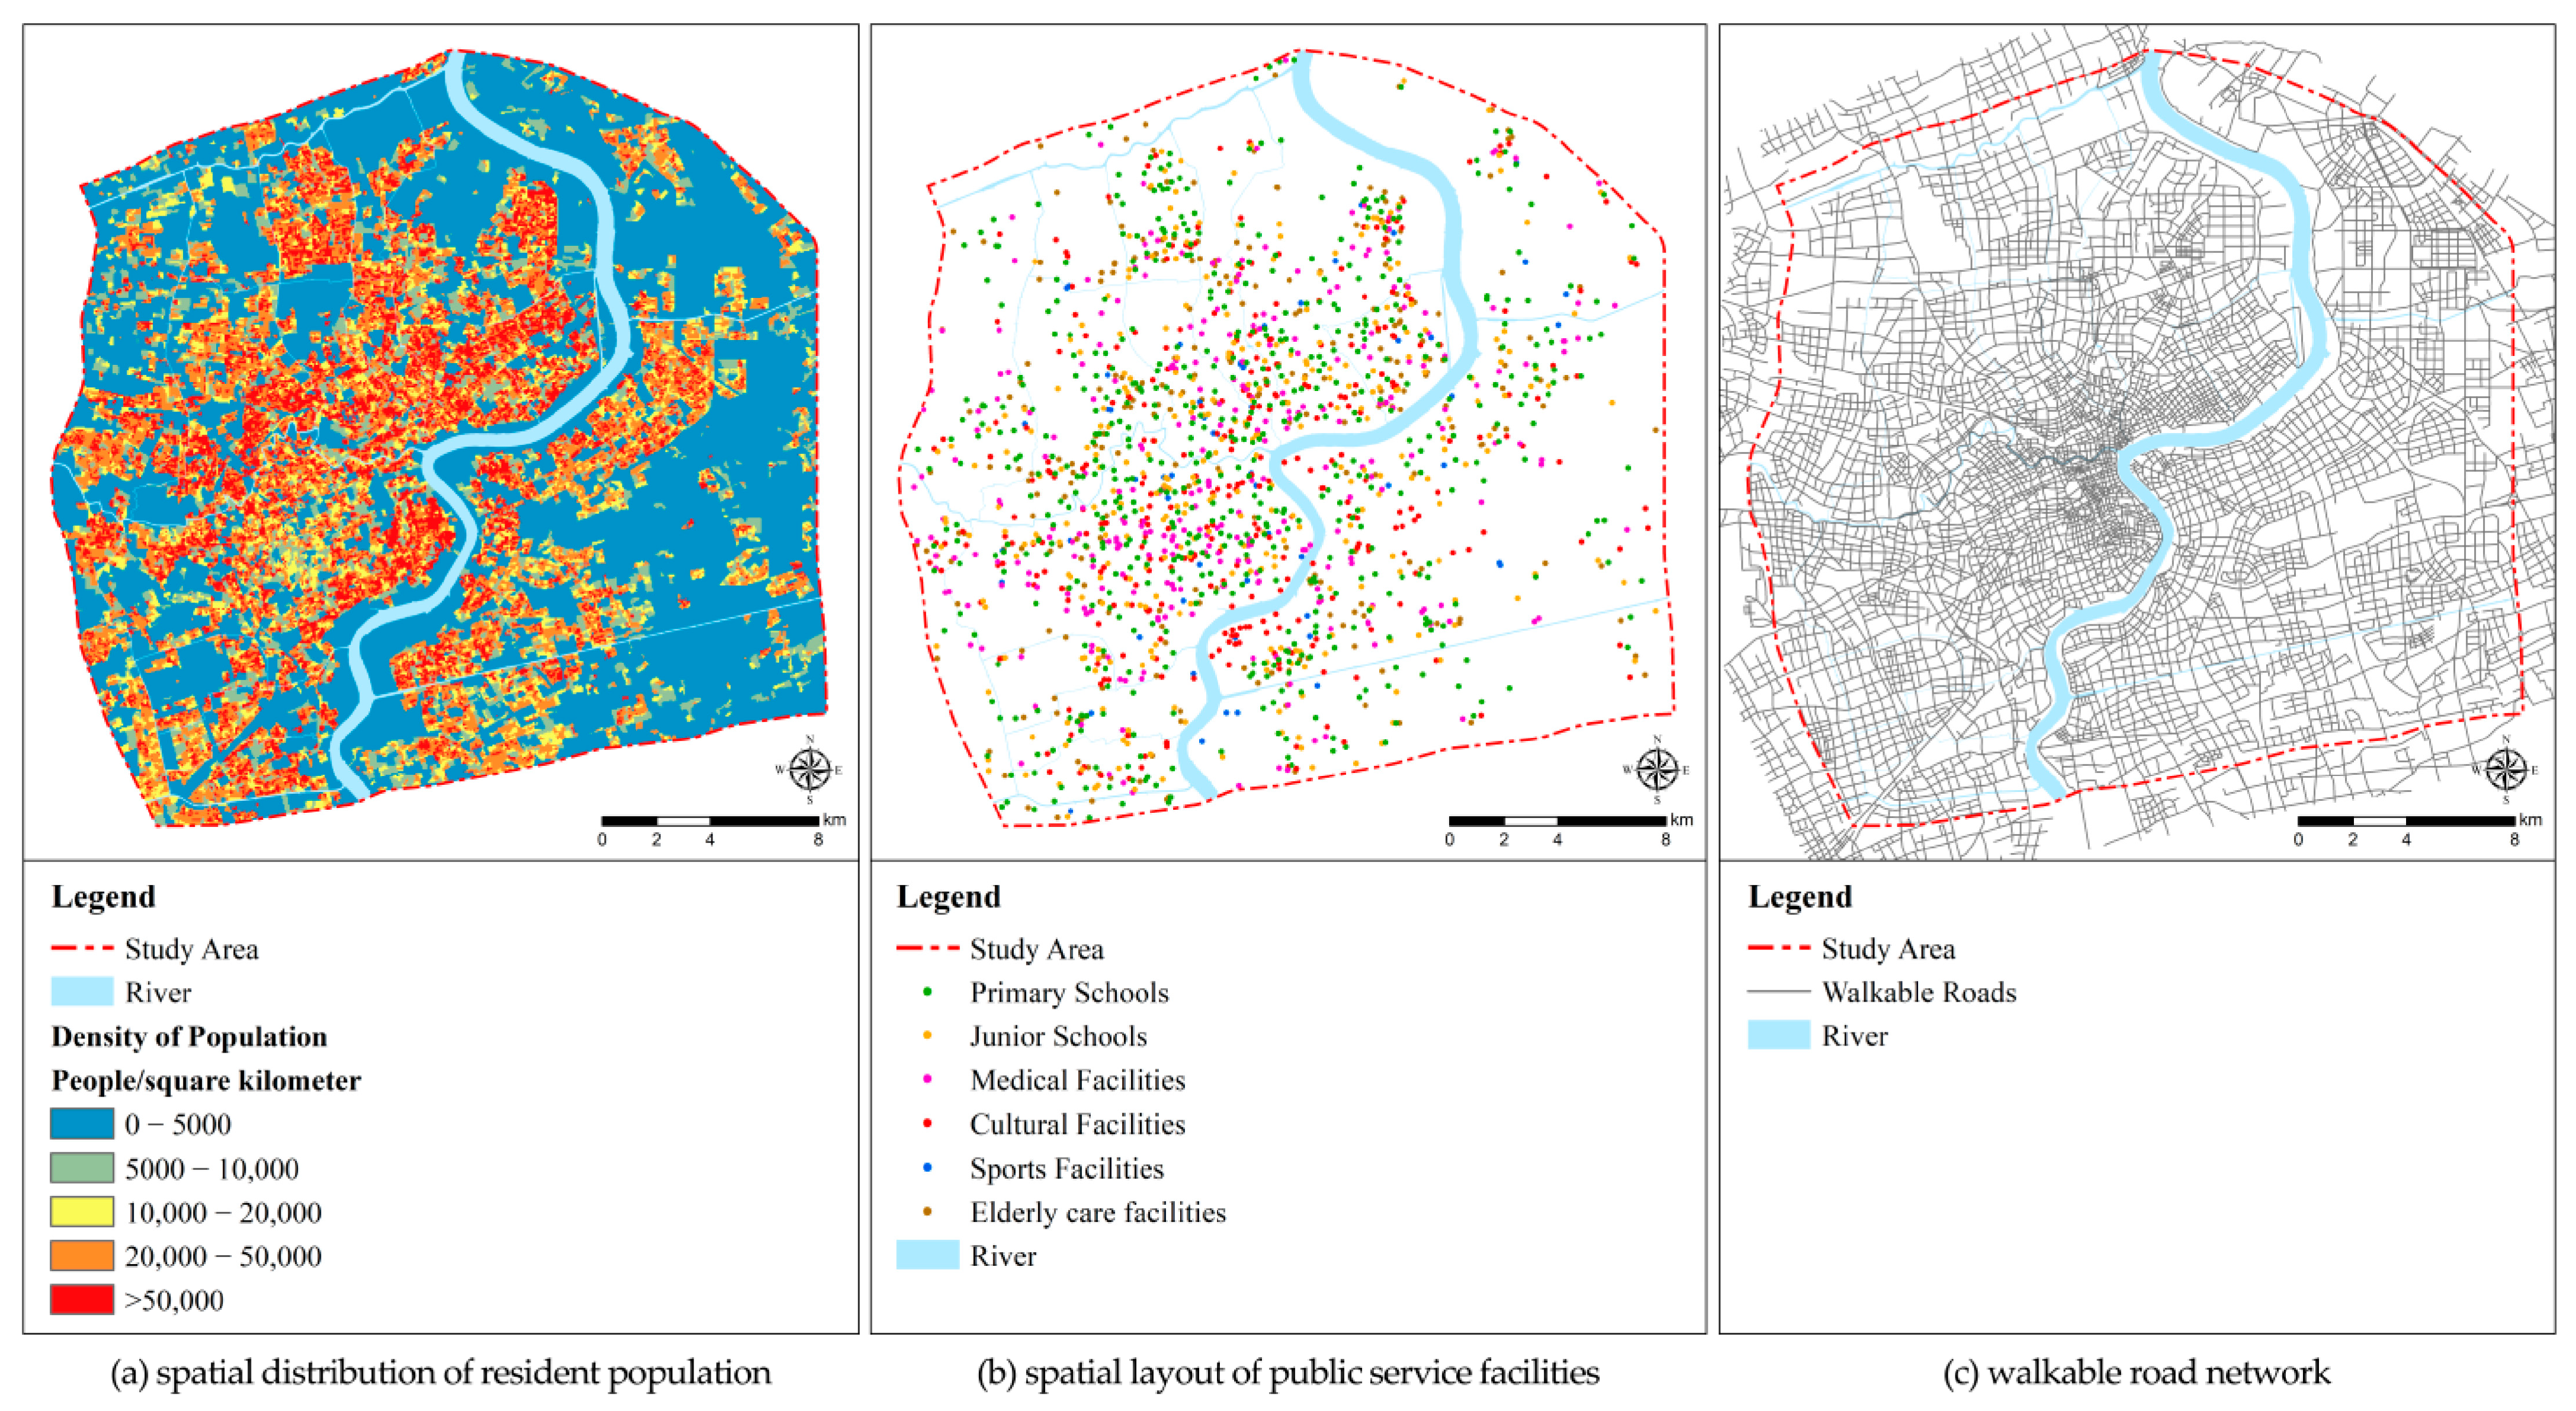
2.1. Materials

The subject of this study is the central city of Shanghai, which refers to the region within the outer ring of Shanghai. The main data required for the study consist of three types: (1) spatial distribution data of resident population; (2) spatial layout data of existing public service facilities; and (3) road network data. These three types of data are illustrated in Figure 2.
The data on resident population come from the Sixth Population Census in 2010, and the spatial scale is subdivided into neighborhoods. As shown in Figure 2a, the spatial distribution of the resident population in the central city of Shanghai exhibits a significant pattern of high concentration in certain local regions, with relatively dispersed features in other local areas. The relatively concentrated areas are usually the old urban areas, old neighborhood concentration zones, and newly built large residential areas, etc. The relatively dispersed areas include industrial parks, large parks and green areas, transportation and storage areas, and areas to be renewed. The spatial distribution data of public service facilities are extracted from the land use data of Shanghai around the year 2015, stored in the form of vector points, whose attribute table fields include the area of respective land parcels; the spatial distribution is shown in Figure 2b. The public service facilities selected for this study include basic education facilities, medical facilities, cultural facilities, sports facilities, and elderly care facilities. Among them are basic education facilities including primary and junior schools, which are analyzed separately in later sections because of the obvious age difference of the service groups they serve; medical facilities including general hospitals, specialized hospitals, community health service centers, etc.; cultural facilities including cultural centers, libraries, museums, science and technology museums, memorial museums, art galleries, exhibition halls, convention centers, children’s activity centers, etc.; sports facilities including stadiums, swimming pools, soccer fields, gymnasiums, sports grounds, etc.; and elderly care facilities including nursing homes, senior apartments, community home care service facilities, etc. The urban road network data within the study area are sourced from navigation map data, which are rectified using a combination of satellite maps. The data corresponds approximately to the year 2015, as depicted in Figure 2c. Since this study focuses on the 15 min living circle scale of the community, and the main mode of transportation for residents to reach public service facilities is walking, the road network was screened to retain only walkable roads and eliminate non-walkable bridges, elevated tunnels, and motor vehicle-only roads.

2.2. Methods

The formulation of the methodology is the focus of this study. It builds upon existing research to introduce centrality concepts from spatial syntax and social network theory. By comprehensively analyzing residents’ pedestrian pathways in the spatial network and how they relate to the positioning of public service facilities, an evaluation approach is put forth. This approach takes into account both the arrangement of public service facilities and the ease of residents’ pedestrian movements. The goal is to improve the equitable distribution of public service resources.
Firstly, there is a need to abstract the walkable road network. The basic road network shown in Figure 1 is abstracted into a node-edge topological network structure, as illustrated in Figure 3. In this structure, road sections are abstracted as nodes, and the connections between road sections are represented as edges. As depicted in Figure 3, road section 3 is connected to road sections 4, 10, 11, 2, 17, and 18. Consequently, the abstracted node 3 is linked to six edges connecting to other nodes.
Secondly, each node needs to be evaluated for centrality on the community walking scale. The result of this evaluation corresponds to the potential likelihood of residents passing on walkable paths. In spatial syntax and social network analysis, mature indexes for assessing node centrality already exist, including metrics such as degree, closeness, and betweenness [51,52,53,54]. In this study, betweenness is selected as a measure of node centrality. Betweenness refers to the extent to which a certain node lies on the shortest paths between any two nodes within a certain range. A higher value indicates greater importance of that node. Corresponding to the community-scale road network, if the betweenness of a road section is higher, it means that the daily walking activities generated by residents on this road section are higher. From observation of Figure 3, it can be roughly inferred that road section 3 near position A exhibits a higher degree of connectivity with surrounding roads, suggesting it might be a road section easily traversed by pedestrian activities. On the other hand, road section 17 near position C demonstrates a lower degree of connectivity with neighboring roads, indicating it could be a road section less frequented by pedestrian activities. Of course, this judgment needs to be verified by carrying out quantitative calculations.
sDNA version 4.1 software was selected to analyze the betweenness index of road sections in the walkable road network in this study. The software can be run based on the ArcGIS platform. According to the definition of sDNA software, the betweenness index is calculated as shown in the following Equations (1) and (2), and the TPBt(x) index, which eliminates the exponential effect brought by the number of node samples on the betweenness value, is calculated as shown in Equation (3) [55,56]. The values of TPBt(x) are mainly used in the later analysis.
B e t w e e n n e s s x = y N z R y W ( y ) W ( z ) P ( z ) O D ( y , z , x )
where
O D y , z , x = 1 ,   i f   x   i s   o n   t h e   f i r s t   g e o d e s i c   f o u n d   f r o m   y   t o   z 1 / 2 ,   i f   x = y z 1 / 2 ,   i f   x = z y 1 / 3 ,   i f   x = y = z 0 , o t h e r w i s e
T P B t x = y N z R y O D ( y , z , x ) W ( z ) P ( z ) t o t a l   w e i g h t ( y )
The meaning of each parameter in the above equation is illustrated in conjunction with Figure 3 [57]. Specify the search distance Ry (referring to an approximate distance of a 15 min walking radius, this study adopted a value of 1500 m) and specify the location of road section x (for example, the road section 3, noting that the position of x is fixed); take the center of any road section y (section y is the variable) in the network structure as the center of the circle with Ry as the radius. All road sections within the radius can be road section z. Calculate the shortest path between any road section z and y, respectively, if the shortest path passes through road section x, then assign the value according to the rule of OD(y,z,x) (road section x, y, and z may be the same road section); W(y) and W(z) are the weights of road sections y and z, respectively; p(z) is the length proportion of road section z within the above radius; and total weight(y) is the total weight in radius from each y [55,56,57]. In this study, the value of W(y) represents the residential population in the parcels around road section y, and the value of W(z) corresponds to the length of road section z. Figure 4 illustrates the calculation results without considering the weights of W(y) and W(z). It can be observed that the betweenness values of core area road sections (such as 2, 3, and 4) are relatively high among all road sections. Assuming that the distribution of residential population in the area is significantly uneven (which often aligns better with real-world scenarios) with a higher concentration of residents in the northeast region, as shown in Figure 5. Each point represents 100 people, and the population count of each point is aggregated to the nearest road section. This aggregated population count serves as the weight value for W(y) and the section length is used as the weight value for W(z). The results, considering the weights, are computed accordingly. In Figure 5, it can be observed that areas with relatively higher betweenness values are located in the northeast, such as sections 14, 4, and 11. This outcome is influenced by the population distribution. It is clear that the results from calculations that consider weights are closer to real-world situations.
Furthermore, the line densities are calculated based on the results of the analysis of the betweenness index values of the road sections, which are calculated to cover any position within the study area. The search radius for line density calculation still corresponds to a 15 min walking distance set at 1500 m in this study. The computed results depict the spatial distribution of potential demand for basic public service facilities by residents. This outcome introduces the influence of betweenness on the pedestrian road network. Moreover, an analysis of the supply density of current public service facilities is also required. Based on point data of existing public service facilities, density calculation in circular areas is conducted with the same 1500 m search radius. The weight field is defined by the facility’s scale (using land parcel area in this study). Thus, the calculation results for both the demand and supply situations of public service facilities at the pedestrian scale are established and stored as raster layers. Finally, supply–demand relationship analysis is carried out. The raster data of supply–demand analysis results can be aggregated to sub-districts, communities, or grids as the fundamental spatial units for subsequent analysis. Regression analysis is performed using the least squares method, calculating residual values. The dependent variable is the numerical demand for facilities, and the explanatory variables are the numerical supply of facilities. Based on residual values, equity of various types of public service facilities is assessed across different spatial units. Areas near a residual value of 0 indicate a basic balance, regions with significantly positive residuals reflect insufficient supply relative to demand, and areas with notably negative residuals signify a relative surplus supply of facilities.

3. Results

3.1. Analysis of Public Service Demand

The results of the analysis of the walkable road-based betweenness index in the central city of Shanghai are shown in Figure 6. The difference between Figure 6a,b lies in the search radius, which is 1500 m and unlimited distance, respectively. According to the previous definition, the search radius limits the farthest distance between the two nodes where the path occurs. From the calculation results, there is a significant difference between the two. The result in Figure 6b corresponds to an unbounded search distance, i.e., a walking path can occur between any two points in the study area. This is unlikely to be the case in practice, and very few people traverse the entire central city by walking. In addition, this scenario does not match the requirements of a community living circle, which generally requires that a variety of basic public services be within a 15 min walk. According to the human walking speed, which is about 5 km/h on average, the distance of 15 min generally does not exceed 1500 m. It is clear that the results with a search distance of 1500 m are more applicable to this study.
According to the definitions provided in the method section, when calculating the betweenness, the weight of road section y is determined by the sum of the permanent population in the surrounding parcels. Therefore, when generating paths, the results are positively correlated with the size of the population departing from that road section. In other words, in the case that the walking path conditions are all identical (ideal situation), the higher value of the road section reflects that there is more demand in the area. This result will serve as foundational data in subsequent studies to assess the population’s fundamental demand for public services within the region.
The spatial distribution of public service demand density in the central city of Shanghai based on the above results is shown in Figure 7. Warm-toned areas are areas with higher values, reflecting that residents in the relevant areas have a higher demand for public services; cool-toned areas are areas with lower values, reflecting a relatively low demand for public services. In general, the western part (Puxi) has a higher demand density than the eastern part (Pudong). Specifically, the demand density values are notably prominent in the central Huangpu, eastern Putuo, central Jing’an, south-central Hongkou, and southwest Yangpu areas. In Pudong, the areas with higher values are mainly distributed along the western bank of the Huangpu River. The eastern and northern parts of Pudong, as well as the northern part of Puxi, are regions with lower values.

3.2. Analysis of Public Service Facilities Supply

The spatial distribution calculation results of current supply density for public service facilities in the central city of Shanghai are shown in Figure 8, presenting the analysis results for primary schools, junior schools, medical, cultural, sports, and elderly care facilities, respectively. Based on the methodology outlined earlier, the point density calculation results incorporated the area of the respective parcels as a scale-weighting factor. It is evident that there are significant variations in the supply of different types of public service facilities. The spatial distribution of primary and junior school facilities is relatively balanced. This is due to the fact that the provision of basic education facilities requires careful consideration of service radii and ensuring equitable access to education for all individuals. The provision of medical service facilities is notably better in the Puxi region compared to the Pudong region. Moreover, within the Puxi area, there are areas with significantly higher supply levels, such as the northern part of Xuhui and the western part of Huangpu. The distribution of cultural facilities’ supply exhibits significant spatial variations, with distinct advantages in certain regions. For instance, the World Expo Park area stands out, encompassing the southern part of Huangpu and the southwestern part of Pudong, with the two areas facing each other across the Huangpu River. The spatial distribution of sports facilities’ supply also demonstrates significant variations, with certain large sports facilities (such as stadiums, football fields, and sports arenas) notably contributing to the values in their surrounding areas. For example, the central Xuhui area (where the Shanghai Stadium is located), the southwestern part of Pudong (where the Oriental Sports Center is located), and the central Hongkou area (where the Hongkou Football Stadium is located) exhibit this trend. These large facilities often operate at the municipal level. This notable imbalance in the supply density of cultural and sports facilities is closely related to inadequate supply at the community level. The provision of elderly care service facilities shows a relatively balanced spatial distribution. Moreover, there are some prominent high-value areas in regions like Yangpu, Hongkou, Jing’an, and Putuo, potentially linked to the higher aging population in those areas.

3.3. Spatial Equity Based on the Relationship of Supply and Demand

The sub-district serves as the fundamental spatial unit for the allocation of basic public service facilities within the 15 min living circle in Shanghai. Using sub-districts as spatial units, the analysis results concerning the demand for public service facilities and the spatial density of their supply are extracted. Furthermore, the residuals of the supply–demand relationship for each sub-district are calculated using the least squares method. The dependent variable is the demand value, while the explanatory variable is the supply value. The residuals between the demand for public service facilities and the supply of six categories of public service facilities are illustrated in Figure 9. Based on the results of residual analysis, the spatial equity of different types of public service facilities is evaluated, and regions with significant imbalances and inequalities are identified. The yellow region (near-zero residuals) represents areas with a basic balance between supply and demand. The red region (residuals significantly greater than zero) indicates areas where supply notably falls short of demand. The blue region (residuals significantly less than zero) corresponds to areas with surplus supply. In Figure 9, it can be observed that the contradiction of “insufficient supply to meet demand” for public service facilities is generally more pronounced in the central area of Puxi. However, there are also significant variations in the supply–demand relationships for different types of public service facilities. Regarding primary schools, the demand contradiction for primary school facilities is more prominent in areas such as the northwest of Huangpu, the southeast of Jing’an, the central part of Hongkou, and the western part of Yangpu. As for junior schools, the contradiction is more pronounced in areas such as the central-northern part of Huangpu, the southeast of Jing’an, the southwest of Hongkou, and the central part of Putuo. Concerning medical facilities, the contradiction is more significant in areas like the eastern part of Putuo and the central part of Hongkou. Regarding cultural facilities, the contradiction is more prominent in the central part of Hongkou and its surrounding areas. In terms of sports facilities, the contradiction is more pronounced in areas such as the central part of Huangpu and the central part of Hongkou. For elderly care facilities, the contradiction is more significant in areas including the central part of Huangpu, the central part of Hongkou, the southwest of Yangpu, and the southeast of Jing’an. Relatively speaking, in the Pudong area, there are no significantly pronounced areas where the supply of public service facilities is lower than the demand.

4. Discussion

The data used in this study consist of three types: the current layout of public service facilities, the residential distribution of the population, and the pedestrian road network. The real-world elements corresponding to these three types of data all affect the equity of the spatial allocation of public service facility resources to different degrees. Based on the results of these analyses, this paper explores the paths to enhance the equity of the layout of public service facilities in the central city of Shanghai from three perspectives.

4.1. Enhancing Equity via Optimizing the Layout of Public Service Facilities

The most direct path to enhancing equity is to optimize the layout of public service facilities to alleviate the conflict between supply and demand. For areas where demand exceeds supply, the layout of relevant public service facilities should be increased. For areas with weak coverage in spatial distribution, it is important to promptly fill these “gaps” and increase the number of facilities. For cases where the quantity is sufficient, but the scale is small, efforts should be made to enhance the facility’s scale to improve its comprehensive service capacity, as seen in the case of elderly care facilities in the Huangpu District. For cases where the scale is large, but coverage is insufficient, the supply level of secondary facilities (such as community level) should be increased whenever possible, as seen in the case of cultural and sports facilities in Shanghai’s central area. For areas where the supply is greater than the demand, different strategies should be adopted according to the actual situation. For relatively newer development areas, if there are regions that are not fully occupied, it may be advisable to reassess after full occupancy; for instance, areas like Zhangjiang Science City in the southeastern part of Pudong and the northwestern part of Puxi. In older urban areas, facility consolidation can be undertaken to integrate spatial resources, such as merging primary schools in the northeast of Putuo, junior schools in the southwest of Jing’an, and cultural facilities in the south of Huangpu. Furthermore, while optimizing and adjusting the layout of public service facilities, under the condition of meeting other requirements, the specific site selection should prioritize locations that are as close as possible to convenient transportation routes and areas.

4.2. Enhancing Equity via Optimizing Residential Spatial Patterns

People are the users of public service facilities, and the fundamental purpose of public service resource allocation is to meet their needs. The pattern of population distribution in cities is not static but changes dynamically with urban expansion or renewal. In urban planning efforts, designing and planning the spatial layout of residential populations is a crucial task. Therefore, enhancing the coupling between residential and facility layouts by optimizing the spatial arrangement of residential populations also serves as an essential practical pathway to promote equity in the allocation of public service facility resources. For Shanghai, the central city within the outer ring road remains the primary region of population concentration. Moreover, several highly concentrated zones exist within the central city itself, including Huangpu, the northern part of Xuhui, the southern part of Jing’an, the central-southern part of Hongkou, and the southwestern part of Yangpu. These areas experience more pronounced conflicts between population and land, characterized by relatively low per capita spatial resources, which manifest in aspects such as residential living, transportation, and public services. In recent years, Shanghai has consistently promoted population dispersion from the central city to alleviate its pressures. Several sub-centers have been planned in peripheral areas of the central city, and five new towns have been planned in suburban areas. According to census data, the efforts to disperse the population from the central city have achieved certain results, but further optimization is still possible. The previous analysis also indicates that the areas with the most pronounced supply–demand conflicts of public service facilities generally correspond to the highly concentrated population areas mentioned above. Therefore, it is necessary to continue optimizing the spatial distribution pattern of permanent residents via urban renewal and new town development. This will enhance the spatial equity of public services. Additionally, encouraging population migration to sub-centers and new towns would also contribute to better utilization of relatively abundant public service resources in these areas, leading to improved resource allocation efficiency.

4.3. Enhancing Equity via Optimizing Pedestrian Transportation Networks

People rely on the pedestrian transportation network to access public service facilities within their community living areas. In other words, the pedestrian transportation network is a crucial infrastructure that ensures the realization of the supply–demand relationship for public service resources. Therefore, it is essential to pay adequate attention to the impact of the construction conditions of the pedestrian transportation network on the equity of public service facility resource allocation. To illustrate with an extreme example, if there are no roads, regardless of how large the population within an area is, the demand for public services cannot be realized spatially, and the area may tend to exhibit a “supply exceeds demand” characteristic. The actual situation is generally not so extreme, but the density of the road network, the shape of the network, and how road sections are connected to each other all affect the paths and flows of trips. This is well discussed in the theory of spatial syntax. A better pedestrian road network (with higher betweenness of road sections) can promote the enhancement of residents’ walking flow; a poor pedestrian road network (with lower betweenness of road sections) can inhibit residents’ walking trips, which further inhibits residents’ willingness to walk to reach public service facilities. For facilities such as primary and junior high schools, where commuting is a necessity, the facilitating or inhibiting effect of the road network is not obvious. However, for cultural and sports facilities where commuting is not mandatory, the facilitating or inhibiting effect of the road network will be more significant. Therefore, it is essential to carefully consider the conditions of the pedestrian network to prevent low-level networks from constraining demand, which would result in a relatively balanced supply–demand relationship. For the central city of Shanghai, due to the different development sequences of different areas, there are differences in planning concepts, and there are also significant differences in the characteristics of its road network structure. The central-western part of Puxi (Huangpu, northern Xuhui, and southern Jing’an), the southern part of Hongkou, and the southern part of Yangpu have higher road network densities and better connectivity. The overall structure of their pedestrian networks should be maintained and further optimized in detail. The western part of Pudong has lower road network density, but reasonable connectivity. In areas with higher demand density for public service facilities, the pedestrian network within neighborhoods can be densified appropriately. The northwestern part of Puxi and the southeastern part of Pudong have lower road network densities and poor connectivity, requiring phased improvements in the pedestrian transportation network in conjunction with development plans for these areas.

5. Conclusions

This study aims to prioritize equity, taking into account the characteristics of residential population distribution, the existing layout of public service facilities, and the structure of pedestrian transportation networks. It proposes an optimized analysis method for the layout of public service facilities, incorporating an index related to node centrality from spatial syntax and social network analysis. Based on the analysis of Shanghai’s central city, the study includes (1) an analysis of public service demand; (2) an analysis of public service facilities supply; and (3) spatial equity based on the relationship between supply and demand. The analysis results help identify issues in the layout of public service facilities in Shanghai’s central city and provide support for enhancing equity in the allocation of public service resources. The study suggests that equity can be enhanced via the following pathways: (1) optimizing the layout of public service facilities; (2) optimizing residential spatial patterns; and (3) optimizing pedestrian transportation networks. The proposed method has technical support for dynamically assessing the layout of public service facilities in territorial spatial planning and designing planning solutions.
There are also some limitations in this study. The current definition of section weights for the pedestrian network employs the number of residents of the nearby parcels to model population-based path activity. This weight definition is suitable for the overall scale of this study (within the central city of Shanghai). If future studies are conducted at smaller scales (such as district and sub-district levels), the weight definition approach can be refined. When calculating the supply density of public service facilities, the scale weight used is the land area of the facility. This choice is a compromise based on data constraints. However, it is worth noting that the size of certain public service facilities is more related to their floor area, and more accurate data could be employed in subsequent analyses if conditions permit. In addition, although this study subdivides the types of public service facilities, demographic categories are not currently further broken down. In reality, some public service facilities cater to specific groups; for example, primary and secondary school facilities serve young people, and elderly facilities mainly serve the elderly. In the future, the analysis methods can be further optimized to accommodate the diverse needs of different groups.

Funding

This research was funded by the Shanghai Philosophy and Social Science Planning Youth Project, grant number 2019ECK007.

Data Availability Statement

The data used in this study have been presented in the drawings with a high degree of accuracy. The shapefile data are not publicly available.

Conflicts of Interest

The author declares no conflict of interest.

References

  1. Rawls, J. A Theory of Justice; The Belknap Press of Harvard University Press: Cambridge, MA, USA, 1971. [Google Scholar]
  2. Jiang, H.; Zhou, C.; Gao, J. Advance in the Equity of Spatial Distribution of Urban Public Service in Western Countries. City Plan. Rev. 2011, 35, 72–77. [Google Scholar]
  3. Li, A.; Zhang, J. Equal Urban Rural Public Service Facility Development. Planners 2011, 27, 5–11. [Google Scholar]
  4. Lucy, W. Equity and Planning for Local Services. J. Am. Plan. Assoc. 1981, 47, 447–457. [Google Scholar] [CrossRef]
  5. Hay, A.M. Concepts of Equity, Fairness and Justice in Geographical Studies. Trans. Inst. Br. Geogr. 1995, 20, 500–508. [Google Scholar] [CrossRef]
  6. Yhee, H.; Kim, S.; Kang, S. GIS-Based Evaluation Method for Accessibility of Social Infrastructure Facilities. Appl. Sci. 2021, 11, 5581. [Google Scholar] [CrossRef]
  7. Heynen, N.; Perkins, H.A.; Roy, P. The Political Ecology of Uneven Urban Green Space. Urban Aff. Rev. 2006, 42, 3–25. [Google Scholar] [CrossRef]
  8. Perkins, H.A.; Heynen, N.; Wilson, J. Inequitable access to urban reforestation: The impact of urban political economy on housing tenure and urban forests. Cities 2004, 21, 291–299. [Google Scholar] [CrossRef]
  9. Gao, J.; Zhou, C.; Ye, C. The Equitable Distribution of Public Services in Guangzhou. Planners 2010, 26, 12–18. [Google Scholar]
  10. Jiang, H.; Zhou, C.; Xiao, R. Spatial Differentiation and Social Equity of Public Parks in Guangzhou. City Plan. Rev. 2010, 4, 43–48. [Google Scholar]
  11. Zhang, Y.; Tarrant, M.A.; Green, G.T. The importance of differentiating urban and rural phenomena in examining the unequal distribution of locally desirable land. J. Environ. Manag. 2008, 88, 1314–1319. [Google Scholar] [CrossRef]
  12. Comber, A.; Brunsdon, C.; Green, E. Using a GIS-based network analysis to determine urban greenspace accessibility for different ethnic and religious groups. Landsc. Urban Plan. 2008, 86, 103–114. [Google Scholar] [CrossRef]
  13. Wicks, B.E.; Crompton, J.L. Citizen and Administrator Perspectives of Equity in the Delivery of Park Services. Leis. Sci. 1986, 8, 341–365. [Google Scholar] [CrossRef]
  14. Erkip, F. The distribution of urban public services: The case of parks and recreational services in Ankara. Cities 1997, 14, 353–361. [Google Scholar] [CrossRef]
  15. Wolch, J.; Wilson, J.P.; Fehrenbach, J. Parks and Park Funding in Los Angeles: An Equity-Mapping Analysis. Urban Geogr. 2005, 26, 4–35. [Google Scholar] [CrossRef]
  16. Wang, S.; Yung, E.; Hiu, K.; Yu, Y.; Tsou, J.Y. Right to the city and community facility planning for elderly: The case of urban renewal district in Hong Kong. Land Use Policy 2022, 114, 105978. [Google Scholar] [CrossRef]
  17. Weng, M.; Ding, N.; Li, J.; Jin, X.; Xiao, H.; He, Z.; Su, S. The 15-minute walkable neighborhoods: Measurement, social inequalities and implications for building healthy communities in urban China. J. Transp. Health 2019, 13, 259–273. [Google Scholar] [CrossRef]
  18. Caselli, B. From urban planning techniques to 15-minute neighbourhoods. A theoretical framework and GIS-based analysis of pedestrian accessibility to public services. Eur. Transp./Trasp. Eur. 2021, 85, 1–15. [Google Scholar] [CrossRef]
  19. Caselli, B.; Carra, M.; Rossetti, S.; Zazzi, M. Exploring the 15-minute neighbourhoods. An evaluation based on the walkability performance to public facilities. Transp. Res. Procedia 2022, 60, 346–353. [Google Scholar] [CrossRef]
  20. Song, G.; He, X.; Kong, Y.; Li, K.; Song, H.; Zhai, S.; Luo, J. Improving the Spatial Accessibility of Community-Level Healthcare Service toward the ‘15-Minute City’ Goal in China. ISPRS Int. J. Geo-Inf. 2022, 11, 436. [Google Scholar] [CrossRef]
  21. Lin, L.; Chen, T. The activity space and the 15-minute neighborhood: An empirical study using big data in Qingdao, China. J. Transp. Land Use 2023, 16, 1–17. [Google Scholar] [CrossRef]
  22. Zhang, S.; Zhen, F.; Kong, Y.; Lobsang, T.; Zou, S. Towards a 15-minute city: A network-based evaluation framework. Environ. Plan. B Urban Anal. City Sci. 2023, 50, 500–514. [Google Scholar] [CrossRef]
  23. Shanghai Municipal People’s Government. Shanghai Master Plan (2017–2035); Shanghai Scientific & Technical Publishers: Shanghai, China, 2018. [Google Scholar]
  24. Standard TD/T 1062-202; Spatial Planning Guidance to Community Life Unit. Ministry of Natural Resources of the People’s Republic of China: Beijing, China, 2021.
  25. Joel, E. GIS-based Network Analysis for Optimisation of Public Facilities Closure: A Study on Libraries in Leicestershire, United Kingdom. J. Geogr. Environ. Earth Sci. Int. 2019, 23, 1–18. [Google Scholar] [CrossRef]
  26. Hakimi, S.L. Optimum Locations of Switching Centers and the Absolute Centers and Medians of a Graph. Oper. Res. 1964, 12, 450–459. [Google Scholar] [CrossRef]
  27. Church, R.; ReVelle, C. The Maximal Covering Location Problem; Springer: Berlin/Heidelberg, Germany, 1974. [Google Scholar]
  28. ReVelle, C.; Toregas, C.; Falkson, L. Applications of the Location Set-covering Problem. Geogr. Anal. 1976, 8, 65–76. [Google Scholar] [CrossRef]
  29. Cornuéjols, G.; Nemhauser, G.; Wolsey, L. The Uncapacitated Facility Location Problem; School of Operations Research and Industrial Engineering, College of Engineering, Cornell University: Ithaca, NY, USA, 1983. [Google Scholar]
  30. Talen, E. Visualizing Fairness: Equity Maps for Planners. J. Am. Plan. Assoc. 1998, 64, 22–38. [Google Scholar] [CrossRef]
  31. Ribeiro, A.; Antunes, A.P. A GIS-based decision-support tool for public facility planning. Environ. Plan. B Plan. Des. 2002, 29, 553–569. [Google Scholar] [CrossRef]
  32. Talen, E.; Anselin, L. Assessing spatial equity: An evaluation of measures of accessibility to public playgrounds. Environ. Plan. A 1998, 30, 595–613. [Google Scholar] [CrossRef]
  33. Lindsey, G.; Maraj, M.; Kuan, S. Access, equity, and urban greenways: An exploratory investigation. Prof. Geogr. 2001, 53, 332–346. [Google Scholar] [CrossRef]
  34. Omer, I. Evaluating accessibility using house-level data: A spatial equity perspective. Comput. Environ. Urban Syst. 2006, 30, 254–274. [Google Scholar] [CrossRef]
  35. Comer, J.C.; Skraastad-Jurney, P.D. Assessing the Locational Equity of Community Parks through the Application of Geographic Information Systems. J. Park Recreat. Adm. 2008, 26, 122–146. [Google Scholar]
  36. Neutens, T.; Schwanen, T.; Witlox, F.; De Maeyer, P. Equity of urban service delivery: A comparison of different accessibility measures. Environ. Plan. A 2010, 42, 1613–1635. [Google Scholar] [CrossRef]
  37. Tome, A.; Santos, B.; Carvalheira, C. GIS-Based Transport Accessibility Analysis to Community Facilities in Mid-Sized Cities. IOP Conf. Ser. Mater. Sci. Eng. 2019, 471, 62034. [Google Scholar] [CrossRef]
  38. Wang, F. Why Public Health Needs GIS: A Methodological Overview. Ann. GIS 2020, 26, 1–12. [Google Scholar] [CrossRef] [PubMed]
  39. Huang, B.; Chiou, S.; Li, W. Accessibility and Street Network Characteristics of Urban Public Facility Spaces: Equity Research on Parks in Fuzhou City Based on GIS and Space Syntax Model. Sustainability 2020, 12, 3618. [Google Scholar] [CrossRef]
  40. Al-Rashid, M.A.; Rao, M.N.; Ahmad, Z. Using GIS measures to analyze the spatial equity to public parks in Lahore metropolitan. J. Res. Archit. Plan. 2020, 28, 8–19. [Google Scholar]
  41. Delbosc, A.; Currie, G. Using Lorenz curves to assess public transport equity. J. Transp. Geogr. 2011, 19, 1252–1259. [Google Scholar] [CrossRef]
  42. Tang, Z.; Gu, S. An Evaluation of Social Performance in the Distribution of Urban Parks in the Central City of Shanghai: From Spatial Equity to Social Equity. Urban Plan. Forum 2015, 222, 48–56. [Google Scholar]
  43. MA, Y. An Evaluation Method of Resident-oriented Urban Public Green Space Services Level: Comparison of 1982 and 2015 in Shanghai Inner-ring. Shanghai Urban Plan. Rev. 2017, 3, 121–128. [Google Scholar]
  44. Zhang, J.; Ge, Z.; Luo, Z.; Sun, S. Research on Equalized Layout of Urban and Rural Public Facilities: A Case Study of Educational Facilities in Changzhou. City Plan. Rev. 2012, 36, 9–15. [Google Scholar]
  45. Liu, W.; Sun, W.; Xing, Y. GIS Network Analysis Based Old City Educational Facilities Service Area Zoning and Scale Calculation: Tianjin Binhai New District Old City Primary School Example. Planners 2012, 28, 82–85. [Google Scholar]
  46. Song, X.; Chen, C.; Zhou, J.; Zhai, Y.; Li, S. Exploration and Improvement of Planning Methods for the Distribution of Primary and Secondary Schools. City Plan. Rev. 2014, 38, 48–56. [Google Scholar]
  47. Batty, M. A New Theory of Space Syntax; Centre for Advanced Spatial Analysis, University College London: London, UK, 2004. [Google Scholar]
  48. Batty, M. Accessibility: In search of a unified theory. Environ. Plan. B Plan. Des. 2009, 36, 191–194. [Google Scholar] [CrossRef]
  49. Batty, M. Exploring isovist fields: Space and shape in architectural and urban morphology. Environ. Plan. B Plan. Des. 2001, 28, 123–150. [Google Scholar] [CrossRef]
  50. Batty, M.; Rana, S. The automatic definition and generation of axial lines and axial maps. Environ. Plan. B Plan. Des. 2004, 31, 615–640. [Google Scholar] [CrossRef]
  51. Bavelas, A. Communication Patterns in Task-Oriented Groups. J. Acoust. Soc. Am. 1950, 22, 725–730. [Google Scholar] [CrossRef]
  52. Freeman, L.C. The gatekeeper, pair-dependency and structural centrality. Qual. Quant. 1980, 14, 585–592. [Google Scholar] [CrossRef]
  53. Freeman, L.C. The intuitive background for measures of structural centrality in social. Soc. Netw. 1978, 1, 215–239. [Google Scholar] [CrossRef]
  54. Freeman, L.C. A Set of Measures of Centrality Based on Betweenness. Sociometry 1977, 40, 35–41. [Google Scholar] [CrossRef]
  55. Cooper, C.H.V.; Chiaradia, A.J.F. sDNA: 3-d spatial network analysis for GIS, CAD, Command Line & Python. SoftwareX 2020, 12, 100525. [Google Scholar]
  56. Cooper, C. Spatial Design Network Analysis (sDNA) Version 4.1 Manual; Cardiff University: Cardiff, UK, 2021. [Google Scholar]
  57. Chen, C. The Suitable Structure of Urban Road Network for Normal Bus Transit; Shanghai People’s Publishing House: Shanghai, China, 2022. [Google Scholar]
Figure 1. Facility location and road network.
Land 12 01780 g001
Figure 2. The three types of data required for this study in the central city of Shanghai.
Land 12 01780 g002
Figure 3. Abstracted node-edge road network structure.
Land 12 01780 g003
Figure 4. Betweenness value of the illustrative road network (without weights).
Land 12 01780 g004
Figure 5. Betweenness value of the illustrative road network (with weights).
Land 12 01780 g005
Figure 6. Betweenness index of the walkable road network in the central city of Shanghai.
Land 12 01780 g006
Figure 7. Density of betweenness index of the walkable road network in the central city of Shanghai (radius = 1500 m).
Land 12 01780 g007
Figure 8. Point density of facilities in the central city of Shanghai (radius = 1500 m).
Land 12 01780 g008
Figure 9. OLS-based residual analysis: facilities demand and supply in the central city of Shanghai.
Land 12 01780 g009
Disclaimer/Publisher’s Note: The statements, opinions and data contained in all publications are solely those of the individual author(s) and contributor(s) and not of MDPI and/or the editor(s). MDPI and/or the editor(s) disclaim responsibility for any injury to people or property resulting from any ideas, methods, instructions or products referred to in the content.

