Article

The Spatial Protection and Governance of Territories Based on the Ecological Product Supply: A Case Study in Beijing–Tianjin–Hebei, China

School of Urban Economics and Public Administration, Capital University of Economics and Business, Beijing 100070, China
*
Author to whom correspondence should be addressed.
Land 2023, 12(12), 2130; https://doi.org/10.3390/land12122130
Submission received: 7 November 2023 / Revised: 25 November 2023 / Accepted: 30 November 2023 / Published: 2 December 2023

Abstract

:
Territory space is an ecological resource carrier and place for human development. Human activities and ecological systems are the basis of ecological product supply. Promoting territories’ spatial protection and governance by improving the supply of ecological products is very important. In this study, we established an ecological product supply capacity evaluation index system involving three types of ecological products, i.e., ecological environmental products, ecological material products, and ecological cultural products. For the case of the Beijing–Tianjin–Hebei region, we comprehensively used principal component analysis, the equivalent factor method, and the entropy method to evaluate the supply capacity of ecological products from 2011 to 2021. Then, we analyzed the spatio-temporal pattern, combining the natural breakpoint and quantile classification methods, and analyzed the obstacle factors using the obstacle degree model of ecological supply. The results show that the supply capacity of different ecological products in each city are closely related to their ecological resource endowment. The supply capacity of ecological products exhibited an upward trend, with the highest ecological environmental product supply being relatively smaller than the ecological material product supply, while the largest growth rate was for ecological cultural product supply. The supply capacity of different ecological products varied across cities over time and displayed noticeable spatial differentiation. The main obstacle factors included eco-land, eco-tourism, eco-leisure, park green space, and fishery products, although there were variations among cities. Finally, based on the level, spatial-temporal pattern, and obstacle factors of ecological product supply, we proposed strategies for territory spatial protection and governance from the perspectives of the integrated protection of elements, structural regulation, and systematic governance. The results reflected the ecological functional heterogeneity of the territory space, which can provide spatial planning guidance for sustainable development.

1. Introduction

Many of the social challenges humans face are closely related to the scarcity of available land resources and the contradiction between land supply and demand, such as food security and ecological damage [1]. Territory spatial planning helps improve land quality and land use efficiency [2] and is considered an essential tool for achieving global sustainable development [3]. With the progress of the Global Land Project (GLP), conducting territory spatial planning from the viewpoint of social–ecological interactions, such as providing ecosystem services, has become a topic of focus [4]. Territory space refers to the regional area under national sovereignty and jurisdictional rights. It is the provider of ecological resources and the place for human production and living. Territory spatial protection and governance help coordinate human development activities, protecting ecological resources and becoming the fundamental basis for various land resource developments in China [5]. Ecosystem services can reflect the ecological functions of territory spaces, but the ecological function damage caused by human over-exploitation has affected these services [6]. Therefore, ecosystem services should be incorporated into territories’ spatial protection and governance to protect ecological resources and achieve human well-being.
The concept of ecological products was initially introduced by China in 2010 as an enhanced iteration of the notion of ecosystem services, and its primary objective was to address the protection and governance challenges related to territory spaces [7]. Human activities and ecological systems are the basis of ecological product supply. Promoting territory spatial protection and governance by improving the ecological products’ supply is very important. China has adopted holistic and systematic thinking to organically combine original economic social development and land use planning, forming a “multiple planning in one” planning of territory space [5]. Opinions on Establishing and Improving the Mechanism for Realizing the Value of Ecological Products, published by China in 2021, explicitly state that conducting suitability evaluations for the utilization of ecological products in territorial spatial planning promotes the supply of ecological products [8]. In view of this, ecological product supply provides a powerful perspective for territory spatial protection and governance and can serve as a research carrier for land resource allocation and spatial interest coordination, further promoting high-quality development. The Beijing–Tianjin–Hebei Coordinated Development Strategy plays a leading and exemplary role in coordinating the development of land and the ecological environment in China. It is necessary to evaluate and analyze the ecological product supply capacity in the Beijing–Tianjin–Hebei region to discuss the protection and governance strategy of the territory’s space.
Previous studies have focused on improving the ecosystem services to guide territory spatial protection and governance in countries, but there has been relatively little research on ecological product supply, especially in countries outside of China, such as those in Europe and the Americas. By exploring the role of ecosystem services in multiple urban planning documents, it was found that incorporating ecosystem services into territory space planning helped protect the environment and meet the needs of various stakeholders [9,10]. Interviews on the values of local authorities and stakeholders regarding the inclusion of ecosystem services in spatial planning indicated that people generally recognize its usefulness [11,12]. Some scholars have quantified and predicted the benefits of incorporating ecosystem services into land use governance [13], green infrastructure planning [14], and biodiversity protection [15]. The effectiveness of land conservation policies, such as ecological compensation and restoration, has been evaluated [16]. Spatial assessment and planning have been conducted by mapping ecosystem services’ demand, flow, and capacity [17]. Although previous research has confirmed that ecosystem services have theoretical and practical support in territory space planning, the application of territory space supply in territory spatial protection and governance was unclear. Implementing the ecological product supply in territory spatial protection and governance lacked pre-planning and overall planning in China [18]. It is necessary to explore the basic evaluations, development directions, target indicators, and spatial guidance of ecological product supply. In addition, there are many ways to promote territory spatial protection and governance through ecological product supply, such as managing natural resource assets [19], spatial zoning classification for territory space regulation [20], and the ecological restoration of territory space [21].
For territory space planning in China, it is urgent to clarify the connotation and classification of the ecological product supply, connect it with the needs of territory spatial planning, and allow it to play a role in the spatial protection and governance of territory. Internationally, ecological products are defined similarly to ecosystem services, which pertain to the environmental conditions and benefits that ecosystems provide and sustain for human survival and development [22]. In China, ecological products denote the products and services provided by ecosystems for human well-being [23]. While scholars have different perspectives on ecological products, it is generally understood to be a term encompassing the products and services arising from the interaction between natural ecology and human society, ultimately leading to an improvement in human well-being. Many researchers have classified ecological products from different perspectives: According to the degree of human social participation, ecological products have been divided into natural element products, natural attribute products, ecological derivative products, and ecological label products [24]. According to the social needs of humans, ecological products have been categorized into public, quasi-public, and commercial ecological products [25]. Based on their ecological attributes, ecological products have been further divided into material products, ecological regulation service products, and cultural service products [26].
The ecological products’ supply capacity refers to the ecosystem’s ability to provide ecological products and services within a defined time and space range [27], and there is no unified understanding or standards for its evaluation indicators and methods. The most representative indicator systems include the system constructed by Costanza et al. [28], which consists of 17 categories, such as climate and gas regulation. The Millennium Ecosystem Assessment report proposes four categories: provisioning, regulating, supporting, and cultural services [29]. The Common International Classification of Ecosystem Goods and Services (CICES) classified it into material supply, regulation, and cultural services [30]. Some scholars have established an indicator selection framework comprising ecological service attributes, functions, and services [31]. Currently, the assessment of ecological products can be measured in terms of functional and value quantity. Functional quantity represents the quantity of ecological products formed by ecosystem functions such as food production, water supply, pollution purification, soil conservation, and tourist numbers. It is intuitive and concrete, but due to different units of measurement, it is difficult to add up the output and services of different ecosystem products. Value assessment methods are relatively old and refined, which include the equivalent factor method [28], the direct market valuation method [32], and the contingent valuation method [33]. The direct and contingent market valuation methods determine the value of ecosystem services by considering the market prices that reflect different human preferences. The equivalent factor method utilizes an ecosystem service values-equivalent table to combine various land ecosystem service functions and the area of different ecosystem types, thereby obtaining the total service value of the research area. In China, the equivalent factor method is extensively used, particularly in land-use-cover change assessments. The studies above have provided crucial theoretical support for establishing evaluation indicators and methods for assessing the ecological product supply capacity.
So far, research on how the ecological product supply promotes territory spatial protection and governance has made substantial progress, but there are also some shortcomings: (1) The research on territory spatial protection and governance from the perspective of the ecological product supply is still in the exploratory stage. (2) The quantitative indicators and evaluation methods for the ecological product supply capacity must be improved. So, we developed an evaluation index system for the ecological product supply capacity to address these two issues. (1) By utilizing data from 13 cities in the Beijing–Tianjin–Hebei region spanning from 2011 to 2021, we quantified the level, spatial-temporal pattern, and obstacle degree of the ecological product supply capacity. We found that the supply capacity of ecological products showed an increasing trend; different types of ecological products varied across cities and over time, exhibiting noticeable spatial differentiation. Obstacle factors affecting the supply capacity included eco-land, eco-tourism, eco-leisure, park green space, and fishery products, although there were variations among cities. Then, we analyzed the strategy to promote territory spatial protection and governance from the perspectives of the integrated protection of elements, structural regulation, and systematic governance.
This study aims to explore promoting territory spatial protection and governance from the perspective of enhancing the supply capacity of ecological products, using the Beijing–Tianjin–Hebei region as an example. The specific objectives include: (1) Evaluating the ecological product supply capacity in the Beijing–Tianjin–Hebei region, and analyzing its level, spatio-temporal pattern, and obstacle factors. (2) Based on the level, pattern, and obstacles of the ecological product supply, constructing strategies for territory spatial protection and governance from the perspectives of comprehensive protection, structural regulation, and systematic governance. The research has the following significance: (1) It identifies the differences in each category’s ecological product supply capacity in the Beijing–Tianjin–Hebei region. (2) Proposing strategies for territory spatial protection and governance from the ecological product supply perspective expands the territorial space planning research perspective. (3) It provides China’s example for global sustainable development, especially providing spatial planning guidance for sustainable development in regions with a spatial imbalance between ecological resources and economic development.
The rest of the structure is as follows: Section 2 introduces the research area, data sources, and the workflow of processing the ecological products’ supply indicators and data, and then presents the index system and methods. Section 3 analyzes the results. Section 4 discusses the strategies for territory spatial protection and governance to enhance the ecological products’ supply capacity. Section 5 presents the research conclusions.

2. Materials and Methods

To explore the strategy of promoting territory spatial protection and governance based on the ecological product supply, we chose the Beijing–Tianjin–Hebei (BTH) region as the study area and introduced the data source. Then, we discussed the processing flow of the ecological product supply capacity for achieving territory spatial protection and governance, further constructed the ecological product supply capacity evaluation index system, and introduced the research methods.

2.1. Research Area and Data Sources

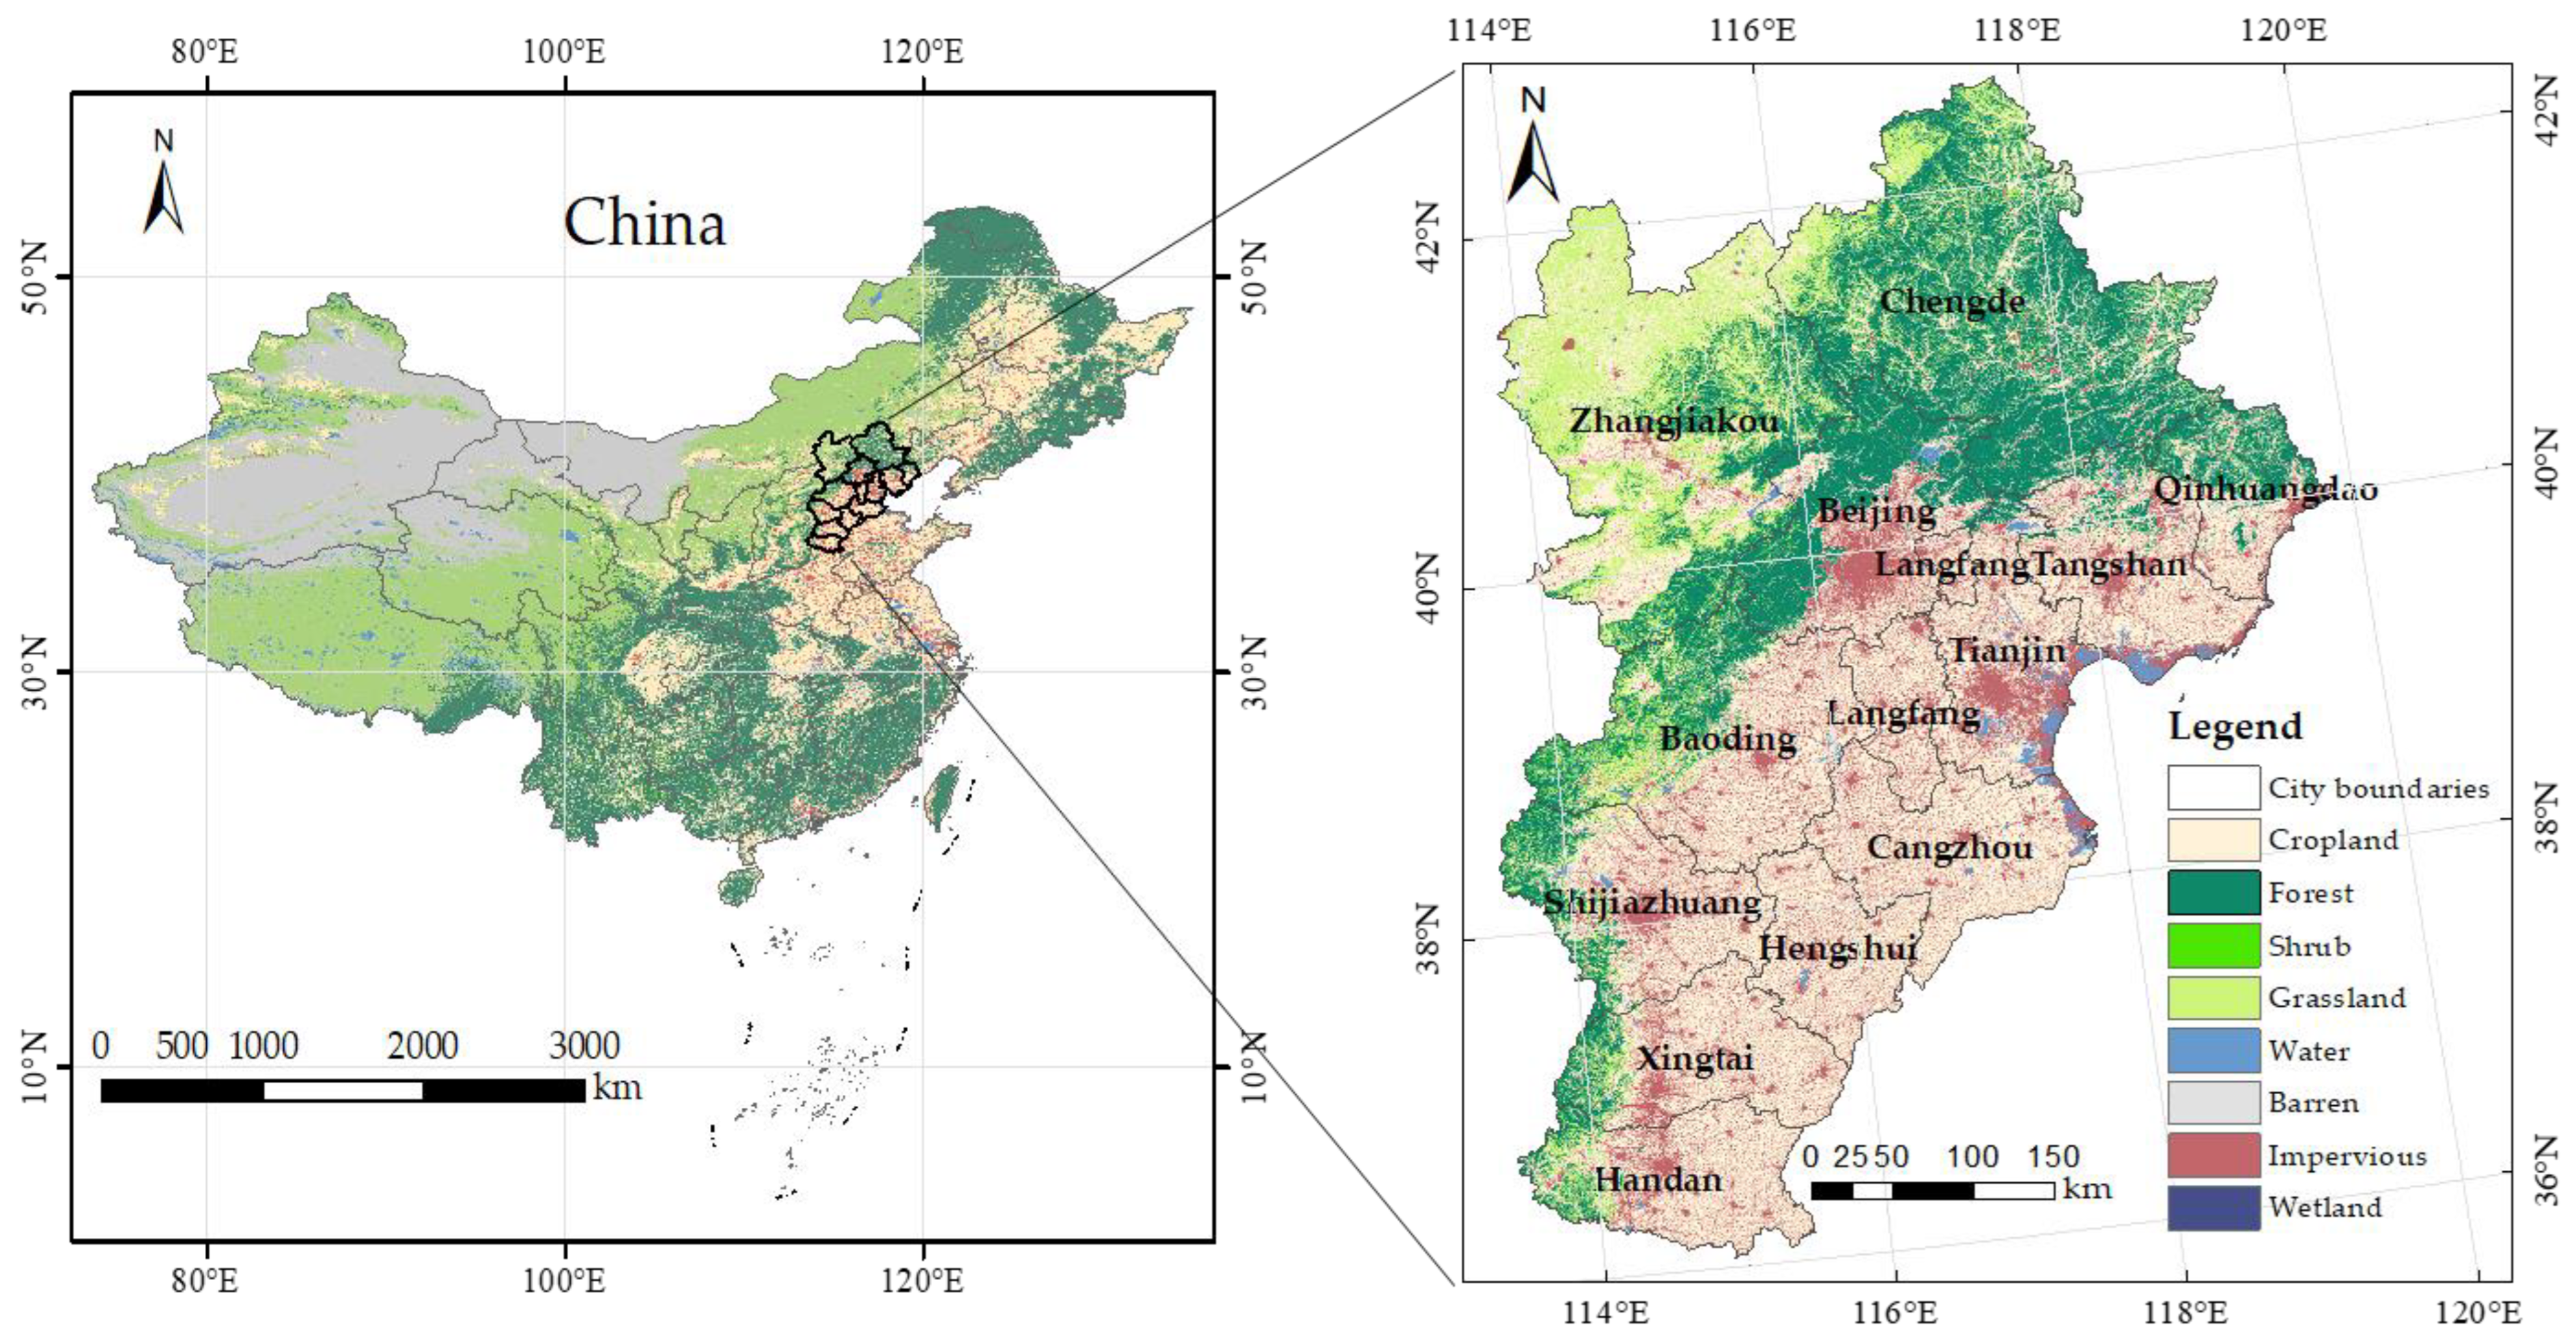
2.1.1. Overview of Research Area

The Beijing–Tianjin–Hebei (BTH) region (36°03′–42°40′ N, 113°27′–119°50′ E) comprises the two municipalities (Beijing and Tianjin), and 11 prefectural-level cities in Hebei Province, i.e., Shijiazhuang, Baoding, Tangshan, Langfang, Qinhuangdao, Zhangjiakou, Chengde, Cangzhou, Handan, Xingtai, and Hengshui (Figure 1). The BTH region spans 219,000 km2, which is equivalent to 2.28% of China’s total land area. As of 2022, the region’s permanent population accounted for 7.77% of the overall population of mainland China. There were significant differences in development within the BTH region in 2022, with Beijing and Tianjin accounting for 13.24% of the BTH area but 32.34% of the permanent population and 57.75% of the GDP. Based on the China land cover dataset from 2022, the land cover map of the BTH region was described in Figure 1. The region has diverse ecosystem types, with land cover transitioning from mainly forests and grasslands in Chengde and Zhangjiakou to impervious land in Beijing and Tianjin and cropland in Hengshui and Cangzhou. Overall, there are obvious differences in land coverage and ecological resources among the cities in the BTH region.
The coordinated development of territory space and the collaborative protection of ecological resources in the BTH region have attracted much attention. The BTH region faces prominent contradictions between land use and ecological construction [34]. Urban expansion and unreasonable land use have degraded the ecological system’s functions, significantly impacting territory spatial protection and governance. Investing in ecological construction in Chengde and Zhangjiakou has resulted in relatively high opportunity costs for economic development [35]. The northwestern mountainous areas of the BTH region provide clean air and high-quality water sources for the southeastern plain areas, which mainly produce agricultural products. Significant differences exist in the types of ecological products supplied between the cities. However, cities in the BTH region are connected by mountains and rivers, and territory space protection and governance are interdependent with strengthening the ecological product supply. Therefore, it is an ideal region for studying territory spatial protection and governance from the perspective of ecological product supply.

2.1.2. Data Source

This study used land grid data and ecological and socio-economic statistical data from 2011 to 2021 (Table 1). The land cover dataset was obtained from the website [36].To explore the changes in the ecological product capacity induced by the land cover change from 2011 to 2021 and to create a land cover map for 2022 in the BTH region, it is necessary to calculate the area of various types of land use over the years. Therefore, we used data from the past 12 years, from 2011 to 2022, to obtain the area of land cover for each category over the years. This dataset is the first annual land cover dataset derived from the land cover dataset in China (CLCD), with a resolution of 30 m × 30 m, and with a higher temporal and spatial resolution than other datasets [36]. Prices of various agricultural products, unit area yield, and sowing area data for soil safety and biodiversity value reporting were obtained from the Territory Compilation of Agricultural Cost and Income. Other data sources include the 2011–2021 China Urban Statistical Yearbook, Beijing Statistical Yearbook, Tianjin Statistical Yearbook, Hebei Statistical Yearbook, and the Beijing, Tianjin, and Hebei ecological environment bulletins.

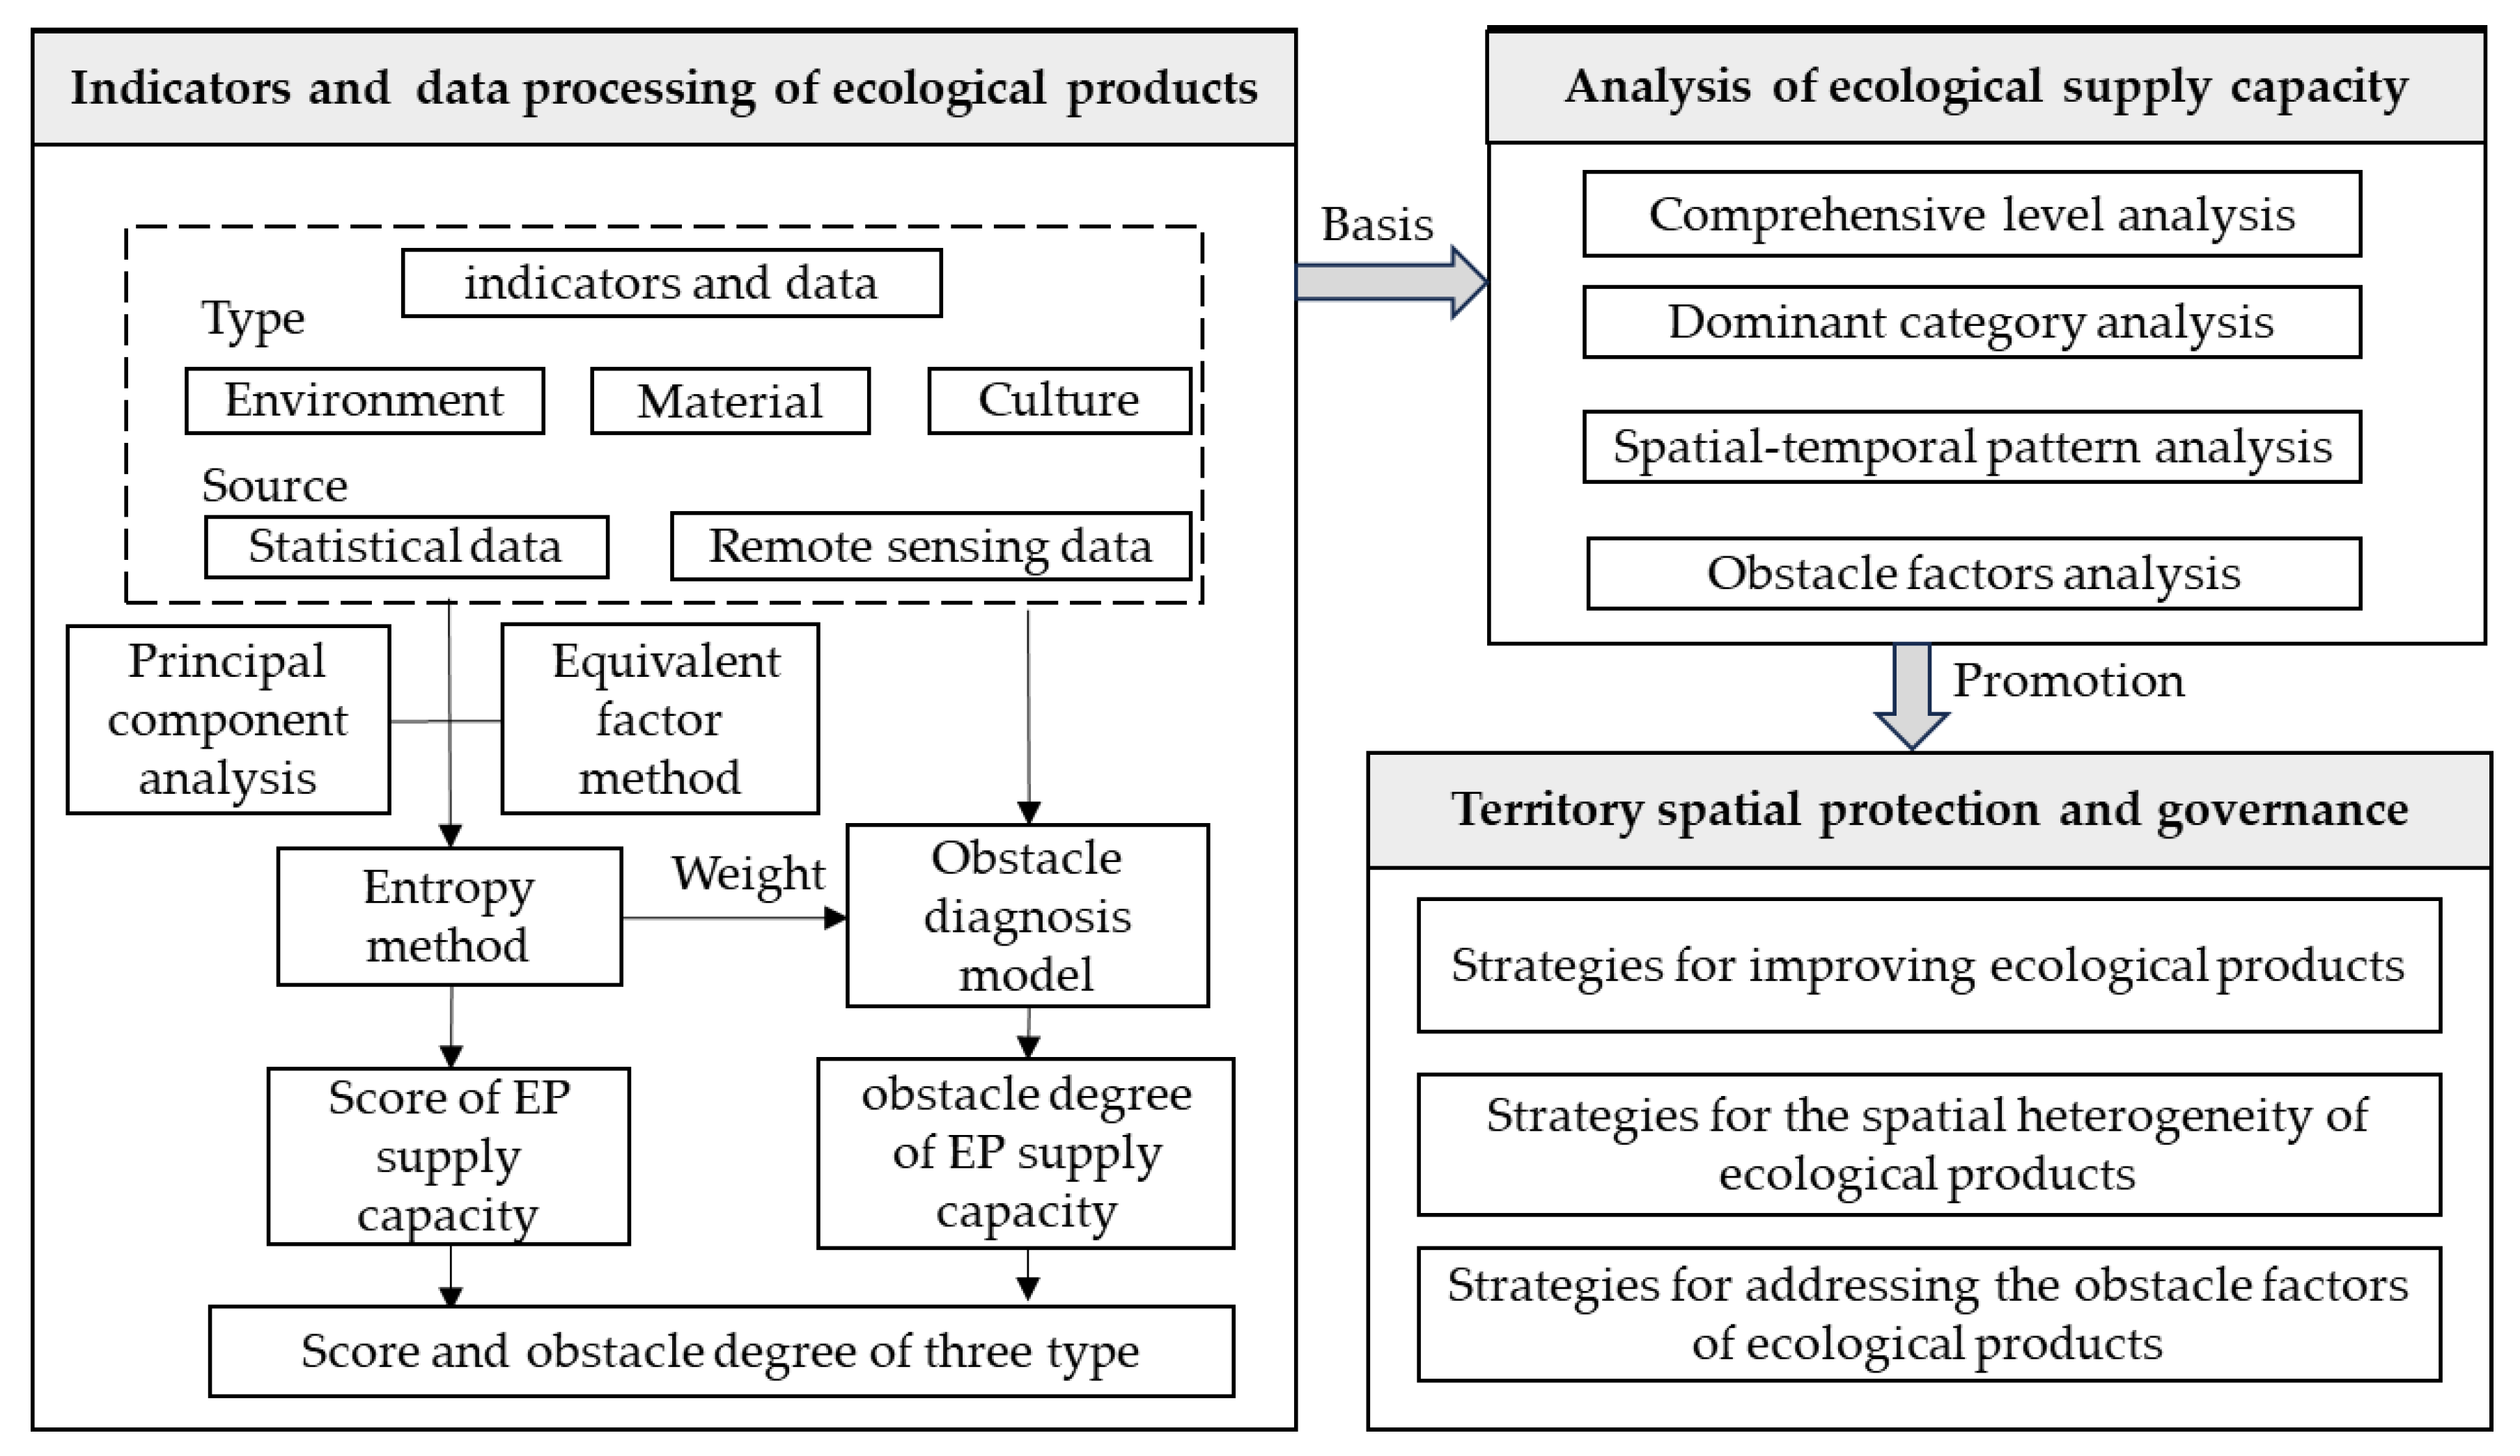
2.2. Analysis of the Ecological Product Supply Capacity for Achieving Territory Spatial Protection and Governance

To evaluate the ecological product supply, we should use the evaluation indicators and data of the ecological product supply capacity and select appropriate research methods (Figure 2). Considering that ecological products possess the attributes of being public, quasi-public, and commercial [25,37] and combine the ecological, production, and living functions of territory spatial development [38,39], the ecological products can be divided into three aspects, i.e., ecological environmental products, ecological material products, and ecological cultural products. These three aspects are the fundamental basis for constructing the evaluation index system in this study. Using collected remote sensing data and statistical data, principal component analysis, the equivalent factor method, the entropy value method, and an obstacle degree model are used to calculate the scores and obstacle factors of the ecological products’ supply capacity. Further, the scores and obstacle factors of each type are analyzed. Research methods will help analyze the supply capacity results with respect to four aspects: comprehensive level, spatial-temporal pattern, dominant category, and obstacle factors. The results’ analysis will help us propose territory spatial protection and governance strategies in response to the ecological product supply capacity index, spatial heterogeneity pattern, and obstacle factors.

2.3. Index System of Ecological Products’ Supply Capacity

To assess the ecological product supply capacity in the BTH region and analyze the regional disparities, we developed an evaluation indicator system for the ecological product supply capacity (Table 2). This indicator system is suitable for evaluating the ecological product supply capacity of two municipalities and 11 prefectural-level cities. Following scientific rigor, a systematic approach, and operational feasibility principles, the establishment of this indicator system was based on the existing research on the meaning [22,23], classification [24,25], and evaluation indicators of ecological products [28,29,30], as well as the three classifications of indicators we mentioned above. Ecological environmental products include natural environmental elements such as air, water sources, and soil, as well as basic elements of human survival such as biodiversity, ecological land use, and per capita cropland. Ecological material products include organic agricultural products and ecological energy products produced with human participation. Due to the uneven distribution of ecological energy and the lack of large-scale development and utilization, ecological energy indicators are not included in the calculation. Ecological cultural products include ecological space culture and tourism and leisure culture products. Ecological space culture mainly refers to the spatial carrier required for landscape beautification, physical fitness, and ecological education, which can be characterized by the greening rate of built-up areas, the coverage area of park green spaces, and the forest coverage rate. Ecological and cultural products refer to the tourism and leisure products developed in suburban areas based on natural and semi-natural ecological environments, mainly manifested as ecological tourism and ecological leisure, characterized by tourism and entertainment income.

2.4. Research Methods for the Ecological Products’ Supply Capacity

To analyze the level, spatial-temporal pattern, and obstacle factors of the ecological products’ supply capacity, we described the methods used for the level evaluation, spatial heterogeneity analysis, and determining the obstacle degree.

2.4.1. Level Evaluation Methods of the Ecological Products’ Supply Capacity

First, we explained the data calculation methods for the overall level of air, soil conservation value, biodiversity value, the overall level of water, and land area. Based on the indicator index value we calculated in the indicator system, we calculated each city’s ecological products’ supply capacity in 2011–2021, using the entropy method, in the BTH.
  • Calculate the Overall Level of Air using Principal Component Analysis
The overall air index represents fresh air. Six indicators are selected based on the national environmental air quality measurement indicators and the national carbon neutrality and peak carbon emissions targets, i.e., the proportion of days with an air quality index above level two; PM2.5; PM10; SO2 concentration; NO2 concentration; and CO2 emissions. The indicators have both positive and negative directions, and there is a correlation between the indicators. Principal component analysis can recombine many correlated original factors into a new set of mutually independent comprehensive indicators to replace the original ones while retaining as much information as possible from the original variables, thus reducing dimensionality [40]. The KMO test [41] and the Bartlett sphericity test [42] are two common statistical tests used to assess the applicability and effectiveness of principal component analysis. In this study, the KMO is 0.756 and Sig is 0. Therefore, principal component analysis is conducted on each city’s air quality characterization indicators to obtain a comprehensive air quality index. A main component is identified by calculating the eigenvalues and eigenvectors, and each city’s overall air index F is calculated according to Equations (1) and (2) [43], where ωin represents the weight of each variable in the principal component, θi represents the variable coefficients in the component matrix, and γi represents the eigenvalues corresponding to the principal component.
F = ω i 1 X 1 + ω i 2 X 2 + + ω i n X n
ω i n = θ i / γ i
2.
Calculate the Soil Safety Value and Biodiversity Value using the Equivalent Factor Method
The equivalent factor method has several advantages, including abundant data availability and low data requirements. In this study, we consulted the equivalent factor table developed by Xie Gaodi [44], which was based on the research of Costanza et al. [28]. Since equivalent factors for ecosystem services vary across regions, we established an equivalent factor table, which was accomplished by comparing the grain yield per unit area in the research area to the national grain yield per unit area [45]. To account for price fluctuations over the years, we used the average grain yield per unit area from 2011 to 2021 and the average grain price in 2021 to estimate the economic value of the grain yield per unit area during the research period [46]. The correction coefficient and value calculation are presented in Equations (3)–(5), where β represents the correction coefficient over the years, k denotes the grain yield per unit area in the BTH region (kg/hectare), and K represents the grain yield per unit area nationwide (hectare/kg). The calculated correction coefficient is 0.84. Using the actual land cover types and correction coefficients in the BTH region, we determined the equivalent values of safe soil and biodiversity per unit area, as shown in Table 3. ESV refers to the monetary value of ecosystem services in the study area (yuan). “i” represents the land-use types, “Ai” represents the area of land use type i (hectares), and “USVi” represents the ecosystem service value per unit the area of land use type i, “S” denotes the sum of rice, wheat, and corn prices in the BTH region (yuan/kg), while “A” represents the total cultivation area for the three agricultural products (hectares). Therefore, “S/A” signifies the economic value of grain production per unit area (yuan/hectare). “Fi” is the correction factor for land use type i. The fraction 1/7 indicates that the unit area ecosystem service value is 1/7 of the unit area output value of the main grain crops in the study area that year [47]. Through calculations, the economic value of one standard equivalent in the BTH region was determined to be 2116.57 (yuan/hectare).
β = k K
E S V = i = 1 n A i × U S V i
U S V i = 1 7 × S A × F i
3.
Calculate the Overall Level of Water and Land Area Index
Clean water sources were mainly characterized by their water quantity and water quality. The calculation was based on their proportion of the water supply and the monitoring of rivers and lakes reaching level three or above. After standardizing the data of these two indicators, they were equally weighted, and the overall water level was obtained using a simple linear weighting method [48]. The ecological land area consists of forest, grassland, and water wetland areas. Ecological land and cropland area data of 13 cities in the BTH region from 2011 to 2021 were calculated and extracted from the land cover dataset mentioned above, using ArcGIS 10.8.
4.
Calculate the Ecological Product Supply Capacity Using the Entropy Method
The weights of the indicators for determining the ecological products’ supply capacity were calculated using the entropy method [49], which is objective and determines the information relayed by entropy by calculating the degree of data dispersion [50]. To compare the ecological product supply capacity in different years, a time variable was included in the study to make the analysis results more scientifically reasonable. First, the indicators were set and standardized. Let there be h years, m cities, and n indicators. Xλij represents the value of the j indicator of the i city in the λ year. The extreme value method was used to normalize each indicator [45], transforming the indicator values to a range of 0–1, and the standardized values are denoted as X′λij.
X λ i j = X λ i j X min / X max X min
Next, calculate the proportion Pλij of the i city in the j indicator of the λ year and calculate the information entropy value Ej of the j indicator. The smaller the information entropy, the greater the data dispersion and information content, indicating a greater impact of the indicator on the evaluation results.
P λ i j = X λ i j / λ = 1 h i = 1 m X λ i j
E j = 1 ln h × m λ = 1 h i = 1 m P λ i j ln P λ i j
Then, determine the weight Wj.
W j = 1 E j j = 1 m 1 E j
Finally, the ecological product supply capacity index is calculated. The evaluation index results are multiplied by Equation (10) for ease of analysis.
T E P = j = 1 n W j × X λ i j × 10

2.4.2. The Spatial Heterogeneity of the Ecological Products’ Supply Capacity

A combination of the natural breakpoint and the quantile classification methods in ArcGIS 10.8 software was used to analyze the spatial heterogeneity of the ecological product supply. The natural breakpoint method uses clustering thinking to classify evaluation subjects based on the similarity of their data results, grouping evaluation subjects with similar results and forming natural breakpoints between evaluation subjects with larger differences [51]. The quantile classification method sorts data from largest to smallest and assigns an equal amount of data to each class, ensuring an equal number of values in each category, which helps in understanding the differences between evaluation subjects and identifying outliers. The quantile classification method may place evaluation subjects with similar data in adjacent classes or place evaluation subjects with large differences in the same class. However, the natural breakpoint method effectively solves this problem, so the effective combination of these two classification methods helps in appropriately classifying and grouping evaluation subjects and analyzing the spatial differences and clustering characteristics of evaluation subjects.
In this study, we used the natural break method and quantile classification method in ArcGIS 10.8 to obtain two sets of hierarchical indices and spatial patterns of the ecological product supply capacity in the BTH region. Further analysis was conducted based on the differences between the two hierarchical indices and spatial patterns, resulting in a unified hierarchical index. Finally, this unified hierarchical index was manually input into the ArcGIS 10.8 software to create the spatial pattern map.

2.4.3. Obstacle Factors of the Ecological Products’ Supply Capacity

The obstacle degree model [52] was used to identify the obstacle factors of the ecological product supply capacity, which helps formulate strategies for territory spatial protection and governance. This study used the Index Deviation Degree (LEPλij), Factor Contribution Degree (UEPλij), and Obstacle Degree (PEPλij) to identify the obstacles and their impact on the supply of ecological products in each city [53,54]. The calculation results were multiplied by 100% to reflect the proportionate relationship of each indicator’s influence, as shown in the formulas:
L E P λ i j = 1 X λ i j
U E P λ i j = W j × L E P λ i j
P E P λ i j = U E P i j j = 1 n U E P i j × 100 %
X′λij represents each indicator’s standardized value and Wj represents the corresponding weight of the indicator, which was obtained using the entropy value method mentioned earlier. LEPλij represents the difference between a single indicator and the maximum target. UEPλij represents the contribution of each single factor to the overall target. PEPλij represents the impact of a single indicator on the supply of ecological products, with a higher value indicating a greater constraint on the supply.

3. Analysis of the Results

This study combined existing research on ecological product classification and territory spatial functionality to establish an evaluation index system for the ecological product supply capacity. We have used the entropy method, natural breaking points, the quantile classification method, and the obstacle degree model to obtain the level of the ecological product supply capacity, its spatial and temporal patterns, and its obstacle factors in the BTH region. The analysis of these results provide a foundation for proposing territory spatial protection and governance strategies in terms of levels, spatio-temporal patterns, and issues.

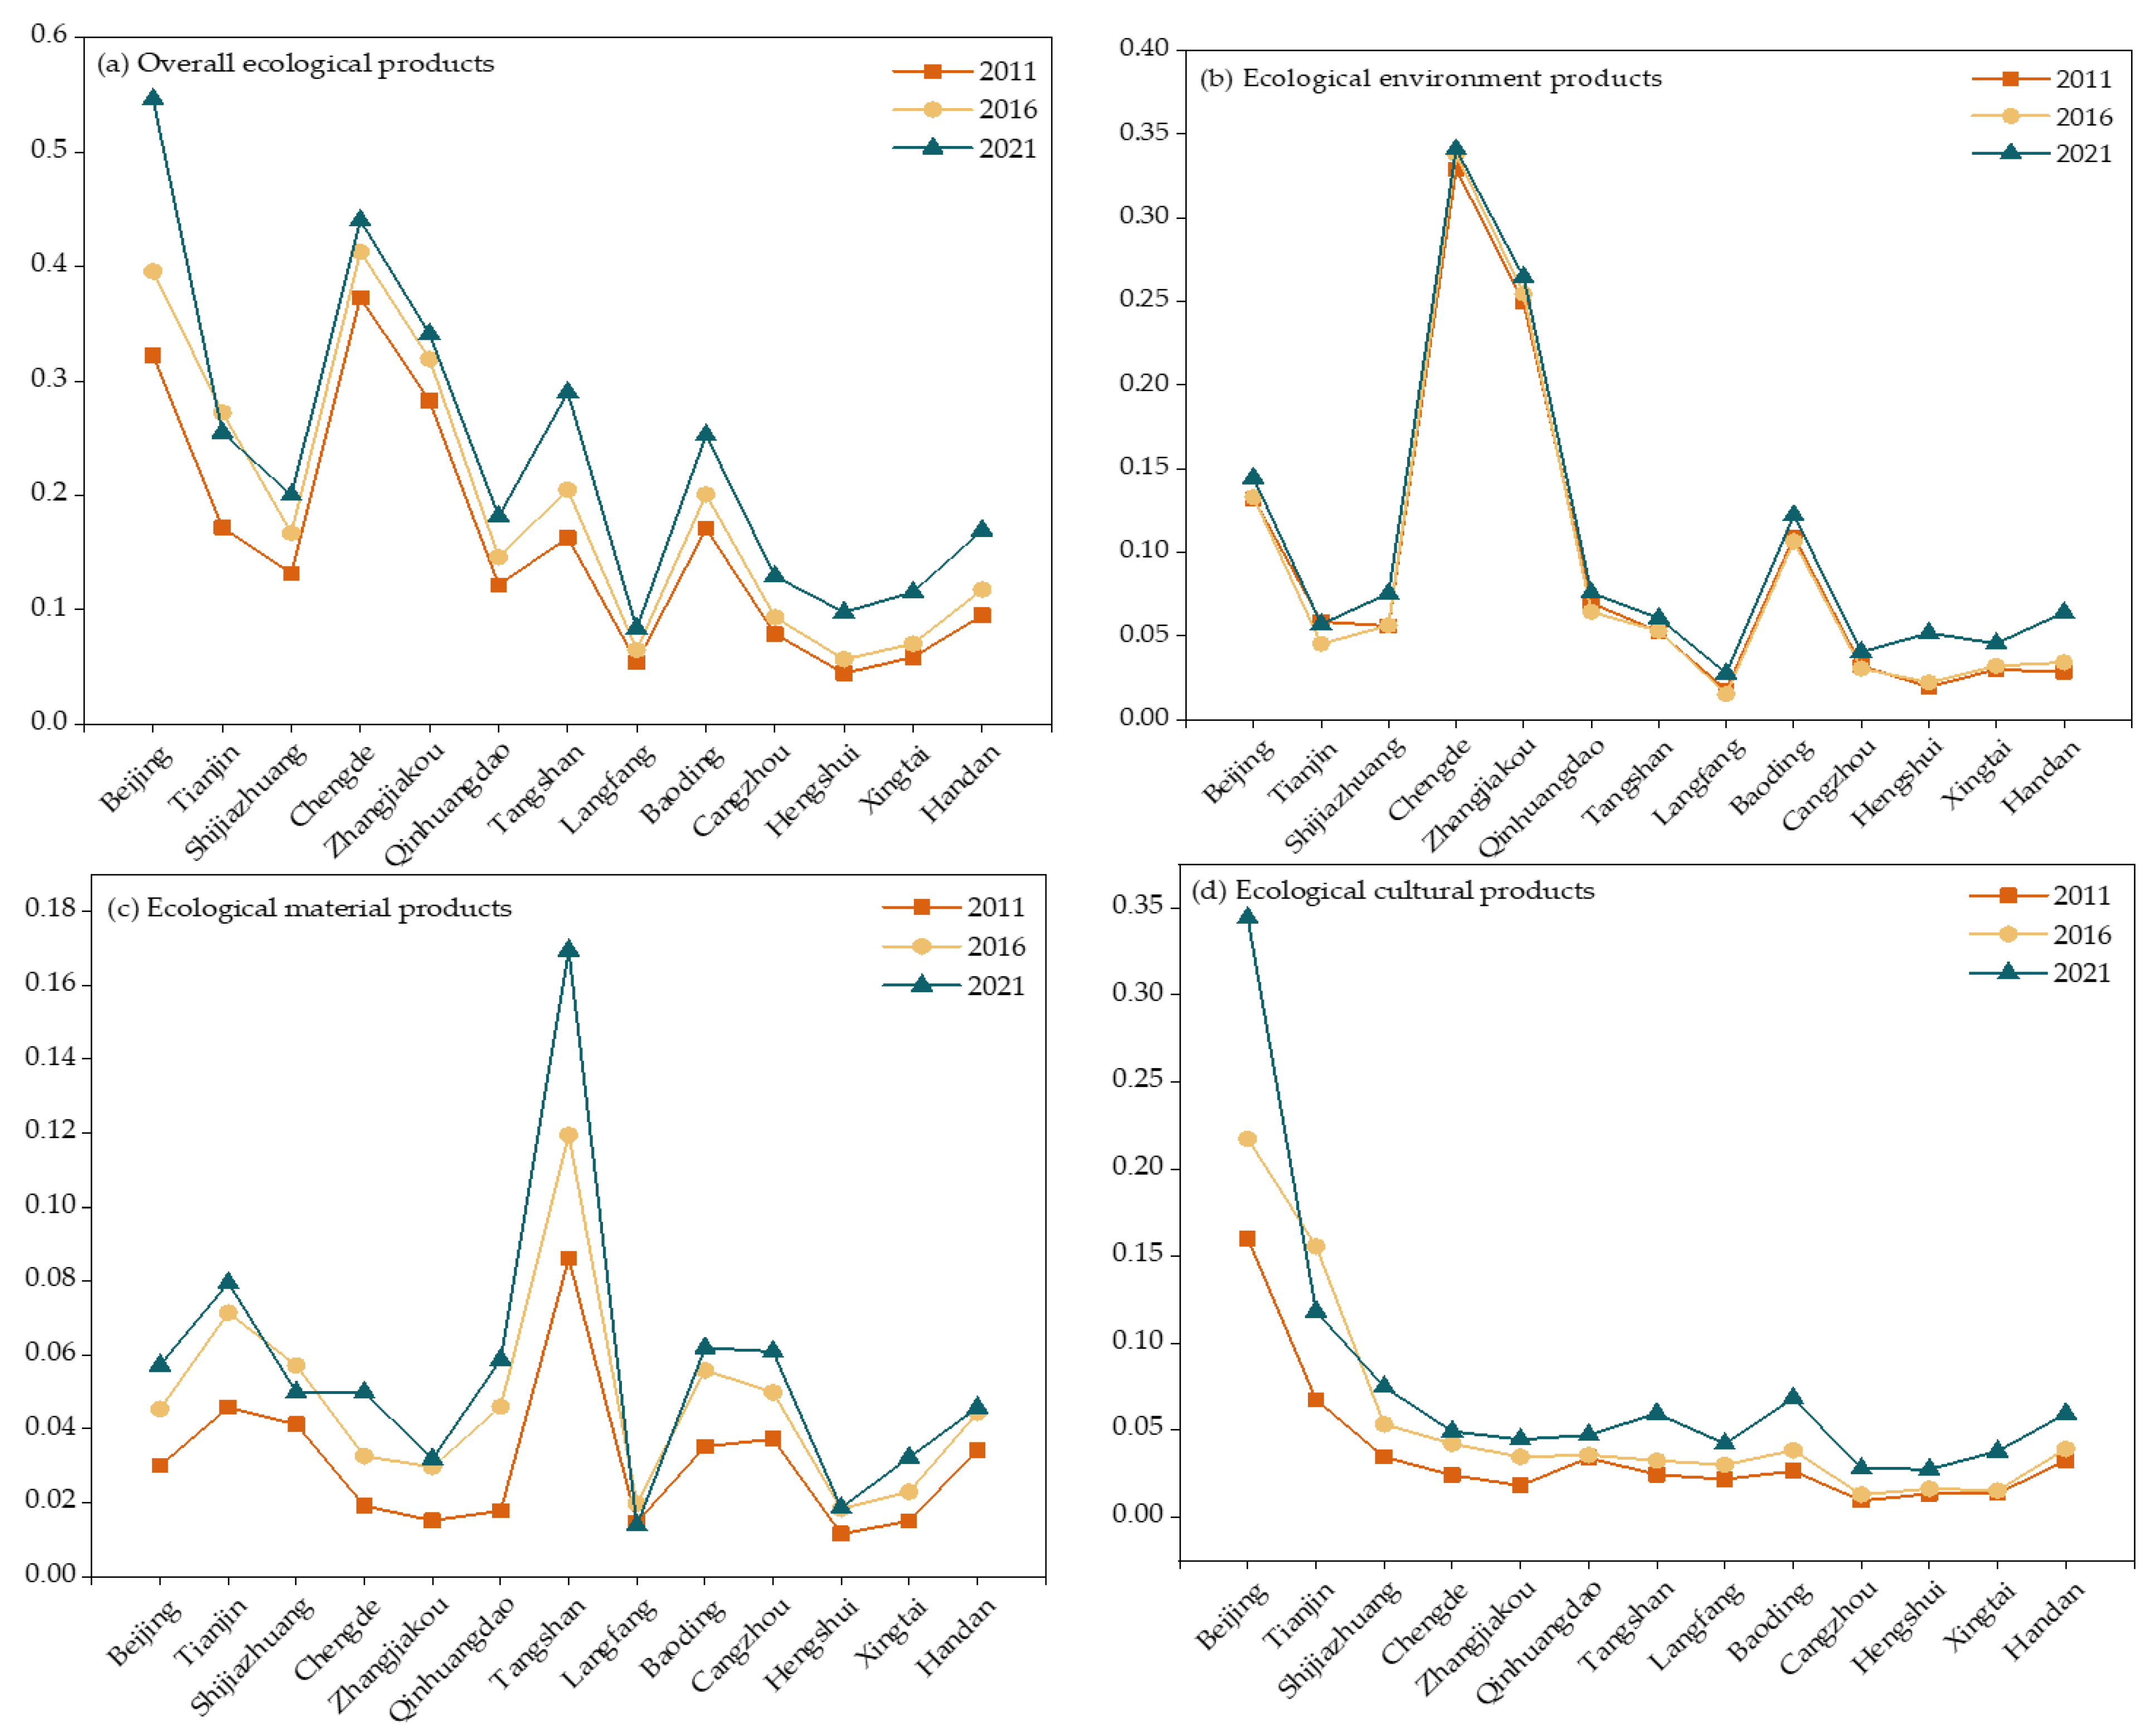
3.1. Level Analysis of the Ecological Products’ Supply Capacity

The ecological products’ supply capacity index of the BTH region from 2011 to 2021 was calculated based on the entropy method (Table 4). Over the past 11 years, the overall ecological product supply capacity index has shown an upward trend (from 1.592 to 2.387), with an increase of 49.94%. The median of the ecological product supply capacity was in 2016 (1.941), and the increase from 2016 to 2021 (0.446) was significantly greater than the increase from 2011 to 2016 (0.349), indicating that the speed of the capacity improvement has gradually increased. The ecological environmental products’ index was the largest of the three classification indexes, showing an upward trend with a small growth rate. Since the beginning of the 21st century, and particularly after the introduction of the BTH coordinated development strategy in 2014, the BTH region has greatly emphasized ecological construction and environmental protection. As a result, notable progress has been made in enhancing the ecological environment [51]. The ecological material products’ index was relatively small, showing a fluctuating upward trend with the lowest growth rate. Ecological material products had a smaller weight in evaluating the ecological product supply capacity, as they were commercially oriented. The output value of agricultural, forestry, animal husbandry, and fishery products remained relatively stable. The ecological cultural products’ index had the largest growth rate, especially from 2016 to 2021, with an increase of 38.42%. There has been a large emphasis on ecological and cultural construction in recent years, and the tourism economy has been booming, leading to a rapid increase in the supply capacity of ecological culture products.

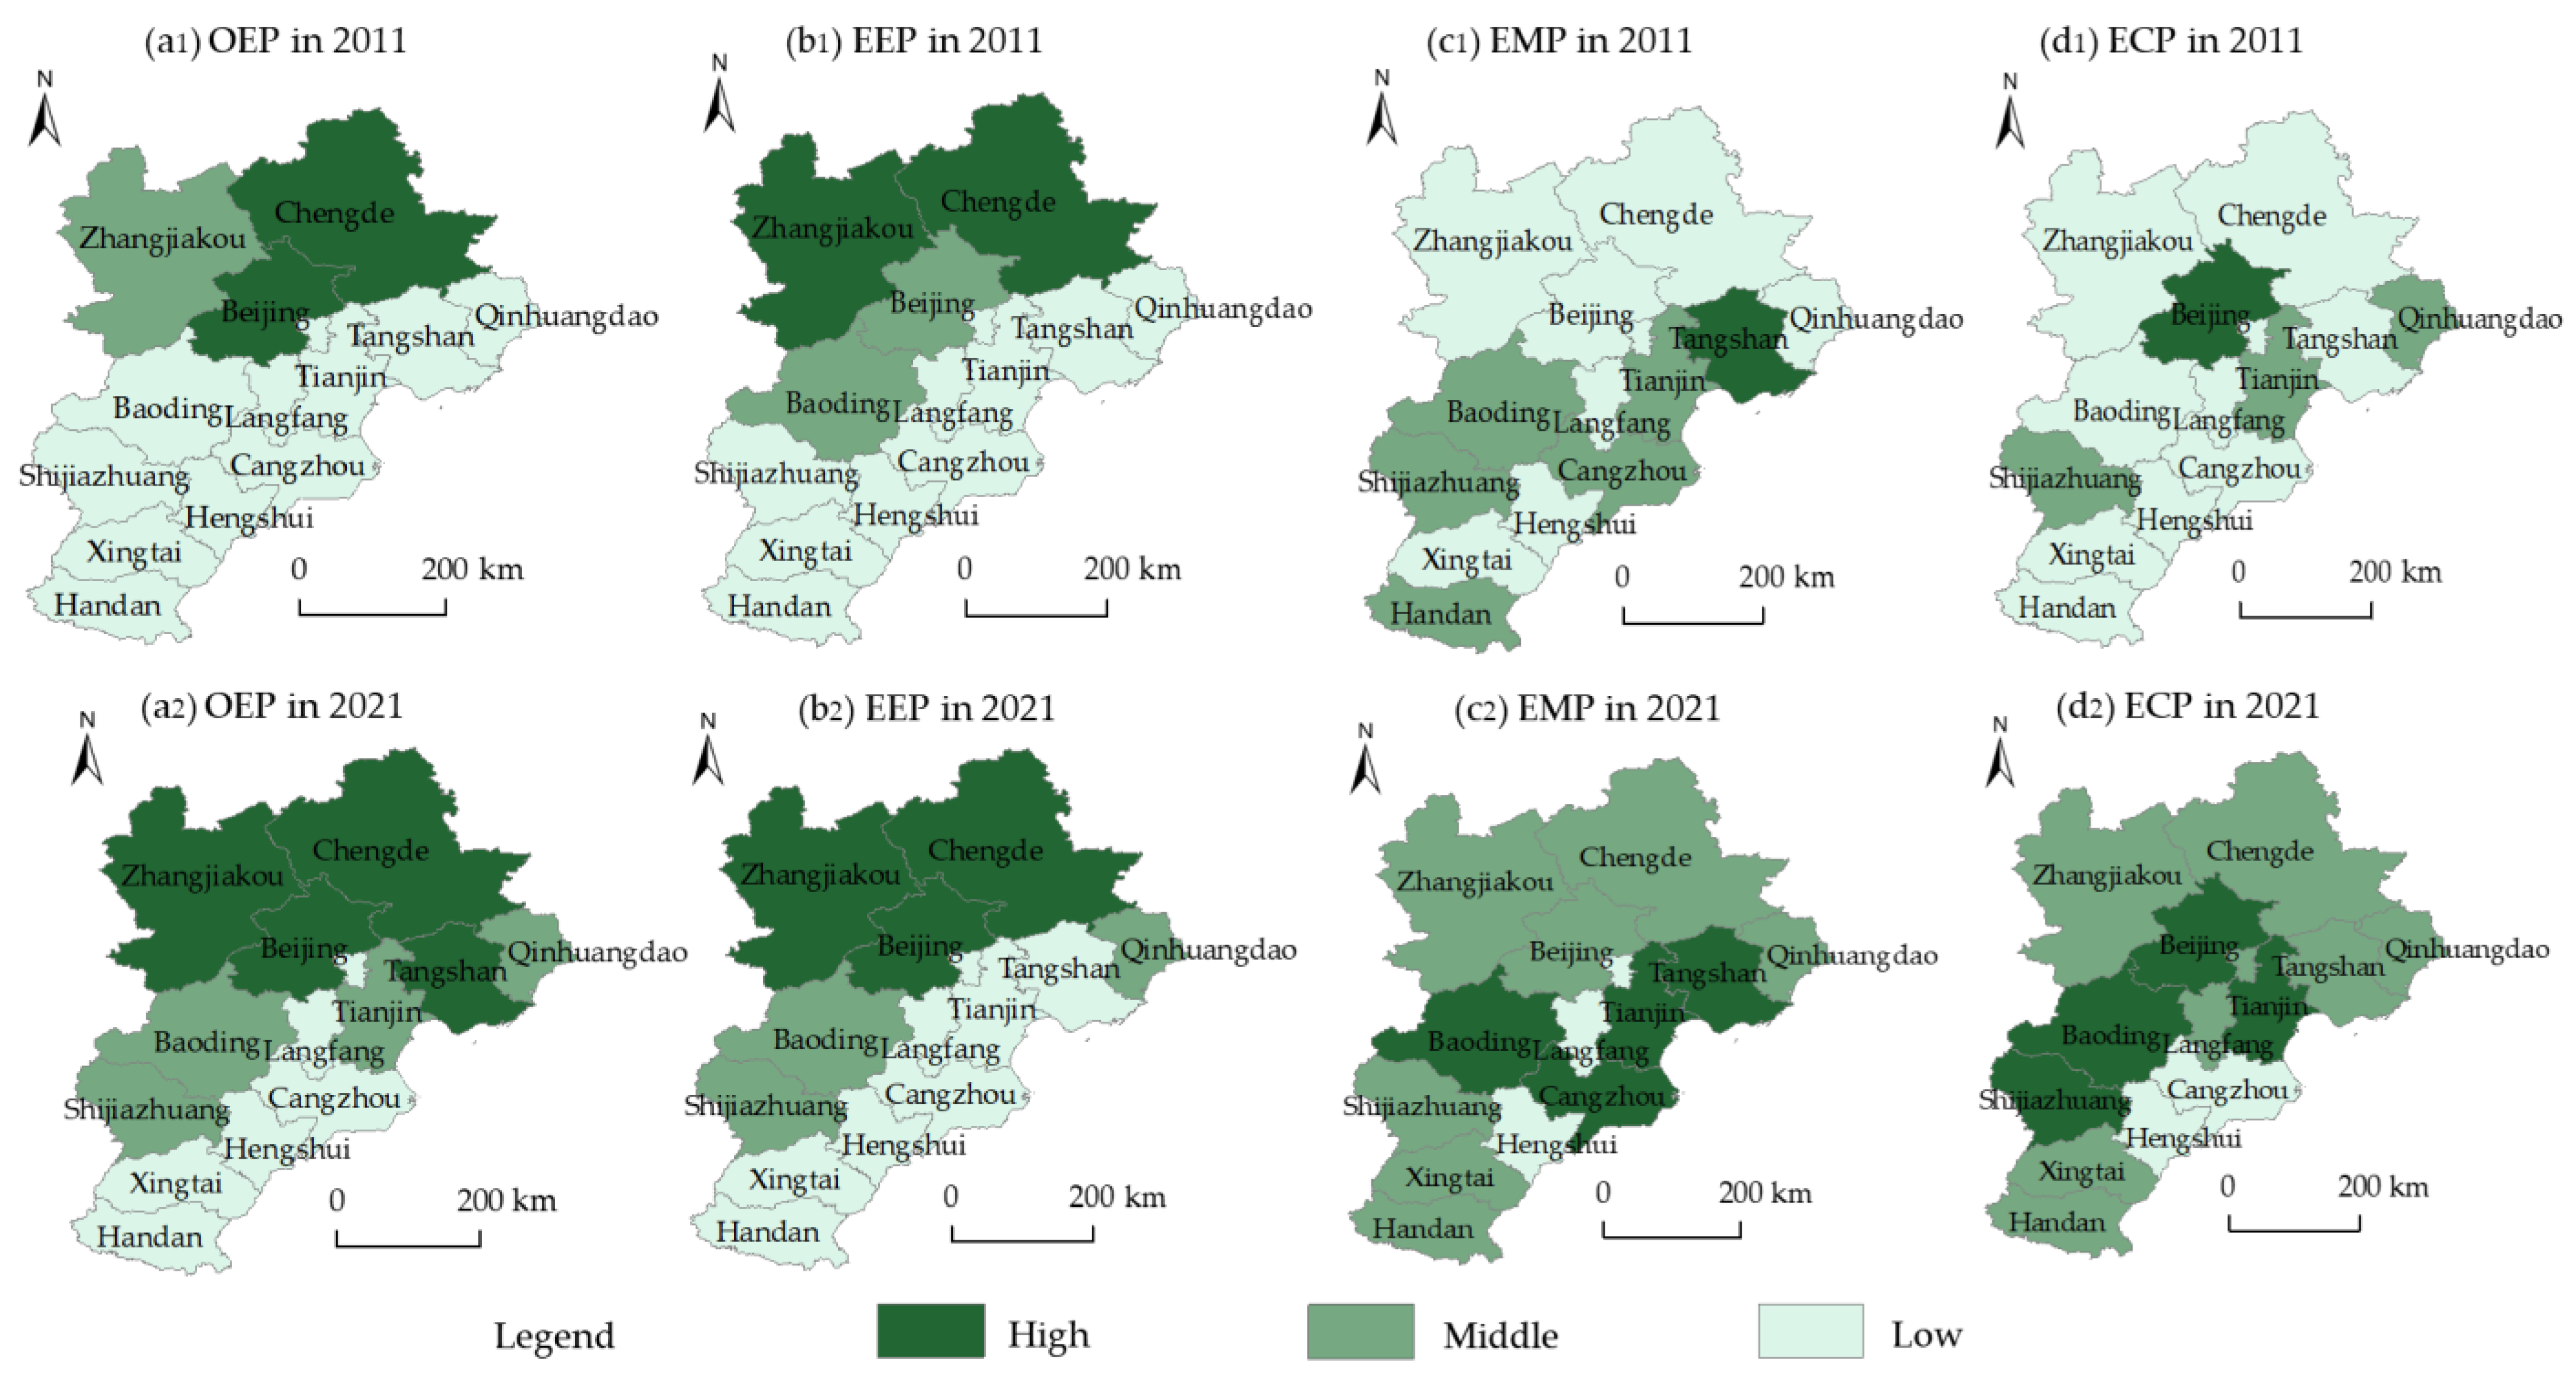
3.2. Spatio-Temporal Pattern Variations of the Ecological Products’ Supply Capacity

3.2.1. Time Change Analysis

From 2011 to 2021, the supply of ecological products in the BTH region continued to increase, but the trends varied (Figure 3). In terms of the overall ecological products’ supply, except for Tianjin, the ecological products’ index of other cities has improved, indicating the continuous protection and governance of the production–living–ecological spatial pattern of each city against the background of national ecological development construction. Land use changes often significantly impact the natural ecological environment [55]. Given the enduring stability of land coverage and terrain in different cities, the availability of ecological environmental products in each city can be relatively consistent. The speed of improvement in Hengshui, Xingtai, and Handan from 2016 to 2021 has been faster, influenced by the industrial reform and resource utilization improvement in Hebei Province. In terms of ecological material products, the supply in Shijiazhuang has decreased from 2016 to 2021, while the supply in Langfang has remained unchanged. Other cities have shown an upward trend, especially Tangshan, with the largest increase in supply, indicating that the construction of rural infrastructure, such as agricultural mechanization, has contributed to improving agricultural productivity. In terms of ecological cultural products, due to the impact of the COVID-19 pandemic in 2020, Tianjin’s tourism revenue has significantly decreased compared to before the pandemic, but other cities had shown a good recovery in their tourism economy by 2021, maintaining a stable and upward trend.

3.2.2. Spatial Change Analysis

The BTH region has a clear spatial distribution pattern of ecological product supply capacity. In this study, we set the classification level to three and used the natural break point classification and the quantile classification method in the ArcGIS 10.8 software to obtain the overall and three-category ecological product supply capacity indices and spatial patterns for the BTH region in 2011 and 2021. Based on the classification indices and patterns formed by the two methods, we constructed a unified three-level classification index for the overall supply and three supply categories of products. The ecological product supply level in different years was then divided into three categories using ArcGIS 10.8: the low supply area, middle supply area, and high supply area (Figure 4). First of all, the overall ecological product supply shows an upward trend, with noticeable spatial differences. The northern Yanshan Mountain and Taihang Mountain regions had a large supply capacity, while the southern and southeastern plain areas had a relatively small supply capacity. From 2011 to 2021, Zhangjiakou City was upgraded from a general supply area to a high supply area, and Baoding City was upgraded from a low supply area to a medium supply area. The regions with high supply capacity gradually increased, while the regions with low supply capacity gradually decreased. The spatial differences of the three supply capacities were obvious; each has different characteristics. The spatial pattern of the ecological environmental products’ supply capacity was aligned with the overall supply capacity of ecological products, while the spatial patterns of the supply capacity of ecological material products and ecological cultural products were inconsistent with the spatial pattern of the entirety. Over time, Beijing has become a high supply area for ecological environmental products, and Shijiazhuang and Qinhuangdao have become medium supply areas for ecological environmental products. In terms of the ecological material product supply, from 2011 to 2021, Tianjin, Baoding, and Cangzhou transitioned from medium supply areas to high supply areas. In terms of ecological cultural product supply, Tianjin, Shijiazhuang, and Baoding became high supply areas from 2011 to 2021.
In the past decade, the BTH region has strengthened the construction of ecological development. The northern mountainous areas served as ecological environmental support and water conservation functional areas, continuously consolidating the “Three-North Shelter Forest” and “Returning Farmland to Forest and Grassland” projects. The forest area increased significantly in the BTH region [56]; in Chengde, Zhangjiakou, Beijing, and Baoding forest area increased by 5.09%, 19.63%, 2.73%, and 4.98%, respectively from 2011 to 2021. The provincial capital, Shijiazhuang, and the important tourist city, Qinhuangdao, have vigorously promoted the governance and protection of the ecological environment and significantly improved their air and water quality. Tangshan had a high agricultural production capacity, Tianjin had a high forestry and fishery output value, and Baoding had a high forestry and animal husbandry production capacity. These three cities had a higher supply capacity of ecological material products. Hengshui and Langfang had a relatively small land area, a large industrial land area, and an obvious expansion of residential land, resulting in a relatively lower ecological material product supply capacity. Beijing and Tianjin had many parks, green spaces, and nature reserves, with abundant tourism, ecological leisure, and entertainment resources. The joint hosting of the 2022 Winter Olympics by Beijing and Zhangjiakou has further promoted improving the quality of the ecological environment and the construction of ecological culture. Shijiazhuang actively promoted the construction of an ecological environment and ecological infrastructure. Baoding has rich natural landscape resources and historical and cultural heritage, and the construction of the Xiong’an New Area has promoted the construction of ecological culture.

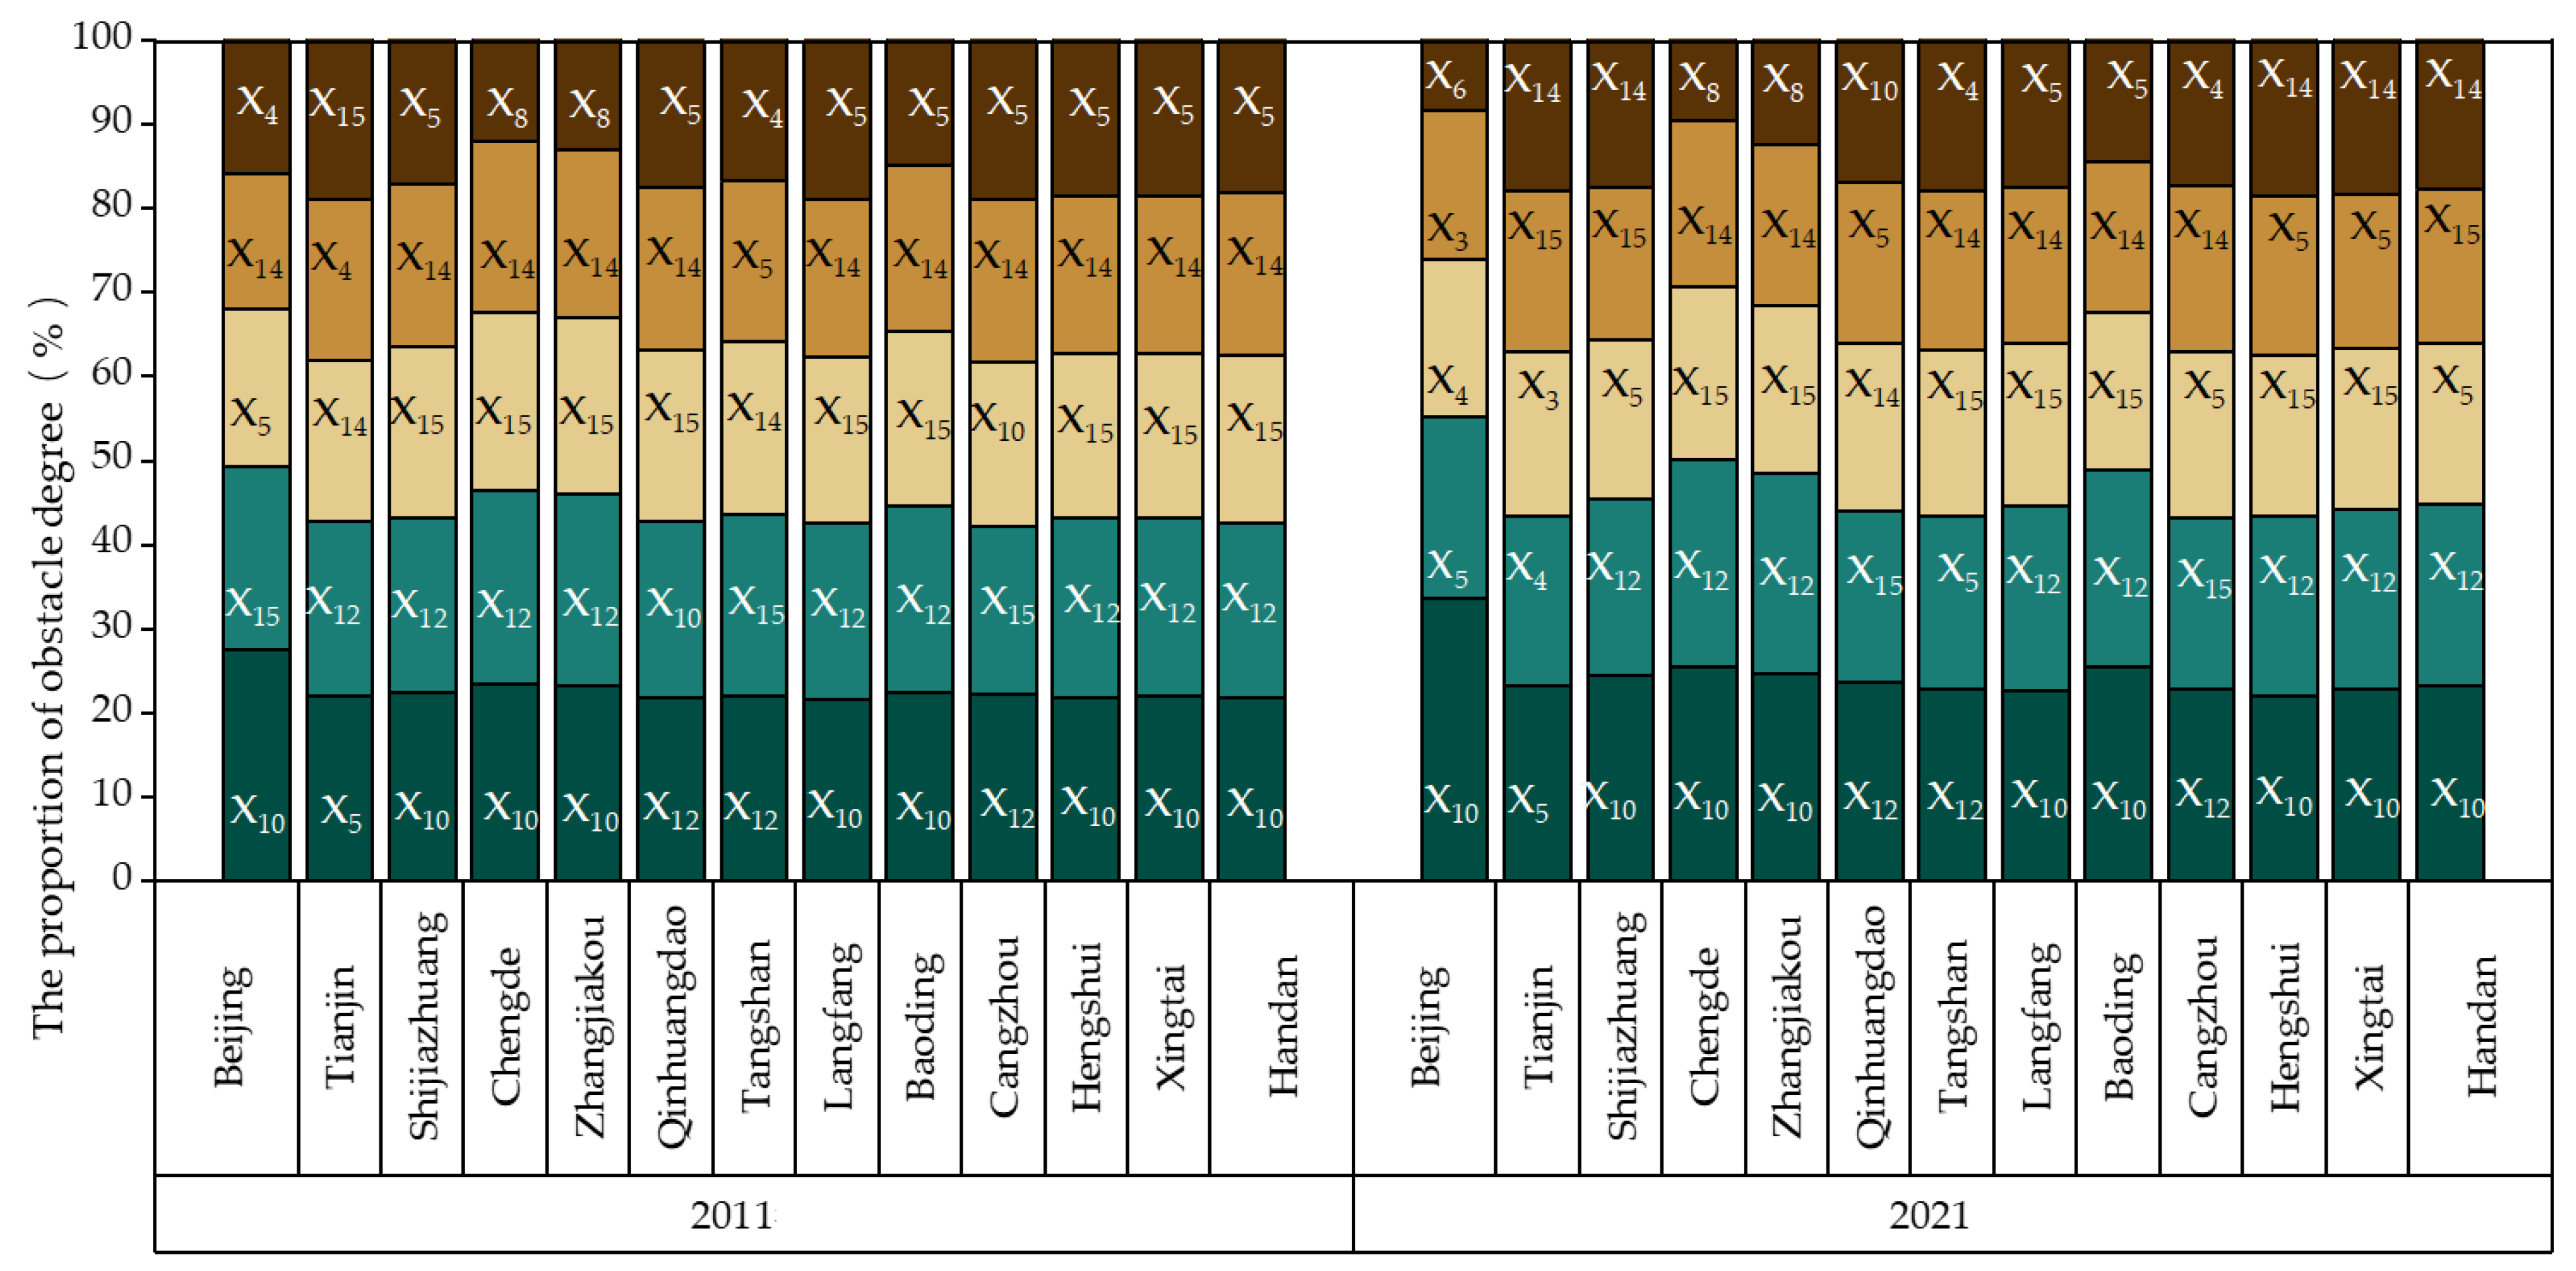
3.3. Obstacle Factors of the Ecological Products’ Supply Capacity

The obstacle degree of the ecological product supply in the BTH region from 2011 to 2021 was calculated using the obstacle degree model. This study found that the obstacle degree of the ecological environmental products, ecological material products, and ecological cultural products were around 36%, 25%, and 39%, respectively. The obstacle factors of ecological culture were the most prominent, indicating that the level of landscaping and green space construction, as well as tourism and leisure development, is relatively low in the BTH region. Beijing and Tianjin have large populations, and the demand for agricultural and forestry products has constantly increased, which has gradually increased the obstacle degree of ecological environmental products and ecological material products. Tangshan has been experiencing a continuous decrease in ecological land, resulting in a higher obstacle degree for ecological environmental products. Despite having a large amount of forest and grassland, Chengde and Zhangjiakou had higher obstacle degrees for ecological material products and ecological cultural products because they had weak development of their animal husbandry due to the restricted construction in the national main functional areas and a lack of urban green space construction. Cities located in the southeastern plain area had relatively less eco-land, and the development of ecological tourism was relatively poor, especially in cities such as Langfang, Cangzhou, Hengshui, Xingtai, and Handan, where the obstacle degree for ecological environmental products and ecological cultural products was higher.
Based on the obstacle degree of various indicators in different years, the ranking of the obstacle factors for the ecological product supply was relatively stable. The cumulative effect of the top 10 obstacle factors was above 90%, and the cumulative impact of the top 5 was above 50%. They were fishery products, park green space, eco-leisure, eco-tourism, and ecological land, of which the obstacle degree for ecological land was increasing. The BTH region has a short coastline and small water area, resulting in low fishery production capacity. Due to natural and economic factors, there was insufficient construction of urban green space and a low level of development of ecological leisure products. Due to a high population density and increasing urbanization, the availability of ecological land was becoming increasingly limited.
Figure 5 shows the top 5 obstacle factors affecting the ecological product supply in each city in 2011 and 2021. The obstacle factors restricting Beijing included fishery products (X10), eco-land (X5), and biodiversity (X4), which have changed to include soil safety (X3) and per capita cropland (X6) in the past ten years. The obstacle factors restricting Tianjin, such as eco-land (X5), biodiversity (X4), eco-tourism (X14), and eco-leisure (X15), have remained relatively stable, with the amendment of soil safety (X3) replacing the factor of park green space (X12) in the past ten years. The main obstacle factors in Shijiazhuang, Qinhuangdao, Baoding, Langfang, Cangzhou, Xingtai, and Handan included fishery products (X10), park green space (X12), eco-leisure (X15), eco-tourism (X14), and eco-land (X5). Among them, the obstacle factors of eco-land (X5) in Qinhuangdao, Shijiazhuang, Cangzhou, Hengshui, and Handan have been increasing year by year; the obstacle factor of biodiversity (X4) in Cangzhou has also been growing year by year. The main obstacle factors in Tangshan were park green space (X12), eco-leisure (X15), eco-tourism (X14), eco-land (X5), and biodiversity (X4); the obstacle factors in Chengde and Zhangjiakou were relatively stable, including fishery products (X10), park green space (X12), eco-leisure (X15), eco-tourism (X14), and forestry products (X8).

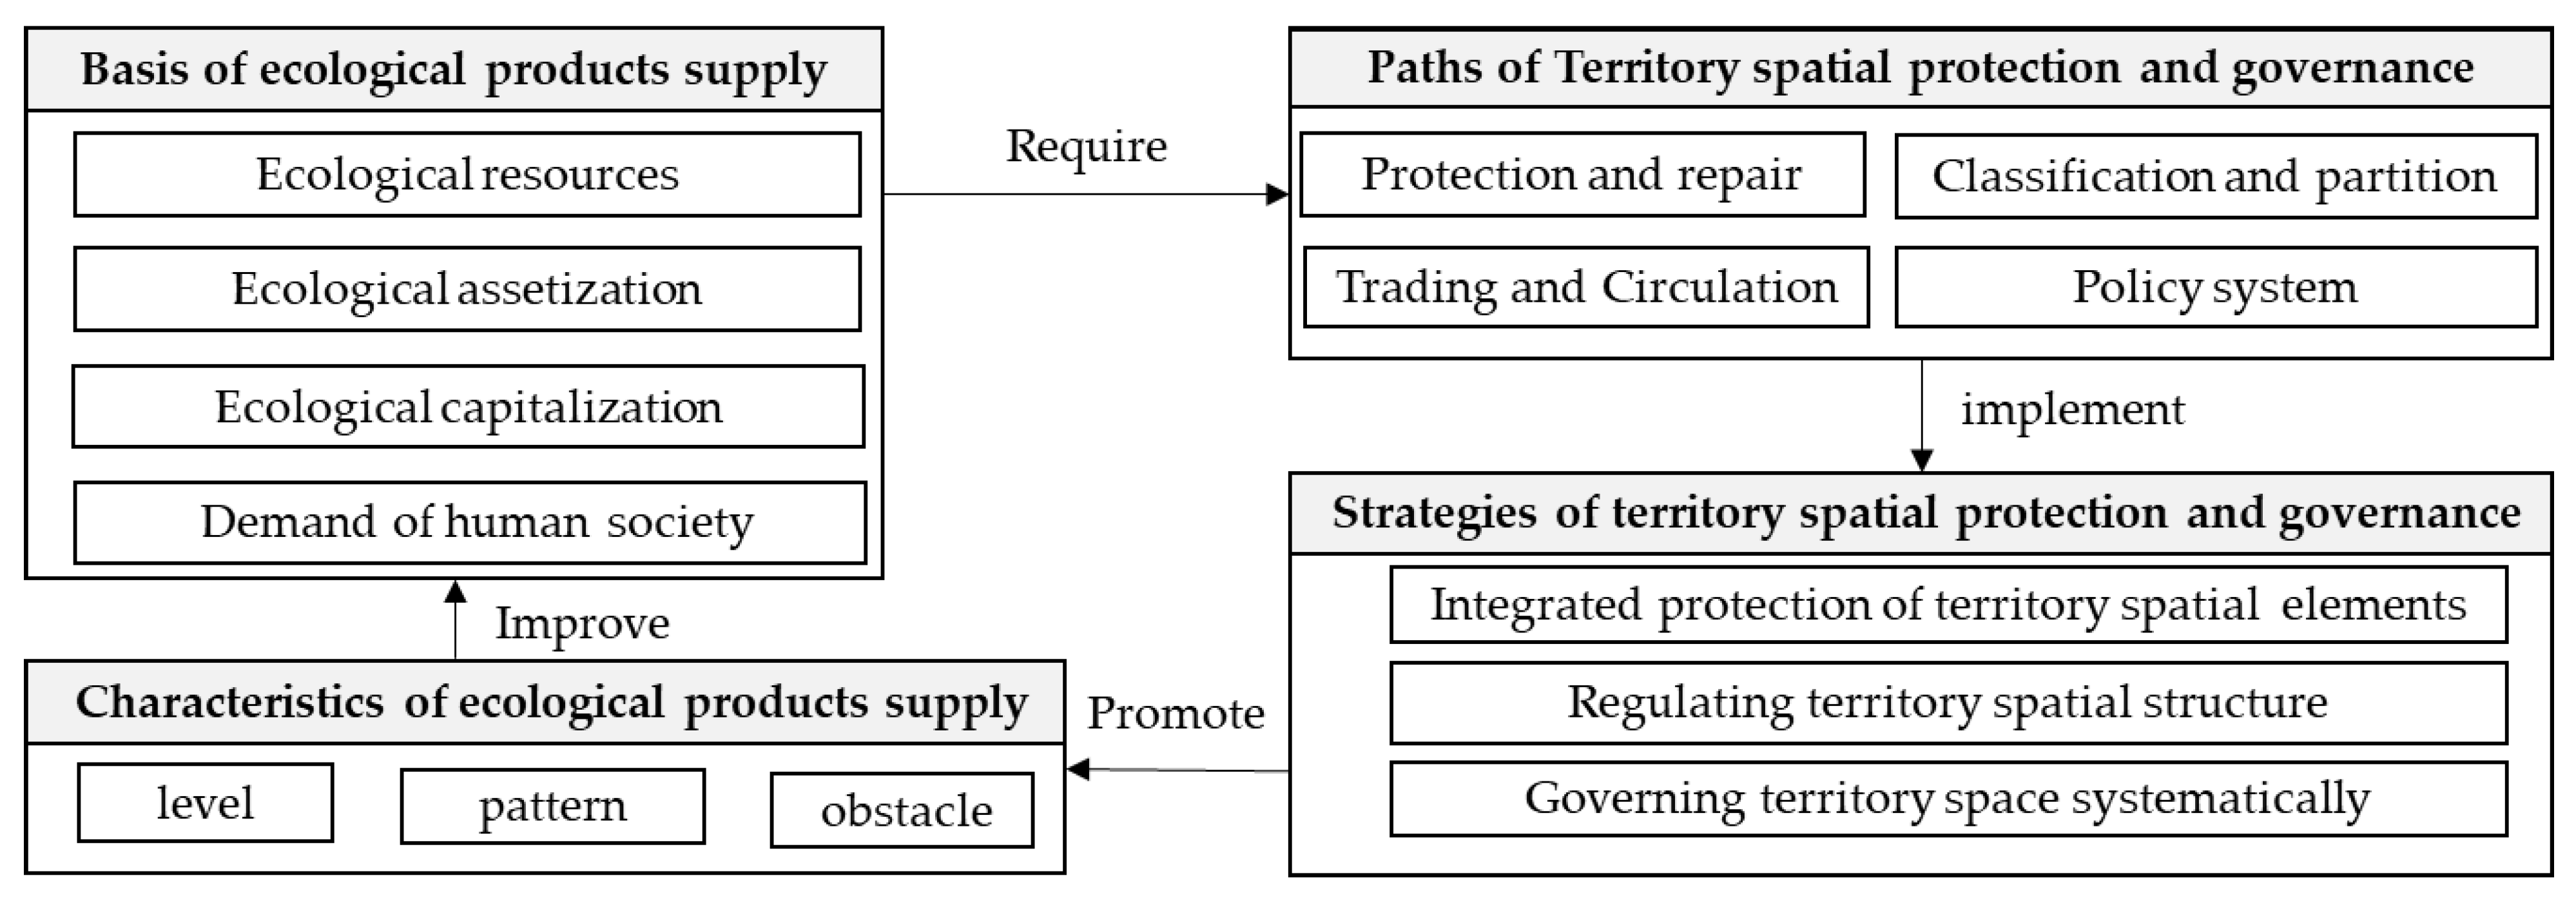
4. Strategies for Territory Spatial Protection and Governance to Enhance the Ecological Products’ Supply Capacity

Ecological products are based on natural resources and shaped by human society, with the territory space acting as the platform for natural resources and human development (Figure 6). The objective is to increase the availability of ecological products to safeguard and manage the territory space. Natural resources are the fundamental components of the ecological product supply, possessing the characteristics of resources, assets, and capital. The key to ensuring a steady supply of ecological products lies in the responsible preservation and utilization of natural resources, encouraging the transformation of ecology into valuable assets and capital to fulfil the requirements of human society. In the supply of ecological products, the protection and management of territory space reflect the asset management consideration of natural resources, providing the following protection and management paths: protecting and restoring natural resources, classifying and zoning the management of ecological resources, providing a space for trade circulation, and implementing safeguarding policies. These paths’ implementation requirements include the integrated protection of elements, structural regulation, and systematic governance. The interaction between human society and the ecological environment creates different types of functional spaces [57], and the characteristics of the ecological products as a product of human and biological joint action on the ecosystem reflect the utilization of territorial space elements, functional structures, and the system status [58]. Therefore, it is possible to enhance the level of the supply capacity, its spatio-temporal pattern, and the obstacle factors of ecological products, and construct strategies for protecting and governing territory space from the three viewpoints of the integrated protection of elements, structural regulation, and system governance.

4.1. Integrated Protection of Territorial Spatial Elements for Enhancing the Ecological Products’ Supply Capacity Level

The integrated protection of territory spatial elements considers the ecosystem of mountains, rivers, forests, fields, lakes, grasslands, and deserts as a whole. It requires relying on the advantages of each city’s endowment of ecological product elements to maintain and enhance the regional ecological system. The endowment of ecological elements determines the foundation and characteristics of the ecological product supply, with wind and water serving as natural media that connect various ecological elements. Therefore, the BTH region should rely on the endowment of ecological elements such as forest area, grassland, and cropland to plan and design integrated protection based on production products such as fresh air, organic agricultural products, natural ecology, and landscape culture.
The characteristic elements of the ecological product supply in the BTH region are located in the Yanshan and Taihang Mountain areas, involving Zhangjiakou and Chengde; the grassland area in the northwest of Zhangjiakou; the ecological tourism area of Beijing and Tianjin; the ecological agriculture area of Beijing, Tianjin, and Tangshan; the western regions of Shijiazhuang, Xingtai, and Handan; the mountainous and hilly ecological transition zones in the western parts of Handan and Hengshui; and the agricultural ecological zone in the North China Plain [59]. The cities of Chengde and Zhangjiakou should develop ecological tourism and animal husbandry based on their natural ecosystems such as forests and grasslands, forming several forest parks and grassland parks as nature reserves [60]. Important ecological tourism areas such as Beijing, Tianjin, and Shijiazhuang should ensure the supply of ecological land, such as forest areas and wetlands, and improve the ecological environment to guarantee the conditions for ecological tourism. Tangshan, Cangzhou, Hengshui, Xingtai, and Handan should make use of their large amount of cropland and agricultural products to develop eco-agriculture and agricultural tourism. In ecologically excessively hilly areas, both oasis protection and farmland protection and afforestation should be considered, forming mixed vegetation to ensure the sustainable development of agricultural ecological obstacles [61].

4.2. Regulation of the Territory Spatial Structure Based on Differentiated Patterns of the Ecological Products’ Supply Capacity

As noted by Pacione, M. in 2013 in Glasgow’s rural–urban fringe study, the disorderly use of territory space structures can lead to conflicts between land use patterns and ecological functions [62]. We should rely on the differences in the ecological product supply types in each city and lay out production, living, and ecological spaces according to the structural regulation of territory spaces’ functions. The division of “three spaces” and three ecological product categories coincide, but, in this study, production space aims at agricultural production and food security, living space involves maintaining residents’ living environment and leisure, and ecological space aims at maintaining ecological system stability. Regions such as Cangzhou, Hengshui, Xingtai, and Handan, which have a higher concentration of agricultural production, should prioritize the protection of permanent basic farmland. They should also make full use of the advantages of flat and contiguous land, promote mechanized agricultural production, and utilize the scientific and technological expertise and talent advantages of Beijing and Tianjin. There should be a shift in the development focus of major agricultural product areas toward providing high-tech and high-quality ecological materials. Living space is mainly located in the southeast plain area, including Beijing, Tianjin, Langfang, Shijiazhuang, and other metropolitan areas. We should promote urban public green space and infrastructure construction. Ecological space is mainly located in Chengde and Zhangjiakou, and we should strictly abide by their ecological protection [55].
The problem of mismatch between ecological product supply and demand is widespread. We should explore the cross-regional circulation and trading models of ecological products to regulate the structure of territory space [35]. Regions with advantages to ecological product supply are usually dominated by mountains and plateaus, with low population density and small consumption of ecological products. Most areas in the BTH region are plain areas, where population density and demand for construction land are large, inevitably leading to an insufficient ecological product supply. These problems inevitably promote the existence of cross-regional ecological product supply. Cities in the northern part of the BTH region, such as Chengde and Zhangjiakou, are regions with advantages in terms of their ecological environmental product supply compared to cities in the southern part of the region. The ecological product value should be calculated, and compensation standards should be determined. Beijing and Tianjin, along with other areas benefiting from fresh air and clean water sources, should pay compensation fees or compensate the areas supplying ecological products through ecological taxation. Tangshan, Cangzhou, and Hengshui, with advantages in their ecological material products’ supply, can improve market transaction prices by adopting ecological labelling certification methods or promoting the sale of local green products through green procurement and policy subsidies, transferring the ecological protection costs and other additional costs of product production to the consumer area.

4.3. Systematic Governance of Territory Space for Addressing the Ecological Products’ Supply Capacity Obstacle Factors

The ecological product supply obstacle factors in the BTH region are the basis for the governance of the territory spatial system, which helps to form a global and specific system of governance plan. The ecological cultural products in the BTH region face the greatest obstacles. The essential factors hindering development include fishery products, park green space, eco-leisure, eco-tourism, and eco-land. So, ecological construction should be strengthened throughout the region, with overall planning for native vegetation and traditional village ecological landscapes, to promote the transformation and realization of the value of ecological spaces and eco-leisure resources [59].
In addition, each city should strengthen its actions such as greening land and space, environmental governance, the restoration of mines, and returning cultivated land to forests, grass, and water, as well as enhance the reclamation and remediation of land while increasing the area of ecological land and urban park green spaces. For example, Beijing, Tianjin, and Tangshan should strengthen their mountain restoration and afforestation, protect water areas and wetlands, and develop ecological agriculture; Chengde and Zhangjiakou should deepen their governance of sand and dust sources in the Beijing–Tianjin region, expand green spaces, and carry out projects such as mountain closure and the afforestation of barren mountains to increase the area of urban park green spaces; Shijiazhuang and Qinhuangdao should rely on the beautiful natural environment to construct park green spaces and improve the quantity and quality of forests; Baoding, Handan, and Xingtai should focus on the restoration of mountain coverage, and continue to prevent soil erosion and vegetation destruction; Langfang, Hengshui, and Cangzhou should be highly vigilant against non-food production and the occupation of cropland, and carry out urban ecosystem integration governance [61].

5. Conclusions

Previous studies have emphasized the guiding role of ecosystem services in land resource development, but these studies have paid less attention to ecological products or have not explored territory protection and governance strategies based on the ecological product supply. This study combined the characteristics of ecological products and the ecological, productive, and living functions of territory space to construct an evaluation index system for the ecological products’ supply capacity, taking the BTH region as an example in which to comprehensively apply principal component analysis, the equivalent factor method, and the entropy value method to evaluate the supply capacity from 2011 to 2021. Furthermore, this study analyzed the spatio-temporal patterns of the ecological products’ supply using the natural breaking point method and quantile classification method and analyzed obstacle factors using the obstacle degree model. Finally, based on the level, pattern, and obstacle factors of the ecological products’ supply, we proposed suggestions for territory spatial protection and governance from the viewpoint of the integrated protection of elements, structural regulation, and systematic governance.
The main findings are as follows: (1) The overall supply capacity of ecological products in the BTH region showed an increase in 2011–2021. The highest availability was of ecological environmental products, while ecological material products had relatively lower availability. The category with the highest growth rate was ecological cultural products. (2) The availability of ecological products in different cities of the BTH region has been consistently increasing from 2011 to 2021, but the trends of different categories of the ecological product supply capacity varied over time. There were significant spatial differences and prominent regional advantages. (3) The supply of ecological cultural products directly impacts the overall supply capacity of ecological products, and the obstacle factors to the supply of ecological products were relatively stable, mainly concentrated in factors such as eco-land, eco-tourism, eco-leisure, park green spaces, and fishery products. There were specific differences in these factors between different cities.
Based on the analysis of the ecological product supply capacity level, pattern, and barrier factors, it is necessary to propose policy recommendations for territory spatial protection and governance from the viewpoints of the integrated protection of elements, structural regulation, and system governance. (1) The integrated protection of territory spatial elements requires relying on the advantages of the endowment of ecological product elements in each city to improve the regional ecological product supply. (2) Based on the variations in the types of ecological product supply in each city, the ecological space should be planned according to the idea of optimizing the overall structure of land space’s function. The optimization of the territory space structure can be based on providing material production, cultural life, and ecological environment functions. (3) The BTH region should strengthen the construction of ecological culture, plan the ecological landscape of native vegetation and traditional villages as a whole, and promote the value of beautiful ecological spaces and cultural resources for ecological leisure. Each city should also explore differentiated system governance strategies based on its barrier factors.
This study developed previous research on ecological products and established an evaluation index system for ecological products that considered the ecological function of the territory space. We also proposed territory spatial protection and governance strategies from the perspective of ecological product supply. This study helps to improve territory spatial planning from the perspective of the ecological environment’s protection. It provides references for ecological product supply and territory spatial planning in China and offers optimized strategies for land resource allocation and spatial coordinated development for sustainable development in some regions. However, various evaluation methods exist for the ecological product supply, and territory spatial protection and governance are complex. Ecological product classification, value reporting, and the realization of value transformation can all affect the evaluation results of the ecological product supply. Different indicators and methods may lead to different evaluation results. On the other hand, there may be inconsistencies between the ecological product supply and territory spatial protection and governance behaviors due to the incomplete economic rationality of ecological product suppliers when facing complex economic and social information. Therefore, in future research, (1) we should further explore the comprehensive set of indicators and corresponding accurate calculation methods (2) to strengthen the analysis of the ecological product demand and the analysis of incentives for ecological product supply in ecological product supply analyses. (3) It is also important to delve into the thinking and behavior of ecological product suppliers and territory spatial protection and governance entities, seeking a balance and consistency between product suppliers and territory spatial protection and governance entities.

Author Contributions

Project administration, W.P.; writing—original draft preparation, X.Y.; data curation, Y.S.; writing—review and editing, Z.S.; supervision, W.P. All authors have read and agreed to the published version of the manuscript.

Funding

This research was supported by the Beijing Social Science Foundation Major Project “Research on building an ecological civilization system (19ZDA03)”.

Data Availability Statement

All data and models generated or used in the research process of this paper are presented and explained in the body of the article.

Conflicts of Interest

The authors declare no conflict of interest.

References

  1. Gao, L.; Bryan, B.A. Finding Pathways to National-Scale Land-Sector Sustainability. Nature 2017, 544, 217–222. [Google Scholar] [CrossRef] [PubMed]
  2. Remøy, H.; Street, E. The Dynamics of “Post-Crisis” Spatial Planning: A Comparative Study of Office Conversion Policies in England and The Netherlands. Land Use Policy 2018, 77, 811–820. [Google Scholar] [CrossRef]
  3. Persson, C. Deliberation or Doctrine? Land Use and Spatial Planning for Sustainable Development in Sweden. Land Use Policy 2013, 34, 301–313. [Google Scholar] [CrossRef]
  4. Turner, B.L.; Lambin, E.F.; Verburg, P.H. From Land-Use/Land-Cover to Land System Science. Ambio 2021, 50, 1291–1294. [Google Scholar] [CrossRef] [PubMed]
  5. The State Council of the People’s Republic of China. Opinions of the Central Committee of the Communist Party of China and the State Council on the Establishment of National Territory Spatial Planning System and Supervision of Its Implementation. Available online: https://www.gov.cn/zhengce/2019-05/23/content_5394187.htm (accessed on 4 May 2021).
  6. Harris, L.R.; Defeo, O. Sandy Shore Ecosystem Services, Ecological Infrastructure, and Bundles: New Insights and Perspectives. Ecosyst. Serv. 2022, 57, 101477. [Google Scholar] [CrossRef]
  7. Fan, J.; Sun, W.; Zhou, K.; Chen, D. Major Function Oriented Zone: New Method of Spatial Regulation for Reshaping Regional Development Pattern in China. Chin. Geogr. Sci. 2012, 22, 196–209. [Google Scholar] [CrossRef]
  8. The State Council of the People’s Republic of China. Opinions of the Central Committee of the Communist Party of China and the State Council on Establishing and Improving the Mechanism for Realizing the Value of Ecological Products. Available online: https://www.gov.cn/zhengce/2021-04/26/content_5602763.htm (accessed on 23 November 2023).
  9. Woodruff, S.C.; BenDor, T.K. Ecosystem Services in Urban Planning: Comparative Paradigms and Guidelines for High Quality Plans. Landsc. Urban Plan. 2016, 152, 90–100. [Google Scholar] [CrossRef]
  10. Hansen, R.; Frantzeskaki, N.; McPhearson, T.; Rall, E.; Kabisch, N.; Kaczorowska, A.; Kain, J.-H.; Artmann, M.; Pauleit, S. The Uptake of the Ecosystem Services Concept in Planning Discourses of European and American Cities. Ecosyst. Serv. 2015, 12, 228–246. [Google Scholar] [CrossRef]
  11. Hauck, J.; Görg, C.; Varjopuro, R.; Ratamäki, O.; Jax, K. Benefits and Limitations of the Ecosystem Services Concept in Environmental Policy and Decision Making: Some Stakeholder Perspectives. Environ. Sci. Policy 2013, 25, 13–21. [Google Scholar] [CrossRef]
  12. Beery, T.; Stålhammar, S.; Jönsson, K.I.; Wamsler, C.; Bramryd, T.; Brink, E.; Ekelund, N.; Johansson, M.; Palo, T.; Schubert, P. Perceptions of the Ecosystem Services Concept: Opportunities and Challenges in the Swedish Municipal Context. Ecosyst. Serv. 2016, 17, 123–130. [Google Scholar] [CrossRef]
  13. Zorrilla-Miras, P.; Palomo, I.; Gómez-Baggethun, E.; Martín-López, B.; Lomas, P.L.; Montes, C. Effects of Land-Use Change on Wetland Ecosystem Services: A Case Study in the Doñana Marshes (SW Spain). Landsc. Urban Plan. 2014, 122, 160–174. [Google Scholar] [CrossRef]
  14. Vallecillo, S.; Polce, C.; Barbosa, A.; Perpiña Castillo, C.; Vandecasteele, I.; Rusch, G.M.; Maes, J. Spatial Alternatives for Green Infrastructure Planning across the EU: An Ecosystem Service Perspective. Landsc. Urban Plan. 2018, 174, 41–54. [Google Scholar] [CrossRef]
  15. Plummer, M.L. Assessing Benefit Transfer for the Valuation of Ecosystem Services. Front. Ecol. Environ. 2009, 7, 38–45. [Google Scholar] [CrossRef]
  16. Marchese, D.; Reynolds, E.; Bates, M.E.; Morgan, H.; Clark, S.S.; Linkov, I. Resilience and Sustainability: Similarities and Differences in Environmental Management Applications. Sci. Total Environ. 2018, 613–614, 1275–1283. [Google Scholar] [CrossRef] [PubMed]
  17. Perschke, M.J.; Harris, L.R.; Sink, K.J.; Lombard, A.T. Using Ecological Infrastructure to Comprehensively Map Ecosystem Service Demand, Flow and Capacity for Spatial Assessment and Planning. Ecosyst. Serv. 2023, 62, 101536. [Google Scholar] [CrossRef]
  18. Li, L.; Fan, Z.; Xiong, K.; Shen, H.; Guo, Q.; Dan, W.; Li, R. Current Situation and Prospects of the Studies of Ecological Industries and Ecological Products in Eco-Fragile Areas. Environ. Res. 2021, 201, 111613. [Google Scholar] [CrossRef] [PubMed]
  19. Zhou, J.; Xiong, K.; Wang, Q.; Tang, J.; Lin, L. A Review of Ecological Assets and Ecological Products Supply: Implications for the Karst Rocky Desertification Control. Int. J. Environ. Res. Public Health 2022, 19, 10168. [Google Scholar] [CrossRef]
  20. Qu, Y.; Wang, S.; Tian, Y.; Jiang, G.; Zhou, T.; Meng, L. Territorial Spatial Planning for Regional High-Quality Development – An Analytical Framework for the Identification, Mediation and Transmission of Potential Land Utilization Conflicts in the Yellow River Delta. Land Use Policy 2023, 125, 106462. [Google Scholar]
  21. Lv, T.; Zeng, C.; Lin, C.; Liu, W.; Cheng, Y.; Li, Y. Towards an Integrated Approach for Land Spatial Ecological Restoration Zoning Based on Ecosystem Health Assessment. Ecol. Indic. 2023, 147, 110016. [Google Scholar] [CrossRef]
  22. Costanza, R.; de Groot, R.; Braat, L.; Kubiszewski, I.; Fioramonti, L.; Sutton, P.; Farber, S.; Grasso, M. Twenty Years of Ecosystem Services: How Far Have We Come and How Far Do We Still Need to Go? Ecosyst. Serv. 2017, 28, 1–16. [Google Scholar] [CrossRef]
  23. Wong, C.P.; Jiang, B.; Kinzig, A.P.; Lee, K.N.; Ouyang, Z. Linking Ecosystem Characteristics to Final Ecosystem Services for Public Policy. Ecol. Lett. 2014, 18, 108–118. [Google Scholar] [CrossRef] [PubMed]
  24. Shi, Y.; Zhou, C.; Wang, R.; Xu, W. Measuring China’s Regional Ecological Development through “EcoDP”. Ecol. Indic. 2012, 15, 253–262. [Google Scholar] [CrossRef]
  25. Wang, N.; Xu, C.; Kong, F. Value Realization and Protection and governance paths of Forest Ecological Products—Case Study from Zhejiang Province, China. Int. J. Environ. Res. Public Health 2022, 19, 7538. [Google Scholar] [CrossRef] [PubMed]
  26. Zhang, Y.; Ma, Z.; Sun, M.; Song, J.; Yang, Y.; Li, Q.; Jing, Y. Quantitatively Evaluating the Ecological Product Value of Nine Provinces in the Yellow River Basin from the Perspective of the Dual-Carbon Strategy. Land 2023, 12, 516. [Google Scholar] [CrossRef]
  27. Schröter, M.; Barton, D.N.; Remme, R.P.; Hein, L. Accounting for Capacity and Flow of Ecosystem Services: A Conceptual Model and a Case Study for Telemark, Norway. Ecol. Indic. 2014, 36, 539–551. [Google Scholar] [CrossRef]
  28. Costanza, R.; d’Arge, R.; de Groot, R.; Farber, S.; Grasso, M.; Hannon, B.; Limburg, K.; Naeem, S.; O’Neill, R.V.; Paruelo, J.; et al. The Value of the World’s Ecosystem Services and Natural Capital. Nature 1997, 387, 253–260. [Google Scholar] [CrossRef]
  29. Millennium Ecosystem Assessment (MEA). Ecosystems and Human Well-Being: Synthesis; Isterritory Press: Washington, DC, USA, 2005. [Google Scholar]
  30. Ouyang, Z.; Song, C.; Zheng, H.; Polasky, S.; Xiao, Y.; Bateman, I.J.; Liu, J.; Ruckelshaus, M.; Shi, F.; Xiao, Y.; et al. Using Gross Ecosystem Product (GEP) to Value Nature in Decision Making. Proc. Natl. Acad. Sci. USA 2020, 117, 14593–14601. [Google Scholar] [CrossRef]
  31. van Oudenhoven, A.P.E.; Petz, K.; Alkemade, R.; Hein, L.; de Groot, R.S. Framework for Systematic Indicator Selection to Assess Effects of Land Management on Ecosystem Services. Ecol. Indic. 2012, 21, 110–122. [Google Scholar] [CrossRef]
  32. de Groot, R.; Brander, L.; van der Ploeg, S.; Costanza, R.; Bernard, F.; Braat, L.; Christie, M.; Crossman, N.; Ghermandi, A.; Hein, L.; et al. Global Estimates of the Value of Ecosystems and Their Services in Monetary Units. Ecosyst. Serv. 2012, 1, 50–61. [Google Scholar] [CrossRef]
  33. Hein, L.; van Koppen, K.; de Groot, R.S.; van Ierland, E.C. Spatial Scales, Stakeholders and the Valuation of Ecosystem Services. Ecol. Econ. 2006, 57, 209–228. [Google Scholar] [CrossRef]
  34. Shen, J.; Li, S.; Liu, L.; Liang, Z.; Wang, Y.; Wang, H.; Wu, S. Uncovering the Relationships Between Ecosystem Services and Social-Ecological Drivers at Different Spatial Scales in the Beijing-Tianjin-Hebei Region. J. Clean. Prod. 2021, 29, 125193. [Google Scholar] [CrossRef]
  35. Chen, Y.; Zhai, Y.; Gao, J. Spatial Patterns in Ecosystem Services Supply and Demand in the Jing-Jin-Ji Region, China. J. Clean. Prod. 2022, 361, 132177. [Google Scholar] [CrossRef]
  36. Yang, J.; Huang, X. The 30 m Annual Land Cover Dataset and Its Dynamics in China from 1990 to 2019. Earth Syst. Sci. Data 2021, 13, 3907–3925. [Google Scholar] [CrossRef]
  37. Farley, J.; Costanza, R. Payments for Ecosystem Services: From Local to Global. Ecol. Econ. 2010, 69, 2060–2068. [Google Scholar] [CrossRef]
  38. Yang, Y.; Ren, X.; Yan, J. Trade-Offs or Synergies? Identifying Dynamic Land Use Functions and Their Interrelations at the Grid Scale in Urban Agglomeration. Cities 2023, 140, 104384. [Google Scholar] [CrossRef]
  39. Fu, J.; Bu, Z.; Jiang, D.; Lin, G.; Li, X. Sustainable Land Use Diagnosis Based on the Perspective of Production–Living–Ecological Spaces in China. Land Use Policy 2022, 122, 106386. [Google Scholar] [CrossRef]
  40. Pearson, K. On Lines and Planes of Closest Fit to Systems of Points in Space. Lond. Edinb. Dublin Philos. Mag. J. Sci. 1901, 2, 559–572. [Google Scholar] [CrossRef]
  41. Kaiser, H. A Second Generation Little Jiffy. Psychometrika 1970, 35, 411–416. [Google Scholar] [CrossRef]
  42. Bartlett, M.S. A Note on the Multiplying Factors for Various χ2 Approximations. J. R. Stat. Soc. Ser. B (Methodol.) 1954, 16, 296–298. [Google Scholar] [CrossRef]
  43. Cattell, R.B. The Scree Test for the Number of Factors. Multivar. Behav. Res. 1966, 1, 245–276. [Google Scholar] [CrossRef]
  44. Xie, G.; Zhang, C.; Zhen, L.; Zhang, L. Dynamic Changes in the Value of China’s Ecosystem Services. Ecosyst. Serv. 2017, 26, 146–154. [Google Scholar] [CrossRef]
  45. Ming, L.; Chang, J.; Li, C.; Chen, Y.; Li, C. Spatial-Temporal Patterns of Ecosystem Services Supply-Demand and Influencing Factors: A Case Study of Resource-Based Cities in the Yellow River Basin, China. Int. J. Environ. Res. Public Health 2022, 19, 16100. [Google Scholar] [CrossRef] [PubMed]
  46. Zhou, Z.; Sun, X.; Zhang, X.; Wang, Y. Inter-Regional Ecological Compensation in the Yellow River Basin Based on the Value of Ecosystem Services. J. Environ. Manag. 2022, 322, 116073. [Google Scholar] [CrossRef] [PubMed]
  47. Xie, G.D.; Lu, C.X.; Long, Y.F.; Zheng, D.; Li, S.C. Ecological assets valuation in the Tibetan Plateau. J. Nat. Resour. 2003, 2, 189–196. (In Chinese) [Google Scholar]
  48. Galton, F. Regression Towards Mediocrity in Hereditary Stature. J. Anthropol. Inst. Great Br. Irel. 1886, 15, 246–263. [Google Scholar] [CrossRef]
  49. Shannon, C.E. A Mathematical Theory of Communication. ACM Sigmobile Mob. Comput. Commun. Rev. 2001, 5, 3–55. [Google Scholar] [CrossRef]
  50. Xu, H.; Jia, A.; Song, X.; Bai, Y. Suitability Evaluation of Carrying Capacity and Utilization Patterns on Tidal Flats of Bohai Rim in China. J. Environ. Manag. 2022, 319, 115688. [Google Scholar] [CrossRef]
  51. Han, H.; Guo, L.; Zhang, J.; Zhang, K.; Cui, N. Spatiotemporal Analysis of the Coordination of Economic Development, Resource Utilization, and Environmental Quality in the Beijing-Tianjin-Hebei Urban Agglomeration. Ecol. Indic. 2021, 127, 107724. [Google Scholar] [CrossRef]
  52. Beck, A.T. Depression: Clinical, Experimental, and Theoretical Aspects; Hoeber Medical Division, Harper & Row: New York, NY, USA, 1967. [Google Scholar]
  53. Zhao, R.; Fang, C.; Liu, J.; Zhang, L. The Evaluation and Obstacle Analysis of Urban Resilience from the Multidimensional Perspective in Chinese Cities. Sustain. Cities Soc. 2022, 86, 104160. [Google Scholar] [CrossRef]
  54. Wei, L.; Zhang, Y.; Wang, L.; Cheng, Z.; Wu, X. Obstacle Indicators Diagnosis and Advantage Functions Zoning Optimization Based on “Production-Living-Ecological” Functions of National Territory Space in Jilin Province. Sustainability 2022, 14, 4215. [Google Scholar] [CrossRef]
  55. Yang, Y. Evolution of Habitat Quality and Association with Land-Use Changes in Mountainous Areas: A Case Study of the Taihang Mountains in Hebei Province, China. Ecol. Indic. 2021, 129, 107967. [Google Scholar] [CrossRef]
  56. Wang, Z.; Liang, L.; Sun, Z.; Wang, X. Spatiotemporal Differentiation and the Factors Influencing Urbanization and Ecological Environment Synergistic Effects within the Beijing-Tianjin-Hebei Urban Agglomeration. J. Environ. Manag. 2019, 243, 227–239. [Google Scholar] [CrossRef] [PubMed]
  57. Yang, Y.; Bao, W.; Liu, Y. Coupling Coordination Analysis of Rural Production-Living-Ecological Space in the Beijing-Tianjin-Hebei Region. Ecol. Indic. 2020, 117, 106512. [Google Scholar] [CrossRef]
  58. Smith, A.; Yee, S.H.; Russell, M.; Awkerman, J.; Fisher, W.S. Linking Ecosystem Service Supply to Stakeholder Concerns on Both Land and Sea: An Example from Guánica Bay Watershed, Puerto Rico. Ecol. Indic. 2017, 74, 371–383. [Google Scholar] [CrossRef] [PubMed]
  59. Zhou, W.; Xi, Y.; Zhai, L.; Li, C.; Li, J.; Hou, W. Zoning for Spatial Conservation and Restoration Based on Ecosystem Services in Highly Urbanized Region: A Case Study in Beijing-Tianjin-Hebei, China. Land 2023, 12, 733. [Google Scholar] [CrossRef]
  60. Bao, C.; Wang, H.; Sun, S. Comprehensive Simulation of Resources and Environment Carrying Capacity for Urban Agglomeration: A System Dynamics Approach. Ecol. Indic. 2022, 138, 108874. [Google Scholar] [CrossRef]
  61. Wu, F.; Wang, X.; Ren, Y. Urbanization’s Impacts on Ecosystem Health Dynamics in the Beijing-Tianjin-Hebei Region, China. Int. J. Environ. Res. Public Health 2021, 18, 918. [Google Scholar] [CrossRef]
  62. Pacione, M. Private Profit, Public Interest and Land Use Planning—A Conflict Interpretation of Residential Development Pressure in Glasgow’s Rural–Urban Fringe. Land Use Policy 2013, 32, 61–77. [Google Scholar] [CrossRef]
Figure 1. The location and territory-use pattern of the BTH region in 2022.
Land 12 02130 g001
Figure 2. Workflow of analyzing ecological products’ supply for achieving territory spatial protection and governance.
Land 12 02130 g002
Figure 3. Time changes in the ecological products’ supply of the cities in the BTH region.
Land 12 02130 g003
Figure 4. Spatial differentiation pattern of ecological products’ supply capacity in the BTH region. Note: “OEP” represents the overall ecological products, “EEP” represents the ecological environmental products, “EMP” represents the ecological material products, and “ECP” represents the ecological cultural products.
Land 12 02130 g004
Figure 5. Top 5 obstacle factors for the ecological products’ supply of cities in the BTH region. Note: Each color block’s length and symbol represent the proportion of each indicator’s obstacle degree to the sum of the obstacle degrees of the top five factors.
Land 12 02130 g005
Figure 6. Analysis for territory spatial protection and governance based on ecological products’ supply.
Land 12 02130 g006
Table 1. Dataset source information.
Data SourceData FormatData Support Organization
The 30 m annual China land cover dataset (CLCD)Raster dataWuhan University
Statistical Yearbook of the provinces in the BTH region
China Urban Statistical Yearbook
National Compilation of Cost and Benefit of Agricultural Products
Numerical dataNational Bureau of Statistics of the People’s Republic of China
Ecological Environment Bulletin of provinces and cities in the BTH regionNumerical dataEcological Environment Bureau of provinces and cities in the BTH region
Table 2. Evaluation index system and weight of ecological products’ supply capacity.
Target LayerCriterion LayerFactor LayerIndex LayerWeightDirection
Ecological productEcological environmental productsX1 Fresh airThe overall level of air 0.0191+
X2 Clean waterThe overall level of water 0.0513+
X3 Safe soilSoil conservation value (CNY)0.0885+
X4 BiodiversityBiodiversity value (CNY)0.0933+
X5 Eco-landEcological land area (hectares)0.1054+
X6 Per capita cropland Cultivated area per capita
(square meters/person)
0.0303+
Ecological material productsX7 Agricultural productsOutput value of agricultural products (CNY)0.0249+
X8 Forestry productsOutput value of forest products (CNY)0.0722+
X9 Animal husbandry productsOutput value of animal husbandry products (CNY)0.0227+
X10 Fishery productsOutput value of fishery products (CNY)0.1232+
Biomass energyBiomass energy output value\+
Wind energyWind energy output value \+
Solar energySolar energy output value\+
Hydro energyHydro energy output value\+
Ecological cultural productsX11 Greening of the built-up areaGreening rate of built-up areas (%)0.0171+
X12 Park green spaceArea of park green space (hectare)0.1216+
X13 Forest coverForest coverage (%)0.0150+
X14 Eco-tourismTourist excursion income (CNY)0.1060+
X15 Eco-leisureTourist entertainment income (CNY)0.1100+
Note: “+” represents the positive indicators. “CNY” is the unit of measurement for China’s legal currency. “\” represents these indicators have not been included in the calculation.
Table 3. Equivalent value of safe soils and biodiversity per unit area in the BTH region.
TypeCroplandWoodlandGrasslandWaterWetlandBare Land
Soil safety0.4371.9491.2350.7811.9400.017
Biodiversity0.1431.7811.1262.1426.6110.017
Table 4. Time change of ecological products’ supply capacity in the BTH region from 2011 to 2021.
IndexYear
Type20112012201320142015201620172018201920202021
OEP1.5911.6461.7151.7881.7871.9411.9992.1492.2872.1172.386
EEP0.9120.9000.8880.8820.8900.9130.9260.9470.9741.0281.055
EMP0.3100.3700.4290.4610.4520.4710.4160.4760.4890.5430.561
ECP0.3690.3760.3980.4450.4450.5560.6580.7270.8240.5450.770
Note: “OEP” represents the overall ecological products, “EEP” represents the ecological environmental products, “EMP” represents the ecological material products, and “ECP” represents the overall cultural products.
Disclaimer/Publisher’s Note: The statements, opinions and data contained in all publications are solely those of the individual author(s) and contributor(s) and not of MDPI and/or the editor(s). MDPI and/or the editor(s) disclaim responsibility for any injury to people or property resulting from any ideas, methods, instructions or products referred to in the content.

