Article

Using Diachronic Cartography and GIS to Map Forest Landscape Changes in the Putna-Vrancea Natural Park, Romania

by
George-Adrian Istrate
1,
Vasilică Istrate
2,
Adrian Ursu
3,
Pavel Ichim
3 and
Iuliana-Gabriela Breabăn
1,3,*
1
Faculty of Geography and Geology, Doctoral School of Geosciences, “Alexandru Ioan Cuza” University of Iasi, Carol I Boulevard, No. 11, 700506 Iasi, Romania
2
Active Intervention in the Atmosphere, Răcari Str., No. 5, 031827 Bucharest, Romania
3
Faculty of Geography and Geology, Department of Geography, “Alexandru Ioan Cuza” University of Iasi, Carol I Boulevard, No. 11, 700506 Iasi, Romania
*
Author to whom correspondence should be addressed.
Land 2023, 12(9), 1774; https://doi.org/10.3390/land12091774
Submission received: 31 July 2023 / Revised: 6 September 2023 / Accepted: 8 September 2023 / Published: 13 September 2023
(This article belongs to the Special Issue Conservation of Bio- and Geo-Diversity and Landscape Changes II)

Abstract

:
The Putna-Vrancea Natural Park (PVNP) is one of the wildest mountain areas in Romania and is home to internationally important species of flora and fauna. Although the park’s area is covered by forests, the last two centuries have seen several major transformations. The aim of this article is to present a historical approach to the development of habitat areas within the PVNP, with an attempt to show both the situation before and after the establishment of its protection regime. The changes in the forest area were identified using available cartographic material from 1789, 1895, 1957, 1975, 2005, and 2018. The analysis of forest distribution according to different classes of natural factors (altitude, slope, soil type, and lithology) highlighted the early 20th century when forest cover decreased at low altitudes and slopes. However, anthropogenic factors were responsible for almost all changes. The specific socio-economic system of the Vrancea Mountains, according to which the forest was and still is owned by the inhabitants of several villages, led to periods of deforestation: burning to increase the area of pastures and the unsustainable exploitation of wood by some companies that had been granted this right by the owners. In the 1960s and 1970s, the mountain pastures were reforested, and in the last 20 years, the mountain pastures have been transformed into forests. Although the use of old maps for this type of analysis has certain limitations, the results obtained provide insight into the causes of the transformation of forest landscapes in some areas of the PVNP.

1. Introduction

Changes in forest landscapes in recent centuries, especially in the 19th and 20th centuries, resulted in the disappearance of some old landscapes that are recoverable via diachronic analysis using historical maps and aerial photographs. Historical land-use changes strongly and sometimes dominantly influence current ecosystem dynamics, showing a delayed response [1]. This article aims to present a historical approach to the evolution of habitat areas within the PVNP, attempting to show both the situation before and after the establishment of its protection regime.
The main focus of this study is on the dynamics of the forested areas in the current PNPV using old cartographic information and orthophotos. Both anthropogenic factors (development of settlements, traditional practices, and logging industry) and natural factors (altitude, slope, soil type, and lithology) were considered in the analysis of the spatial distribution of forested areas. In addition, an attempt has been made to identify the possible factors that have influenced the increase or decrease in forested areas during the period under study. Since historical maps are useful for the retrospective analysis of land use and land-use change over time [2,3], the results obtained can provide a theoretical reference for the management and promotion of the sustainable development of PVNP. In the analysis of the evolution of forests and other areas, historical maps (old cadastral maps, topographic maps, military maps, and thematic maps) containing information on land use can serve as temporal layers. They can be used as a basis for the reconstruction of past patterns of land use, particularly when they are used in a geographical information system (GIS). Cadastral maps, which were produced in almost all European countries in the 19th century, have been widely used for land cover analysis. They can be used to assess the microstructure of the landscape because they are reliable and detailed. They are used in Belgium [3] Slovenia [4], Germany [5], Italy [6], Sweden [7], Norway [8,9], and the Czech Republic [10,11]. Petit and Lambin [3] found that historical maps seemed to provide more reliable land-use estimates than agricultural census data. In Slovenia [4], maps from the Franziscean Cadastre were compared with current land use, and they successfully determined changes, particularly in the rural cultural landscape. For southern Germany [5], the land-register-based diachronic GIS provides valuable results that are relevant for planning processes and nature conservation in changing cultural landscapes. Skaloš et al. [11] indicate that military survey maps are an adequate source for analyzing and evaluating changes in the macrostructure of the landscape, particularly the main trends in landscape development. A comparison of landscape development in Sweden and the Czech Republic using old cadastral maps was also carried out by Skaloš [12]. In addition, landscape changes and the evolution of land cover with specific vegetation types are also studied using historical topographic maps, old vegetation maps, and military maps. To reconstruct landscape change in the canton of Valais, Switzerland, Stäuble. [13] used more accurate topographic maps from the mid-19th century. Wetland evolution was analyzed using both old and new topographic maps in the canton of Zurich, Switzerland [14], and some US coastal areas [15,16,17]. Despite their scientific value, analyses using historical maps for larger areas are still relatively rare, because on the one hand, they require extensive contextual knowledge [18,19,20] and on the other hand they are time-consuming due to the geometric correction, digitization, and manual assignment of land-use classes. For these reasons, the long-term studies of land change based on historical maps are largely limited to relatively small areas [21,22,23,24], and they are rarely used for continental or global scales [25,26,27]. Existing global or continental reconstructions provide long timescales, but their spatial resolution and local accuracy are too low for studying regional-scale change.
For the Romanian territory, studies have been conducted using information from 18th, 19th, and 20th century topographic maps, especially regarding the evolution of forest areas. In western Romania, Munteanu et al. used the digitised topography maps of 1860 and 1960 to model the degree of contemporary forest degradation [28]. Other studies have focused on the diachronic analysis of areas occupied by different vegetation types for smaller areas such as watersheds [29,30,31,32,33], relief units [34,35,36], administrative units [37,38,39], or around places of interest [40,41]. For the northern part of PVNP, Istrate et al. [42] analysed changes in land use and the degree of fragmentation, focusing particularly on the dynamics of the evolution of forested areas and using information from topographic maps dated 1896 and 1975.

2. Materials and Methods
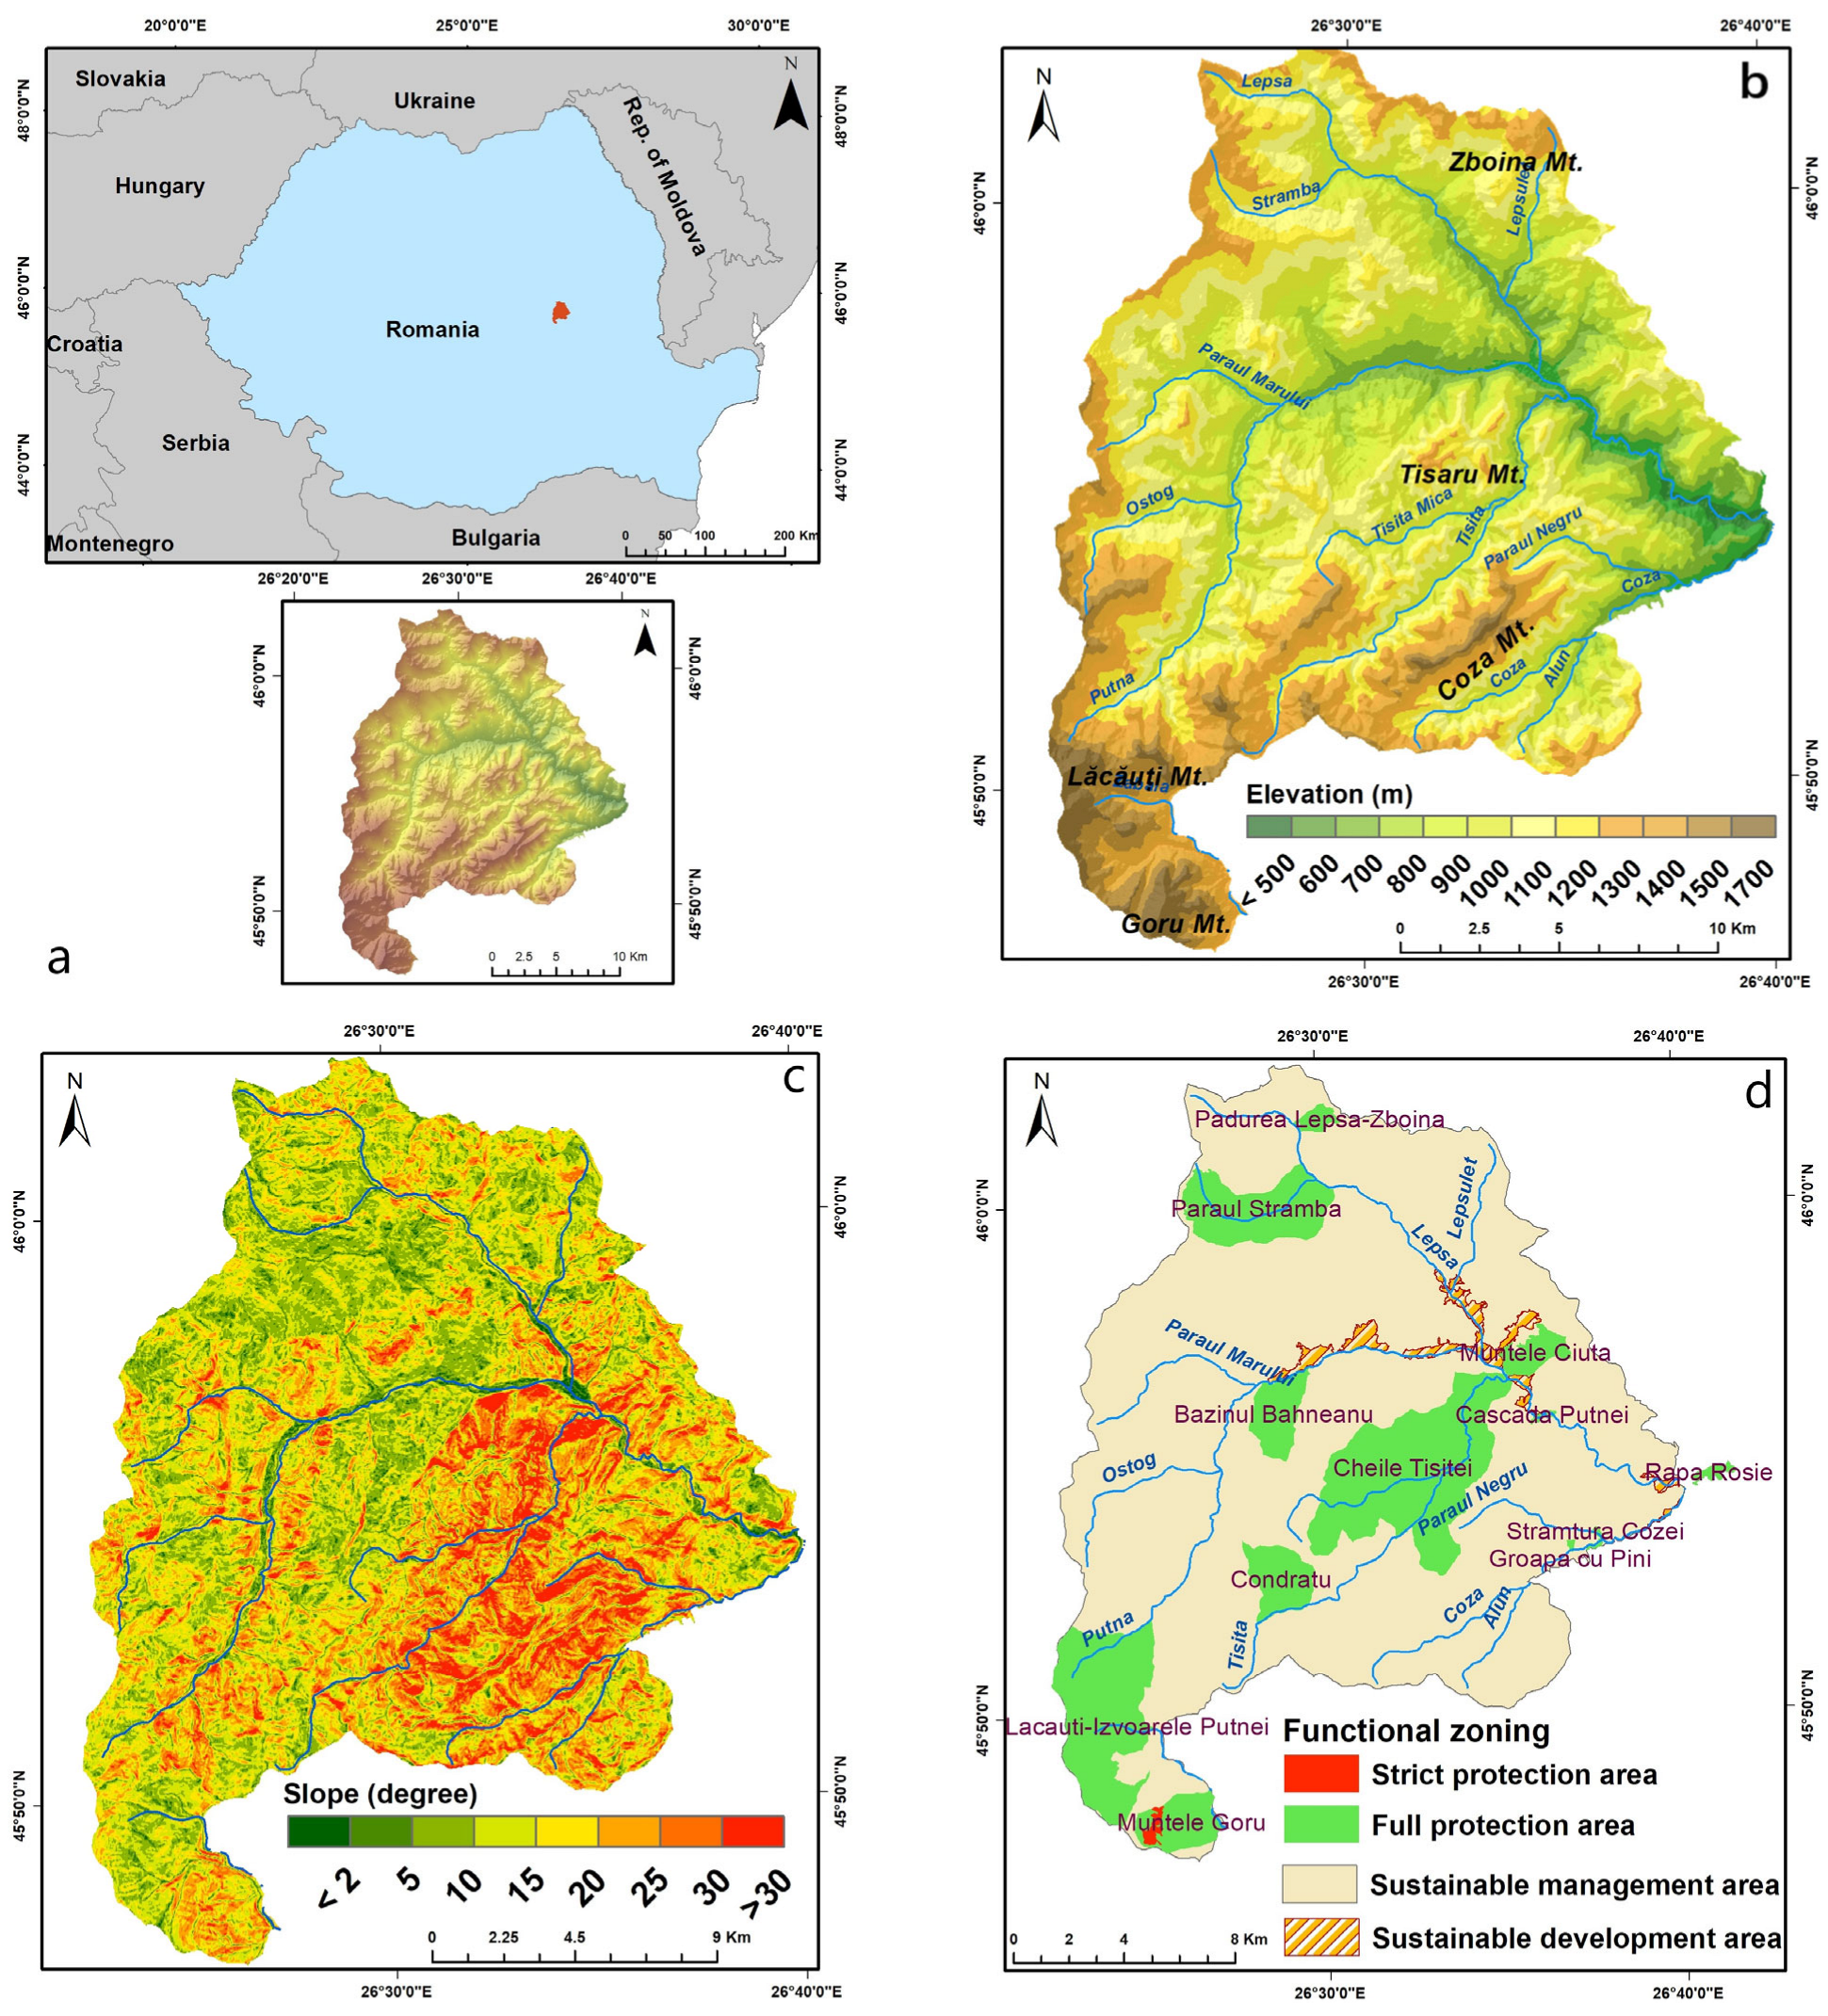
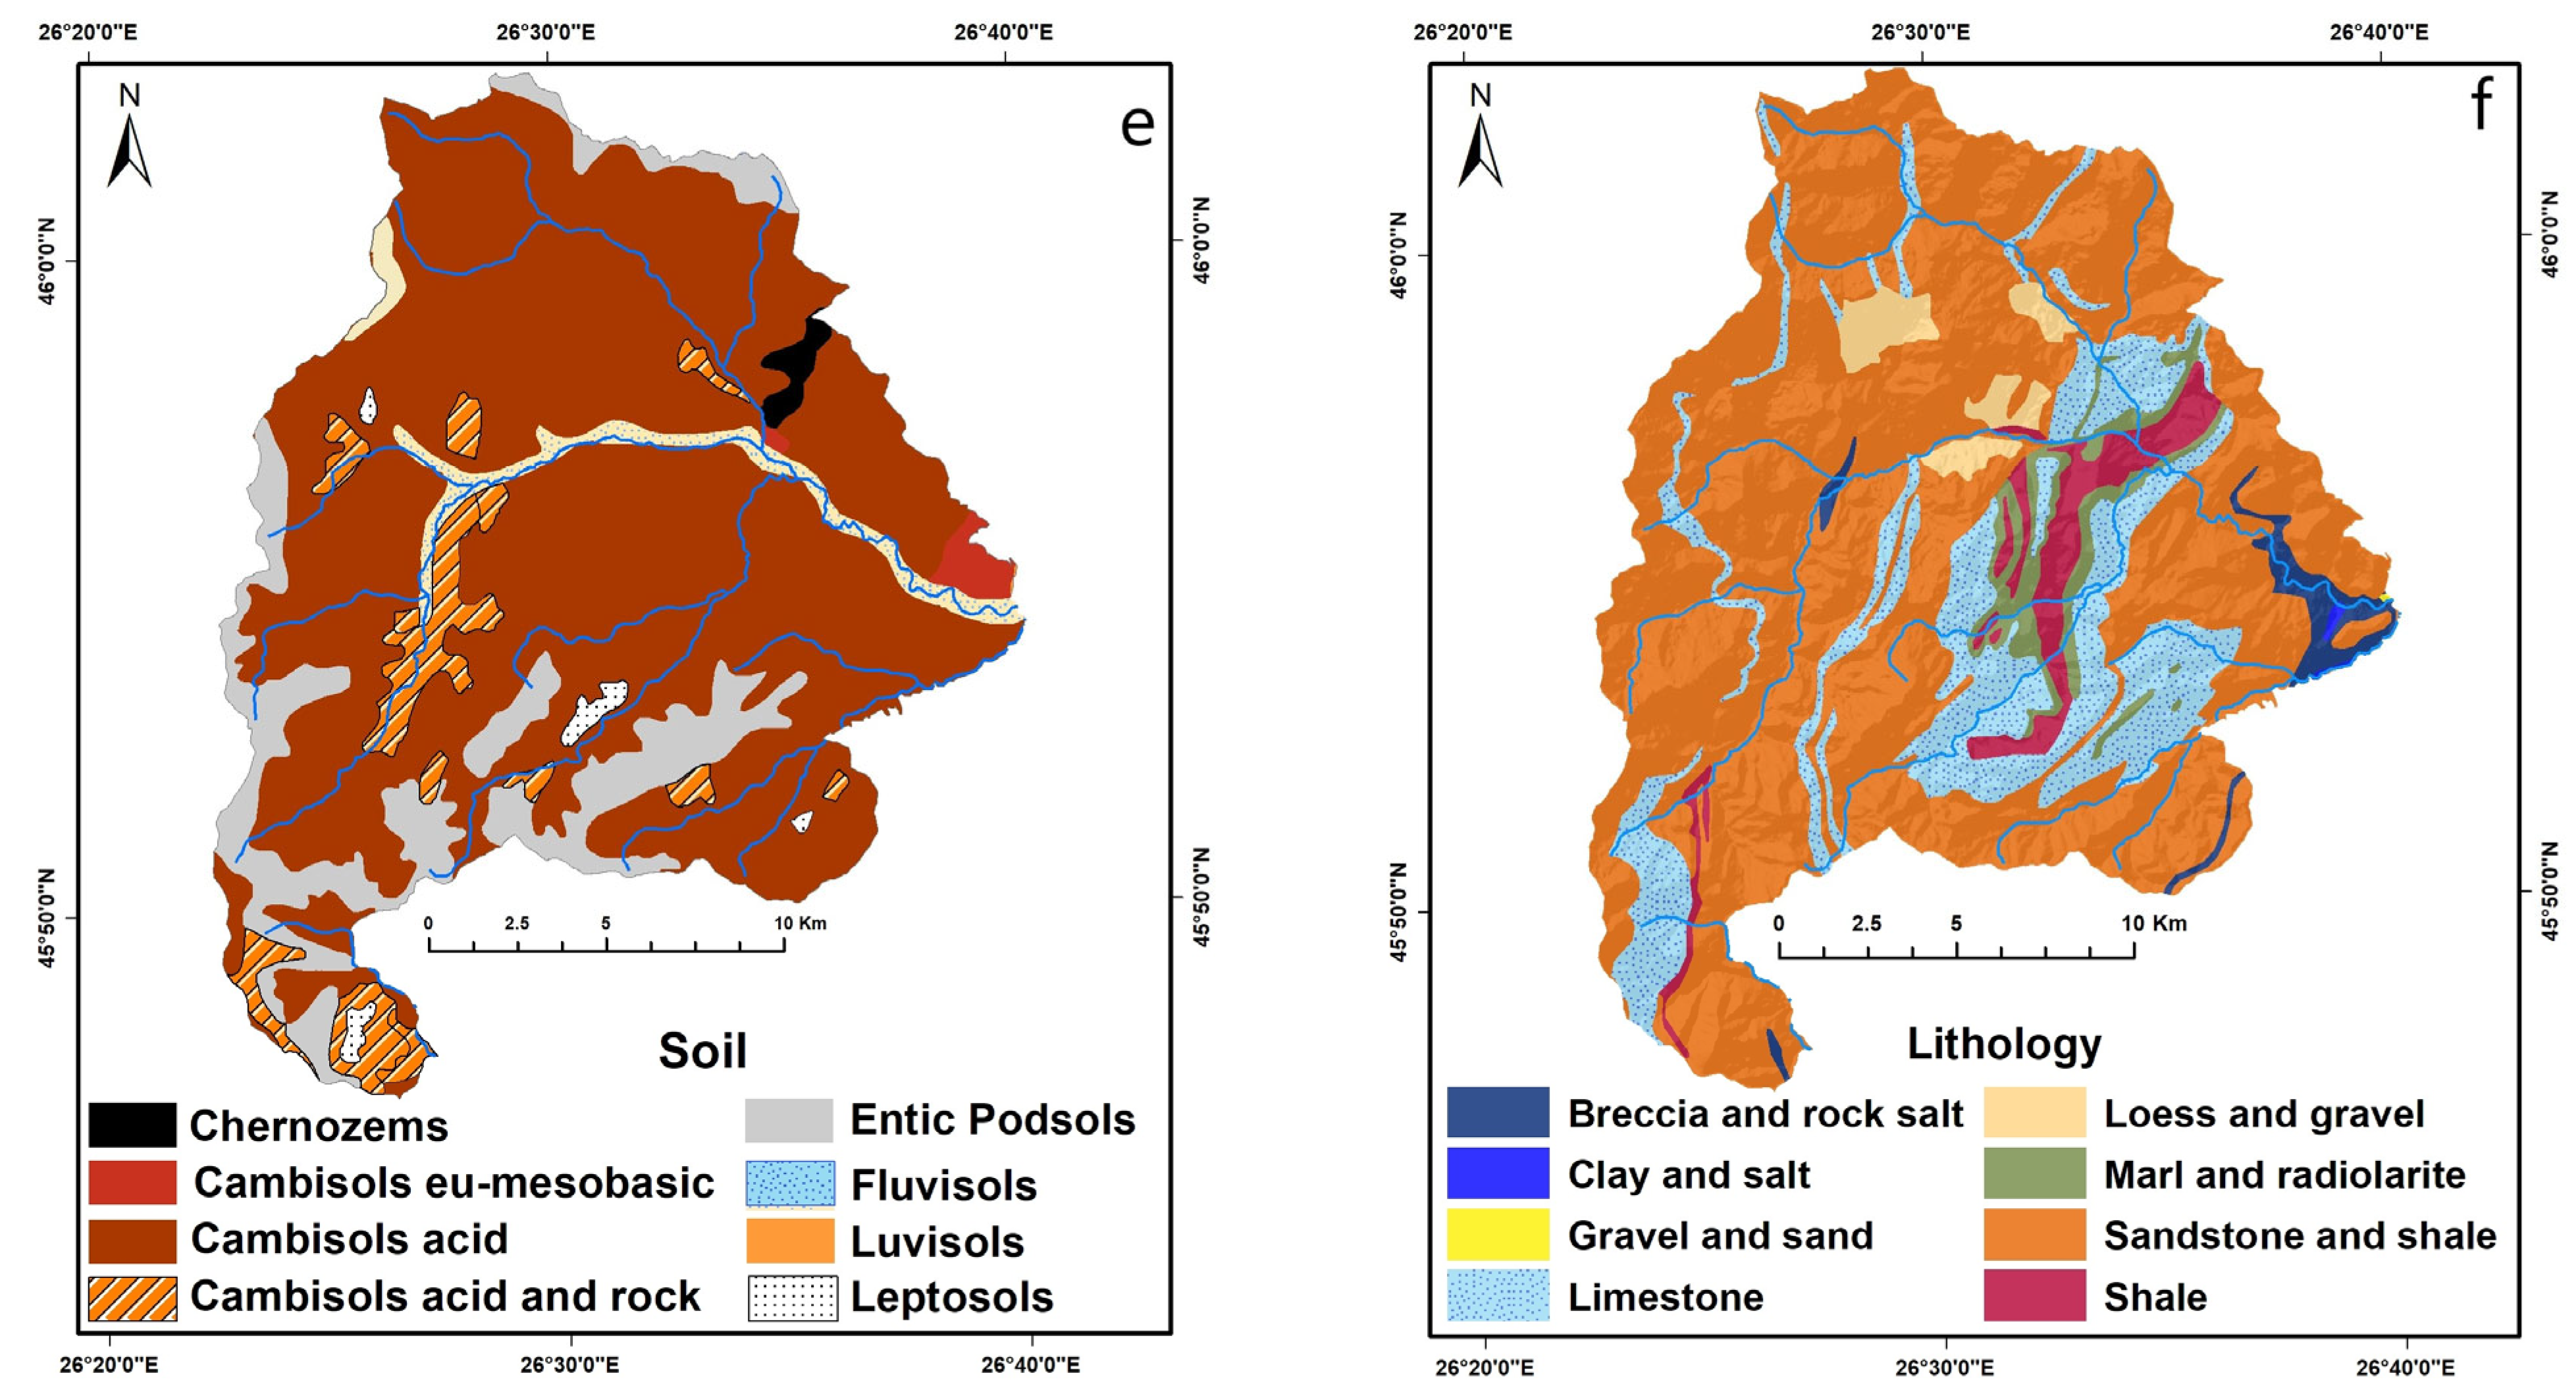
2.1. Study Area

Created in 2004, the PVNP aims to protect and conserve landscape complexes where the interaction between human activities and nature over time has created a distinct area of significant landscape and/or cultural value that is often accompanied by high biodiversity. Within the territory of the park, the following areas have been identified: strictly protected areas, integrated protected areas, areas for sustainable management, and areas for the sustainable development of human activity management plans [43]. The park extends over the central–northwestern part of the Vrancea Mountains and covers the entire Putna River basin. To the southwest, the Mordanu and Goru massifs (maximum altitude—1778 m) are included. The Putna-Vrancea Natural Park covers an area of 38,204 hectares, which represents 41.32% of the mountainous area of Vrancea County, Figure 1.
Geologically, the Cretaceous and Paleogene formations, which form the geological composition of the Putna-Vrancea Natural Park, are highly heterogeneous both geographically and structurally, and they are elements that, together with positive or negative tectonic movements, define a complex area both as a whole and in its details. Sedimentary, detrital, and chemically precipitated rocks predominate, i.e., gypsum and salt and local pyroclastics. The bedrock is dominated by numerous types of sandstone, the most common of which are Kliwa and Tarcău sandstone, but calcareous, convex cortical, glauconitic, or micaceous sandstone is also observed, and they are arranged in bundles of variable thicknesses that are often folded or comprise phyllite [44,45]. Lithology and tectonics have determined that about 27% of PVNP has slopes above 25° (Tisaru and Coza massifs), defining hardly accessible areas. The most predominant soils are the Dystric Cambisols of the cambisols class according to soil maps [46,47].
The natural vegetation under which these soils have been formed is dominated by beech woods mixed with conifers at the lower altitudes, while spruce woods are predominant at the higher altitudes. Podzols are found with an insular character, and in some places, there are scrublands. In the Lăcăuți-Goru and Zboina massifs, they occupy large areas. Grassland is the main cover of these soils in places where they occur in association with podzols and lithosols. They are characterised by a high erosion index and require erosion control measures to maintain their high productivity. The Umbrisols are represented in the Putna basin by the Nigrosols, which have a medium to high productive value and provide favourable conditions for developing forests, especially beech and coniferous.
In terms of climate, the PVNP area is characterised by average temperatures in July ranging from 14 to 16 °C at the edge of the mountains and 10 °C at altitudes above 1500 m. In January, average temperatures fall from −2 °C to less than −6 °C at the highest altitudes [48].

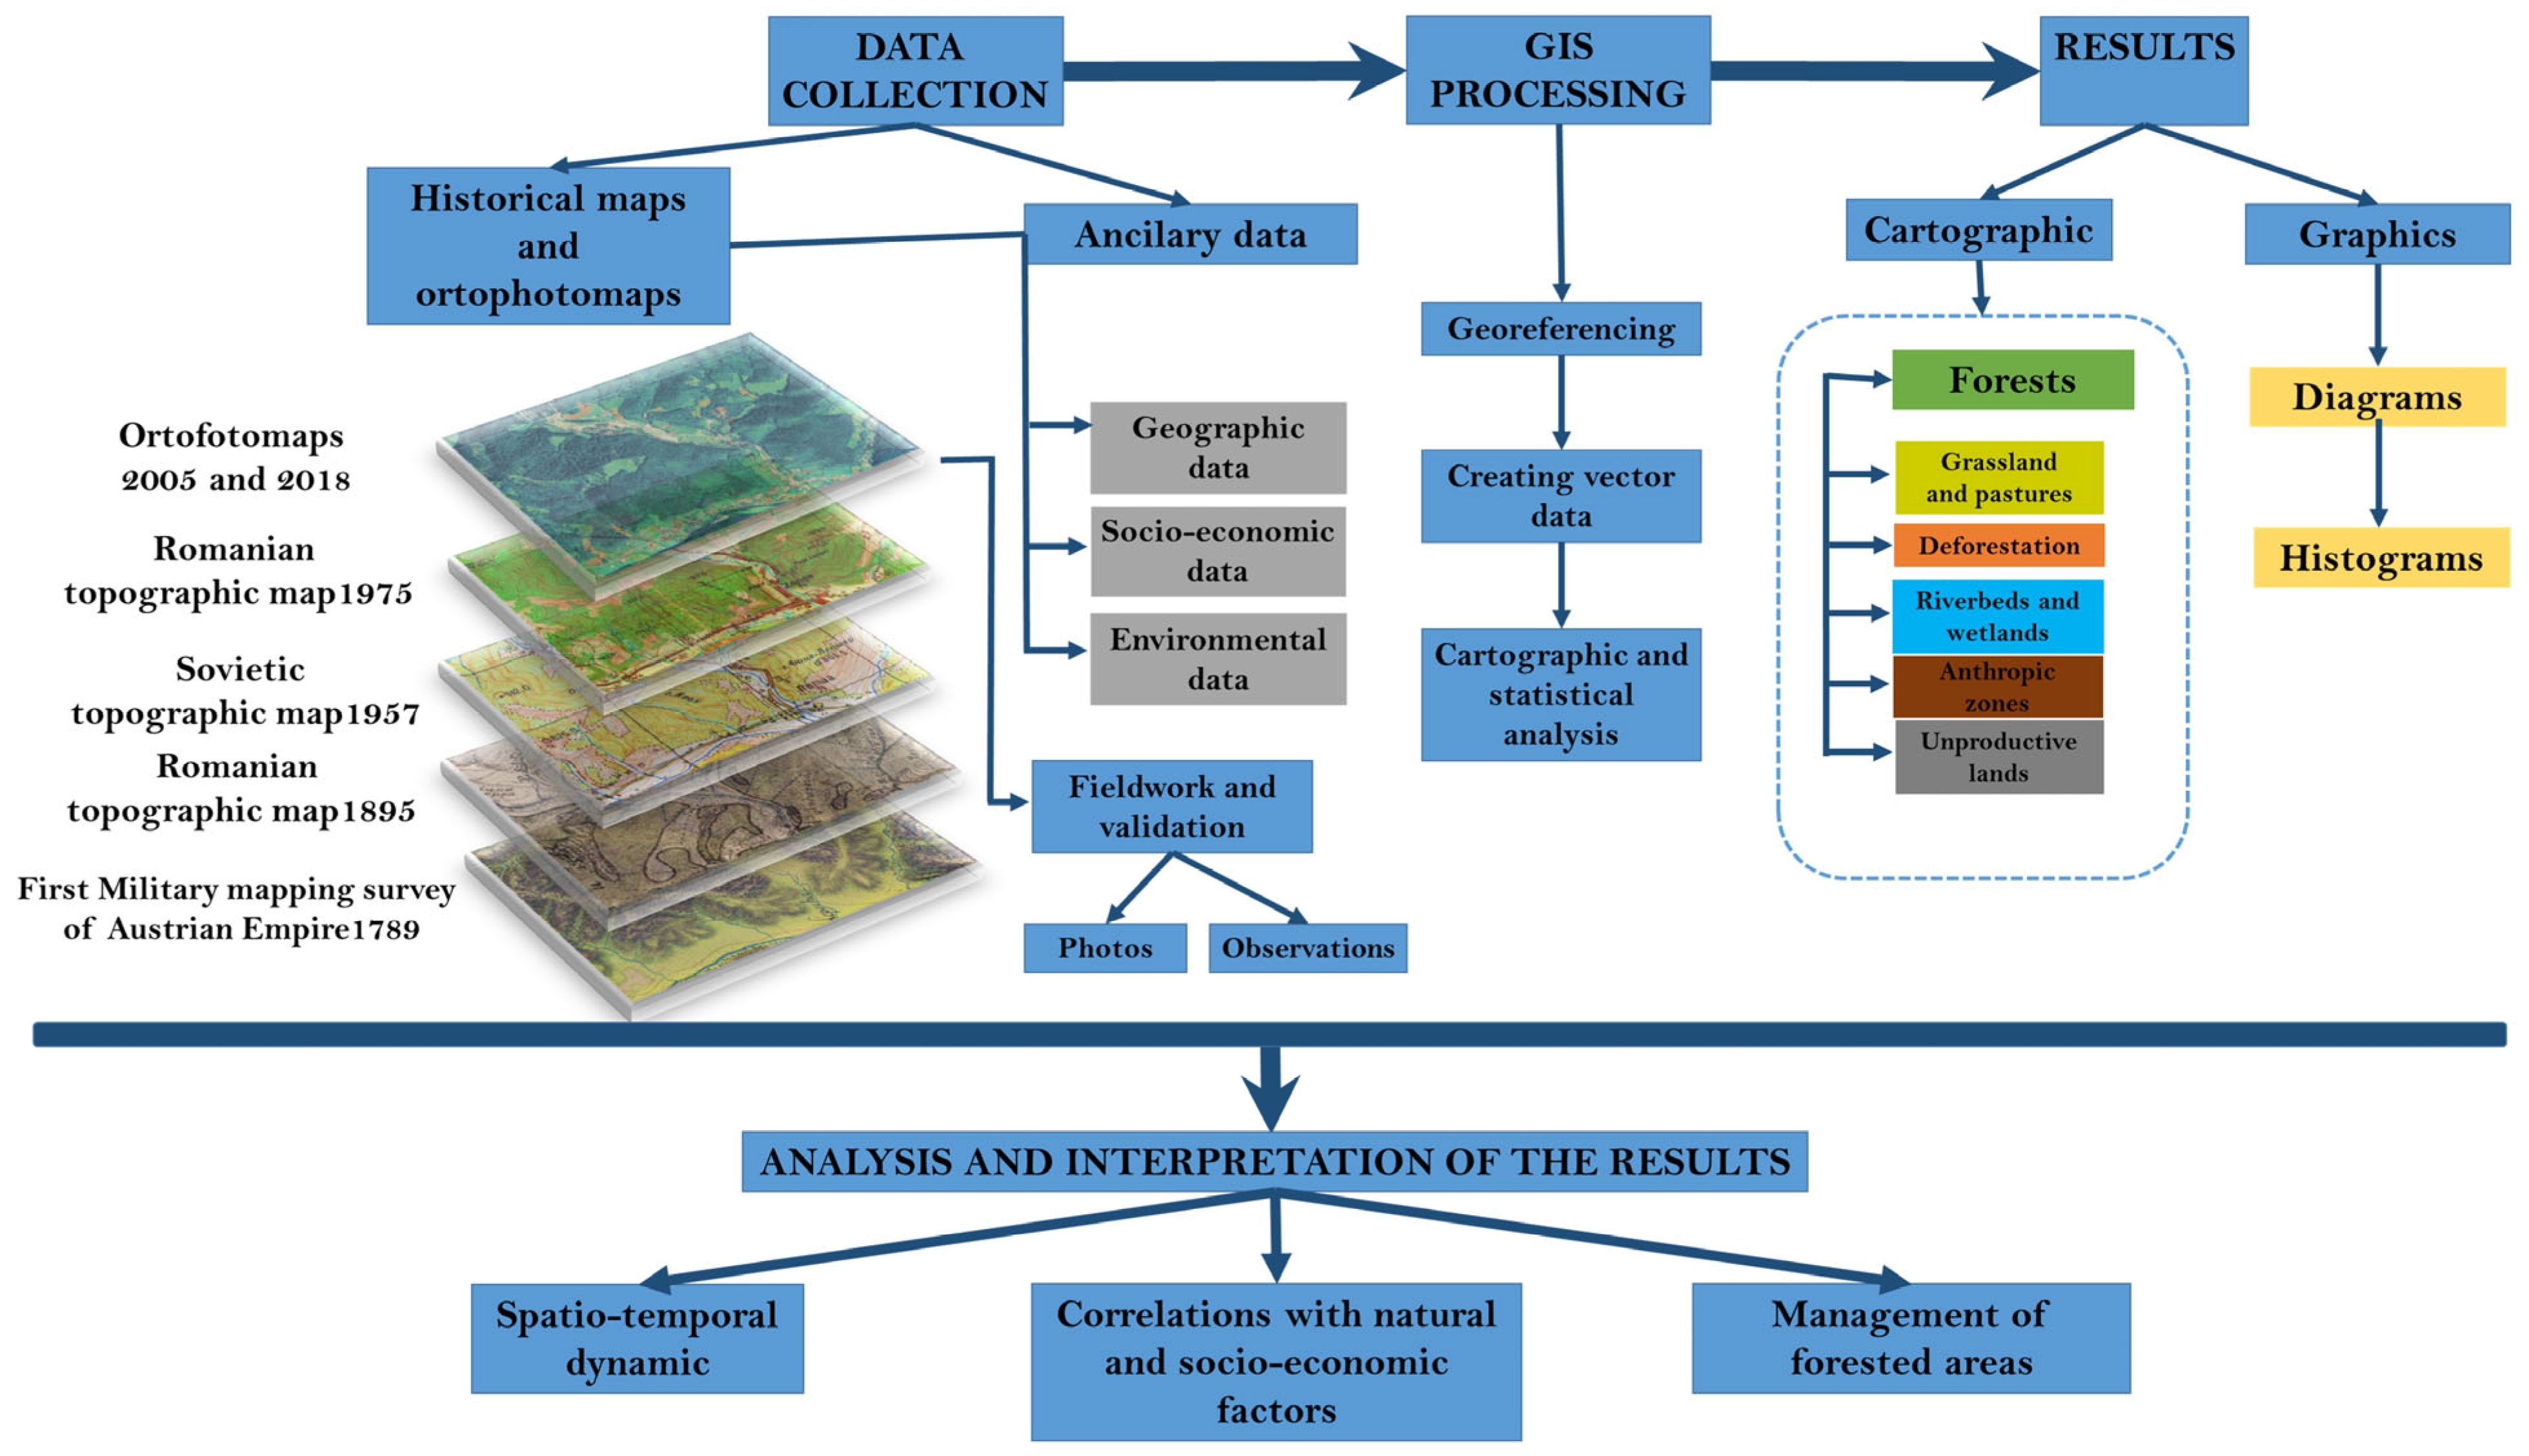
2.2. Data Collection

Information from all available cartographic material for the area, as well as orthophotos, was used to analyse land-use changes in the PNPV over the last two centuries, Table 1.
All materials used were georeferenced in Stereo70 projection, the official projection of Romania. The materials starting from the topographic map of 1970 were downloaded directly from the indicated sources.
The cartographic materials from 1789 were obtained from the website https://maps.arcanum.com/en/accessed on 20 June 2021 via WGS84 georeferencing. Their original projection was Cassini. For each province, 200–250 ground control points were used for the WGS84 projection of the maps for the entire Habsburg Empire. The resulting errors were up to 200 metres, with the largest errors at the edges [49,50]. Using the Project Raster tool, this was then reprojected to Stereo 70 with Dealul_Piscului_1970 in Arc Map.
The 1886 map was originally Cassini-projected. This was first digitised by scanning the map sheets used. The georeferencing was carried out using the image-to-image method. Twenty-five control points from the 1970 topographic map were used, and a third-order polynomial transformation was applied. The control points were chosen to be those that have not changed over time. These include churches, peaks or dominant elevations, and major road junctions.
The 1957 map of the Soviet Union was downloaded from http://www.geospatial.org/vechi/maps/download-planuri-tragere.php with a Stereo 70 georeference, and its original georeference is Gauss–Krűger.
The Habsburg maps of 1788–1790 provide the earliest information on land use. This was based on the first topographic mapping carried out by the Habsburg army. During the Russo–Austrian–Turkish war between 1787 and 1791, the Habsburgs occupied the territories of Moldavia and Wallachia, and at this time, they carried out the first detailed field surveys and topographic maps of these countries; the field surveys and measurements were carried out between 1788 and 1789 [51,52], (Figure 2). Map sheets at a scale of 1:28,800 were produced based on the topographic surveys. A total of 107 map sheets (and an index map) were produced, each measuring 63 × 42 cm (16 × 24 inches on the map and 1.6 × 2.4 miles on the téren) [53,54]. Six map sheets, namely 95, 96, 97, 98, 99, and 100, were used for our study. They were obtained from the website https://maps.arcanum.com/ (accessed on 20 June 2021) and scanned, georeferenced, and mosaicked as part of the ARCANUM project [49,55].
From a chronological point of view, the topographic map of Moldavia of the 1892–1898 period was the second cartographic material used. After the War of Independence, the triangulation of the territory of Moldavia began with Romanian specialists from the war depot. It began in the summer of 1875 and ended in autumn 1894 using a Cassini projection. Four map sheets were used in the present study at a scale of 1:50,000. These are based on the information available in 1895 and include a brief description of the main conventional characters in use. The Austro-Hungarian 1:75,000 maps were used for information on narrow-gauge railways, funiculars, and gantries used in forestry. These maps covered the neighbouring areas of the empire and were also called "Special Maps of the Austro-Hungarian Monarchy" (Specialkarte der Österreichisch-Ungarischen Monarchie). They are available for free download and use under the Creative Common Licence at http://geoportost.ios-regensburg.de/geoportal/ (accessed on 2 June 2021). Information on land use and some elements related to the development of forest areas (narrow-gauge railways, gates) in this period have been compiled from the “Master Drawings”. Before the Unification of 1918, Romanian territories belonged to several empires; therefore, the cartographic basis for each Romanian province differed from area to area. In 1916–1917, this resulted in new data, a new projection system, and new nomenclature. Lambert’s projection system, modified by French geodesist, mathematician, and officer Andre Louis Cholesky, was applied [32]. The base map, known as the “Plan Director de Tragere”, had a scale of 1:20,000 and consisted of 2118 plates covering the entire Romanian territory. The graphic length of these plates was 75 cm (equivalent to 15 km in the field) and 50 cm (equivalent to 10 km in the field). The transformation of the map sheets from classical support (paper or canvas) to a digital georeferenced format and their accessibility to the public was carried out by members of the geo-spațial.org association. For this study, five 1916–1917 maps were downloaded and used as Geotiff in the Stereo70 projection (http://www.geospatial.org/vechi/maps/download-planuri-tragere.php) (accessed 4 July 2021). The southern map sheet is missing and does not cover the entire PVNP area. The topographic surveys on which they are based date from 1893 to 1894, although they were made during the First World War. The level of detail of the forest areas is similar to that of the 1896 map, with only the roads updated, as indicated in the legend at the bottom of the sheet. These maps also show narrow-gauge railways, funiculars, and gantries used for logging, and the localities are much more detailed.
Soviet topographic maps at a scale of 1:50,000 were used for the third analysed period, i.e., 1957. The USSR launched one of the most ambitious cartographic projects in history even before the outbreak of the Second World War. The aim of this project was to map the entirety of the globe down to the smallest detail. After the fall of the Soviet Union, the project was unearthed, and scans of the maps were available on various websites, both free and paid. The rasters used to extract information about the PNPV (L-35-065-D, L-35-066-C, L-35-077-B, L-35-077-D, L-35-078-A, and L-35-078-C) were downloaded with Stereo 70 georeferencing from http://geo-spatial.org/vechi/download/hartile-sovietice-50k (accessed 23 June 2021). Despite being on a 1:50,000 scale, the Soviet maps are very detailed and are comparable to the Romanian military topography maps on a 1:25,000 scale.
The early 1970s is the fourth analysed period. Information was extracted from Romanian 1:25,000 military topographic maps. This is the 2nd edition of the “modernised map at the scale of 1:25,000” in the Gauss–Krueger projection on the Krasovski ellipsoid, and it is produced by the Military Topographic Directorate, also called the modernised map. The used map sheets are dated from 1974 to 1975, and they were obtained from the Database of the Department of Geography, Faculty of Geography and Geology, Alexandru Ioan Cuza University, Iasi.
The 2005 map was made via photo interpretation based on aerial photographs available on the portal of the National Agency for Cadastre and Land Registration (NACLR): www.ancpi.ro.
The last phase of analysis from a chronological point of view was the one from 2017 to 2019. Orthophotos available in Google Earth Pro software were used for this approach. QGis software with the QuickMapServices plugin was used to download them. The greater part of the PVNP area is covered by aerial photographs taken in the 2017–2019 interval, and for about 1200 ha of its area, there are images from the 2010 and 2011 intervals.

2.3. Thematic Generalization and Land-Use Analysis

The manual digitisation technique was then used to visually interpret and delineate the different land-use categories. For each of the cartographic materials used, digitisation was carried out using ArcGIG 10.6.1 and TNTMips 6.4 software. Manual digitisation proved to be the most reliable, and it was accurate for the cartographic materials used. The vector layers that were obtained in the form of polygons were given attributes so that they could then be used in diachronic analysis. Despite the fact that there are many different types of land use on modern maps and orthophotos, the main categories of land use that are common across the five periods examined were applied. The five categories are as follows: anthropic zones (village interiors, small arable areas, and roads in the PNPV area), grasslands and pastures (mountain pastures and meadows), forests (all areas marked on the cartographic materials as covered by trees and shrubs), riverbeds and wetlands (main riverbeds and areas marked on the map as wetlands), unproductive areas (cliffs, badlands, erosion areas, and landslide gullies). The 1956 Soviet military topographic map introduced the category “deforestation”, which included areas of actual deforestation, clearings, and burnt forests marked with symbols [56].
The time series of each natural factor (slope, elevation, soils, and lithology) were subjected relative to a raster-based statistical analysis to obtain the representative multi-year trends of the spatial patterns of change in each pixel; this was carried out using the percentage ratio of the number of pixels specific to each subcategory and the total number of pixels, followed by subtracting the initial value from the final value. Thus, some changes have been highlighted, and we consider these changes as mostly effects of human intervention.

3. Results

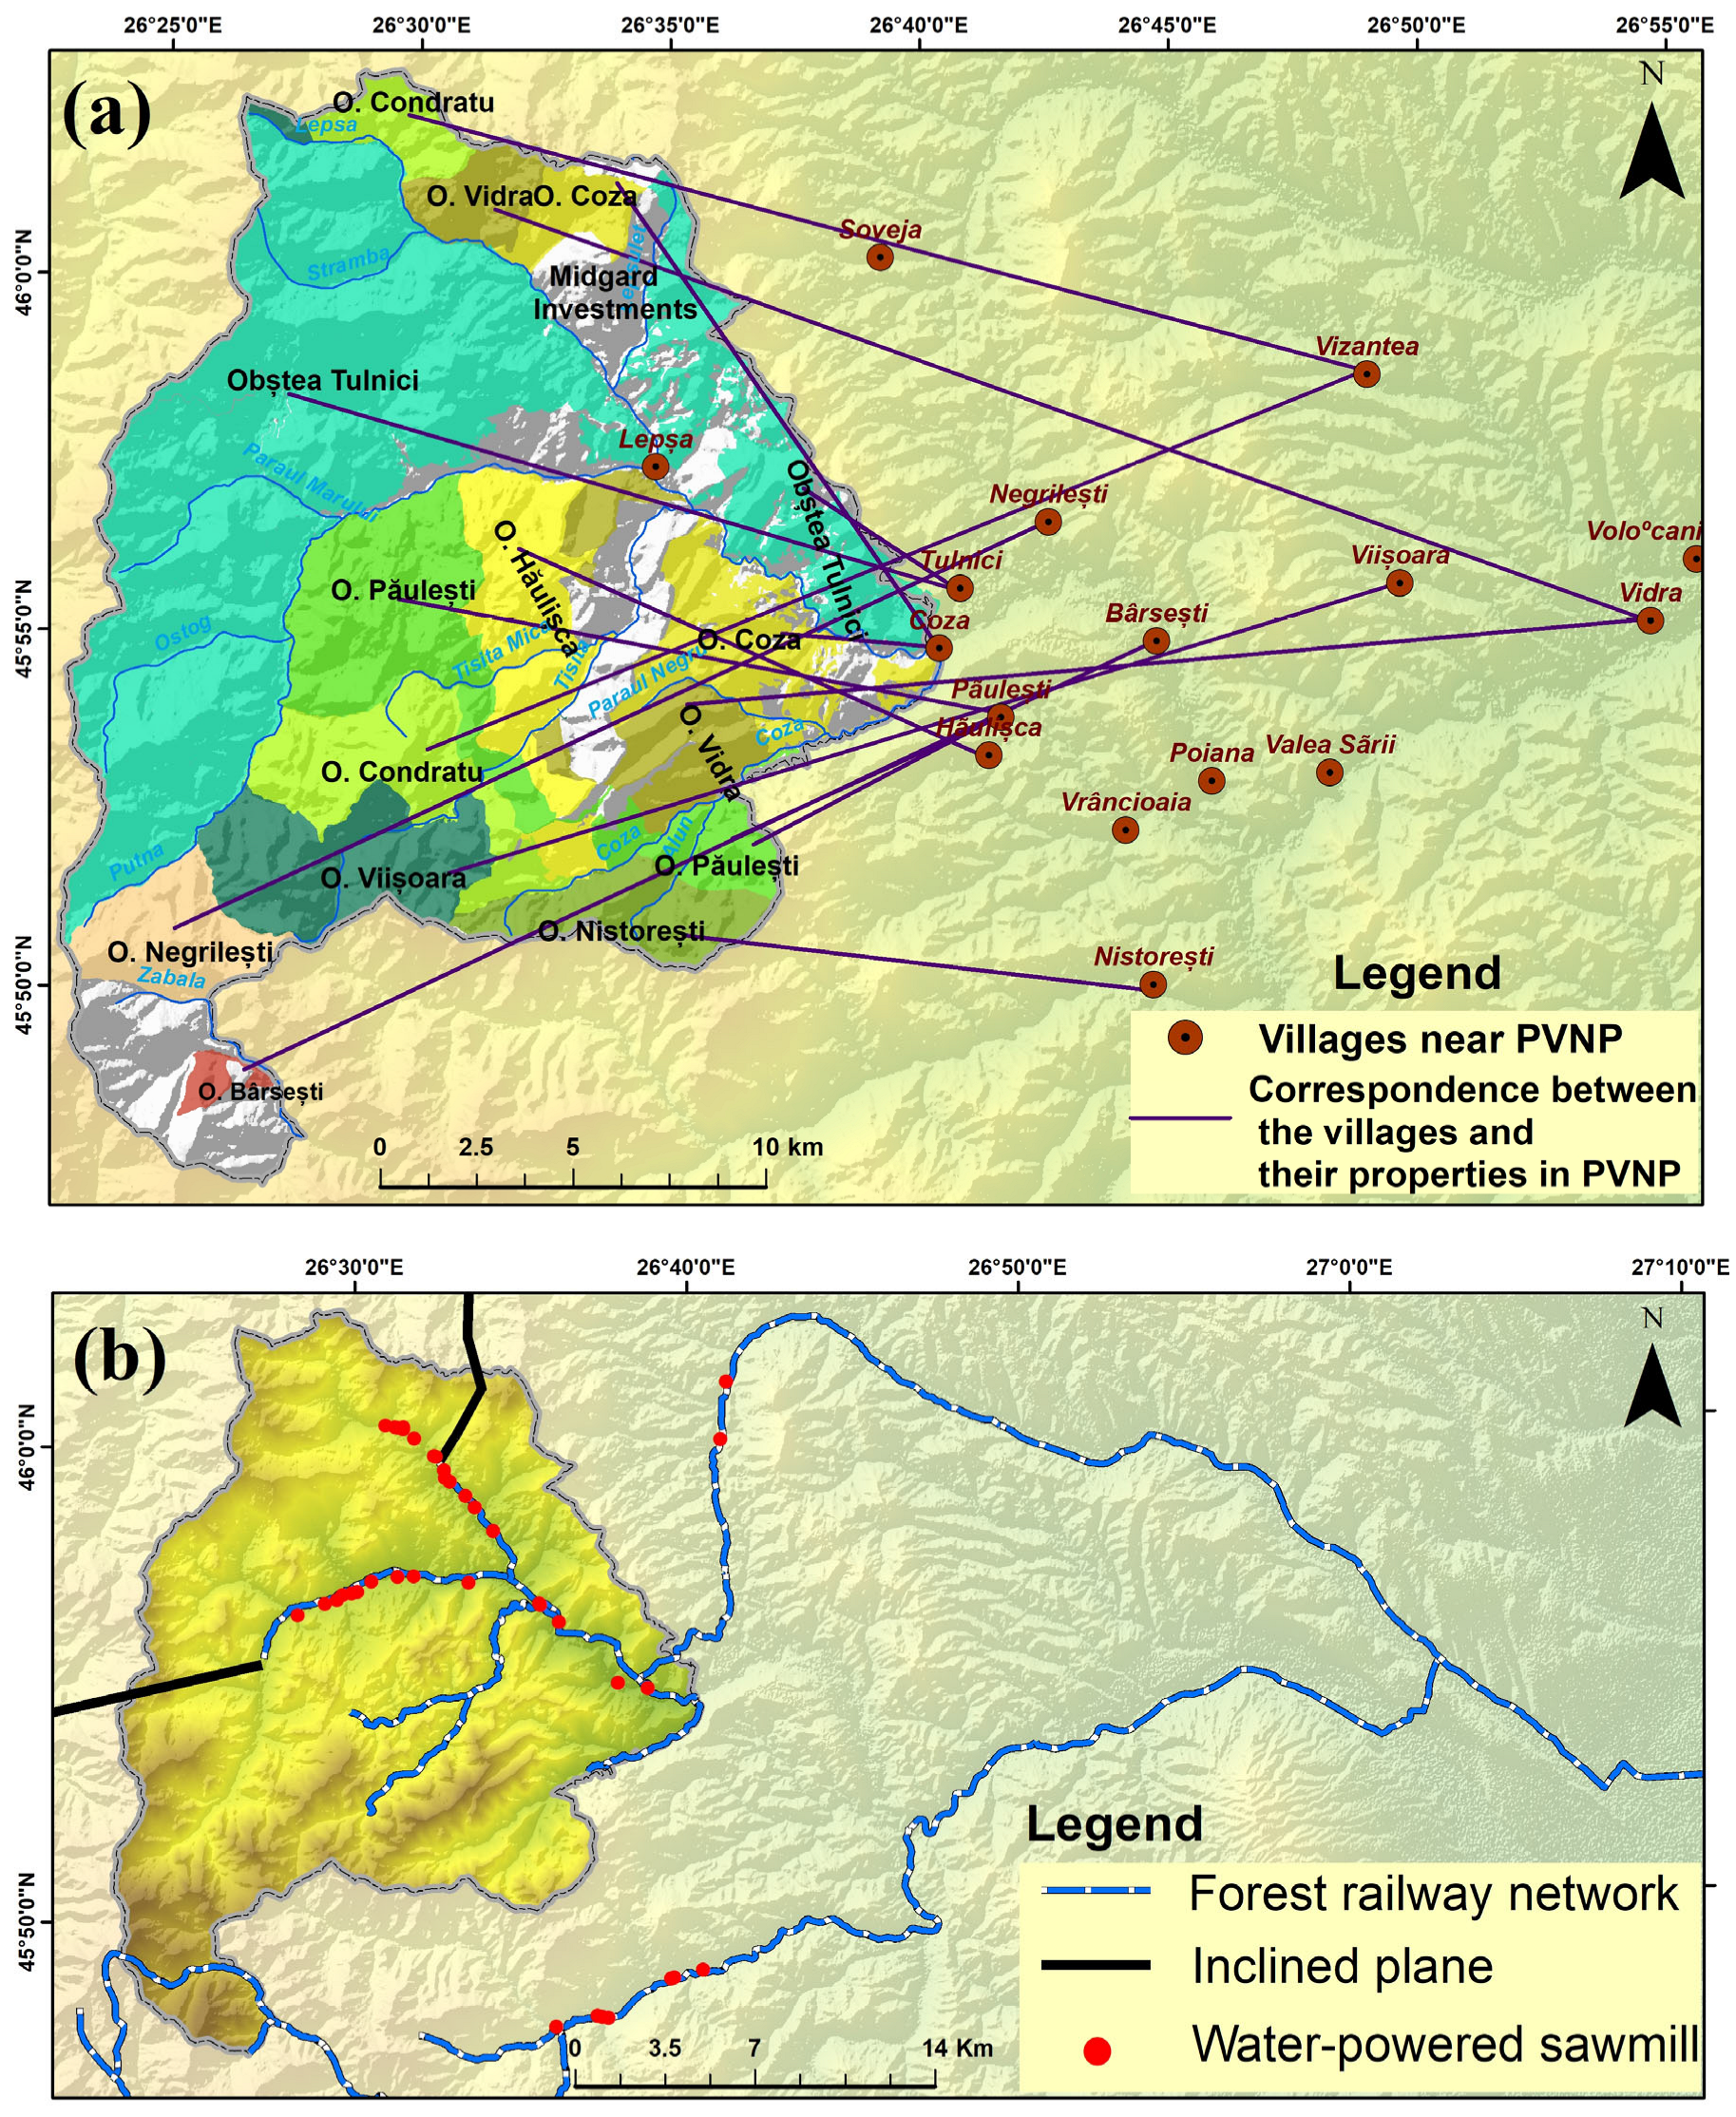
3.1. History of Forest Exploitation

It is impossible to study the evolution of the PVNP’s forests over the last two centuries without considering the social, economic, and cultural characteristics of the Vrancea region.
The PVNP is a well-defined natural area. This creates the conditions for the emergence of a quasi-autonomous political grouping with its own socio-economic organisation. This territory has been characterised as an island of ancient social organisation by many researchers who have studied archaic Vrancea [57,58,59,60]. Its geographical position as a “borderland” at the intersection of the borders of Moldova, Transylvania, and Wallachia in a sub-Carpathian depression that is almost completely isolated from the main transit roads is the main reason for this type of organisation. This created a community of settlements in which the ownership of the land and its resources was common. This was a devilish form of communal ownership, in which the property belonged to all co-owners. The ownership of the mountains, comprising a devalm, which is undivided co-ownership that has been preserved to the present day, did not create differences within the federal obști (communal lands or oblast) until the 18th century. With the growth of the population and the need for better and larger areas for grazing, the mountains were divided into communal lands (obști) (Figure 3). The need for grazing land led to the first appearance of cleared, deforested, dried up, or burned areas, giving rise to the courts, dry lands, and jariști (regrowth after forest fire). From a historical point of view, the period under study (1789–2018) can be divided into several phases:
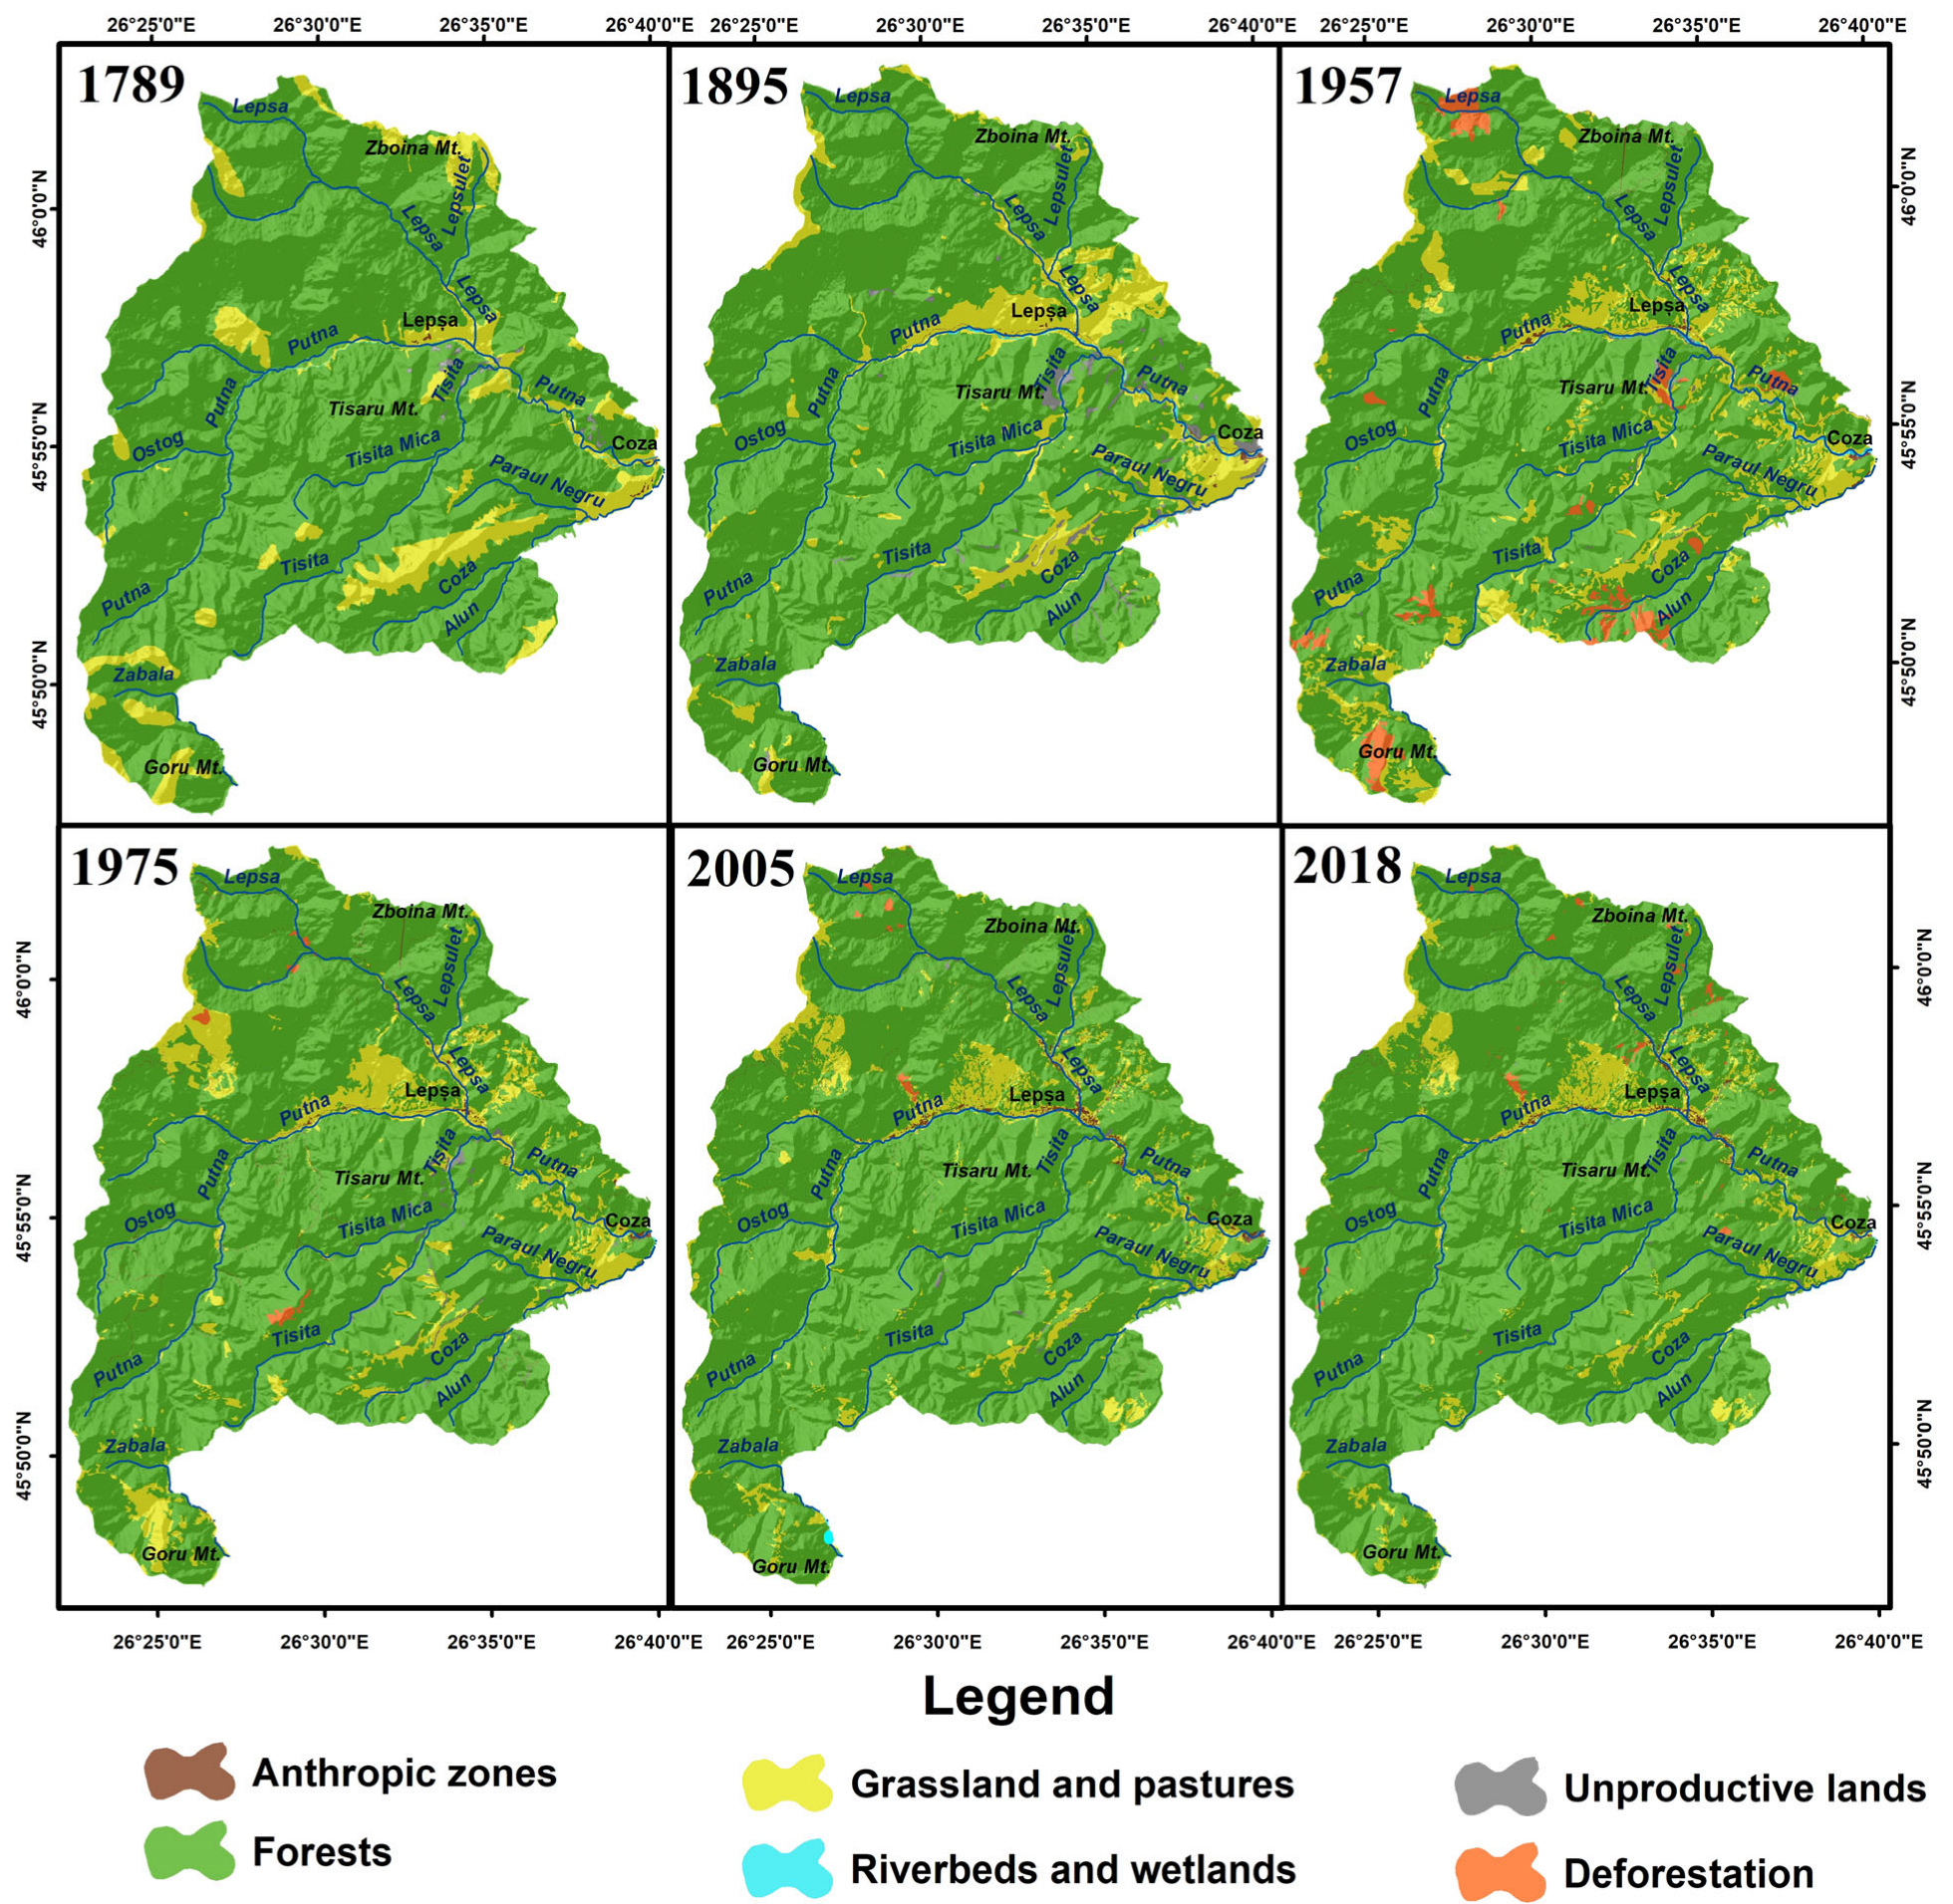
  • From 1789 to 1859, Vrancea was part of the Principality of Moldavia, and the stress on the forests was low because the area was difficult to access, the infrastructure was not developed, and even if there was a demand for timber, transport was not easy. The area covered by forests decreased, and the most extensive areas were those close to the valleys of Putna, Lepșa, and Coza. This is how the villages of Lepșa, Greșu, and Coza have had their origins. Due to the small number of inhabitants and the need to create new pastures, the transformation of the forest landscape was not very significant. The wood was used rationally and strictly for the immediate needs of the population: building and heating houses.
  • For the period of 1859–1914, after the establishment of the modern Romanian state, Vrancea became the central point of the new country; consequently, the pressure on the exploitation of resources increased. The above-mentioned companies created the railway infrastructure necessary for the exploitation and transport of wood such that the area occupied by forests continued to decrease.
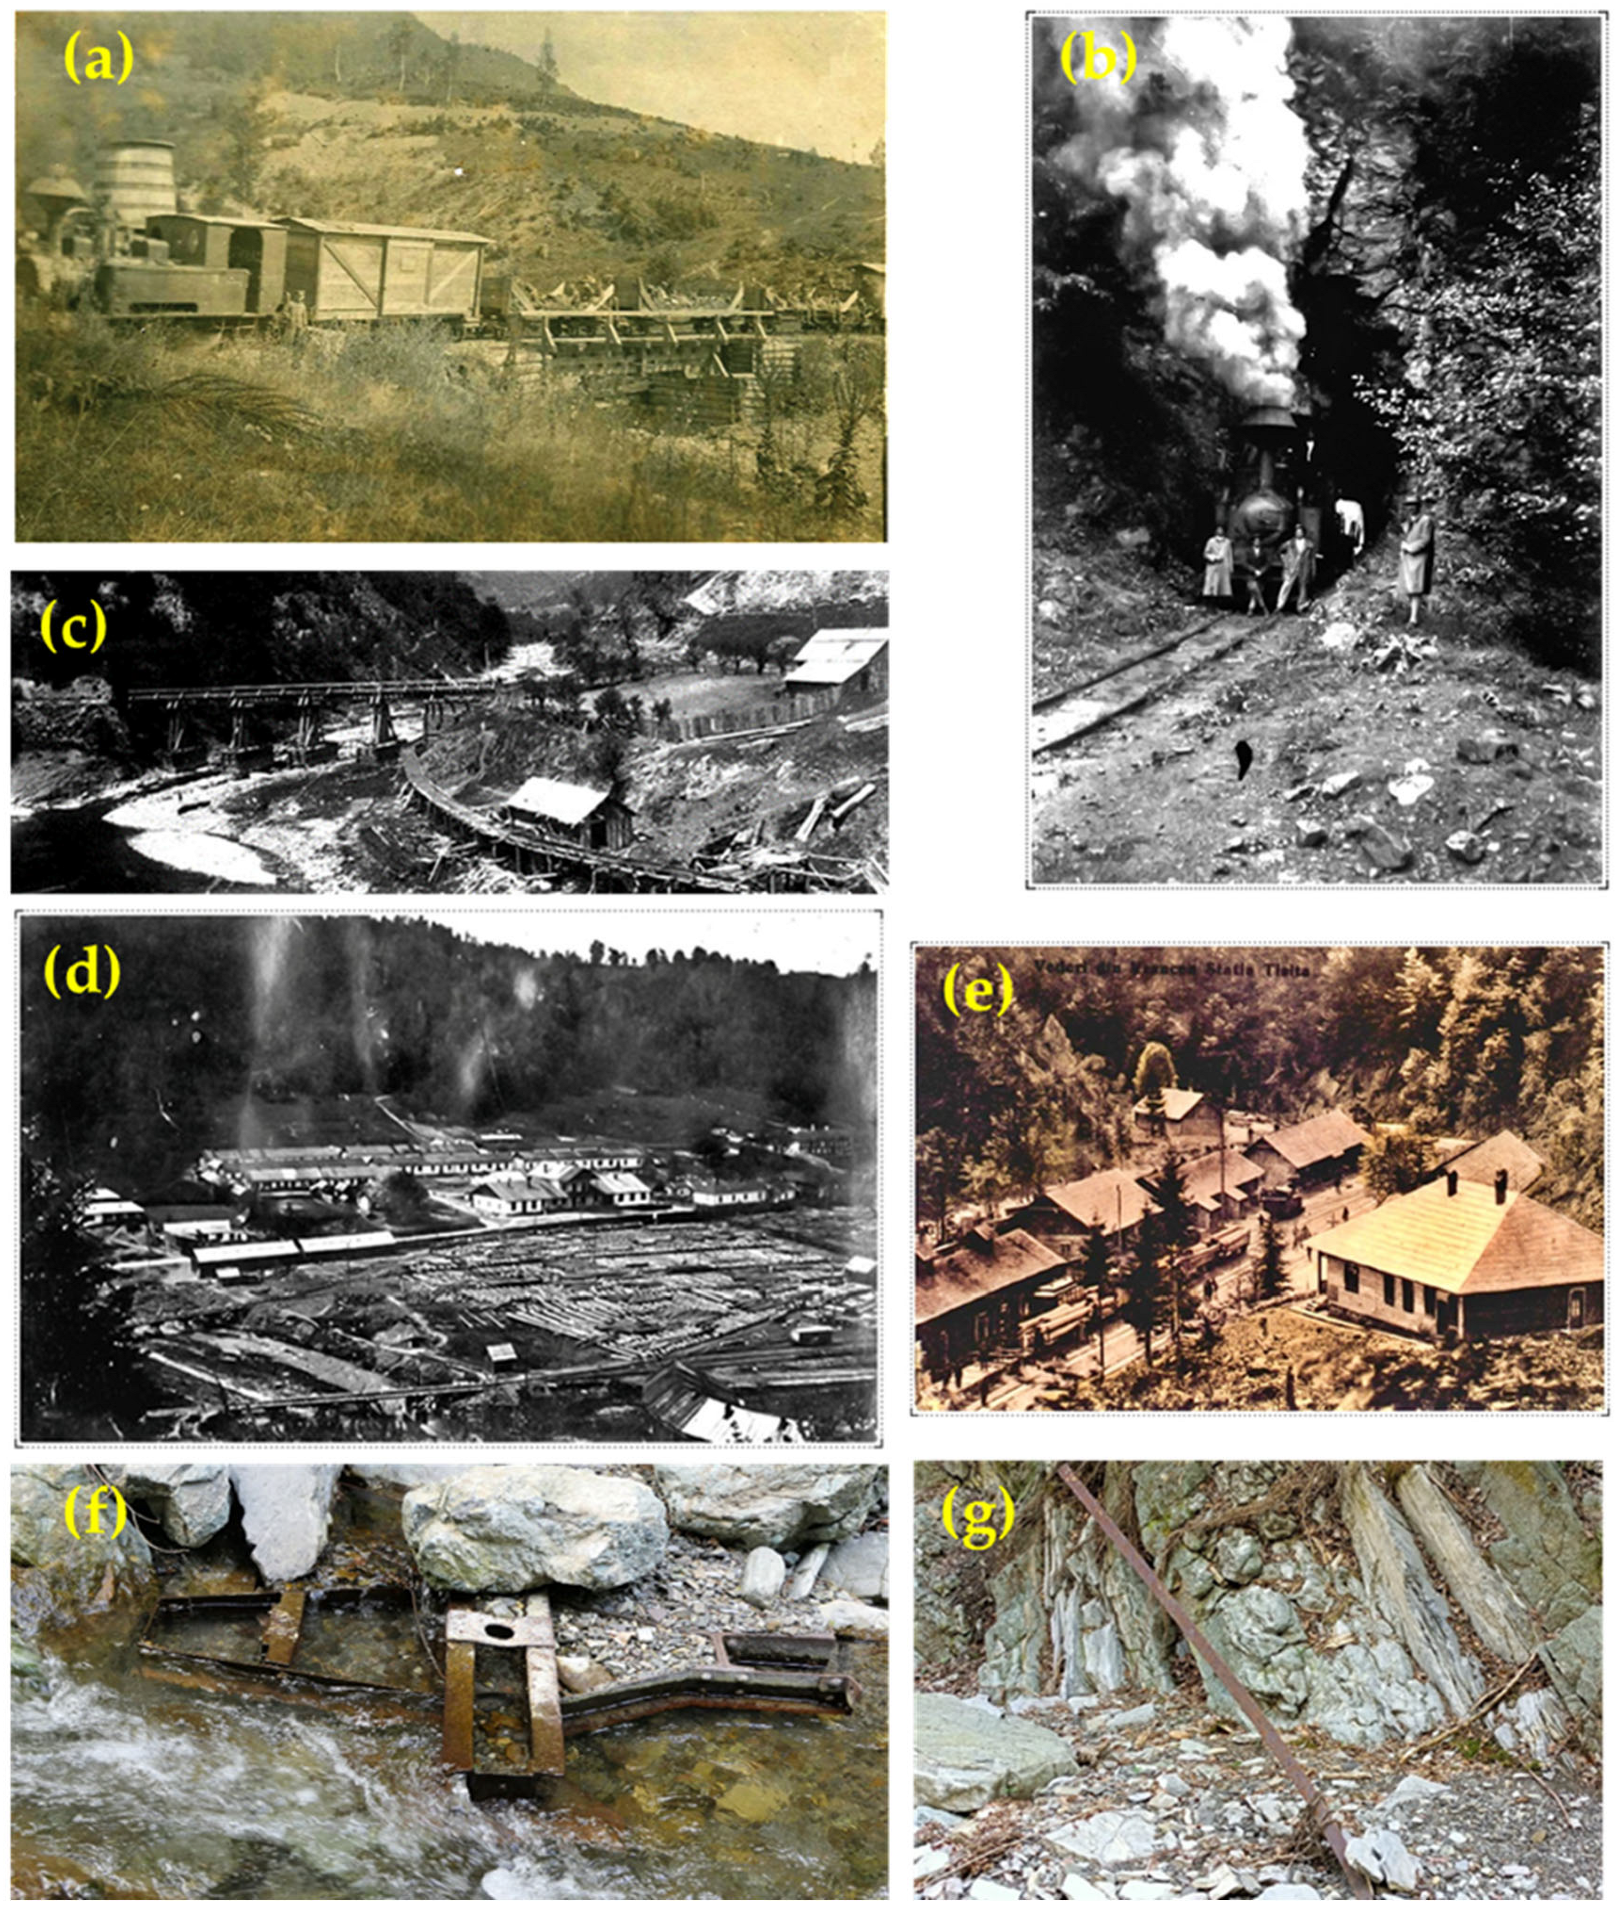
  • For the period of the “world wars” in 1914–1948, logging by foreign companies in the study area intensified (Figure 3), and the area occupied by forests decreased significantly.
  • During the communist (transition) period from 1948 to 1990, forests became state property, and centralized management was introduced; large afforestation campaigns were undertaken and logging continued at a slower rate; forest cover increased.
  • Post-communist (transitional) period 1990–2007: More emphasis was placed on the protection of nature, with the adoption of several normative acts and G.D., which included implicitly protected areas. In 2004, the Putna-Vrancea Natural Park was declared.
  • The period from 2007 to the present: Romania became a member of the European Union, thus implicitly aligning with the policy. A large number of sites of community importance were designated, and the PVNP obtained the status of a site of community importance: ROSCI0208. The number of interventions in the area was greatly reduced, and forest areas increased.
In the absence of detailed cartography for these historical periods, the focus was on the periods for which such data were available.
Figure 3. (a)—actual properties of the communities (Obști) in the PVNP; (b)—forest railway network and sawmill from PVNP and the adjacent area between 1903 and 1929.
Land 12 01774 g003

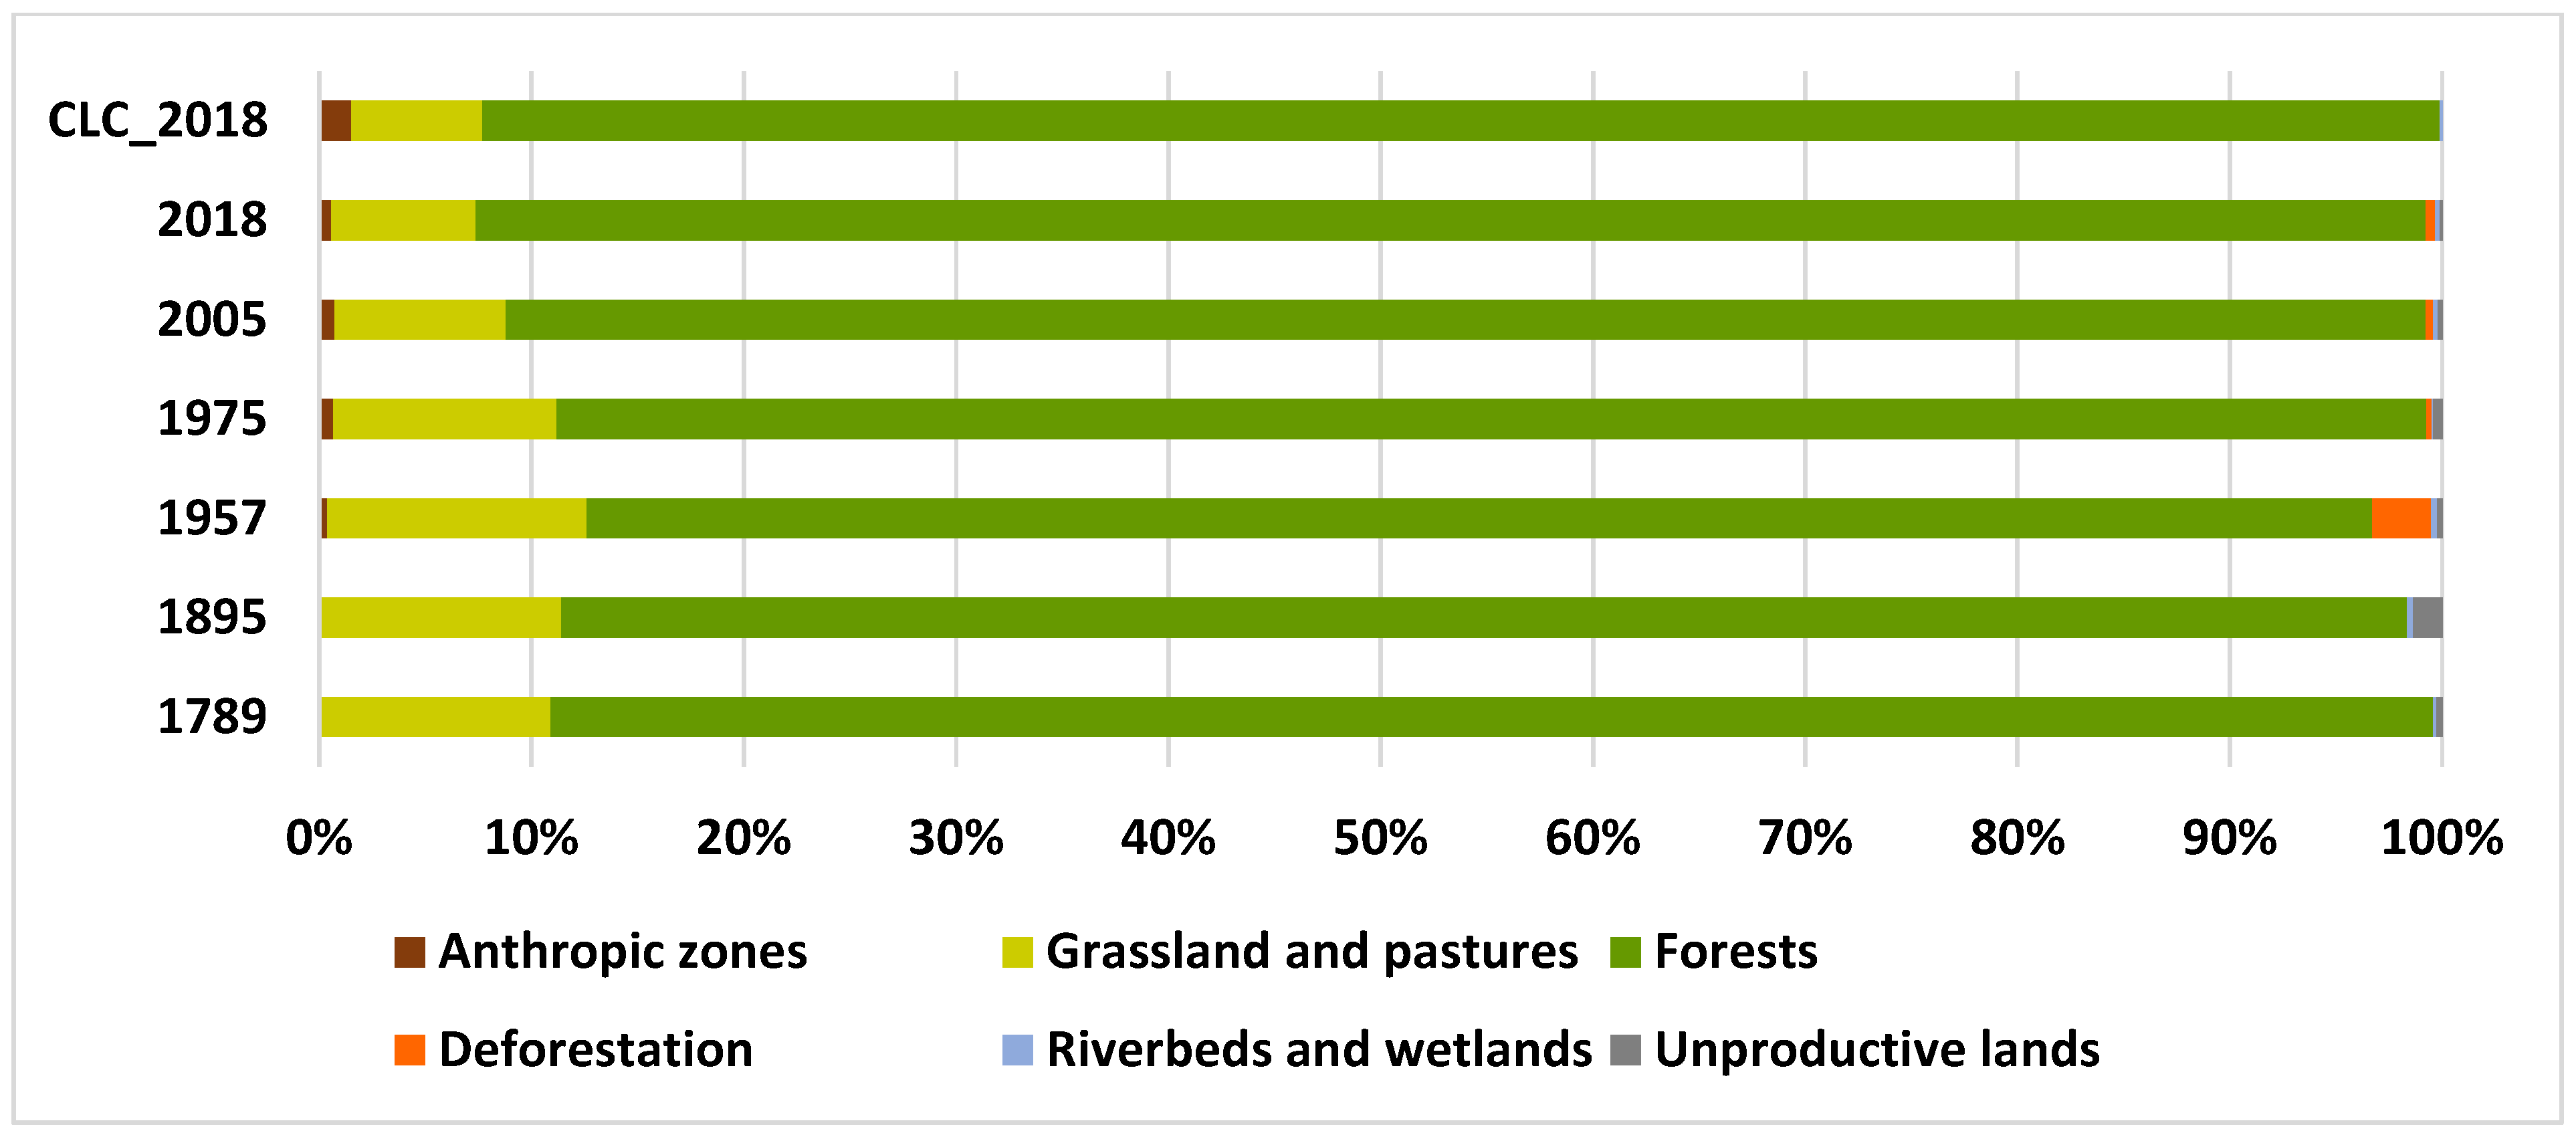
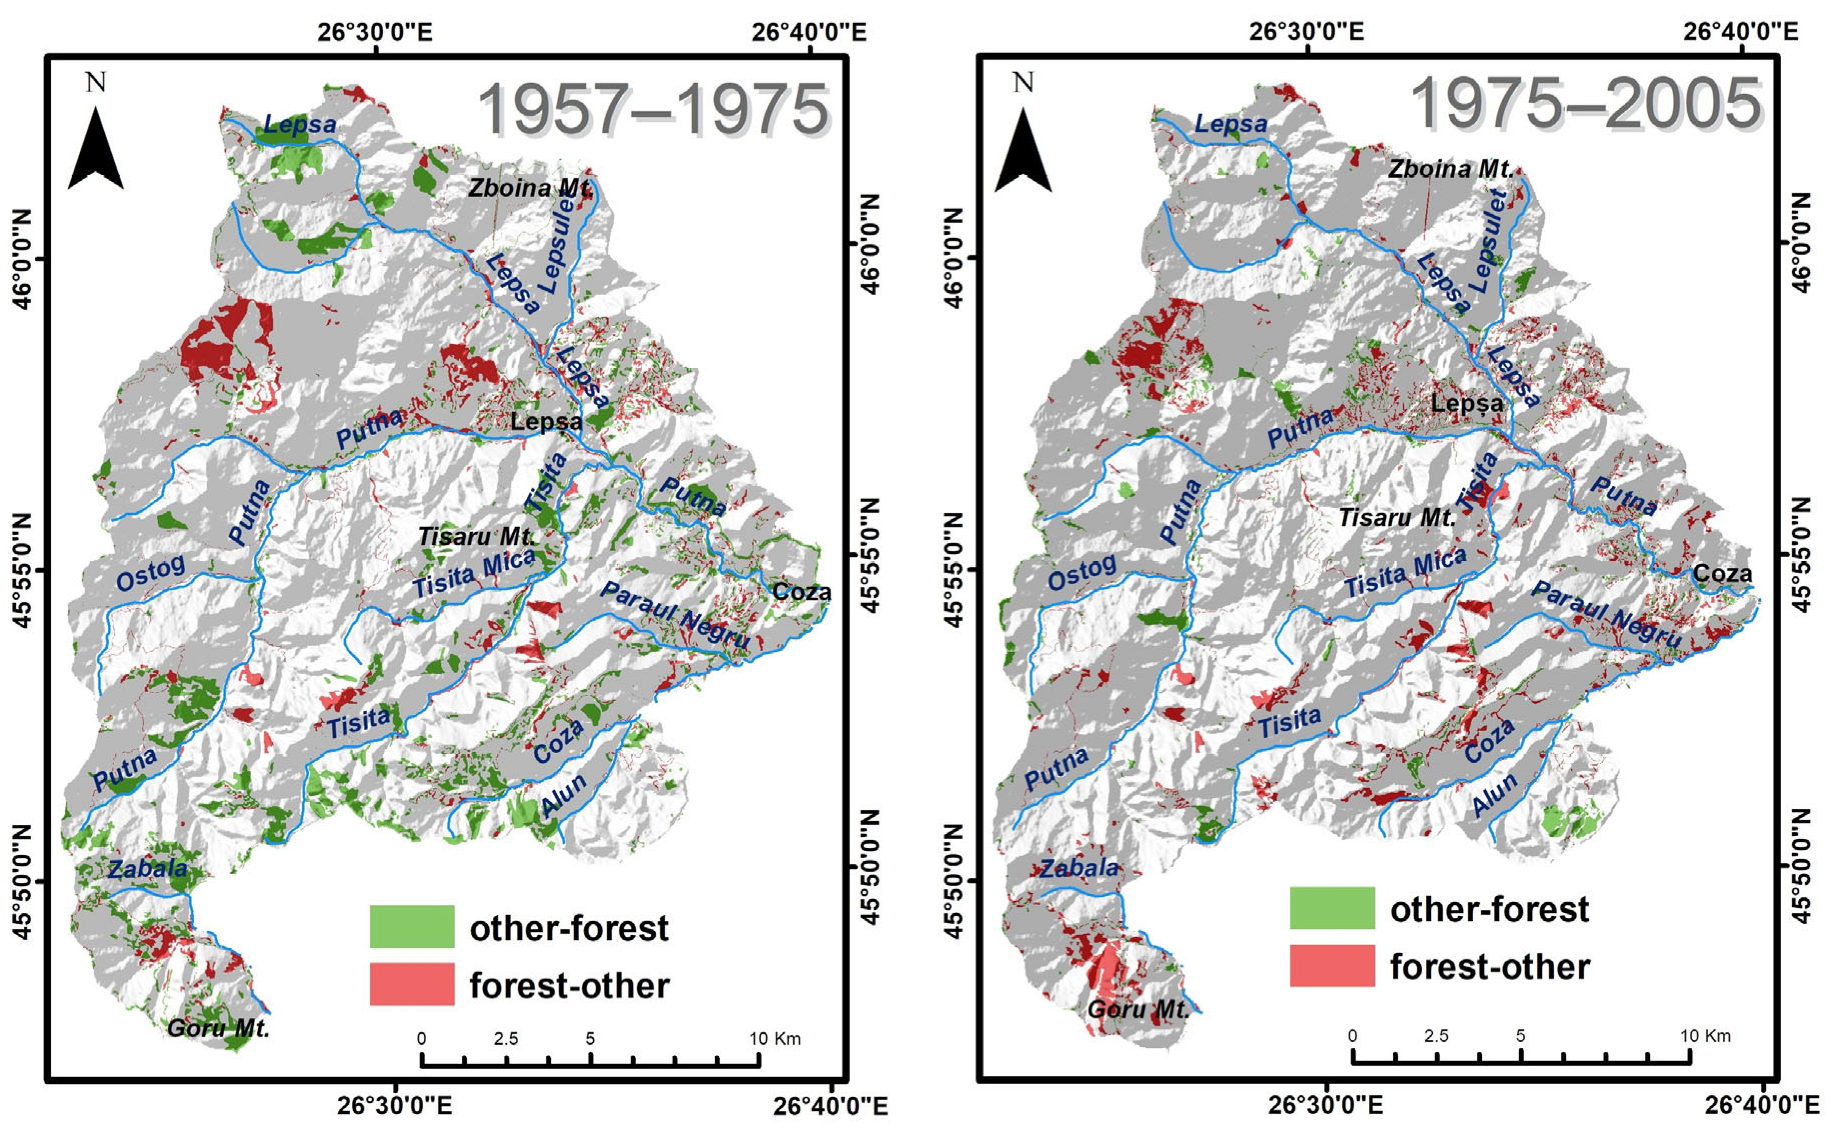
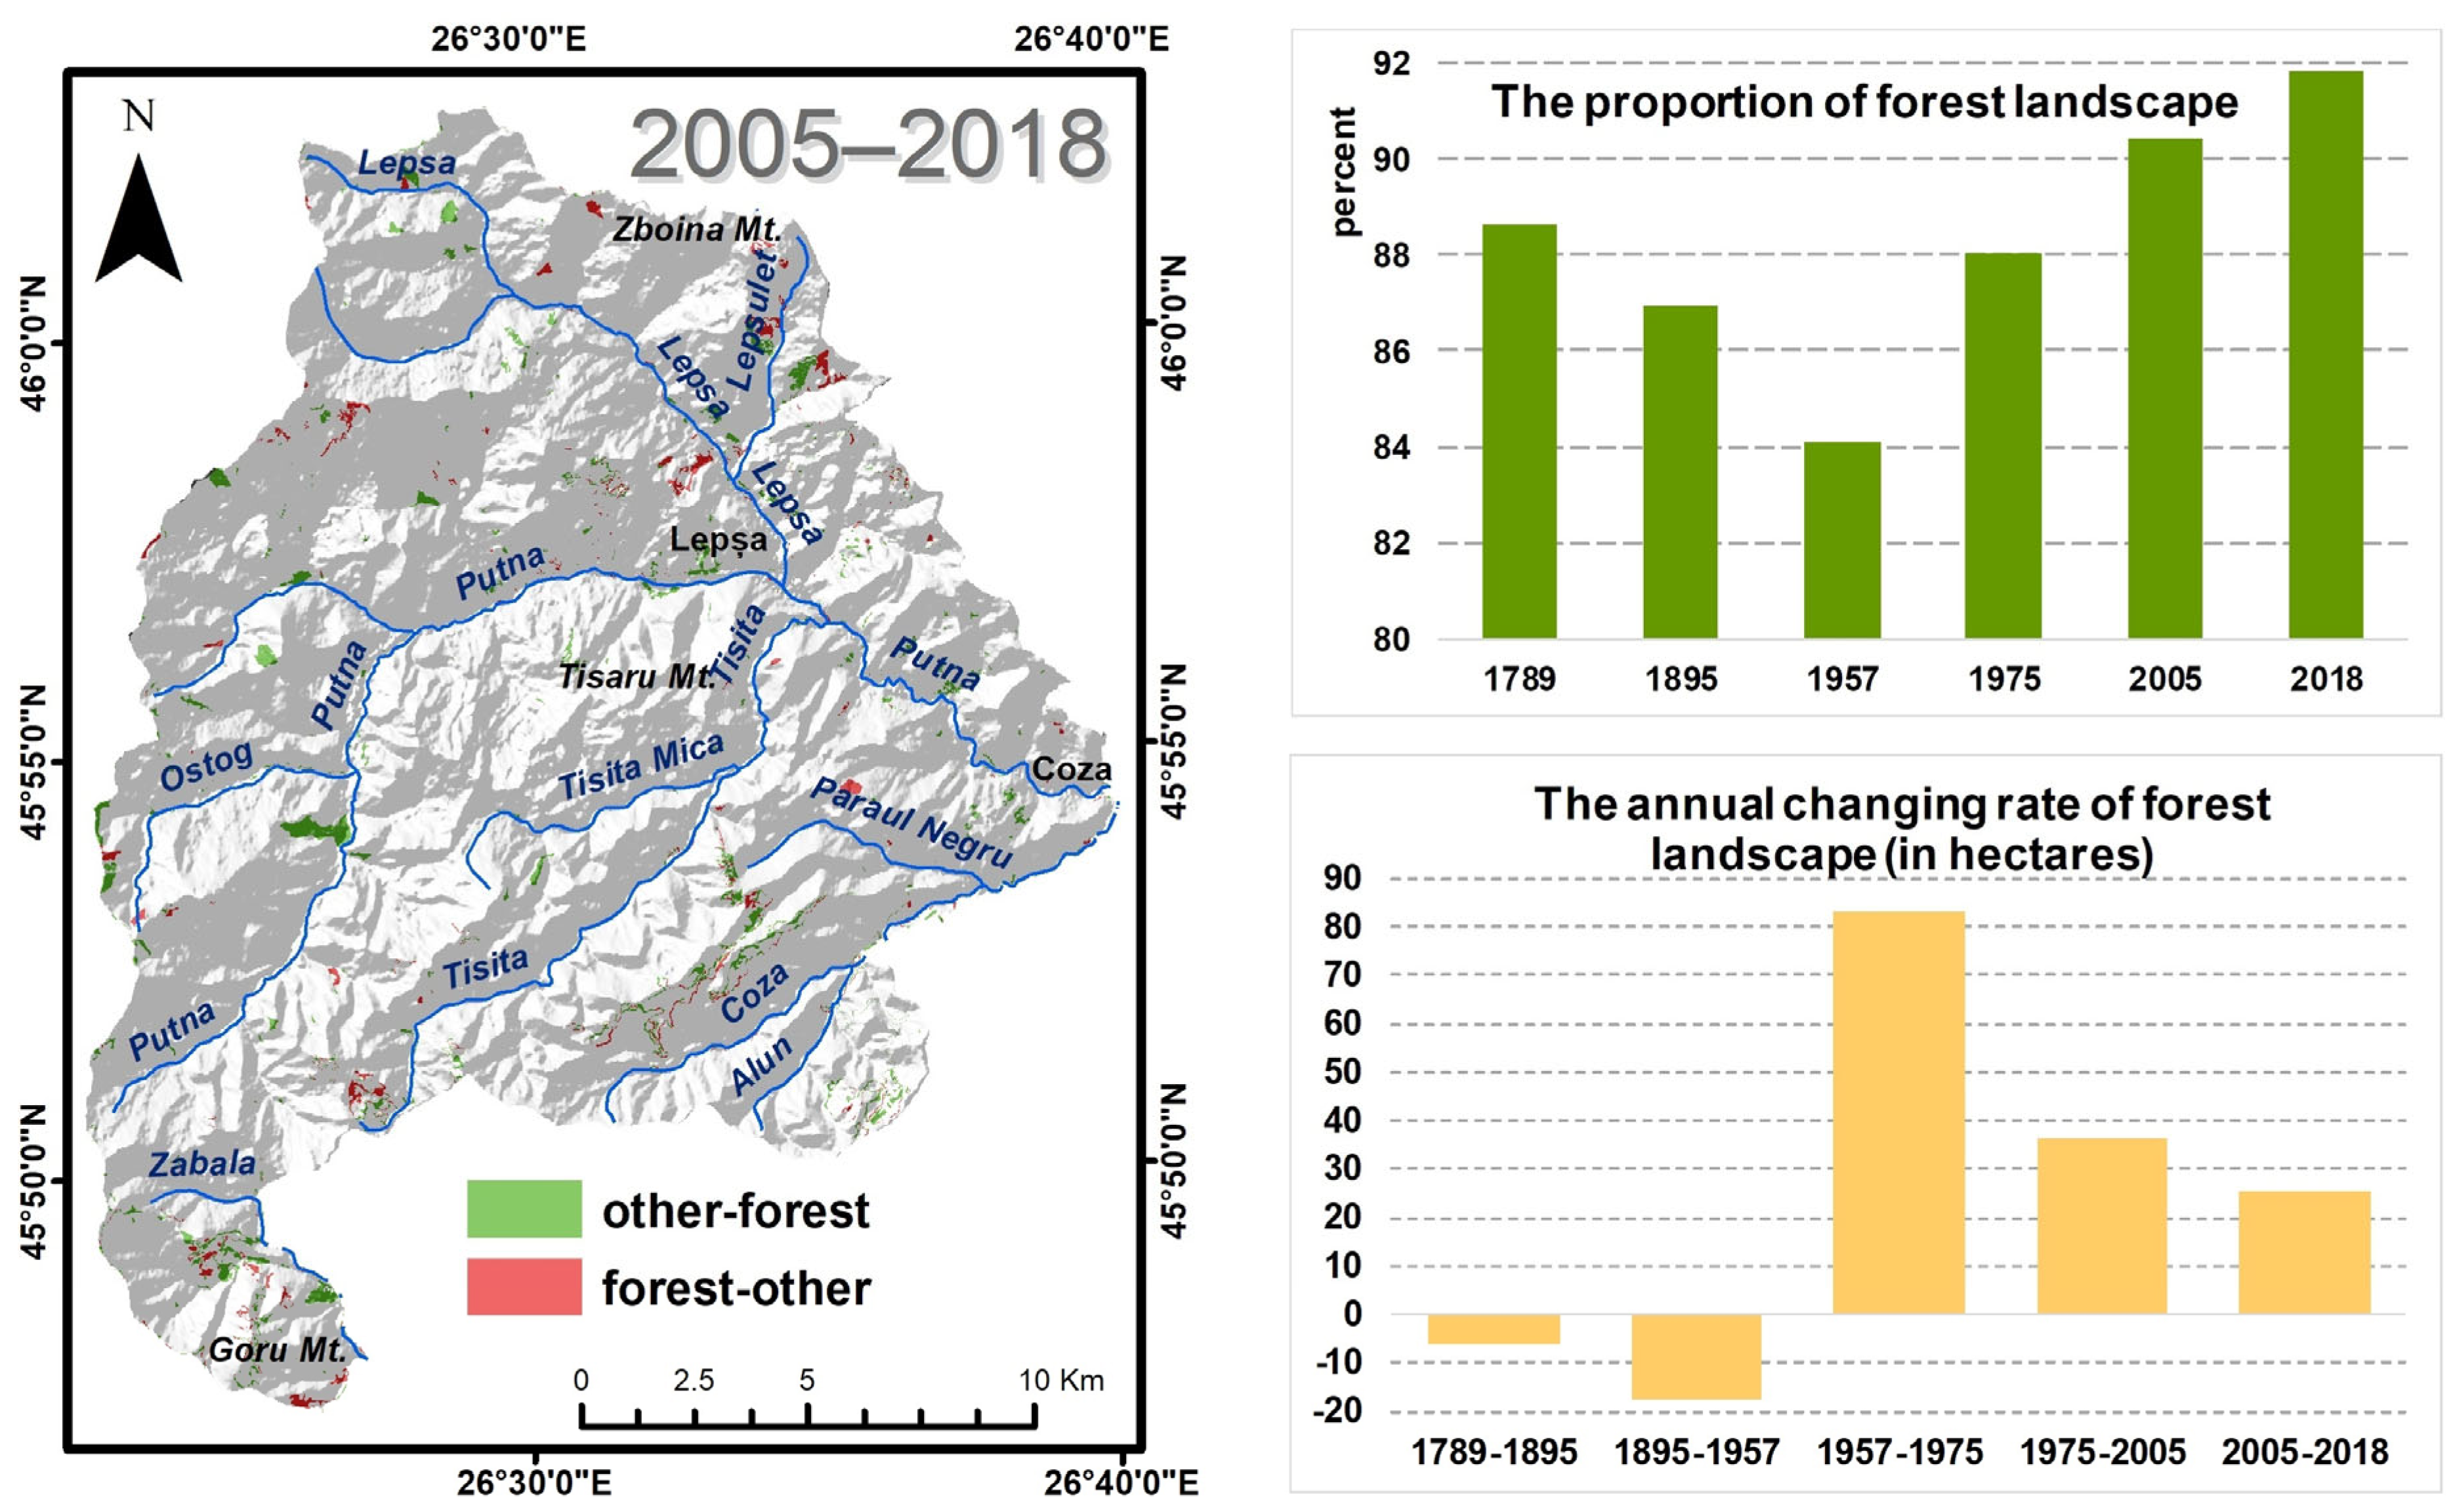
3.2. Overall Chang Process and Characteristics in Time

For the first time interval studied, it can be observed that the largest part of the PVNP, about 33,848 ha (88.6%), was covered by forests. Accounting for 10.9% of the park area, forest areas were followed by grassland. The southern slopes of the Coza massif, the Cârnituri Hill, and the Zmeuriș Hill have the largest area of mountain pastures. The upper basin of the Zăbala River and the slopes on the left of the Mărului stream valley were also most likely used as pastures. In the northern part of the park, the largest area of grassland is located in the area of Zboina Mountain. Around Coza, Lepșa, and Greșu, as well as along the Putnei valley, there are large areas of grassland.
The situation at the end of the 19th century, recorded by the cartographic materials used, first shows a much higher level of detail than in the previous analysed period, reflecting the technological advance during this century in terms of the accuracy with which the land was mapped (Figure 4). Forests still occupy most of the area (87% of total), followed by grasslands (about 11%). The largest area of grassland is in the vicinity of the three PVNP localities. Compared to the situation on the Habsburg map, this is an increase that can be attributed to population growth and the greater need for pastures near settlements. The mountain pastures in the higher part of the park have maintained their position, but their surface area is smaller, and they are more fragmented. The Soviet map of 1957 shows approximately the same areas occupied by landscapes other than forests (with an even greater degree of detail than in the previous period) such that the percentage of forests covered by the total area of the PVNP is 84%, that of grasslands is 12.2%, and that of deforested areas is 2.8% (about 1051 ha). More detailed mapping has made it possible to identify small forest areas within the large grasslands near settlements. The 1975 military topographic map, created 18 years after the Soviet map, shows some changes, especially in the areas classified as deforested. Firstly, the deforested area of the Goru Massif is shown as grassland. In fact, most of these areas are now classified as forests. Trees have also started to grow on some of the scrubland, meaning that 88% of the PNPV’s total area is forested. Analyses of the latest source for the main land-use categories show a decrease in the area occupied by grassland, which has been replaced by forest vegetation. Therefore, for the most recent situation, forests cover 87.3%, and grasslands cover 8.65% of the area of the PNPV. Deforested areas range from 5 to 20 ha, and they are mostly located on the left side of the Putna basin. Figure 5 shows the differences between the data resulting from the 2018 CLC and 2018 Ortho processing. There are different values between the following land-use classes: anthropic at 0.55% vs. 1.55%; grassland at 6.80 vs. 6.19; forest at 91.8 vs. 92.2%. The other classes have no values in the CLC. These results are an indication that the CLC results are coarse and do not capture the evolutionary processes that develop over time. For areas with similar characteristics, to ensure the accuracy of the land use analysis, the CLCs need to be adjusted using other data sources (remote sensing, UAV, field surveys, etc.).

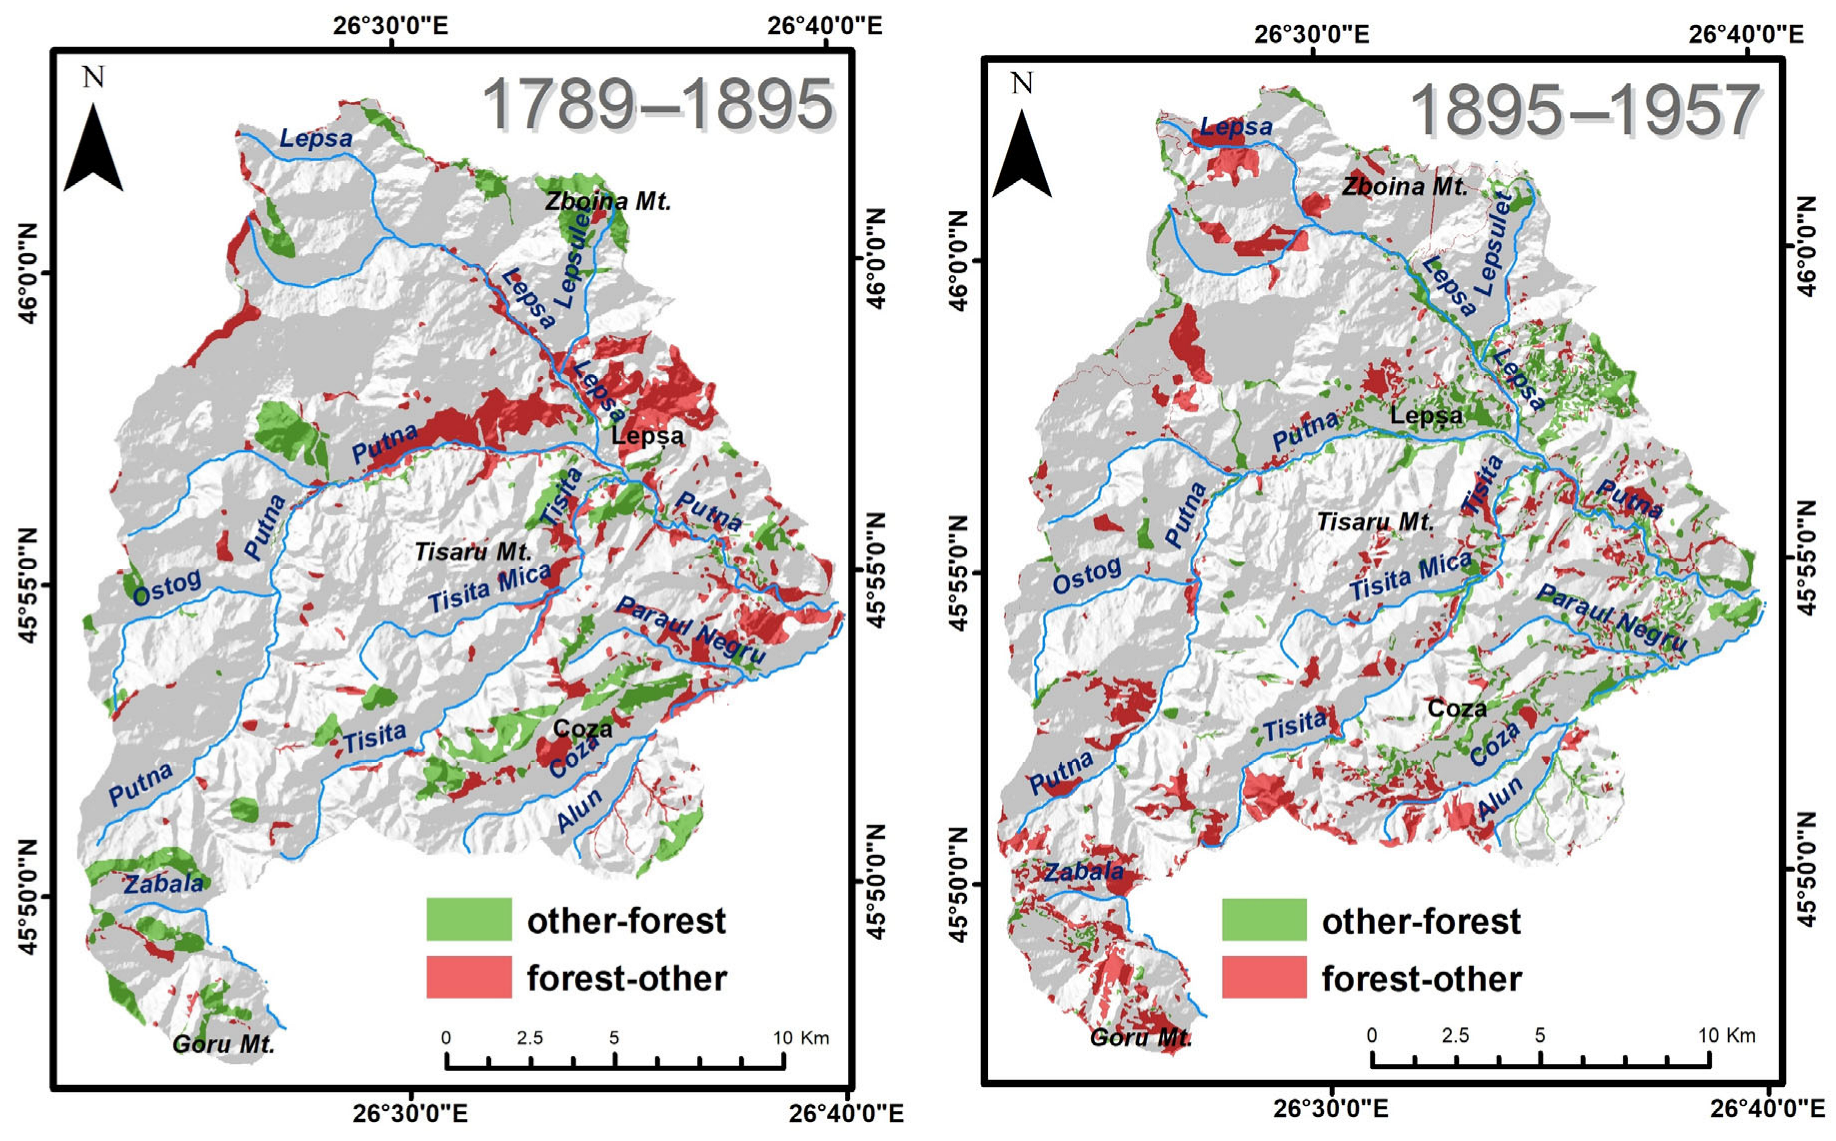
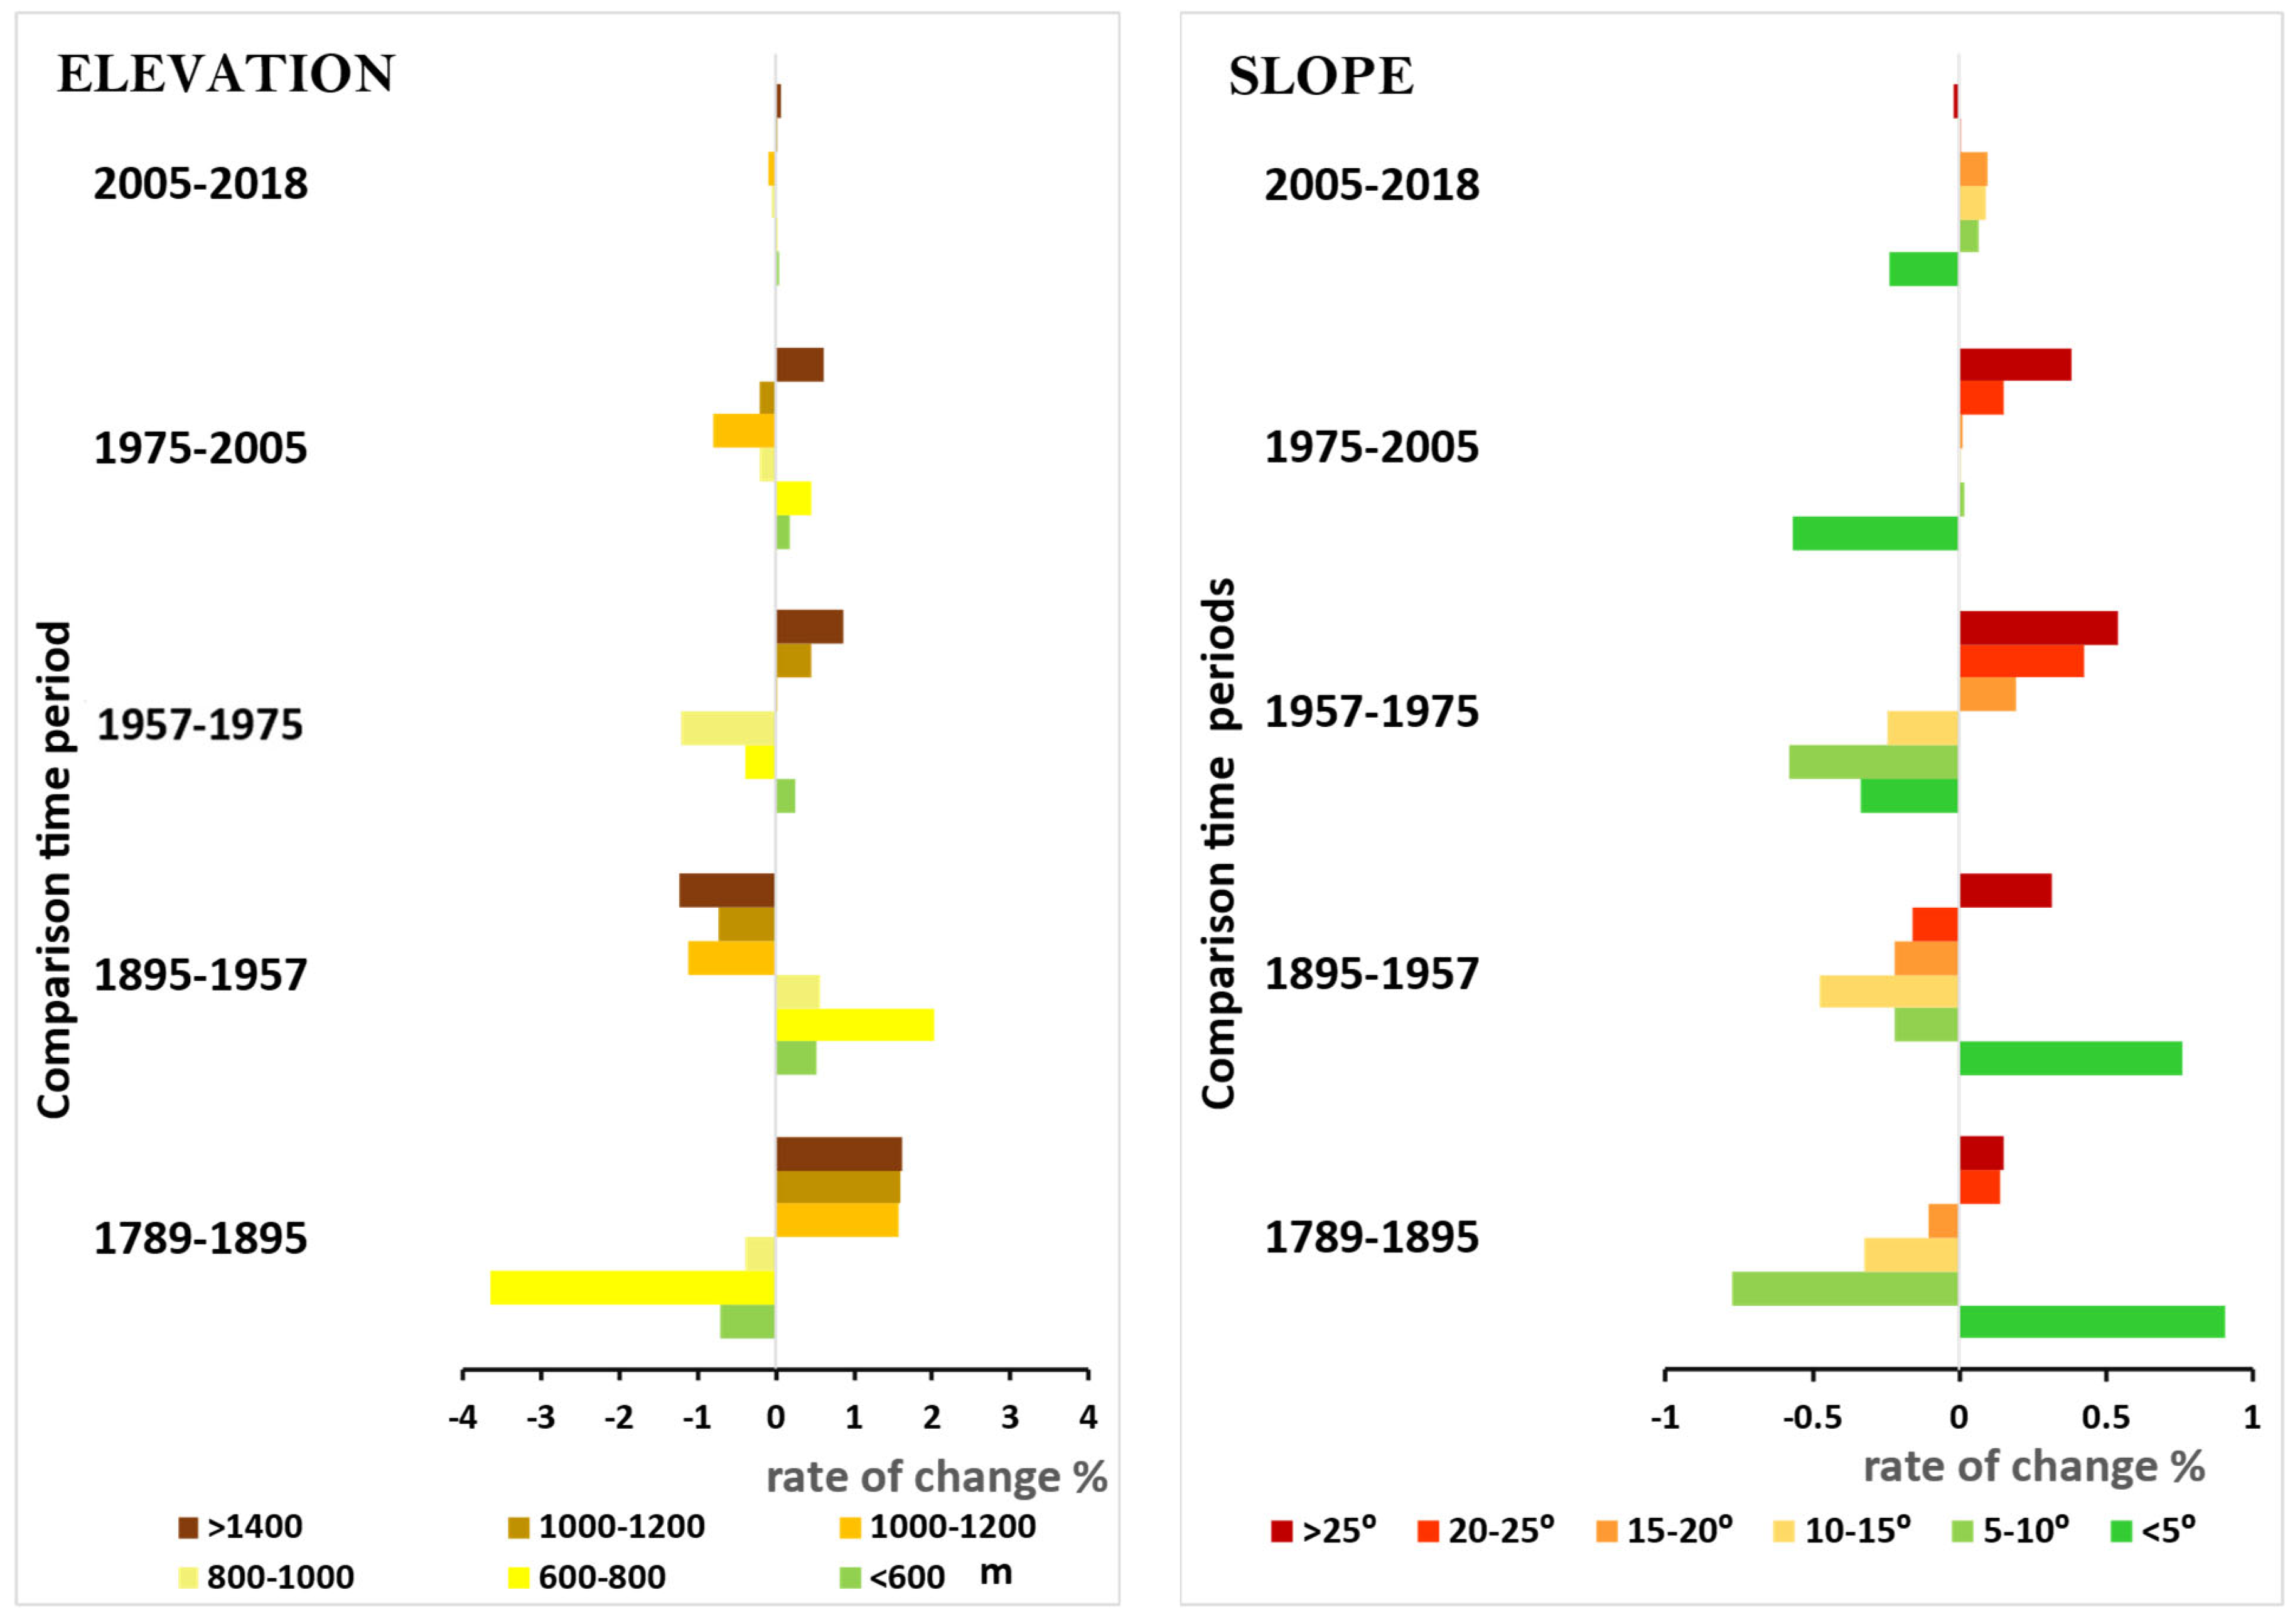
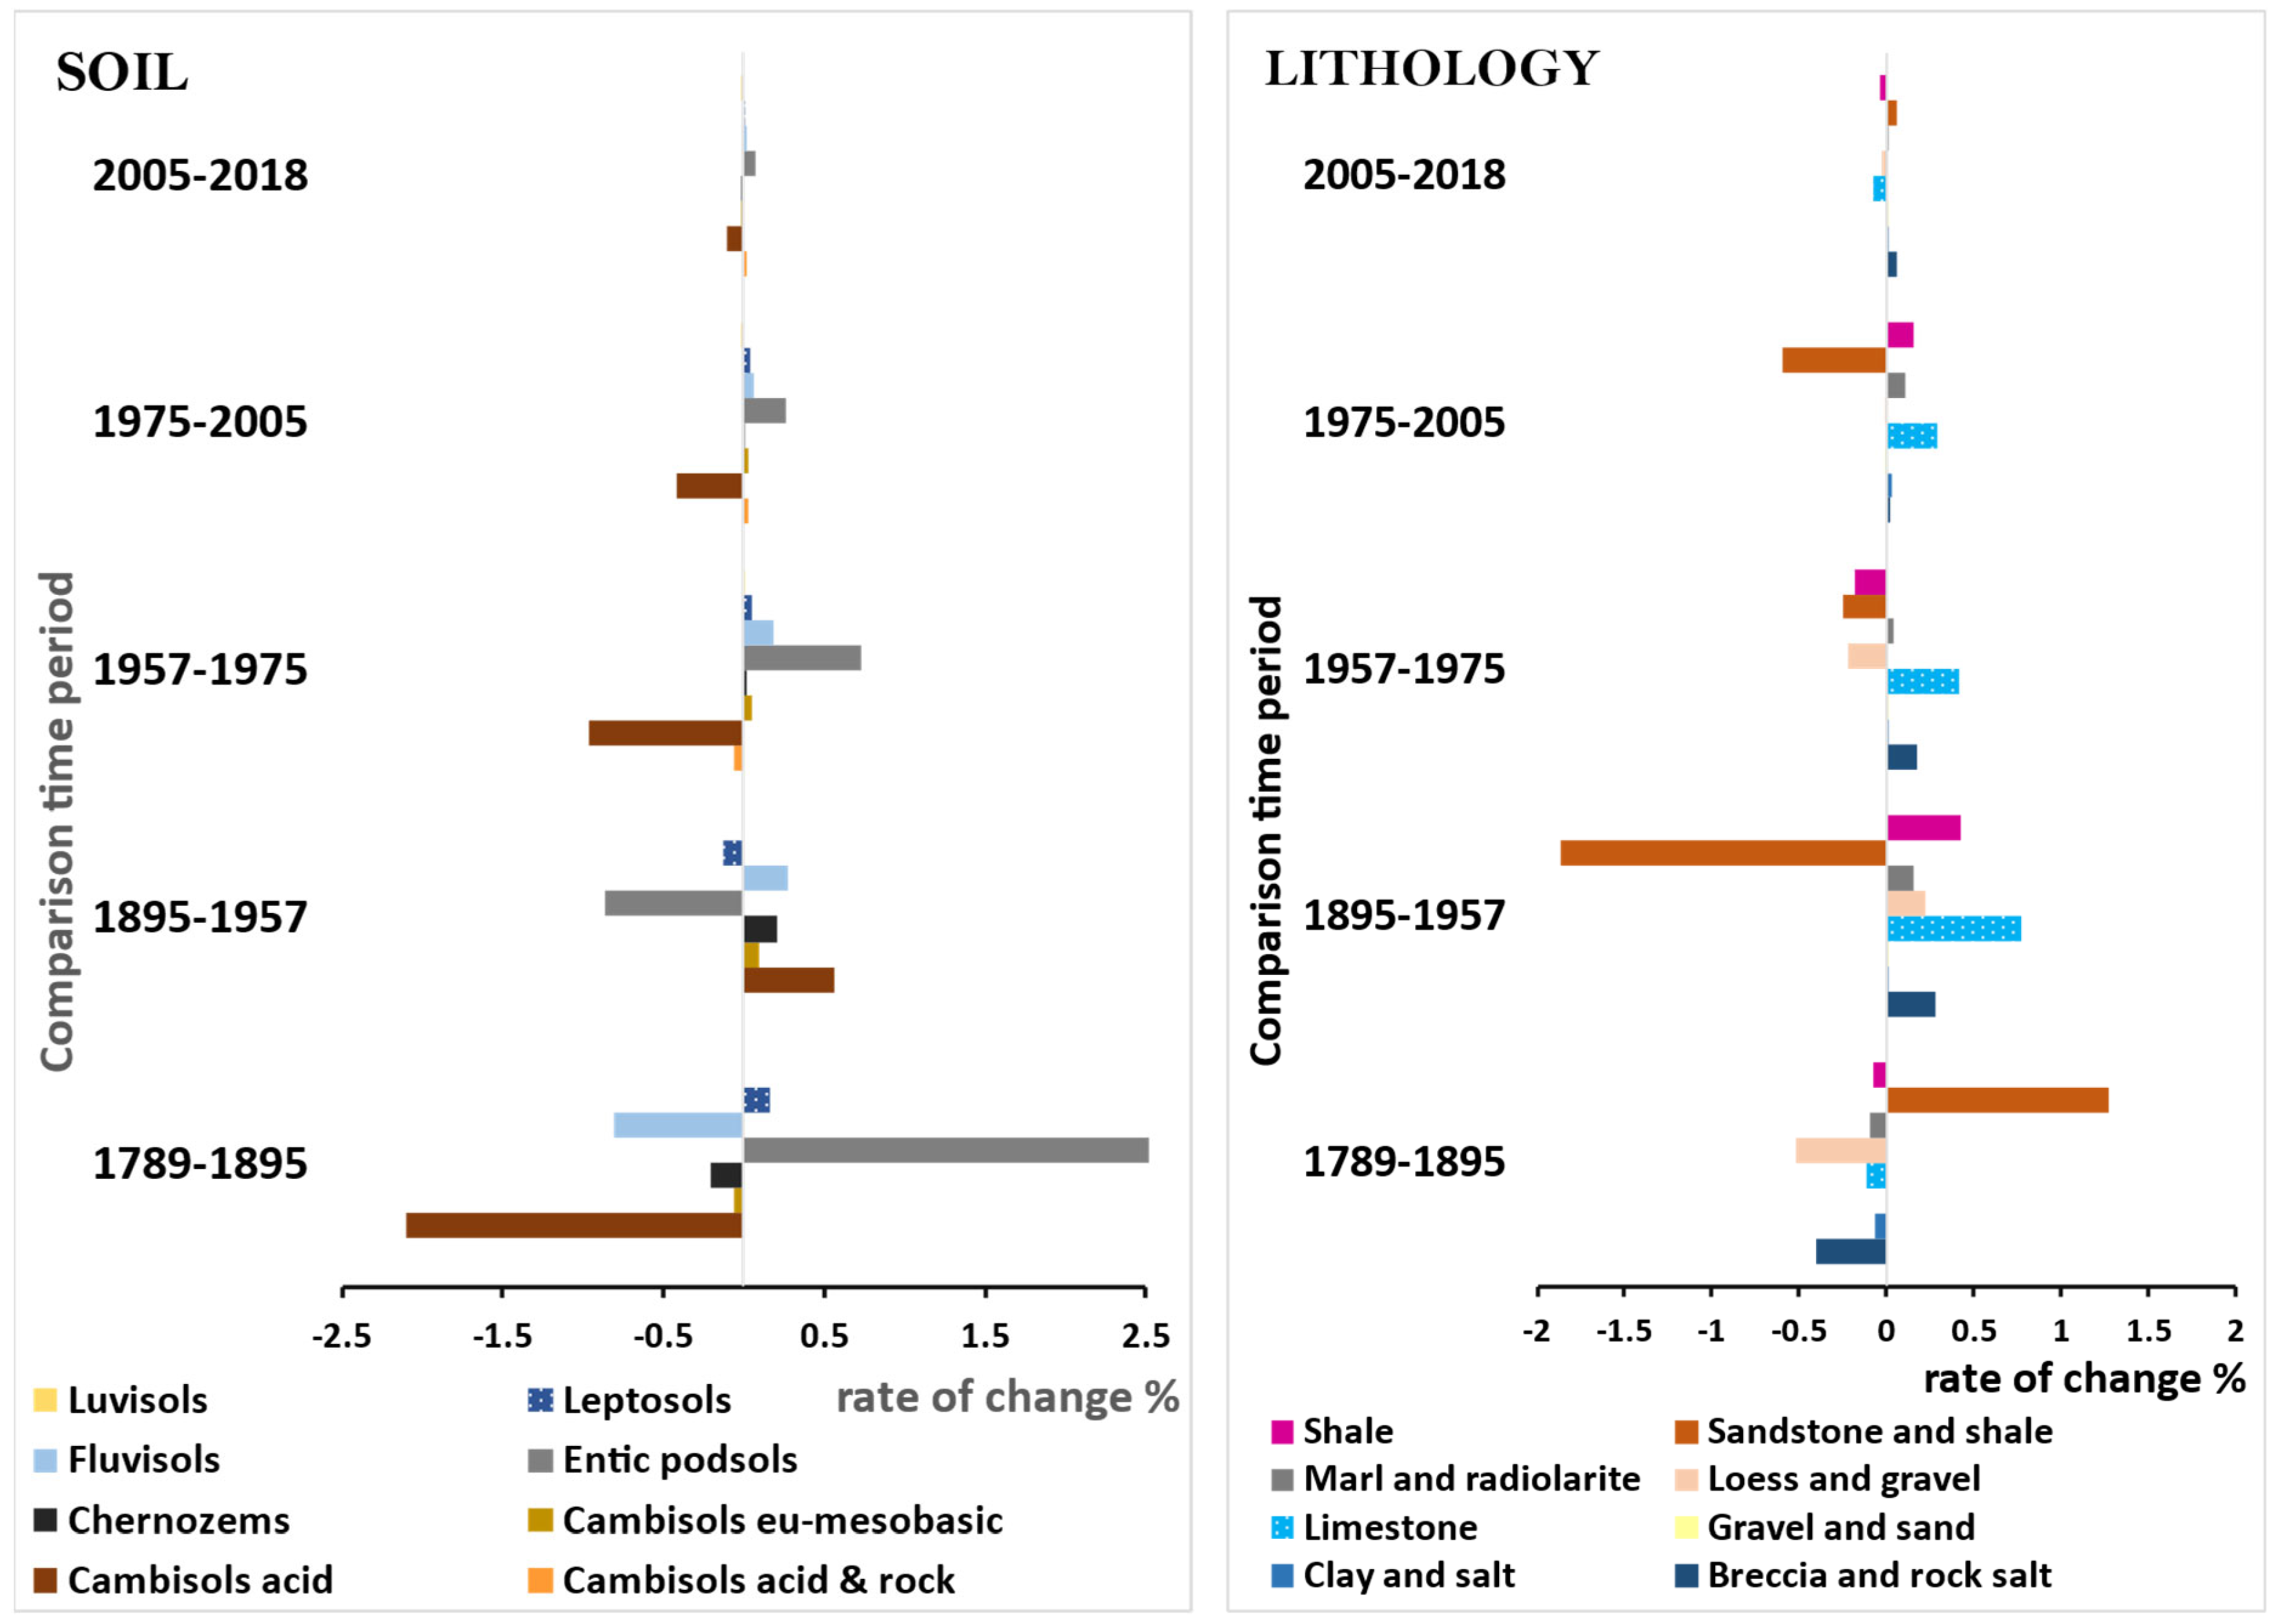
3.3. Changes in Forest Cover under Anthropic Factors

The changes in land use in the PVNPs observed during the study period have several characteristics. For example, between 1789 and 1895, the forest area decreased by 650 ha mainly due to the increase in unproductive land and pastures. In fact, during this period, the secondary settlements of Lepșa and Greșu appeared as Odăi settlements, and the main activity of the inhabitants of this area was animal husbandry (Figure 6). Odăi settlements are domestic settlements with rudimentary or more elaborate buildings that are used for storing hay and sheltering animals (especially in winter).
These settlements have evolved as an effective solution for the management of fodder and livestock in the context where grasslands are located at a considerable distance from the household. Residents deforested the land to provide winter fodder for their growing herds as they needed hayfields and pasture for their animals. It was also during this period that some of the areas surrounding the settlements of Coza and Tulnici were deforested as a result of the emergence of capitalist trade relations. It is important to note that some of the changes are due to the different methods of cartography. In the 18th century, especially after several wars in the area, there was much less interest in the details of the settled areas than in the 19th century. After 1904, following the changes in forestry regulations, large logging companies began to appear in the region, replacing small local entrepreneurs and changing the landscape considerably. As they arrived, networks of narrow-gauge railways were built to transport timber from the mountains. The species composition also changed, favouring those with commercial value.
Between 1895 and 1957, the changes were much more pronounced. The decrease in forest of around 1100 ha can most probably be explained by the increase in deforested areas of the same size and the increase in the areas of pasture and highly cultivated land. This situation is mainly due to the intensive forest exploitation that took place between 1903 and 1929, and secondarily, population growth and the need for more pasture resulted in this situation. At the end of the 19th century and the beginning of the 20th century, Vrancea’s transition to modernity and a supply-and-demand economy occurred. The villages of Vrancea came into contact with foreign forestry companies during this period. The forestry companies built narrow-gauge railways, creating a veritable network in Vrancea, in order to make the harvesting of wood as efficient as possible. Between 1903 and 1929, several narrow-gauge railways were built and operated on the territory currently occupied by PVNP according to [61,62,63,64,65,66]. Beginning in the valley corridors and extending up the slopes to the highlands, logging was carried out by Austrian companies. Most of the timber was transported to the forest colony near the village of Soveja (Figure 7). From there, it was transported by narrow-gauge railway to Mărășești, where it was further transported by standard-gauge railway to the port of Constanta. Some of the timber was processed in the Putna Valley’s numerous water-operated gantries. In the south of PVPV, there was also a railway belonging to the Năruja Forest Enterprise. The Covasna-Comandău funicular railway transported the harvested timber to the sawmill at Gugești or to Covasna. The decrease in the area classified as "non-productive lands" is due to the beginning of the large-scale reforestation of eroded slopes from 1948 onwards [67], especially in the context of the institutionalized management of the Forest Fund.
Even though this is a short period, the largest changes in forest cover took place between 1957 and 1975. There was an increase in forest area of about 1500 ha, while the area of deforested land and grassland decreased. However, the current composition of forests was influenced by the management of the forests during this period. Between 1948 and 1989, large areas were deforested in order to repay war debts [68] and international loans, followed by extensive spruce plantations both within [69] and outside forest areas. The area of spruce increased, while that of fir and deciduous species decreased (Figure 8).
The period from 1975 to 2005 is a more complex period, and it includes both the communist period and the emergence of the market economy post-1990. In the first period, while the forest was used, there were also extensive afforestation programmes, so the changes were almost neutral. After 1990, forests were retroceded, and there were some large deforestations in the upper Putna, Zabala, Tișița, and Alunului basins.
The last period considered (2005–2018) is the least dynamic, and the number of changes in the forest cover was low as the territory entered the protection regime (Figure 9). In 2004, the Putna-Vrancea Natural Park was established as IUCN Category V, and forest management was carried out according to other regulations aimed at preserving the existing natural habitat. This is demonstrated by the fact that there are no large areas of deforestation, and only small, widely spaced patches exist. Several European projects for the protection of predators have been carried out within the park: "Conservation in situ of large carnivores in Vrancea County” LIFE02/NAT/RO/8576; “Improvement of the protection system of large carnivores in Vrancea County” LIFE05NAT/RO/000170; “Prevention of the extinction of the Dinaric-SE Alpine lynx population through reinforcement and long-term conservation” LIFE16 NAT/SI/000634; “Conservation of saproxylic beetles in the Carpathians” LIFE19 NAT/RO/000023.
Figure 7. Narrow-gauge railways from PNPV during the first part of the 20th century; (a)—German train at Tulnici at the Sovejea Tulnici–Valea Larga section in 1917 [70]; (b) a locomotive in the Lepșa tunnel [68]; (c) narrow-gauge railways in Lepsa at the beginning of the 20th century; [71] (d) the Carpati work colony for wood exploitation, 1930; [71] (e) Tişiţa Station—the terminus of the branch on Tişiţa Mare; [71] (f,g) remnants of today’s narrow-gauge railway (personal archive of the authors—GAI).
Land 12 01774 g007
Figure 8. The space transfer matrix maps of forest landscape during the historical periods: 1957–1975 and 1975–2005.
Land 12 01774 g008
Figure 9. The space transfer matrix maps of the forest landscape during the 2005–2018 period and the evolution of forested areas during the analysed periods.
Land 12 01774 g009
The park’s administration, which monitors compliance with the law within the park’s area, was also established during this period. Tourism activities took a lead in the area, and a large number of guesthouses were built in Lepṣa; thus, tourism became more important in the local economy as a source of income, and forest exploitation became less important.
In the early days, forests were usually exploited in low or easily accessible areas, but as soon as companies with significant capital arrived, they were able to access more difficult areas and built a railway and cable transport network, which made the transport of timber to Transylvania very easy. Recently, there has been an increase of between 3.4% and 5.2% in the area of planted forests according to the slope (Figure 10).
The evolution of the forest landscape in relation to its pedology is more complex in the first two studied periods. In the period from 1789 to 1895, the chernozem and fluvisol types experienced larger losses (ranging from 20 to 30%), and the cambisol types experienced smaller losses (ranging from 4 to 7%). An increase in the proportion of forest was recorded for the podzolic and leptosol soil types. The situation between 1895 and 1975 is diametrically opposed. The more developed and fertile soil types (chernozems, cambisols, and fluvisols) show an increase in forest area, while the less developed ones (podsols and leptosols) indicate a decrease. In the last two intervals, forest cover increased for all soil types (Figure 11).
The evolution of the forest by rock type in the four intervals is similar to that of soil type. There was a decrease in forest cover for all lithological substrate types in the first interval. The largest decrease occurred with respect to the substrates formed by clay and salt (40%), breccia and salt (18%), and a mixture of loess and gravel (18%). In the second interval, forest cover increased with respect to the above substrates, but the increase was much less (between 4 and 10%). On the other hand, the proportion of forest only increased with respect to the substrate formed by sandstone and shale, which is present in the majority of the park’s area. In the third interval, forest cover increased with respect to all substrates, except for loess and gravel.

4. Discussion

This study uses thematic and topographic maps to show the evolution of the PVNP’s forest cover. Some effects of the socio-economic transformations that have taken place over the last 230 years in the area currently occupied by the PVNP can be detected in the analysed periods. From 1789 to 1957 (according to the maps), there was a period of decline in the area covered. This is due to the deforestation of the “difficult” Vrancea period and to differences in cartographic methods. Then, a period of growth followed that overlapped with the National Plan for Land Use and Erosion Control of ICAS Focsani; then, the maintenance of land-use areas was carried out as a result of the establishment of the partial protection regime via the appearance of the first nature reserves in 1973 (Cascada Putnei, Valea Tișiței, and Padurea Lepșa Zboina) and those from 2004 (Putna-Vrancea Natural Park).
It should also be noted that the most active period was 1957–1975, when experiments were carried out and optimal solutions for forest regeneration were promoted [72]. The results of deforestation carried out by foreign logging companies at the beginning of the 20th century can be observed in the decrease in forest area, although they are not presented at the scale used in written documents [58,59]. The afforestation of eroded or threatened slopes, which was carried out after the forests were nationalised in 1948, is also visible. For the most recent analysed period (1975–2018), the main conclusion is that some areas used as mountain pastures have been transformed into forest landscapes mainly due to the abandonment of the traditional practice of sheep farming in the area [73].
The analysis of the forest areas according to the natural factors’ hypsometry, slope lithology, and soil reveals some changes that, in our opinion, are closely related to the anthropogenic influences on the forest landscape in the PVNP. In the first interval of 1789–1895, as a result of deforestation carried out to create pastures and hayfields near settlements, the proportion of forests decreased in areas with the lowest altitudes and slopes. In addition, due to the lack of technological facilities, wood for everyday needs (heating and house building) was exploited in the easiest areas. As technology and loggers became more widespread, there was a decline in woodland cover above 1000 m and on slopes angled between 10 and 20° (1895–1957).
The methodological approach used in this study has some advantages and disadvantages, and these are also mentioned in other similar studies [6,11,13,29,32,49,50]. In our opinion, manual digitisation has two major advantages in the present study. First, manual digitisation conferred much better resolutions than the available datasets (Corine Land Cover and ESRI Land Cover). Also, for older time periods, such datasets are not available. Secondly, the manual digitisation of old maps provided a higher degree of accuracy. We appreciate that the use of information from historical sources and a good knowledge of the studied area led to the best method for interpreting historical map information. The identification of only five classes of land use is based on consistent reasons. The studied area is quite homogeneous from this point of view. Most of it is occupied by forests, followed by pastures and meadows. Human influence has not led to the appearance of many land-use classes (agricultural or industrial activities are almost absent). The level of detail of the old maps used is also quite low. A compromise has also been made in order to be able to compare data from different periods.
The main disadvantage, which prevents a reliable and accurate quantification of the landscape, is the geodetic inaccuracy of the First Military Survey maps. As a result, there may be some errors in the estimation of forest areas due to these inaccuracies. In addition, their average scale does not allow detailed landscape structure and microstructure changes to be recorded. Nevertheless, over a long period of time, from the late 18th century to the present, the use of old maps has proved to be an adequate method for monitoring changes in the landscape.
For the study area, which includes a large number of strictly protected areas and a high diversity of habitats, we believe that this study can lead to improvements in future management plans. The present forest landscape is affected by the changes that occurred during the study period. It has been shown that the massive deforestation of the early 20th century, besides causing material losses to local people [61,64], created areas of massive soil erosion [72]. Another major impact is associated with major changes in the composition and flora of the stands. These effects are only intuited at present and will be investigated in the future. We consider the present study as an initial stage of the more complex analysis of the woodlands of the PVNP. In the future, using information from past and present forest management, we intend to carry out studies on species changes that are a result of anthropogenic interventions.
Meanwhile, the current trend, as shown by the 2018 land-use analysis, comprises a gradual decrease in grazing and haying to the benefit of natural vegetation. Based on the results of the current study, this could become the second major line of future research development. In some natural grasslands with protected species of flora and fauna or in geomorphological and fossil reserves in the PVNP, it will be possible to quantify the influence of the expansion of forested areas.

5. Conclusions

The main objective of this study was to analyse the evolution of a prehistoric habitat over the centuries. In this way, the typology of the protected area (natural, semi-natural, or man-made) can be highlighted. From a scientific point of view, the results of this study have significant implications for the conservation of biodiversity. The historical context and drivers of forest ecosystem change can be understood in order to develop conservation strategies that take into account the complex interaction between natural and human factors. The period between the late 19th and early 20th centuries proved to be the most negative, as Austrian foresters exceeded the limits of sustainability. Since then, negative impacts have been minimal or even positive, and the relationship between humans and nature has become more balanced. The return to the profit-driven paradigm has left its mark on the area, but any deforestation is now blocked by the existing protection regime in the area. If these measures had been strengthened, the PVNP area would have had less biodiversity and ecological importance.
Furthermore, the study highlights the limitations of using historical maps in the analysis; nevertheless, the results obtained provide valuable information on the causes of forest landscape change in specific areas of the PVNP.
In conclusion, the importance of historical data, spatial analysis, and the understanding of socio-economic factors in the assessment of the evolution of forests is highlighted by the use of diachronic mapping and GIS techniques for the mapping of forest landscape changes in the Putna Vrancea Natural Park. It will also provide a scientific basis for the development of specific conservation measures for an area of such ecological importance.

Author Contributions

Conceptualization, G.-A.I., V.I. and I.-G.B.; methodology, G.-A.I., V.I. and A.U.; software, V.I. and P.I.; validation: G.-A.I. and A.U.; investigation, G.-A.I. and P.I.; writing—original draft preparation, G.-A.I. and V.I.; writing—review and editing, A.U., P.I. and I.-G.B.; visualization, V.I. and P.I.; supervision, P.I., A.U. and I.-G.B.; project administration and funding acquisition, G.-A.I. All authors contributed equally and have equal rights to this research paper. All authors have read and agreed to the published version of the manuscript.

Funding

This research received no external funding.

Data Availability Statement

The data presented in this study are available upon request from the corresponding author.

Acknowledgments

This project received technical support from the Department of Geography, Faculty of Geography and Geology, Alexandru Ioan Cuza University of Iasi, Romania, which offered us full access to remote sensing and GIS laboratories. Acknowledgment is also given by G.A.I and I.G.B. to the infrastructure support provided by the Operational Program Competitiveness 2014–2020, Axis 1, under POC/448/1/1 research infrastructure projects for public R&D institutions/Sections F 2018 and the Research Center with Integrated Techniques for Atmospheric Aerosol Investigation in Romania (RECENT AIR) project, under grant agreement MySMIS no. 127324. G.A.I. is supported by the European Social Fund through Operational Programme Human Capital 2014–2020, project number POCU/993/6/13/153322, project title” Educational and training support for PhD students and young researchers in preparation for insertion into the labor market”.

Conflicts of Interest

The authors declare no conflict of interest.

References

  1. Yang, Y.; Zhang, S.; Yang, J.; Chang, L.; Bu, K.; Xing, X. A review of historical reconstruction methods of land use/land cover. J. Geogr. Sci. 2014, 24, 746–766. [Google Scholar] [CrossRef]
  2. Kienast, F. Analysis of historic landscape patterns with a Geographical Information System: A methodological outline. Landsc. Ecol. 1993, 8, 103–118. [Google Scholar] [CrossRef]
  3. Petit, C.C.; Lambin, E.F. Long-term land-cover changes in the Belgian Ardennes (1775–1929): Model-based reconstruction vs. Historical maps. Glob. Chang. Biol. 2002, 8, 616–630. [Google Scholar] [CrossRef]
  4. Petek, F.; Urbanc, M. The Franziscean land cadastre as a key to understanding the 19th-century cultural landscape in Slovenia. Acta Geogr. Slov. 2004, 44, 89–113. [Google Scholar] [CrossRef]
  5. Bender, O.; Boehmerb, H.J.; Jens, D.; Schumacher, P.K. Using GIS to analyse long-term cultural landscape change in Southern Germany. Landsc. Urban Plan. 2005, 70, 111–125. [Google Scholar] [CrossRef]
  6. Statuto, D.; Cillis, G.; Picuno, P. Using Historical Maps within a GIS to Analyze Two Centuries of Rural Landscape Changes in Southern Italy. Land 2017, 6, 65. [Google Scholar] [CrossRef]
  7. Cousins, S.A. Analysis of land-cover transitions based on 17th and 18th century cadastral maps and aerial photographs. Landsc. Ecol. 2001, 16, 41–54. [Google Scholar] [CrossRef]
  8. Domaas, S.T. The reconstruction of past patterns of tilled fields from historical cadastral maps using GIS. Landsc. Res. 2007, 32, 23–43. [Google Scholar] [CrossRef]
  9. Hamre, L.N.; Domaas, S.T.; Austad, I.; Knut, R. Land-cover and structural changes in a western Norwegian cultural landscape since 1865, based on an old cadastral map and a field survey. Landsc. Ecol. 2007, 22, 1563–1574. [Google Scholar] [CrossRef]
  10. Sklenicka, P.; Molnarova, K.; Bravec, E. Remnants of medieval field patterns in the Czech Republic: Analysis of driving forces behind their disappearance with special attention to the role of hedgerows. Agric. Ecosyst. Environ. 2009, 129, 465–473. [Google Scholar] [CrossRef]
  11. Skaloš, J.; Weber, M.; Lipský, Z.; Trpáková, I.; Šantrůčková, M.; Uhlířová, P.; Kukla, P. Using old military survey maps and orthophotograph maps to analyse long-term land cover changes: Case study (Czech Republic). Appl. Geogr. 2011, 31, 426–438. [Google Scholar] [CrossRef]
  12. Skaloš, J. Czech and Swedish intensively utilised agricultural landscape-parallels and divergences during the last 300 years. J. Landsc. Ecol. 2007, 135–162. [Google Scholar] [CrossRef]
  13. Stäuble, S.; Martin, S.; Reynard, E. Historical mapping for landscape reconstruction: Examples from the Canton of Valais (Switzerland). Mt. Mapp. Vis. 2008, 211–217. [Google Scholar]
  14. Gimmi, U.; Lachat, T.; Bürgi, M. Reconstructing the collapse of wetland networks in the Swiss lowlands 1850–2000. Landsc. Ecol. 2011, 26, 1071–1083. [Google Scholar] [CrossRef]
  15. Van Dyke, E.; Wasson, K. Historical ecology of a central California estuary: 150 years of habitat change. Estuaries 2005, 28, 173–189. [Google Scholar] [CrossRef]
  16. Borde, A.B.; Thom, R.M.; Rumrill, S.; Miller, L. Geospatial habitat change analysis in Pacific Northwest coastal estuaries. Estuaries 2003, 26, 1104–1116. [Google Scholar] [CrossRef]
  17. Kearney, M.S.; Russell, E.G.; Stevenson, J.C. Marsh Loss in Nanticoke Estuary, Chesapeake Bay. Geogr. Rev. 1988, 78, 205–220. [Google Scholar] [CrossRef]
  18. Plewe, B. The nature of uncertainty in historical geographic information. Trans. GIS 2002, 6, 431–456. [Google Scholar] [CrossRef]
  19. Leyk, S.; Boesch, R.; Weibel, R. A conceptual framework for uncertainty investigation in map-based land cover change modelling. Trans. GIS 2005, 9, 291–322. [Google Scholar] [CrossRef]
  20. Kaim, D.; Kozak, J.; Ostafin, K.; Dobosz, M.; Ostapowicz, K.; Kolecka, N.; Gimmi, U. Uncertainty in historical land-use reconstructions with topographic maps. Quaest. Geogr. 2014, 33, 55–63. [Google Scholar] [CrossRef]
  21. Bürgi, M.; Salzmann, D.; Gimmi, U. 264 years of change and persistence in an agrarian landscape: A case study from the Swiss lowlands. Landsc. Ecol. 2015, 30, 1321–1333. [Google Scholar] [CrossRef]
  22. Ławniczak, R.; Kubiak, J. Changes in the settlement network in the Noteć Forest (Poland) in a historical perspective. J. Maps 2021, 17, 14–22. [Google Scholar] [CrossRef]
  23. Chen, F.; Bai, X.; Liu, F.; Luo, G.; Tian, Y.; Qin, L.; Li, Y.; Xu, Y.; Wang, J.; Wu, L.; et al. Analysis Long-Term and Spatial Changes of Forest Cover in Typical Karst Areas of China. Land 2022, 11, 1349. [Google Scholar] [CrossRef]
  24. Ramankutty, N.; Foley, J.A. Estimating historical changes in global land cover: Croplands from 1700 to1992. Glob. Biogeochem. Cycles 1999, 13, 997–1027. [Google Scholar] [CrossRef]
  25. Goldewijk, K.K.; Beusen, A.; Janssen, P. Long-term dynamic modeling of global population and built-up area in a spatially explicit way: HYDE 3.1. Holocene 2010, 20, 565–573. [Google Scholar] [CrossRef]
  26. Fuchs, R.; Herold, M.; Verburg, P.H.; Clevers, J.G.P.W. A high-resolution and harmonized model approach for reconstructing and analysing historic land changes in Europe. Biogeosciences 2013, 10, 1543–1559. [Google Scholar] [CrossRef]
  27. Fuchs, R.; Verburg, P.H.; Clevers, J.G.P.W.; Herold, M. The potential of old maps and encyclopaedias for reconstructing historic European land cover/use change. Appl. Geogr. 2015, 59, 43–55. [Google Scholar] [CrossRef]
  28. Munteanu, C.; Kuemmerle, T.; Keuler, N.S.; Müller, D.; Balazs, P.; Dobosz, M.; Griffiths, P.; Halada, L.; Kaim, D.; Király, G.; et al. Legacies of 19th century land use shape contemporary forest cover. Glob. Environ. Chang. 2015, 34, 83–94. [Google Scholar] [CrossRef]
  29. Timár, G.; Galambos, C.; Molnár, G.; Czimbalmas-Szabó, Z. Forest cover changes on the catchment of the Békény Creek (Gyergyó/Gheorgheni Basin, Eastern Carpathians) from the 18th century to nowadays. Geophys. Res. Abstr. 2006, 8, 04556. [Google Scholar]
  30. Osaci-Costache, G.; Ene, M. The Analysis of Forest Dynamics within the Carpathians—The Subcarpathians Contact Area by Using the Historical Cartography Approach and Open-Source GIS Software. Case Study: The Limpedea Catchment (Romania). Forum Geogr. 2010, 9, 115–124. [Google Scholar]
  31. Chelaru, D.A.; Apostol, L.; Ursu, A. Spatial analysis of forested area dynamics in Bistrita Valley—Subcarpathian sector. Present Environ. Sustain. Dev. 2013, 7, 36–47. [Google Scholar]
  32. Armaş, I.; Osaci-Costache, G.; Braşoveanu, L. Forest landscape history using diachronic cartography and GIS case study: Subcarpathian Prahova Valley, Romania. In Planning and Designing Sustainable and Resilient Landscapes; Springer Geography; Crăciun, C., Bostenaru, D.M., Eds.; Springer: Dordrecht, The Netherlands, 2014. [Google Scholar] [CrossRef]
  33. Ursu, A.; Ungureanu, O.A.; Istrate, V.; Acuculitei, A.; Buciumanu, O. The forest area changes in the Prut river watershed (Romania). In Proceedings of the 15th International Multidisciplinary Scientific GeoConference SGEM, Albena, Bulgaria, 18–24 June 2015; Volume 2, pp. 1131–1138. [Google Scholar] [CrossRef]
  34. Osaci-Costache, G.; Achim, F. Changes of the environmental components within the Danube floodplain (Mânăstirea—Călăraşi sector) reflected in the cartographic documents from 19th–20th centuries. Present Environ. Sustain. Dev. 2008, 2, 301–309. [Google Scholar]
  35. Sâvulescu, I.; Mihai, B. Mapping Forest landscape change in Iezer Mountains, Romanian Carpathians. A GIS approach based on cartographic heritage, forestry data and remote sensing imagery. J. Maps 2011, 7, 429–446. [Google Scholar] [CrossRef]
  36. Stângă, I.C.; Niacsu, L. Using old maps and soil properties to reconstruct the forest spatial pattern in the late 18th century. Environ. Eng. Manag. J. 2016, 15, 1369–1378. [Google Scholar]
  37. Pătru-Stupariu, I.; Stupariu, M.S.; Cuculici, R.; Huzui, A. Understanding landscape change using historical maps. Case study Sinaia, Romania. J. Maps 2011, 7, 206–220. [Google Scholar] [CrossRef]
  38. Horodnic, V.D.; Graur, D.S.; Afloari, M.; Efros, V. Geospatial analysis of land use dynamics using historical maps and GIS techniques. Case study of Rădăuți, Romania. In Proceedings of the Geobalcanica, Ohrid, North Macedonia, 15–16 May 2018; pp. 577–594. [Google Scholar] [CrossRef]
  39. Afloari, M.; Graur, D.S.; Horodnic, V.D.; Efros, V. Vatra Dornei—Forestry landscape dynamics in the past 240 years. In Proceedings of the Geobalcanica, Ohrid, North Macedonia, 15–16 May 2018; pp. 565–575. [Google Scholar] [CrossRef]
  40. Apostol, L.; Chelaru, D.A. The landscape dynamics in Piatra Neamt area. Present Environ. Sustain. Dev. 2011, 5, 89–100. [Google Scholar]
  41. Nicu, I.C.; Stoleriu, C. Land use changes and dynamics over the last century around churches of Moldavia, Bukovina, Northern Romania—Challenges and future perspectives. Habitat Int. 2019, 99, 101797. [Google Scholar] [CrossRef]
  42. Istrate, A.G.; Breaban, I.G.; Ichim, P.; Ursu, A. Implications of land use—Land cover change in the northern part of Putna Vrancea Natural Park. In Proceedings of the 21st International Multidisciplinary Scientific GeoConference SGEM, Albena, Bulgaria, 16–22 August 2021; Volume 21, pp. 465–474. [Google Scholar] [CrossRef]
  43. The management plan of the Putna-Vrancea Natural Park and the ROSCI0208 Putna-Vrancea and ROSPA0088 Vrancei Mountain sites. Available online: https://www.life000170.carnivoremari.ro/pdf/PLAN%20DE%20MANAGEMENT%20PUTNA-VRANCEA%20DRAFT%201.pdf (accessed on 30 July 2023).
  44. Dumitrescu, I.; Săndulescu, M.; Bandrabur, T.; Jana, I. Geological Map 1:200,000, Covasna Sheet; Geological Institute: Bucharest, Romania, 1965. [Google Scholar]
  45. Ursu, A.; Juravle, D.T. The impact of geological structure and lithology on landforms in Vrancea region (Romania). In Proceedings of the 15th International Multidisciplinary Scientific GeoConference SGEM, Albena, Bulgaria, 16–22 August 2021; Volume 15. [Google Scholar]
  46. Cernescu, N.; Florea, N.; Conea, A.; Gogoaşă, T. Soil Map: 1:200 000, L-35-XXII Sheet Focsani; IGFCOT: Bucureşti, Romania, 1969. [Google Scholar]
  47. Vasiliniuc, I.; Ursu, A.; Niacșu, L. Soil cover transitions in the Vrancea region. Factori Şi Procese Pedogenetice Din Zona Temp. 2010, 9, 99–118. [Google Scholar]
  48. Sandu, I.; Pescaru, V.; Poiană, I.; Geicu, A.; Cândea, I.; Ţâştea, D. (Eds.) Clima României; Editura Academiei Române: Bucureşti, Romania, 2008; p. 365. (In Romania) [Google Scholar]
  49. Timár, G.; Biszak, S.; Székely, B.; Molnár, G. Digitized Maps of the Habsburg Military Surveys—Overview of the Project of ARCANUM Ltd. (Hungary). In Preservation in Digital Cartography; Lecture Notes in Geoinformation and Cartography; Jobst, M., Ed.; Springer: Berlin/Heidelberg, Germany, 2010. [Google Scholar] [CrossRef]
  50. Molnár, G.; Timár, G. Inversion application in cartography: Estimation of the parameters of the best fitting Cassini-projections ofthe First Habsburg Military Survey. Geosci. Eng. 2015, 6, 36–44. [Google Scholar]
  51. Buchholtzer, C.; Rotaru, P. Istoricul Cartografiei; Institutul Geografic Militar: Bucureşti, Romania, 1937. [Google Scholar]
  52. Popescu-Spineni, M. România în Izvoare Geografice şi Cartografice; Editura Științifică şi enciclopedică: Bucureşti, Romania, 1978. [Google Scholar]
  53. Otzellowitz, H. Militaerischer Aufnahms-Brouillon von der Chotymer Raja, Bestehend in 29 Sectionen. 1788. [Google Scholar]
  54. Otzellowitz, H. Brouillon Oder Original Aufnahme der fünf Moldauischen Districten, Nämlich des Sutschawaer, Roman, Niamtz, Bakeu und Puttnaer Bezirkes, Welche im Jahre 1788 von de Kayserlich Königlichen Armée Occupirt und im Jahr 1790 unter der Direction des Teutsch Bannatischen Gränitz-Regiments Hauptmanns Hora von Otzellowitz Durch Civil-Ingénieurs Aufgenommen Worden; Academiei Romane: Bucharest, Romania, 1790. [Google Scholar]
  55. Timár, G.; Biszak, S.; Molnár, G.; Székely, B.; Imecs, Z.; Jankó, A. Digitized Maps of the Habsburg Empire—First and Second Military Survey; Grossfürstenthum Siebenbürgen; DVD issue, Arcanum Adatbázis Kiadó: Budapest, Hungary, 2007. [Google Scholar]
  56. Pande, C.B. Land use/land cover and change detection mapping in Rahuri watershed area (MS), India using the google earth engine and machine learning approach. Geocarto Int. 2022, 37, 13860–13880. [Google Scholar] [CrossRef]
  57. Constantinescu-Mircești, C. Vrancea Arhaică—Evoluția și Problemele ei; Editura Litera: Bucharest, Romania, 1985. [Google Scholar]
  58. Conea, I. Vrancea Geografie Istorica Toponimie si Terminologie Geografica; Academiei Romane: Bucharest, Romania, 1991; 202p. [Google Scholar]
  59. Stahl, H. Contribuții la Studiul Satelor Devălmașe Românești, Confederații de Ocol, Structuri Teritoriale și Tehnici Agricole, 2nd ed.; Carte Românească: Bucharest, Romania, 1998. [Google Scholar]
  60. Osaci-Costache, G. Topografie-Cartografie: Metodologie, Exemple Rezolvate şi 335 de Aplicaţii; Editura Universitară: Bucureşti, Romania, 2006. [Google Scholar]
  61. Iliescu, I. Aspecte ale activitătii Societăţilor forestiere străine în Vechea Vrance (1). In Cronica Vrancei; Dumitrescu, H., Ed.; Editura Pallas: Focşani, Romania, 2002; Volume III, p. 269. Available online: https://biblioteca-digitala.ro (accessed on 17 April 2023).
  62. Iliescu, I. Calea ferată din Munţii Vrancei (zona Tulnici—Lepşa) realizată de către armata germană în timpul Primului Război Mondial. Mărturii documentare. In Cronica Vrancei; Dumitrescu, H., Ed.; Editura Pallas: Focşani, Romania, 2011; Available online: https://biblioteca-digitala.ro (accessed on 18 April 2023).
  63. Turnock, D. Transport for Romania’s Carpathian Forests: Improved Accessibility through Technological Change. GeoJournal 1990, 22, 409–428. [Google Scholar] [CrossRef]
  64. Turnock, D. Forest exploitation and its impact on transport and settlement in the Romanian Carpathians. J. Transp. Hist. 1991, 12, 37–60. [Google Scholar] [CrossRef]
  65. Turnock, D. Railways and economic development in Romania before 1918. J. Transp. Geogr. 2001, 9, 137–150. [Google Scholar] [CrossRef]
  66. Muică, N.; Turnock, D. The railway age in the Carpathian forests: A study of Romania. Geogr. Pannonica 2003, 7, 9–20. [Google Scholar] [CrossRef]
  67. Mare, M.; Mihai, B. Mapping land cover using remote sensing data and GIS techniques: A case study of Prahova Subcarphathians. Procedia Environ. Sci. 2016, 32, 244–255. [Google Scholar] [CrossRef]
  68. Banu, F. Asalt Asupra Economiei Romaniei de la Solagra la SOVROM (1936–1956); Nemira: Bucuresti, Romania, 2004. [Google Scholar]
  69. Munteanu, C.; Nita, M.D.; Abrudan, I.V.; Radeloff, V.C. Historical Forest management in Romania is imposing strong legacies on contemporary forests and their management. For. Ecol. Manag. 2016, 361, 179–193. [Google Scholar] [CrossRef]
  70. Popescu, I. Caile Ferate in Timpul Primului Razboi Mondial, Club Feroviar, 2020, p70. Available online: https://fliphtml5.com/ylfj/amox/Caile_Ferate_in_Timpul_Primului_Razboi_Mondial/ (accessed on 3 May 2023).
  71. Hufnage, H.; Lăcrițeanu, S. Căile Ferate Forestiere Tișița, Arhivele Naționale Vrancea, 2011. Available online: https://invrancea.ro/istoria-mocanitei-din-cheile-tisitei-vrancea-partea-a-doua/ (accessed on 3 May 2023).
  72. Constandache, C.; Dinca, L.; Nistor, S.; Crisan, V. Causes of land degradation in Vrancea. Forestry measures to improve degraded land. Pedogenic Factors Process. Temp. Zone 2016, 15, 57–68. [Google Scholar]
  73. Muica, N.; Nancu, D.; Turnock, D. Historical and contemporary aspects of pluriactivity in the Curvature Sub–Carpathians of Romania. GeoJournal 2000, 50, 199–212. [Google Scholar] [CrossRef]
Figure 1. The maps of the location and main natural background of the study area. Note the following: (a) location; (b) elevation classification; (c) slope grade; (d) internal functional zoning areas of the PNPV; (e) soil type; (f) lithology.
Land 12 01774 g001aLand 12 01774 g001b
Figure 2. Flowchart of the methodological research steps.
Land 12 01774 g002
Figure 4. The spatial distribution of forest landscape and main land-use categories during different historical times.
Land 12 01774 g004
Figure 5. Changes in the land-use classes between 1789 and 2018.
Land 12 01774 g005
Figure 6. The space transfer matrix maps of forest landscapes during different historical periods: 1789–1895 and 1895–1957.
Land 12 01774 g006
Figure 10. The percentage of changing forest areas with different elemental grades in terms of the total forest area and with respect to every elevation and slope class during different historical periods.
Land 12 01774 g010
Figure 11. The percentage of changing forest area with different elemental grades in terms of the total forest area and with respect to every soil and lithology class during different historical periods.
Land 12 01774 g011
Table 1. Overview of the data used in the analysis.
Historical MapsLand SurveyYears of PrintAverage
Calculated
Residual
Error
Digitization
Error
First Military Survey map1788 and 17891790157 m1 pixel (4.3 m)
Moldavian Atlas1893–1895189876 m1 pixel (4.6 m)
Plan Director de Tragere1893–18951916–191758 m1 pixel (1.7 m)
Sovietic Topographic map195719723.8 m1 pixel (4.5 m)
Romanian topographic map1974–197519761.051 pixel (3 m)
Disclaimer/Publisher’s Note: The statements, opinions and data contained in all publications are solely those of the individual author(s) and contributor(s) and not of MDPI and/or the editor(s). MDPI and/or the editor(s) disclaim responsibility for any injury to people or property resulting from any ideas, methods, instructions or products referred to in the content.

