Article

Evaluation of Territorial Capacity for Development: Population and Employment

by
Ricard Calvo-Palomares
1,
Juli Antoni Aguado-Hernández
1,
Enric Sigalat-Signes
1 and
Bernat Roig-Merino
2,*
1
Territorial Development Research Group (GRIDET-UV), Universitat de València, 46021 Valencia, Spain
2
Department of Economics and Social Sciences, Universitat Politècnica de València, 46730 Valencia, Spain
*
Author to whom correspondence should be addressed.
Land 2023, 12(9), 1773; https://doi.org/10.3390/land12091773
Submission received: 26 July 2023 / Revised: 5 September 2023 / Accepted: 6 September 2023 / Published: 13 September 2023

Abstract

:
Rural depopulation and its consequences is a critical social, economic, labour and environmental issue. Based on diagnoses carried out five years ago in two rural territories of the Valencian Community (Spain) in a situation of demographic desertification, this paper aims to analyse if the evolution of employment and population has become a driving force for local development in both territories. To this end, triangulated analysis has been conducted using statistical sources, a survey of the respective Local Development and Employment Officers (AEDLs) and application of the new READI© methodology—based on a matrix with indicators evaluating the level of convergence of the resources, actors and dynamics available to the territory. The survey and READI© methodology have allowed us to complete sociodemographic analysis of population and employment to identify the causes that explain the similarities and differences between both territories in their capacity to generate local development processes. As a result of this study, some positive trends can be observed in the period encompassing 2017–2022, changing the preceding negative tendency and allowing us to generate a hopeful approach for such territories if local development policies correct the detected imbalances.

1. Introduction and Objectives

It is clear that rural territories have greater difficulties in generating opportunities for job creation and local development. Many factors are working against them: physical distance from urban centres; deficient infrastructure and insufficient means of transport; intermittent supplies and, in many cases, without guarantees; limited access to new technologies; inhibited training processes; lack of financial resources for entrepreneurship; and an ageing, poorly trained population with a lack of innovation and initiative. We would suggest that all of the above factors revolve around a single central element: the depopulation process to which these inland territories are subjected and which, in turn, undoubtedly affects the other factors mentioned above.
The Spanish [1,2,3,4,5,6] and international [7,8,9,10] academic literature has widely studied rural depopulation and its social and economic consequences. This issue has also been investigated from different disciplines and perspectives, such as demography [9,11,12,13,14,15]; geography and rural–urban spatial analysis [10,16,17]; employment and territorial development [8,18,19,20,21,22,23]; urbanisation and land transfer for developing the regional economy [24]; as a political [14] and social challenge [25]; and public policies and services [23,26]. But the problem can also be explored from the urban–rural digital divide [27] and social media use as a way to help improve organisation performance [28].
The depopulation of a large part of inland Spain is the result of structural changes that have their roots in the development of the Spanish economy during the third quarter of the twentieth century [6]. But above all, they show that they are not only a critical demographic problem but also a social, economic, labour and environmental issue. This context justifies the interest of this empirical study to evaluate the recent evolution of population settlement and job creation as drivers of territorial capacity for development in two rural areas that have experienced one of the most significant demographic declines in Spain during the last decades, in the context of a marked socioeconomic crisis linked to their rural and peripheral situation.
This paper builds on a thorough diagnosis carried out in 2017 in the 25 different comarcas1 of the Valencian Community (Spain) to analyse the territories in an integrated way and identify the qualities of each geographic space and its development possibilities [18]. It was intended to serve as a guide for policies to combat depopulation in rural areas, receiving the direct involvement of the regional public administrations with competencies in this area through the LABORA organisation—the Valencian Service for Employment and Training.
On this basis, this study aims to analyse if the evolution of employment and population has become a driving force for local development in two distinct rural areas (comarcas) in a situation of demographic desertification and located in the interior of the Valencian Community: El Rincón de Ademuz and Los Serranos. To this end, triangulated analysis has been conducted using statistical sources, a survey of the respective Local Development and Employment Officers (AEDLs)2, and the application of the new READI©3 methodology [31]—based on a matrix with indicators evaluating the level of territorial capacity for local development processes. The ultimate goal is to lay the foundations of local development policies to address possible imbalances and generate opportunities to retain inhabitants.
Our working hypothesis links the capacities4 to establish a settled population and to generate employment as driving forces of local development. To verify this, we will analyse how population and employment have evolved and whether they have indeed become driving forces for these territories. Moreover, to provide a gender perspective not considered in previous diagnoses, we will include sociodemographic information differentiated by gender.
This paper is organised as follows. Section 2 reviews the previous diagnosis of the two comarcas. Section 3 describes the research method used for triangulated analysis. Section 4 shows the results of the study in three subsections: firstly, in Section 4.1, we describe the recent evolution of the relevant sociodemographic statistical data; then, in Section 4.2, we show the socioeconomic evolution of employment and population outcomes as perceived by the AEDL; and thirdly, in Section 4.3, we provide more detailed diagnosis of the development capacity of each comarca in the three dimensions of the READI© matrix: resources, actors and dynamics. Finally, Section 5 summarises the results, showing the usefulness of the READI© matrix in identifying the causes that explain the similarities and differences between both territories in their capacity to generate local development processes.

2. Background: Previous Diagnosis of Two Rural Comarcas of the Valencian Community

Taking into account all of the above regarding the difficulties in generating opportunities for job creation and local development in rural territories, what shows itself to be the principal problem of depopulation is the quantitative loss of human resources. And so we see that as the average age goes up in these comarcas, the age pyramid becomes regressive, relative mortality increases and the birth rate decreases. Consequently, if the migratory balances are negative, the result can only be an ageing population. Bielza [32] points out that an ageing society cannot be an entrepreneurial society since it is dominated by a gerontocracy, and this, in the long term, leads to economic imbalance:
“It might be described as a perfect storm of rural depopulation initiated by the lack of profitable jobs, which causes an exodus leading to the consequent demographic regression to levels of underpopulation, which in turn reduce the provision of services and equipment and the consequent deterioration of the quality of life. All of which lessens the attraction of an underpopulated rural environment, aggravating the problem of low employment, and the process is reinforced until total depopulation is reached” [32] (p. 618).
The scientific literature on the subject and recent studies corroborate the above, pointing out that depopulation is a not only a demographic and territorial phenomenon but also a social challenge for the territory [4,14,16,25].
In Figure 1, we can see the geographical location of these comarcas and the reality of the situation of depopulation in which they find themselves.
Territorial diagnoses of these two comarcas were carried out in 2017, within the framework of the Valencian Strategy for Employment administered by the Valencian Government [18]5. These diagnoses identified the existing resources in both territories to favour development potential and seek out local networks to form the backbone of the development process. All of this was with the ultimate aim of laying the foundations of a local strategy whose main courses of action were:
  • To make the most of the available resources and the need to strategically dimension the potential of the territory.
  • To promote endogenous initiatives from, by and for the territory.
  • To generate population attraction poles, especially for women and young people.
  • To improve infrastructures to circumvent the technological gap (roads and basic amenities such as electricity and Internet).
  • To encourage private initiative through public–private partnerships.
  • Who leads the territory? A joint, comprehensive, integrated and integrating vision.
  • To attend to the singularities of these territories.
  • The need to retain and attract capital and talent through training.
  • To activate the population. Do not wait for someone from outside to come and do this or to propose the solution.
  • To address the lack of investment: a strategic plan of action (long term).
All these proposals come together to form the main conclusion that a clear link exists between the capacities that the territory has at its disposal to settle the population, on the one hand, and to generate employment opportunities, on the other hand. Any local development project must take into account and coordinate these two variables in order to achieve success. The combination of these two capacities (simplified through a dichotomy of whether they are capable/not capable) determines four scenarios a rural territory may face, shown in Figure 2.

3. Method: Analysis of the Period Encompassing 2017–2022

As previously indicated, five years after the initial diagnosis, this paper analyses in detail the recent evolution of employment and population in the rural territories of the Valencian Community. Our working hypothesis will seek to link the two variables in order to verify whether they have become driving forces for development.
The fieldwork was carried out in the comarcas of Los Serranos and El Rincón de Ademuz. Los Serranos (also known as La Serranía) is made up of a total of 19 municipalities and has a population of 16,604 inhabitants. El Rincón de Ademuz comprises seven villages with a population of 2189 inhabitants in 2022 [33]. Both comarcas are located in the northwest of Valencia (Spain), with an area of almost 1800 km² and an average density of just 10 inhabitants per km² (see the map in Figure 1).
The data collection and analysis techniques used in the development of this research were as follows:
  • Analysis of statistical and documentary sources, such as:
    -
    INE-National Institute of Statistics [33];
    -
    IVE-Valencian Institute of Statistics [34];
    -
    LABORA-Valencian Employment and Training Service [35].
We also considered statistical sources and secondary data provided by the local administration of both comarcas. In addition, to provide a gender perspective not considered in the initial diagnoses, we included sociodemographic information differentiated bygender.
2.
The sending of an ad hoc questionnaire to the 23 AEDL technicians of the territory, in which they were asked questions about population, employment and opportunities for territorial development. Of the 23 AEDL technicians (6 from El Rincón de Ademuz and 17 from Los Serranos), 15 responded (5 from El Rincón and 10 from Los Serranos). All the respondents were women (except a man from Los Serranos) since AEDL is an eminently feminine profession. Therefore, results broken down by respondent gender are unnecessary since this sample ensures no gender bias against women.
3.
Application of the READI© methodology to know and measure the capacities of the territories for future local development processes. This methodology based on the READI© matrix consists of a set of 165 indicators organised around three large blocks: resources, actors and dynamics. This matrix allows for assessing the situation of the territories by offering a resulting score, as a general whole or itemised, for each element or grouping of indicators. A more detailed explanation of this methodology can be found in [31,36].
The final distribution of dimensions, variables and subsections of this matrix is shown in Table 1 [31]. This complex index shares out a total of 500 points among the three main dimensions as follows: resources (200 points), actors (150 points) and dynamics (150 points). The READI© matrix has been validated as described in [37].

4. Results of the Study: Evolution over the Period 2017–2022

The results of the analysis carried out in these two territories are shown below. Firstly, the evolution of sociodemographic statistical data is described, then the socioeconomic evolution is described as perceived by AEDLs and, finally, a more detailed diagnosis of their capacity for development is described for each of the three dimensions of the READI© methodology: resources, actors and dynamics.

4.1. Sociodemographic Evolution

Table 2 shows the evolution of the main sociodemographic indicators of the two comarcas over the last five years. It also shows the data corresponding to the year in which the historical series began. The year of the beginning of the series is different for each indicator and appears in parentheses in the first column. The last year available is also different for each index (either 2021 or 2022).
We are presented with a difficult contextual starting point, with low activity rates, which distinguish a territory where the priority is to guarantee opportunities for its inhabitants to stay to live there. The danger is that this area could become a land of ghost towns. However, there are certain positive indicators that we feel it is important to highlight.
These areas have experienced some of the greatest demographic decline in the Valencian region, in the context of a marked socioeconomic crisis linked to their rural and peripheral situations. Demographic indicators show the population decline of both comarcas with annual growth rates that are clearly negative. The comarca of Los Serranos continued to lose population from 17,169 residents in 1996 to 16,604 in 2022, although between 2017 and 2022 there was a small growth in population that has allowed it to stabilise at 0.33 per cent of the regional total since 2017. As regards the comarca of El Rincón de Ademuz, the population went from 10,000 inhabitants at the beginning of the twentieth century to 3013 inhabitants in 1996 and 2189 in 2022, falling throughout the period, both in absolute terms and as a percentage of the regional total.
Disaggregated by gender, between 1996 and 2022, the percentage of women dropped from 48.8 to 46.2 per cent for the inhabitants in El Rincón de Ademuz, and from 49.1 to 47.4 per cent in Los Serranos. Therefore, women’s population has fallen slightly more than men’s in both comarcas. However, this negative trend seems to have just changed in Los Serranos during the last five years, with a stabilisation of the percentage of women and the aforementioned small population growth for this comarca.
The qualified young population generally seeks to invest their future elsewhere, where they can find better opportunities. The ageing rate in both comarcas is double the average value for the Valencian Community.
The average age is respectively seven years older (Los Serranos) and fourteen years older (El Rincón de Ademuz) than the regional average (48 years). With such a demographic panorama, it is not surprising that the dependency ratio is significantly high compared to the Valencian region as a whole. Thus, a marked deficit in the young and adult population is a characteristic feature of the population structure of these areas.
The combination of all the factors described above has generated an extensive demographic desert with very low population densities. In Los Serranos, the population density has been around 12 inhabitants per km2 since 1996, while in El Rincón de Ademuz it is 6 inhabitants per km2, less than 10 inhabitants/km², which is considered the threshold of “demographic desertification” [11] (p. 207).
With the current dependency rates, exacerbated ageing rates and low Labour Force Renewal Index, the result is inevitable, especially if we focus on the high ageing index rates, 263.3 in El Rincón de Ademuz and 251 in Los Serranos, as well as longevity rates of 53.9 and 64.5, respectively. The crude birth rate also dropped significantly, from around seven per 1000 in 2010 to less than five in the first comarca and five and a half in the second, in 2022. The percentage of children under 16 years of age, which had improved slightly between 2001 and 2017, decreased somewhat between 2017 and 2022, remaining at around 11 per cent in both comarcas in 2022, below the regional average of 15 per cent. All this translates to a Labour Force Renewal Index that is much lower than in 2002 and continues to decline well below the regional average of 75.
In contrast to this pessimistic outlook, a few indicators have evolved favourably in recent years. For example, the dependency ratio reduced in El Rincón de Ademuz from a high 81 per cent in 2001 to 69 per cent in 2022, while in Los Serranos it remained around 63 per cent over the same period. These values exceed the regional average of 54 per cent but have improved in the comarca with the worst data at the beginning of the century. This improvement is mainly due to the reduction in the percentage of people over 64 in El Rincón de Ademuz between 2001 and 2022. Likewise, between 2017 and 2022, the crude mortality rate changed its trend and reduced slightly in both comarcas, although it was still higher than the regional average rate. Finally, life expectancy at birth remains the same as the regional average in the comarca of Los Serranos, and a little below in El Rincón de Ademuz, with no sign of a negative trend.
Concerning the economic situation, the supply of employment in these comarcas is mainly based on agriculture, commerce and manufacturing industries. However, there is little entrepreneurial strength, with 162 companies in El Rincón de Ademuz and 1029 in Los Serranos. According to the DIRCE16, the current number of companies in both comarcas is lower than in 2012, when the series began. On the other hand, the number of companies registered with the Social Security rose from 2012 to 2022 in both territories (also from 2017 to 2022). These companies are mostly SMEs.
Agriculture continues to be an important activity, although construction and rural tourism have positioned themselves as the economic engine in recent decades. With regard to affiliation to the social security system, it is worth highlighting the significant weight of affiliation by workers with self-employed status in these rural areas, which is double the figures registered in the Valencian Community. The submerged economy—especially for women—and other economic alternatives, such as neighbourhood and family networks, are widely analysed facts of Spanish rural areas [41], with no exception apparent here.
Nevertheless, from 2012 to 2022, Social Security affiliation rates increased in both comarcas, up to 35 per cent of the working-age population in El Rincón de Ademuz and up to 44 per cent in Los Serranos. However, they still do not reach the 61 per cent regional average. Likewise, women’s Social Security affiliation rate also increased in both comarcas between 2012 and 2022, rising to 43 per cent in both comarcas and quite close to the 46 per cent regional average.
The educational level of unemployed job seekers registered in 2022 in LABORA shows that almost half of the job seekers in these comarcas do not have a school diploma. However, although the absolute number of contracts has declined in the last five years, the number of unemployed people registered in the public employment service and the unemployment rate decreased in both comarcas, which can be considered a positive indicator for the labour market. The gender unemployment gap17 in both comarcas is practically the same as the regional average (4%).
In addition, mobility associated with employment opportunities is linked to the possibilities offered by the transport system. There is no public transport service in these rural areas, which constrains employment opportunities in the local labour markets since any kind of mobility implies travel by car. Thus, the traditional deficit of services and infrastructures hinders accessibility and integration between these municipalities and with the wider economy. This brings into evidence the lack of territorial cohesion and the isolation of these rural areas [12,18,26].
Regional policy has largely neglected addressing the specific problems of the territory. Regional and state policy initiatives have been directed mainly towards improving road communications and basic infrastructure to ensure that these rural areas are acceptably attended to. However, these are insufficient, as Pinilla and Saez [4] (p. 14) point out when referring to the unsystematic and disjointed public investment provided to Spain’s most depopulated rural areas.
The data in Table 2 above illustrate the “rural–urban” dichotomy, which authors such as Del Molino [2] consider a new centre of inequality in Spanish society, pointing out that this has been accentuated by Spain’s entry into the European Union. This dichotomy causes a gap fostered by economic interests, which have focused on large cities and urban areas, and has eroded some of the traditional rural cultural elements to a certain extent. Along the same lines, Del Rey et al. [42] point out that there is a decrease in the importance of the rural environment. And the stigmatisation of all that is rural still pervades [1,5,7].
To address this trend, a European strategy for the rural development policy of its member states is necessary. As Margaras [3] points out, several EU countries are home to sparsely populated areas, so the problem could be addressed from a European perspective and a conception of development understood in a broad sense. Territorial cohesion is one of the fundamental objectives of the European Union, included in the Lisbon Treaty of 2007, to call for a balanced and harmonious development of all European territories according to their strengths and singularities [19].
In this sense, rural areas represent one of the main challenges for development policies throughout the member states, as these areas are more exposed to poverty and social exclusion. Moreover, this situation is aggravated by other deficits that cause the material and immaterial isolation of these areas. These deficits range from the absence or difficulty of access to basic services (such as healthcare) to the lack of education and training infrastructure, especially for young people [13] (p. 223). According to Pinilla and Sáez [26] (p. 331), depopulation policies should have the objective of enabling citizens to reside where they wish and obtain the best possible quality of life. And this could be based on a new governance framework, together with the support of the European Union [21,43], to carry out these policies more effectively and constitute a benchmark of successful territorial cohesion for the member states.
These areas exemplify imbalances in development because of their low expectations and because they are ostensibly unattractive to live in. However, as noted above, if the singularities of these territories are taken into account and rural society is to be preserved, they could also become areas of opportunity. As underpinned by the scientific literature [8,9,10,11,27], it is a matter of urgency to attract population and investment in order to fight against depopulation and unemployment.

4.2. Socioeconomic Evolution: Employment and Population Outcomes

The recent evolution of the population and the economy of these two comarcas have been surveyed by means of the ad hoc questionnaire answered by 15 AEDLs from both territories. Figure 3 shows that the responses provide a very close pass score (greater than or equal to five out of ten) for all the items, with better values for Los Serranos.
In both comarcas, the evolution of the economy and opportunities for local development are perceived as being somewhat better than the evolution and settlement of population.
According to the AEDLs, the pandemic has slowed the exodus and ageing in both comarcas but has not stopped them. Although there has been a settlement of young people in the last two years due to COVID-19, this increase cannot be considered significant. Young people continue to leave for the main urban centres seeking study opportunities, and the population continues to be predominantly older.
And concerning the evolution of the economy, some cooperative and private employment-generating projects have been created in the last years. New services have also been provided, and existing services have been maintained to facilitate the reconciliation of work and family (nursery school, respite for carers and home help services for the elderly), encouraging the incorporation of many women into the labour market. Nevertheless, most of the business fabric is still made up of micro-enterprises with ageing personnel.

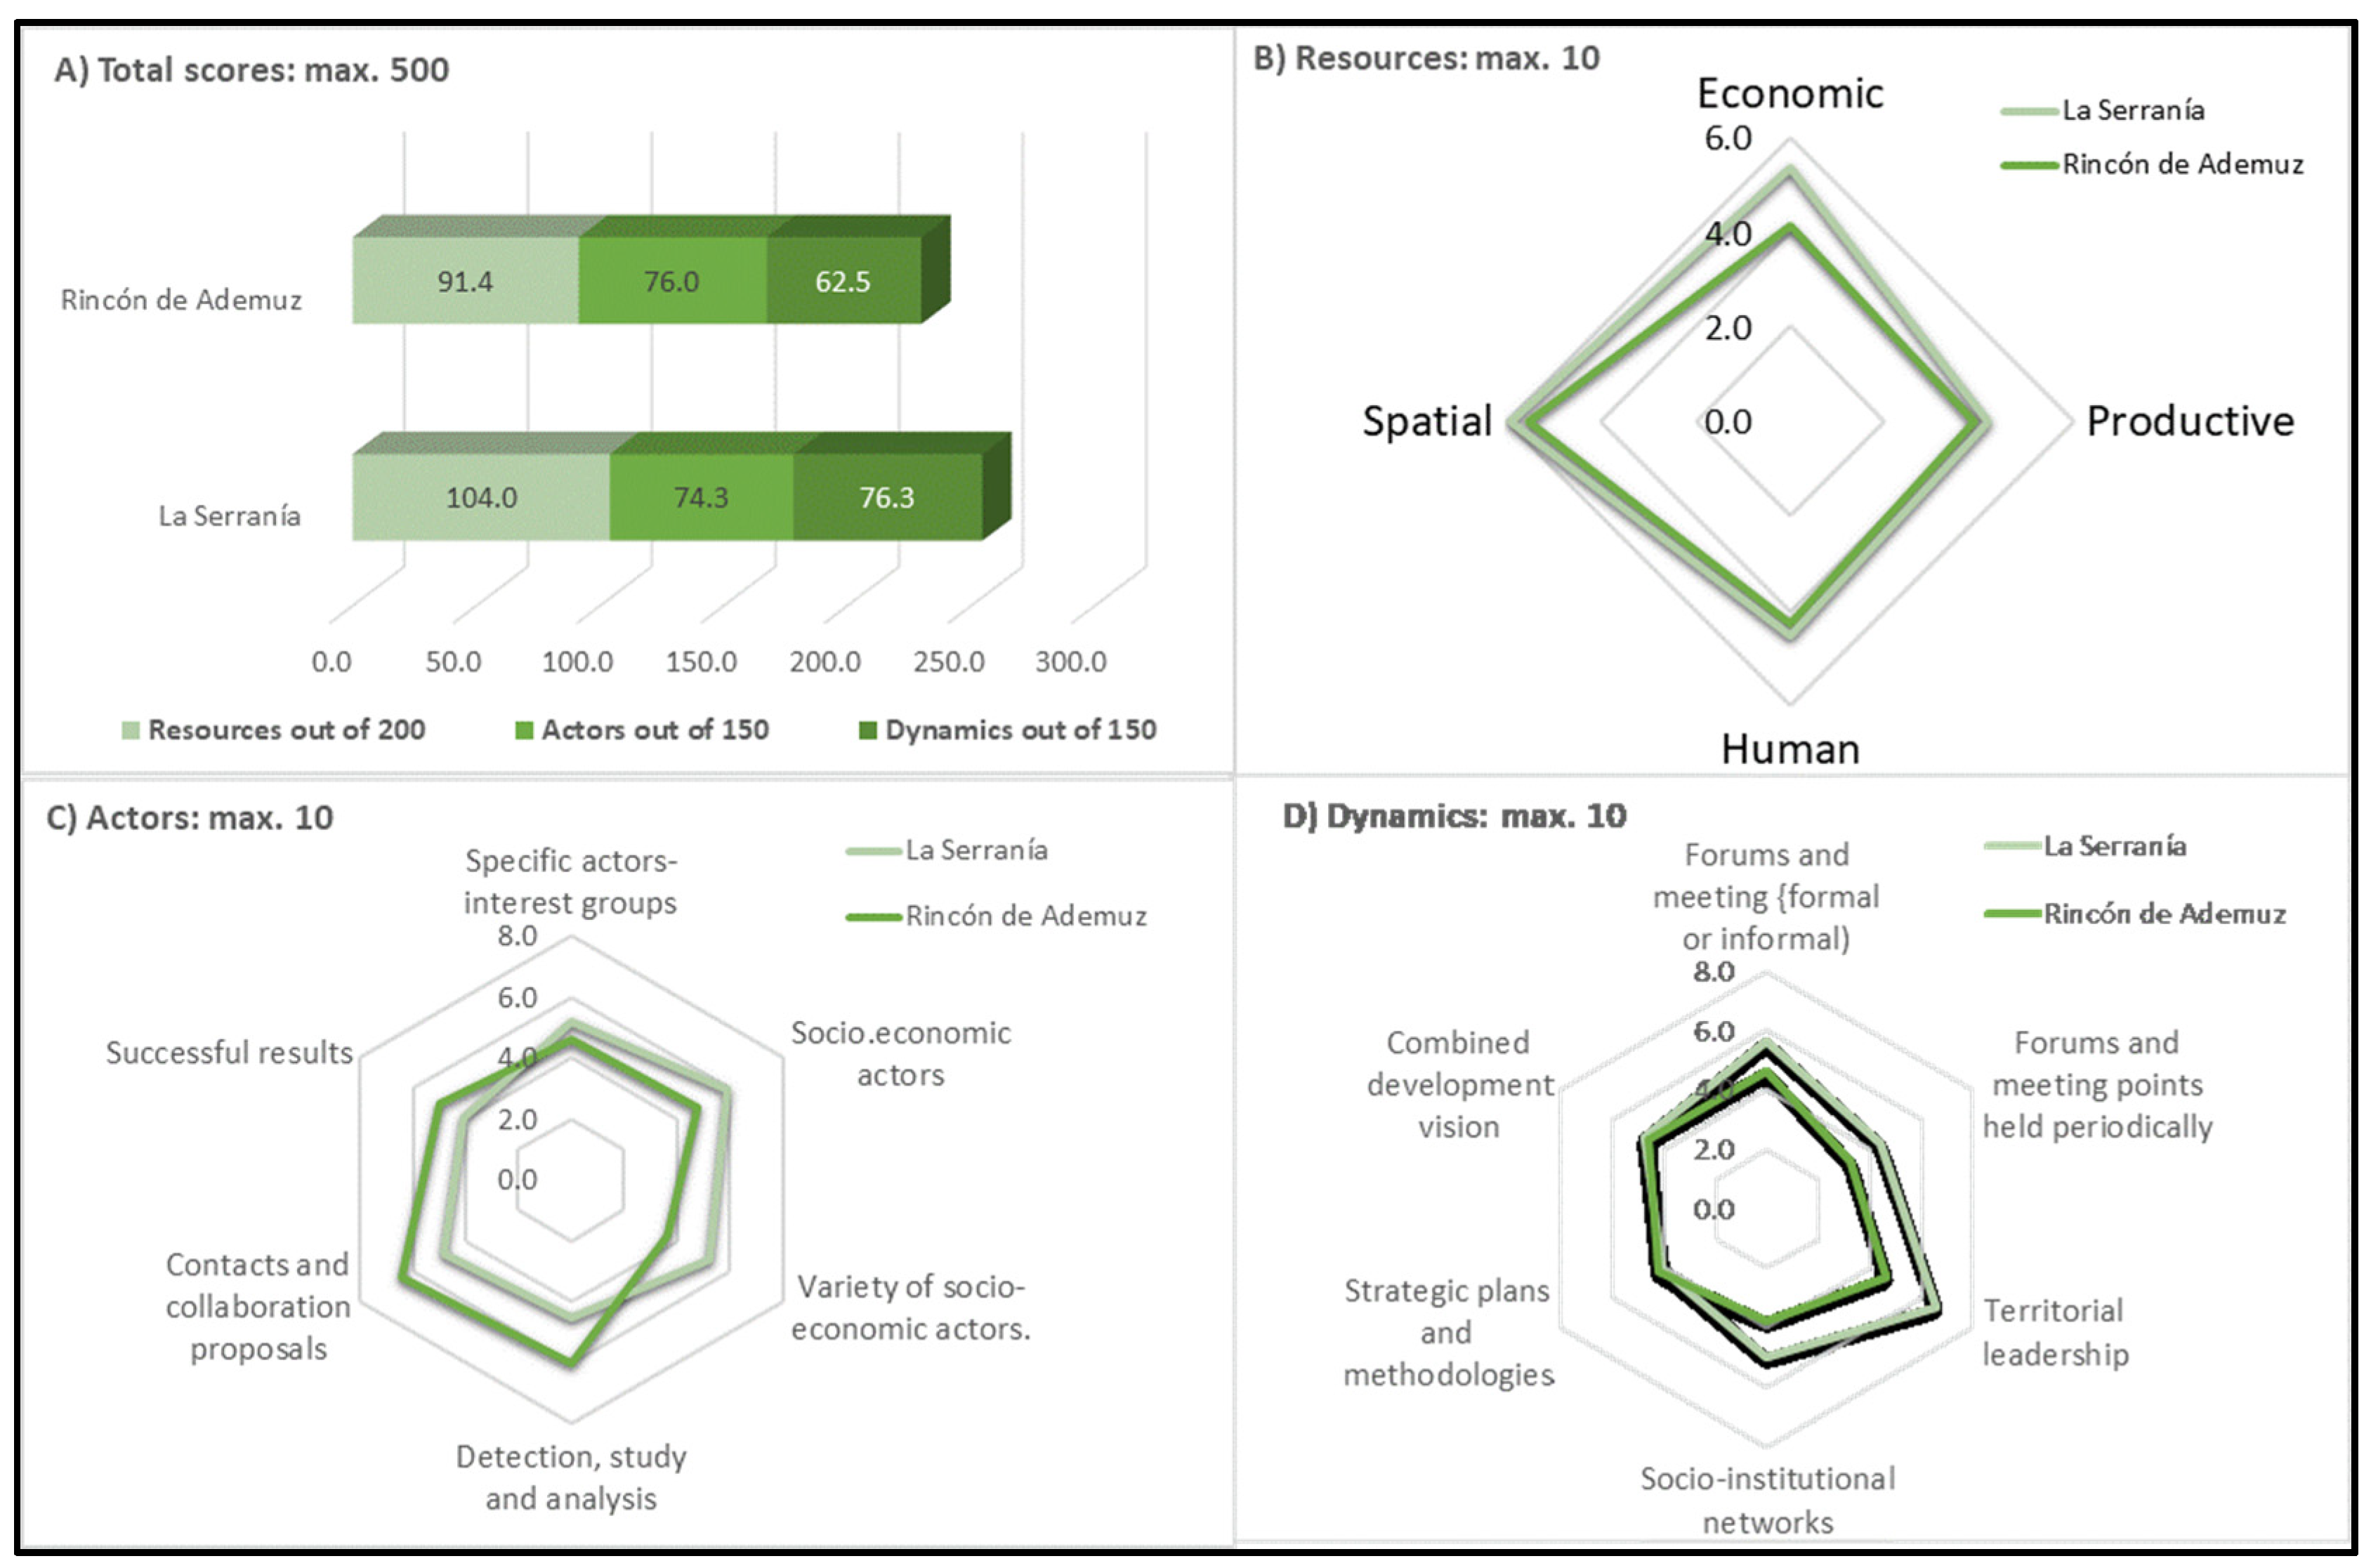
4.3. READI© Methodology Results (Resources, Actors and Dynamics)

This socioeconomic vision is also endorsed by the indicators shown below, the result of the application of the READI© matrix [36], which evaluates a territory’s capacity for development. This matrix is based on the convergence of three key dimensions: resources, actors and dynamics.
The resources in an area are of no use if there are not actors who know how to make the most of them. Equally, actors are of little use if they do not cooperate and do not establish interaction dynamics among themselves, beyond those motivated by their own interests. Therefore, territories are only competent to the extent that they make the most of their available resources through the actors present and generate dynamics among them. However, not all factors influence territorial development to the same degree, so they are assigned different weights in this matrix [36].
In Figure 4, we see the summary of the scores for each comarca in the main dimensions and variables of the READI© scheme, with four graphs.
In Figure 4A, we can discern that the total scores of both comarcas are located within an intermediate value band in relation to the maximum 500 points of the matrix. El Rincón de Ademuz rests at 46 per cent (229.9/500) of its potential for development, compared to 51 per cent (254.6/500) for Los Serranos.
If we compare the scores for each of the three main dimensions analysed (Figure 4A), El Rincón de Ademuz does not gain a pass mark in the valuation of dynamics (62.5/150 = 42 per cent of its capacity), nor in that of resources (91.4/200 = 45 per cent of its potential), while La Serranía has an intermediate score in both dimensions, a little above 50 per cent. Finally, the valuation for actors just scrapes a pass mark in both comarcas.
In this sense, it becomes necessary to consider the relevance of the issue of “social capital” and cooperation links between actors—human, technical and organisational resources, among others—as sources of relationships where the dynamics that generate development strategies take place. According to Barreiro Cavestany [44] (p. 10), as cited in [45] (p. 1012), social capital is relational, and a person or an organisation must relate to another in order to possess this type of capital. Social capital only exists when it is shared. That is to say, although there are actors, if there are no exchanges and interactions among them, no dynamics are produced. In short, this social capital is not used in favour of possible territorial development strategies by both comarcas.
The following is a more detailed analysis of each of the three elements of the READI© matrix through their main variables shown in Figure 4B–D:
  • As shown in Figure 4B, the resources that score best are spatial resources (natural, tourist, cultural heritage, productive and infrastructures), which are located between 55% and 60% of their potential in both comarcas. They are followed in capacity by economic resources (self-financing, public or private external financing, and European Union funding), although with important differences between Los Serranos (54% for potentiality) and El Rincón de Ademuz (41%). Human resources (labour migration balance and training of the population) are at between 43% and 45% of their capacity, with productive resources (quantity and quality of job creation, productive fabric, number of productive sectors and size of companies) being the lowest rated (between 39% and 42% of their capacity).
    To discover with more detail the capacity of these comarcas to generate employment, we will now look at an assessment of three subsections of the “resources” dimension of the READI© matrix, which do not appear in Figure 4. The first subsection is the variable “quantity of employment generated” (valued within the productive resources section), which is between 40% and 45% of its capacity in both territories. The second subsection is the “quality of employment generated”, valued at between 46% and 50% of its potential. And finally, the third one is the “labour migratory balance” (valued within the human resources section), which shows that more labour is imported from other places (between 49% and 52% of its potential) than can be exported (between 41% and 44% of its potential). In all cases, Los Serranos has a slightly higher assessment than El Rincón. We will discuss these specific scores later in this paper.
  • The actors dimension refers to the existence of people and organisations (economic, political, social and technical), both public and private, with a direct or indirect interest in the development of the territory.
    When we analyse the six variables of this dimension, both territories receive scores of around 50% for the presence of specific stakeholders and interest groups (specific resources for development), with scores of between 46% and 52%. However, they differ considerably in the score received for the variety of socioeconomic actors, which is low in the Rincón de Ademuz (36%), while it achieves a pass mark in Los Serranos (52%). And the contrary occurs with the results obtained from the contacts between the different actors or interest groups in the territory, which achieve minimal success in the Rincón de Ademuz (50%) and a low score in Los Serranos (41%). What is noteworthy in this dimension is that an inverse process is detected for both comarcas. In Los Serranos, there are more actors and they are more varied than in Rincón de Ademuz, but in the latter comarca there is a remarkable process of detection, study, analysis, contact and proposals for collaboration among the actors. Does this presence of actors and their identification processes indeed translate into dynamics for activating and mobilising the territories’ resources? This question will be answered in the next section.
  • Finally, the issue of dynamics is closely related to that of actors. For dynamics to exist in the territory, not only must the actors be detected and defined, but there must also be spaces for meeting and exchange. In both comarcas, there is a wide margin for improvement and progress as regards these issues, with worse scores in El Rincón de Ademuz. It is true that there are forums and meeting points for development at a local level, with an average degree of consolidation and institutionalisation (creation of participatory bodies) that varies between 46% and 56%. However, when it comes to the functioning of these forums and their timing throughout the year, the scores drop to between 32% and 44% of their capacity. As a consequence, the existence of socio-institutional networks for interaction between the different local social actors or interest groups is also low, resting at between 38% and 50%. This also implies that the existence of methodologies and strategic plans is only slightly above 40% in both territories.
    Only the assessment of the joint vision of development (between 46% and 48%) and the existence of territorial leadership (especially in Los Serranos) are saved from these negative scores.

5. Conclusions

In accordance with our working hypothesis, linking the capacities to settle population and generate employment as driving forces of local development, the main findings of this research highlight some positive cues facing the issue of depopulation and loss of economic activity and jobs in the rural areas studied.
Firstly, various statistical indicators point in this direction: from demography (low population growth in the last five years, reduction in the dependency ratio and crude mortality rate, and maintenance of life expectancy at birth, among other factors) to employment (increase in Social Security affiliation rates and reduction of the unemployment rate) and economy (increase in the number of companies registered with Social Security). Secondly, the AEDL survey shows that the evolution of the economy and opportunities for local development is perceived as being somewhat better than the evolution and settlement of population. And thirdly, the READI© matrix shows well-valued spatial resources, together with a certain vision and capacity for territorial leadership in these areas, although lacking the forums where their vision turns into plans.
These findings are consistent with other studies [6] examining the recent demographic and economic trends in the so-called “depopulated Spain”, finding that some rural areas next to these two comarcas also seem to be overcoming the declining course of the past.
Some positive population and employment trends observed in both territories between 2017 and 2022 are detailed below, allowing us to generate a hopeful approach if local development policies succeed in correcting the detected imbalances:
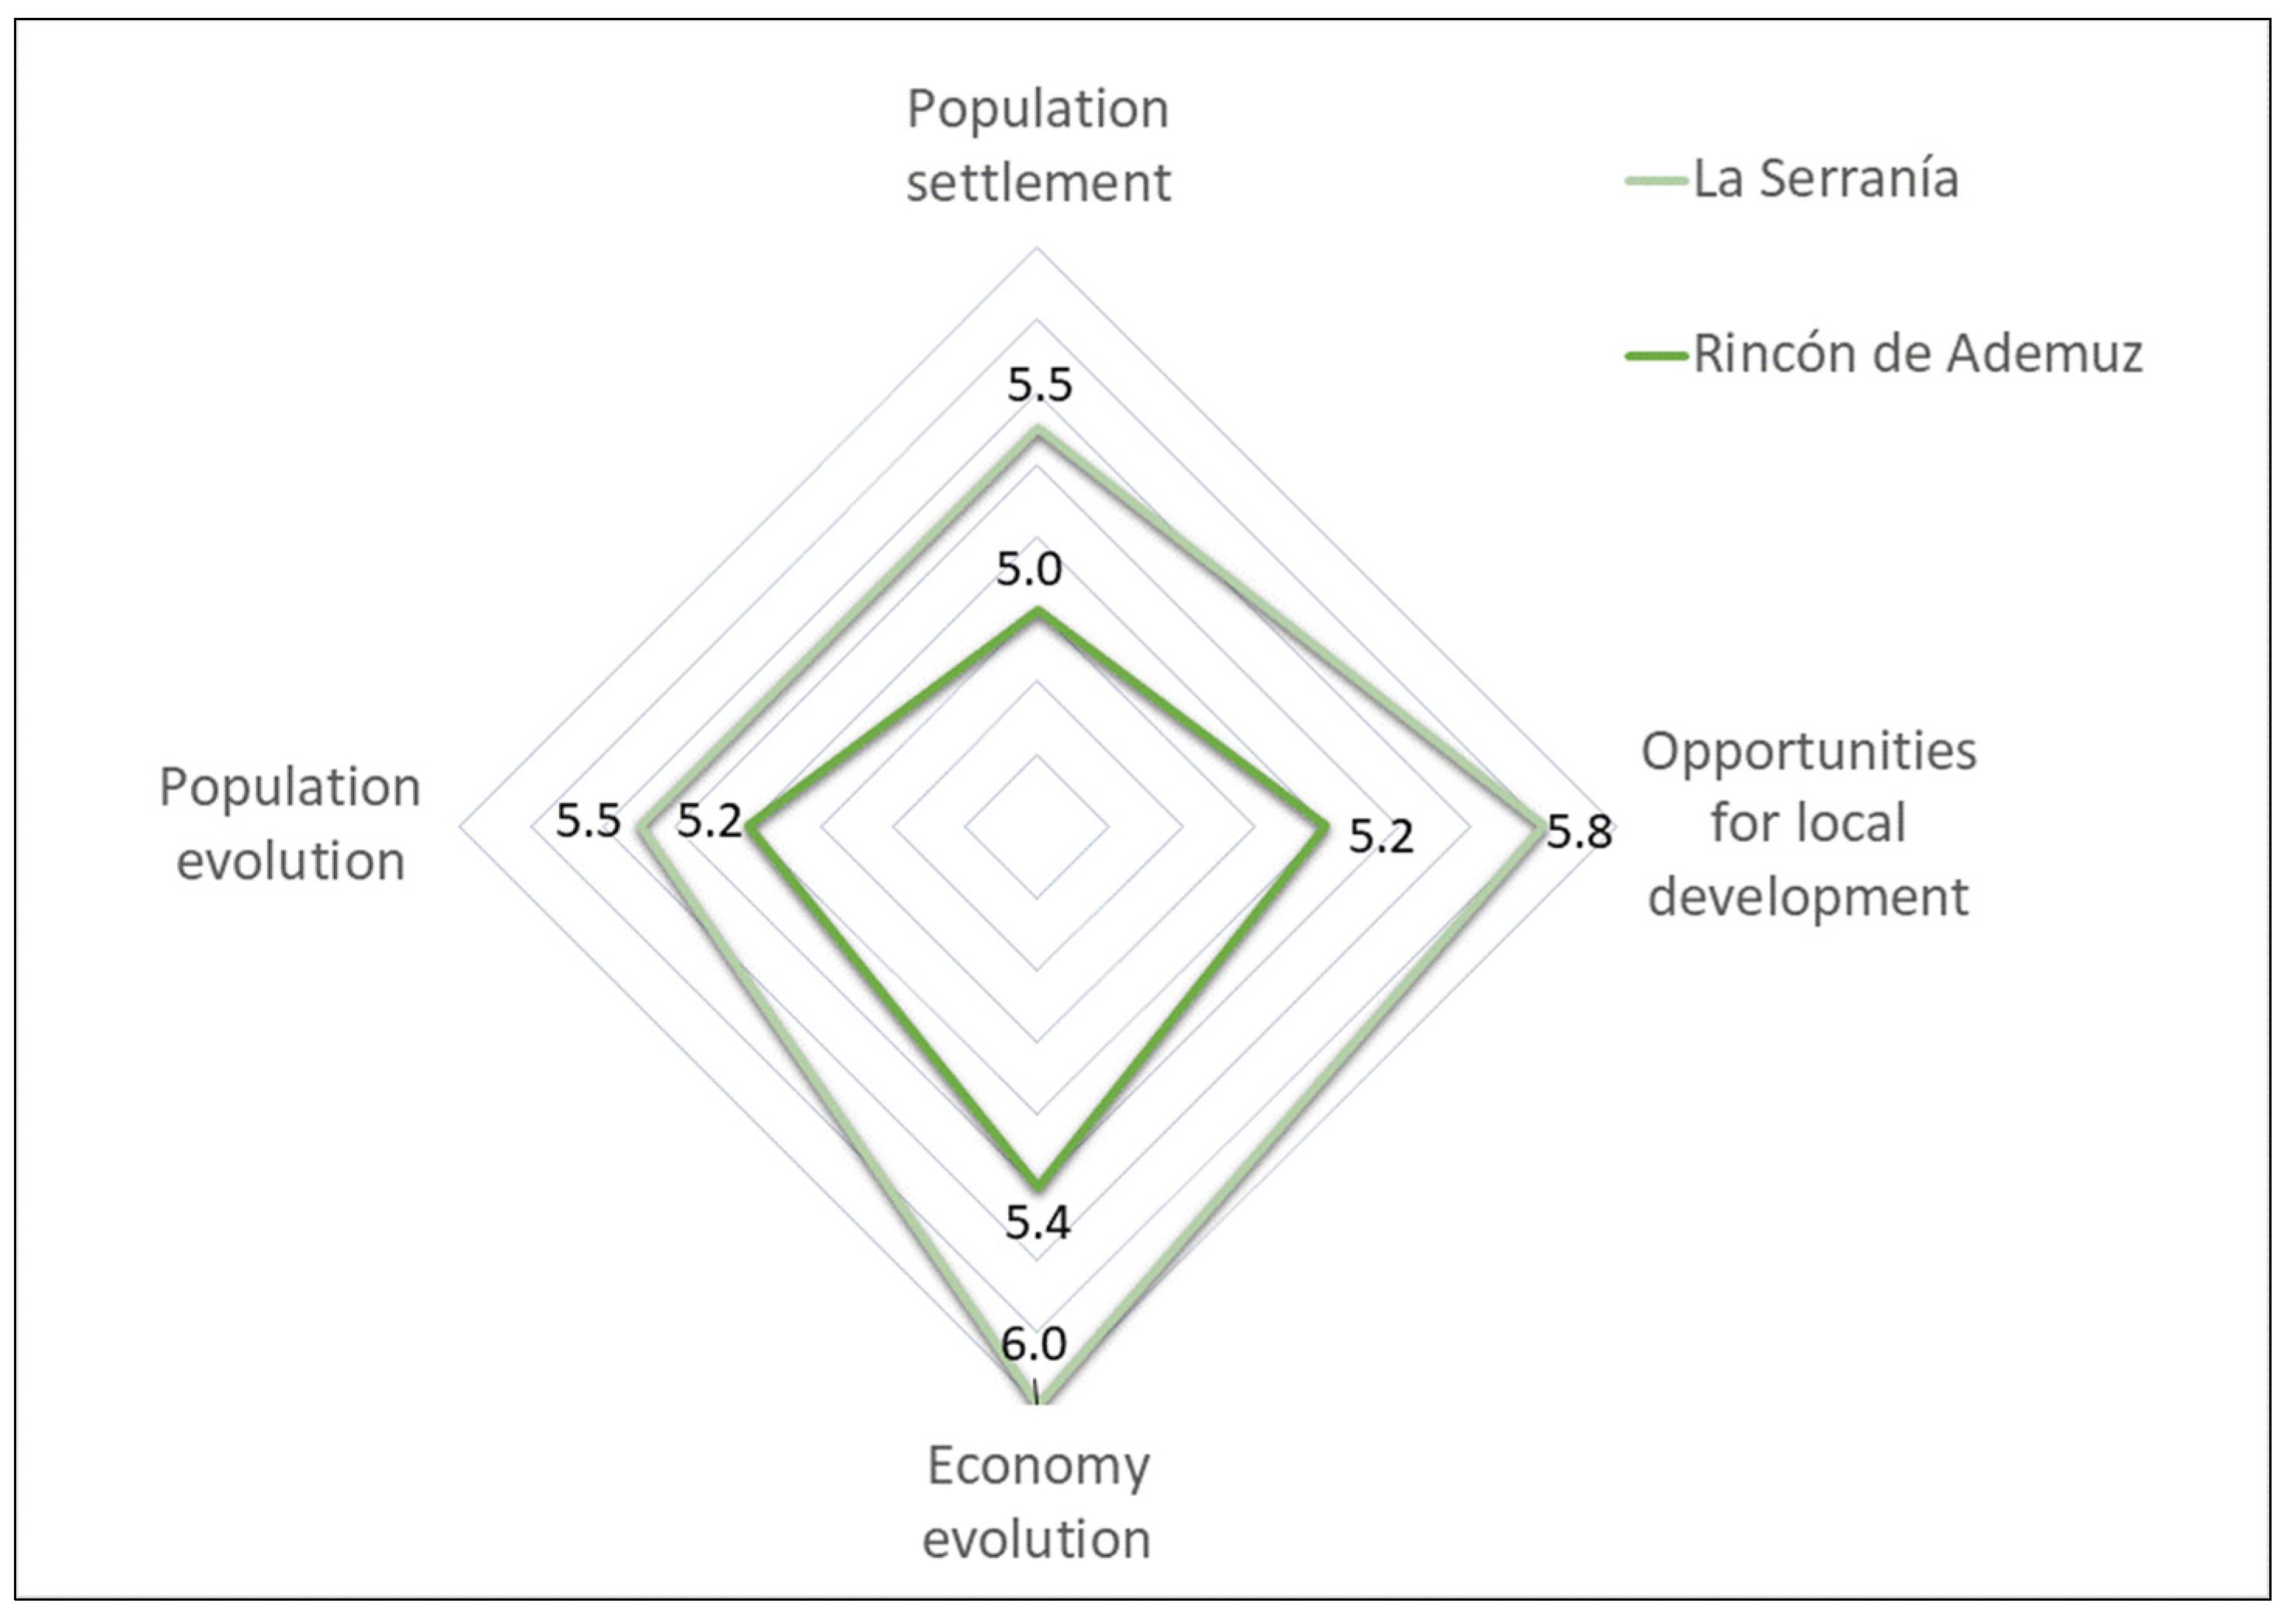
  • On the one side, the statistical data on population show that Los Serranos maintains its percentage score as regards the average regional population, slightly increasing its population density. Moreover, the dependency ratio fell in El Rincón de Ademuz and Los Serranos in the same period. Likewise, the percentage of people over 64 decreased in the first comarca and remained practically the same in the second. Finally, the crude mortality rate reversed its trend and dropped between 2017 and 2022 in both territories.
    Similarly, the AEDLs interviewed have awarded a marginal pass to the recent evolution of the population and the settlement of people in the municipalities, with values around 50–55% of their capacity (Figure 3), which is also positive. The explanation provided is that the pandemic has slowed the rate of exodus and ageing but has not stopped it. Young people continue to leave, and the population continues to be predominantly older.
    Focusing on the AEDLs’ vision in Figure 3, what stands out is that the recent evolution of the population is valued slightly lower than that of the economy. The evaluation of Los Serranos is slightly better than that of El Rincón de Ademuz for every indicator.
    According to the working hypothesis, the previous statistical analysis combined with the diagnosis of the AEDLs shows two comarcas whose ability to settle the population is less than their capacity for economic development.
  • On the other side, analysis of statistical data for employment generation also reveals some encouraging data. Between 2017 and 2022, the number of companies and the Social Security affiliation rate have risen in both comarcas. In addition, the number of unemployed people registered with the public employment service and the unemployment rate have decreased in both territories, indicating an improvement in the labour market.
    The insights into employment generation gained from certain specific subsections of the READI© matrix reveal that the “quality of job created” and “labour importation” are valued slightly better than “quantity of job created” and “labour exportation”. Therefore, a greater problem is perceived in the quantity of employment than in its quality and, likewise, a greater problem in the ability to export labour than in the ability to import.
The dimensions of the READI© methodology (Figure 4) have allowed us to complete a sociodemographic analysis of population and employment to identify the causes that explain the similarities and differences between both territories in their capacity to generate local development processes: the endowment of resources, presence of actors and generation of dynamics.
The vision offered by the READI© matrix presents a panorama of territories with scarce productive resources (more than human or economic resources), their spatial resources being the best valued. The territory with fewer economic resources and a lower quantity and variety of socioeconomic actors has developed a greater capacity for detecting actors, contacts and proposals for collaboration between agents.
However, both territories end up receiving a low valuation for the dynamics that generate methodologies and strategic plans. This is surely due to the low score given to the activity carried out by existing forums and available meeting points. It is curious to note that, in the section on dynamics, the most highly valued aspect is the capacity for territorial leadership (an average of 60%). This last result may be interpreted as the high level of willingness of the actors, faced with a challenging starting point, since this leadership does not seem to have materialised yet.
In view of the positive signs, if the trends observed continue in the future, this could be the beginning of a scenario which provides sustainable development, attracts population, generates employment and takes advantage of existing resources. This would undoubtedly be the case if the leading bodies of the process opt for strategies that respond to the needs of the territory, with the participation of the population itself, which would allow these comarcas to move towards a more beneficial situation, very close even to scenario 4 in our initial proposal (Figure 2).
The present study has some limitations, and the recognition of these should help refine future research. First, this is a complex issue that requires study over a more extended observation period. Second, although it is an exhaustive study using triangulated analysis, it is based on only two comarcas of the Valencian Community. For this reason, we are working to extend the study to other depopulated territories with similar characteristics. This research line is complementary to studying whether these trends will continue in the future in the same comarcas. Finally, the initial diagnosis lacked information from statistical sources differentiated by gender. Future research and a revised READI© matrix must incorporate the gender perspective in their indicators.
From this perspective, these comarcas are masculinised, with percentages of women around 46-47% of the population, below the regional average of 51% in the Valencian Community. In addition, this percentage of women has decreased over the period analysed (1996-2022). Likewise, the unemployment rate of women is higher than men’s (4% of gender unemployment gap). Nevertheless, women’s Social Security affiliation rates have increased in both comarcas over the last decade, standing similar to men’s in Los Serranos and higher than men’s in El Rincón de Ademuz. These examples show the importance of applying the gender perspective to the analyses of territorial indicators.
Despite the above limitations, our research provides policymakers with practical tools to understand better the causes and factors influencing the capacity for development in a territory, from local to regional level. The results of this study are intended to serve as a guide for policies to combat depopulation in rural areas. To achieve this, it is essential, on the one hand, to frame these policies within the European strategy for the rural development policy of the member states. On the other hand, it is necessary to consider the singularities of these territories that could also become areas of opportunity. As the scientific literature points out [8,9,10,11,27], it is urgent to attract population and investment to fight against depopulation and unemployment.
Finally, next steps for further investigations must be highlighted in addition to those indicated in the limitations paragraph above. The READI© matrix model forms the basis for future research by transforming the concepts into a set of measurable indicators to determine the current capacity for development of regions and territories. The empirical research here has shown the applied results of a previously validated assessment methodology so that other rural territories can implement it and benchmark themselves against peers, aiming to focus priorities for action and face development challenges successfully. Moreover, this contribution can also be of help to conceptual research on the measurement of territorial capacity and competence for development, a topic of interest among researchers and practitioners with very recent new conceptual frameworks [46], analysing the links between the territorial capacities to settle the population, on one side, and to generate employment opportunities, on the other.

Author Contributions

Conceptualisation, R.C.-P.; methodology, all authors; formal analysis, J.A.A.-H. and E.S.-S.; investigation, all authors; data curation, B.R.-M.; writing—original draft preparation, E.S.-S.; writing—review and editing, all authors; visualization, B.R.-M.; supervision, R.C.-P. and B.R.-M. All authors have read and agreed to the published version of the manuscript.

Funding

This research received no external funding.

Data Availability Statement

Data sheets are available from authors under request.

Acknowledgments

We thank the Provincial Council of Valencia (project OTR2018-18556INVES) for funding and collaborating in the original research, and we acknowledge Lecturer Carmen Zornoza for her help in preparing the cartography used in this study.

Conflicts of Interest

The authors declare no conflict of interest.

Notes

1
Comarca is a territorial unit in Spain and Latin American countries comparable to a county. It provides an accepted spatial framework and constitutes the highest administrative level for which there are complete and official statistical data (adapted from [29]).
2
The AEDLs are the technicians in charge of employment and local development policies in the territory for which they work (municipalities or groups of municipalities). The AEDL acronym is also known as ADL in Spain and is sometimes translated as Local Employment and Development Agents (instead of Officers) by some Spanish authors. This figure is described in more detail in [30].
3
Matrix registered as a product resulting from the research project code UV-MET- 202060R, developed by GRIDET—Territorial Development Research Group of the University of Valencia).
4
In this paper, capacity will be considered as “the amount that something can produce”.
5
A triangulated methodology was used in these diagnoses, combining analysis of secondary statistical sources from public administrations, in-depth interviews with socioeconomic actors in the territory and social forums for development. Twenty-eight interviews and one social forum per comarca were conducted, where 30 stakeholders participated.
6
First dimension of the matrix.
7
First variable of the dimension Resources.
8
First subsection of the variable Economic Resources.
9
Dependency ratio = [(Population aged under 16 + Population aged over 64)/(Population aged from 16 to 64)] ×100
10
Ageing index = [Population aged over 64/Population aged under 16] ×100
11
Longevity index = [Population aged over 74/Population aged over 64] ×100
12
Trend index = [Population aged under 5/Population aged from 5 to 9] ×100
13
Labour Force Renewal Index = [Population aged from 20 to 29/Population aged from 55 to 64] ×100
14
DIRCE: Central Directory of Companies of the National Institute of Statistics (INE)
15
SS affiliation rate = [Number of affiliates contributing to Social Security/Working age population (16–64)] ×100
16
See note 14 above
17
Gender unemployment gap = [Female unemployment rate—Male unemployment rate]

References

  1. Pérez Soriano, J. ¿Por qué se van? Mujeres de pueblo y desarraigo en la ruralidad valenciana. Encruc. Rev. Crítica Cienc. Soc. 2013, 6, 101–116. [Google Scholar]
  2. Del Molino, S. La España Vacía. Viaje por un país que Nunca Fue; Turner: Madrid, Spain, 2016. [Google Scholar]
  3. Margaras, V. Sparsely Populated and Under-Populated Areas [Briefing]; European Parliament: Brussels, Belgium, 2016. [Google Scholar]
  4. Pinilla, V.; Sáez, L.A. La Despoblación Rural en España: Génesis de un problema y políticas innovadoras. Inf. CEDDAR 2017, 2, 1–24. [Google Scholar]
  5. Delgado Viñas, C. Depopulation Processes in European Rural Areas: A Case Study of Cantabria (Spain). Eur. Countrys. 2019, 11, 341–369. [Google Scholar] [CrossRef]
  6. Bandrés Moliné, E.; Azón Puértolas, V. La España despoblada: Tendencias recientes. Economistas 2023, 181, 266–273. [Google Scholar]
  7. Rizzo, A. Declining, transition and slow rural territories in southern Italy Characterizing the intra-rural divides. Eur. Plan. Stud. 2016, 24, 231–253. [Google Scholar] [CrossRef]
  8. de Almeida, M.A.P. Territorial inequalities: Depopulation and local development policies in the portuguese rural world. AGER Rev. Estud. Sobre Despoblación Desarro. Rural 2017, 22, 61–87. [Google Scholar] [CrossRef]
  9. Reynaud, C.; Miccoli, S. Depopulation and the Aging Population: The Relationship in Italian Municipalities. Sustainability 2018, 10, 1004. [Google Scholar] [CrossRef]
  10. Benassi, F.; Busetta, A.; Gallo, G.; Stranges, M. Local Heterogeneities in Population Growth and Decline. A Spatial Analysis of Italian Municipalities. In Springer Proceedings in Mathematics and Statistics; Salvati, N., Perna, C., Marchetti, S., Chambers, R., Eds.; Springer: Cham, Switzerland, 2022; Volume 406, pp. 297–314. [Google Scholar] [CrossRef]
  11. Delgado Viñas, C. Population dynamics of Spanish mountain areas: Case study of two regions in the Cantabrian Mountains (Spain). J. Settlements Spat. Plan. 2013, 2, 207–217. [Google Scholar]
  12. Johnson, K.M.; Lichter, D.T. Rural Depopulation: Growth and Decline Processes over the Past Century. Rural Sociol. 2019, 84, 3–27. [Google Scholar] [CrossRef]
  13. Labianca, M.; Navarro Valverde, F. Depopulation and aging in rural areas in the European Union: Practices starting from the LEADER approach. Perspect. Rural Dev. 2019, 223–252. [Google Scholar] [CrossRef]
  14. Lutz, W.; Gailey, N. Depopulation as a Policy Challenge in the Context of Global Demographic Trends; UNDP Serbia: Beograd, Serbia, 2020; ISBN 978-86-7728-292-9. [Google Scholar]
  15. Cejudo García, E.; Navarro Valverde, F.A. (Eds.) Despoblación y Mundo Rural Europeo Mediterráneo: El Caso de Andalucía; Tirant Humanidades: Valencia, Spain, 2023; ISBN 978-84-19226-37-2. [Google Scholar]
  16. Nieto Masot, A.; Cárdenas Alonso, G.; Engelmo Moriche, Á. Spatial Analysis of the Rural-Urban Structure of the Spanish Municipalities. ISPRS Int. J. Geo-Inf. 2020, 9, 213. [Google Scholar] [CrossRef]
  17. De Cos Guerra, O. Spatiotemporal patterns of population in Spain (1998–2021). Population decreasing nuances in a bipolar system. Investig. Reg. 2023, 56, 69–89. [Google Scholar] [CrossRef]
  18. Hermosilla, J. (Ed.) Territori i Ocupació. Desenvolupament Territorial i Mercal de Treball Valencià; Universitat de València: Valencia, Spain, 2018. [Google Scholar]
  19. Ruiz Pulpón, Á.R.; Cañizares Ruiz, M.d.C. Enhancing the Territorial Heritage of Declining Rural Areas in Spain: Towards Integrating Top-Down and Bottom-Up Approaches. Land 2020, 9, 216. [Google Scholar] [CrossRef]
  20. Rodríguez-del Pino, J.A.; Sigalat-Signes, E.; Calvo-Palomares, R. Weaknesses and Threats Around the Depopulation of Two Valencian Rural Regions: A Challenge for Local Development. Ciudad Territ. Estud. Territ. 2021, 53, 391–404. [Google Scholar] [CrossRef]
  21. Czubala Ostapiuk, M.R.; Puente Regidor, M.; Corullon Hermosa, C. Depopulation in Spain: Next Generation EU as a stimulus to accelerate the transformation. J. Lib. Int. Aff. 2022, 8, 211–228. [Google Scholar] [CrossRef]
  22. Izquierdo Ramírez, B. International Migration, Occupation and Rural Settlement: An Imperfect Equation. Recer. Rev. Pensam. Anàlisi 2023, 28, 1–23. [Google Scholar]
  23. Rodríguez Escanciano, S. Despoblación, Envejecimiento y Servicios Públicos de Cuidado: Apostando por los Empleos Verdes; Thomson Reuters Aranzadi: Cizur Menor, Spain, 2023; ISBN 978-84-1163-378-9. [Google Scholar]
  24. Zhang, M.; Tan, S.; Zhang, Y.; He, J.; Ni, Q. Does land transfer promote the development of new-type urbanization? New evidence from urban agglomerations in the middle reaches of the Yangtze River. Ecol. Indic. 2022, 136, 108705. [Google Scholar] [CrossRef]
  25. Cejudo García, E.; Navarro Valverde, F. La despoblación rural como reto social. Algunos apuntes. Perspect. Rural Dev. 2019, 3, 17–40. [Google Scholar] [CrossRef]
  26. Pinilla, V.; Sáez, L.A. What Do Public Policies Teach us About Rural Depopulation: The Case Study of Spain. Eur. Countrys. 2021, 13, 330–351. [Google Scholar] [CrossRef]
  27. Feurich, M.; Kourilova, J.; Pelucha, M.; Kasabov, E. Bridging the urban-rural digital divide: Taxonomy of the best practice and critical reflection of the EU countries’ approach. Eur. Plan. Stud. 2023, 1–23. [Google Scholar] [CrossRef]
  28. Kalra, A.; Chaker, N.N.; Singh, R.; Itani, O.S.; Agnihotri, R. A desire for success: Exploring the roles of personal and job resources in determining the outcomes of salesperson social media use. Ind. Mark. Manag. 2023, 113, 202–214. [Google Scholar] [CrossRef]
  29. Brenner, J.; Jimenez, J.A.; Sardá, R. Definition of Homogeneous Environmental Management Units for the Catalan Coast. Environ. Manag. 2006, 38, 993–1005. [Google Scholar] [CrossRef]
  30. Calvo Palomares, R. AEDL (Agente de Empleo y Desarrollo Local): Una Aproximación Sociológica Al Estudio de Una Nueva Profesión. Ph.D. Dissertation, Universitat de València, Valencia, Spain, 2011. [Google Scholar]
  31. Calvo-Palomares, R.; Aguado-Hernández, J.A.; Sigalat-Signes, E.; Roig-Merino, B. A New Methodology to Assess Territorial Competence for Sustainable Local Development: The READI® (Resources-Actors-Dynamics) Matrix. Sustainability 2021, 13, 6022. [Google Scholar] [CrossRef]
  32. Bielza, V. El Desarrollo Local Endógeno en las Zonas de Baja Densidad de la Europa Suroccidental; CIOT: Zaragoza, Spain, 2003. [Google Scholar]
  33. INE-National Statistics Institute. Available online: https://www.ine.es/ (accessed on 15 June 2023).
  34. IVE-Valencian Institute of Statistics. Available online: https://pegv.gva.es/es/ (accessed on 15 June 2023).
  35. LABORA-Valencian Employment and Training Service. Available online: https://visor.gva.es/visor/ (accessed on 15 June 2023).
  36. Calvo, R.; Sigalat, E.; Aguado, J.A. READI. Una Herramienta para la Autoevaluación de los Territorios; Tirant lo Blanch: Valencia, Spain, 2021. [Google Scholar]
  37. Sigalat Signes, E.; Calvo Palomares, R.; Aguado Hernández, J.A.; Payá Castiblanque, R. Validity of an instrument to measure territorial competence. Matrix READI matrix for the self-assessment of competent territories. Cuad. Geográficos 2021, 60, 31–51. [Google Scholar] [CrossRef]
  38. Argos-Generalitat Valenciana Municipality Database. Available online: http://www.argos.gva.es/bdmun/pls/argos_mun/DMEDB_UTIL.INDEXC (accessed on 6 June 2023).
  39. SEPE-State Public Employment Service. Available online: https://www.sepe.es/ (accessed on 15 June 2023).
  40. Spanish Social Security Statistics. Available online: https://www.seg-social.es/wps/portal/wss/internet/EstadisticasPresupuestosEstudios/Estadisticas (accessed on 15 June 2023).
  41. Esparcia Pérez, J.; Pastor Gradolí, C. Alternativas económicas en el ámbito rural interior: El papel de las mujeres en el desarrollo rural. Cuad. Geogr. 1998, 64, 527–542. [Google Scholar]
  42. Rey, A.D.; José, M.C.; Ortega, A. Despoblamiento y envejecimiento en Castilla y León durante el siglo XX: Análisis a través de la emigración femenina y la pérdida de nacimientos. AGER Rev. Estud. Sobre Despoblación Desarro. Rural 2009, 8, 113–149. [Google Scholar]
  43. Zonneveld, W.; Stead, D. European territorial cooperation and the concept of urban—Rural relationships. Plan. Pract. Res. 2007, 22, 439–453. [Google Scholar] [CrossRef]
  44. Barreiro Cavestany, F. Desarrollo Desde el Territorio (A Propósito del Desarrollo Local); Instituto Internacional de Gobernabilidad, Biblioteca de Ideas: Barcelona, Spain, 2000; p. 28. [Google Scholar]
  45. Gallicchio, E. El desarrollo económico local. Estrategia económica y de construcción de capital social. ECA Estud. Centroam. 2003, 58, 1003–1013. [Google Scholar] [CrossRef]
  46. Fric, U.; O’Gorman, W.; Rončević, B. Strategic Competence Model for Understanding Smart Territorial Development. Societies 2023, 13, 76. [Google Scholar] [CrossRef]
Figure 1. Geographical location and population of the municipalities in the territories analysed. Source: Prepared by the authors from INE-National Statistics Institute.
Land 12 01773 g001
Figure 2. Possible scenarios in the diagnosis of a territory’s capacities for development: settling its population and generating employment. Source: Adapted from [20].
Land 12 01773 g002
Figure 3. The vision of the AEDLs on the evolution of the population and economy of each comarca with respect to its development capacity. Source: Prepared by the authors, based on ad hoc questionnaires (scale from 0 to 10, where 10 = 100% of the territory’s capacity).
Land 12 01773 g003
Figure 4. (A) Summary with the scores of each comarca in the main dimensions of the READI© matrix. (BD) Detail with the scores in the variables of each dimension. Source: Prepared by the authors, based on ad hoc questionnaires (scale from 0 to 10, where 10 = 100% of the territory’s capacity).
Land 12 01773 g004
Table 1. READI© matrix final proposal: dimensions, variables and subsections.
 MATRIX Summary—Resources, Actors and Dynamics Scores
  RESOURCES6200
   ECONOMIC7
   Own funding sources815
   External funding sources (public)10
   External funding sources (public–private)10
   External funding sources (private)10
   Interest in and seeking participation in European projects5
   PRODUCTIVE
   Quantity of employment generated15
   Quality of employment generated20
   Productive fabric10
   Productive sectors (quantity)5
   Size of companies5
   HUMAN
   Average education level of the population 10
   Labour migration balance (local employment system)10
   SPATIAL
   Natural resources10
   Tourism resources10
   Cultural resources10
   Production resources15
   Geographical location 10
   Infrastructure10
  ACTORS150
   Specific resources for development25
   Presence of socioeconomic actors25
   Presence of a variety of socioeconomic actors25
   Detection, study and analysis process20
   Contact process and collaboration proposals30
   Results obtained25
  DYNAMICS150
   Forums and meeting points30
   Types of forum and meeting points20
   Territorial leadership25
   Socio-institutional networks at local level25
   Methodologies and strategic plans25
   Joint vision of territorial development25
   TOTAL MAXIMUM SCORE500
Source: [31].
Table 2. Recent evolution of sociodemographic indicators for both comarcas.
Indicators (in Parentheses the Year of the Beginning of the Series for Each Indicator)El Rincón de AdemuzLa SerraníaValencian
Community
DemographicsStart of Series20172021/2022Start of Series20172021/20222021/2022
Population (1996)30132289218917,16916,23716,6045,097,967
Population percentage over the Valencian Community population (%) (1996)0.080.050.040.430.330.33
Density (inhabitants/km2) (1996)8.16.25.912.211.611.8219.2
Children under 16 (%) (2001)9.312.211.110.511.110.815.0
Older than 64 (%) (2001)35.530.829.727.527.727.720.0
Women (%) (1996)48.847.046.249.147.547.450.8
Dependency ratio9 (2001)81.075.368.861.463.462.754.6
Ageing index10 (2002)380.30252.30263.30264.70248.80251.00128.9
Longevity index11 (2002)52.0061.9064.5049.0053.8053.9048.1
Trend index12 (2002)102.759.680.067.781.277.981.4
Labour Force Renewal Index13 (2002)86.759.354.1114.368.760.674.9
Crude birth rate (‰) (2010) 7.25.04.97.06.35.57.1
Total fertility rate (‰) (2010)37.4330.2631.8534.8835.6831.3632.52
Crude mortality rate (‰) (2010) 17.620.119.312.614.714.39.9
Life expectancy at birth (men) (2010)78.477.978.479.379.980.279.5
Life expectancy at birth (women) (2010)84.283.683.884.584.985.085.0
CompaniesStart of series20172021/2022Start of series20172021/20222021/2022
No. of companies (DIRCE14) (2012)1801741621.0841.0051.029370.645
No. of companies registered with Social Security (2012)645875408435459150.491
EmploymentStart of Series20172021/2022Start of Series20172021/20222021/2022
Registered unemployment (No. of people) (1996)1341311237011.092883338.243
Unemployment rate (%) (2006)5.99.69.36.210.88.710.3
Registered new contracts (2007)1188770278275240104.916
SS affiliation rate15 (%) (2012)29.832.434.632.538.143.961.0
Women’s SS affiliation rate (%) (2012)39.2 40.743.439.9 39.642.7 46.3
Source: Own elaboration from [33,34,35,38,39,40].
Disclaimer/Publisher’s Note: The statements, opinions and data contained in all publications are solely those of the individual author(s) and contributor(s) and not of MDPI and/or the editor(s). MDPI and/or the editor(s) disclaim responsibility for any injury to people or property resulting from any ideas, methods, instructions or products referred to in the content.

