
Phytoplankton in the Ecological Assessment of the Mining Facilities Influence on the Anabar River in the Permafrost Zone of the Arctic, Eastern Siberia, Russia


Abstract
:1. Introduction
2. Materials and Methods
2.1. Description of Study Site
2.2. Sampling and Laboratory Study
3. Results
3.1. Water Chemistry
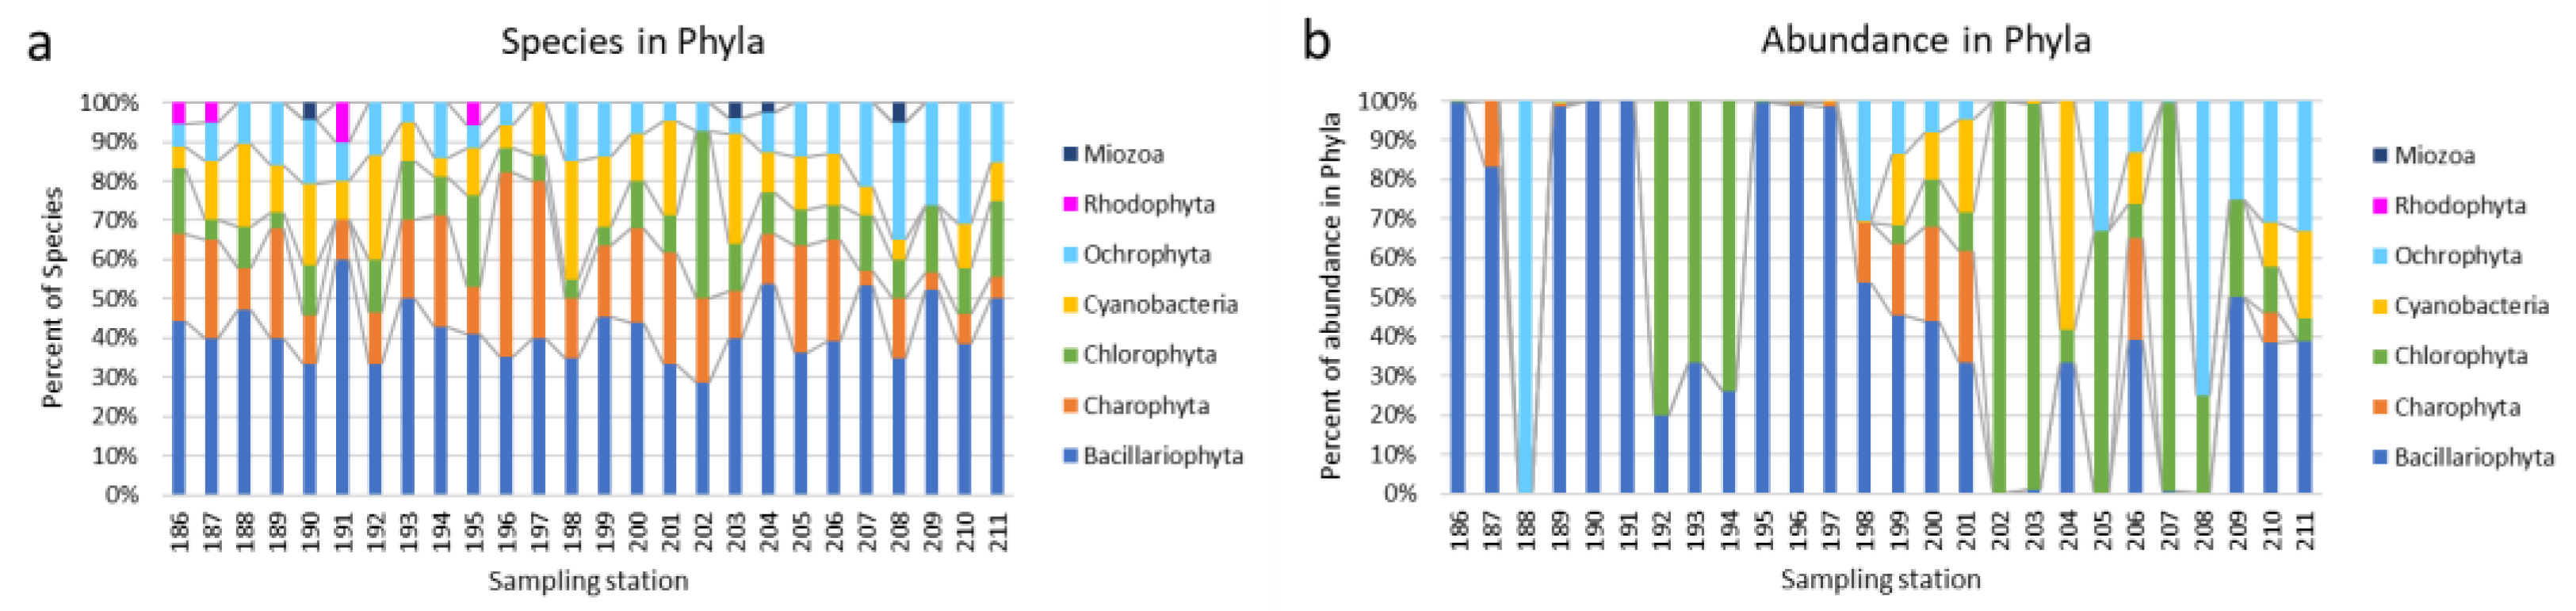
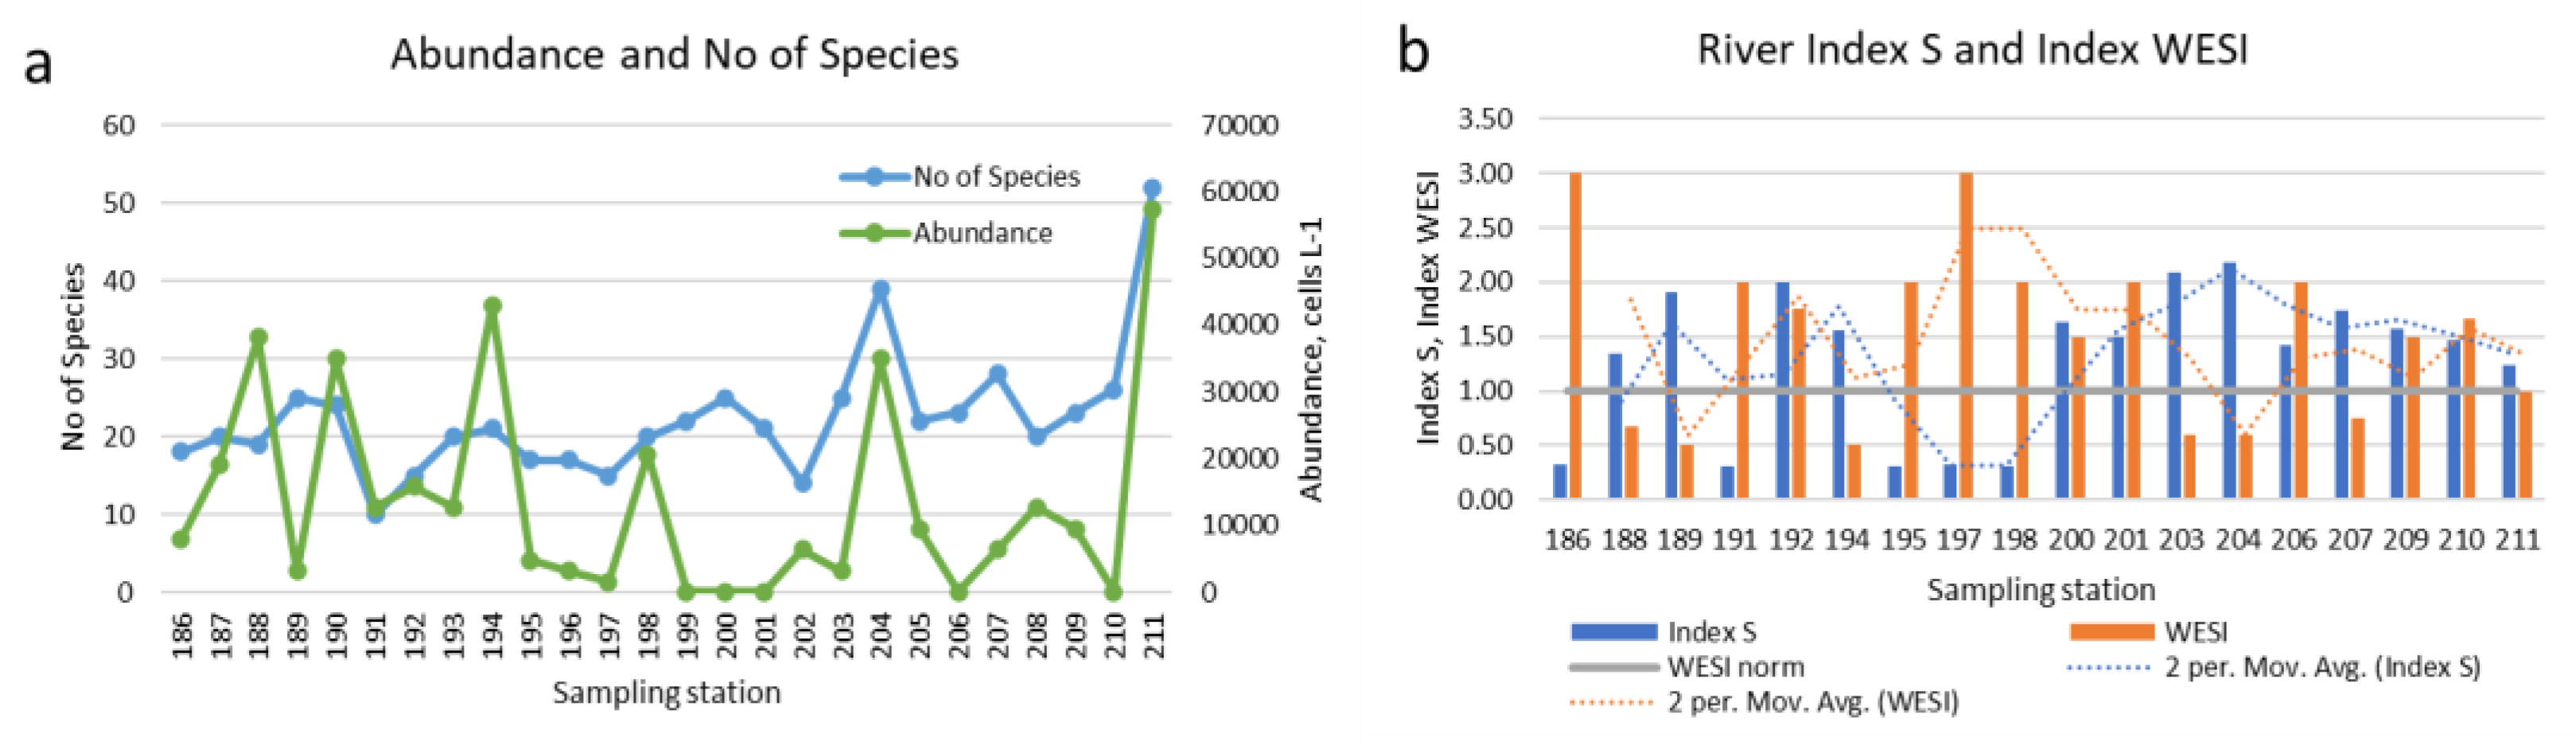
3.2. Biological Variables
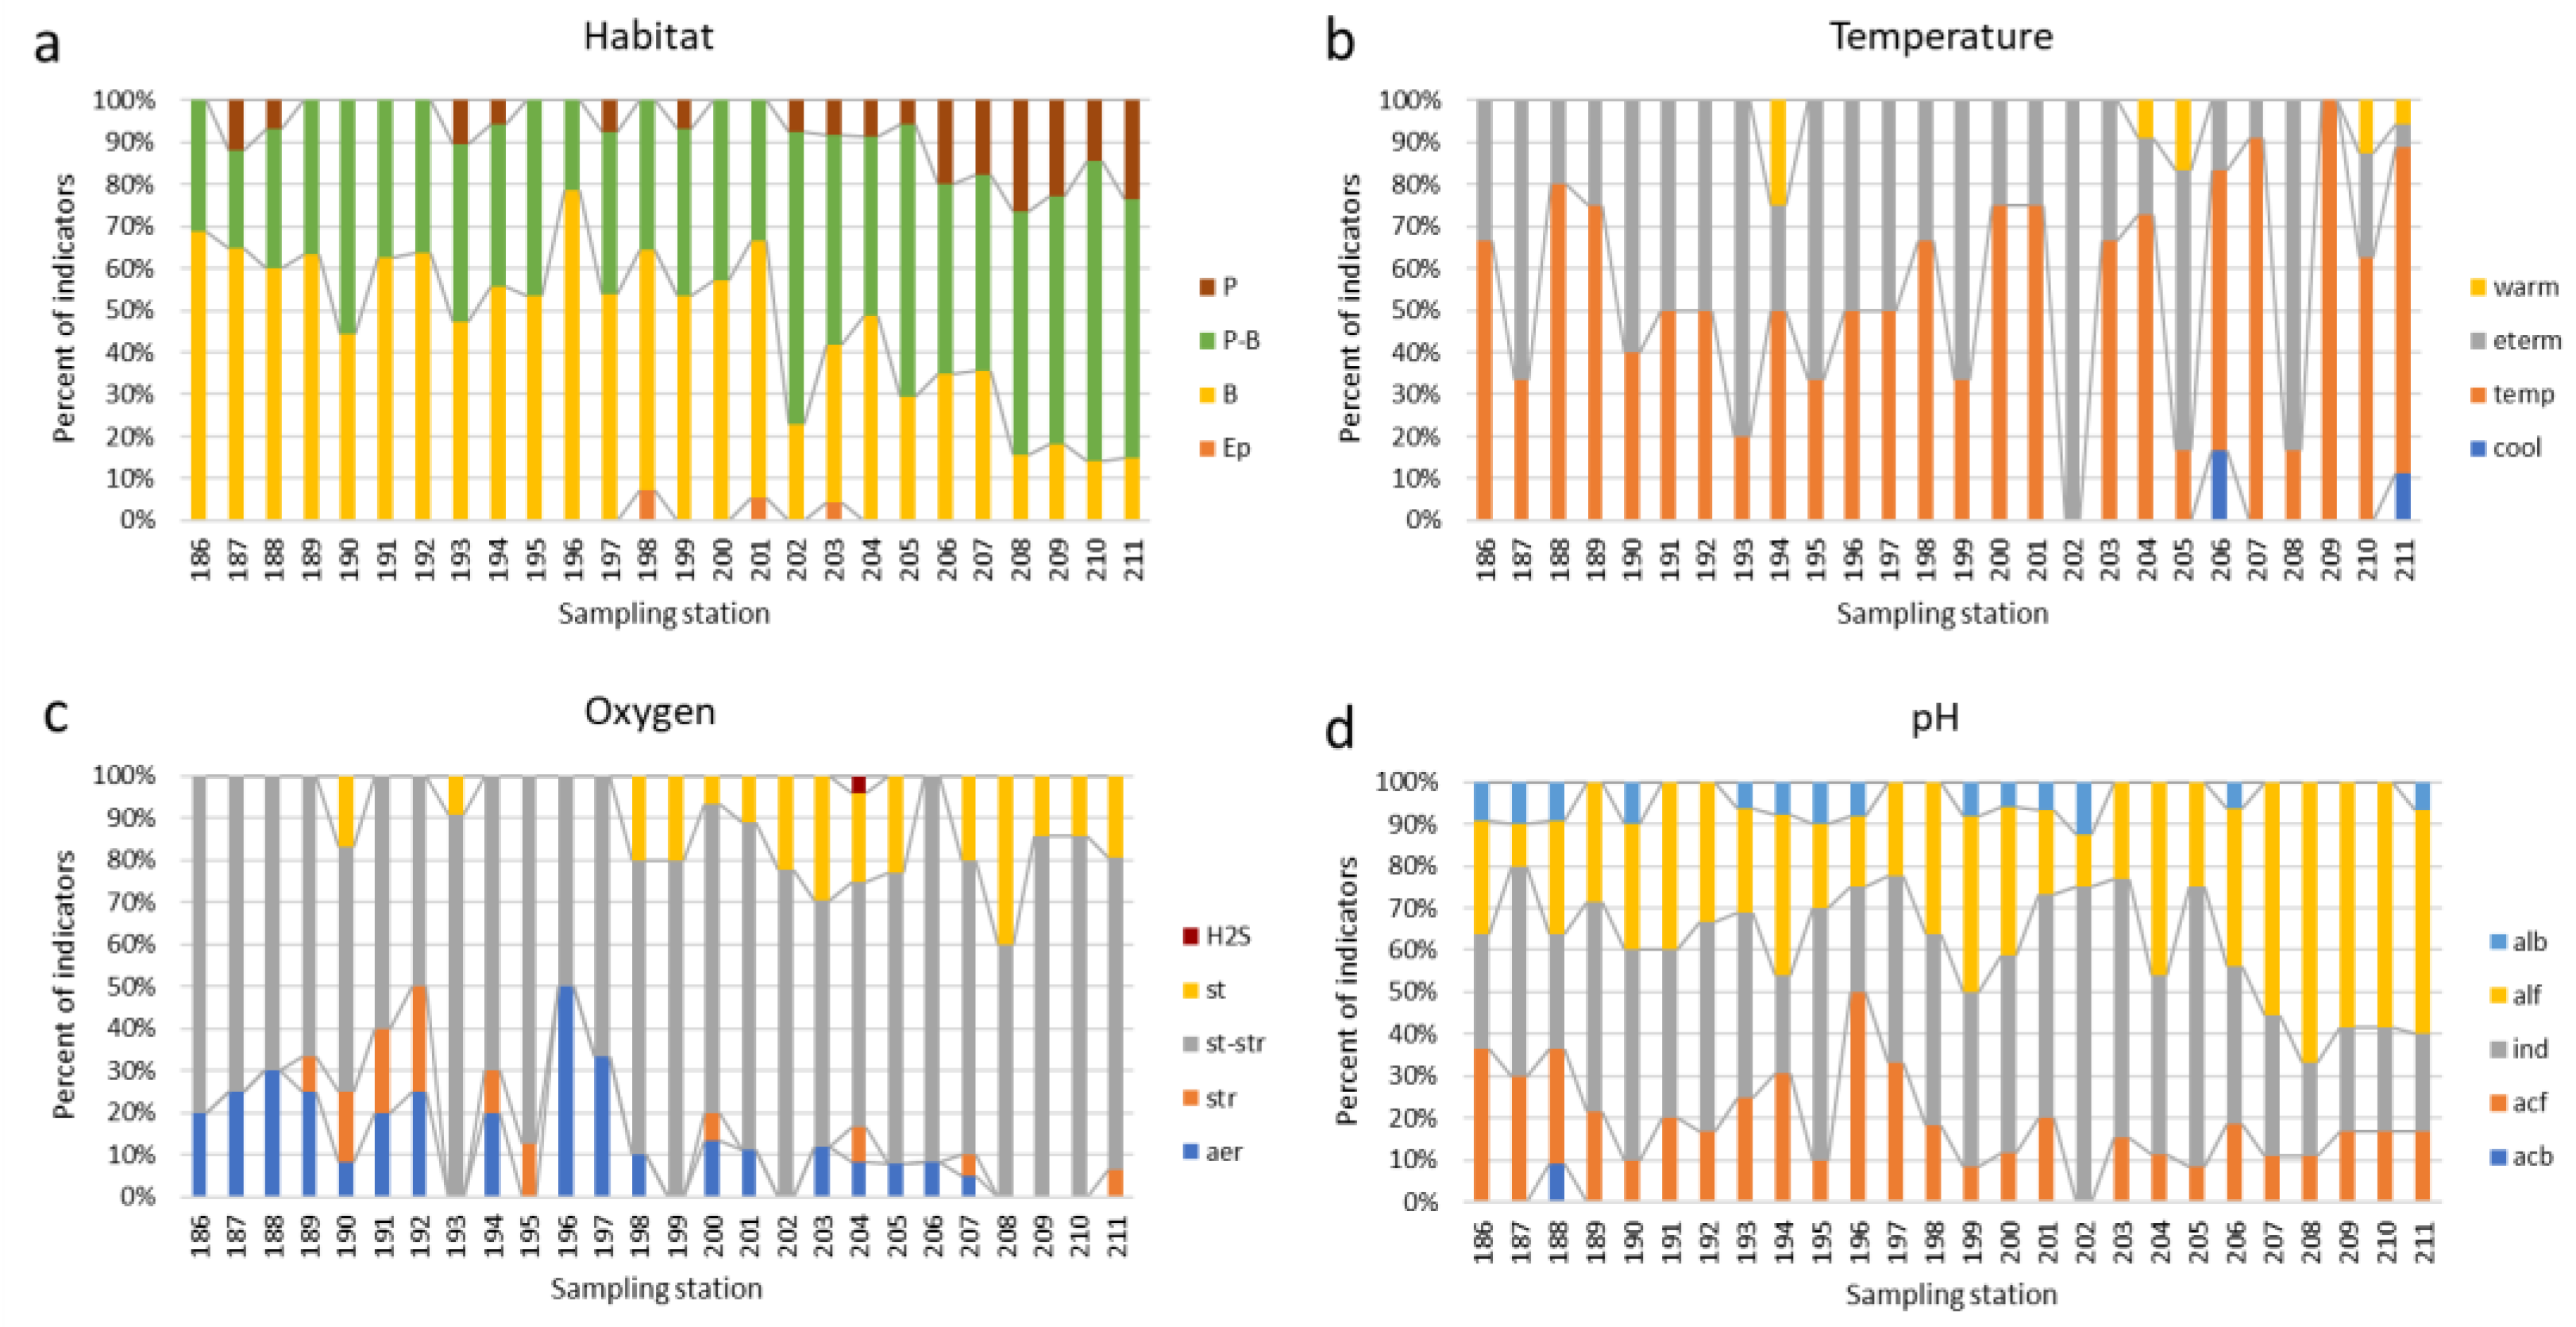
3.3. Bioindicators
3.4. Ecological Mapping
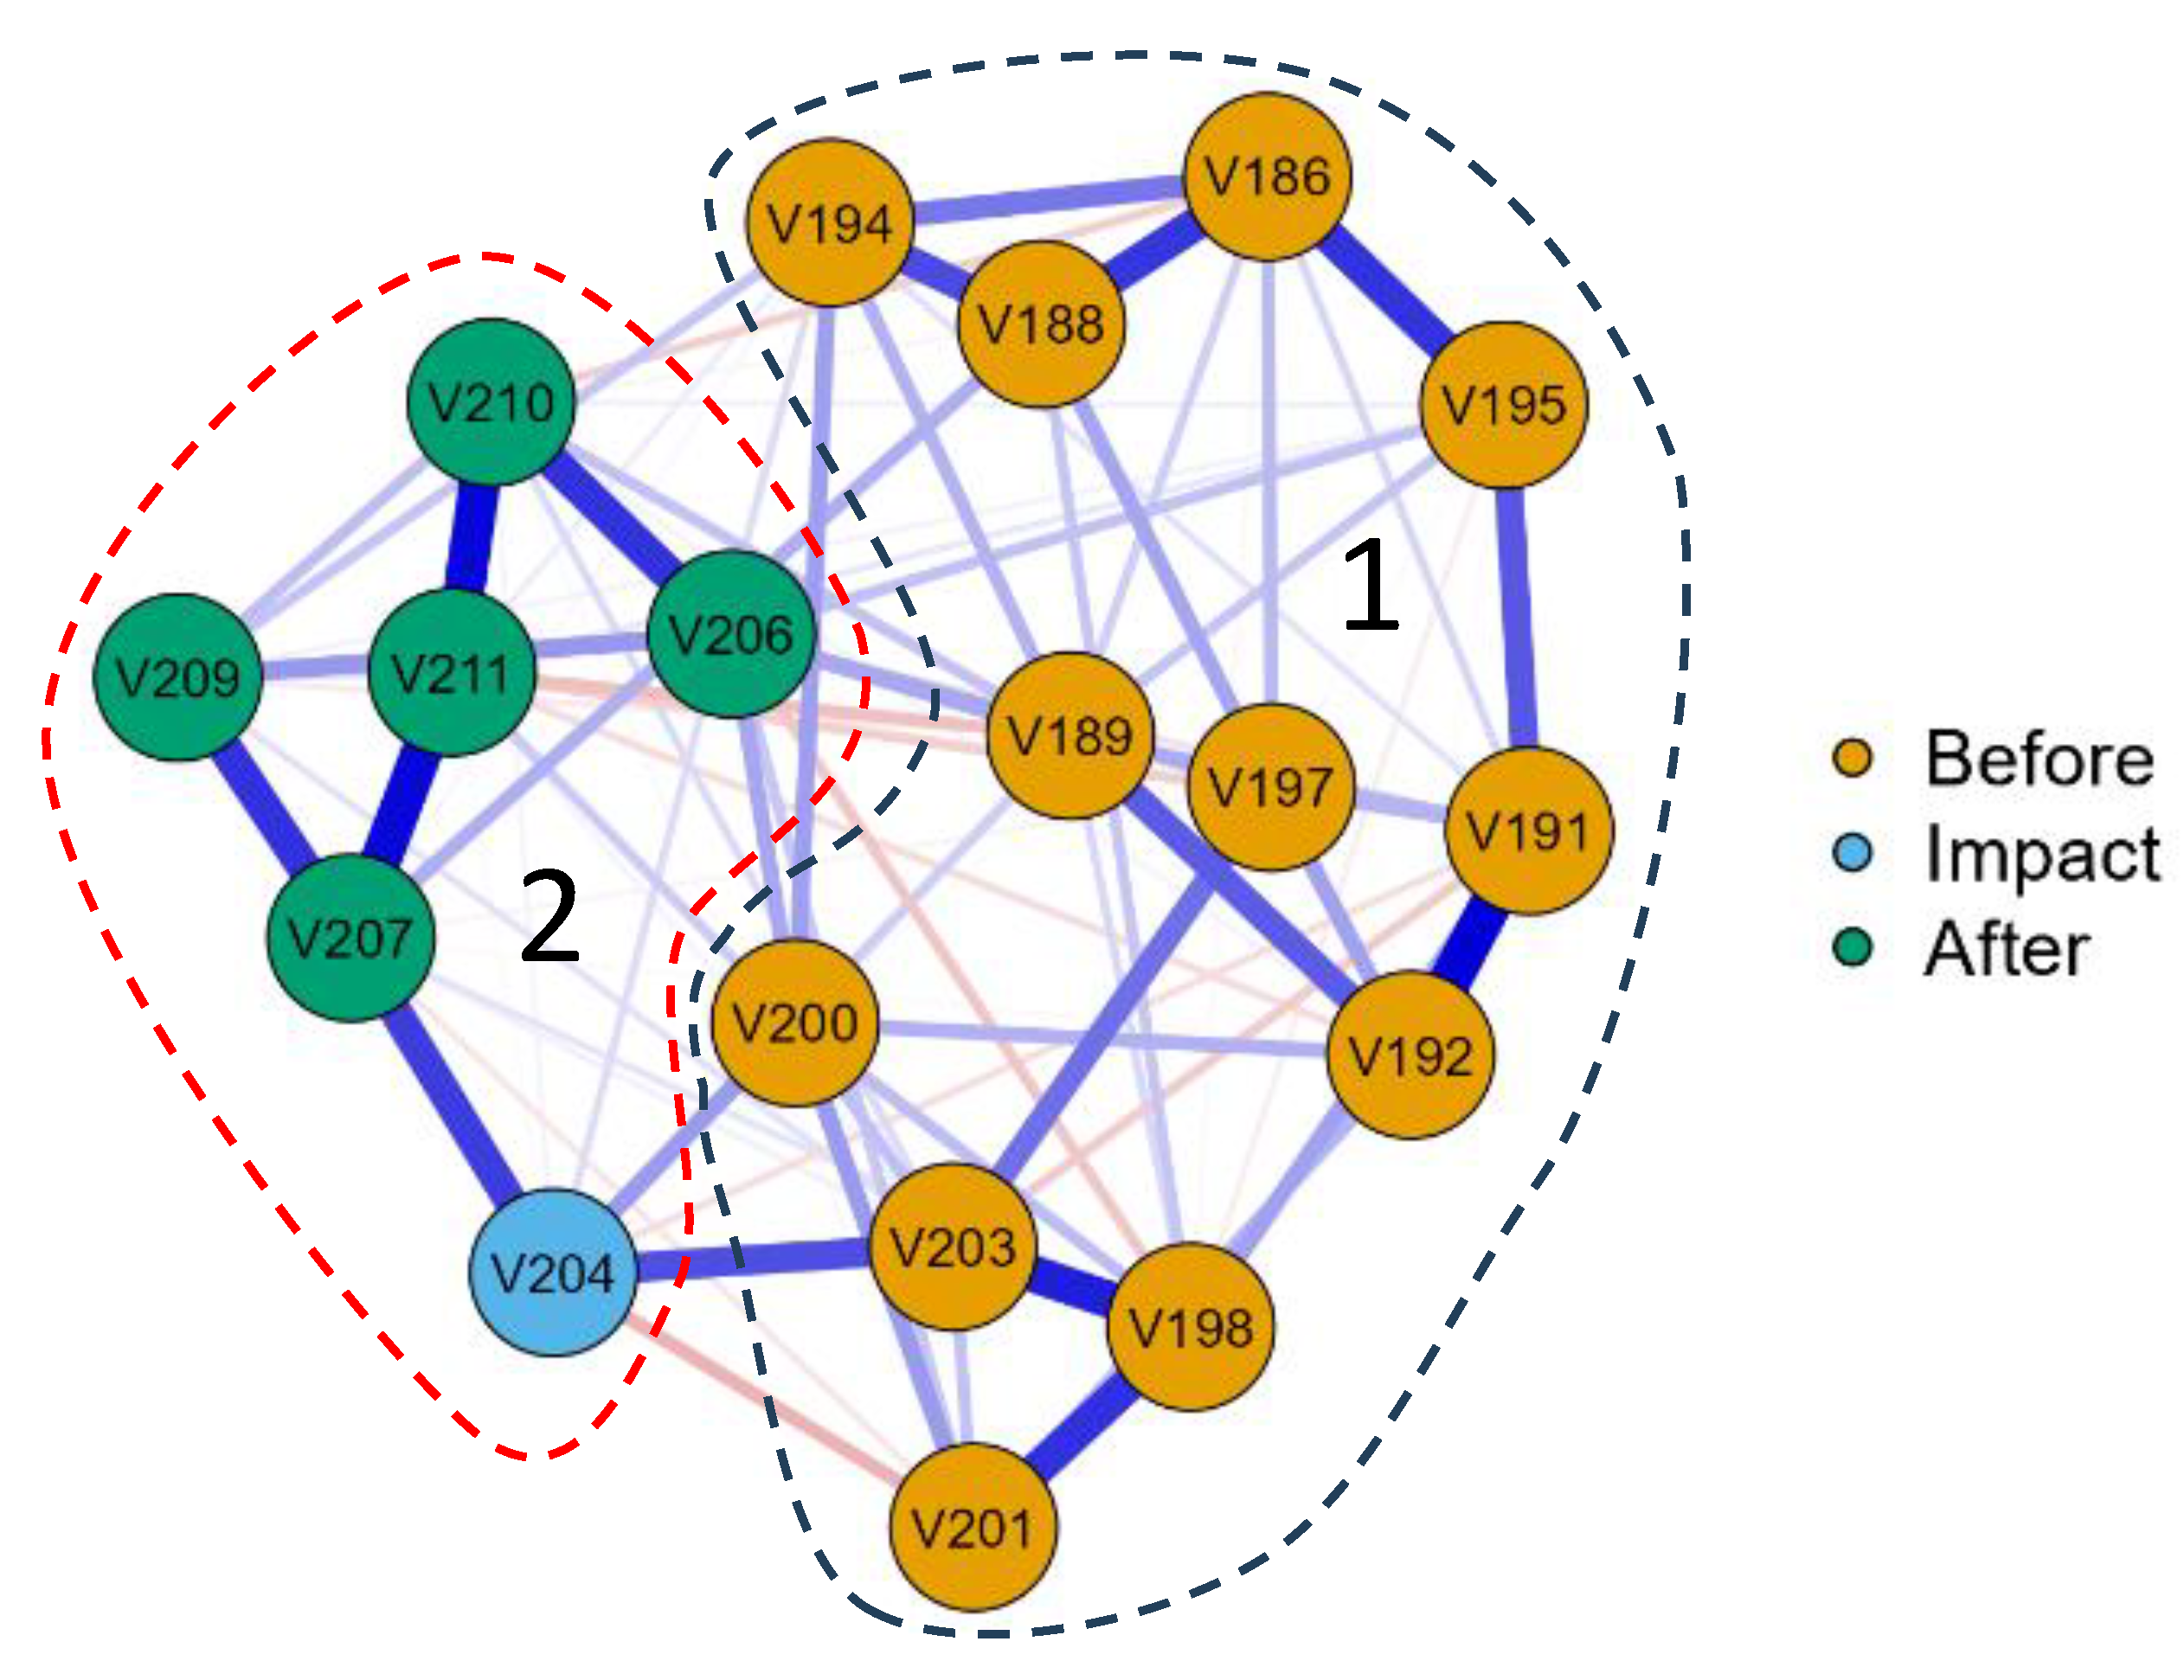
3.5. Cluster Analysis
3.6. Biological and Environmental Variables Relationships with RDA
4. Discussion
5. Conclusions
Author Contributions
Funding
Institutional Review Board Statement
Informed Consent Statement
Data Availability Statement
Acknowledgments
Conflicts of Interest
Appendix A

| Sampling Station | 186 | 187 | 188 | 189 | 190 | 191 | 192 | 193 | 194 | 195 | 196 | 197 | 198 | 199 | 200 | 201 | 202 | 203 | 204 | 205 | 206 | 207 | 208 | 209 | 210 | 211 |
|---|---|---|---|---|---|---|---|---|---|---|---|---|---|---|---|---|---|---|---|---|---|---|---|---|---|---|
| NO2, mg L−1 | 0.01 | 0.03 | 0.00 | 0.01 | 0.00 | 0.02 | 0.00 | 0.00 | 0.00 | 0.01 | 0.00 | 0.00 | 0.01 | 0.00 | 0.00 | 0.01 | 0.00 | 0.00 | 0.00 | 0.00 | 0.01 | 0.01 | 0.01 | 0.01 | 0.00 | 0.00 |
| Temperature, °C | 9.70 | 12.20 | 11.70 | 13.80 | 10.30 | 11.00 | 11.20 | 8.90 | 9.00 | 11.00 | 11.70 | 11.50 | 11.20 | 10.60 | 10.80 | 11.20 | 14.80 | 12.60 | 10.40 | 11.70 | 11.60 | 11.20 | 11.00 | 10.90 | 10.00 | 8.00 |
| Transparency, m | 2.50 | 2.50 | 2.50 | 2.50 | 2.50 | 2.50 | 2.50 | 2.50 | 2.50 | 2.50 | 2.50 | 2.50 | 2.50 | 2.50 | 2.50 | 2.50 | 2.50 | 2.50 | 0.30 | 0.40 | 0.50 | 0.60 | 0.70 | 0.80 | 0.90 | 1.00 |
| Depth, m | 1.25 | 1.30 | 1.35 | 1.50 | 1.50 | 1.55 | 1.45 | 1.20 | 1.50 | 1.55 | 1.10 | 1.60 | 1.80 | 1.10 | 2.00 | 2.00 | 1.30 | 2.00 | 1.70 | 1.00 | 1.80 | 1.80 | 0.80 | 2.00 | 2.50 | 10.00 |
| pH | 8.21 | 8.26 | 8.27 | 8.29 | 8.29 | 8.34 | 8.05 | 8.46 | 8.42 | 8.45 | 8.50 | 8.45 | 8.44 | 8.64 | 8.48 | 8.45 | 8.67 | 8.70 | 8.55 | 8.44 | 8.46 | 8.60 | 8.40 | 8.54 | 8.53 | 8.63 |
| O2, mg L−1 | 8.10 | 6.40 | 7.10 | 7.20 | 7.20 | 7.80 | 6.80 | 7.70 | 8.10 | 8.20 | 8.10 | 8.20 | 7.80 | 8.10 | 7.80 | 6.90 | 6.85 | 7.25 | 6.00 | 6.50 | 7.30 | 7.60 | 7.70 | 8.00 | 6.80 | 7.80 |
| CO2, mg L−1 | 8.80 | 5.28 | 5.72 | 6.60 | 3.96 | 5.28 | 6.16 | 3.52 | 3.96 | 4.84 | 3.96 | 4.84 | 4.40 | 2.64 | 3.08 | 3.52 | 4.40 | 3.08 | 3.52 | 3.52 | 4.40 | 3.08 | 3.96 | 3.52 | 2.64 | 3.52 |
| TDS, mg L−1 | 15.98 | 18.59 | 19.32 | 18.68 | 15.65 | 17.52 | 23.70 | 15.47 | 18.55 | 13.77 | 26.75 | 23.39 | 26.25 | 56.28 | 39.89 | 34.02 | 147.87 | 121.47 | 61.31 | 41.24 | 48.95 | 66.45 | 43.12 | 58.11 | 54.75 | 100.55 |
| NH4, mg L−1 | 0.24 | 0.52 | 0.78 | 0.42 | 0.32 | 0.32 | 0.42 | 0.24 | 0.24 | 0.42 | 0.48 | 0.48 | 0.48 | 0.48 | 0.48 | 0.48 | 0.42 | 0.48 | 0.56 | 0.78 | 0.70 | 1.00 | 0.78 | 0.70 | 0.64 | 0.64 |
| NO3, mg L−1 | 0.30 | 0.14 | 0.16 | 0.10 | 0.06 | 0.08 | 2.16 | 0.06 | 0.06 | 0.10 | 0.20 | 0.26 | 0.16 | 0.25 | 1.62 | 1.85 | 0.32 | 0.30 | 0.27 | 1.79 | 1.68 | 0.32 | 1.06 | 1.56 | 1.50 | 0.30 |
| PO4, mg L−1 | 0.00 | 0.00 | 0.00 | 0.00 | 0.00 | 0.00 | 0.00 | 0.00 | 0.00 | 0.00 | 0.00 | 0.00 | 0.02 | 0.00 | 0.00 | 0.00 | 0.00 | 0.00 | 0.00 | 0.02 | 0.01 | 0.05 | 0.05 | 0.06 | 0.01 | 0.02 |
| Ptot, mg L−1 | 0.00 | 0.00 | 0.01 | 0.05 | 0.02 | 0.07 | 0.04 | 0.01 | 0.03 | 0.03 | 0.26 | 0.01 | 0.05 | 0.02 | 0.02 | 0.33 | 0.02 | 0.05 | 0.04 | 0.08 | 0.08 | 0.14 | 0.05 | 0.08 | 0.09 | 0.05 |
| Si, mg L−1 | 2.16 | 3.20 | 3.04 | 2.84 | 2.16 | 2.36 | 2.68 | 2.04 | 2.04 | 2.04 | 2.68 | 2.52 | 2.52 | 2.04 | 2.16 | 2.36 | 2.04 | 2.04 | 2.16 | 2.16 | 2.16 | 2.52 | 2.00 | 2.36 | 2.16 | 1.64 |
| Fe tot., mg L−1 | 0.10 | 0.26 | 0.26 | 0.20 | 0.08 | 0.08 | 0.16 | 0.02 | 0.08 | 0.16 | 0.16 | 0.16 | 0.10 | 0.10 | 0.10 | 0.26 | 0.10 | 0.10 | 0.26 | 0.80 | 0.72 | 0.94 | 1.08 | 0.80 | 0.46 | 0.10 |
| Altitude, m a.s.l. | 388.00 | 388.00 | 388.00 | 226.00 | 222.00 | 264.00 | 160.00 | 130.00 | 147.00 | 94.00 | 84.00 | 60.00 | 50.00 | 25.00 | 31.00 | 34.00 | 30.00 | 30.00 | 23.00 | 15.00 | 13.00 | 2.00 | 2.00 | 27.00 | 2.00 | 1.00 |
| Sampling Station | 186 | 187 | 188 | 189 | 190 | 191 | 192 | 193 | 194 | 195 | 196 | 197 | 198 | 199 | 200 | 201 | 202 | 203 | 204 | 205 | 206 | 207 | 208 | 209 | 210 | 211 |
|---|---|---|---|---|---|---|---|---|---|---|---|---|---|---|---|---|---|---|---|---|---|---|---|---|---|---|
| Total Abundance, cells L−1 | 7980 | 19,088 | 38,131 | 3241 | 34,968 | 15,884 | 15,903 | 19,088 | 42,893 | 7977 | 3220 | 1627 | 20,674 | 62 | 70 | 59 | 6383 | 3241 | 38,173 | 9573 | 65 | 6420 | 12,741 | 12,747 | 73 | 57,246 |
| No of Species | 18 | 20 | 19 | 25 | 24 | 10 | 15 | 20 | 21 | 17 | 17 | 15 | 20 | 22 | 25 | 21 | 14 | 25 | 39 | 22 | 23 | 28 | 20 | 23 | 26 | 52 |
| Index S | 0.32 | 0.30 | 1.34 | 1.90 | 0.30 | 0.30 | 2.00 | 1.63 | 1.56 | 0.30 | 0.31 | 0.32 | 0.30 | 1.44 | 1.63 | 1.49 | 2.10 | 2.09 | 2.17 | 1.75 | 1.41 | 1.75 | 1.33 | 1.57 | 1.46 | 1.23 |
| Index WESI | 3.00 | 2.00 | 0.67 | 0.50 | 2.00 | 2.00 | 1.75 | 0.50 | 0.50 | 2.00 | 2.00 | 3.00 | 2.00 | 1.00 | 1.50 | 2.00 | 0.60 | 0.60 | 0.60 | 1.50 | 2.00 | 0.75 | 1.67 | 1.50 | 1.67 | 1.00 |
| Index Shannon | 0.238 | 0.386 | 0.006 | 0.072 | 0.292 | 0.582 | 0.226 | 0.386 | 0.254 | 0.311 | 0.049 | 0.077 | 0.436 | 1.342 | 1.398 | 1.322 | 0.022 | 0.072 | 0.596 | 0.497 | 1.362 | 0.341 | 0.465 | 0.617 | 1.415 | 0.796 |
| Phyla Species | ||||||||||||||||||||||||||
| Bacillariophyta | 8 | 8 | 9 | 10 | 8 | 6 | 5 | 10 | 9 | 7 | 6 | 6 | 7 | 10 | 11 | 7 | 4 | 10 | 21 | 8 | 9 | 15 | 7 | 12 | 10 | 26 |
| Charophyta | 4 | 5 | 2 | 7 | 3 | 1 | 2 | 4 | 6 | 2 | 8 | 6 | 3 | 4 | 6 | 6 | 3 | 3 | 5 | 6 | 6 | 1 | 3 | 1 | 2 | 3 |
| Chlorophyta | 3 | 1 | 2 | 1 | 3 | 0 | 2 | 3 | 2 | 4 | 1 | 1 | 1 | 1 | 3 | 2 | 6 | 3 | 4 | 2 | 2 | 4 | 2 | 4 | 3 | 10 |
| Cyanobacteria | 1 | 3 | 4 | 3 | 5 | 1 | 4 | 2 | 1 | 2 | 1 | 2 | 6 | 4 | 3 | 5 | 0 | 7 | 4 | 3 | 3 | 2 | 1 | 0 | 3 | 5 |
| Ochrophyta | 1 | 2 | 2 | 4 | 4 | 1 | 2 | 1 | 3 | 1 | 1 | 0 | 3 | 3 | 2 | 1 | 1 | 1 | 4 | 3 | 3 | 6 | 6 | 6 | 8 | 8 |
| Rhodophyta | 1 | 1 | 0 | 0 | 0 | 1 | 0 | 0 | 0 | 1 | 0 | 0 | 0 | 0 | 0 | 0 | 0 | 0 | 0 | 0 | 0 | 0 | 0 | 0 | 0 | 0 |
| Miozoa | 0 | 0 | 0 | 0 | 1 | 0 | 0 | 0 | 0 | 0 | 0 | 0 | 0 | 0 | 0 | 0 | 0 | 1 | 1 | 0 | 0 | 0 | 1 | 0 | 0 | 0 |
| Phyla abundance, cells L−1 | ||||||||||||||||||||||||||
| Bacillariophyta | 7952 | 15,884 | 25 | 3199 | 34,924 | 15,872 | 3185 | 6369 | 11,129 | 7949 | 3189 | 1602 | 11,124 | 28 | 31 | 20 | 11 | 28 | 12,741 | 22 | 25 | 42 | 20 | 6375 | 28 | 22,278 |
| Charophyta | 11 | 3185 | 6 | 20 | 8 | 3 | 6 | 11 | 17 | 6 | 22 | 17 | 3179 | 11 | 17 | 17 | 8 | 8 | 14 | 17 | 17 | 3 | 8 | 3 | 6 | 8 |
| Chlorophyta | 8 | 3 | 6 | 3 | 8 | 0 | 12,696 | 12,699 | 31,736 | 11 | 3 | 3 | 3 | 3 | 8 | 6 | 6361 | 3179 | 3182 | 6347 | 6 | 6352 | 3176 | 3182 | 8 | 3199 |
| Cyanobacteria | 3 | 8 | 11 | 8 | 14 | 3 | 11 | 6 | 3 | 6 | 3 | 6 | 17 | 11 | 8 | 14 | 0 | 20 | 22,222 | 8 | 8 | 6 | 3 | 0 | 8 | 12,705 |
| Ochrophyta | 3 | 6 | 38,083 | 11 | 11 | 3 | 6 | 3 | 8 | 3 | 3 | 0 | 6352 | 8 | 6 | 3 | 3 | 3 | 11 | 3179 | 8 | 17 | 9531 | 3187 | 22 | 19,057 |
| Rhodophyta | 3 | 3 | 0 | 0 | 0 | 3 | 0 | 0 | 0 | 3 | 0 | 0 | 0 | 0 | 0 | 0 | 0 | 0 | 0 | 0 | 0 | 0 | 0 | 0 | 0 | 0 |
| Miozoa | 0 | 0 | 0 | 0 | 3 | 0 | 0 | 0 | 0 | 0 | 0 | 0 | 0 | 0 | 0 | 0 | 0 | 3 | 3 | 0 | 0 | 0 | 3 | 0 | 0 | 0 |
| Habitat | ||||||||||||||||||||||||||
| Ep | 0 | 0 | 0 | 0 | 0 | 0 | 0 | 0 | 0 | 0 | 0 | 0 | 1 | 0 | 0 | 1 | 0 | 1 | 0 | 0 | 0 | 0 | 0 | 0 | 0 | 0 |
| B | 11 | 11 | 9 | 12 | 8 | 5 | 7 | 9 | 10 | 8 | 11 | 7 | 8 | 8 | 12 | 11 | 3 | 9 | 17 | 5 | 7 | 10 | 3 | 4 | 3 | 7 |
| P-B | 5 | 4 | 5 | 7 | 10 | 3 | 4 | 8 | 7 | 7 | 3 | 5 | 5 | 6 | 9 | 6 | 9 | 12 | 15 | 11 | 9 | 13 | 11 | 13 | 15 | 29 |
| P | 0 | 2 | 1 | 0 | 0 | 0 | 0 | 2 | 1 | 0 | 0 | 1 | 0 | 1 | 0 | 0 | 1 | 2 | 3 | 1 | 4 | 5 | 5 | 5 | 3 | 11 |
| Temperature | ||||||||||||||||||||||||||
| cool | 0 | 0 | 0 | 0 | 0 | 0 | 0 | 0 | 0 | 0 | 0 | 0 | 0 | 0 | 0 | 0 | 0 | 0 | 0 | 0 | 1 | 0 | 0 | 0 | 0 | 2 |
| temp | 2 | 1 | 4 | 3 | 2 | 1 | 1 | 1 | 2 | 1 | 1 | 1 | 2 | 1 | 3 | 3 | 0 | 2 | 8 | 1 | 4 | 10 | 1 | 8 | 5 | 14 |
| eterm | 1 | 2 | 1 | 1 | 3 | 1 | 1 | 4 | 1 | 2 | 1 | 1 | 1 | 2 | 1 | 1 | 3 | 1 | 2 | 4 | 1 | 1 | 5 | 0 | 2 | 1 |
| warm | 0 | 0 | 0 | 0 | 0 | 0 | 0 | 0 | 1 | 0 | 0 | 0 | 0 | 0 | 0 | 0 | 0 | 0 | 1 | 1 | 0 | 0 | 0 | 0 | 1 | 1 |
| Oxygen | ||||||||||||||||||||||||||
| aer | 1 | 2 | 3 | 3 | 1 | 1 | 2 | 0 | 2 | 0 | 3 | 2 | 1 | 0 | 2 | 1 | 0 | 2 | 2 | 1 | 1 | 1 | 0 | 0 | 0 | 0 |
| str | 0 | 0 | 0 | 1 | 2 | 1 | 2 | 0 | 1 | 1 | 0 | 0 | 0 | 0 | 1 | 0 | 0 | 0 | 2 | 0 | 0 | 1 | 0 | 0 | 0 | 2 |
| st-str | 4 | 6 | 7 | 8 | 7 | 3 | 4 | 10 | 7 | 7 | 3 | 4 | 7 | 8 | 11 | 7 | 7 | 10 | 14 | 9 | 11 | 14 | 6 | 12 | 12 | 23 |
| st | 0 | 0 | 0 | 0 | 2 | 0 | 0 | 1 | 0 | 0 | 0 | 0 | 2 | 2 | 1 | 1 | 2 | 5 | 5 | 3 | 0 | 4 | 4 | 2 | 2 | 6 |
| H2S | 0 | 0 | 0 | 0 | 0 | 0 | 0 | 0 | 0 | 0 | 0 | 0 | 0 | 0 | 0 | 0 | 0 | 0 | 1 | 0 | 0 | 0 | 0 | 0 | 0 | 0 |
| Salinity | ||||||||||||||||||||||||||
| hb | 1 | 2 | 2 | 0 | 0 | 0 | 0 | 2 | 0 | 1 | 1 | 2 | 0 | 0 | 0 | 0 | 0 | 0 | 1 | 0 | 0 | 1 | 0 | 0 | 0 | 1 |
| i | 5 | 5 | 5 | 6 | 9 | 3 | 4 | 9 | 8 | 7 | 3 | 4 | 8 | 10 | 12 | 7 | 8 | 13 | 19 | 10 | 11 | 20 | 9 | 15 | 15 | 28 |
| hl | 0 | 0 | 0 | 1 | 2 | 0 | 0 | 0 | 0 | 1 | 0 | 0 | 1 | 1 | 1 | 1 | 0 | 1 | 1 | 1 | 1 | 1 | 0 | 0 | 1 | 4 |
| mh | 1 | 1 | 1 | 1 | 1 | 1 | 1 | 1 | 1 | 1 | 1 | 1 | 2 | 1 | 1 | 2 | 0 | 2 | 3 | 1 | 1 | 1 | 0 | 1 | 2 | 5 |
| eh | 0 | 0 | 0 | 0 | 0 | 0 | 0 | 0 | 0 | 0 | 0 | 0 | 0 | 0 | 0 | 0 | 0 | 0 | 1 | 0 | 0 | 0 | 0 | 0 | 0 | 0 |
| pH | ||||||||||||||||||||||||||
| acb | 0 | 0 | 1 | 0 | 0 | 0 | 0 | 0 | 0 | 0 | 0 | 0 | 0 | 0 | 0 | 0 | 0 | 0 | 0 | 0 | 0 | 0 | 0 | 0 | 0 | 0 |
| acf | 4 | 3 | 3 | 3 | 1 | 1 | 1 | 4 | 4 | 1 | 6 | 3 | 2 | 1 | 2 | 3 | 0 | 2 | 3 | 1 | 3 | 2 | 1 | 2 | 2 | 5 |
| ind | 3 | 5 | 3 | 7 | 5 | 2 | 3 | 7 | 3 | 6 | 3 | 4 | 5 | 5 | 8 | 8 | 6 | 8 | 11 | 8 | 6 | 6 | 2 | 3 | 3 | 7 |
| alf | 3 | 1 | 3 | 4 | 3 | 2 | 2 | 4 | 5 | 2 | 2 | 2 | 4 | 5 | 6 | 3 | 1 | 3 | 12 | 3 | 6 | 10 | 6 | 7 | 7 | 16 |
| alb | 1 | 1 | 1 | 0 | 1 | 0 | 0 | 1 | 1 | 1 | 1 | 0 | 0 | 1 | 1 | 1 | 1 | 0 | 0 | 0 | 1 | 0 | 0 | 0 | 0 | 2 |
| Watanabe | ||||||||||||||||||||||||||
| sp | 0 | 0 | 0 | 0 | 0 | 0 | 0 | 0 | 0 | 0 | 0 | 0 | 0 | 0 | 0 | 0 | 0 | 0 | 0 | 0 | 0 | 0 | 0 | 0 | 0 | 1 |
| es | 1 | 0 | 1 | 1 | 1 | 0 | 0 | 1 | 1 | 1 | 1 | 1 | 1 | 1 | 2 | 1 | 1 | 2 | 7 | 1 | 3 | 4 | 3 | 4 | 3 | 4 |
| sx | 0 | 0 | 1 | 0 | 0 | 0 | 0 | 1 | 1 | 0 | 0 | 0 | 1 | 1 | 1 | 2 | 1 | 1 | 1 | 1 | 1 | 1 | 1 | 1 | 1 | 3 |
| Class of Water Quality | ||||||||||||||||||||||||||
| Class 1 | 1 | 0 | 1 | 0 | 0 | 0 | 0 | 2 | 1 | 1 | 0 | 0 | 0 | 0 | 0 | 0 | 0 | 0 | 0 | 0 | 1 | 2 | 1 | 1 | 1 | 3 |
| Class 2 | 2 | 5 | 3 | 4 | 3 | 1 | 1 | 3 | 5 | 2 | 2 | 3 | 3 | 2 | 5 | 0 | 4 | 6 | 11 | 4 | 5 | 14 | 11 | 9 | 8 | 15 |
| Class 3 | 3 | 3 | 4 | 5 | 4 | 2 | 3 | 4 | 3 | 3 | 2 | 4 | 4 | 4 | 6 | 0 | 5 | 7 | 6 | 5 | 5 | 6 | 3 | 7 | 7 | 13 |
| Class 4 | 2 | 2 | 1 | 2 | 1 | 1 | 2 | 2 | 3 | 1 | 2 | 2 | 1 | 1 | 3 | 0 | 0 | 1 | 4 | 1 | 1 | 1 | 1 | 0 | 1 | 1 |
| Class 5 | 0 | 0 | 0 | 0 | 0 | 0 | 0 | 1 | 0 | 0 | 0 | 0 | 0 | 0 | 0 | 0 | 0 | 0 | 0 | 0 | 0 | 0 | 0 | 0 | 0 | 0 |
| Autotrophy-Heterotrophy | ||||||||||||||||||||||||||
| ats | 1 | 0 | 1 | 0 | 0 | 0 | 0 | 1 | 1 | 0 | 0 | 0 | 1 | 1 | 1 | 1 | 1 | 1 | 2 | 0 | 0 | 4 | 2 | 2 | 0 | 8 |
| ate | 1 | 1 | 1 | 3 | 1 | 0 | 0 | 2 | 2 | 2 | 0 | 0 | 0 | 0 | 2 | 0 | 0 | 1 | 4 | 3 | 4 | 3 | 3 | 4 | 4 | 5 |
| hne | 0 | 0 | 0 | 0 | 0 | 0 | 0 | 0 | 0 | 0 | 1 | 1 | 1 | 1 | 1 | 1 | 1 | 1 | 0 | 0 | 0 | 0 | 0 | 0 | 0 | 1 |
| hce | 0 | 0 | 0 | 0 | 0 | 0 | 0 | 0 | 0 | 0 | 0 | 0 | 0 | 0 | 0 | 0 | 0 | 0 | 1 | 0 | 0 | 0 | 0 | 0 | 0 | 0 |
| Trophic state | ||||||||||||||||||||||||||
| ot | 1 | 1 | 2 | 0 | 0 | 0 | 0 | 2 | 2 | 0 | 0 | 0 | 2 | 1 | 1 | 0 | 1 | 1 | 3 | 1 | 0 | 2 | 0 | 1 | 0 | 3 |
| om | 0 | 1 | 1 | 0 | 0 | 0 | 0 | 0 | 1 | 0 | 2 | 1 | 1 | 1 | 2 | 1 | 1 | 1 | 1 | 0 | 1 | 2 | 2 | 3 | 2 | 5 |
| m | 1 | 2 | 1 | 3 | 1 | 0 | 1 | 0 | 1 | 0 | 4 | 2 | 2 | 1 | 1 | 4 | 0 | 3 | 3 | 1 | 3 | 1 | 1 | 0 | 4 | 2 |
| me | 0 | 0 | 0 | 0 | 0 | 0 | 0 | 1 | 0 | 1 | 0 | 1 | 0 | 0 | 1 | 0 | 1 | 2 | 4 | 3 | 4 | 1 | 1 | 2 | 1 | 4 |
| e | 2 | 2 | 2 | 3 | 3 | 1 | 2 | 6 | 5 | 2 | 1 | 3 | 3 | 2 | 5 | 2 | 2 | 4 | 5 | 4 | 2 | 4 | 3 | 4 | 2 | 6 |
| o-e | 0 | 0 | 0 | 0 | 0 | 0 | 0 | 0 | 0 | 0 | 0 | 0 | 0 | 0 | 0 | 0 | 0 | 0 | 0 | 0 | 1 | 0 | 0 | 0 | 0 | 0 |
| he | 0 | 0 | 0 | 1 | 0 | 0 | 0 | 0 | 0 | 0 | 0 | 0 | 0 | 0 | 0 | 0 | 0 | 0 | 0 | 0 | 0 | 0 | 0 | 0 | 0 | 0 |
| Phyla | Hab | T | OXY | HAL | pH | D | Index S | SAP | AUT-HET | TRO |
|---|---|---|---|---|---|---|---|---|---|---|
| Bacillariophyta | ||||||||||
| Achnanthidium affine (Grunow) Czarnecki | B | - | str | i | alf | es | 1.10 | o | ate | - |
| Achnanthidium minutissimum (Kützing) Czarnecki | P-B | eterm | st-str | i | ind | es | 0.95 | b | ate | e |
| Achnanthidium trinode Ralfs | B | - | - | - | alf | - | 1.00 | o | - | ot |
| Actinocyclus normanii (W.Gregory ex Greville) Hustedt | P | - | st-str | mh | alf | - | 2.30 | b | ate | e |
| Asterionella formosa Hassall | P | temp | st-str | i | alf | sx | 1.35 | b | ate | me |
| Asterionella ralfsii W.Smith | P-B | - | - | i | acf | - | 0.50 | x-o | - | ot |
| Aulacoseira distans (Ehrenberg) Simonsen | P-B | cool | str | i | acf | sp | 0.40 | o | ats | ot |
| Aulacoseira granulata (Ehrenberg) Simonsen | P-B | temp | st-str | i | alf | es | 2.00 | b | ate | e |
| Aulacoseira islandica (O.Müller) Simonsen | P-B | cool | st-str | i | ind | es | 2.00 | b | ate | o-e |
| Aulacoseira subarctica (O.Müller) E.Y.Haworth | P | temp | st-str | i | alf | - | 1.70 | b-o | ats | om |
| Belonastrum berolinense (Lemmermann) Round & Maidana | P-B | - | st-str | hl | alf | - | 2.20 | b | ate | he |
| Cymatopleura comperei C.Cocquyt & R.Jahn | - | - | - | - | - | - | - | - | - | - |
| Cymbella aspera (Ehrenberg) Cleve | B | - | st-str | i | neu | es | 0.30 | x | ats | e |
| Cymbella cistula (Ehrenberg) O.Kirchner | B | - | st-str | i | alf | sx | 1.20 | b | ats | e |
| Cymbella lanceolata C.Agardh | B | temp | st-str | i | alf | es | 2.50 | b-a | ate | e |
| Cymbopleura heteropleura (Ehrenberg) Z.X.Shi | - | - | - | - | - | - | - | - | - | - |
| Cymbopleura naviculiformis (Auerswald ex Heiberg) Krammer | B | temp | st-str | i | ind | - | - | - | - | - |
| Diatoma elongata (Lyngbye) C.Agardh | P-B | - | st-str | hl | alf | - | - | - | - | - |
| Diatoma tenuis C.Agardh | P-B | temp | st-str | hl | alf | - | 2.40 | b-a | - | om |
| Diatoma vulgaris Bory | P-B | temp | st-str | i | alf | - | 2.40 | b-a | - | - |
| Diatoma vulgaris var. linearis Grunow | B | - | str | i | alf | es | - | - | - | - |
| Didymosphenia geminata (Lyngbye) Mart. Schmidt | B | - | st-str | i | ind | - | 2.00 | b | - | - |
| Encyonema minutum (Hilse) D.G.Mann | B | temp | st-str | i | ind | sx | 1.50 | o-b | ats | - |
| Encyonema silesiacum (Bleisch) D.G.Mann | B | temp | st-str | i | ind | - | - | - | - | - |
| Encyonema ventricosum (C.Agardh) Grunow | B | - | st-str | i | ind | - | - | - | ate | - |
| Entomoneis paludosa (W.Smith) Reimer | P-B | - | - | mh | alf | - | - | - | - | - |
| Epithemia adnata (Kützing) Brébisson | B | temp | st-str | i | alb | - | 1.20 | o | - | - |
| Epithemia argus (Ehrenberg) Kützing | P-B | - | st-str | i | ind | sx | 1.20 | o | ats | me |
| Epithemia sorex Kützing | B | temp | st-str | i | alf | - | - | - | - | - |
| Epithemia turgida (Ehrenberg) Kützing | B | temp | st-str | i | alf | - | 1.10 | - | - | - |
| Eunotia arcus Ehrenberg | B | temp | st-str | i | acf | sx | 0.40 | x-o | ats | ot |
| Eunotia exigua (Brébisson ex Kützing) Rabenhorst | P-B,aer | temp | st-str | hb | acb | - | 1.00 | o | - | ot |
| Eunotia incisa W.Smith ex W.Gregory | P-B | temp | st-str | i | acf | - | - | o | ats | om |
| Eunotia lunaris (Ehrenberg) Grunow | B | - | - | - | - | - | - | - | - | - |
| Eunotia polydentula Hustedt | B | - | - | hb | acf | - | - | - | - | - |
| Eunotia septentrionalis Østrup | P-B | - | str | hb | acf | - | 1.00 | o | - | ot |
| Eunotia tenella (Grunow) Hustedt | B | temp | st-str | hb | acf | - | - | - | - | - |
| Eunotia vanheurckii R.M.Patrick | B | temp | st-str | i | acf | - | 0.50 | x-o | ats | ot |
| Eunotia veneris (Kützing) De Toni | - | - | - | - | - | - | - | - | - | - |
| Fragilaria capucina Desmazières | P-B | temp | st-str | i | ind | - | - | - | - | - |
| Fragilaria intermedia (Grunow) Grunow | - | - | - | - | - | - | - | - | - | - |
| Fragilaria radians (Kützing) D.M.Williams & Round | P-B | warm | st-str | i | alf | - | - | - | - | - |
| Gomphonema longiceps Ehrenberg var. montanum (Schumann) Cleve f. suecicum Grunow | - | - | - | - | - | - | - | - | - | - |
| Gomphonema acuminatum Ehrenberg | B | temp | st-str | i | ind | - | 0.80 | x-b | - | - |
| Gomphonema brebissonii Kützing | B | - | st | i | ind | - | - | - | - | m |
| Gomphonema constrictum Ehrenberg | - | - | - | - | - | - | - | - | - | - |
| Gomphonema coronatum Ehrenberg | B | - | st | i | ind | - | - | - | - | - |
| Gomphonema montanum (Schumann) Grunow | B | - | str | i | ind | - | - | - | ate | - |
| Gomphonema pumilum (Grunow) E.Reichardt & Lange-Bertalot | B | temp | - | i | alf | - | - | - | - | - |
| Hannaea arcus (Ehrenberg) R.M.Patrick | B | temp | str | i | alf | - | - | - | - | - |
| Hannaea linearis (Holmboe) Álvarez-Blanco & S.Blanco | P | - | - | i | alf | - | 1.00 | o | - | ot |
| Hantzschia elongata (Hantzsch) Grunow | B | - | aer | i | acf | - | - | - | - | - |
| Iconella tenera (W.Gregory) Ruck & Nakov | P-B | temp | st | i | alf | - | 0.20 | x | ats | ot |
| Meridion circulare (Greville) C.Agardh | P-B | temp | st-str | i | ind | - | - | - | - | - |
| Navicula radiosa Kützing | B | temp | st-str | i | ind | sx | - | - | - | - |
| Nitzschia acicularis (Kützing) W.Smith | P-B | temp | st | i | alf | es | 1.40 | o-b | ats | om |
| Nitzschia linearis W.Smith | B | temp | st-str | i | alf | - | - | - | - | - |
| Nitzschia recta Hantzsch ex Rabenhorst | B | temp | st-str | i | alf | - | 1.00 | o | - | - |
| Nitzschia sigma (Kützing) W.Smith | B | temp | st-str | mh | alf | - | - | - | - | - |
| Nitzschia tubicola Grunow | B | temp | - | mh | ind | es | 2.80 | a-o | hce | e |
| Pinnularia divergens W.Smith | B | - | st | hb | ind | - | - | - | - | - |
| Pinnularia microstauron var. ambigua F.Meister | B | - | st-str | hb | ind | - | 0.80 | x-b | ate | me |
| Pinnularia stauroptera (Grunow) Rabenhorst | - | - | - | - | - | - | - | - | - | - |
| Planothidium dispar (Cleve) Witkowski, Lange-Bertalot & Metzeltin | B | - | - | eh | alf | - | - | - | - | - |
| Pseudostaurosira parasitica (W.Smith) E.Morales | P-B | temp | st-str | i | alf | - | 1.00 | o | ate | ot |
| Rhopalodia gibba (Ehrenberg) O.Müller | P-B | temp | st-str | i | alf | es | 1.40 | x-o | ate | om |
| Stauroneis anceps Ehrenberg | P-B | temp | st-str | i | ind | sx | 1.30 | o | ats | om |
| Stauroneis phoenicenteron (Nitzsch) Ehrenberg | P-B | temp | st-str | i | ind | - | - | - | - | - |
| Stephanocyclus meneghinianus (Kützing) Kulikovskiy, Genkal & Kociolek | - | - | - | - | - | - | - | - | - | - |
| Stephanodiscus niagarae Ehrenberg | P-B | temp | st | i | alf | - | - | - | hne | - |
| Tabellaria fenestrata (Lyngbye) Kützing | P-B | - | st-str | i | ind | - | 1.90 | o-a | - | - |
| Tabellaria flocculosa (Roth) Kützing | P-B | eterm | st-str | i | acf | - | 0.30 | a | - | - |
| Tabularia tabulata (C.Agardh) Snoeijs | B | - | - | mh | alf | - | - | - | - | - |
| Thalassiosira baltica (Grunow) Ostenfeld | P-B | cool | - | mh | - | - | - | - | - | - |
| Ulnaria acus (Kützing) Aboal | P-B | warm | st-str | i | alf | es | 1.85 | o-a | ate | me |
| Ulnaria amphirhynchus (Ehrenberg) Compère & Bukhtiyarova | P-B | - | - | i | alf | es | 2.00 | b | hne | om |
| Ulnaria ulna (Nitzsch) Compère | P-B | temp | st-str | i | alf | es | 2.40 | b-a | ate | e |
| Urosolenia longiseta (O.Zacharias) Edlund & Stoermer | P | - | str | i | acf | - | 0.90 | x-b | ats | me |
| Charophyta | ||||||||||
| Closterium acerosum Ehrenberg ex Ralfs | P-B | - | st-str | i | ind | - | 2.60 | a-o | - | e |
| Closterium decorum Brébisson | - | - | - | - | - | - | - | - | - | - |
| Closterium dianae var. arcuatum (Brebisson ex Ralfs) Rabenhorst | B | - | - | - | acf | - | 0.80 | x-b | - | m |
| Closterium leibleinii Kützing ex Ralfs | P-B | - | st-str | - | ind | - | 2.60 | a-o | - | e |
| Closterium littorale F.Gay | P-B | - | - | - | ind | - | 2.40 | b-a | - | e |
| Closterium macilentum Brébisson | P-B | - | st-str | i | ind | - | - | - | - | me |
| Closterium moniliferum Ehrenberg ex Ralfs | P-B | - | st-str | i | ind | - | 2.10 | b | - | me |
| Closterium parvulum Nägeli | P-B | - | - | i | ind | - | 2.00 | b | - | m |
| Closterium peracerosum F.Gay | - | - | - | - | - | - | - | - | - | - |
| Closterium rostratum Ehrenberg ex Ralfs | B | - | aer | - | ind | - | 0.70 | o-x | - | m |
| Closterium strigosum var. elegans (G.S.West) Willi Krieger | B | - | - | - | ind | - | - | - | - | e |
| Closterium subulatum (Kützing) Brébisson | B | - | - | - | ind | - | - | - | - | me |
| Closterium tumidum L.N.Johnson | B | - | aer | - | acf | - | - | - | - | om |
| Cosmarium asphaerosporum var. strigosum Nordstedt | B | - | - | - | acf | - | - | - | - | m |
| Cosmarium boeckii Wille | P-B | - | - | - | ind | - | - | - | - | m |
| Cosmarium formosulum Hoff | P-B | - | - | - | ind | - | 1.80 | o-a | - | me |
| Cosmarium novae-semliae Wille | B | - | - | - | acf | - | - | - | - | m |
| Cosmarium pygmaeum W.Archer | P-B | - | st-str | - | acf | - | - | - | - | om |
| Cosmarium speciosum P.Lundell | B,aer | - | aer | - | ind | - | - | - | - | m |
| Cosmarium staurastroides Eichler & Gutwinski | - | - | - | - | acf | - | - | - | - | ot |
| Cosmarium subcrenatum Hantzsch | B,aer | - | aer | - | acf | - | 1.10 | o | - | m |
| Cosmarium trachypleurum var. minus Raciborski | B | - | - | - | acf | - | - | - | - | m |
| Euastrum bidentatum Nägeli | P-B | - | - | hb | ind | - | 0.50 | x-o | - | - |
| Gonatozygon brebissonii var. minutum (West) West & G.S.West | B | - | - | - | acf | - | 1.10 | - | - | - |
| Heimansia pusilla (L.Hilse) Coesel | - | - | - | - | ind | - | - | - | - | - |
| Mougeotia sp. st. | B | - | - | - | - | - | 1.00 | o | - | - |
| Roya pseudoclosterium (J.Roy) West & G.S.West | B | - | - | - | acf | - | - | - | - | e |
| Spirogyra sp. st. | P-B | - | - | - | alf | - | - | - | - | - |
| Spondylosium planum (Wolle) West & G.S.West | P-B | - | - | i | ind | - | - | - | - | - |
| Staurastrum avicula var. lunatum (Ralfs) Coesel & Meesters | P-B | - | - | i | ind | - | - | - | - | e |
| Staurastrum basidentatum Borge | - | - | - | - | - | - | - | - | - | - |
| Staurastrum dispar Brébisson | B | - | - | - | ind | - | - | - | - | m |
| Staurastrum erasum Brébisson | B | - | - | - | acf | - | - | - | - | m |
| Staurastrum margaritaceum Meneghini ex Ralfs | B | - | - | - | acf | - | - | - | - | om |
| Staurastrum pachyrhynchum var. convergens Raciborski | - | - | - | - | acf | - | - | - | - | m |
| Staurastrum pilosum Brébisson | P-B | - | st-str | - | acf | - | - | - | - | ot |
| Staurastrum punctulatum Brébisson | P-B | - | st-str | i | ind | - | - | - | - | ot |
| Staurastrum vestitum var. splendidum Grönblad | - | - | - | - | - | - | - | - | - | - |
| Zygnema sp. st. | P-B | - | - | - | alb | - | 1.00 | x-b | - | - |
| Chlorophyta | ||||||||||
| Ankistrodesmus arcuatus Korshikov | P-B | - | st-str | i | - | - | 2.10 | b | - | - |
| Ankistrodesmus fusiformis Corda | P-B | - | st-str | i | - | - | 2.00 | b | - | e |
| Ankistrodesmus spiralis (W.B.Turner) Lemmermann | P | - | - | - | - | - | 2.10 | b | - | e |
| Bulbochaete sp. | B | - | - | - | - | - | 1.20 | o | - | e |
| Cladophora glomerata (Linnaeus) Kützing | P-B | - | st-str | i | alf | - | 1.90 | o-a | - | e |
| Closteriopsis longissima (Lemmermann) Lemmermann | P | - | st-str | i | - | - | 1.80 | o-a | - | e |
| Coenococcus planctonicus Korshikov | P | - | - | i | - | - | 1.50 | o-b | - | - |
| Klebsormidium subtile (Kützing) Mikhailyuk, Glaser, Holzinger & Karsten | - | - | - | - | - | - | - | - | - | - |
| Lagerheimia chodatii C.Bernard | P | - | - | - | - | - | - | - | - | - |
| Monoraphidium komarkovae Nygaard | P-B | - | st | - | - | - | 1.50 | o-b | - | - |
| Mucidosphaerium pulchellum (H.C.Wood) C.Bock, Proschold & Krienitz | P-B | - | st-str | i | ind | - | 1.80 | o-a | - | - |
| Neglectella solitaria (Wittrock) Stenclová & Kastovsky | P | - | st | i | ind | - | 0.80 | x-b | ats | - |
| Oedogonium sp. | B | - | - | - | alb | - | - | - | - | - |
| Oocystis lacustris Chodat | P-B | - | st-str | hl | - | - | - | - | - | - |
| Penium spirostriolatum J.Barker | B | - | - | - | acf | - | - | - | - | - |
| Radiococcus polycoccus (Korshikov) Kostikov, Darienko, Lukesová & L.Hoffmann | P | - | - | i | - | - | - | - | - | me |
| Siderocystopsis punctifera (Bolochonzew) Hegewald & Schnepf | P-B | - | st-str | i | - | - | - | - | - | - |
| Sphaerocystis planctonica (Korshikov) Bourrelly | P | - | - | i | - | - | 1.00 | o | - | e |
| Stigeoclonium fasciculare Kützing | B | - | str | - | - | - | - | - | - | - |
| Stigeoclonium setigerum Kützing | - | - | - | - | - | - | - | - | - | - |
| Stigeoclonium tenue (C.Agardh) Kützing | P-B | - | st-str | - | alf | - | 2.30 | b | - | - |
| Ulothrix tenerrima (Kützing) Kützing | P-B | - | st | i | - | - | 1.80 | o-a | - | - |
| Ulothrix zonata (F.Weber & Mohr) Kützing | P-B | - | st-str | i | ind | - | 1.80 | o-a | - | - |
| Cyanobacteria | ||||||||||
| Anabaena aequalis O.Borge | P-B | - | st | - | - | - | 1.50 | o-b | - | e |
| Anabaena contorta H.Bachmann | P | - | st-str | - | - | - | - | - | - | - |
| Anagnostidinema amphibium (C.Agardh ex Gomont) Strunecký, Bohunická, J.R.Johansen & J.Komárek | P-B,S | - | st-str,H2S | hl | alf | - | 2.60 | a-o | - | m |
| Aphanizomenon flos-aquae Ralfs ex Bornet & Flahault | P-B | - | - | hl | alb | - | 1.95 | o-a | - | m |
| Aphanocapsa grevillei (Berkeley) Rabenhorst | P | - | - | hb | - | - | 1.40 | o-b | - | e |
| Aphanothece clathrata West & G.S.West | - | - | - | - | - | - | - | - | - | - |
| Calothrix clavata G.S.West | B,S | - | st-str | - | - | - | - | - | - | - |
| Chamaesiphon carpaticus Starmach | B | - | - | - | - | - | 0.50 | x-o | - | - |
| Chamaesiphon rostafinskii Hansgirg | - | - | - | - | - | - | - | - | - | - |
| Chroococcopsis gigantea Geitler | - | - | - | - | - | - | - | - | - | - |
| Coelosphaerium dubium Grunow | P | - | - | - | - | - | - | - | - | e |
| Coelosphaerium kuetzingianum Nägeli | P | - | - | i | - | - | 1.60 | b-o | - | m |
| Hassallia manginii Frémy | - | - | - | - | - | - | - | - | - | - |
| Jaaginema woronichinii (Anisimova) Anagnostidis & Komárek | B,Ep | - | st | mh | - | - | - | - | - | - |
| Leptolyngbya tenuis (Gomont) Anagnostidis & Komárek | B,S | - | st-str | i | alf | - | 0.50 | x-o | - | - |
| Limnothrix planctonica (Wołoszyńska) Meffert | P | - | - | i | - | - | 1.00 | o | ats | ot |
| Merismopedia glauca (Ehrenberg) Kützing | P-B | - | - | i | ind | - | - | - | - | e |
| Nostoc minutum Desmazières ex Bornet & Flahault | S,Ep | - | - | - | - | - | 1.60 | b-o | - | m |
| Oscillatoria rupicola (Hansgirg) Hansgirg ex Forti | P-B,S | - | aer | - | - | - | 2.70 | a-o | - | me |
| Oscillatoria tenuis C.Agardh ex Gomont | P-B,S | - | st-str | hl | - | - | - | - | - | - |
| Phormidium ambiguum Gomont | B,S | eterm | st-str | i | ind | - | - | - | - | - |
| Phormidium bohneri Schmidle | B,S | - | - | - | - | - | - | - | - | - |
| Phormidium tambii (Woronichin) Anagnostidis & Komárek | - | - | - | - | - | - | - | - | - | - |
| Phormidium terebriforme (C.Agardh ex Gomont) Anagnostidis & Komárek | P-B,S | eterm | st-str | - | ind | - | 1.50 | o-b | - | ot |
| Planktolyngbya limnetica (Lemmermann) Komárková-Legnerová & Cronberg | P-B,S | - | st-str | hl | alf | - | 1.80 | o-a | - | me |
| Planktothrix agardhii (Gomont) Anagnostidis & Komárek | P-B | - | st | hl | - | - | - | - | - | - |
| Scytonema hoffmannii C.Agardh ex Bornet & Flahault | B,S | - | aer | - | - | - | - | - | - | - |
| Spirulina laxa G.M.Smith | P | - | st | - | alf | - | 3.60 | a-b | - | e |
| Spirulina major Kützing ex Gomont | P-B,S | warm | st | hl | - | - | - | - | - | - |
| Spirulina schroederi Koppe | - | - | - | - | - | - | - | - | - | - |
| Spirulina spirulinoides (Ghose) Geitler | - | - | - | - | - | - | - | - | - | - |
| Stigonema hormoides Bornet & Flahault | S,B | - | aer | - | - | - | 2.80 | a-o | - | - |
| Stigonema informe Kützing ex Bornet & Flahault | S,B | - | aer | - | - | - | 2.80 | a-o | - | - |
| Tolypothrix distorta Kützing ex Bornet & Flahault | B,S | - | - | - | - | - | 0.95 | x-b | - | ot |
| Tolypothrix tenuis Kützing ex Bornet & Flahault | B,S | - | st | i | - | - | 1.00 | x-b | - | ot |
| Miozoa | ||||||||||
| Peridinium bipes F.Stein | P | - | st-str | oh | - | - | 1.40 | o-b | - | - |
| Peridinium cinctum (O.F.Müller) Ehrenberg | P-B | - | st-str | i | - | - | 1.40 | o-b | - | - |
| Peridinium volzii Lemmermann | P | - | - | - | - | - | 0.30 | x | ats | om |
| Ochrophyta | ||||||||||
| Arachnochloris subsolitaria (Pascher) Bourrelly | - | - | - | - | - | - | - | - | - | - |
| Bumilleria angustata (Starmach) Matvienko & Dogadina | - | - | - | - | - | - | - | - | - | - |
| Bumilleria sicula Borzì | - | - | - | - | - | - | - | - | - | - |
| Characiopsis anabaenae Pascher | - | - | - | - | - | - | - | - | - | - |
| Characiopsis heeringiana Pascher | - | - | - | - | - | - | - | - | - | - |
| Chlorarkys reticulata Pascher | - | - | - | - | - | - | - | - | - | - |
| Dinobryon bavaricum Imhof | P-B | - | - | i | - | - | 1.20 | o | - | - |
| Dinobryon borgei Lemmermann | P | - | - | - | - | - | 1.10 | - | - | - |
| Dinobryon cylindricum O.E.Imhof | P-B | - | - | i | - | - | 1.20 | o | - | - |
| Dinobryon faculiferum Willén | P | - | - | - | - | - | 1.20 | o | - | - |
| Dinobryon sociale var. americanum (Brunnthaler) Bachmann | P | - | - | - | - | - | 1.30 | o | - | - |
| Dinobryon suecicum var. longispinum Lemmermann | P | - | - | - | - | - | 1.20 | o | - | - |
| Epipyxis pulchra D.K.Hilliard & B.C.Asmund | - | - | - | - | - | - | - | - | - | - |
| Gaumiella bellifontana Bourrelly | - | - | - | - | - | - | - | - | - | - |
| Gloeoskene turfosa Fott | - | - | - | - | - | - | - | - | - | - |
| Heterodendron pascheri Steinecke | - | - | - | - | - | - | - | - | - | - |
| Kephyrion colliferum de Graaf | B | - | - | - | - | - | 1.50 | o-b | - | - |
| Mallomonas horrida J.Schiller | - | - | - | - | - | - | - | - | - | - |
| Ophiocytium cochleare (Eichwald) A.Braun | P-B | - | - | oh | - | - | - | - | - | e |
| Pseudokephyrion pseudospirale Bourrelly | - | - | - | - | - | - | 1.50 | o-b | - | - |
| Pseudokephyrion undulatissimum Scherffel | B | - | - | oh | - | - | 1.10 | o | - | - |
| Synura uvella Ehrenberg | P-B | - | st | - | - | - | 1.10 | o | - | - |
| Tribonema affine (Kützing) G.S.West | B | - | - | hb | - | - | 0.80 | x-b | - | - |
| Tribonema ambiguum Skuja | - | - | - | - | - | - | - | - | - | - |
| Tribonema microchloron Ettl | - | - | - | - | - | - | - | - | - | - |
| Tribonema pyrenigerum Paseher | - | - | - | - | - | - | - | - | - | - |
| Tribonema regulare Pascher | B | - | - | - | - | - | 1.60 | b-o | - | - |
| Tribonema ulotrichoides Pascher | B | - | - | - | - | - | 1.30 | o | - | - |
| Tribonema utriculosum (Kützing) Hazen | B | - | - | - | - | - | - | - | - | - |
| Tribonema viride Pascher | P-B | - | - | i | - | - | 0.70 | o-x | - | - |
| Xanthonema quadratum (Pascher) P.C.Silva | - | - | - | - | - | - | - | - | - | - |
| Rhodophyta | ||||||||||
| Batrachospermum gelatinosum (Linnaeus) De Candolle | B | - | - | - | - | - | 0.90 | x-b | - | - |
References
- Knights, D.; Piliouras, A.; Schwenk, J.; Hariharan, J.; Russoniello, C. Seasonal and morphological controls on nitrate retention in Arctic deltas. Geophys. Res. Lett. 2023, 50, e2022GL102201. [Google Scholar] [CrossRef]
- Jeppesen, E.; Brucet, S.; Naselli-Flores, L.; Papastergiadou, E.; Stefanidis, K.; Nõges, T.; Nõges, P.; Attayde, J.L.; Zohary, T.; Coppens, J.; et al. Ecological impacts of global warming and water abstraction on lakes and reservoirs due to changes in water level and related changes in salinity. Hydrobiologia 2015, 750, 201–227. [Google Scholar] [CrossRef]
- Lugg, A.; Copeland, C. Review of cold water pollution in the Murray–Darling Basin and the impacts on fish communities. Ecol. Manag. Restor. 2014, 15, 71–79. [Google Scholar] [CrossRef]
- Gabyshev, V.A.; Sidelev, S.I.; Chernova, E.N.; Vilnet, A.A.; Davydov, D.A.; Barinova, S.; Gabysheva, O.I.; Zhakovskaya, Z.A.; Voronov, I.V. Year-Round Presence of Microcystins and Toxin-Producing Microcystis in the Water Column and Ice Cover of a Eutrophic Lake Located in the Continuous Permafrost Zone (Yakutia, Russia). Toxins 2023, 15, 467. [Google Scholar] [CrossRef]
- Barinova, S.; Gabyshev, V.; Gabysheva, O. Climate impact of freshwater biodiversity: General patterns in extreme environments of North-Eastern Siberia (Russia). Br. J. Environ. Clim. Change 2014, 4, 423–443. [Google Scholar] [CrossRef]
- Dedić, A.; Gerhardt, A.; Kelly, M.G.; Stanić-Koštroman, S.; Šiljeg, M.; Kalamujić Stroil, B.; Kamberović, J.; Mateljak, Z.; Pešić, V.; Vučković, I.; et al. In-novative methods and approaches for WFD: Ideas to fill knowledge gaps in science and policy. Water Solut. 2020, 3, 30–42. [Google Scholar]
- Barinova, S. On the Classification of Water Quality from an Ecological Point of View. Int. J. Environ. Sci. Nat. Resour. 2017, 2, 1–8. [Google Scholar] [CrossRef]
- Barinova, S. Ecological Mapping in Application to Aquatic Ecosystems BioIndication: Problems and Methods. Int. J. Environ. Sci. Nat. Resour. 2017, 3, 1–7. [Google Scholar] [CrossRef]
- Komarenko, L.E.; Vasilyeva, I.I. Some Data on the Algae of the Anabar River in the Summer: Botanical Materials for Yakutia; Publishing House of the Yakut Branch of the Siberian Branch of the USSR Academy of Sciences: Yakutsk, Russia, 1975; pp. 78–86. (In Russian) [Google Scholar]
- Kirillov, A.F.; Khodulov, V.V.; Sobakina, I.G.; Sokolova, V.A.; Ushnitskaya, L.A.; Ivanov, E.V.; Solomonov, N.M. Biology of the Anabar River; Izdatelstvo YaNTs SB RAS: Yakutsk, Russia, 2007; 224p. (In Russian) [Google Scholar]
- Chistyakov, G.E.; Nogovitsyn, D.D.; Yakushev, M.V.; Konstantinov, A.F. Hydropower Resources of the Anabar River Basin; Nauka: Moscow, Russia, 1971; 122p. (In Russian) [Google Scholar]
- Yagnyshev, B.S.; Yagnysheva, T.A.; Zinchuk, M.N.; Legostaeva, Y.B. Ecology of Western Yakutia (Geochemistry of Geoecosystems: Status and Problems); Izdatelstvo YaNTs SB RAS: Yakutsk, Russia, 2005; 432p. (In Russian) [Google Scholar]
- Gabyshev, V.A.; Gabysheva, O.I. Water quality of the Anabar River indicated by phytoplankton structure and hydrochemical characteristics. Contemp. Probl. Ecol. 2010, 3, 395–400. [Google Scholar] [CrossRef]
- Gabyshev, V.A.; Gabysheva, O.I. Phytoplankton of the Largest Rivers of Yakutia and Adjacent Territories of Eastern Siberia; SibAk: Novosibirsk, Russia, 2018; 414p. (In Russian) [Google Scholar]
- Gabysheva, O.I.; Gabyshev, V.A. The Chemical Composition of the Waters of Large Rivers in the Northeast of Russia and the Components of Aquatic Biota (on the Example of Planktonic Mixotrophs) under Conditions of Seasonal Permafrost Degradation; Izdatelstvo SD RAS: Novosibirsk, Russia, 2023; 121p. (In Russian) [Google Scholar]
- Krupa, E.; Barinova, S.; Romanova, S. Ecological Mapping in Assessing the Impact of Environmental Factors on the Aquatic Ecosystem of the Arys River Basin, South Kazakhstan. Diversity 2019, 11, 239. [Google Scholar] [CrossRef]
- Semenov, A.D. Guidance on the Chemical Analysis of Surface Waters of Land; Gidrometeoizdat: Leningrad, Russia, 1977; 540p. (In Russian) [Google Scholar]
- Shornikova, E.A. Guidelines for Planning, Organizing and Monitoring Surface Watercourses; Hyphen: Surgut, Russia, 2007; 88p. (In Russian) [Google Scholar]
- Ratkovich, D.Y. Actual Problems of Water Supply; Nauka: Moscow, Russia, 2003; 352p. (In Russian) [Google Scholar]
- Guiry, M.D.; Guiry, G.M. AlgaeBase World-Wide Electronic Publication. National University of Ireland, Galway. Available online: http://www.algaebase.org (accessed on 24 June 2019).
- Barinova, S. Essential and practical bioindication methods and systems for the water quality assessment. Int. J. Environ. Sci. Nat. Resour. 2017, 2, 79–89. [Google Scholar] [CrossRef]
- European Commission, Directive 2000/60/EC of the European Parliament and of the Council of 23 October 2000 establishing a framework for Community action in the field of water policy. Off. J. Eur. Communities 2000, L327. Available online: https://www.eea.europa.eu/data-and-maps/indicators/freshwater-quality (accessed on 25 August 2023).
- Barinova, S.S.; Bilous, O.P.; Tsarenko, P.M. Algal Indication of Water Bodies in Ukraine: Methods and Prospects; Publishing House of Haifa University: Haifa, Israel; Kyiv, Ukraine, 2019; 367p. (In Russian) [Google Scholar]
- Love, J.; Selker, R.; Marsman, M.; Jamil, T.; Dropmann, D.; Verhagen, J.A.; Ly, A.; Gronau, F.Q.; Smira, M.; Epskamp, S.; et al. JASP: Graphical statistical software for common statistical designs. J. Stat. Softw. 2019, 88, 1–17. [Google Scholar] [CrossRef]
- McAleece, N.; Gage, J.D.G.; Lambshead, P.J.D.; Paterson, G.L.J. BioDiversity Professional Statistics Analysis Software; Jointly developed by the Scottish Association for Marine Science and the Natural History Museum London; Scottish Association for Marine Science: Oban, UK, 1997. [Google Scholar]
- Ter Braak, C.J.F.; Šmilauer, P. CANOCO Reference Manual and CanoDraw for Windows User’s Guide: Software for Canonical Community Ordination (Version 4.5); Microcomputer Power Press: Ithaca, NY, USA, 2002; 500p. [Google Scholar]
- Venglinsky, D.L.; Tyaptirgyanov, M.M.; Labutina, T.M.; Sokolova, V.A.; Ogai, R.I. Features of the Ecology of Hydrobionts of the Lower Lena; Izdatelstvo YaF SO AN SSSR: Yakutsk, Russia, 1987; 184p. (In Russian) [Google Scholar]
- Hustedt, F. Die Diatomeen flora des Flußsystems der Weser im Gebiet der Hansestadt Bremen. Abh. Naturwissenschaftlichen Ver. Brem. 1957, 34, 181–440. [Google Scholar]
- Watanabe, T.; Asai, K.; Houki, A. Numerical estimation of organic pollution of flowing water by using the epilithic diatom assemblage—Diatom Assemblage Index (DAIpo). Sci. Total Environ. 1986, 55, 209–218. [Google Scholar] [CrossRef]
- Sládeček, V. Diatoms as indicators of organic pollution. Acta Hydrochim. Hydrobiol. 1986, 14, 555–566. [Google Scholar] [CrossRef]
- Van Dam, H.; Mertens, A.; Sinkeldam, J. A coded checklist and ecological indicator values of freshwater diatoms from the Netherlands. Neth. J. Aquat. Ecol. 1994, 28, 117–133. [Google Scholar] [CrossRef]
- Barinova, S.S.; Gabyshev, V.A.; Ivanova, A.P.; Gabysheva, O.I. Bioindication of the water salinity dynamics by the microalgae communities in the Lena River Delta, Laptev Sea, Russian Arctic. Mar. Biol. J. 2021, 6, 15–28. [Google Scholar] [CrossRef]
- Novoselova, T.; Barinova, S.; Protasov, A. Phytoplankton Indicators in the Assessment of the Ecological Status of Two Reservoirs with Different Purposes in Southern Ukraine. Ecologies 2022, 3, 96–119. [Google Scholar] [CrossRef]
- Birk, S.; Bonne, W.; Borja, A.; Brucet, S.; Courrat, A.; Poikane, S.; Solimini, A.; van de Bund, W.; Zampoukas, N.; Hering, D. Three Hundred Ways to Assess Europe’s Surface Waters: An Almost Complete Overview of Biological Methods to Implement the Water Framework Directive. Ecol. Indic. 2012, 18, 31–41. [Google Scholar] [CrossRef]
- Hering, D.; Borja, A.; Jones, J.I.; Pont, D.; Boets, P.; Bouchez, A.; Bruce, K.; Drakare, S.; Hänfling, B.; Kahlert, M.; et al. Implementation options for DNA-based identification into ecological status assessment under the European Water Framework Directive. Water Res. 2018, 138, 192–205. [Google Scholar] [CrossRef] [PubMed]
- Tickner, D.; Opperman, J.J.; Abell, R.; Acreman, M.; Arthington, A.H.; Bunn, S.E.; Cooke, S.J.; Dalton, J.; Darwall, W.; Edwards, G.; et al. Bending the Curve of Global Freshwater Biodiversity Loss: An Emergency Recovery Plan. BioScience 2020, 70, 330–342. [Google Scholar] [CrossRef] [PubMed]
- Moore, J.W. Ecology of algae in a subarctic stream. Can. J. Bot. 2011, 55, 1838–1847. [Google Scholar] [CrossRef]
- Rostekhnadzor. On Approval of the Federal Norms and Rules in the Field of Industrial Safety “Safety Rules for Mining and Processing of Solid Minerals”; Ministry of Justice of Russia: Moscow, Russia, 2020; (In Russian). Available online: https://normativ.kontur.ru/document?moduleId=1&documentId=384179 (accessed on 1 January 2021).
- Burgmer, T.; Hillebrand, H.; Pfenninger, M. Effects of climate-driven temperature changes on the diversity of freshwater macroinvertebrates. Oecologia 2007, 151, 93–103. [Google Scholar] [CrossRef] [PubMed]
- Laker, M.C. Environmental Impacts of Gold Mining—With Special Reference to South Africa. Mining 2023, 3, 205–220. [Google Scholar] [CrossRef]
- Mamyan, A.; Gevorgyan, G. Comparative investigation of the river phytoplankton of the Debed River catchment basin’s mining and non-mining areas. Biol. J. Armen. 2017, 4, 50–55. [Google Scholar]
- Kamboj, V.; Kamboj, N.; Sharma, A.K.; Bisht, A. Phytoplankton communities as bio-indicators of water quality in a mining-affected area of the river Ganga, Haridwar, India. Energ. Ecol. Environ. 2022, 7, 425–438. [Google Scholar] [CrossRef]
- Beck, M.W.; Altieri, A.; Angelini, C.; Burke, M.C.; Chen, J.; Chin, D.W.; Gardiner, J.; Hu, C.; Hubbard, K.A.; Liu, Y.; et al. Initial estuarine response to inorganic nutrient inputs from a legacy mining facility adjacent to Tampa Bay, Florida. Mar. Pollut. Bull. 2022, 178, 113598. [Google Scholar] [CrossRef]
- Pochechun, V.A.; Konovalov, V.E.; Semyachkov, A.I. Basic Procedure to Estimate the Accumulated Environmental Damage Caused by Mining Facilities as Exemplified by the Kachkanar Tailing Dump in the Middle Urals. In Proceedings of the 6th International Conference on Construction, Architecture and Technosphere Safety. ICCATS 2022; Lecture Notes in Civil Engineering; Radionov, A.A., Ulrikh, D.V., Timofeeva, S.S., Alekhin, V.N., Gasiyarov, V.R., Eds.; Springer: Cham, Switzerland, 2022; Volume 308. [Google Scholar] [CrossRef]
- Shchur, L.A.; Bazhina, L.V.; Volkova, N.I.; Trofimova, M.A. Water Quality of Small Rivers in the Zone of Influence of Gold-Mining Facilities in Krasnoyarsk Region. Water Resour. 2003, 30, 72–80. [Google Scholar] [CrossRef]
- Shikhov, A.; Ilyushina, P.; Makarieva, O.; Zemlianskova, A.; Mozgina, M. Satellite-Based Mapping of Gold-Mining-Related Land-Cover Changes in the Magadan Region, Northeast Russia. Remote Sens. 2023, 15, 3564. [Google Scholar] [CrossRef]
- Atici, T. Diatoms of Seydisuyu Stream Basin (Turkey) and Assessment of Water Quality by Statistical and Biological Approaches. Sigma J. Eng. Nat. Sci. 2018, 36, 271–288. [Google Scholar]
- Gerhardt, A.; Janssens de Bisthoven, L.; Soares, A.M.V.M. Macroinvertebrate response to acid mine drainage: Community metrics and on-line behavioural toxicity bioassay. Environ. Pollut. 2004, 130, 263–274. [Google Scholar] [CrossRef] [PubMed]
- Poikane, S.; Herrero, F.S.; Kelly, M.G.; Borja, A.; Birk, S.; van de Bund, W. European aquatic ecological assessment methods: A critical review of their sensitivity to key pressures. Sci. Total Environ. 2020, 740, 140075. [Google Scholar] [CrossRef] [PubMed]
- Reynolds, C.S. The concept of ecological succession applied to seasonal periodicity of freshwater phytoplankton. Verh. Int. Ver. Limnol. 1988, 23, 683–691. [Google Scholar] [CrossRef]
- Gerhardt, A.; Janssens de Bisthoven, L.; Guhr, K.; Soares, A.M.V.M.; Pereira, M.J. Phytoassessment of Acid Mine Drainage: Combining Lemna gibba bioassay and Diatom community structure. Ecotoxicology 2008, 17, 7–58. [Google Scholar] [CrossRef]
- Gerhardt, A. Aquatic Behavioral Ecotoxicology—Prospects and Limitations. Hum. Ecol. Risk Assess. Int. J. 2007, 13, 481–491. [Google Scholar] [CrossRef]
- Kelly, M.; Boonham, N.; Juggins, S.; Kille, P.; Mann, D.; Pass, D.; Sapp, M.; Sato, S.; Glover, R.; Walsh, K. A DNA Based Diatom Metabarcoding Approach for Water Framework Directive Classification of Rivers; Science Report SC140024; Environment Agency: Bristol, UK, 2018; 151p. [Google Scholar]
- Barinova, S.; Gabyshev, V.; Genkal, S.; Gabysheva, O. Diatoms of Small Water Bodies as Bioindicators in the Assessment of Climatic and Anthropogenic Impacts on the Coast of Tiksi Bay, Russian Arctic. Water 2023, 15, 1533. [Google Scholar] [CrossRef]
- Hustedt, F. Systematische und Ökologische Untersuchungen über die Diatomeenflora von Java, Bali und Sumatra; Otto Koeltz Science: Königstein, Germany, 1980; pp. 131–177. [Google Scholar]


| Station No. | Name of Sampling Station | Sampling Date | North | East |
|---|---|---|---|---|
| 186 | Bolshaya Kuonamka River above the mouth of the Darikhan River | 24 June 2008 | 69°18′6″ | 106°53′16″ |
| 187 | Mouth of Darikhan River | 24 June 2008 | 69°18′9″ | 106°53′35″ |
| 188 | Bolshaya Kuonamka River below the mouth of the Darikhan River | 24 June 2008 | 69°18′28″ | 106°53′42″ |
| 189 | Bolshaya Kuonamka River above the mouth of the Daldyn River | 27 June 2008 | 69°25′34″ | 109°1′35″ |
| 190 | Mouth of Daldyn River | 27 June 2008 | 69°25′37″ | 109°2′6″ |
| 191 | Bolshaya Kuonamka River below the mouth of the Daldyn River | 27 June 2008 | 69°25′26″ | 109°3′48″ |
| 192 | Bolshaya Kuonamka River above the mouth of the Delindeh River | 30 June 2008 | 69°58′4″ | 110°58′60″ |
| 193 | Mouth of Delindeh River | 30 June 2008 | 69°57′49″ | 110°59′54″ |
| 194 | Bolshaya Kuonamka River below the mouth of the Delindeh River | 30 June 2008 | 69°57′16″ | 111°1′22″ |
| 195 | Bolshaya Kuonamka River above the mouth of the Dyuken River | 2 July 2008 | 69°53′48″ | 112°48′0″ |
| 196 | Mouth of Dyuken River | 2 July 2008 | 69°54′1″ | 112°48′40″ |
| 197 | Bolshaya Kuonamka River below the mouth of the Dyuken River | 2 July 2008 | 69°54′49″ | 112°48′29″ |
| 198 | Bolshaya Kuonamka River above the mouth of the Staraya River | 4 July 2008 | 70°45′1″ | 112°36′20″ |
| 199 | Mouth of Staraya River | 4 July 2008 | 70°44′58″ | 112°36′43″ |
| 200 | Bolshaya Kuonamka River below the mouth of the Staraya River | 4 July 2008 | 70°44′23″ | 112°37′40″ |
| 201 | Bolshaya Kuonamka River above the mouth of the Malaya Kuonamka River | 5 July 2008 | 70°46′3″ | 113°19′42″ |
| 202 | Mouth of Malaya Kuonamka River | 5 July 2008 | 70°46′10″ | 113°20′40″ |
| 203 | Anabar River below the mouth of the Malaya Kuonamka River | 5 July 2008 | 70°46′45″ | 113°20′15″ |
| 204 | Anabar River above the mouth of the Udzha River | 8 July 2008 | 71°46′0″ | 114°16′17″ |
| 205 | Mouth of the Udzha River | 8 July 2008 | 71°46′15′ | 114°17′43′ |
| 206 | Anabar River below the mouth of the Udzha River | 8 July 2008 | 71°46′41″ | 114°19′34″ |
| 207 | Anabar River above the Srednyaya River | 10 July 2008 | 72°26′18″ | 113°59′30″ |
| 208 | Mouth of Srednyaya River | 10 July 2008 | 72°27′11″ | 114°10′10″ |
| 209 | Anabar River below Srednyaya River | 10 July 2008 | 72°27′29″ | 114°12′39″ |
| 210 | Anabar River above the Yuryung-Khaya settlement | 10 July 2008 | 72°46′44″ | 113°18′58″ |
| 211 | Mouth of Anabar River (Anabar Bay) | 12 July 2008 | 73°9′60″ | 113°34′26″ |
Disclaimer/Publisher’s Note: The statements, opinions and data contained in all publications are solely those of the individual author(s) and contributor(s) and not of MDPI and/or the editor(s). MDPI and/or the editor(s) disclaim responsibility for any injury to people or property resulting from any ideas, methods, instructions or products referred to in the content. |
© 2023 by the authors. Licensee MDPI, Basel, Switzerland. This article is an open access article distributed under the terms and conditions of the Creative Commons Attribution (CC BY) license (https://creativecommons.org/licenses/by/4.0/).
Share and Cite
Barinova, S.; Gabyshev, V.; Gabysheva, O. Phytoplankton in the Ecological Assessment of the Mining Facilities Influence on the Anabar River in the Permafrost Zone of the Arctic, Eastern Siberia, Russia. Land 2023, 12, 1775. https://doi.org/10.3390/land12091775
Barinova S, Gabyshev V, Gabysheva O. Phytoplankton in the Ecological Assessment of the Mining Facilities Influence on the Anabar River in the Permafrost Zone of the Arctic, Eastern Siberia, Russia. Land. 2023; 12(9):1775. https://doi.org/10.3390/land12091775
Chicago/Turabian StyleBarinova, Sophia, Viktor Gabyshev, and Olga Gabysheva. 2023. "Phytoplankton in the Ecological Assessment of the Mining Facilities Influence on the Anabar River in the Permafrost Zone of the Arctic, Eastern Siberia, Russia" Land 12, no. 9: 1775. https://doi.org/10.3390/land12091775