Article

Diagnosis of Key Ecological Restoration Areas in Territorial Space under the Guidance of Resilience: A Case Study of the Chengdu–Chongqing Region

1
College of Resource, Sichuan Agricultural University, Chengdu 611130, China
2
Institute of Mountain Hazards and Environment, Chinese Academy of Sciences, Chengdu 610299, China
3
Key Laboratory of Investigation and Monitoring, Protection and Utilization for Cultivated Land Resources, Ministry of Natural Resources, Chengdu 611130, China
*
Authors to whom correspondence should be addressed.
These authors contributed equally to this work as co-first authors.
F.L. is the first corresponding author and Q.H. is the last corresponding author.
Land 2023, 12(5), 973; https://doi.org/10.3390/land12050973
Submission received: 10 March 2023 / Revised: 14 April 2023 / Accepted: 19 April 2023 / Published: 27 April 2023

Abstract

:
Territorial space ecological restoration is a significant way to map the development of “ecological priority, green, and low-carbon” and realize the goal of reducing carbon emissions. Based on the evaluation of the degree of urban ecological resilience restriction, this study aimed to diagnose the key areas of surface–line–point ecological restoration under the guidance of the resilience target by constructing a patch–corridor–matrix ecological network; then, the corresponding repair strategy was proposed. The results showed that (1) there was an obvious core–periphery structure in the resilience restriction intensity of the Chengdu–Chongqing region, showing a gradual decreasing trend from Chengdu and Chongqing to the surrounding cities; (2) the regional ecological network, including 17 ecological source patches and 33 potential ecological corridors, was identified; and (3) the diagnosed key areas of ecological restoration were composed of surface–line–point multiscale spatial morphology, including 7793.81 km2 of key areas of ecological source restoration, 380.39 km of key areas of ecological corridor restoration, and 29 key areas of ecological pinch point restoration. The construction of ecological restoration strategies with carbon neutralization as the core idea at different scales was realized. The research can provide a reference for scientifically identifying key areas of ecological restoration in territorial space, coordinating and planning major projects of ecological restoration, and optimizing the allocation of natural resources.

Graphical Abstract

1. Introduction

With the background of the rapid increase in the global population, the continuous extension of city size, and the sharp contraction of natural resources, harmonious coexistence between humans and nature and the sustainable development of habitats have turned into common themes. At present, to build a suitable ecological environment for human beings, the focus of sustainable development research has gradually shifted to ecological security research concerning the acceleration of green low-carbon development and the reduction in carbon emission intensity [1]. Territorial space is the material basis, energy resource, and constituent element for ecological civilization construction. Due to the acceleration of the urbanization process, large-scale sustainable development and construction have led to significant changes in human–land relationships and territorial space patterns, triggering a series of ecological problems [2]. Therefore, natural recovery or human intervention is needed to carry out ecological restoration and ecological construction activities, and ecological restoration has gradually become a research hotspot [3,4]. How to implement the concept of mountain–river–forest–farmland–lake–grass life communities, accelerate lower carbon emissions, and realize ecological restoration and protection while simultaneously ensuring the integrity and balance of the ecosystem have become the core problems faced by the current territorial space governance.
The purpose of territorial consolidation and ecological restoration is to adjust and optimize territorial spatial structure and strengthen ecological function restoration to promote the safety and stability of the ecological system and coordinate the sustainable development of the whole region. The current research on the ecological restoration of territorial space focuses on single-object restoration based on micro-scale pilot studies and fails to comprehensively consider the coordination and sustainability of multifactor restoration from a global perspective [5]. The macro-scale studies focus on the implementation of national ecological protection and construction engineering techniques and the evaluation of engineering effects. The meso-scale studies mainly implement regional ecological protection construction and restoration projects and are less studied from the perspective of ensuring the integrity of the ecosystem. Due to the lack of discussion on maintaining ecosystem integrity and structural connectivity at the regional scale, there is a phenomenon characterized by good local effects, low overall income, and even a decline in ecosystem service function [6]. As an important part of ecological protection, the diagnosis of key ecological restoration areas has become necessary in the process of ecological restoration. Existing studies have constructed ecological networks based on the theory of landscape ecology and, on this basis, delineated the ecological restoration zoning of territorial space [7,8]. It has become an important development direction to identify ecological obstacle areas, ecological pinch points, and ecological breakpoints and then diagnose the key areas of ecological restoration [9,10]. The existing research regards the source-resistance surface-ecological corridor as the general pattern of the ecological network space [11]. The construction of an ecological network effectively maintains the integrity of the ecosystem, ensures the safety of the ecological region, and provides guiding significance for ecological protection and ecological restoration. Overall, the ecological restoration of territorial space in current times is changing from singular local renovation to diversified overall governance, and the spatial scale of restoration work is becoming more macroscopic. How to coordinate the development of natural ecology and human society from the overall perspective, construct the pattern of regional ecological restoration, and identify the key areas of ecological restoration in territorial space still require further research.
Resilience describes the ability of a system to absorb interference while maintaining the same infrastructure and function, and it also refers to self-organization and adaptation to pressure and change [12,13,14]. In 1973, Holling first integrated resilience into ecosystem research to describe the persistence of natural systems in the face of disturbances [15]. Subsequent studies have shifted from ecology to human ecology, and resilience concepts have also been used in urban research [10]. As the basis of urban construction, the improvement in natural ecosystem resilience is conducive to the sustainable development of cities. Urban resilience, as a mirror of a city’s ability to withstand and recover from disasters, can provide the basis for urban ecosystem protection and management decisions and offer a cognitive basis for ecological security [16]. The concept of ecosystem resilience also provides a theoretical framework for how urban ecosystems respond to pressure and shocks [17,18]. Therefore, evaluating urban ecological resilience and measuring urban ecological security are essential for systematically maintaining urban ecological security [19]. At present, most studies have regarded ecological resilience as a physical attribute of an ecosystem and evaluated the resilience of ecosystems from the aspects of ecological carrying capacity and ecological resilience to reflect the self-resistance and self-recovery of ecosystems after external disturbance [20,21]. In a constantly changing social environment, urban ecosystem resilience experiences dual pressure from both natural and human factors [22,23]. When the external pressure is overloaded, the resistance, adaptability, and reduction force represented by resilience are greatly limited. Additionally, the key areas of ecological restoration are vulnerable areas of ecological resilience. When they are subjected to strong external factors, their internal ecological material cycle is easily destroyed. Based on this, measuring the degree to which resilience is restricted by external factors is vital in accurately diagnosing the damaged areas of ecological structure and function to be repaired. However, the number of quantitative studies on the interference intensity of external factors in the literature is relatively low, and an evaluation model and its corresponding evaluation indicators that can be applied universally remain lacking. Therefore, the combination of the resilience concept and the diagnosis of key areas of ecological restoration provides a new perspective and method for addressing the ecological restoration of territorial space.
The Chengdu–Chongqing region is an area with a high level of industrialization and urbanization in the upper reaches of the Yangtze River. However, the rapid economic development of Chengdu–Chongqing has seriously damaged the ecological environment in this region. Water pollution, air pollution, industrial pollution, and other issues have become increasingly prominent. Compared with the urban agglomeration in the eastern region, the ecological development of the Chengdu–Chongqing region is relatively slow, and the development situation is unsatisfactory. The restricted degree of ecological environment capacity is becoming a bottleneck for the Chengdu–Chongqing region to develop into an important growth pole in western China [24,25]. As the core construction point of ecological barriers in the upper reaches of the Yangtze River, the Chengdu–Chongqing region needs to create a green and low-carbon development model while ensuring economic growth, and it is necessary for the region to prioritize the restoration of the ecological environment to promote the construction of ecological civilization, improve the territorial space planning system, and form a pattern of harmonious coexistence between man and nature [26,27,28]. Therefore, this paper determined the restricted degree of urban ecological resilience by studying the factors affecting urban ecological resilience and then identified and extracted ecological sources, ecological resistance surfaces, and ecological corridors to construct an ecological network and diagnose the key areas of ecological restoration. By exploring the application value of ecosystem services and the systematic restoration of ecosystems, this paper aimed to provide a theoretical reference for exploring the application value of ecosystem services, ensuring systematic ecological restoration, formulating sustainable development strategies for land space, and promoting the construction of regional ecological restoration areas [29,30].

2. Materials and Methods
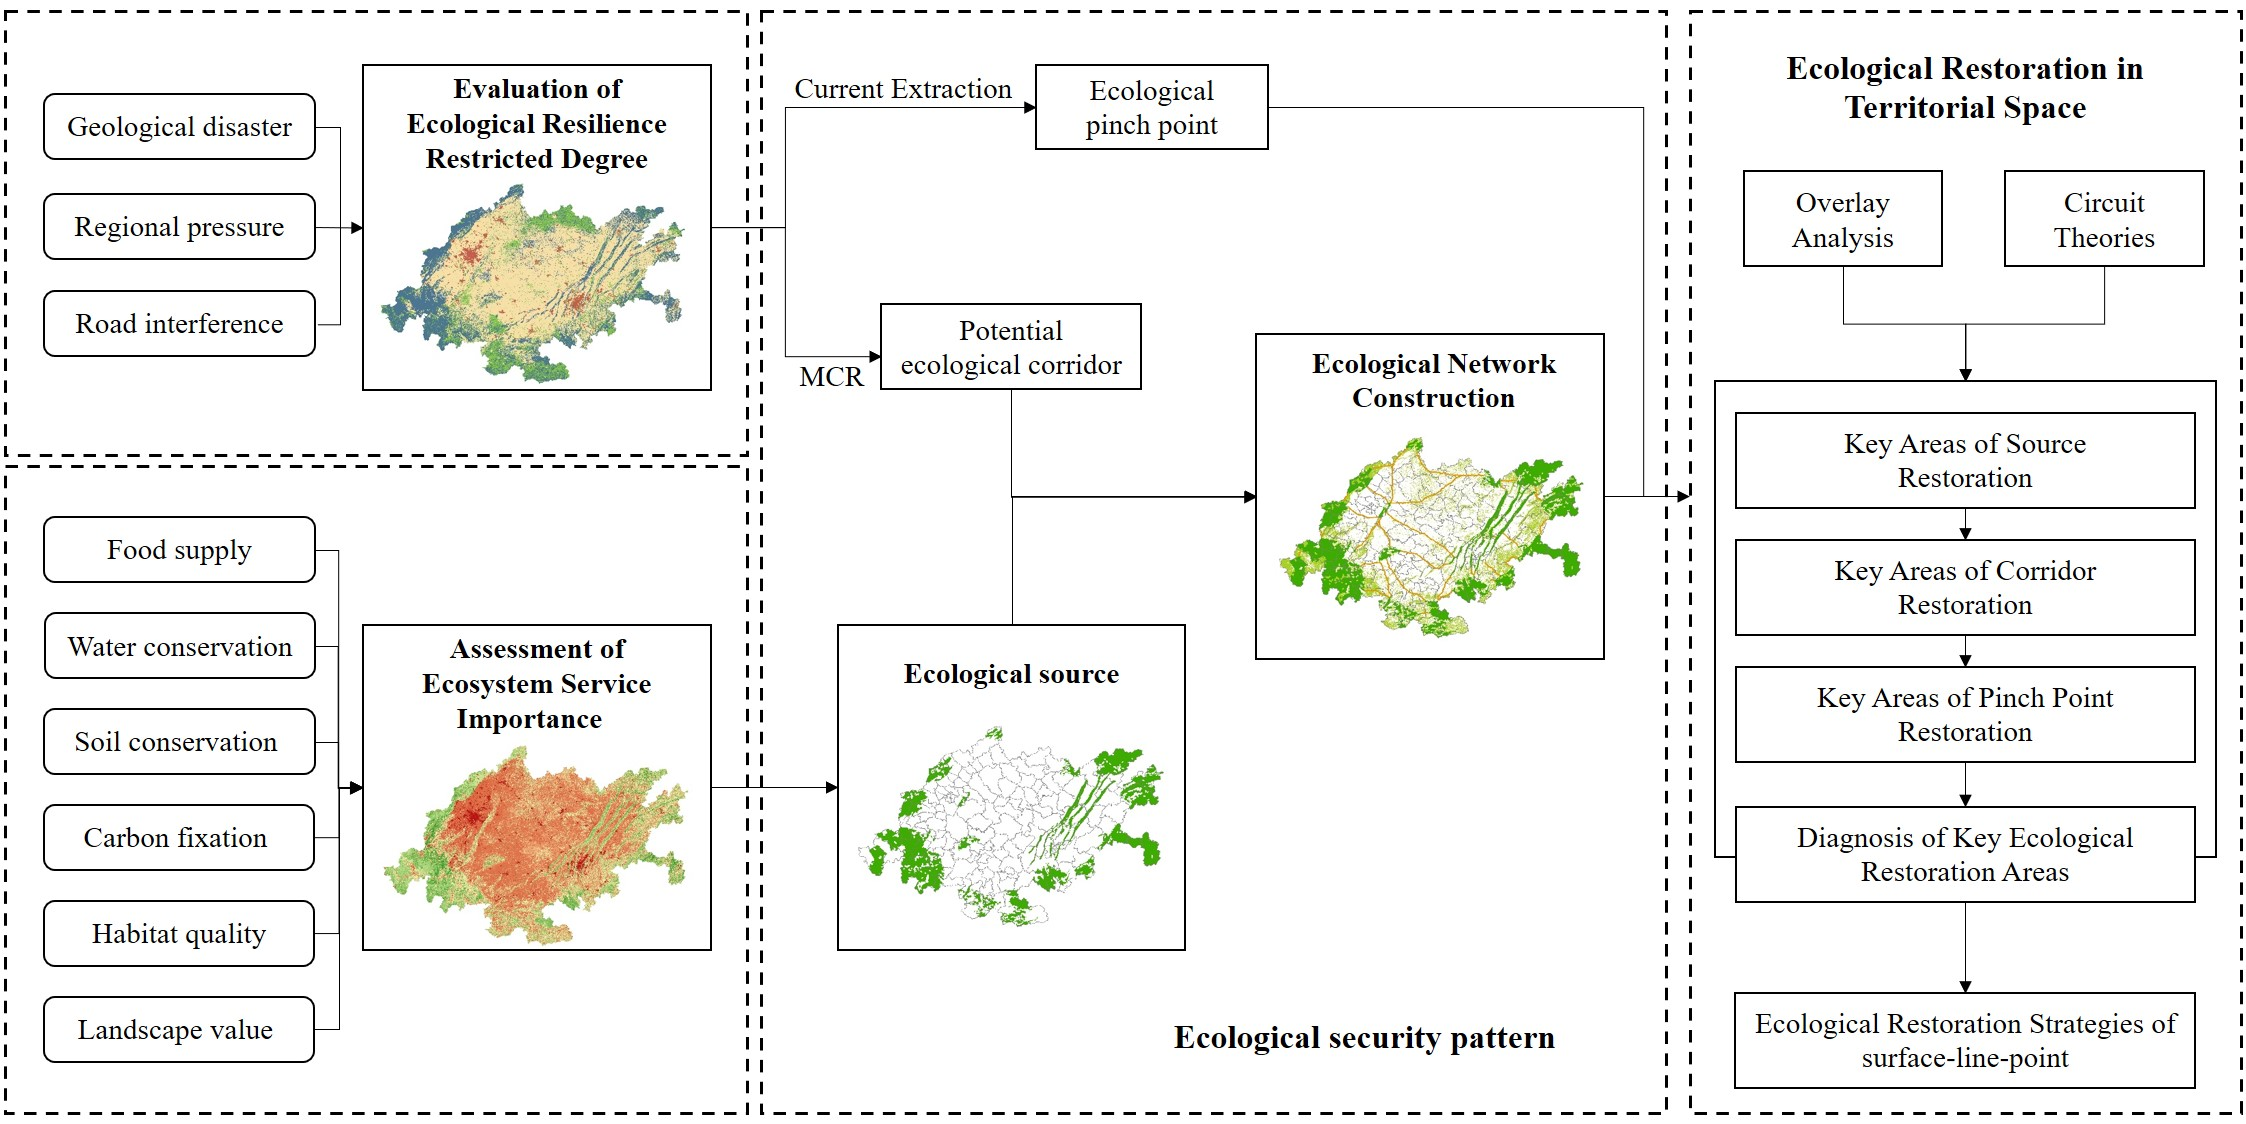
2.1. Study Area

The Chengdu–Chongqing region is located in the Sichuan Basin in the upper reaches of the Yangtze River in western China, with a total area of 185,000 km2 (Figure 1). The region is situated in the subtropical monsoon climate zone, with an average annual precipitation of approximately 1000–1300 mm and an average annual temperature of 16–18 °C. Its forest resources are abundant, and its vegetation types, which are mainly subtropical evergreen broad-leaved forests, are diverse. The surface of the middle basin in the region is flat, and the edge has mountains that undulate greatly. There are eight rivers, including the Qingyi River, Jialin River, Fujiang River, and Minjiang River, in this area, and the water network is complex. The Chengdu–Chongqing region has the most concentrated population density, the strongest industrial strength, and the broadest market development in Southwest China. It has a unique strategic position in the overall situation of national development. As the green development demonstration area of the Yangtze River Economic Belt, it is necessary to ensure ecological quality, optimize the spatial layout of land, and adhere to the principle of ecological priority and green low carbon while constructing the important growth pole of western development. Currently, in the Chengdu–Chongqing region, the ecological service function is negatively influenced during the pursuit of economic development, and soil erosion and other threats still need to be solved.

2.2. Data Sources

The basic data used in this paper are as follows: (1) Chengdu–Chongqing digital elevation model (DEM) data, with an accuracy of 30 m, which came from the geospatial data cloud platform, through elevation data in ArcGIS software slope extraction (https://www.gscloud.cn/, accessed on 2 November 2021); (2) the normalized difference vegetation index (NDVI) was derived from the global vegetation index change dataset launched by NASA Land Data Center (https://lpdaac.usgs.gov/, accessed on 2 November 2021); (3) the annual rainfall, temperature changes, and road layout data came from the National Earth System Science Data Center (http://www.geodata.cn/, accessed on 2 November 2021); (4) the soil type data were downloaded from the National Qinghai–Tibet Plateau Science Data Center (http://data.tpdc.ac.cn/, accessed on 2 November 2021); (5) the river data and the soil erosion data both came from the resource and environmental science and data center (https://www.resdc.cn/, accessed on 2 November 2021); and (6) the land use types in the Chengdu–Chongqing region were divided into eight categories: cultivated land, forestland, grassland, shrub land, wetland, water area, bare land, and construction land. The data were derived from the global geographic information public product GlobeLand30 with a precision of 30 m (http://www.globallandcover.com/, accessed on 2 November 2021). (7) Nighttime light data were derived from the data platform of the Earth Observation Group of the National Oceanic and Atmospheric Administration of the United States, and irrelevant light sources and cloud cover interference factors were removed (https://ngdc.noaa.gov/eog/viirs/, accessed on 2 November 2021). (8) Population density data were retrieved from the global high-resolution population plan project, and the accuracy was 30 m (https://www.worldpop.org, accessed on 2 November 2021). All data were unified using a 250 m precision grid unit and CGCS2000 coordinate system for subsequent calculation and processing.

2.3. Methods

The research methods consisted of three parts, namely the evaluation of the degree of urban ecological resilience restriction, the construction of a regional ecological network, and the identification of key ecological restoration areas in territorial space. The research route is shown in Figure 2.

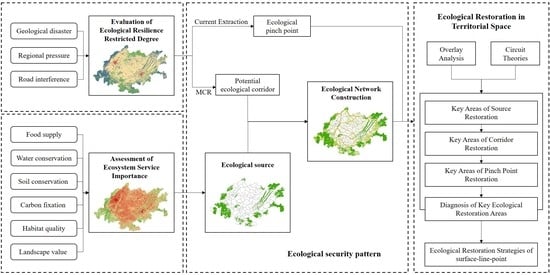
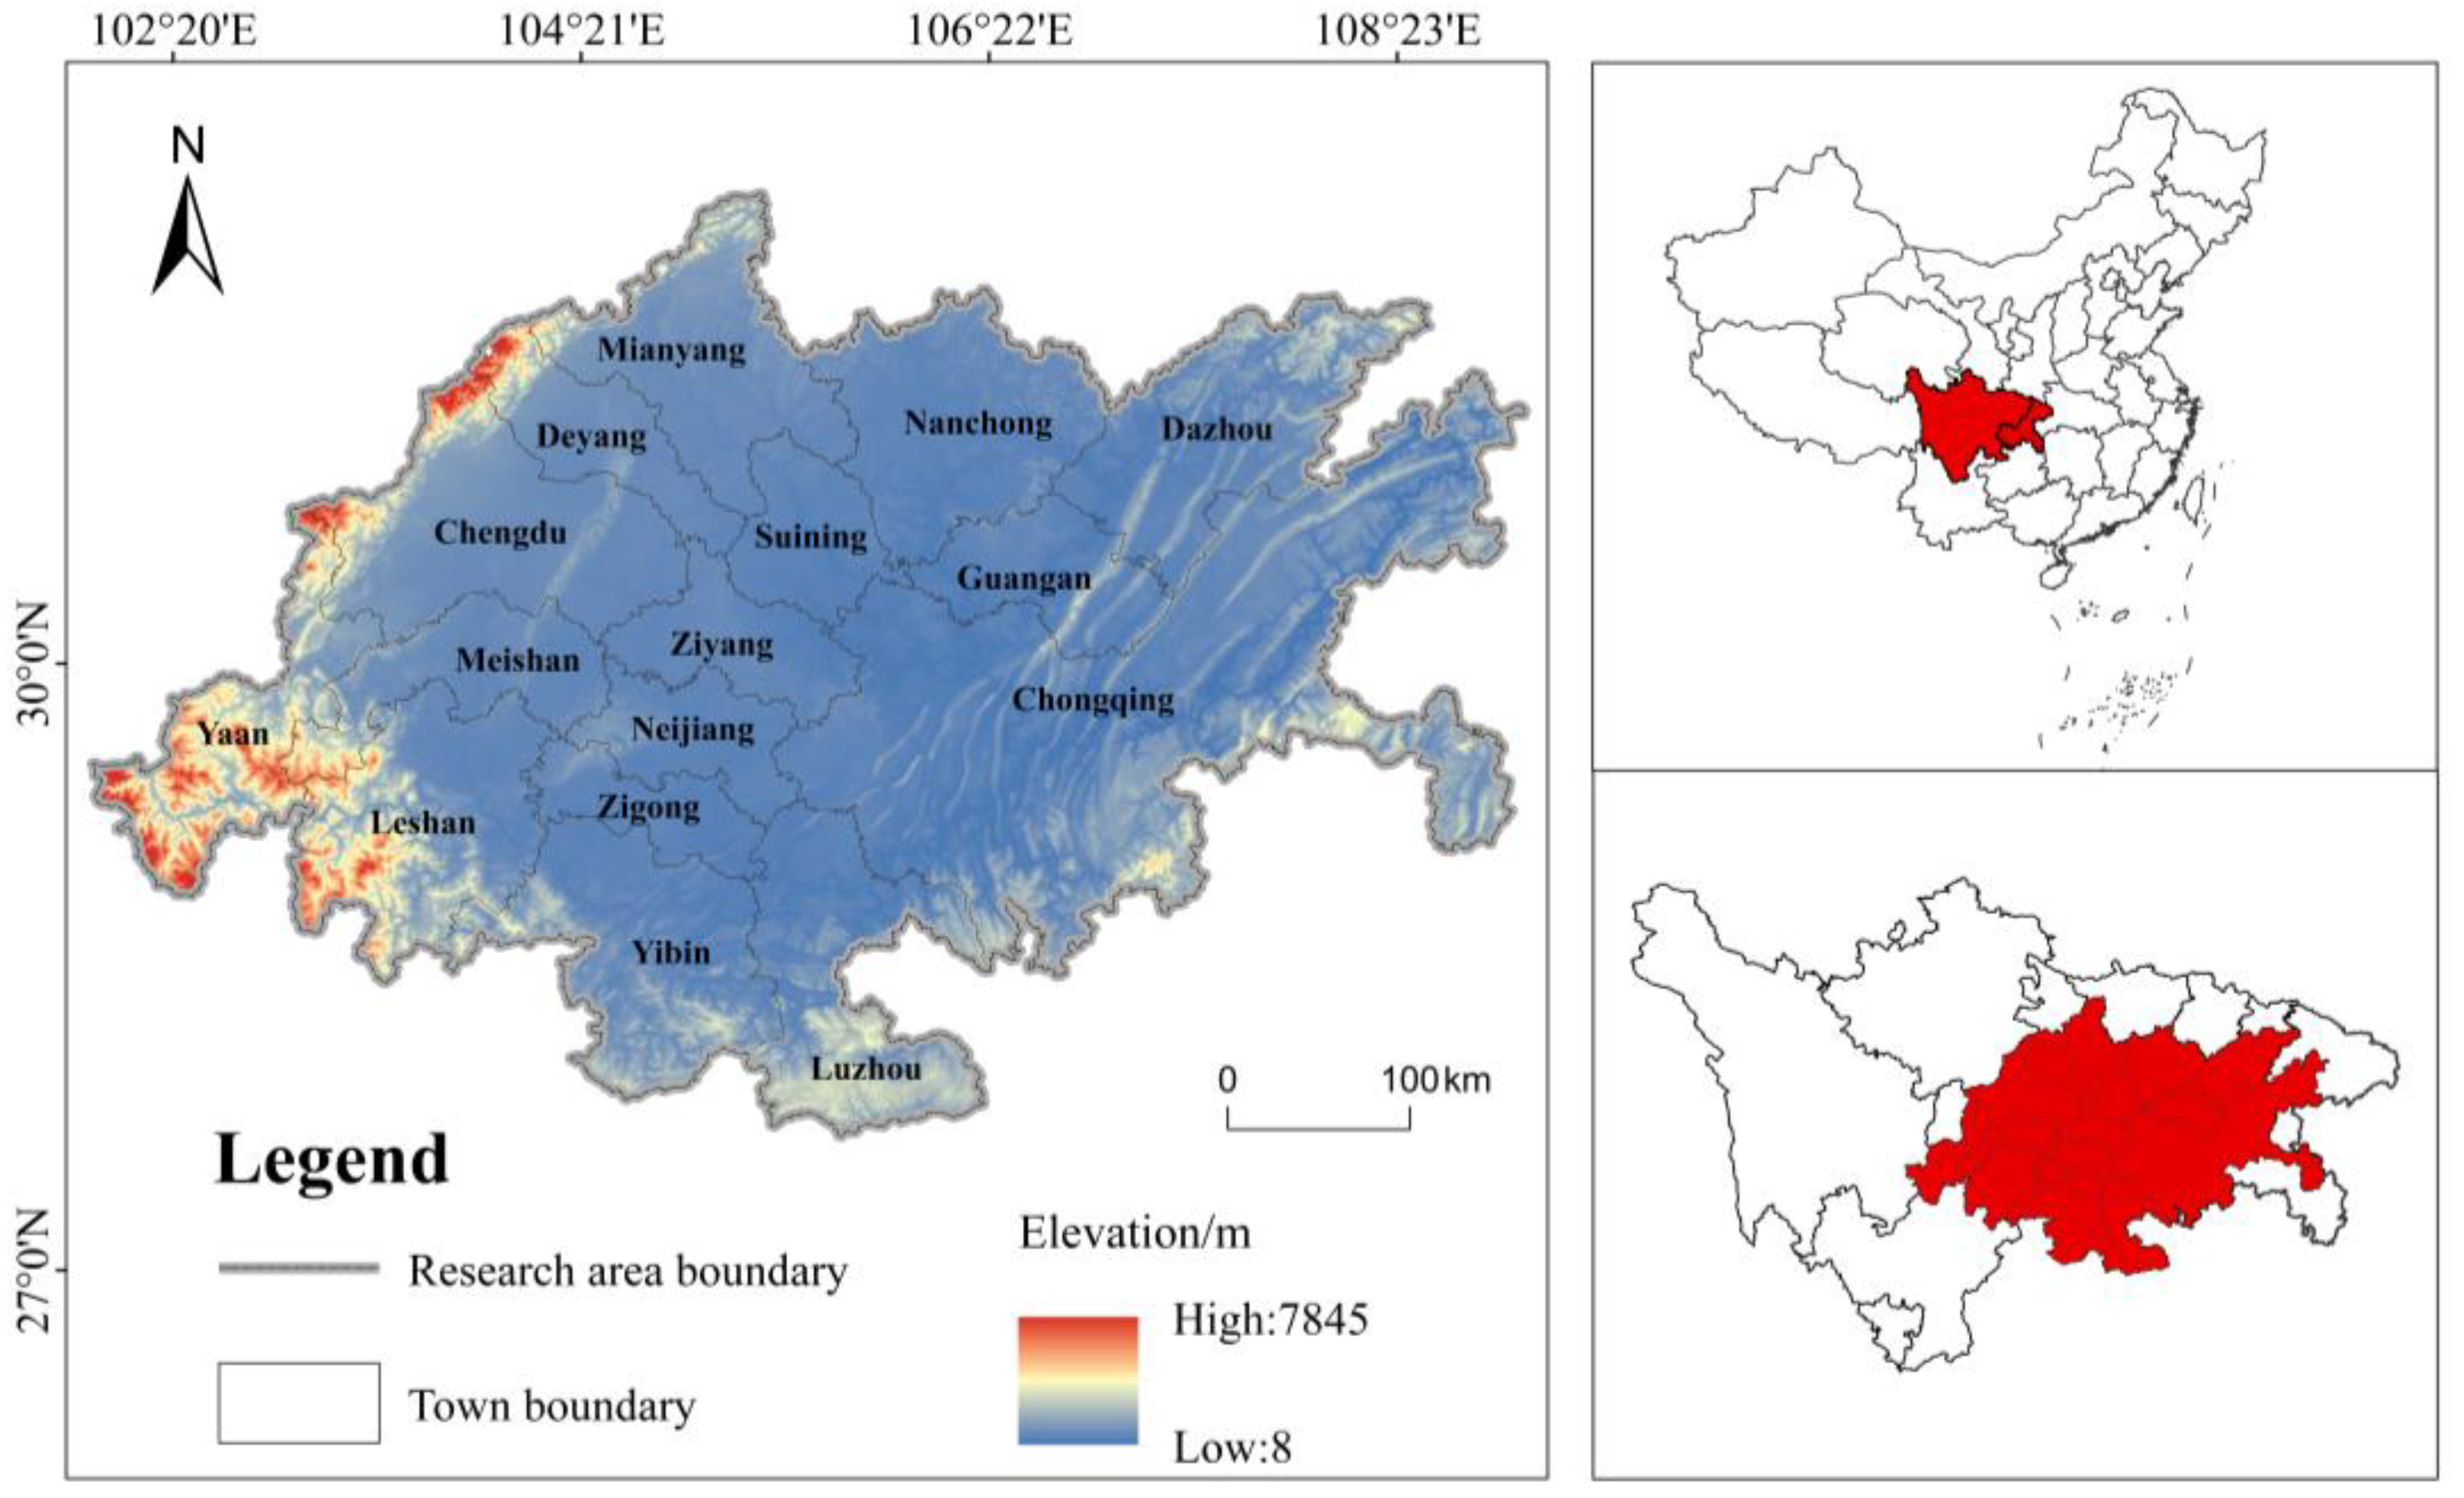
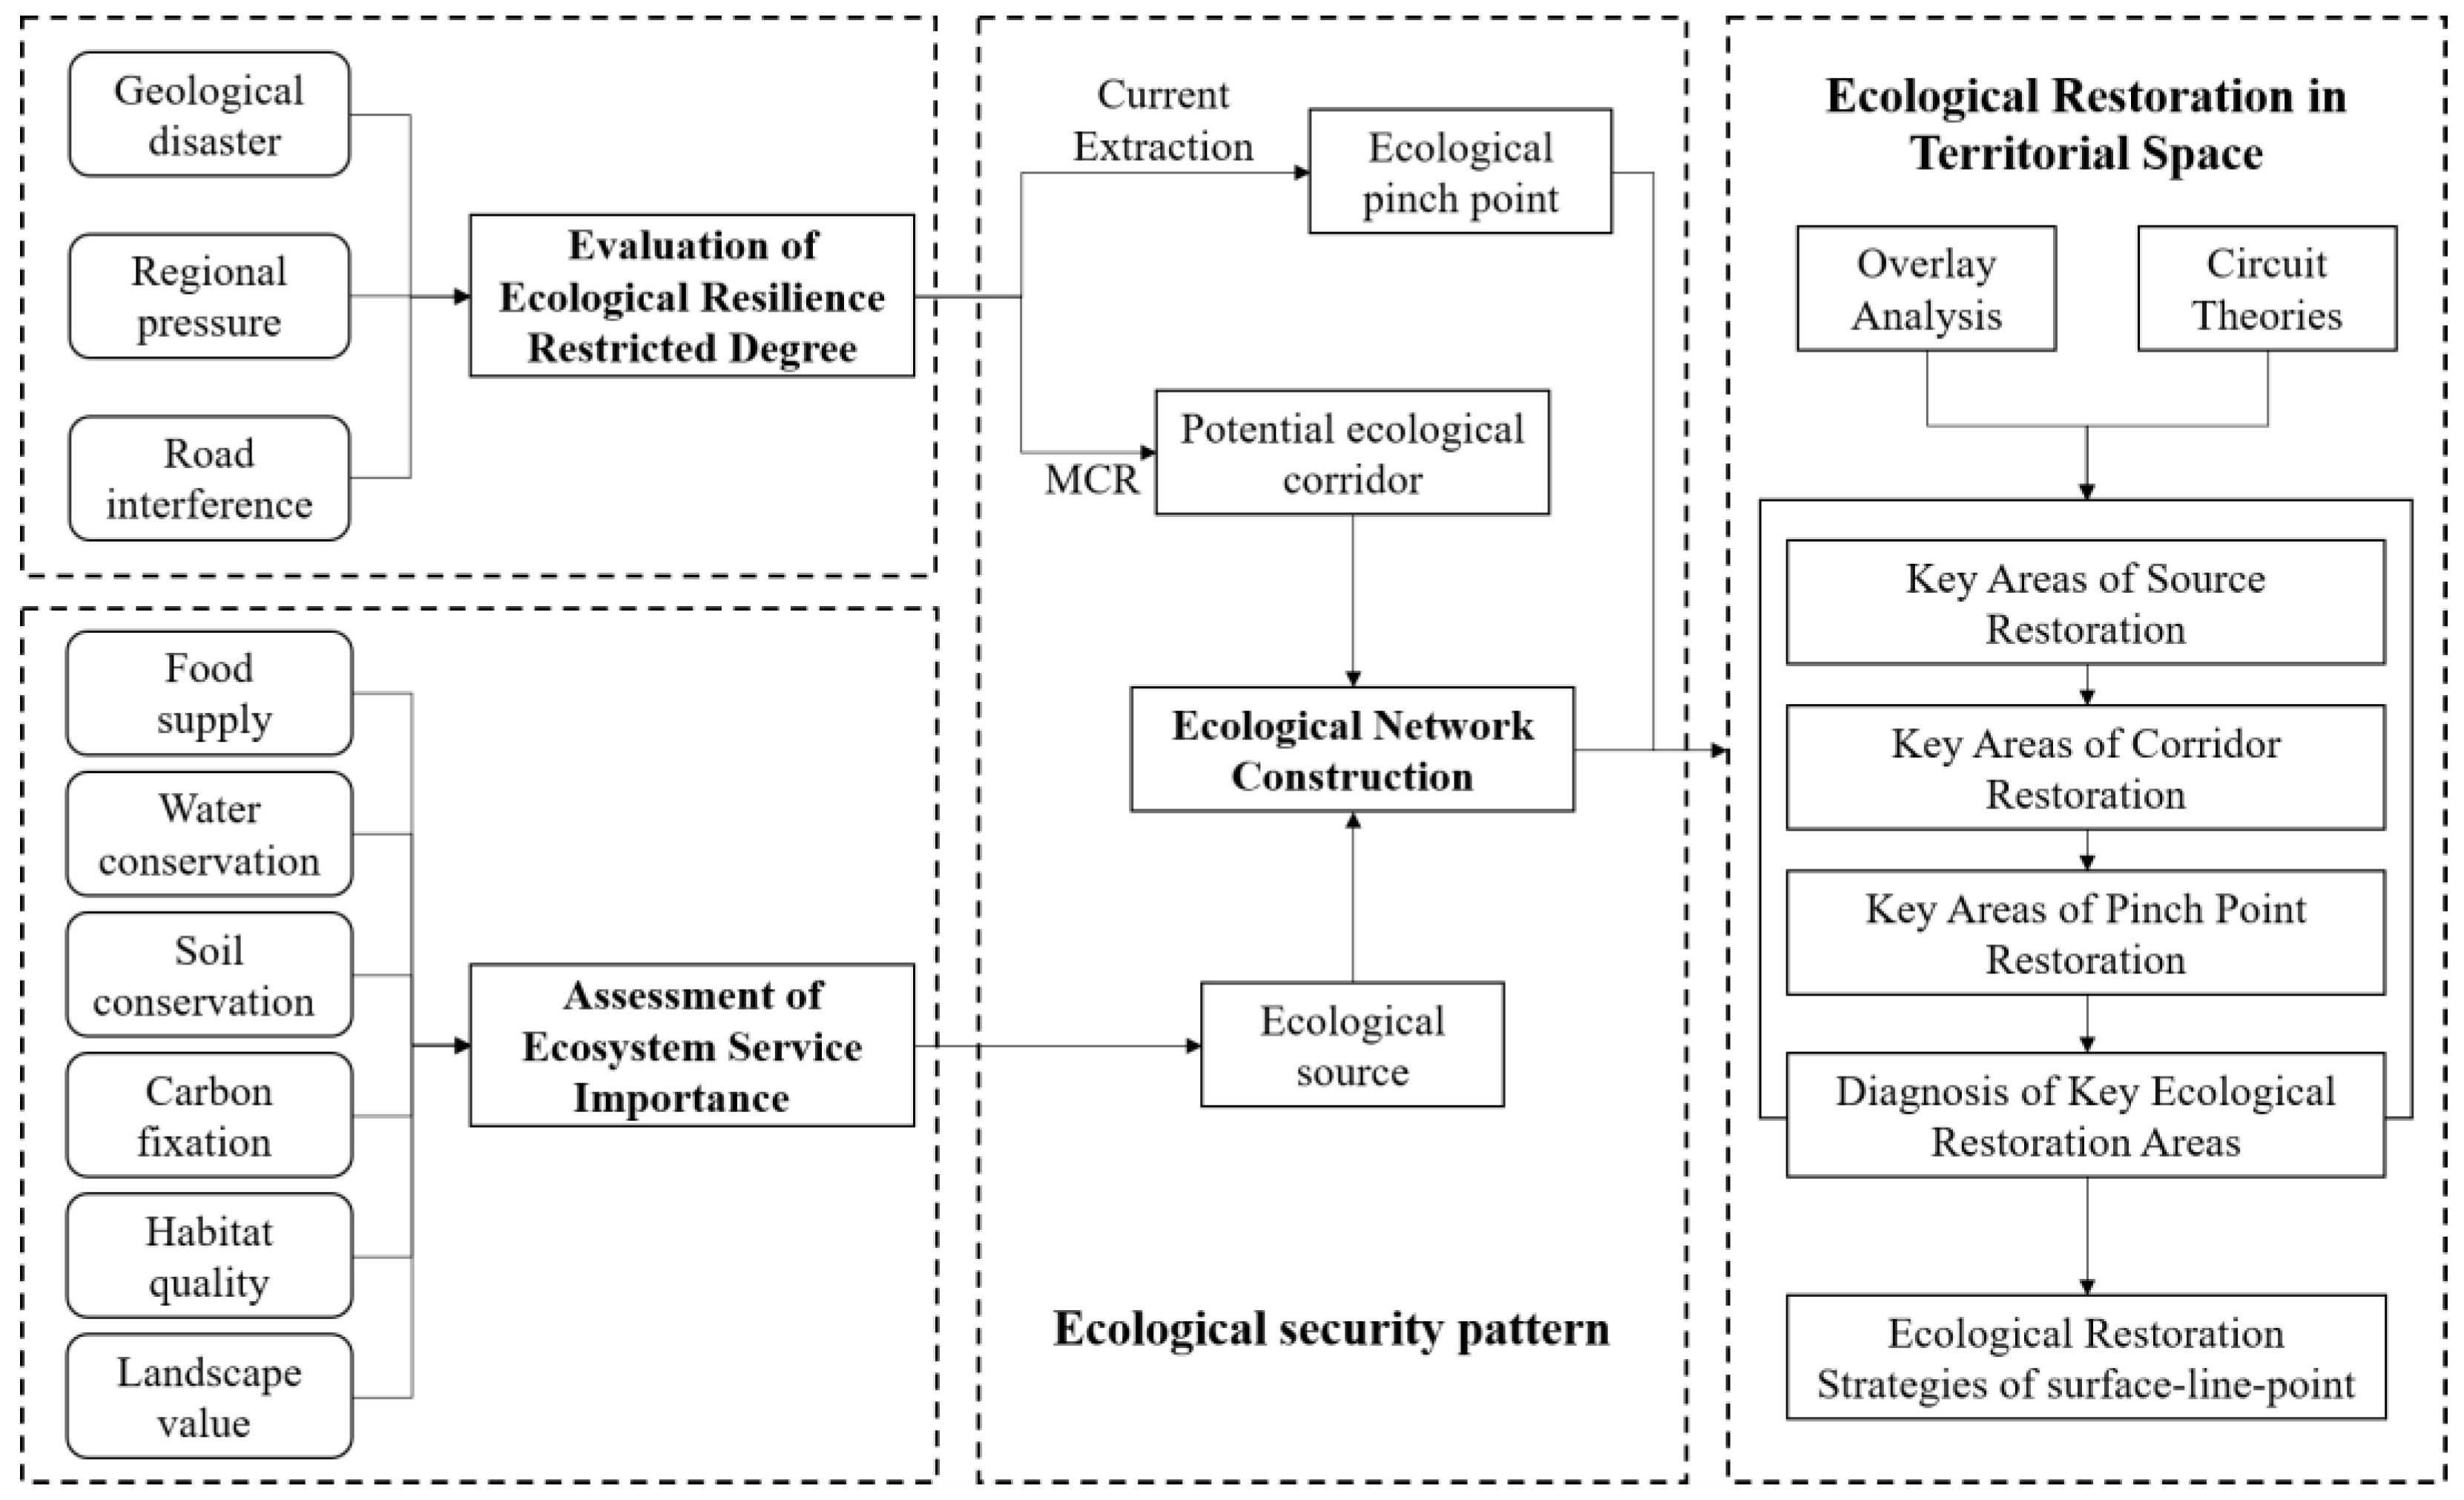
2.3.1. Evaluation of Urban Ecological Resilience Restricted Degree

Urban ecological resilience focuses on the ability of an urban ecosystem to cope with external human disturbances and natural disasters [23,31]. The evaluation based on the concept of resilience can diagnose regional ecosystems with disordered structures and damaged functions in cities and provide a theoretical basis for ecological protection and restoration [32,33]. From the perspective of measuring the limiting degree of external factors on urban ecological resilience, this study determined the restricted level of urban ecological resilience by studying the resistance factors that limited urban ecological resilience and then realized diagnosing key areas of ecological restoration.
Based on the regional characteristics of the Chengdu–Chongqing region, the ecological resilience constraint was divided into two dimensions: natural suppression force and human disturbance force. Twelve influencing factors were selected from three aspects: geological disasters, regional pressure, and road interference. The relative weights of different influencing factors were determined by the analytic hierarchy process (AHP) method based on the actual conditions of the ecological environment in the Chengdu–Chongqing region (Table 1). The indicator system of the ecological resilience restricted degree was established [34]. Eight factors, such as fractional vegetation cover, soil erosion, and slope, were selected as evaluation indicators for the geological disaster layer to comprehensively characterize the degree of natural process disturbance to the ecosystem in the Chengdu–Chongqing region. Combined with the present situation of the Chengdu–Chongqing region, this paper mainly considered two types of natural geological disasters, namely the disaster of slope rock mass movement (collapse, landslide, debris flow) and soil and water loss. The nighttime light index, population density, and land use type were selected as indicator factors for the regional pressure layer to reflect population activity intensity, population aggregation, and ecological suitability of land [35], further reflecting the level of human interference with the environment visually. The construction of artificial roads could block the migration of information flow, nutrient flow, and species flow in the ecosystem. At the same time, human transportation activities in the road system easily destroy the normal operation of adjacent ecosystems. Therefore, road interference was regarded as an independent evaluation layer, and the distance from the comprehensive road network composed of national roads, provincial roads, highways, and railways was used as an indicator factor to reflect the influence degree of urban natural ecosystems by road systems.
The selected indicators were different in nature and dimension, so they could not be directly used for the evaluation of the restricted degree of urban ecological resilience. Consequently, the “Max-Min” standardized method was adopted for the unified treatment of all the participating indicators [36]. The influences of the 12 selected evaluation factors on resilience were compared, and they were divided into positive and negative indicators. With an increase in value, the positive indicator becomes increasingly restrictive to resilience, while the reverse indicator becomes less restrictive to resilience. Qualitative indicators in the evaluation system need to be quantified. Referring to the relevant research results [37,38], the quantitative assignment of the indicator factors was carried out according to the grade assignment method (Table 2).

2.3.2. Ecological Network Construction

Ecological Source Identification
Ecological sources are the gathering habitat, survival, and reproduction sites of regional species as well as key migration stopover sites, which function as the basis for the construction of ecological security patterns [30]. Ecosystem services refer to the valuable products and services brought about by ecosystems that humans obtain directly or indirectly, and they are needed to maintain human survival and development [39,40,41,42].
This paper mainly identified ecological sources based on the importance of ecosystem services [43]. The assessment of ecosystem service importance was based on the ecological environmental status of a certain area, and the spatial geographical laws of ecosystem services were analyzed [23,44]. The following six indicators were selected for the assessment of ecosystem service importance (Table 3). First, the selection of food supply indicators characterized the supply service [45]. It is a significant service in the agroecosystem and plays a vital role in the survival of human beings and the development of the region. Second, indicators characterizing adjusting services included water conservation [46], soil conservation [47], carbon fixation [48], and habitat quality [49]. Water conservation reflects the ability of ecosystem water storage and the mitigation of surface runoff; soil state stability plays a fundamental role in maintaining ecosystem stability, and soil conservation can effectively reflect an ecosystem’s ability to prevent soil erosion, prevent mud, and store sand; carbon fixation reflects the carbon absorption and storage capacity of ecosystems, which is of great significance to the balance of carbon cycle; and habitat quality reflects the ability of organisms to survive and develop in ecosystems and is of great significance to the construction of regional ecological security patterns. In addition, landscape value was selected as an indicator of the cultural service sector [50] and reflected the ability of the ecosystem to provide cultural services, such as tourism, entertainment, and leisure.
Through the equal weight comprehensive evaluation and analysis of the indicators used to determine the importance of ecosystem services, the top 10% of the value of ecosystem services was identified as the ecological source, and the areas with important ecological value should be protected.
Ecological Resistance Surface Construction
The resistance surface refers to the obstacles encountered by ecological elements in the process of flowing between different landscape units. It is a benchmark for calculating the diffusion path and extracting ecological corridors when ecological elements overcome resistance [51,52]. The natural ecosystem in urban agglomerations has been transformed into an ecosystem featuring man and nature coexistence. Highly uncertain natural disasters and intensive human activities have become the major driving forces for the evolution of the national territory [53]. Therefore, in the process of material conversion and energy flow, natural and human activities constantly disturb ecological factors, dramatically changing the ecological structure and process. The evaluation of the ecological resilience restricted degree could intuitively express the disturbance of external factors on ecosystems, and the penetration ability of ecological elements in high restriction zones would be seriously hindered. According to the negative correlation between the restricted degree of ecological resilience and the permeability of landscape ecological flow [8], the resistance surface was constructed based on the evaluation of the urban ecological resilience restricted degree.
Ecological Corridor Extraction
Ecological corridors are the spatial types of landscape ecosystems that effectively connect matter and energy in the study area, and they are also structural elements that improve landscape connectivity in the process of ecological restoration [39]. In this paper, the minimum cumulative resistance model (MCR) was used to calculate the lowest cost path (LCP) between the sources in the study area; that is, when the landscape ecological flows expanded outward through different landscape bases, the path with the lowest cost was extracted [54,55,56]. The formula is as follows:
M C R = f m i n j = n i = m D i j × R i
where f represents the positive correlation between the minimum cumulative resistance and the ecological process; D i j represents the distance from the ecological source to the spatial unit; and R i represents the drag coefficient value for species movement as the landscape ecological flows in the spatial units expand outward.

2.3.3. Identification of Key Ecological Restoration Areas in Territorial Space

A complete and stable ecological network is of great significance to maintaining the integrity of an ecosystem and its processes as well as ensuring regional ecological security. Areas in an ecological network that are subject to a high degree of negative disturbance are at great risk of having their functions and structures damaged, which will lead to a significant reduction in the overall function of the ecosystem. Therefore, such vulnerable areas were diagnosed as key areas of ecological restoration in the national territorial space [57].
Identification of Key Areas of Ecological Source Restoration
The extracted ecological sources in the study area and the evaluation results of the restricted degree of urban ecological resilience were subjected to a spatial overlay analysis of various elements [58]. The areas with a high restricted degree of urban ecological resilience in their ecological sources are prone to environmental degradation, which is likely to negatively influence the ecological function of the area. Thus, they were diagnosed as key areas of ecological source restoration.
Identification of Key Areas of Ecological Corridor Restoration
Ecological corridors have many functions, such as connecting broken habitats and protecting biodiversity. There are obstacle areas in the potential ecological corridors between the sources, which are defined as important areas with landscape features that hinder the movement of habitats. Removing such obstacle areas will enhance the connectivity of potential ecological corridors between sources [51,59]. Based on the ecological resistance surface under the guidance of resilience, this study identified the obstacle areas by the Barrier Mapper of Linkage Mapper toolbox [60]. After several comparative analyses, the best recognition effect was achieved when the search radius of the moving window was set to 250 m, which was consistent with the spatial resolution of the resistance surface. Referring to the existing research about verifying the rationality of the search radius [61], although the area of the high-value area of unit restoration connectivity increased with increasing radius, the core position remained unchanged. There was no significant difference between the key areas of ecological corridor restoration obtained when the radius was 100 m and the radius gradient increased.
Identification of Key Areas of Ecological Pinch Point Restoration
McRae et al. [62] applied electric circuit knowledge in physics to ecosystem evaluation systems, and a circuit theory based on exploring the ecological process of biological flow in landscape patterns and quantitatively evaluating the connectivity between ecological habitats was formed [63]. Due to the large resistance in the surrounding areas of some corridors, organisms cannot pass through high-resistance areas, so the corridors become relatively compressed, eventually forming ecological pinch points [64]. Simulating the flow of ecological elements based on circuit theory can obtain the high-intensity area of landscape ecological flow in the study area and be used to identify an ecological pinch point [64,65,66,67]. Ecological pinch points have a greater risk of ecological degradation and are endowed with higher landscape connectivity functions [63]. The destruction of ecological pinch points will lead to a fracture in ecological connectivity, a decline in ecosystem stability, and a decrease in resilience [68]. Research, with the aid of the Pinchpoint Mapper of the Linkage Mapper toolbox [69], selected the “all to one” mode iterative operation to simulate the abstract circuit of the ecological network, obtain the current intensity of each potential corridor, and identify the ecological pinch points. Moreover, the overlay analysis of the restricted areas of resilience and the ecological pinch points was carried out to identify the comprehensive influence degree of each restrictive factor of ecological resilience on each ecological pinch point, and then they were reclassified according to the restricted level, and the ecological pinch points with high interference intensity were taken as the key areas of ecological restoration.

3. Results

3.1. Analysis of Urban Ecological Resilience Restricted Degree

Based on the evaluation indicators of the degree of ecological resilience restriction, natural suppression and human disturbance were evaluated (Figure 3). The ecological resilience restricted level of the study area was obtained, and it ranged from 0 to 10, where 0 represented complete primitiveness and 10 represented the maximum ecological constraint. The study area was divided into low restriction zones (0–2), moderate low restriction zones (2–4), moderate high restriction zones (4–6), and high restriction zones (6–10) according to the restricted degree of ecological resilience. Each category had an area of 49,757.49 km2, 26,813.78 km2, 102,011.88 km2, and 6416.85 km2, accounting for 26.9%, 14.49%, 55.14%, and 3.47% of the study area, respectively. The total area of the medium high restriction zones and high restriction zones accounted for more than 50% of the research area. This result indicates that natural pressure and human activities in the study area had a large intensity and wide range of restriction on ecological resilience.
The high restriction zones were mainly distributed in the metropolitan areas of Chengdu and Chongqing and the central urban areas of the surrounding counties, and a few high restriction zones were distributed along the main traffic roads. The moderate high restriction zones were most widely distributed in the central part, followed by the western part, and relatively few were distributed in the east, radiating from the two central cities to the periphery. Compared with the moderate high restriction zones, the moderate low restriction zones were mainly distributed in the hilly areas with moderate slopes, which were crowded with human activities, while the low restriction zones were mainly concentrated in the high–hilly areas at the edge of the study area, such as Shimian County, Marian Yi Autonomous County, Lushan County, and Dayi County. Overall, the restricted degree of ecological resilience gradually decreased from Chengdu and Chongqing to the surrounding cities, the restricted degree of ecological resilience in the west was lower than that in the east, and the restricted degree of ecological resilience in the south was not significantly different from that in the north.

3.2. Ecological Network Construction

3.2.1. Ecological Sources

Assessment of Ecosystem Service Importance
According to the established indicators and methods of ecosystem service importance in six categories, the following evaluation results were obtained (Figure 4). In terms of food supply (Figure 4a), there were many moderate high value areas in the study area, which are mainly distributed in the middle of the study area. Low value areas were few, mainly in the western region, and there was a small amount of distribution in the eastern region. In regard to water conservation (Figure 4b), there were many low value areas in the study area, mainly concentrated in the middle of the study area, and moderate high value and high value areas were mostly distributed in the eastern and western areas of the study area. For carbon fixation (Figure 4c), low value areas were larger and were distributed around the middle, east, and north of the study area, and high value and moderate high value areas were mainly concentrated in the western region with a small distribution area. In terms of soil conservation (Figure 4e), there were many low value areas in the study area, with a wide distribution range, and a small number of high value and moderate high value areas were distributed at the edge of the western and eastern regions. In terms of habitat quality (Figure 4d) and landscape value (Figure 4f), low value areas were mainly concentrated in the middle of the study area, with a wide distribution range, and high value and moderate high value areas were scattered at the edges of the study area, of which some were interspersed in the middle area of the study area.
Ecological Source Extraction
According to the assessment results of ecosystem service importance, 17 ecological sources with a total area of 43,711.78 km2 were selected, accounting for 23.63% of the total area of the Chengdu–Chongqing region. From the perspective of spatial distribution, the sources were mainly located in the eastern and western areas of the study area and covered the largest area. The southern area covered a small area, and the northern and central parts of the study area had the smallest coverage areas, as shown in Figure 5. From the county distribution, the distribution of ecological sources was the most concentrated in Jinkouhe District, Yingjing County, Ebian Yi Autonomous County, and a few nearby areas, with a total area of 10,870.92 km2, accounting for 24.87% of the total area of ecological sources, followed by Xuanhan County, Chongqing, with an area of 5376.94 km2, accounting for 12.30% of the total area of ecological sources. Chengdu Longquanyi District had the smallest ecological sources, with an area of 149.47 km2, accounting for only 0.34% of the total ecological sources. The specific distributions are shown in Table 4.

3.2.2. Ecological Corridors

The Linkage Mapper module in Circuitscape was used to identify the LCP between ecological sources, and 33 potential corridors between sources were extracted for a total path length of 2365.81 km (Figure 6). The spatial distribution of ecological corridors formed a typical core–edge structure under the joint action of various factors, such as the distribution of ecological sources and the spatial attributes of urban agglomerations. There were relatively few and sparse corridors in the northern center of urban agglomerations, and they had a long length and a high path cost. Conversely, there were relatively more and denser corridors in the southwestern and southeastern edges of urban agglomerations, and they had a short length and a low path cost. Through the extraction of ecological sources and ecological corridors, the ecological network of the Chengdu–Chongqing region was formed.

3.3. Diagnosis of Key Ecological Restoration Areas in Territorial Space

3.3.1. Diagnosis of Key Areas of Ecological Source Restoration

The ecological sources are the gathering habitat, survival, and reproduction sites of regional species and key migration stopover sites; thus, these areas provide the foundation of ecological network construction and have important ecological functions. According to the abovementioned identification method, the key areas of ecological restoration were identified and are shown in Figure 7; these sites included high interference areas, medium high interference areas, medium low interference areas, and low interference areas, accounting for 3.09%, 14.74%, 10.22%, and 71.95% of the total ecological source, respectively. The degree of disturbance in the key areas of ecological source restoration in the east was significantly higher than that in the west and south.
The high interference areas were diagnosed as the key areas of the first-level ecological source restoration, covering 1350.69 km2. These areas were mainly found in the eastern ecological sources, and most of the areas were distributed along the edge of the ecological sources and their surrounding parts, with a small share scattered in the center of the source, such as in Shapingba District, Qianjiang District, and Tongchuan District. The medium high interference areas were diagnosed as the key areas of the second-level ecological source restoration, covering 6443.12 km2. These areas were mainly concentrated in the ecological sources in the eastern part of the study area, with less distribution in the southeastern region and the lowest distribution in the western region; furthermore, most sites were scattered in the ecological sources, which aggravated the fragmentation of habitat patches, such as in Xuanhan County, Wanzhou District, and Rong County (Table 5). The key areas of ecological source restoration were basically distributed in the main urban areas of each district and county, which were particularly disturbed by human activities. Overall, the disturbance degree of ecological sources in the study area was relatively low.

3.3.2. Diagnosis of Key Areas of Ecological Corridor Restoration

In this study, the recovery connectivity value of the ecological corridor unit distance was detected, and the high value areas were diagnosed as the key areas of ecological corridor restoration (Figure 8), with a length of 380.39 km, accounting for 16% of the total corridor length. On the whole, according to the difference in natural terrain characteristics in the Chengdu–Chongqing region, the key areas of ecological corridor restoration could be roughly divided into two categories: one was concentrated in the central urban construction area with Chengdu as the core. Because the Chengdu Plain was flat and would not seriously split the habitat, the restrictive factors of resilience in this area were mainly dominated by the intensity of human activities. The other was distributed in the eastern edge area in a scattered way. Because the terrain in the eastern hilly area was undulating and the habitat was split, the restrictive factors of resilience in this area were mainly dominated by natural landforms and human activities. The details for each administrative unit key area of ecological corridor restoration are shown in Table 6.

3.3.3. Diagnosis of Key Areas of Ecological Pinch Point Restoration

As high-density areas for the flow of ecological elements, ecological pinch points are the cornerstone of ecosystem stability, bear the high risk of ecological degradation and destruction, and are extremely irreplaceable. Through circuit theory, all the ecological pinch points in the Chengdu–Chongqing region were selected, and their total area was 626.88 km2. After superimposing the high restriction zones of ecological resilience, the key areas of ecological pinch point restoration were confirmed. The results showed that there were 29 key areas of ecological pinch point restoration in the study area (Figure 9), mainly distributed in greenway corridors, river corridors, and artificial road corridors, of which twenty-four were located in greenway corridors, three in river corridors, and two in road corridors. The key areas of ecological pinch point restoration in the Chengdu–Chongqing region were spatially distributed as “less in the middle and more around”. In terms of water systems, there were three near the Tuojiang River system, two near the Minjiang River system, and two near the Yangtze River basin. In terms of mountain systems, there were two near the Longmen Mountain system, three near the Longquan Mountain system, three near the Dalou Mountain area, three near the Huaying Mountain system, and four near the Daba Mountain system. The specific results are shown in Table 7.
Combined with the restrictive factors of ecological resilience, seven key restoration areas restricted by natural conditions were obtained. Among them, two key areas were located in Lushan County and Rong County, which were prone to geological hazards. One key area, due to the extremely steep terrain compared to other pinch points, was more likely to be degraded, as was diagnosed with the key restoration area. The rest of the four key areas were mainly affected by river factors. For example, Fuling District, Hejiang County, and Kaijiang County each had one key area formed by the obstruction of the flow of ecological elements caused by rivers crossing ecological pinch points, and Qingshen County included one key area that was vulnerable to the erosion and destruction of surrounding rivers. There were 24 key areas of ecological pinch point restoration disturbed by human factors in the Chengdu–Chongqing region. Compared with the limitation of natural conditions, the interference of human factors on key areas was more obvious, among which the interference of urban traffic was the most significant. This was because traffic could not only directly cut off the horizontal process of landscape ecological flow but also increase the scope of human interference as artificial corridors, which could easily destroy the integrity and stability of ecological elements. A total of 23 key areas in the study area were directly or indirectly affected by traffic. For example, four key areas in Zitong County were all disturbed by urban traffic. At the same time, the obstruction of urban architecture and the interference of agricultural production were also important reasons for the formation of key areas of ecological pinch point restoration. These key areas were mainly distributed in the central construction areas of the city, such as Guanghan City, Jintang County, and Zhongxian County. In addition, there were two key areas in the study area affected by both natural and human factors, which were located in Kaijiang County and Qingshen County. In conclusion, the spatial differentiation of restrictive factors affected the spatial distribution pattern of the key areas of ecological pinch point restoration in the Chengdu–Chongqing region.

4. Conclusions and Implications for Policy

4.1. Conclusions

In this study, from the perspective of urban ecological resilience, the ecological sources of the Chengdu–Chongqing region were identified, and the potential ecological corridors were extracted by the MCR model. The ecological pinch points were identified with circuit theory. On this basis, the ecological network was constructed, and the Linkage Mapper toolbox and 3S spatial analysis were introduced to quantitatively identify the key areas of ecological restoration. Finally, corresponding measures were proposed that could weaken or eliminate the negative impacts. The conclusions of the study are as follows:
(1)
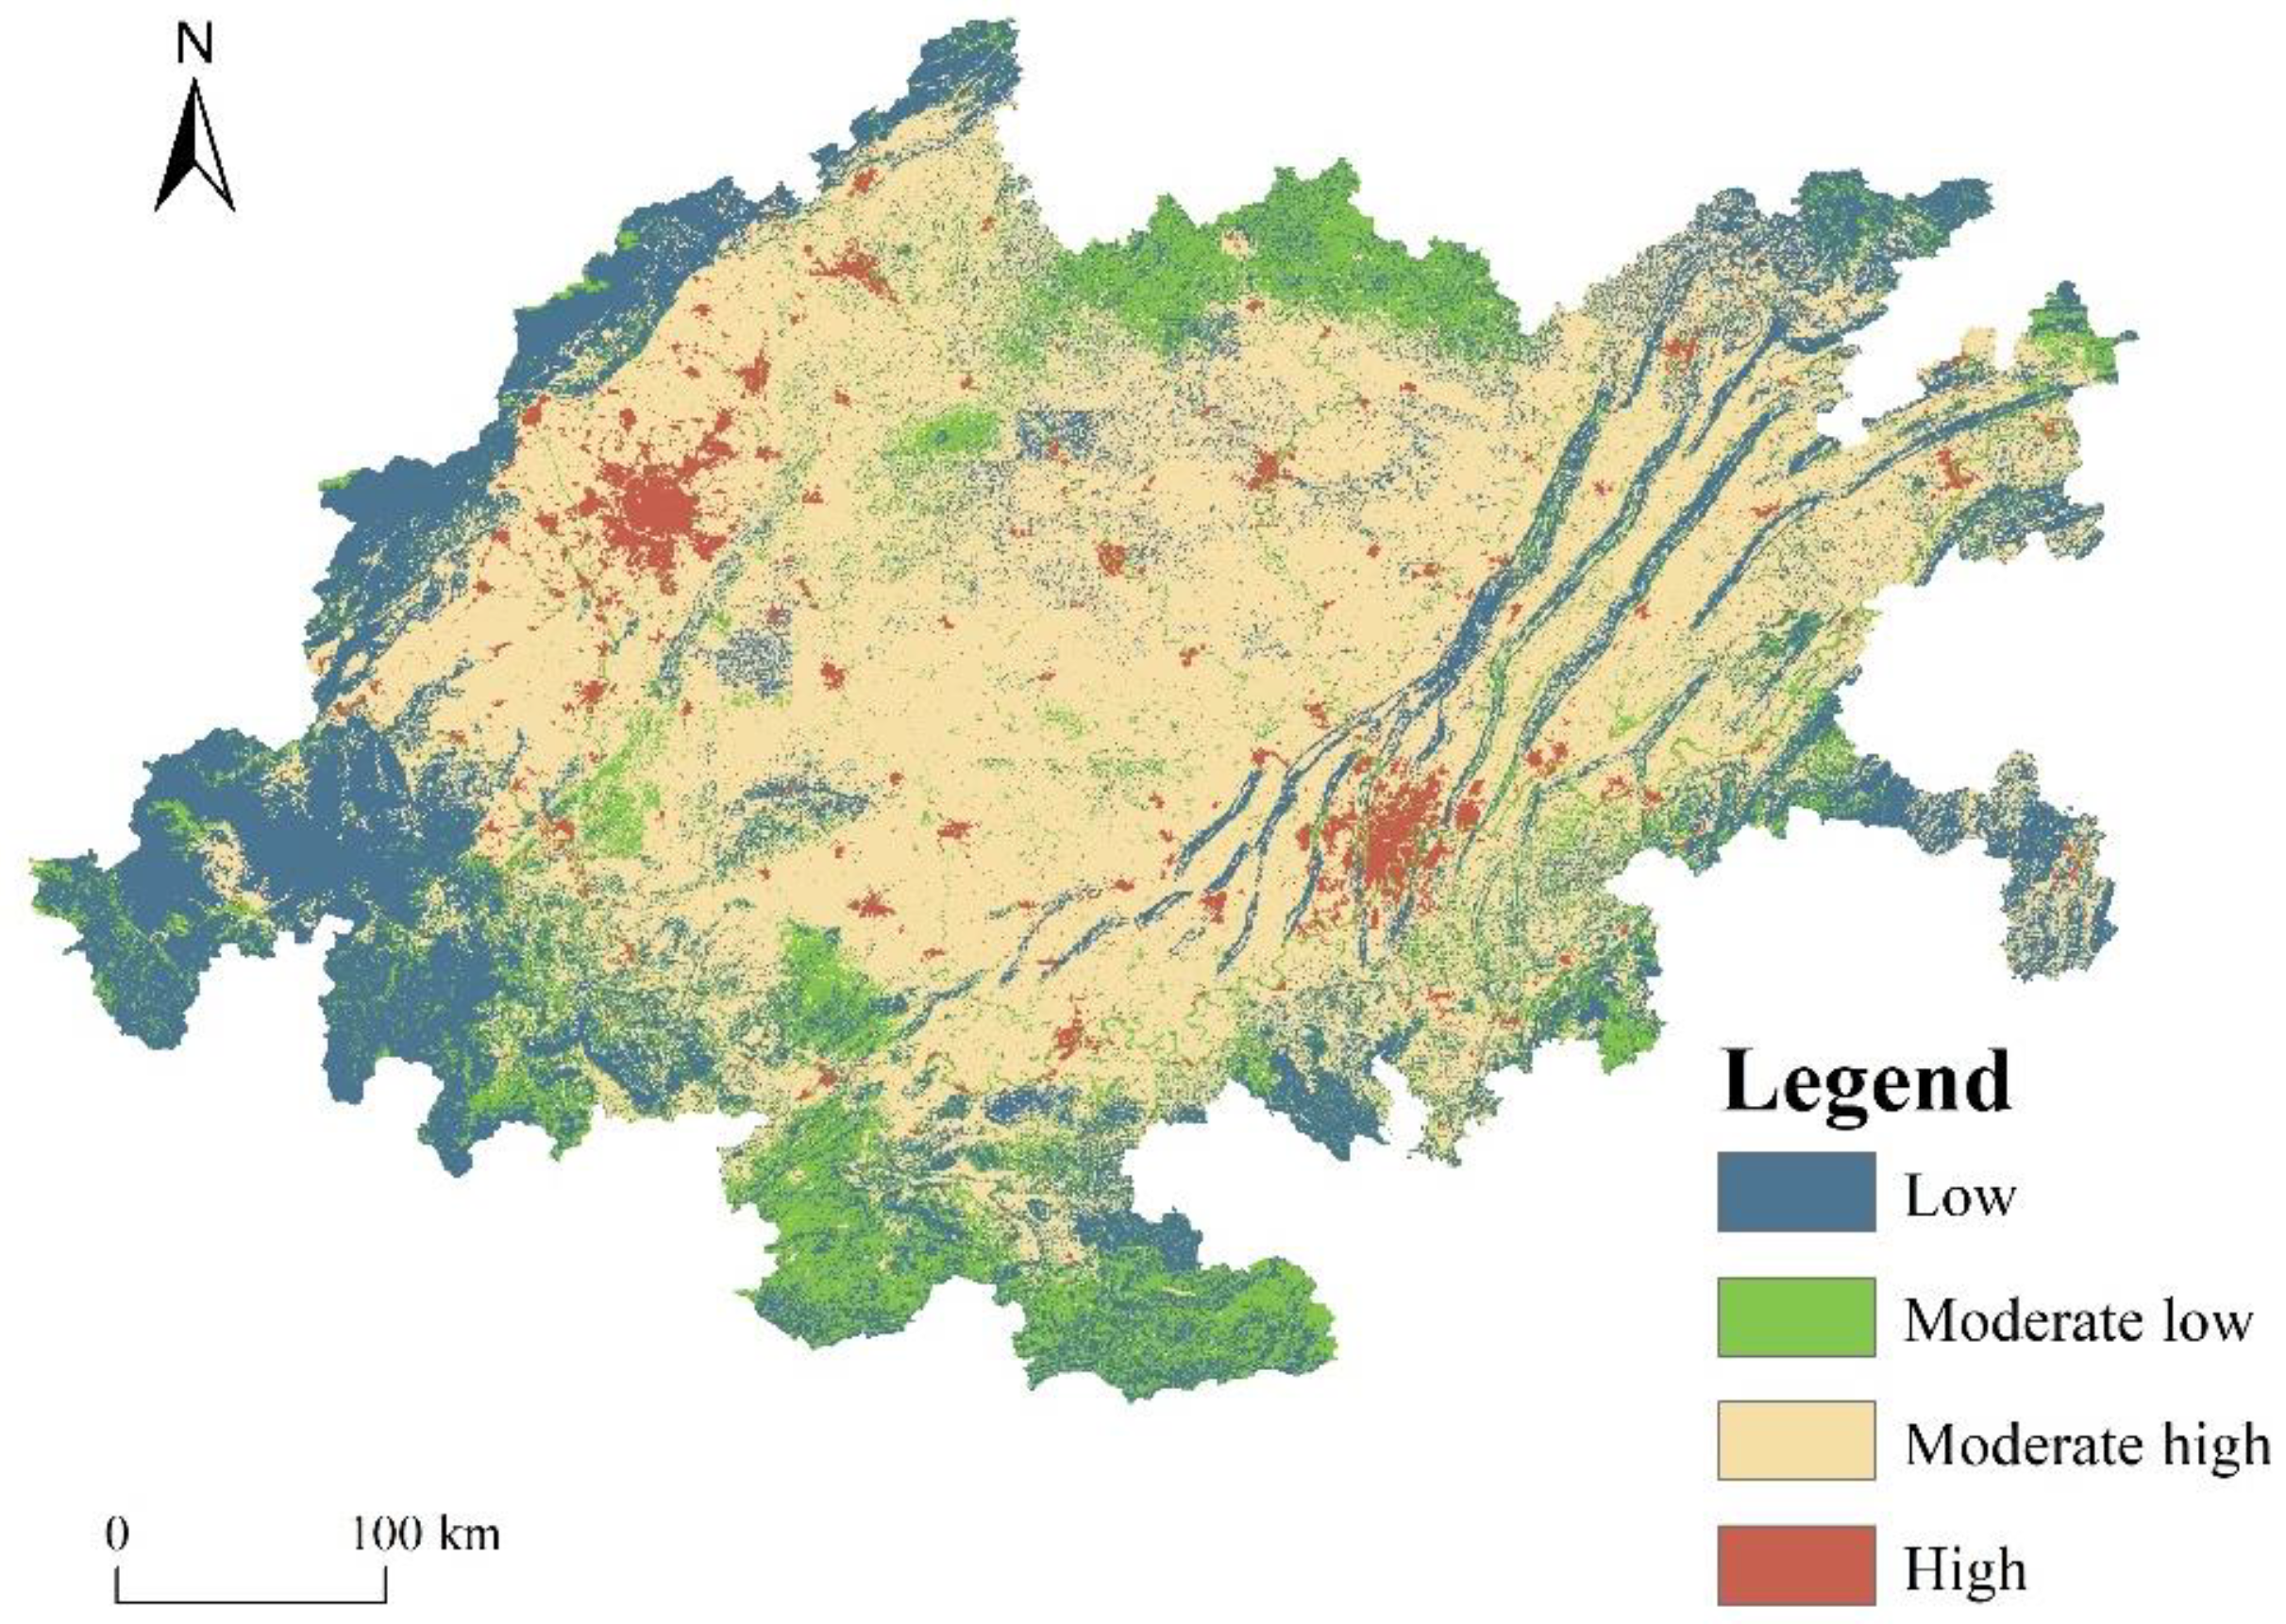
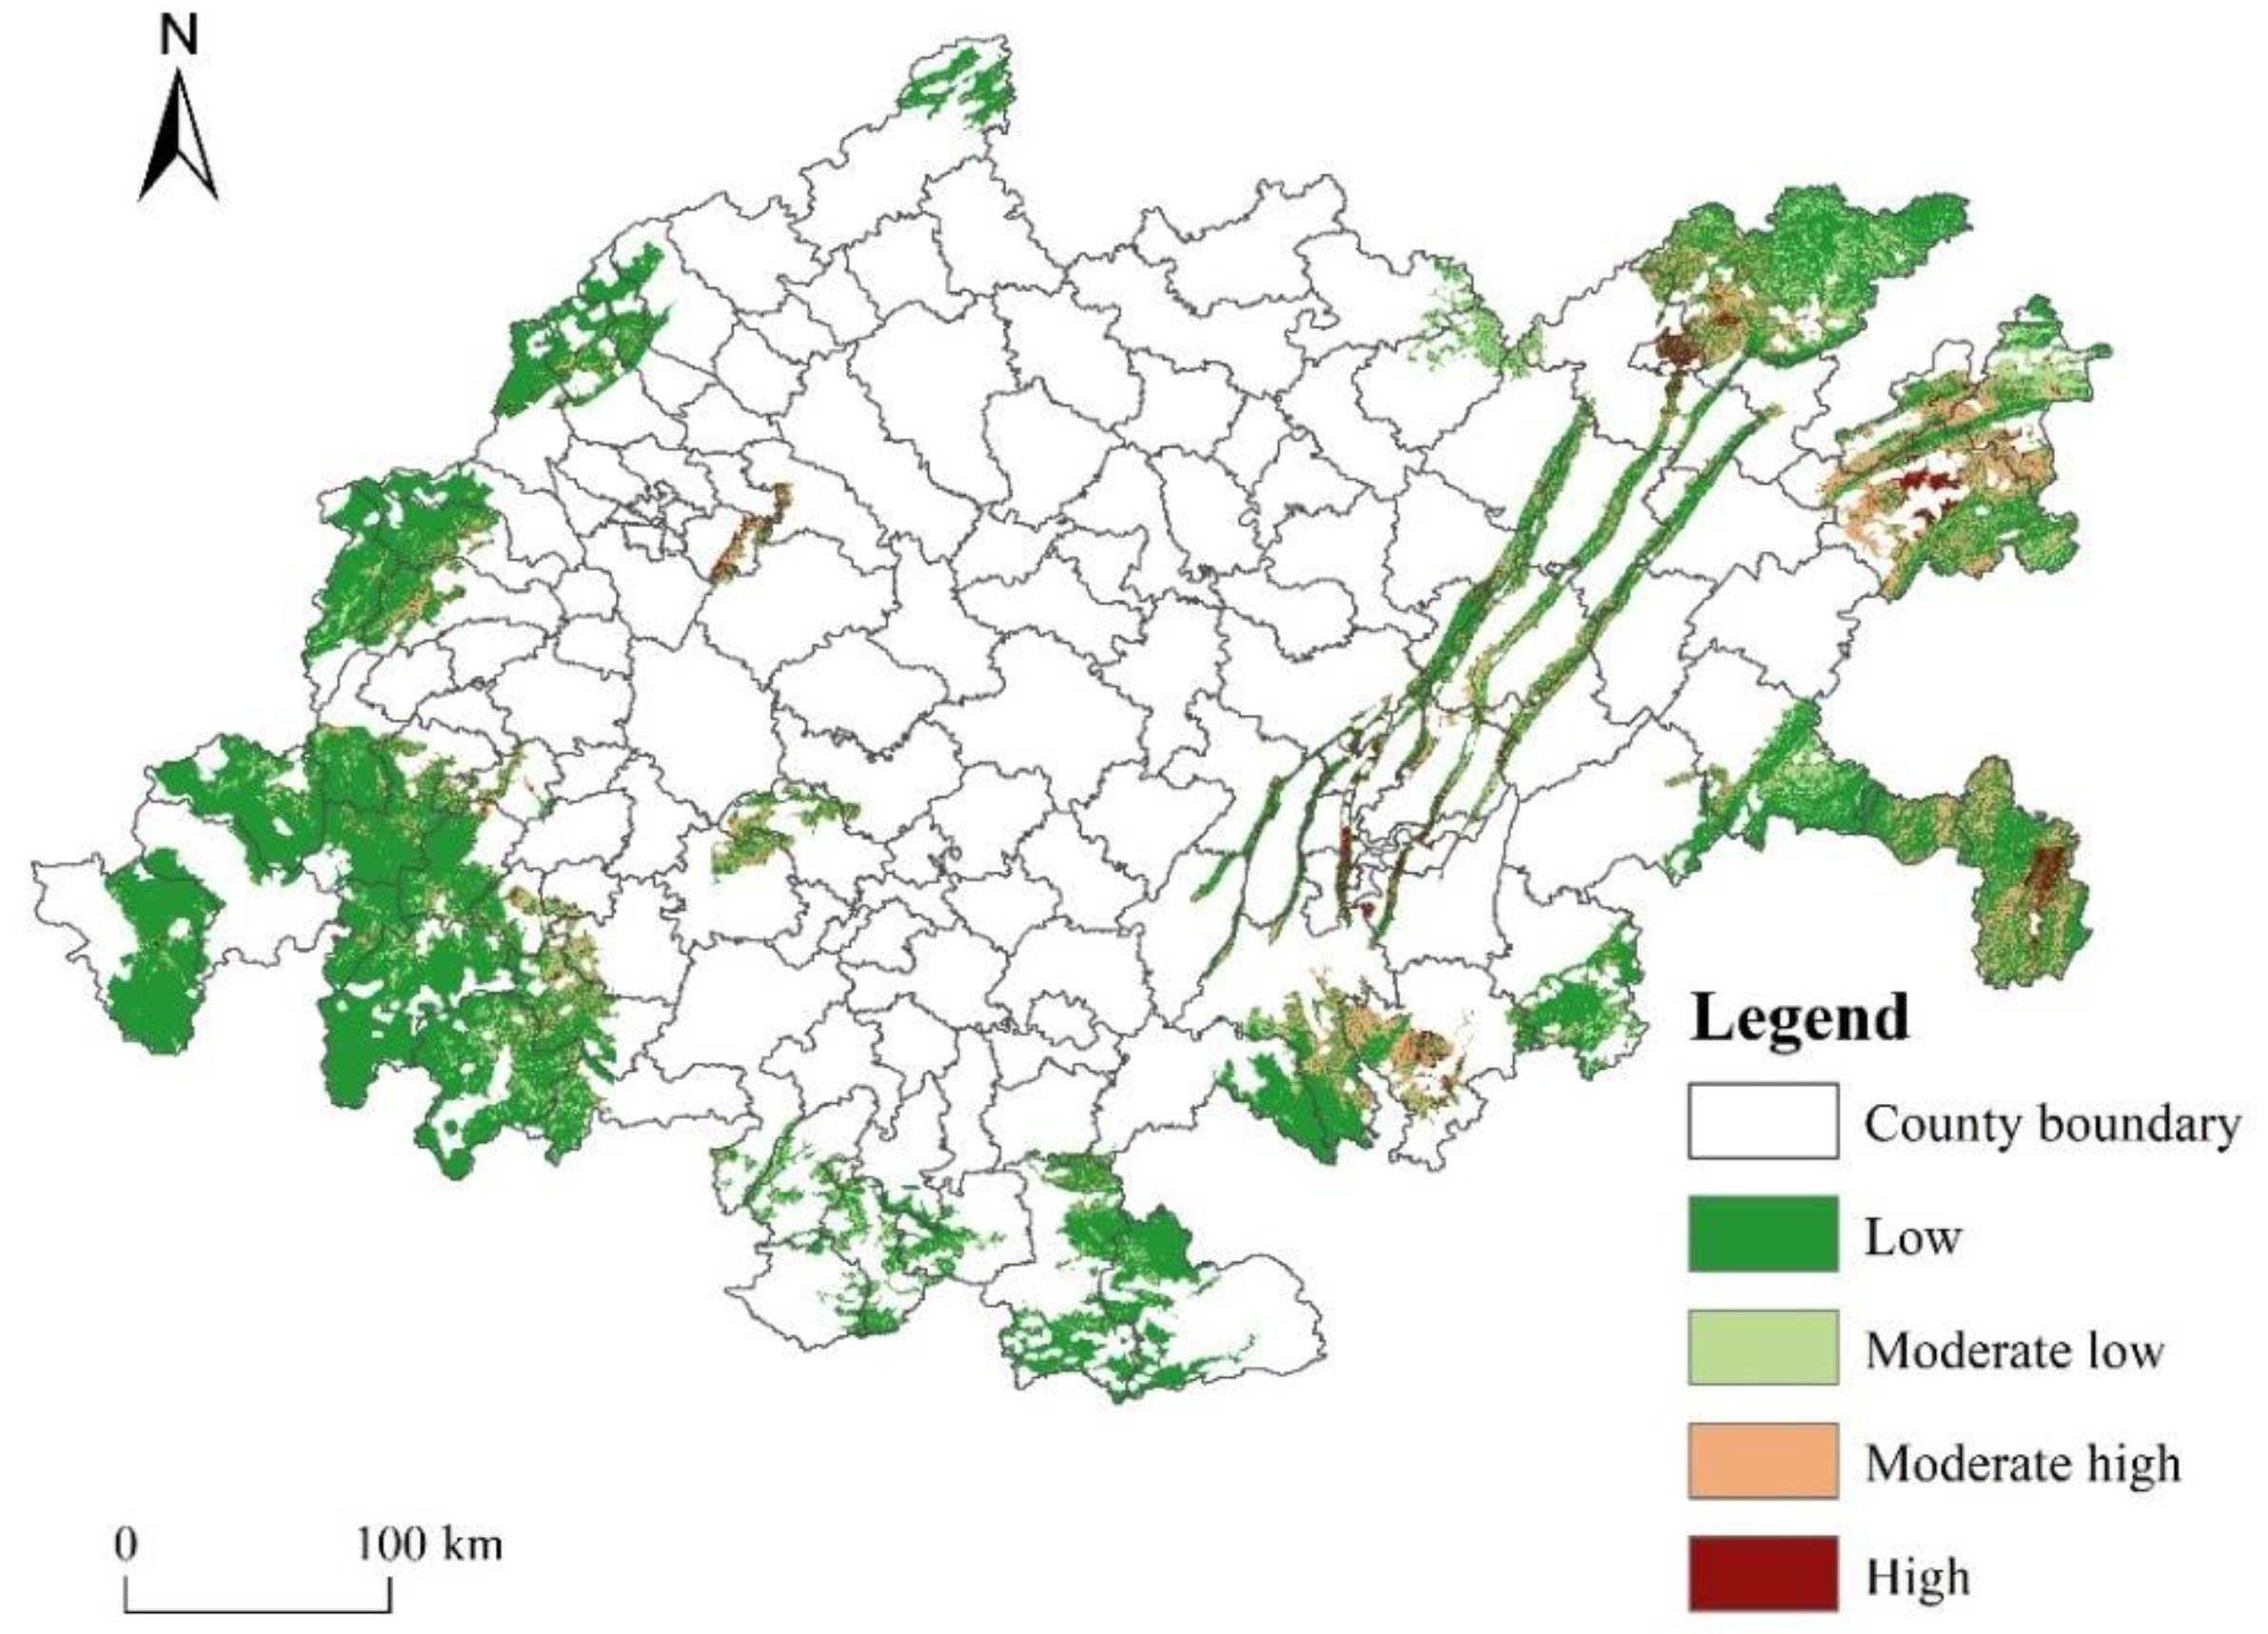
Through comprehensive evaluation from the three levels of geological disasters, regional pressure, and road interference, the areas of the low restriction zones, moderate low restriction zones, moderate high restriction zones, and high restriction zones in the Chengdu–Chongqing region were 49,757.49 km2, 26,813.78 km2, 102,011.9 km2, and 6416.85 km2, respectively. The ecological resilience of the Chengdu–Chongqing region was restricted mainly by the undulating terrain, population density, land use, and road factors. Due to the significant differences in typical landforms and development levels across the study area, there was an obvious core–periphery structure in the restricted degree of ecological resilience. Chengdu and Chongqing are two regional core cities with large population densities and high land development levels, so the restrictive effect of ecological resilience on Chengdu and Chongqing was stronger than that on other cities. Therefore, alleviating regional pressure was a problem that needed to be solved in the Chengdu–Chongqing region agglomeration.
(2)
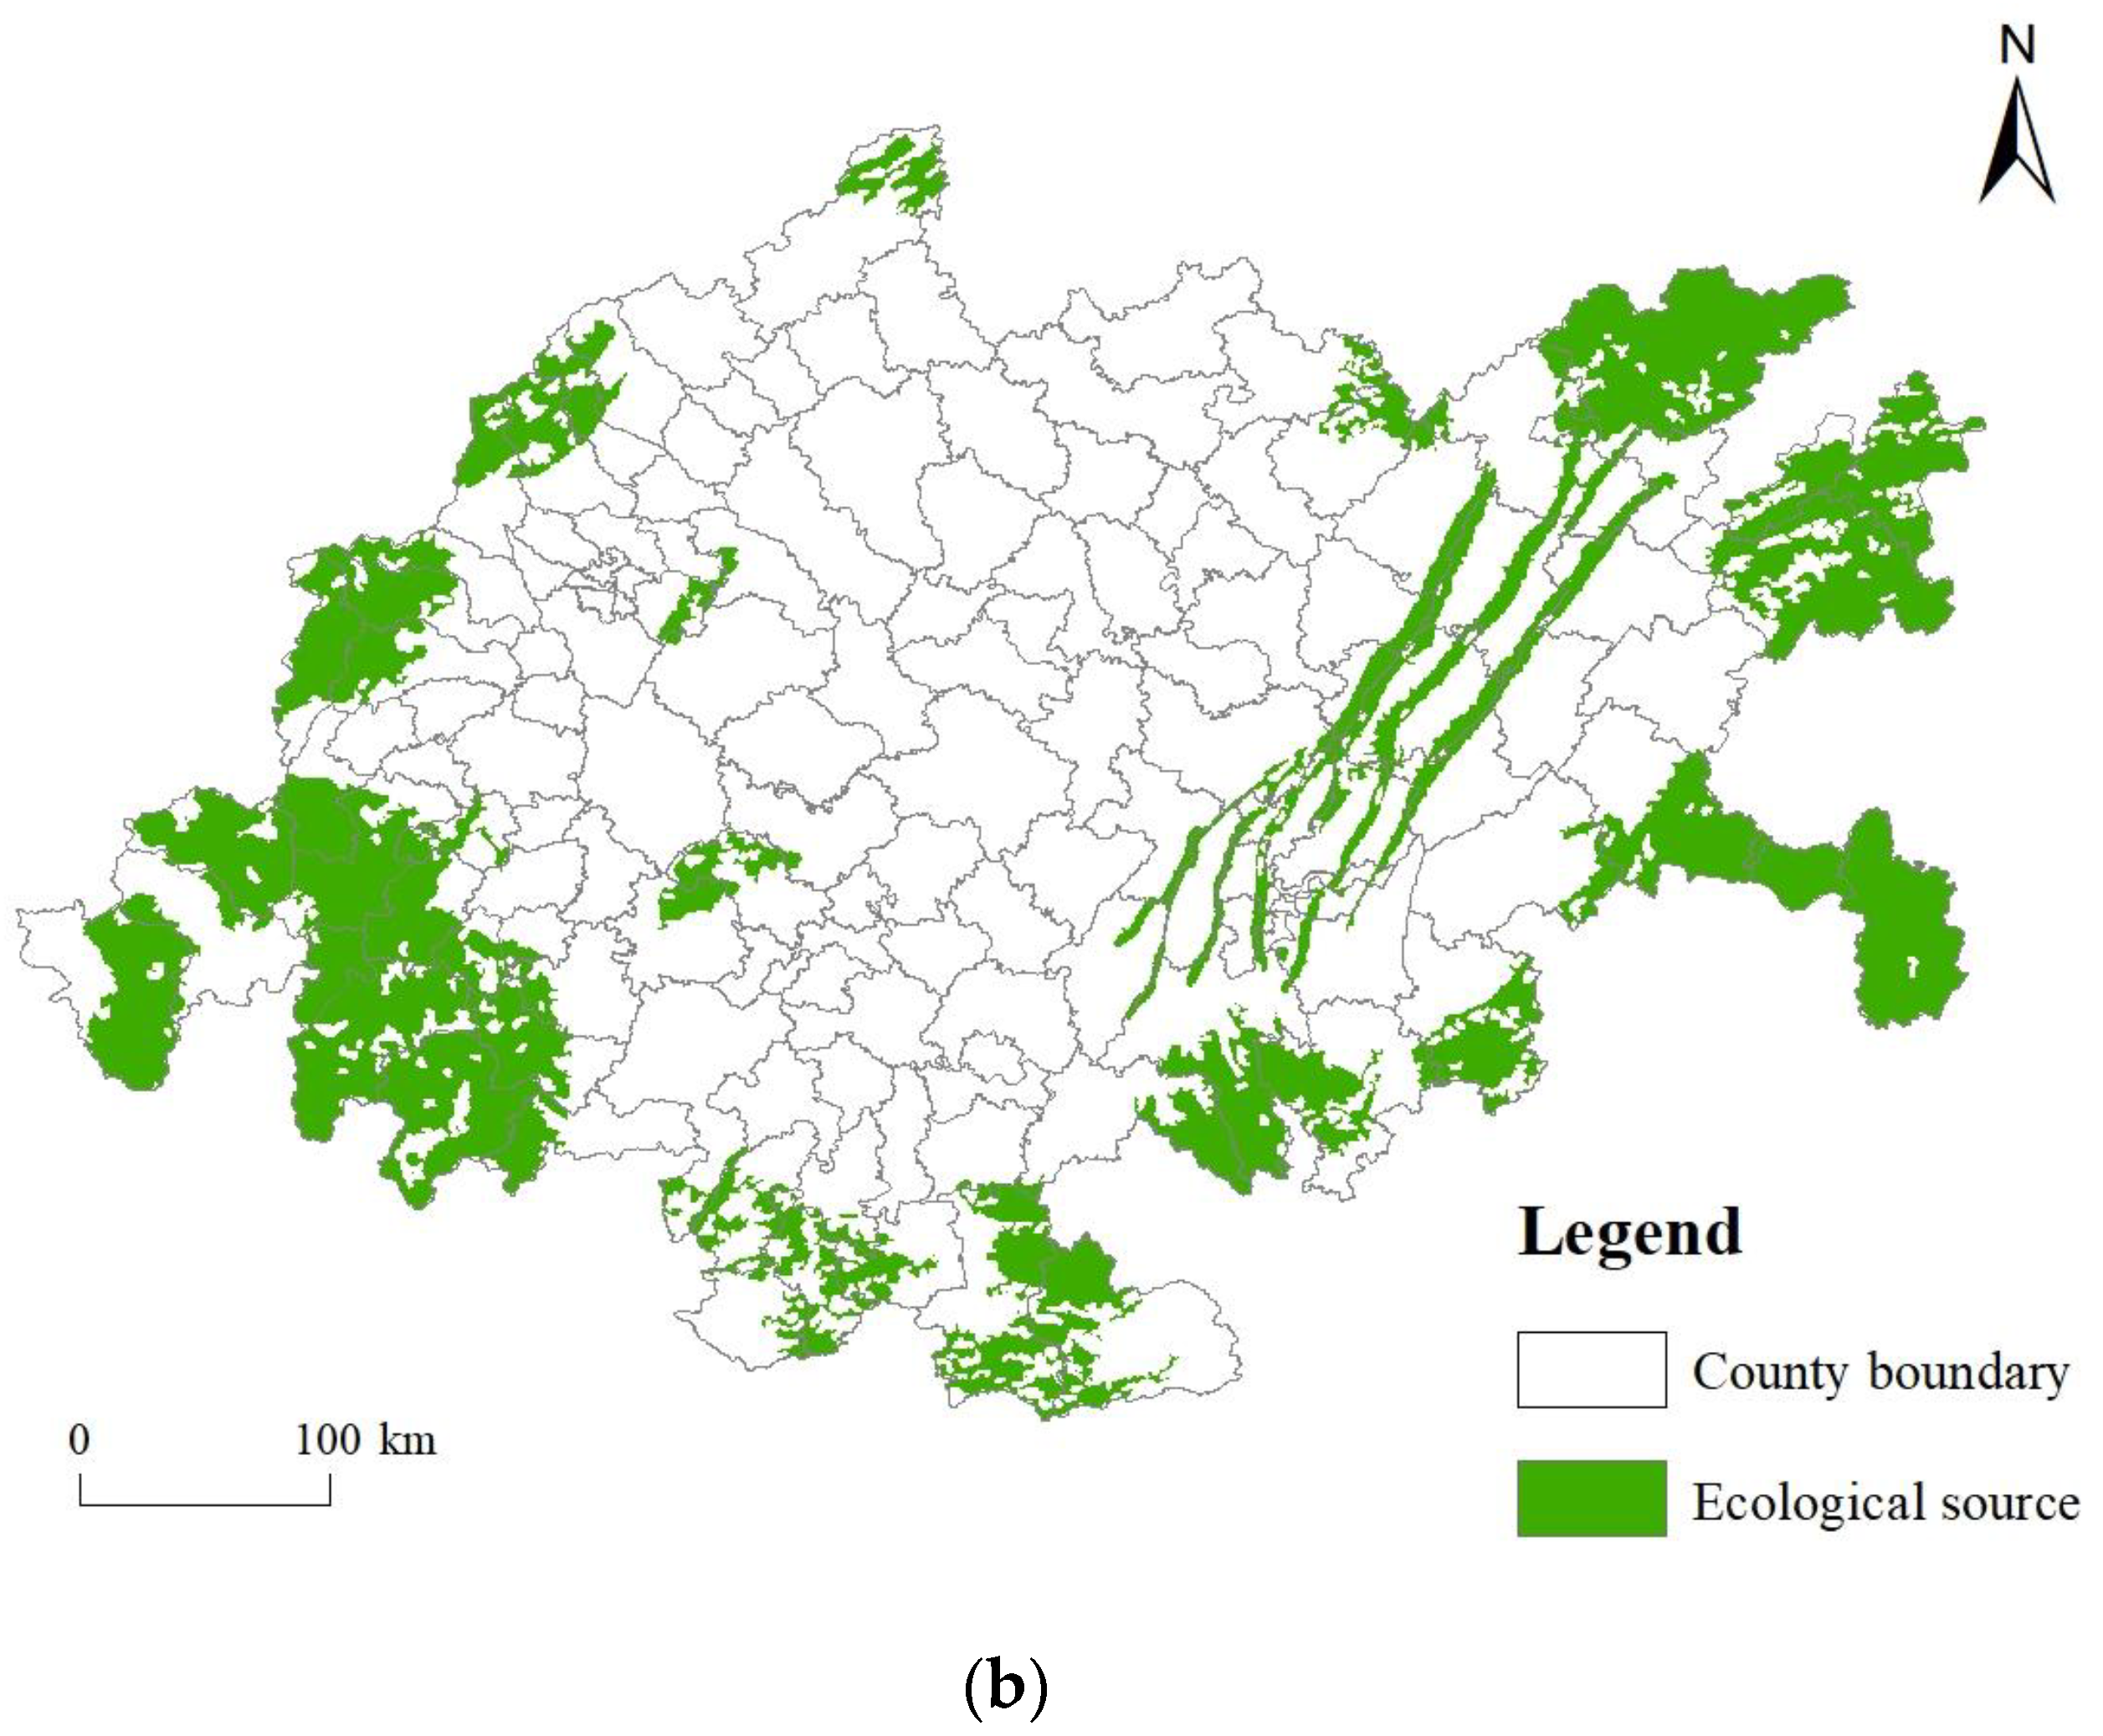
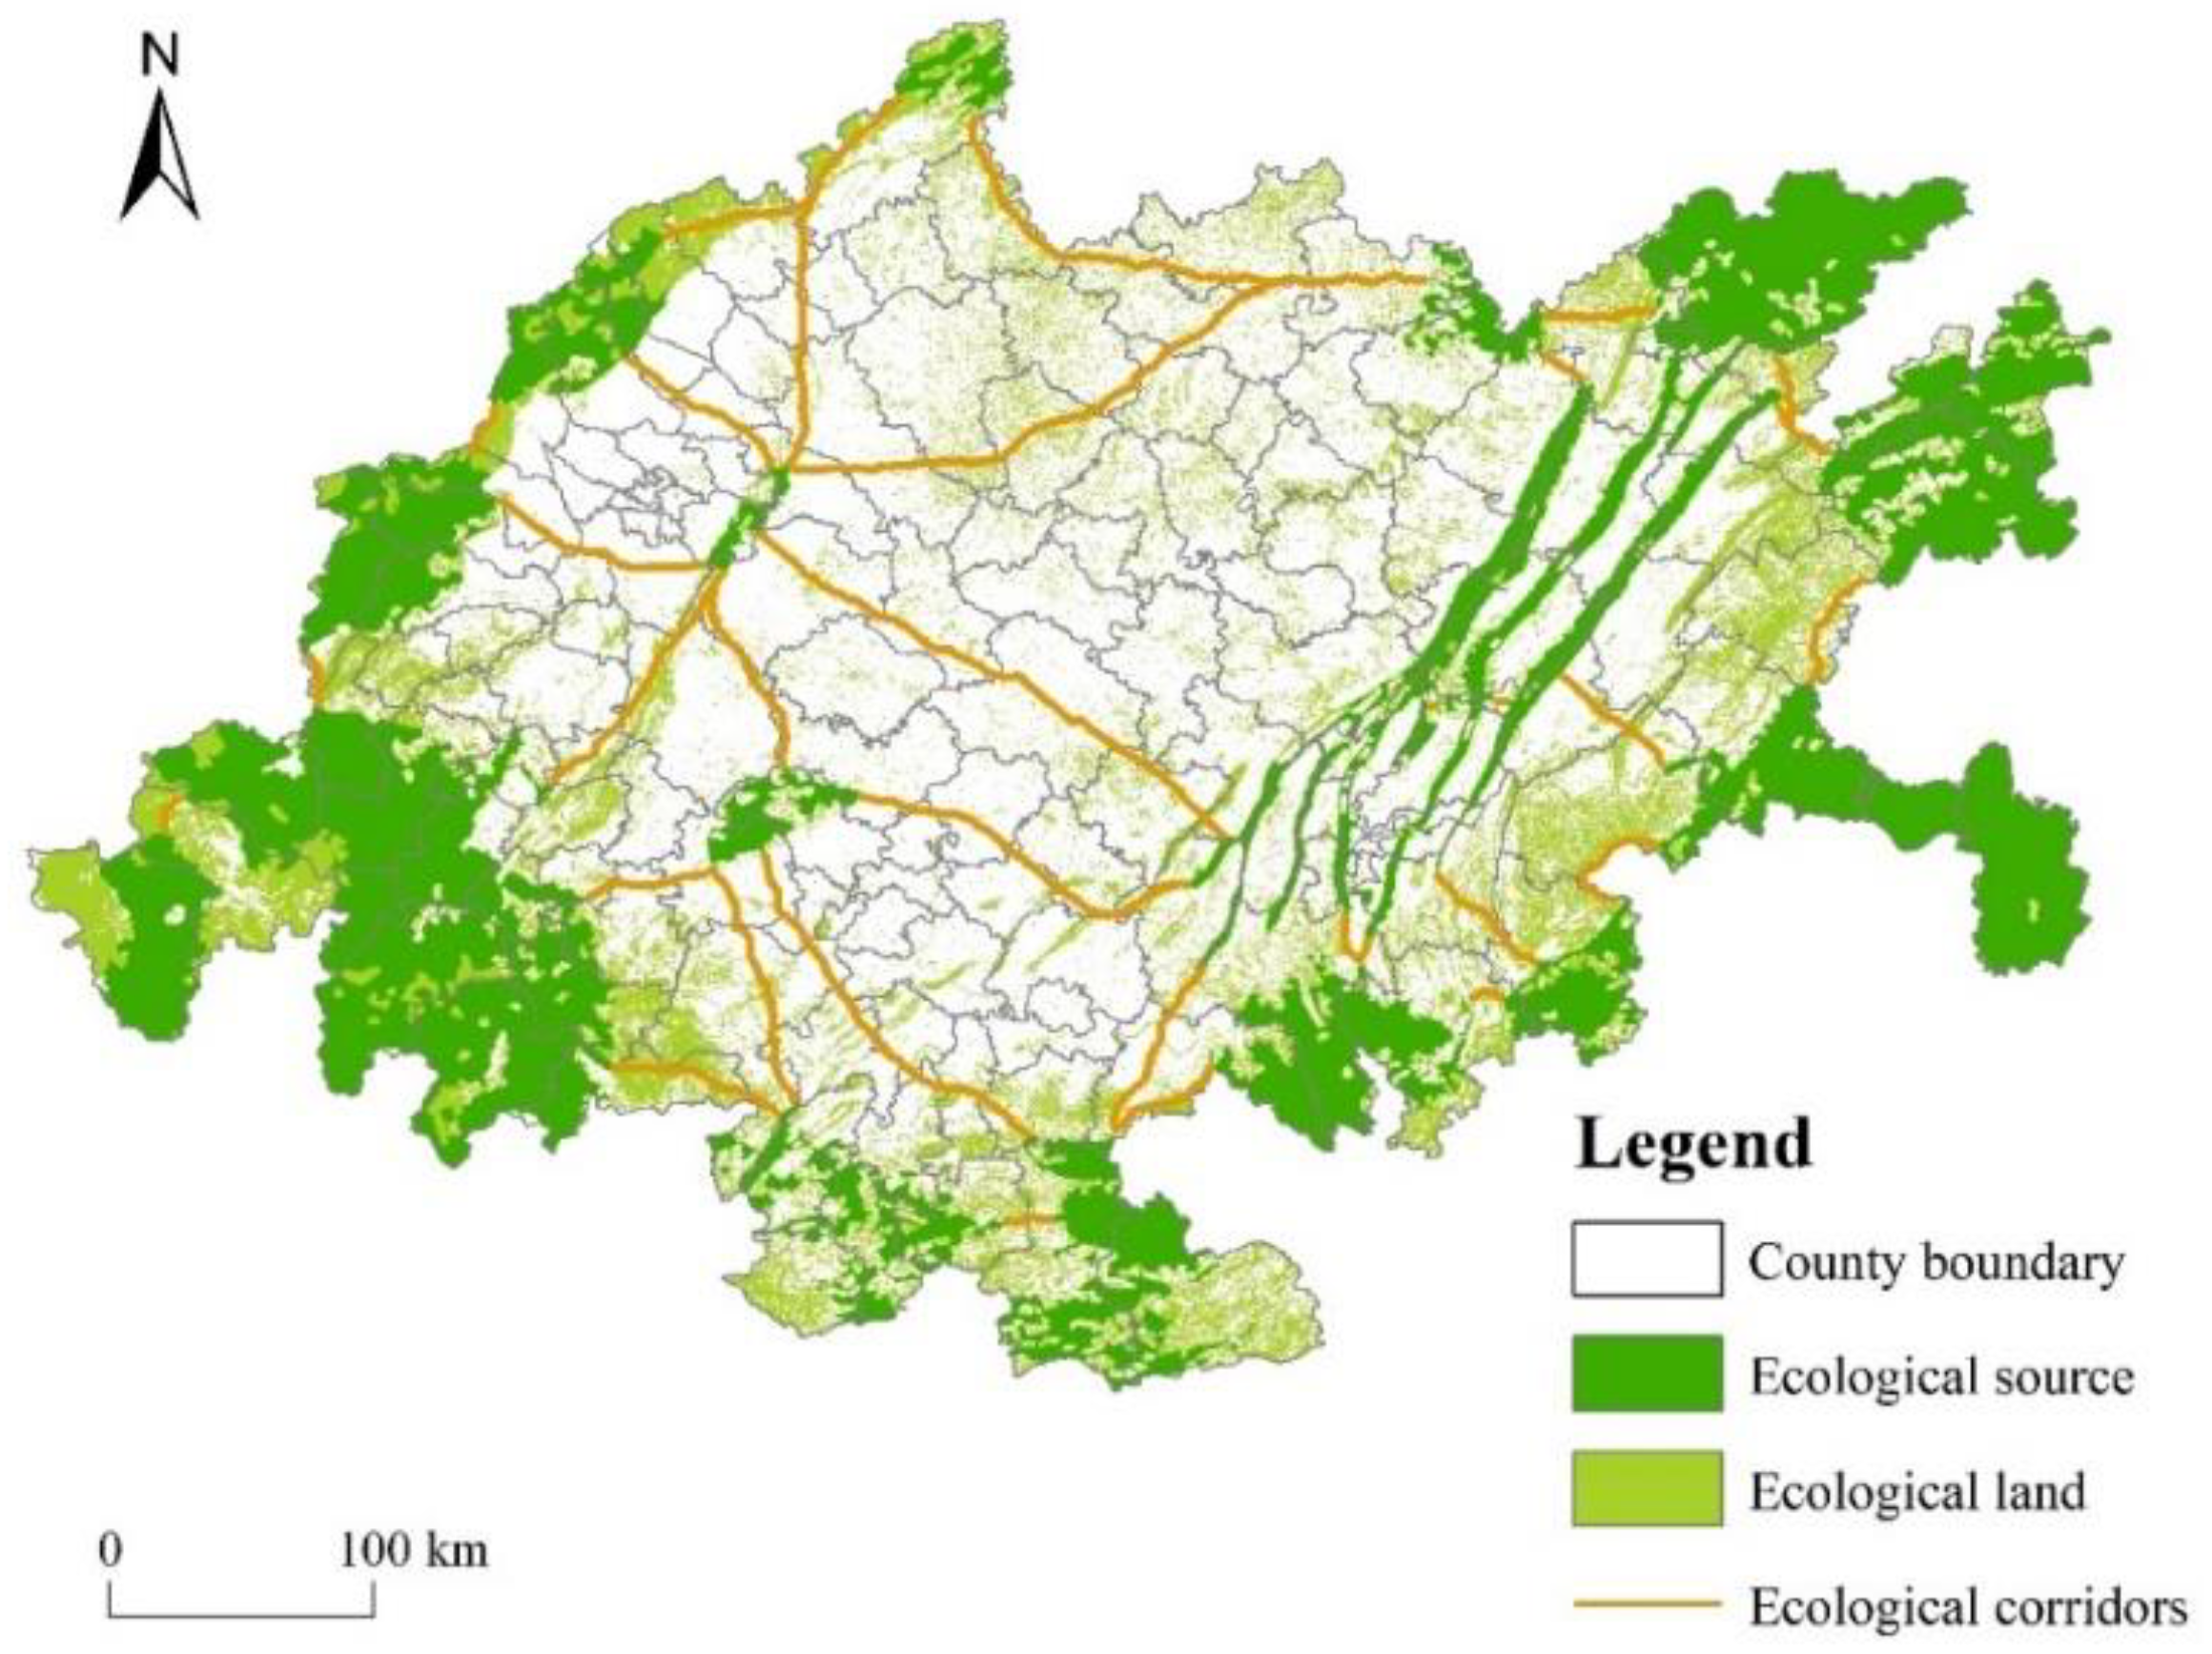
The ecological network was constructed based on the evaluation of resilience restriction degree, which included 17 ecological sources and 33 potential ecological corridors, with a source area of 43,711.78 km2 and corridor length of 2365.811 km. The source area in the study area was the largest in the east and west, mostly located in the low hills with better vegetation coverage. The spatial distribution of ecological corridors was characterized by “long in the west, short in the east, dense in the west, and sparse in the east”. The western ecological corridors in the Chengdu–Chongqing region were more continuous and denser than those in the eastern region.
(3)
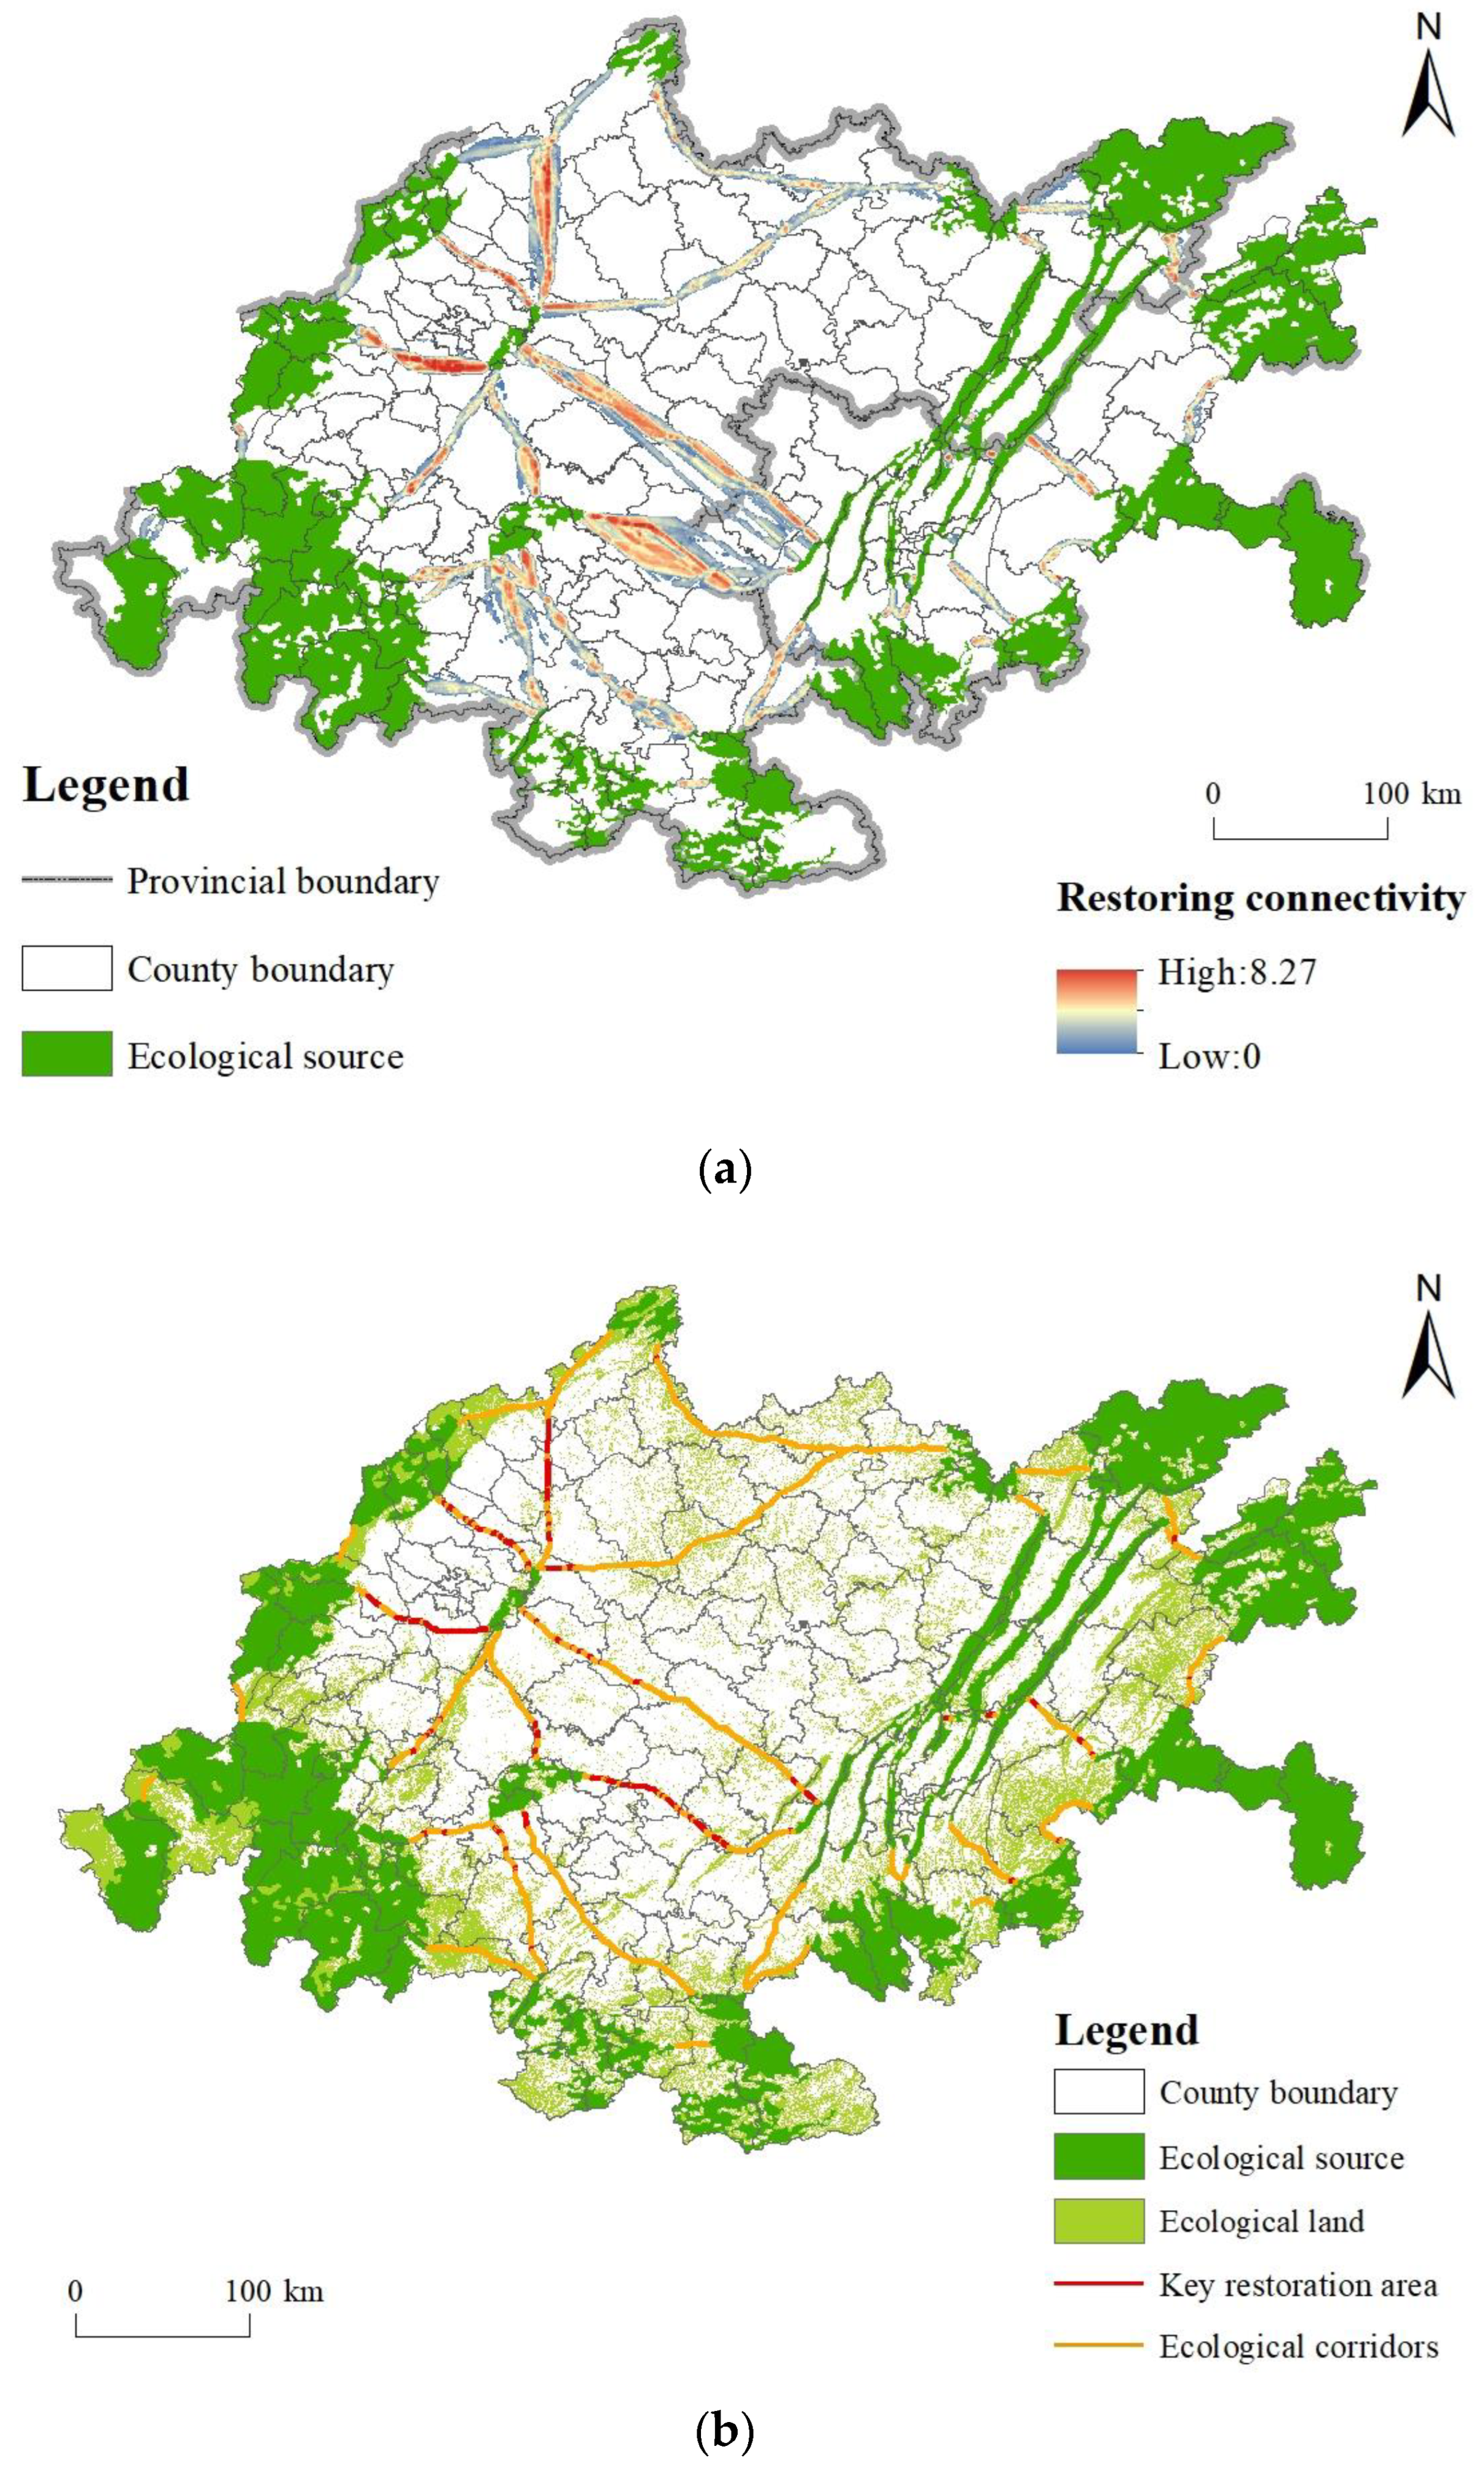
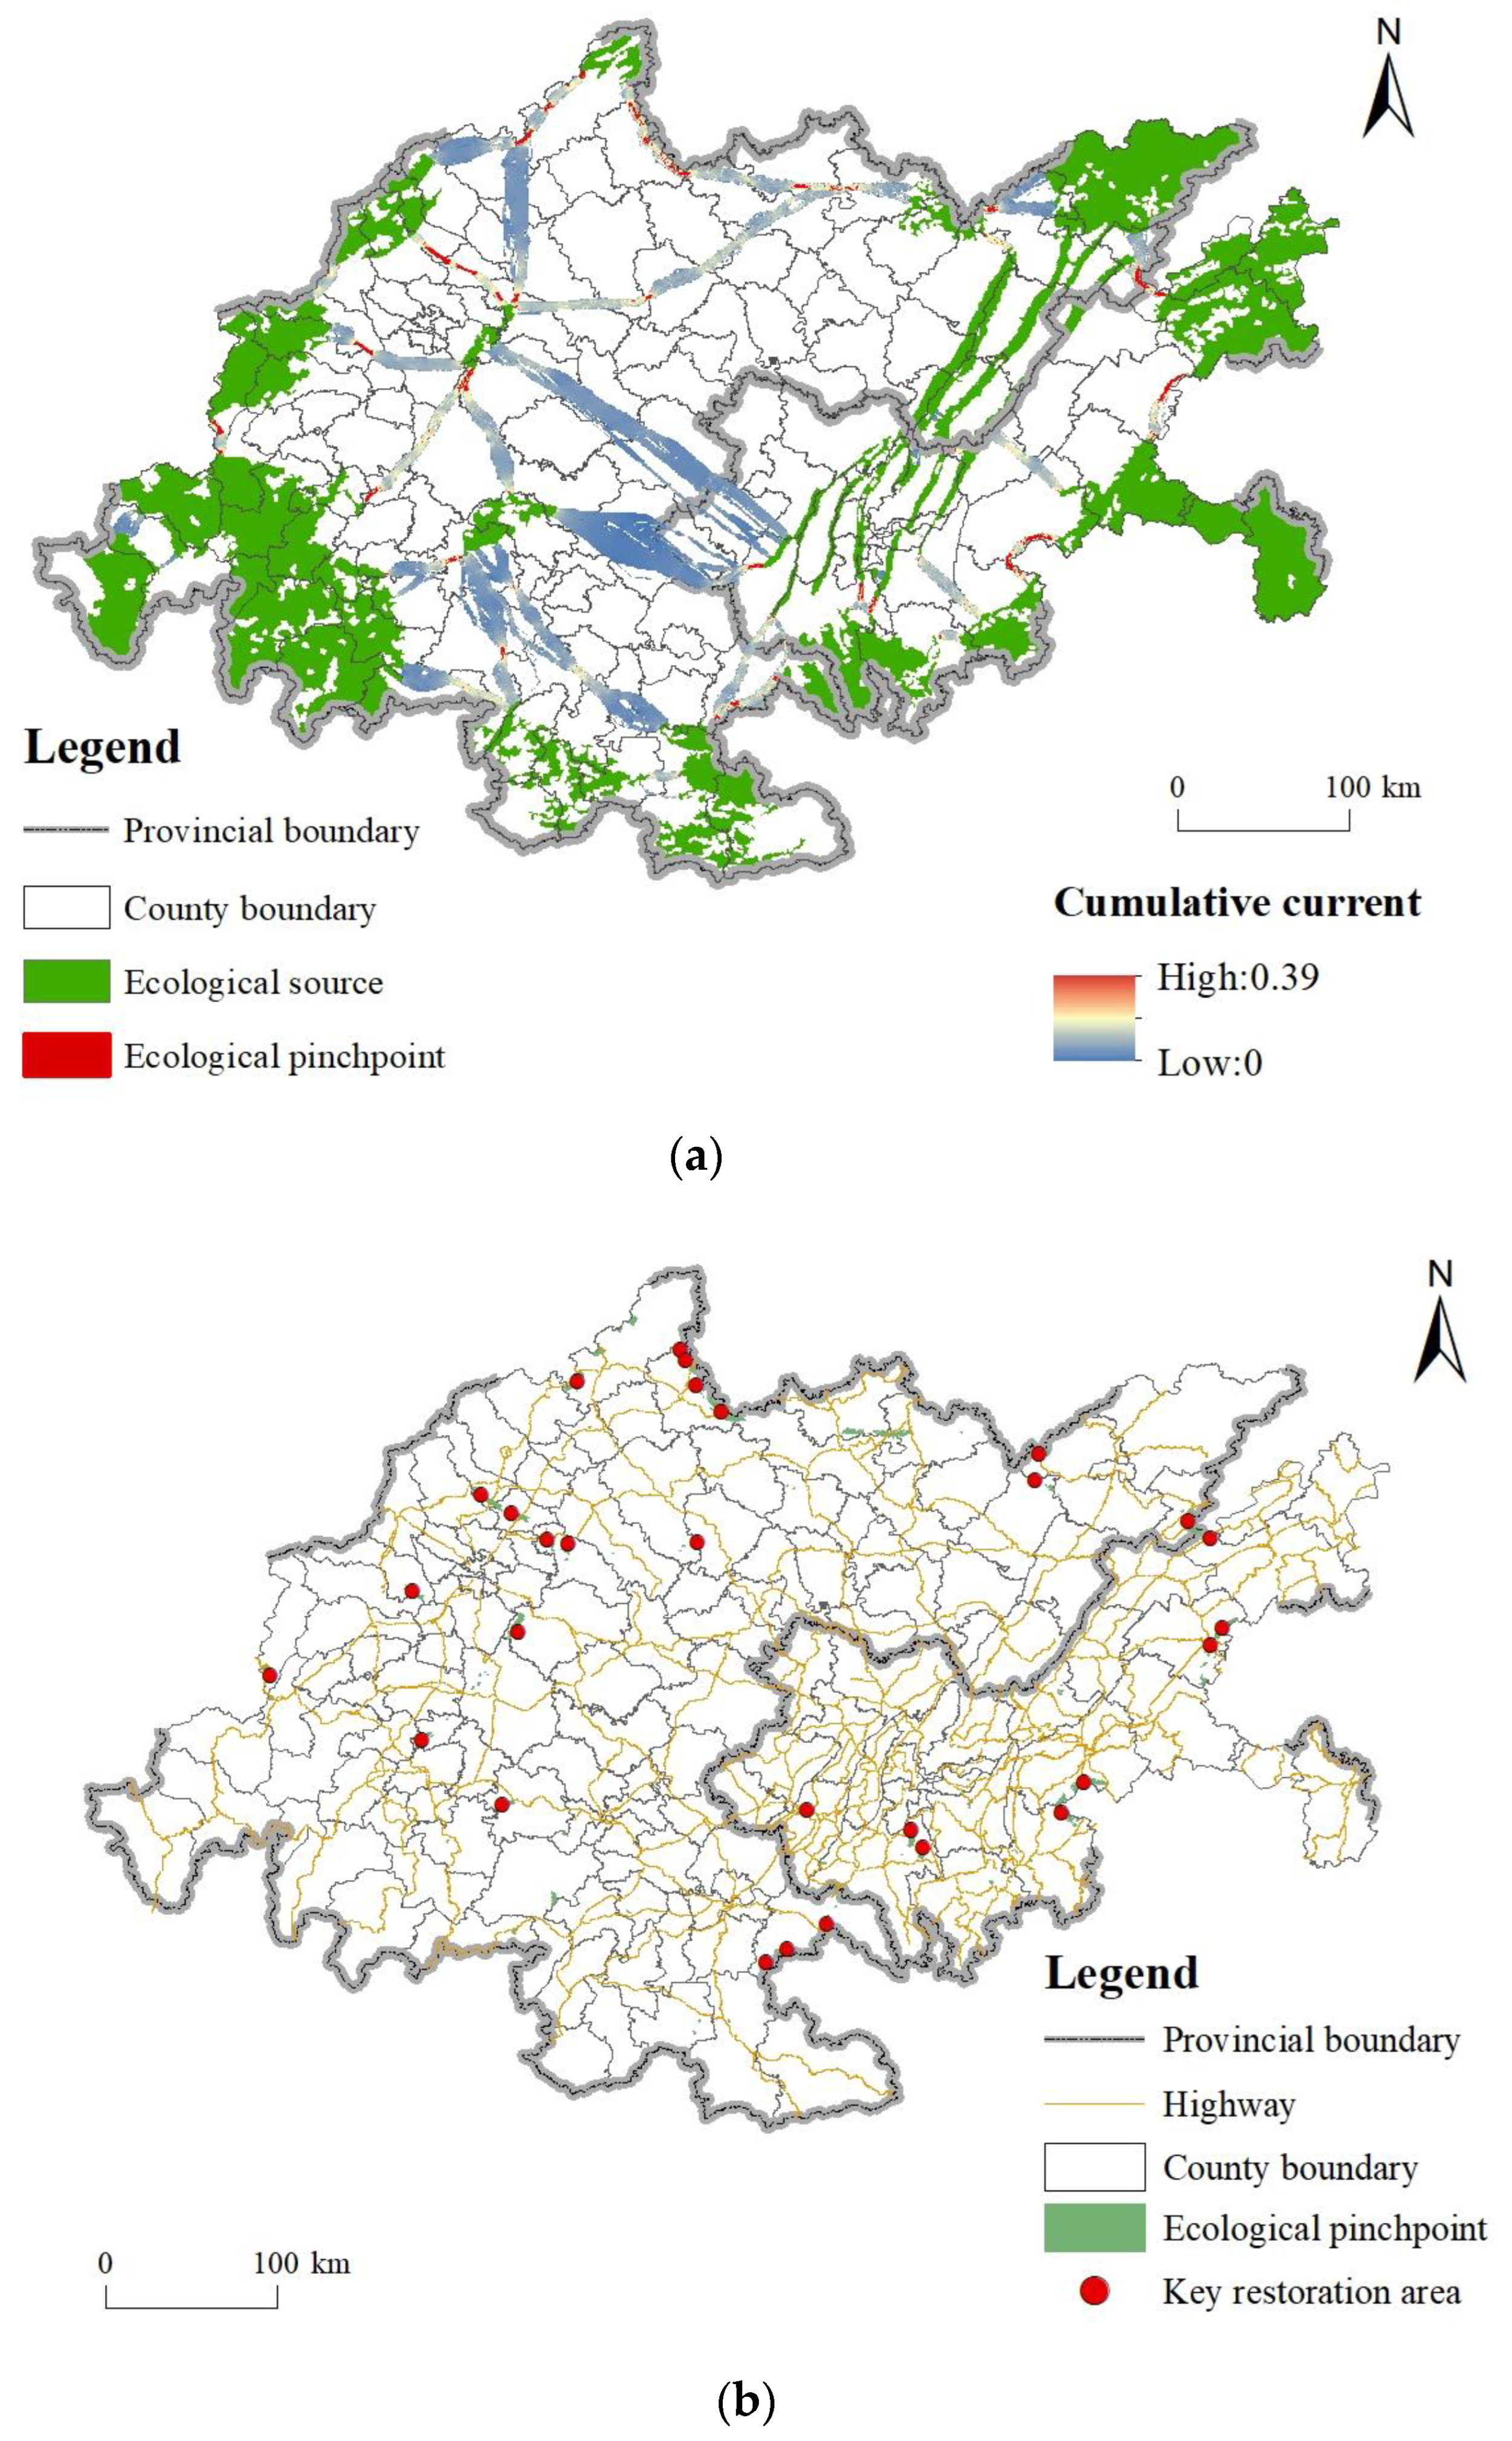
The key areas of ecological restoration in the Chengdu–Chongqing region included the key areas of ecological source restoration, ecological corridor restoration, and ecological pinch point restoration. The key restoration area of the ecological sources was 7793.81 km2, which showed obvious spatial differentiation due to the influence of regional pressure. The key areas of ecological restoration were mainly distributed in the eastern part of the Chengdu–Chongqing region agglomeration, accounting for 17.93% of the total study area. The length of the key areas of ecological corridor restoration was 380.39 km. These key restoration areas were discretely distributed in the high topographic relief area and Chengdu Plain area, and their diagnoses were based primarily on topography and human activity intensity. In the Chengdu–Chongqing area, there were 29 key areas of ecological pinch point restoration, of which the number of key areas that needed to be repaired due to traffic interference was the largest, with a total of 16. The diagnosis of key restoration areas in the Chengdu–Chongqing region was composed of the multiscale spatial morphology of the surface–line–point. According to the spatial distribution characteristics of key ecological restoration areas with different morphologies, targeted repair strategies at the “surface–line–point” level were proposed.

4.2. Policy Implications

4.2.1. Restoration Strategy of Ecological Sources at the Surface Scale

Excessive exploitation should be severely restricted in the ecological sources, and the main measures include sealing mountains for afforestation in natural forest areas of abandoned mines, implementing afforestation on wastelands, and moderately exploiting some of the wasteland that is suitable for agricultural and tourism purposes. Additionally, water conservation and biodiversity conservation work should be carried out to protect and restore wildlife habitats, enhance regional ecological conservation capacity, and comprehensively improve ecological service functions. We will comprehensively control the rocky desertification of karst areas in the upper and middle reaches of the Yangtze River. By increasing the coverage of forest and grassland vegetation, the ecological situation in areas severely affected by rocky desertification can be comprehensively improved. In addition, we can enhance the stability of mountain systems and curb regional soil erosion. Furthermore, the key restoration areas are mostly distributed in the marginal sources far from the core space, such as Wanzhou District, Qianjiang District, and Tongchuan District, and the importance of the management and control of these marginal areas should be emphasized.

4.2.2. Restoration Strategy of Ecological Corridors at the Linear Scale

Relying on mountains, water systems, farmland shelterbelts, and road corridor systems, we can construct ecological belts around the city and maintain ecological space with connectivity, such as green wedges, to prevent overexploitation of land space and over-continuity of urban space, eventually achieving a good status of urban development. The ecological network can be improved with the mainstream of the middle and upper reaches of the Yangtze River as the main vein and other main tributaries, lakes, reservoirs, and wetlands as the support. At the same time, to improve the ecological stability, landscape characteristics, and functional perfection of the watershed, it is necessary to implement countermeasures according to local conditions and form a protection and restoration system of the whole basin, integrating water conservation in the upper reaches, water and soil conservation in the middle reaches, and wetland protection in the lower reaches. Attention was provided to the construction of the northwest corridor group in the study area (namely the construction of the Chengdu Plain corridor concentration area with Chengdu as the core) and the centralized optimization of the eastern corridor group construction (namely the optimization of the special corridor area in the hilly area with Chongqing as the core).

4.2.3. Restoration Strategy of Ecological Pinch Points at the Point Scale

River obstruction, urban traffic, urban architecture, and other factors were the main reasons explaining the emergence of the key areas of ecological pinch point restoration. Exceeding the tolerance range of urban ecological resilience to external disturbances will reduce or interrupt some landscape ecological flows, and landscape connectivity will be forced to decrease. The key areas of ecological pinch point restoration were large in number and wide in area; thus, it is urgent to coordinate nature conservation and economic construction. For the key restoration areas where natural conditions are not suitable, artificial measures should be applied to enhance landscape connectivity, such as building protection works to resist mountain disasters or digging mountains and building bridges to build ecological greenways. For those areas disturbed by human factors, in addition to building ecological projects, we should also optimize the layout of the city, control the rate of urban expansion, return farmland to forest, build green isolation belts, and separate animal migration pathways and artificial roads to ensure the stable flow of ecological factors.

4.3. Limitations and Prospects

Under the guidance of the basic principles of “carrying out overall protection, implementing divisional restoration, and adhering to comprehensive governance”, this paper introduced the evaluation of urban ecological resilience restricted degree, diagnosed the key ecological restoration areas in territorial space from a macro-comprehensive perspective, and took targeted measures to effectively eliminate or weaken the pressure of natural disasters and human interference on the ecological network and improve the structural connectivity and functional integrity of the ecological system, which was of great significance for coordinating the man–land relationship and ensuring the ecological security and sustainable development of territorial space. Connecting the process and pattern of ecological elements based on the concept of resilience restriction could more intuitively reflect the negative impact of external multisource factors on the urban natural ecosystem. At the same time, it could better reflect the diversity and complexity of the ecosystem itself by exploring the impact of resistance factors with resilience restriction characteristics on the pattern of ecological network security.
However, there were still some shortcomings in the study: in the process of carrying out the assessment of ecosystem service importance, the difference in human society’s demand for ecosystem services was not considered, and the importance of different ecosystem services for ecological source selection requires further research. For the evaluation method of ecological resilience restricted degree, it was still necessary to study the ecological significance and quantitative methods of evaluation factors; the regional ecological environment was continuous and dynamic, and the spatial elements under the guidance of resilience would change to a certain extent with the development of the regional social economy and the trajectory of human activities, which would cause deviations in future strategies, so how to maintain the dynamic capture of ecological restoration strategy is worthy of future research.

Author Contributions

J.J. and H.Z. equally contributed to this work as co-first authors. J.J.: Conceptualization, Methodology, Visualization, Software, Writing—original draft. H.Z.: Conceptualization, Methodology, Software, Data curation, Writing—original draft. F.L.: Writing—review and editing, Supervision, Project administration, Funding acquisition. Q.H.: Writing—review and editing, Supervision, Project administration. L.L.: Conceptualization, Formal analysis, Writing—original draft. H.Q.: Resources, Software, Data curation, Writing—original draft. S.Z.: Software, Formal analysis, Validation, Writing—original draft. All authors have read and agreed to the published version of the manuscript.

Funding

This research was funded by National Natural Science Foundation of China (42101215), CAS “Light of West China” Program, College Students’ Innovative Entrepreneurial Training Plan Program (202210626041), and Youth Training Program of the Institute of Mountain Hazards and Environment, CAS (SDS-QN-1911).

Data Availability Statement

DEM data were downloaded from the Geospatial Data Cloud website (https://www.gscloud.cn/, accessed on 2 November 2021); the normalized difference vegetation index (NDVI) was derived from the global vegetation index change dataset launched by NASA Land Data Center (https://lpdaac.usgs.gov/, accessed on 2 November 2021); the annual rainfall, temperature changes, and road layout data came from the National Earth System Science Data Center (http://www.geodata.cn/, accessed on 2 November 2021); the soil type data were downloaded from the National Qinghai–Tibet Plateau Science Data Center (http://data.tpdc.ac.cn/, accessed on 2 November 2021); the river data and the soil erosion data both came from the resource and environmental science and data center (https://www.resdc.cn/, accessed on 2 November 2021); the data of the land use types were derived from the global geographic information public product GlobeLand30 (http://www.globallandcover.com/, accessed on 2 November 2021); nighttime light data were derived from the data platform of the Earth Observation Group of the National Oceanic and Atmospheric Administration of the United States (https://ngdc.noaa.gov/eog/viirs/, accessed on 2 November 2021); population density data were retrieved from the global high-resolution population plan project (https://www.worldpop.org, accessed on 2 November 2021); the data of carbon storage of carbon fixation in Table 3 were provided by the project sponsor.

Conflicts of Interest

The authors declare no conflict of interest.

References

  1. Folke, C.; Biggs, R.; Norström, A.V.; Reyers, B.; Rockström, J. Social-Ecological Resilience and Biosphere-Based Sustainability Science. Ecol. Soc. 2016, 21, 41. [Google Scholar] [CrossRef]
  2. Prabhakar, S.V.R.K.; Srinivasan, A.; Shaw, R. Climate Change and Local Level Disaster Risk Reduction Planning: Need, Opportunities and Challenges. Mitig. Adapt. Strateg. Glob. Chang. 2009, 14, 7–33. [Google Scholar] [CrossRef]
  3. Han, B.; Jin, X.; Xiang, X.; Rui, S.; Zhang, X.; Jin, Z.; Zhou, Y. An Integrated Evaluation Framework for Land-Space Ecological Restoration Planning Strategy Making in Rapidly Developing Area. Ecol. Indic. 2021, 124, 107374. [Google Scholar] [CrossRef]
  4. Nunes, A.; Oliveira, G.; Mexia, T.; Valdecantos, A.; Zucca, C.; Costantini, E.A.C.; Abraham, E.M.; Kyriazopoulos, A.P.; Salah, A.; Prasse, R.; et al. Ecological Restoration across the Mediterranean Basin as Viewed by Practitioners. Sci. Total Environ. 2016, 566–567, 722–732. [Google Scholar] [CrossRef] [PubMed]
  5. Bai, Z.; Zhou, W.; Wang, J.; Zhao, Z.; Cao, Y.; Zhou, Y. Overall Protection, Systematic Restoration and Comprehensive Management of Land Space. China Land Sci. 2019, 33, 1–11. [Google Scholar] [CrossRef]
  6. Zhang, M.; Wang, S.; Fu, B.; Gao, G.; Shen, Q. Ecological Effects and Potential Risks of the Water Diversion Project in the Heihe River Basin. Sci. Total Environ. 2018, 619–620, 794–803. [Google Scholar] [CrossRef]
  7. Peng, J.; Li, H.; Liu, Y.; Hu, Y.; Yang, Y. Identification and Optimization of Ecological Security Pattern in Xiong’an New Area. Dili Xuebao/Acta Geogr. Sin. 2018, 73, 701–710. [Google Scholar] [CrossRef]
  8. Gao, J.; Du, F.; Zuo, L.; Jiang, Y. Integrating Ecosystem Services and Rocky Desertification into Identification of Karst Ecological Security Pattern. Landsc. Ecol. 2021, 36, 2113–2133. [Google Scholar] [CrossRef]
  9. Kang, J.; Zhang, X.; Zhu, X.; Zhang, B. Ecological Security Pattern: A New Idea for Balancing Regional Development and Ecological Protection. A Case Study of the Jiaodong Peninsula, China. Glob. Ecol. Conserv. 2021, 26. [Google Scholar] [CrossRef]
  10. Liu, Z.; Xiu, C.; Song, W. Landscape-Based Assessment of Urban Resilience and Its Evolution: A Case Study of the Central City of Shenyang. Sustainability 2019, 11, 2964. [Google Scholar] [CrossRef]
  11. Han, Z.; Jiao, S.; Hu, L.; Yang, Y.; Cai, Q.; Li, B.; Zhou, M. Construction of Ecological Security Pattern Based on Coordination between Corridors and Sources in National Territorial Space. J. Nat. Resour. 2019, 34, 2244–2256. [Google Scholar] [CrossRef]
  12. Li, T. New Progress in Study on Resilient Cities. Urban Plan. Int. 2017, 32, 15–25. [Google Scholar] [CrossRef]
  13. Suárez, M.; Gómez-Baggethun, E.; Benayas, J.; Tilbury, D. Towards an Urban Resilience Index: A Case Study in 50 Spanish Cities. Sustainability 2016, 8, 774. [Google Scholar] [CrossRef]
  14. Meerow, S.; Newell, J.P.; Stults, M. Defining Urban Resilience: A Review. Landsc. Urban Plan. 2016, 147, 38–49. [Google Scholar] [CrossRef]
  15. Holling, C.S. Resilience and Stability of Ecological Systems. In The Future of Nature: Documents of Global Change; Yale University Press: New Haven, CT, USA, 2013. [Google Scholar]
  16. Kim, D.; Lim, U. Urban Resilience in Climate Change Adaptation: A Conceptual Framework. Sustainability 2016, 8, 405. [Google Scholar] [CrossRef]
  17. Ferreira, A.J.D.; Pardal, J.; Malta, M.; Ferreira, C.S.S.; Soares, D.D.J.; Vilhena, J. Improving Urban Ecosystems Resilience at a City Level the Coimbra Case Study. Energy Procedia 2013, 40, 6–14. [Google Scholar] [CrossRef]
  18. Bozza, A.; Asprone, D.; Manfredi, G. A Methodological Framework Assessing Disaster Resilience of City Ecosystems to Enhance Resource Use Efficiency. Int. J. Urban Sustain. Dev. 2017, 9, 136–150. [Google Scholar] [CrossRef]
  19. Lehmann, S. Growing Biodiverse Urban Futures: Renaturalization and Rewilding as Strategies to Strengthen Urban Resilience. Sustainability 2021, 13, 2932. [Google Scholar] [CrossRef]
  20. Wang, T.; Li, H.; Huang, Y. The Complex Ecological Network’s Resilience of the Wuhan Metropolitan Area. Ecol. Indic. 2021, 130, 108101. [Google Scholar] [CrossRef]
  21. Adger, W.N.; Adger, W.N. Progress in Human Geography Social and Ecological Resilience: Are They Related? Prog. Hum. Geogr. 2000, 24, 347–364. [Google Scholar] [CrossRef]
  22. Garmestani, A.; Craig, R.K.; Gilissen, H.K.; McDonald, J.; Soininen, N.; van Doorn-Hoekveld, W.J.; van Rijswick, H.F.M.W. The Role of Social-Ecological Resilience in Coastal Zone Management: A Comparative Law Approach to Three Coastal Nations. Front. Ecol. Evol. 2019, 7, 410. [Google Scholar] [CrossRef] [PubMed]
  23. Wang, D.; Chen, J.; Zhang, L.; Sun, Z.; Wang, X.; Zhang, X.; Zhang, W. Establishing an Ecological Security Pattern for Urban Agglomeration, Taking Ecosystem Services and Human Interference Factors into Consideration. PeerJ 2019, 2019, e7306. [Google Scholar] [CrossRef] [PubMed]
  24. Zeng, P.; Zhu, Y. The Comparative Studies on the Eco-Development of the Top Ten Urban Agglomerations in China. Areal Res. Dev. 2013, 32, 45–51. [Google Scholar] [CrossRef]
  25. Wang, S.; Huang, L.; Xu, X.; Li, J. Spatio-Temporal Variation Characteristics of Ecological Space and Its Ecological Carrying Status in Mega-Urban Agglomerations. Dili Xuebao/Acta Geogr. Sin. 2022, 77, 164–181. [Google Scholar] [CrossRef]
  26. Zhang, L.; Peng, J.; Liu, Y.; Wu, J. Coupling Ecosystem Services Supply and Human Ecological Demand to Identify Landscape Ecological Security Pattern: A Case Study in Beijing–Tianjin–Hebei Region, China. Urban Ecosyst. 2017, 20, 701–714. [Google Scholar] [CrossRef]
  27. Wang, Y.C.; Shen, J.K.; Xiang, W.N. Ecosystem Service of Green Infrastructure for Adaptation to Urban Growth: Function and Configuration. Ecosyst. Health Sustain. 2018, 4, 132–143. [Google Scholar] [CrossRef]
  28. Klaus, V.H.; Kiehl, K. A Conceptual Framework for Urban Ecological Restoration and Rehabilitation. Basic Appl. Ecol. 2021, 52, 82–94. [Google Scholar] [CrossRef]
  29. Guo, R.; Wu, T.; Liu, M.; Huang, M.; Stendardo, L.; Zhang, Y. The Construction and Optimization of Ecological Security Pattern in the Harbin-Changchun Urban Agglomeration, China. Int. J. Environ. Res. Public Health 2019, 16, 1190. [Google Scholar] [CrossRef]
  30. Ouyang, X.; Wang, Z.; Zhu, X. Construction of the Ecological Security Pattern of Urban Agglomeration under the Framework of Supply and Demand of Ecosystem Services Using Bayesian Network Machine Learning: Case Study of the Changsha-Zhuzhou-Xiangtan Urban Agglomeration, China. Sustainability 2019, 11, 6416. [Google Scholar] [CrossRef]
  31. Bao, H.; Wang, C.; Han, L.; Wu, S.; Lou, L.; Xu, B.; Liu, Y. Resources and Environmental Pressure, Carrying Capacity, and Governance: A Case Study of Yangtze River Economic Belt. Sustainability 2020, 12, 1576. [Google Scholar] [CrossRef]
  32. Yang-fan, L.; Zhi-yuan, X.; Yi, Y.; Quan-li, W.; Yi, L. Application of Ecological Restoration and Planning Based on Resilience Thinking in Coastal Areas. J. Nat. Resour. 2020, 35, 130–140. [Google Scholar] [CrossRef]
  33. Sharifi, A. Urban Resilience Assessment: Mapping Knowledge Structure and Trends. Sustainability 2020, 12, 5918. [Google Scholar] [CrossRef]
  34. Peng, J.; Ma, J.; Du, Y.; Zhang, L.; Hu, X. Ecological Suitability Evaluation for Mountainous Area Development Based on Conceptual Model of Landscape Structure, Function, and Dynamics. Ecol. Indic. 2016, 61, 500–511. [Google Scholar] [CrossRef]
  35. Colding, J. “Ecological Land-Use Complementation” for Building Resilience in Urban Ecosystems. Landsc. Urban Plan. 2007, 81, 46–55. [Google Scholar] [CrossRef]
  36. Wang, Z.J.; Su, Y. Analysis of Eco-Environmental Vulnerability Characteristics of Hanzhong City, near the Water Source Midway along the Route of the South-to-North Water Transfer Project, China. Shengtai Xuebao/Acta Ecol. Sin. 2018, 38, 432–442. [Google Scholar] [CrossRef]
  37. Xiaolei, Z.; Yuee, Y.; Hui, W.; Feng, Z.; Liyu, W.; Jizhou, R. Assessment of Eco-Environment Vulnerability in the Northeastern Margin of the Qinghai-Tibetan Plateau, China. Environ. Earth Sci. 2011, 63, 667–674. [Google Scholar] [CrossRef]
  38. Hunsaker, C.T.; Graham, R.L.; Suter, G.W.; O’Neill, R.V.; Barnthouse, L.W.; Gardner, R.H. Assessing Ecological Risk on a Regional Scale. Environ. Manag. 1990, 14, 325–332. [Google Scholar] [CrossRef]
  39. Huang, X.; Wang, H.; Shan, L.; Xiao, F. Constructing and Optimizing Urban Ecological Network in the Context of Rapid Urbanization for Improving Landscape Connectivity. Ecol. Indic. 2021, 132, 108319. [Google Scholar] [CrossRef]
  40. Wang, H.; Ma, X.; Du, Y. Constructing Ecological Security Patterns Based on Ecological Service Importance and Ecological Sensitivity in Guangdong Province. Shengtai Xuebao/Acta Ecol. Sin. 2021, 41, 1705–1715. [Google Scholar] [CrossRef]
  41. Daily, G.C.; Söderqvist, T.; Aniyar, S.; Arrow, K.; Dasgupta, P.; Ehrlich, P.R.; Folke, C.; Jansson, A.M.; Jansson, B.O.; Kautsky, N.; et al. Value of Nature and the Nature of Value. Science 2000, 289, 395–396. [Google Scholar] [CrossRef]
  42. Calderón-Contreras, R.; Quiroz-Rosas, L.E. Analysing Scale, Quality and Diversity of Green Infrastructure and the Provision of Urban Ecosystem Services: A Case from Mexico City. Ecosyst. Serv. 2017, 23, 127–137. [Google Scholar] [CrossRef]
  43. Jin, X.; Wei, L.; Wang, Y.; Lu, Y. Construction of Ecological Security Pattern Based on the Importance of Ecosystem Service Functions and Ecological Sensitivity Assessment: A Case Study in Fengxian County of Jiangsu Province, China. Environ. Dev. Sustain. 2021, 23, 563–590. [Google Scholar] [CrossRef]
  44. Norton, L.; Greene, S.; Scholefield, P.; Dunbar, M. The Importance of Scale in the Development of Ecosystem Service Indicators? Ecol. Indic. 2016, 61, 130–140. [Google Scholar] [CrossRef]
  45. Liu, L.; Liu, C.; Wang, C.; Li, P. Supply and Demand Matching of Ecosystem Services in Loess Hilly Region: A Case Study of Lanzhou. Dili Xuebao/Acta Geogr. Sin. 2019, 74, 1921–1937. [Google Scholar] [CrossRef]
  46. Wang, S.; Zhang, B.; Wang, S.; Xie, G. di Dynamic Changes in Water Conservation in the Beijing–Tianjin Sandstorm Source Control Project Area: A Case Study of Xilin Gol League in China. J. Clean. Prod. 2021, 293, 126054. [Google Scholar] [CrossRef]
  47. Chen, X.; Peng, J.; Liu, Y.; Yang, Y.; Li, G. Constructing Ecological Security Patterns in Yunfu City Based onthe Framework of Importance-Sensitivity-Connectivity. Geogr. Res. 2017, 36, 471–484. [Google Scholar] [CrossRef]
  48. Zhu, W.; Zhang, J.; Cui, Y.; Zheng, H.; Zhu, L. Assessment of Territorial Ecosystem Carbon Storage Based on Land Use Change Scenario: A Case Study in Qihe River Basin. Dili Xuebao/Acta Geogr. Sin. 2019, 74, 446–459. [Google Scholar] [CrossRef]
  49. Sun, F.; Zhang, J.; Wang, P.; Wei, G.; Chu, G.; Cao, Y. Construction and Evaluation of Urban Ecological Security Pattern: A Case Study of Suzhou City. Geogr. Res. 2021, 40, 2476–2493. [Google Scholar] [CrossRef]
  50. Li, M.; Zhou, Z. Positive and Negative Ecosystem Services Evaluation and Its Spatial Pattern Analysis on Urban Landscape: A Case Study of Xi’an City. Dili Xuebao/Acta Geogr. Sin. 2016, 71, 1215–1230. [Google Scholar] [CrossRef]
  51. Ma, L.; Bo, J.; Li, X.; Fang, F.; Cheng, W. Identifying Key Landscape Pattern Indices Influencing the Ecological Security of Inland River Basin: The Middle and Lower Reaches of Shule River Basin as an Example. Sci. Total Environ. 2019, 674, 424–438. [Google Scholar] [CrossRef]
  52. Spear, S.F.; Balkenhol, N.; Fortin, M.J.; McRae, B.H.; Scribner, K. Use of Resistance Surfaces for Landscape Genetic Studies: Considerations for Parameterization and Analysis. Mol. Ecol. 2010, 19, 3576–3591. [Google Scholar] [CrossRef] [PubMed]
  53. Wu, M.; Hu, M.; Wang, T.; Fan, C.; Xia, B. Recognition of Urban Ecological Source Area Based on Ecological Security Pattern and Multi-Scale Landscape Connectivity. Shengtai Xuebao/Acta Ecol. Sin. 2019, 39, 4720–4731. [Google Scholar] [CrossRef]
  54. Dai, L.; Liu, Y.; Luo, X. Integrating the MCR and DOI Models to Construct an Ecological Security Network for the Urban Agglomeration around Poyang Lake, China. Sci. Total Environ. 2021, 754, 141868. [Google Scholar] [CrossRef] [PubMed]
  55. Chen, C.; Shi, L.; Lu, Y.; Yang, S.; Liu, S. The Optimization of Urban Ecological Network Planning Based on the Minimum Cumulative Resistance Model and Granularity Reverse Method: A Case Study of Haikou, China. IEEE Access 2020, 8, 43592–43605. [Google Scholar] [CrossRef]
  56. Zhang, Y.; Xu, D.; Li, X.; Zhang, X.; Wang, X.; Wang, S. Construction of Ecological Corridors and Identification of Key Nodes in the Core Area of China-Laos Transportation Corridors. Shengtai Xuebao/Acta Ecol. Sin. 2020, 40, 1933–1943. [Google Scholar] [CrossRef]
  57. Jiao, S.; Liu, Y.; Han, Z.; Zhou, K.; Hu, L.; Liu, T. Determining Priority Areas for Land Ecological Restoration Based on Ecological Network-Human Disturbance: A Case Study of Changsha-Zhuzhou-Xiangtan Urban Agglomeration. J. Nat. Resour. 2021, 36, 2294–2307. [Google Scholar] [CrossRef]
  58. Wang, Y.; Pan, J. Building Ecological Security Patterns Based on Ecosystem Services Value Reconstruction in an Arid Inland Basin: A Case Study in Ganzhou District, NW China. J. Clean. Prod. 2019, 241, 118337. [Google Scholar] [CrossRef]
  59. McRae, B.H.; Hall, S.A.; Beier, P.; Theobald, D.M. Where to Restore Ecological Connectivity? Detecting Barriers and Quantifying Restoration Benefits. PLoS ONE 2012, 7, e52604. [Google Scholar] [CrossRef]
  60. Cao, Y.; Yang, R.; Carver, S. Linking Wilderness Mapping and Connectivity Modelling: A Methodological Framework for Wildland Network Planning. Biol. Conserv. 2020, 251, 108679. [Google Scholar] [CrossRef]
  61. Hui-hui, W.; Han-ting, L.; Miao-miao, X.; Meng, X.; Shao-ling, L.; Zhong-ke, B. Construction of Ecological Security Pattern for Systematic Restoration of Industrial and Mining Land in Resource-Based Cities. J. Nat. Resour. 2020, 35, 162. [Google Scholar] [CrossRef]
  62. McRae, B.H.; Dickson, B.G.; Keitt, T.H.; Shah, V.B. Using Circuit Theory to Model Connectivity in Ecology, Evolution, and Conservation. Ecology 2008, 89, 2712–2724. [Google Scholar] [CrossRef] [PubMed]
  63. Li, J.; Xu, J.; Chu, J. The Construction of a Regional Ecological Security Pattern Based on Circuit Theory. Sustainability 2019, 11, 6343. [Google Scholar] [CrossRef]
  64. Song, L.L.; Qin, M.Z. Identification of Ecological Corridors and Its Importance by Integrating Circuit Theory. Chin. J. Appl. Ecol. 2016, 27, 3344–3352. [Google Scholar] [CrossRef]
  65. An, Y.; Liu, S.; Sun, Y.; Shi, F.; Beazley, R. Construction and Optimization of an Ecological Network Based on Morphological Spatial Pattern Analysis and Circuit Theory. Landsc. Ecol. 2021, 36, 2059–2076. [Google Scholar] [CrossRef]
  66. Dickson, B.G.; Albano, C.M.; Anantharaman, R.; Beier, P.; Fargione, J.; Graves, T.A.; Gray, M.E.; Hall, K.R.; Lawler, J.J.; Leonard, P.B.; et al. Circuit-Theory Applications to Connectivity Science and Conservation. Conserv. Biol. 2019, 33, 239–249. [Google Scholar] [CrossRef] [PubMed]
  67. Peng, J.; Yang, Y.; Liu, Y.; Hu, Y.; Du, Y.; Meersmans, J.; Qiu, S. Linking Ecosystem Services and Circuit Theory to Identify Ecological Security Patterns. Sci. Total Environ. 2018, 644, 781–790. [Google Scholar] [CrossRef]
  68. Pelorosso, R.; Gobattoni, F.; Geri, F.; Monaco, R.; Leone, A. Evaluation of Ecosystem Services Related to Bio-Energy Landscape Connectivity (BELC) for Land Use Decision Making across Different Planning Scales. Ecol. Indic. 2016, 61, 114–129. [Google Scholar] [CrossRef]
  69. Carroll, C.; Mcrae, B.H.; Brookes, A. Use of Linkage Mapping and Centrality Analysis Across Habitat Gradients to Conserve Connectivity of Gray Wolf Populations in Western North America. Conserv. Biol. 2012, 26, 78–87. [Google Scholar] [CrossRef]
Figure 1. Location of the study area.
Land 12 00973 g001
Figure 2. Research route.
Land 12 00973 g002
Figure 3. The evaluation pattern of the degree of urban ecological resilience restriction.
Land 12 00973 g003
Figure 4. Spatial patterns of ecosystem service importance. (a) Food supply; (b) water conservation; (c) carbon fixation; (d) habitat quality; (e) soil conservation; (f) landscape value.
Land 12 00973 g004
Figure 5. Spatial distribution of ecological sources. (a) Importance of ecosystem services; (b) ecological sources.
Land 12 00973 g005aLand 12 00973 g005b
Figure 6. The ecological network of the study area.
Land 12 00973 g006
Figure 7. Spatial layout of key areas of ecological source restoration.
Land 12 00973 g007
Figure 8. Spatial layout of key areas of ecological corridor restoration. (a) The recovery connectivity index; (b) distribution of key areas of ecological corridor restoration.
Land 12 00973 g008
Figure 9. Spatial layout of key areas of ecological pinch point restoration. (a) Current intensity; (b) distribution of key areas of ecological pinch point restoration.
Land 12 00973 g009
Table 1. Evaluation indicator system of the degree of urban ecological resilience restriction.
Rule LayerIndicator LayerWeightThe Meaning of Rule Layer
Geological disastersFractional vegetation cover0.06Reflecting the density of vegetation biomass, the richer the regional vegetation, the more obvious the slope protection effect, and the lower the probability of disasters.
Distance from the river0.01Reflecting the possibility of erosion and erosion of riparian ecosystems by river network systems, the closer to the river, the more obvious the impact on the ecosystem.
Precipitation0.02Reflecting the total amount of rainfall in the region, the denser the precipitation, the higher the probability of landslides and soil erosion.
Soil type0.01Reflecting the characteristics of different soil types and determines the degree of susceptibility to hydraulic erosion according to the properties of the soil itself.
Elevation0.01Reflecting the vertical height and steepness of the surface elements, they jointly determine the possibility of disasters, such as ecosystem collapse, landslides, and mudslides.
Slope0.03
Temperature0.02Reflecting the average annual temperature in the region, the higher the temperature, the greater the amount of evaporation of surface runoff and the lower the degree of hydraulic erosion.
Soil erosion0.08Reflecting the erosion of the soil, the higher the degree of erosion, the more likely geological disasters are to occur, such as soil erosion.
Regional pressureNighttime light index0.08Reflecting the intensity of human activities, the more frequent the human activities, the greater the pressure on regional ecosystems.
Population density0.17Reflecting population aggregation, the larger the regional population, the larger the amount of natural resources required and the greater the pressure on regional ecosystems.
Land use type0.37Reflecting the intensity and utilization of land use, land with high utilization rate has a strong impact on the surrounding natural ecosystems.
Road interferenceDistance from the road0.14Reflecting the diffusion influence range of road system, the closer the ecosystem is to the road, the flow of ecological elements is more easily limited.
Table 2. Quantitative processing of restrictive indicators of urban ecological resilience.
Standard Score246810
Soil typeBlack clay (Subalpine meadow soil)Purple soilRed soil, lateritic soil, southern paddy soilYellow soil, brown soil, yellow brown soilCalcareous soil
Soil erosionMildModerateStrongStrongerSevere
Land use typeForestlandWetland,
water area
Grassland, shrub landCultivated landBare land and other unused land, construction land
Table 3. Assessment indicators of ecosystem service importance.
IndicatorFormula and Interpretation
Food
supply
F o o d s u p p l y x j = N D V I m x N D V I s u m j × F o o d s u p p l y j
F o o d s u p p l y x j   represents the grain supply service of the x raster in j county, N D V I m x   represents the NDVI maximum value of the raster throughout the year, N D V I s u m _ j represents the sum of the annual maximum NDVI value in the j   county of the arable land layer, and F o o d s u p p l y j   represents the annual grain production of the j county
Water
conservation
T Q = k = 1 n P k R k E T k × A k × 10 3
T Q is the total water conservation (m3), P k is the rainfall (mm), R k is the surface runoff (mm), E T k is the evapotranspiration (mm), A k is the k ecosystem area (km2), k   is the k   ecosystem type in the study area, and n   is the number of ecosystem types in the study area.
Soil
conservation
S C = R × K × L S R × K × L S × C × P
S C is the soil retention, R is the precipitation erosion coefficient, K is the soil erosion coefficient, L and S are the slope length and slope coefficients, respectively, and C is the vegetation cover coefficient. The value is calculated according to the vegetation coverage; P is the soil and water conservation coefficient.
Carbon
fixation
C x i = C s o i l i + C a b o v e i + C b e l o w i + C d e a d i
C x i is the annual carbon sequestration of the x grid of the i land use type, C s o i l i is the soil organic carbon storage, C a b o v e i is the aboveground biological carbon storage, C b e l o w i is the underground biological carbon storage, and C d e a d i is the dead organic carbon storage.
Habitat
quality
D x i = 1 r 1 y w r / r = 1 n w r × r y × b r x y × β x × S i r
M x i = H x i × 1 D x i z / D x i z + k 2
M x i is the habitat quality of the x grid of the i land use type, and its value range is 0–1. If the value is larger, the habitat quality is better. D x i is the degree of habitat degradation; H x i is the habitat adaptability; k is a semisaturation constant; r is the habitat threat factor; w r is the weight of the threat factor; r y is the intensity of the threat factor; β x is the habitat anti-interference level; S i r is the relative sensitivity of different habitats to different threat factors; and b r x y is the extent to which the x grid is affected by the threat factor r in the y grid.
Landscape
value
Reference to previous studies, the tourism and leisure value of the unit area of 8 types of land use, such as forestland, grassland, cultivated land, water area, bare land, shrubland, wetland, and construction land, respectively, was CNY 1940/hm2, 60/hm2, CNY 20/hm2, CNY 6580/hm2, CNY 0/hm2, CNY 1940/hm2, CNY 6580/hm2, and CNY 0/hm2, respectively, and these values were used to evaluate landscape value services.
Table 4. Statistics on ecological sources in the study area.
The Name of the District and CountyQuantity
(pcs)
Quantity Share (%)Area
(km2)
Area Percentage
(%)
Jinkouhe District, Xingjing County, etc.211.7712,718.4129.10
Xuanhan County, Kai County, Wanzhou District, etc.635.2918,313.4841.89
Longquanyi District15.88149.470.34
Jiangyou City15.88430.920.99
Rong County, Weiyuan County15.88604.661.38
Dayi County, Dujiangyan, etc.211.773872.198.86
Hejiang County, Gao County, etc.423.537622. 6517.44
Total1710043,711.78100
Table 5. Statistics on key areas of ecological source restoration in the study area.
Level of InterferenceCoverage Districts and CountiesArea
(km2)
Area Percentage
(%)
High
interference zone
Shapingba District, Qianjiang District, Yuzhong District, Longquanyi District, etc.1350.693.09
Medium high
interference zone
Xuanhan County, Wanzhou District, Qianjiang District, Qu County, Jiangjin District, etc.6443.1214.74
Total7793.8117.83
Table 6. Statistics on key areas of ecological corridor restoration in the study area.
Administrative UnitsKey Area Length
(km)
Length Percentage (%)Barrier Areas Identify Land Use Types
Jiangyou7.561.99Farmland, woodland
Ann22.445.90Farmland, town land, waters, woodland
Fucheng14.823.90Farmland, grassland, town land
Luojiang34.439.05Farmland, waters
Jingyang9.712.55Farmland, waters
Zhongjiang16.714.39Farmland, woodland, grassland
Shifang8.652.27Farmland, waters
Guanghan24.626.47Grassland, waters, wetland
Jintang28.147.40Farmland, waters
Jianyang7.411.95Farmland, town land, waters
Shuangliu62.1716.34Farmland, town land, grassland
Chongzhou16.234.27Farmland, town land. waters
Qingshen4.531.19Farmland, town land
Zizhong23.786.25Farmland, woodland
Rong11.453.01Farmland
Qianwei9.052.38Farmland, waters
Shizhong7.121.87Farmland, grassland, town land
Dongxing18.124.76Farmland, town land
Longchang9.162.41Farmland
Rongchang4.391.15Farmland, grassland
Dazu4.061.07Farmland, town land
Nagakawa4.261.12Farmland
Minamikawa8.742.30Farmland, grassland, town land
Yubei5.031.32Farmland, woodland
Longevity9.152.41Farmland, waters
Zhong3.450.91Farmland, town land
Kaijiang5.211.37Farmland
Table 7. Statistics on key areas of ecological pinch point restoration in the study area.
Administrative
Units
Quantity Percentage
(%)
Quantity
(pcs)
LocationThe Type of
Corridor
Influencing
Factors
Lushan3.451East side of the Longmen MountainsGreenwayGeological hazards
Rong3.451Ziwei anticlines the southwestern sectionGreenwayGeological hazards
Wanzhou3.451Low-lying land between the Daba MountainsGreenwaySteep terrain
Chongzhou3.451The west section of the Min River tributaryRiverUrban traffic
Dachuan3.451The western gentle slope of the terraced hilly
area and the northern terrace low-lying lowland
GreenwayUrban traffic
Jiangyou3.451Longquan Mountain Range in
the southwest of Jiangyou city
GreenwayUrban traffic
Jianyang3.451On the west side of the Longquan Mountains,
on the north side of Sancha Lake
GreenwayUrban traffic
Qu3.451Gentle slopes on the west side of the
Ba River are terrace-like hills
GreenwayUrban traffic
Shehong3.451Transition zone between low hills and hills in the westGreenwayAgricultural production
Hejiang10.341Northwest of the central branch of the Dalou MountainsGreenwayRiver obstruction
2Urban traffic
Jintang6.902The Tuojiang River system stretches
on both sides of the river
RiverUrban architecture
Longquan MountainsGreenwayUrban traffic
Jiangjin6.902Southern part of the Middle Liang MountainsGreenwayUrban traffic
Lowland between the southern part of causeway
Mountain and the southern hills of the region
Fuling3.451The area is southeast of the Wujiang River basin to the westGreenwayRiver obstruction
3.451Urban traffic
Guanghan3.451On both sides of the Duck River section
of the Tuojiang River system
Artificial roadUrban architecture, urban traffic
Zhong6.902On both sides of the Yangtze RiverGreenwayUrban architecture, urban traffic
Shifang3.451On both sides of the Duck River
section of the Tuojiang River system
RiverUrban traffic, agricultural production
Yongchuan3.451The intersection of the Nine
Peaks Mountains and G8515
Artificial roadUrban traffic, agricultural production
Zitong13.794On the east side of the Tong River, Yangzi quasi-platformGreenwayUrban traffic, agricultural production
Kaijiang3.451North side of the Daba MountainsGreenwayRiver obstruction, urban traffic
Qingshen3.451Between the Min River and its tributary, the Jinniu RiverGreenwayFluvial erosion, urban traffic
Disclaimer/Publisher’s Note: The statements, opinions and data contained in all publications are solely those of the individual author(s) and contributor(s) and not of MDPI and/or the editor(s). MDPI and/or the editor(s) disclaim responsibility for any injury to people or property resulting from any ideas, methods, instructions or products referred to in the content.

