Article

Assessment of Urban Ecological Resilience Based on PSR Framework in the Pearl River Delta Urban Agglomeration, China

1
School of Geography, South China Normal University, Guangzhou 510631, China
2
School of Tourism Management, Chaohu University, Hefei 238024, China
*
Author to whom correspondence should be addressed.
Land 2023, 12(5), 1089; https://doi.org/10.3390/land12051089
Submission received: 16 April 2023 / Revised: 14 May 2023 / Accepted: 15 May 2023 / Published: 18 May 2023

Abstract

:
Studying resilience provides an opportunity to address a range of urban environmental problems. However, existing studies pay little attention to urban ecological resilience (UER), and the system of assessing urban resilience pays little attention to the process attribute of resilience. This study focuses on UER and constructs an evaluation framework based on the pressure _state _response (PSR) framework. The ‘pressure’ indicator morphological resilience (MR) is evaluated using source _sink landscape theory. The ‘state’ indicator density resilience (DR) is evaluated using the ratio of ecological carrying capacity to ecological footprint. The ‘response’ indicator uses indicators of economic structure, vitality, and innovation for evaluation. We found that the MR and DR of the study area in 2020 showed a spatial layout of low in the central area and high in the peripheral areas, while the high-value ER area was in the central part. The average district and county MR was 1.44, DR was between 0.003 and 1.975, and ER was 0.32; overall, ER and MR are better in the study area, but DR is worse. The spatial layout of comprehensive UER was found to be low in the middle and high in the periphery of the study area. Some areas with low MR and DR have high UER, which verifies the compensation effect of ER on urban ecology. This study provides a new method for assessing UER, and the findings can provide useful information for urban planning.

1. Introduction

The urban environment has become vulnerable and sensitive due to urbanization and agglomeration development [1,2]. Sustainable and resilient cities are the vision of the future, as proposed in the New Urban Agenda by UN-Habitat III in 2016. Urban resilience, which is an effective solution for cities to deal with natural disasters and human pressure, can promote the sustainable development of cities and ensure human well-being [3]. Urban ecological resilience (UER) is an important part of urban resilience, but it often limits the sustainable development of many cities [4]. Therefore, assessing UER is an important part of urban governance and the formation of resilient cities [5,6].
UER refers to the ability of an urban system to absorb and adapt to risk and gradually establish a new stable state [7]. However, existing studies do not pay much attention to UER, which is usually analyzed as a level of urban resilience. The Rockefeller Foundation- has developed a relatively comprehensive assessment framework for urban resilience, which includes some indicators of the urban environment and health [6]. The hierarchical analysis method has been applied in many studies evaluating urban resilience [6,8]. Some environmental or pollution indicators have been used to evaluate urban ecological resilience, such as the urban green land rate and the utilization rate of industrial solid waste [9,10]. Urban resilience is a process of gradually adapting to and improving from an impact or disturbance, and recovering or establishing a new stable state. Therefore, urban resilience has process attributes, including UER [2]. However, we note that previous methods for assessing urban resilience ignored the process attributes of resilience.
The pressure _state _response (PSR) framework reveals the interrelationship among motivation, systems and human actions [11]. “Pressure” refers to the interference and stress faced by the city, “state” refers to the overall situation of the city’s current environment and social ecology, and “response” refers to the system feedback to cope with the impact of pressure, mostly reflecting the elements of human intervention [12,13]. The PSR framework was first proposed by Canadian statisticians Rapport and Friend, was used by the United Nations Environment Programme to study environmental problems, and has been widely used in ecological security, environmental health and other fields [12,14,15]. For example, Cheng et al. built an ecological security assessment model of land resources in mainland China based on the PSR framework [13]. The PSR framework is often combined with remote sensing data to assess ecosystem health in wetlands or watersheds [11,12]. The logic behind the PSR framework is similar to the process of urban response after disturbance. Hence, we constructed an assessment framework of UER based on the logic of the PSR framework.
The Pearl River Delta Urban Agglomeration (PRD) was the first national forest urban agglomeration in China. The ecological location of the PRD is important, as three of the eight main global migratory bird routes pass through the area [16]. The urbanization rate in PRD is relatively high, and the growth rate is not decreasing. It still has a stable growth rate after urbanization rate reached 71.4% in 2000 [17]. Previous studies have found that environmental pollution, mangrove degradation and other problems keep appearing in the PRD [18]. Sun et al. integrated the PSR framework into a Mamdani fuzzy inference approach to evaluate ecological security in the PRD, and they found that Zhaoqing had the highest level of ecological security, while Foshan had the lowest [19]. In 2018, using the “size-density-morphology” approach to urban resilience proposed by Xiu et al. [20], Wang evaluated the urban ecological resilience of PRD, and they found that the coupling coordination degree between UER and urbanization presented a circle pattern that centered on the Pearl River estuary and increased toward the periphery [3]. The study found that urban agglomeration has become the main area responsible for carbon neutrality due to its increased proportion of carbon emissions [21]. Assessing the ecological resilience of the PRD can provide references for other cities and urban agglomerations.
Specifically, the main aims of the present were as follows: (1) to build a UER evaluation system based on the logic of the PSR framework; (2) to assess UER of the PRD in 2020; and (3) to provide suggestions for improving UER.

2. Materials and Methods

2.1. Study Area

The PRD is located in Guangdong Province on the southeast coast of China (21.17–23.55° N, 111.59–115.25° E (Figure 1). Geographically, it was first formed by sediment from the Pearl River system at its estuary. The PRD developed water systems and numerous water networks, and has average annual rainfall of 1600–2000 mm with the most precipitation in summer [16]. The main land use types in the study area are forest land and cultivated land, accounting for more than 70%.
With a dense population and rapid economic development, the study area is one of the three largest urban agglomerations with the highest comprehensive strength in China [18]. In 2020, the PRD had a permanent population of 78,235,400 and a gross domestic product (GDP) of 1.37 trillion, accounting for 8.8% of China’s total economy. The PRD is the mainland part of the Guangdong–Hong Kong–Macao Greater Bay Area and serves as a link between the internal and external circulation of the country’s economy [22]. In this study, the 50 districts and counties of the PRD are taken as the basic analysis units, as there is no administrative division of districts and counties under the prefecture-level cities of Dongguan and Zhongshan, which are also taken as basic analysis units. PRD data in 2020 were selected for assessment in this study.

2.2. UER Evaluation Framework Construction

Based on the logic of the PSR framework, some indicators in the “size–density–morphology” framework and economic indicators in the urban adaptability indicator system were integrated to build a UER evaluation framework (Figure 2) [20,23]. Morphological resilience (MR) is the pressure indicator. Urban morphology describes the material elements of the city and the allocation of various categories, which has a significant impact on urban disaster prevention and mitigation, and response capacity [24]. Construction land expansion brings many risks to urban ecology, and ecological space can reduce the pressure. Therefore, MR is used in this study to characterize the mosaic state of urban construction land and ecological space [25].
Density resilience (DR) is the state indicator, which can reflect the carrying capacity of the urban ecology under population pressure [26]. When the population density is too high, the influence of human activities greatly exceeds the digestion capacity of nature, resulting in a series of environmental problems, such as water pollution and air pollution. Therefore, DR is of great significance for UER. In this study, ecological footprint theory was adopted to represent the impact of population activities on UER; the theory can reflect the state of sustainable development in a region [3,20].
Economic resilience (ER) is the response index. Many studies have shown that cities with better economic status can invest more funds to build urban defense foundation societies and protect the urban ecology [22,27,28]. In addition, existing studies have shown that in PRD, the better the economic situation, the more sound the environmental protection facilities and environmental problem-solving measures are [18]. Therefore, we used ER to reflect the ability to respond to ecological risks.

2.3. Methods of Evaluating UER Indicators

2.3.1. Evaluating Morphological Resilience

We evaluated MR based on the “source–sink” landscape pattern theory, which is derived from atmospheric pollution research. In this study, we used the landscape type distance index to characterize MR [29]. “Source” refers to landscape types that cause side effects in the urban ecology, and “sink” refers to landscape types that absorb and reduce ecological threats [3,30]. In this study, construction land is defined as a “source” because it increases the probability of urban ecological risk. Forests, grasslands, wetlands, and water bodies are defined as sinks because they can eliminate risks [20]. Cultivated land was not included in the analysis because it can partially eliminate ecological risks, but artificial fertilization in cultivated land increases pollution.
First, we divided land uses into “sources” and “sinks”, and then calculated the closest distance from “sinks” to “sources” in ArcGIS 10.7. After adding the total distance of each county or district, we divided the number of “source” patches in the region to obtain the average distance index of “source–sink” patches in the region, and the specific calculation equation is as follows,
L d = i = 1 m min ( d i j ) m · ( i = 1 ,   2 ,   3 m ; j = 1 ,   2 ,   3 n
where Ld represents the average distance of “source” patches, dij represents the minimum distance between “source” and “sink” patches, and m and n represent the number of “source” and “sink” patches, respectively.
MR is a pressure index that should have adverse effects on UER. In order to facilitate the calculation of comprehensive UER. Equation (2) was used to transform MR into a beneficial index, and the larger MR, the better the urban landscape pattern.
MR = L/Ld
where L represents the average value of the landscape distance index; in this study, is 657.96.

2.3.2. Evaluating Density Resilience

The ratio of ecological carrying capacity to ecological footprint is used to evaluate DR (Equation (3)), which can reflect the current ecological state under bearing ecological pressure brought by population density [3]. According to ecological footprint theory, the consumption of natural resources by the population can be transformed into a comparable area of ecologically productive land [31]. Here, ecological carrying capacity refers to the maximum carrying capacity of urban ecological productive land under population density [32].
In this study, we referred to the Special Report on the Per Capita Consumption of Main Food in Guangdong Households (Edition 2019) (https://www.docin.com/p-2379423978.html, 14 May 2023) [33] and converted the corresponding consumption into cultivated land, forest land, grassland and water area. Fossil energy consumption was calculated by converting it into standard coal and then into fossil energy land according to data from the Guangdong Statistical Yearbook (2021) [34]. We used Equation (4) to calculate the ecological footprint.
The calculation of ecological carrying capacity is shown in Equation (5). Due to regional and land type differences, certain land areas need to be multiplied by the corresponding yield factor and equilibrium factor to convert ecologically productive land areas consistent with the ecological footprint.
The equilibrium and yield factors are coefficients that convert all kinds of ecologically productive land into land areas with the same productivity [35]. In this study, the “provincial hectare” and “municipal hectare” models proposed in previous studies were adopted to localize the equilibrium and yield factors [36]. The specific calculation is shown in Equations (5) and (6).
DR = EC(1 − 12%)/EF
where EC is ecological carrying capacity and EF is the ecological footprint, and 12% represents the EC for protecting biodiversity, proposed by the World Commission on Environment and Development [3,20,32];
EF = ef   ×   N = N γ j S j
where ef refers to the per capita ecological footprint, N represents the number of permanent residents in the corresponding area, γj refers to the equilibrium factor of type land j, and Sj refers to the per capita occupied area of a certain type of land;
EC = ec   ×   N = N a j γ j y j
where ec is per capita ecological capacity, aj represents the actual per capita occupied area of class j land, and yj is the yield of class j productive land.

2.3.3. Evaluating Economic Resilience

ER was assessed in terms of economic structure, vitality, and innovation. The economic structure is expressed as the proportion of GDP in the tertiary industry. The tertiary industry plays a significant role in promoting modernization, and previous studies have shown that ER will increase accordingly [37]. Economic vitality is expressed in terms of per capita GDP and total retail sales of social consumer goods, which is the most intuitive manifestation of urban economic development and can reflect the vitality of a city. GDP per capita is the most intuitive manifestation of regional economic conditions (Wagner’s Law) [38], and consumption, an essential component of economic development, also promotes economic development. Economic innovation is represented by the proportion of financial investment in education and science and technology. The greater the two investments, the stronger the learning ability and innovation ability of the urban system to respond to change [39].
After data collection, hierarchical analysis is used to calculate economic resilience. The indicator weights are shown in Table 1. To avoid unit differences, the min-max standardization method was used to linearly change the original data before calculating economic resilience. Equation (6) shows the standardization.
Yi = (Xi − Mini)/(Maxi − Mini)
where Yi represents the value of indicator i after standardization, Xi represents the value before standardization, Maxi represents the maximum value, and Mini represents the minimum value.

2.3.4. Evaluating Comprehensive UER

UER is the combination of MR, DR and ER (Figure 2). The three-dimensional space vector method was used to determine comprehensive urban ecological resilience [40], representing the three types of resilience. Since the standardized resilience values are all in the range of [0, 1], (1,1,1) is the most ideal target value for the development of UER. The specific calculation for district and county UER is shown in Equation (7).
UER = a   2 + b   2 + c   2
where a, b, and c represent MR, DR, and ER, respectively, after standardization.

3. Results

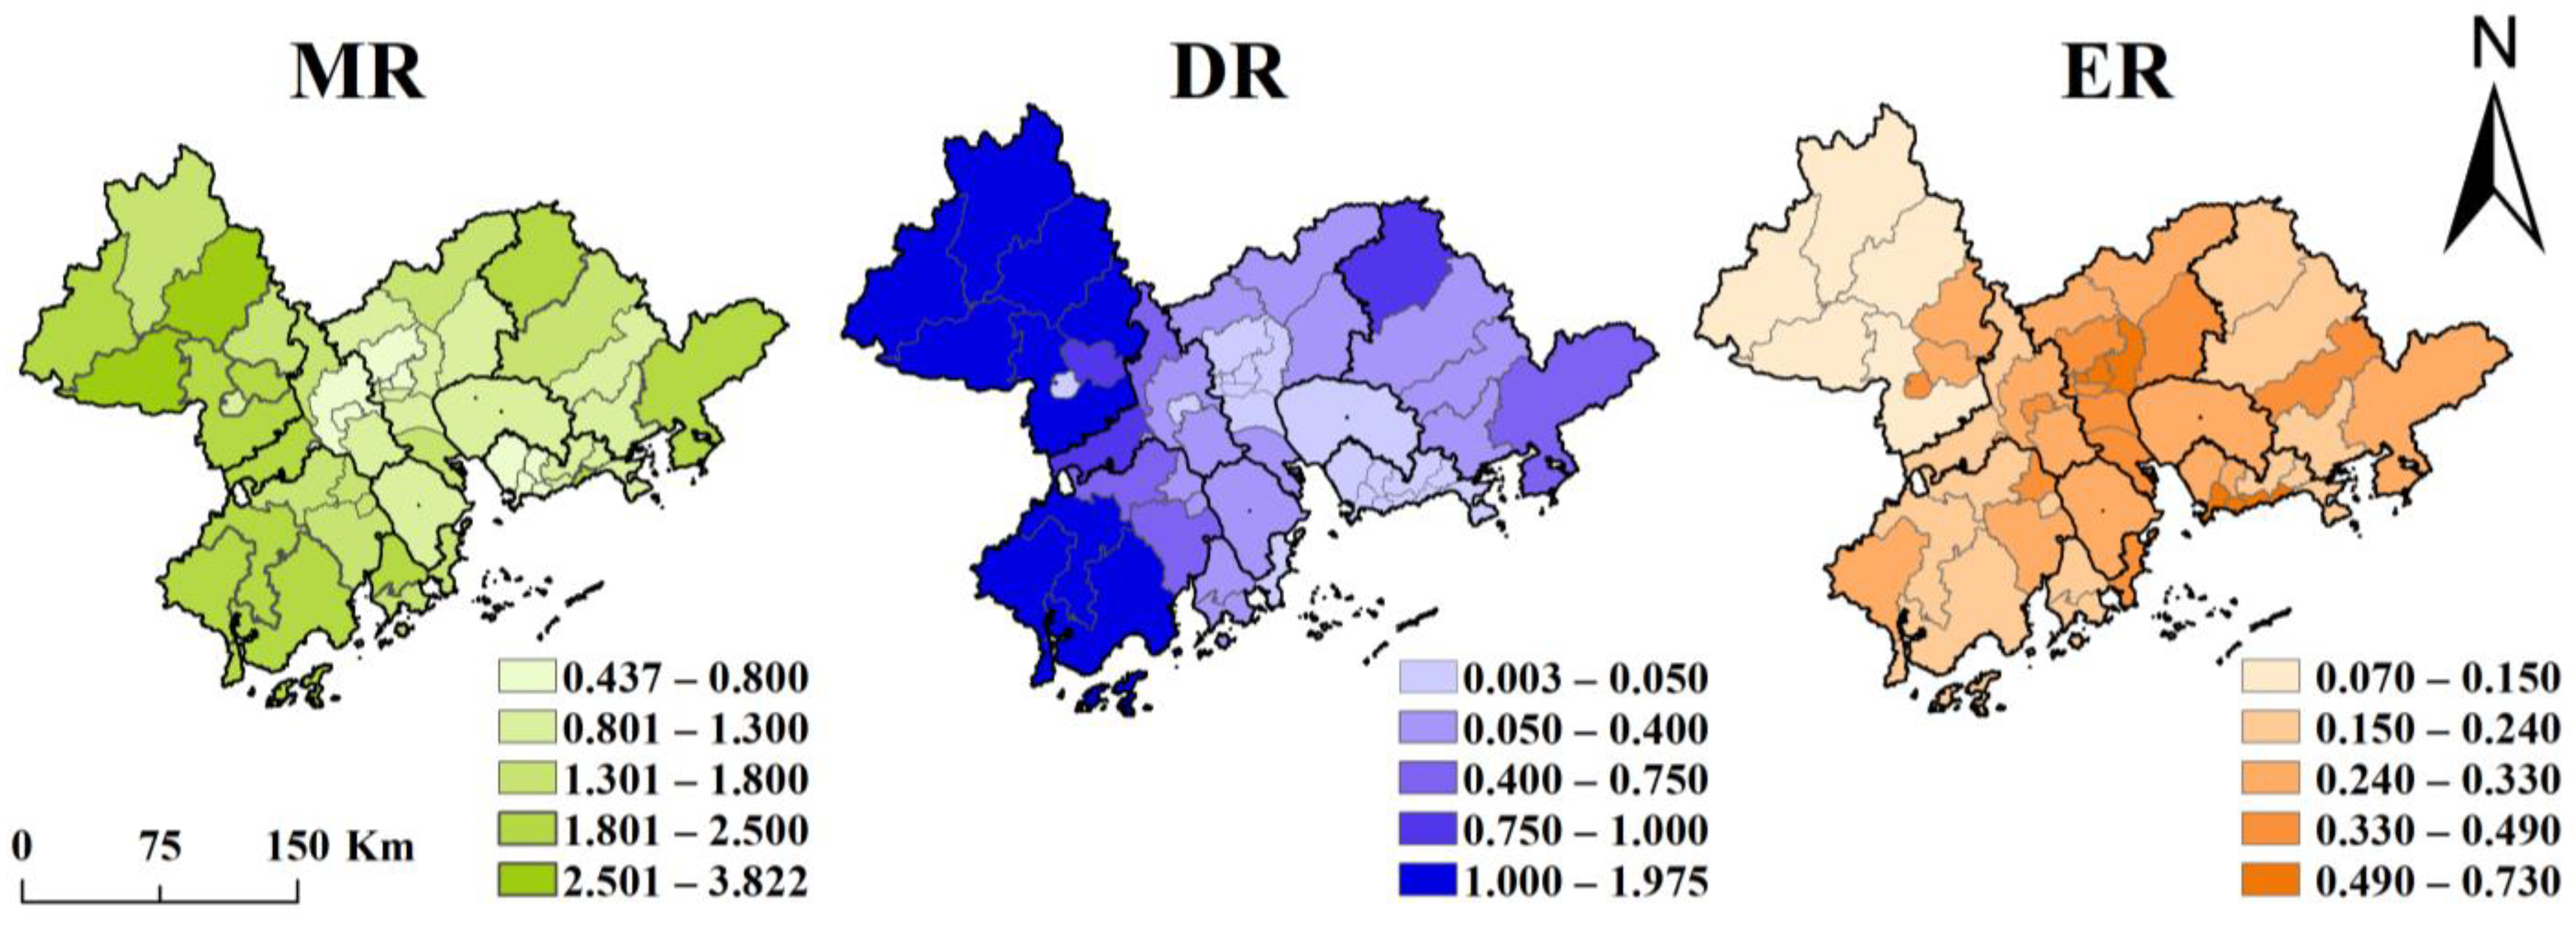
3.1. Morphological Resilience

In 2020, the average value of MR of the PRD was 1.44 with a standard deviation of 0.72 (Table 2). The spatial distribution of MR presents a layout of low value in the central part of the study area, and high value in the peripheral areas (Figure 3). This indicates that the ecological landscape inlaid degree in the periphery of the study area is better. The MR of Guangzhou, Foshan and Shenzhen is generally low, while that of Zhaoqing and Jiangmen is better (Figure 4). There is a significant overlap between low MR value areas and construction land in various cities (Figure 2 and Figure 3).

3.2. Density Resilience

The ecological footprint of most districts and counties in the PRD is larger than the ecological carrying capacity, presenting a state of mismatch between supply and demand. The mean DR in the PRD is 0.32, and all districts have a DR between 0.003–1.975 (Table 2). The DR is lower in the central urban areas of cities in the study area than in the surrounding areas (Figure 3). Guangzhou and Shenzhen have low DR overall, and the DR of each district and county is basically less than 0.1 (Figure 4). Among the nine prefecture-level cities, Zhaoqing has the highest density resilience with an overall value greater than 1. Some areas in the PRD still have ecological surpluses, and this is different from the results of ecological deficits reported in the “Ecological Footprint of Guangdong, Hong Kong, Macao and the Great Bay Area” [41].

3.3. Economic Resilience

In 2020, the average ER of the PRD was 0.32 with a standard deviation of 0.15 (Table 2). The ER was higher in the central and southern areas, and lower in the suburb. In each prefectural city, the ER of the central city and some new districts is significantly higher compared to other areas, such as Duanzhou and Dinghu Districts of Zhaoqing (Figure 3). The high-value ER area in the study area is mainly in Guangzhou and Shenzhen. An analysis of the basic data shows that the industrial structure of the whole PRD is better, the consumption vitality of Huizhou and Shenzhen is relatively high, and the input of science and education in each city is similar to the per capita GDP.

3.4. Comprehensive UER

The mean UER for the study area in 2020 was 0.617 with a standard deviation of 0.249. The comprehensive UER of Jiangmen and Zhaoqing was higher, while that of Dongguan and Zhongshan was slightly lower (Table 2). The UER of the study area was lower in the middle and higher in the periphery (Figure 5). The higher UER in some districts and counties in Guangzhou and Shenzhen correlates with the higher ER value. The morphological and density resilience of Zhaoqing and Jiangmen were higher than their economic resilience, and the development of Foshan and Huizhou was relatively balanced in all aspects (Figure 6).

4. Discussion

4.1. Framework of UER Evaluation

The constructed “MR–DR–ER” UER evaluation framework based on the logic of the PSR framework makes up for the lack of attention paid to the attributes of the resilience process in existing urban resilience studies [14]. This paper verifies the wide applicability of the PSR framework in ecological environment research. All three UER evaluation indicators emphasize the interactions between humans and the ecological environment [26]. The assessment of morphological resilience is based on source–sink landscape theory, which combines dynamic ecological processes with static landscape patterns, and is consistent with the concept of incorporating a landscape index into the ecological analysis process proposed by previous studies [13,29]. The ecological footprint and ecological carrying capacity, as indicated by DR, are the true reflections of current urban ecological supply and demand [42]. While the expansion of urban scale brought about by economic growth has put great pressure on urban ecology, many studies have shown that the economic condition can reflect the ability and speed of urban environmental governance [22,28]. ER is a representation of a city’s ability to respond and evolve when confronted with shocks [27], and studies in PRD have verified the important role of socioeconomic factors in ecological restoration [18]. In this paper, the values of DR and MR of some districts and counties in Guangzhou and Shenzhen are low, and the overall UER is increased due to the higher ER, which verifies the effect of the economy on UER.

4.2. Evaluation and Spatial Difference of UER Indicators

The use of source–sink landscape theory to evaluate MR has shifted the analysis of the relationship between landscape patterns and ecological processes from qualitative to quantitative [43]. The low-value areas of MR are mainly in districts and counties of Guangzhou and Shenzhen, primarily due to the large volume and high continuity of buildings in these districts, and the imperfect planning of green spaces in some old urban areas (Figure 1). According to the evaluation method and theory of this study, the low building density in the urban fringe should have a higher MR, but the MR of the counties in Foshan and Dongguan fringe areas is not higher than that in the central area. This is related to the object of this paper, which is urban agglomeration. In urban agglomerations, the edge zone near cities with the ”head effect” is more closely related to the traffic of neighboring cities and undergoes rapid economic construction, so it has a higher density of built-up space [44].
The ratio of ecological carrying capacity to the ecological footprint was used to evaluate MR. Previous studies mostly used the difference between the two to reflect ecological deficits [32]. MR obtained by the ratio method is more convenient for comparing of the unit area than the ecological deficit. In addition, the ecological footprint and carrying capacity calculated by the localized equilibrium factor and yield factor are more consistent with the real situation of the PRD. The localization evaluation method also explains why DR is still greater than 1 in the study area, and why this differs from the existing ecological footprint report [41]. One of the reasons for the low DR in the central part is that the population is concentrated. Guangzhou and Shenzhen both have a population of 10 million with tremendous total ecological consumption. Another reason is that in order to develop the economy in these cities, agricultural ecological land with low economic efficiency has been occupied a lot, and its regional production capacity and ecological carrying capacity have declined.
The phenomenon of the economy’s feeding back to the environment gradually becomes prominent in developed areas [18,28]. In Guangdong Province, the enlarged of domestic sewage treatment pipe networks in Guangzhou, Shenzhen, and Dongguan accounted for 78.6% of the increase in the province since 2018. Economic structure, vitality, and innovation can comprehensively reflect the urban economic condition [37,45]. Studies have shown that foreign direct investment can improve regional green total-factor productivity [45]. The high-value ER areas in the study area are mainly concentrated in the central and southern areas, and in the central urban areas of prefecture-level cities. Guangzhou, an area with high economic resilience, is the capital city and has concentrated resources, while Shenzhen and Zhuhai, the earliest special economic zones in China, had an early start in development and have relatively concentrated technology resources.
The reliability of the three-dimensional space vector method for calculating the comprehensive UER in this study has been verified in comprehensive measurement research in multiple fields [40]. The comprehensive UER of the PRD presents a rough spatial layout of high in the middle, and low in the periphery, while ER presents a layout of high in the middle and low in the periphery (Figure 5). In areas with high ER and low MR and DR, ER improves the comprehensive UER, such as the coastal counties of Zhuhai and Shenzhen, which also verifies the effect of economic compensation on ecology [18,27,45]. The differences in the three types of resilience for each prefecture-level city after standardization (Figure 6) are almost consistent with the results of the ecological niche of natural and social ecosystems in the cities of PRD, which were analyzed by Chen using the analogy method [46].

4.3. Policy Implications for Improving UER

Improving UER should start with MR, DR, and ER together. The mosaic of the blue and green urban landscape and architectural facilities is an important measure to improve MR. First of all, urban ecological networks should be strengthened; for the space that has already been built, and we should keep building pocket parks by using space adjacent to roads, houses, and ponds to make up for the current ecological shortcomings [10]. Based on maintaining the ecological red line in China, for future development and construction spaces, spatial planning should be performed in advance, and the layout and scope of blue–green spaces should be designed to avoid damaging the integrity of existing natural patches. Moreover, we should constantly promote urban renewal and the construction of ecological communities.
DR is closely related to population density. In the short-term, it is difficult to improve ecological carrying capacity; on the one hand, employment benefits in low-density areas can be improved to alleviate the population pressure in high-density areas, while on the other hand, resource consumption needs to be reduced in various ways. Firstly, residents should be encouraged to adopt an environmentally friendly lifestyle and recycle resources, such as paper, metal products and food residues through garbage classification. Secondly, enterprises with substantial fossil energy consumption should constantly explore the use of renewable resources and improve the utilization rate of fossil energy through scientific and technological capabilities.
Improvement of ER is often not achieved by one city’s efforts. It is necessary to give full play to the driving role of cities with higher economic status in urban agglomerations, enhance the vitality of small and medium-sized urban areas to develop characteristic demonstration industries, actively seek trans-regional cooperation, coordinate and improve industrial chain links, and smooth out competitive and cooperative relationships [46]. In addition, it is necessary to deepen financial investment in science, technology, and education innovation, introduce more high-tech foundations, and pursue all-around high-quality, cost-effective development of an urban agglomeration economy [44]. Furthermore, we should enhance economic and environmental protection efforts, and reduce negative environmental effects brought about by economic development.

4.4. Limits of This Study

Although we tried our best to ensure the reliability of the evaluation results, the study still had some shortcomings. In the assessment of MR, we only looked at the mosaic of ecological space within a certain study area, but PRD has several coastal cities. Previous studies found that when considering the blue ocean landscape, the mosaic status would be improved [47]. However, due to data availability, only continental data could be obtained, so the marine ”sink” of coastal cities was not been considered. When calculating the ecological footprint, we could only obtain district-level data of the human consumption of food, wood, and fossil energy, so the calculated ecological footprint is smaller than the actual consumption. In addition, it is still under wide discussion whether the economic threat to urban ecology or the protection effect is greater. Future studies should further consider the proportion of ER included in the comprehensive UER calculation.

5. Conclusions

Based on the PSR framework, in this paper, we constructed a UER assessment framework and evaluated the UER of the PRD. Morphological resilience was evaluated based on source and sink landscape theory, density resilience based on the ratio of ecological carrying capacity and ecological footprint, and economic resilience by the indicators of the economic structure, economic vitality, and economic innovation. The analysis showed that in 2020, the average morphological resilience of each district and county in PRD was 1.44, density resilience was between 0.003 and 1.975, and average economic resilience was 0.32. The spatial layout of MR and DR is roughly high in the middle and low in the periphery of the study area, while ER is the opposite. The layout of UER confirms the role of the economy in guaranteeing and compensating for urban ecology. We propose enhancing UER by strengthening urban green space planning, relieving population pressure in core urban areas, advocating a green lifestyle, and increasing the proportion of environmental investment in the economy.

Author Contributions

Conceptualization, Q.Z.; Data curation, T.H.; Formal analysis, T.H.; Funding acquisition, S.X.; Investigation, S.X.; Methodology, Q.Z.; Resources, T.H.; Software, T.H.; Supervision, S.X.; Validation, Q.Z.; Writing—Original draft, Q.Z.; Writing—Review and editing, S.X. All authors have read and agreed to the published version of the manuscript.

Funding

This research was funded by the National Natural Science Foundation of China, grant number 41877411.

Institutional Review Board Statement

Not applicable.

Informed Consent Statement

Not applicable.

Data Availability Statement

The data presented in this study are available in article.

Conflicts of Interest

The authors declare no conflict of interest.

References

  1. Alberti, M.; Marzluff, J.M. Ecological resilience in urban ecosystems: Linking urban patterns to human and ecological functions. Urban Ecosyst. 2004, 7, 241–265. [Google Scholar] [CrossRef]
  2. Shi, Y.; Zhai, G.; Xu, L.; Zhou, S.; Lu, Y.; Liu, H.; Huang, W. Assessment methods of urban system resilience: From the perspective of complex adaptive system theory. Cities 2021, 112, 103141. [Google Scholar] [CrossRef]
  3. Wang, S.; Cui, Z.; Lin, J.; Xie, J.; Kun, S.U. The coupling relationship between urbanization and ecological resilience in the Pearl River Delta. J. Geogr. Sci. 2022, 32, 44–64. [Google Scholar] [CrossRef]
  4. Wang, T.; Zou, Z.; Zhou, G.; Zheng, J. A framework for measuring urban ecological resilience under high-quality development. J. Nat. Sci. Hunan Norm. Univ. 2022, 56, 33–40. [Google Scholar]
  5. McPhearson, T.; Andersson, E.; Elmqvist, T.; Frantzeskaki, N. Resilience of and through urban ecosystem services. Ecosyst. Serv. 2015, 12, 152–156. [Google Scholar] [CrossRef]
  6. Spaans, M.; Waterhout, B. Building up resilience in cities worldwide—Rotterdam as participant in the 100 Resilient Cities Programme. Cities 2017, 61, 109–116. [Google Scholar] [CrossRef]
  7. Hamel, P.; Hamann, M.; Kuiper, J.J.; Andersson, E.; Guerry, A.D. Blending Ecosystem Service and Resilience Perspectives in Planning of Natural Infrastructure: Lessons from the San Francisco Bay Area. Front. Environ. Sci. 2021, 9, 601136. [Google Scholar] [CrossRef]
  8. Garg, P.; Nagargoje, S.; Dey, S.; Nandish, S.K.; Jaiswal, A. Urban Vulnerability: A Review of the Methodologies Adopted Globally to Assess Vulnerability of Cities. In Proceedings of the International Conference on Construction Real Estate Infrastructure and Projects (CRIP) Management, Pune, India, 23–25 November 2018. [Google Scholar]
  9. Bai, L.; Xiu, C.; Feng, X.; Mei, D.; Wei, Y. A comprehensive assessment of urban resilience and its spatial differentiation in China. World Reg. Stud. 2019, 28, 77–87. [Google Scholar]
  10. Rafael, S.; Martins, H.; Sá, E.; Carvalho, D.; Borrego, C.; Lopes, M. Influence of urban resilience measures in the magnitude and behaviour of energy fluxes in the city of Porto (Portugal) under a climate change scenario. Sci. Total Environ. 2016, 566–567, 1500–1510. [Google Scholar] [CrossRef]
  11. Sahana, M.; Saini, M.; Areendran, G.; Imdad, K.; Sarma, K.; Sajjad, H. Assessing Wetland ecosystem health in Sundarban Biosphere Reserve using pressure-state-response model and geospatial techniques. Remote Sens. Appl. Soc. Environ. 2022, 26, 100754. [Google Scholar] [CrossRef]
  12. Hazbavi, Z.; Sadeghi, S.H.; Gholamalifard, M.; Davudirad, A.A. Watershed health assessment using the pressure-state-response (PSR) framework. Land Degrad. Dev. 2020, 31, 3–19. [Google Scholar] [CrossRef]
  13. Cheng, H.; Zhu, L.; Meng, J. Fuzzy evaluation of the ecological security of land resources in mainland China based on the Pressure-State-Response framework. Sci. Total Environ. 2022, 804, 150053. [Google Scholar] [CrossRef] [PubMed]
  14. Chen, D. Urban Resilience Assessment Based on Pressure-State-Response Model—A Case Study of HuangShi City. Master’s Thesis, Huazhong University of Science and Technology, Wuhan, China, 2019. [Google Scholar]
  15. Friend, A.M.; Rapport, D.J. Evolution of macro-information systems for sustainable development. Ecol. Econ. 1991, 3, 59–76. [Google Scholar] [CrossRef]
  16. Zhang, Q.; Yang, L.; Xu, S. The Relationships of Supporting Services and Regulating Services in National Forest City. Forests 2022, 13, 1368. [Google Scholar] [CrossRef]
  17. Liu, W.; Zhan, J.; Zhao, F.; Yan, H.; Zhang, F.; Wei, X. Impacts of urbanization-induced land-use changes on ecosystem services: A case study of the Pearl River Delta Metropolitan Region, China. Ecol. Indic. 2019, 98, 228–238. [Google Scholar] [CrossRef]
  18. Li, Z.T.; Yuan, M.J.; Hu, M.M.; Wang, Y.F.; Xia, B.C. Evaluation of ecological security and influencing factors analysis based on robustness analysis and the BP-DEMALTE model: A case study of the Pearl River Delta urban agglomeration. Ecol. Indic. 2019, 101, 595–602. [Google Scholar] [CrossRef]
  19. Sun, J.; Li, Y.P.; Gao, P.P.; Xia, B.C. A Mamdani fuzzy inference approach for assessing ecological security in the Pearl River Delta urban agglomeration, China. Ecol. Indic. 2018, 94, 386–396. [Google Scholar] [CrossRef]
  20. Xiu, C.L.; Wei, Y.; Wang, Q. Evaluation of urban resilience of Dalian city based on the perspective of “Size-Density-Morphology”. Acta Geogr. Sin. 2018, 73, 2315–2328. [Google Scholar]
  21. Fang, C.L.; Zhang, G.Y.; Xue, D.S. High-quality development of urban agglomerations in China and construction of science and technology collaborative innovation community. Acta Geogr. Sin. 2021, 76, 2898–2908. [Google Scholar]
  22. Cui, W.; Chen, J.; Xue, T.; Shen, H. The Economic Resilience Cycle Evolution and Spatial-Temporal Difference of Tourism Industry in Guangdong-Hong Kong-Macao Greater Bay Area from 2000 to 2019. Sustainability 2021, 13, 12092. [Google Scholar] [CrossRef]
  23. Chen, C.; Noble, I.; Hellmann, J.; Coffee, J.; Murillo, M.; Chawla, N. University of Notre Dame Global Adaptation Index Country Index Technical Report; University of Notre Dame: Notre Dame, IN, USA, 2015. [Google Scholar]
  24. Kouklis, G.R.; Yiannakou, A. The Contribution of Urban Morphology to the Formation of the Microclimate in Compact Urban Cores: A Study in the City Center of Thessaloniki. Urban Sci. 2021, 5, 37. [Google Scholar] [CrossRef]
  25. Guo, Z.P. Study on the Temporal and Spatial Features of Urban Resilience in Lanzhou. Master’s Thesis, Lanzhou University, Lanzhou, China, 2021. [Google Scholar]
  26. Zhao, X.Q. Analysis on the Spatio-Temporal Evolution and Influencing Factors of Urban Resilience Based on “Size-Density-Morphology”—A Case of Cheng Demian Development Zone. Master’s Thesis, Sichuan Normal University, Sichuan, China, 2020. [Google Scholar]
  27. Huang, G.; Li, D.; Zhu, X.; Zhu, J. Influencing factors and their influencing mechanisms on urban resilience in China. Sustain. Cities Soc. 2021, 74, 103210. [Google Scholar] [CrossRef]
  28. Zafar, M.W.; Zaidi, S.; Khan, N.R.; Mirza, F.M.; Ou, F.H.; Kirmani, S. The impact of natural resources, human capital, and foreign direct investment on the ecological footprint: The case of the United States. Resour. Policy 2019, 63, 101428. [Google Scholar] [CrossRef]
  29. Chen, L.D.; Fu, B.J.; Zhao, W.W. Source-sink landscape theory and its ecological significance. Acta Ecol. Sin. 2006, 26, 1444–1449. [Google Scholar] [CrossRef]
  30. Wan, W.; Han, Y.; Wu, H.; Liu, F.; Liu, Z. Application of the source–sink landscape method in the evaluation of agricultural non-point source pollution: First estimation of an orchard-dominated area in China. Agric. Water Manag. 2021, 252, 106910. [Google Scholar] [CrossRef]
  31. Wackernagel, M.; Rees, W. Our Ecological Footprint: Reducing Human Impact on the Earth; New Society Publishers: Gabriola Island, BC, Canada, 1997; Volume 19, pp. 185–189. [Google Scholar]
  32. Liu, M.C. Temporal Dynamics and Spatial Patterns of China’s Ecological Footprints; Chemical Industry Press Co., Ltd.: Beijing, China, 2014; pp. 006–012. [Google Scholar]
  33. Special Report on the Per Capita Consumption of Main Food in Guangdong Households (Edition 2019). Available online: https://www.docin.com/p-2379423978.html (accessed on 14 May 2023).
  34. Guangdong Statistical Yearbook. 2021. Available online: http://stats.gd.gov.cn/gdtjnj/content/post_3557537.html (accessed on 14 May 2023).
  35. Monfreda, C.; Wackernagel, M.; Deumling, D. Establishing national natural capital accounts based on detailed Ecological Footprint and biological capacity assessments. Land Use Policy 2004, 21, 231–246. [Google Scholar] [CrossRef]
  36. Gao, T.Y. Temporal and Spatial Changes of Land Natural Capital in Xianyang City Based on Improved Three-Dimensional Ecological Footprint Model. Master’s Thesis, Chang’an University, Xi’an, China, 2019. [Google Scholar]
  37. Wang, H.; Li, Y.; Liu, Y.; Qing, F.; Fang, D. Study on the Influencing factors of urban economic resilience in post epidemic Era—A case study of Kunming City. J. Urban Manag. 2021, 10, 255–264. [Google Scholar] [CrossRef]
  38. Xuguang, S.; Gang, P.; Yunyun, M.; Nan, Z. Testing the applicability of Wagner’s Law in China based on reconstruction of government expenditure indicators. China Financ. Econ. Rev. 2015, 4, 87–100. [Google Scholar]
  39. Mukhtarov, S.; Mammadov, I.; Humbatova, S. The Relationship Between Government Expenditures on Education and Economic Growth: The Case of Azerbaijan. Res. World Econ. 2020, 11, 195–201. [Google Scholar] [CrossRef]
  40. Xu, Y.; Duan, J.; Xu, X.R. Comprehensive measure methods of regional multi-dimensional development and their applications. Acta Geogr. Sin. 2016, 71, 2129–2140. [Google Scholar]
  41. WWF; OPF; Institute of Geographical Sciences and Natural Resources Research, Chinese Academy of Sciences. Guangdong-Hong Kong-Macao Greater Bay Area Ecological Footprint Report 2019; Guangdong People’s Press: Guangzhou, China, 2020. [Google Scholar]
  42. Xue, Q.; Song, W.; Zhang, Y.; Mou, F. Research Progress in Ecological Carrying Capacity Implications, Assessment Methods and Current Focus. J. Resour. Ecol. 2017, 8, 514–525. [Google Scholar]
  43. Chen, L.; Tian, H.; Fu, B.; Zhao, X. Development of a new index for integrating landscape patterns with ecological processes at watershed scale. Chin. Geogr. Sci. 2009, 19, 37–45. [Google Scholar] [CrossRef]
  44. Melo, P.C.; Graham, D.J.; Noland, R.B. A meta-analysis of estimates of urban agglomeration economies. Reg. Sci. Urban Econ. 2009, 39, 332–342. [Google Scholar] [CrossRef]
  45. Wang, K.L.; He, S.; Zhang, F.Q. Relationship between FDI, fiscal expenditure and green total-factor productivity in China: From the perspective of spatial spillover. PLoS ONE 2021, 16, e0250798. [Google Scholar] [CrossRef] [PubMed]
  46. Chen, M.L. Spatial Optimization Path of Urban Agglomerations from an Ecosystem-Like Perspective: A Case Study of the Pearl River Delta Urban Agglomeration. Ph.D. Thesis, Chinese Academy of Social Sciences, Beijing, China, 2015. [Google Scholar]
  47. Filho, W.L.; Barbir, J.; Sima, M.; Kalbus, A.; Nagy, G.J.; Paletta, A.; Villamizar, A.; Martinez, R.; Azeiteiro, U.M.; Pereira, M.J.; et al. Reviewing the role of ecosystems services in the sustainability of the urban environment: A multi-country analysis. J. Clean. Prod. 2020, 262, 121338. [Google Scholar] [CrossRef]
Figure 1. Location of the study area and land use types.
Land 12 01089 g001
Figure 2. Urban ecological resilience assessment framework.
Land 12 01089 g002
Figure 3. Spatial layout of morphological, density, and economic resilience.
Land 12 01089 g003
Figure 4. Ecological resilience of counties (based on prefecture-level cities). MR, DR, and ER: morphological, density, and economic resilience, respectively; CER, comprehensive urban ecological resilience; * indicates outlier.
Land 12 01089 g004
Figure 5. Layout of UER in the PRD.
Land 12 01089 g005
Figure 6. Bboxplots of resilience prefecture-level cities. (mmMR, mmDR, and mmER: standardized morphological, density, and economic resilience, respectively.); * indicates outlier.
Land 12 01089 g006
Table 1. Data preparation and processing.
IndicatorDataData Source
MRLand use dataGeographic Data Sharing Infrastructure, Resource and Environment Science and Data Center (http://www.resdc.cn) (accessed on date 14 May 2023)
Guangdong Statistical Yearbook 2021 (http://stats.gd.gov.cn/) (accessed on date 14 May 2023)
DRAverage food consumption; fossil energy consumption; number of permanent residents; various types of land use.
ERProportion of GDP of tertiary industry (30%); per capita GDP (30%); total retail sales of social consumer goods (15%); education investment (10%); science and technology investment (15%).Guangdong Statistical Yearbook 2021 (http://stats.gd.gov.cn/) (accessed on date 14 May 2023)
Table 2. Mean and standard deviation of resilience indicators.
MRDRERCER
MeanStdMeanStdMeanStdMeanStd
PRD1.4430.7160.4070.5420.3180.1510.6170.249
Guangzhou1.0350.3850.0900.1100.4280.1150.5910.153
Shenzhen0.8740.4140.0170.0140.4180.2020.5560.302
Foshan1.1770.6900.3280.3070.2780.0840.4700.155
Dongguan0.884/0.041/0.260/0.317/
Huizhou1.6420.4910.4080.2890.2640.1110.5380.172
Zhongshan1.131/0.063/0.290/0.392/
Zhuhai1.7120.1610.1130.1090.2930.1700.5370.168
Jiangmen1.8140.2610.7560.5380.2440.0520.6530.188
Zhaoqing2.3690.8611.2270.6050.1980.1150.9270.256
Disclaimer/Publisher’s Note: The statements, opinions and data contained in all publications are solely those of the individual author(s) and contributor(s) and not of MDPI and/or the editor(s). MDPI and/or the editor(s) disclaim responsibility for any injury to people or property resulting from any ideas, methods, instructions or products referred to in the content.

