Article

Sustainable Development of Farmers in Minority Areas after Poverty Alleviation Relocation: Based on an Improved Sustainable Livelihood Analysis Framework

1
Faculty of Management and Economics, Kunming University of Science and Technology, Kunming 650093, China
2
City College, Kunming University of Science and Technology, Kunming 650093, China
*
Author to whom correspondence should be addressed.
Land 2023, 12(5), 1045; https://doi.org/10.3390/land12051045
Submission received: 19 April 2023 / Revised: 7 May 2023 / Accepted: 9 May 2023 / Published: 11 May 2023

Abstract

:
As an essential regional planning policy, poverty alleviation relocation has a significant impact on the regional economy, environment, and social well-being and is critical for sustainable development. Based on the development of minority areas in Yunnan, this study improves the traditional sustainable livelihood analysis framework and constructed a livelihood capital evaluation system including natural, physical, financial, social, human, and cultural capital. Furthermore, the measurement standard of sustainable livelihoods is proposed, which requires not only the enhancement of livelihood capital but also the coupling and coordinated development of all capital components. Based on the data of Menglai township from 2015 to 2021, this study estimates that farmers’ livelihood capital has increased after relocation, and the level of coupling and coordination has improved. Still, it has yet to reach extreme coordination. Hereafter, the theoretical framework of internal and external factors affecting livelihood capital is constructed, and the influencing factors of livelihood capital are obtained through regression analysis. This study provides a new tool for evaluating livelihood capital in minority areas, obtains new findings on the sustainable development of farmers’ livelihood capital after poverty alleviation relocation, and expands a new perspective for studying the influencing factors of livelihood capital.

1. Introduction

Relocation means that farmers leave their original land, which is an effective means to reduce poverty, solve vulnerability, and promote regional development. It profoundly impacts the natural, physical, financial, social, human, and cultural fields, and is a necessary way to achieve sustainable development [1]. The Sustainable Development Goals (SDGs) propose balancing the sustainability of the economy, environment, and society and pursue sustainable development [2]. Poverty eradication is considered the primary goal of sustainable development. As a global problem, although poverty can be measured by income, expenditure, and other dimensions, from the perspective of sustainable development, sustainable livelihood is considered to be the most effective and reasonable way to measure poverty because it can track poverty in multiple dimensions [3]. A sustainable livelihood is the ultimate goal of poverty reduction, which can provide people with comprehensive development programs based on different backgrounds and economic and political conditions [4]. When people face external pressures and shocks, if they can recover, maintain, or even increase their livelihood capital, their livelihood will be sustainable [5,6]. To study livelihood issues, the United Kingdom Department for International Development (DFID) has formulated a sustainable livelihood analysis framework, which is the most widely used and accepted tool for analyzing sustainable livelihood [7,8]. Livelihood capital is the core and foundation of this framework, including natural, physical, financial, social, and human capital [9]. Promoting livelihood capital will help low-income families escape from poverty, while people with short livelihood capital struggle to get out of the poverty trap. Therefore, improving livelihood capital is vital for all countries, especially developing countries, to eliminate poverty and achieve sustainable development [10]. For farmers, realizing the sustainable development of livelihood capital is the fundamental purpose and significance of the SDGs. On the one hand, the more livelihood capital farmers have, the more able they are to resist risks and the more choices they have. On the other hand, the reasonable structure and allocation of livelihood capital can broaden farmers’ livelihood channels and enable farmers to switch different livelihood strategies [11]. Thus, farmers’ sustainable livelihood is not only reflected in the increase in the absolute value of livelihood capital but also requires the coupling and coordinated development of various capitals.
Governments worldwide have made several plans to improve the sustainability of people’s livelihoods. For developing countries, relocation is considered the most effective way. China has implemented five significant projects of a precision poverty alleviation strategy and ensured the elimination of absolute poverty through five measures: supporting production and employment, poverty alleviation relocation, ecological protection, developing education, and providing minimum living security [12]. Poverty alleviation relocation, as the “first project” of accurate poverty alleviation, aims to realize the sustainable development of relocated farmers, helping farmers move out of areas with a harsh environment and attain lasting development. Since poverty alleviation relocation began, about 35,000 resettlement communities have been built nationwide, and more than 9.6 million poor people have been resettled. The relocated farmers can eliminate the poverty trap by improving infrastructure construction, developing industries, and strengthening education and social security in the resettlement area [13,14]. As the most prominent poverty reduction target country, China has contributed more than 70% of the global poverty reduction population and made remarkable achievements [12,15]. However, the factors that restrict people’s development still exist, the risk of returning to poverty has not been eliminated, and poverty governance still has a long way to go [16,17]. In particular, the COVID-19 epidemic has negatively impacted the economy, reduced people’s livelihood capital, and hindered the realization of the SDGs [18,19]. In addition, poverty alleviation relocation is not only the migration of the population but also the complicated process of significant changes in the social system, economy, and politics, and the disintegration–reconstruction of farmers’ livelihood capital [20,21]. Suppose the relevant departments fail to effectively implement the follow-up integration and assistance work for the relocated farmers. In that case, they will be marginalized, and poverty and inequality will be aggravated, making it challenging to achieve sustainable development, which runs counter to the original intention of the policy [22,23]. In particular, farmers in minority areas have formed unique religious beliefs, living customs, and cultural forms after long-term development. After relocation, they need to adapt to the rapidly changing external environment passively. The original social relations and economic models disintegrate, so it is difficult to reconstruct their national culture and social relations and adapt to the new livelihood model. Thus, the poverty alleviation and sustainable development of farmers in minority areas are even more arduous [3].
This study improved the traditional analysis framework of sustainable livelihoods, combined with the characteristics of minority areas, and added cultural capital to the evaluation system of livelihood capital. Based on the data of Menglai Township in Yunnan Province from 2015 to 2021, it was concluded that the livelihood capital and its coupling and coordination level of farmers have improved after relocation, which meets the requirements of sustainable livelihood development. Finally, the theoretical framework of internal and external factors affecting farmers’ livelihood capital was constructed, and the influencing factors of livelihood capital were obtained through empirical analysis. This study can effectively break the development dilemma of livelihood capital after the relocation of farmers in minority areas and help the relocated farmers achieve the goal of sustainable development.
This study has made outstanding contributions to both the theoretical framework and policy practice. First, it provides a new tool for evaluating livelihood capital in minority areas. It improves the DFID’s sustainable livelihood analysis framework, constructs the evaluation system of farmers’ livelihood capital in minority areas, and further emphasizes the importance of national culture, which provides ideas for future research on livelihood capital according to regional characteristics. Second, it obtains new findings on the sustainable development of farmers’ livelihood capital after relocation. Poverty alleviation relocation is a remarkable feat in the history of human migration and poverty reduction worldwide. Evaluating the livelihood capital and its coupling and coordination level of relocated farmers provides a basis for policy implementation and promotes the realization of sustainable development goals. Third, the study expands a new perspective for studying influencing factors of livelihood capital. It constructs the theoretical framework of internal and external factors that affect relocated farmers’ livelihood capital, breaks the limitation that the existing research mainly relies on external forces to improve livelihood capital, and realizes the complementarity of endogenous motivation and external assistance.
The remainder of this study is organized as follows. Section 2 introduces the materials and methods. Section 3 lists the measurement results of livelihood capital and its coupling and coordination level, and verifies the internal and external factors affecting livelihood capital through regression analysis. Section 4 presents discussions of this study. The final section summarizes the study.

2. Materials and Methods

Based on the SDGs and sustainable livelihood analysis framework, this study analyzes the livelihood issues of relocated farmers in Menglai Township, Yunnan minority areas, to realize the sustainable development of farmers’ livelihood capital. To carry out the research effectively, it is necessary to construct an evaluation system of farmers’ livelihood capital in minority areas, which is the basis of any quantitative analysis on livelihood capital, and further measure and compare the stock of livelihood capital and the coupling and coordination level between livelihood capitals before and after relocation. Hereafter, based on theoretical analysis, this study constructs a theoretical framework of internal and external factors affecting the livelihood capital of relocated farmers in Yunnan minority areas and explores the influencing factors of livelihood capital to realize accurate policies and the sustainable development of livelihood capital. The framework and design of the study are shown in Figure 1.

2.1. Livelihood Capital Evaluation

2.1.1. Construction of Livelihood Capital Evaluation System

Farmers’ livelihood capital includes natural, physical, financial, social, human, and cultural capital. Natural capital is the natural resources, environmental services, and biodiversity that people enjoy, including all kinds of land, forests, wildlife, and water resources [4]. For poor farmers, natural capital is the basis of their productive activities and is most closely associated with livelihood vulnerability [24], in which land is the most significant capital [11,25]. The primary function of physical capital is to meet the basic needs of farmers and improve their productivity, including safe housing, vehicles, roads, transportation, and production equipment and tools. Financial capital usually refers to the funds raised or controlled by people to achieve their livelihood goals, including relief, lending, savings, and income. For farmers, the most crucial financial capital is their income. The richer the sources of income, the more they can accumulate financial capital. Social capital is embodied in the participation of social groups, social contact, social trust, and public health support [26,27]. The level of farmers’ social capital is greatly influenced by the quality and scale of the social network, and it will also affect the realization of the functions of the rest of the livelihood capital. Through people’s interaction, social capital can bring farmers more resources and social support [28]. Human capital usually exists in the form of skills, health, and education [29]. On the one hand, the external manifestation of poverty can be reflected in the lack of human capital; on the other hand, the lack of human capital will further lead to poverty. Cultural capital is the element that best reflects regional characteristics, including norms, values, rules, indigenous customs, traditional knowledge, and activities [30]. Cultural factors often impact farmers’ agricultural practices, production and consumption patterns, family decisions, and attitudes toward new agricultural technologies [31,32,33]. Thus, for farmers in minority areas, cultural capital, like the other five capitals, greatly influences farmers’ livelihood strategies and results. As shown in Figure 2, this study comprehensively summarizes the relevant literature and combines the characteristics of minority areas to build an evaluation system of farmers’ livelihood capital in Yunnan minority areas based on the principles of scientificity and objectivity, comprehensiveness and representativeness, comparability and operability.

2.1.2. Measurement of Livelihood Capital

Based on the evaluation system of livelihood capital constructed above, the weight of each index was obtained by using the global entropy method, and the comprehensive evaluation value of livelihood capital was calculated, which avoids the interference of people’s subjective factors and fully considers the characteristics of three-dimensional spatio-temporal data composed of farmers, indicators and time [34,35]. The specific steps are as follows:
First, a global evaluation matrix is constructed to evaluate m farmers’ livelihood capital in t years with n indicators.
X = X 11 1 X 1 n 1 X m 1 t X m n t
Second, the range method standardizes the data to eliminate differences [36].
If the indicator is positive,
X i j = ( X i j min X i j ) ( max X i j min X i j ) × 0.9 + 0.1 , ( 1 i m t ,   j = 1,2 , 3 17 )
If the indicator is negative,
X i j = ( max X i j X i j ) ( max X i j min X i j ) × 0.9 + 0.1 , ( 1 i m t ,   j = 1,2 , 3 17 )
Third, the weight of each index is calculated.
w j = 1 ( k i = 1 m t X i j i = 1 m t X i j ln X i j i = 1 m t X i j ) j = 1 17 1 ( k i = 1 m t X i j i = 1 m t X i j ln X i j i = 1 m t X i j ) , ( k = 1 ln m t )
Fourth, the comprehensive evaluation value of livelihood capital is calculated.
L C = j = 1 n W j X i j

2.1.3. Measurement of Coupling Coordination Level

More importantly, the sustainable development of livelihood capital is not only manifested in the increase in its absolute value but also in the improvement in the level of coupling and coordination among various capitals.
(1) Coupling degree model
“Coupling” refers to the interaction and influence between several systems. The coupling degree describes the degree of interaction, and the benign coupling is measured by the coordination degree. The higher the level of coupling and coordination, the more harmonious and orderly the development of each subsystem [37].
The calculation formula of the coupling degree of multiple systems is as follows:
C n = μ 1 × μ 2 × × μ n μ 1 + μ 2 + + μ n n 1 n
where μ i i = 1,2 , , n is the comprehensive evaluation function of each subsystem, and the number of subsystems in this study is n = 6, so the coupling level of six kinds of livelihood capital is:
C = N C × P C × F C × S C × H C × C C N C + P C + F C + S C + H C + C C / 6 6 1 6
where C is the coupling degree of six capitals; NC, PC, FC, SC, HC, and CC represent the evaluation of six subsystems, that is, natural, physical, financial, social, human, and cultural capital values, respectively.
(2) Coupling and coordination model
The coupling degree can only reflect the level of interaction between subsystems and cannot obtain their coordination degree. The coupling coordination degree can comprehensively consider the two dimensions of “development” and “coordination” between systems, and the formula is as follows:
D = C × T
where C is the coupling degree between capitals, T is the total amount of livelihood capital, D is the degree of coupling and coordination among the six capitals, and its level and classification are shown in Table 1 [38].

2.2. Influencing Factors of Livelihood Capital

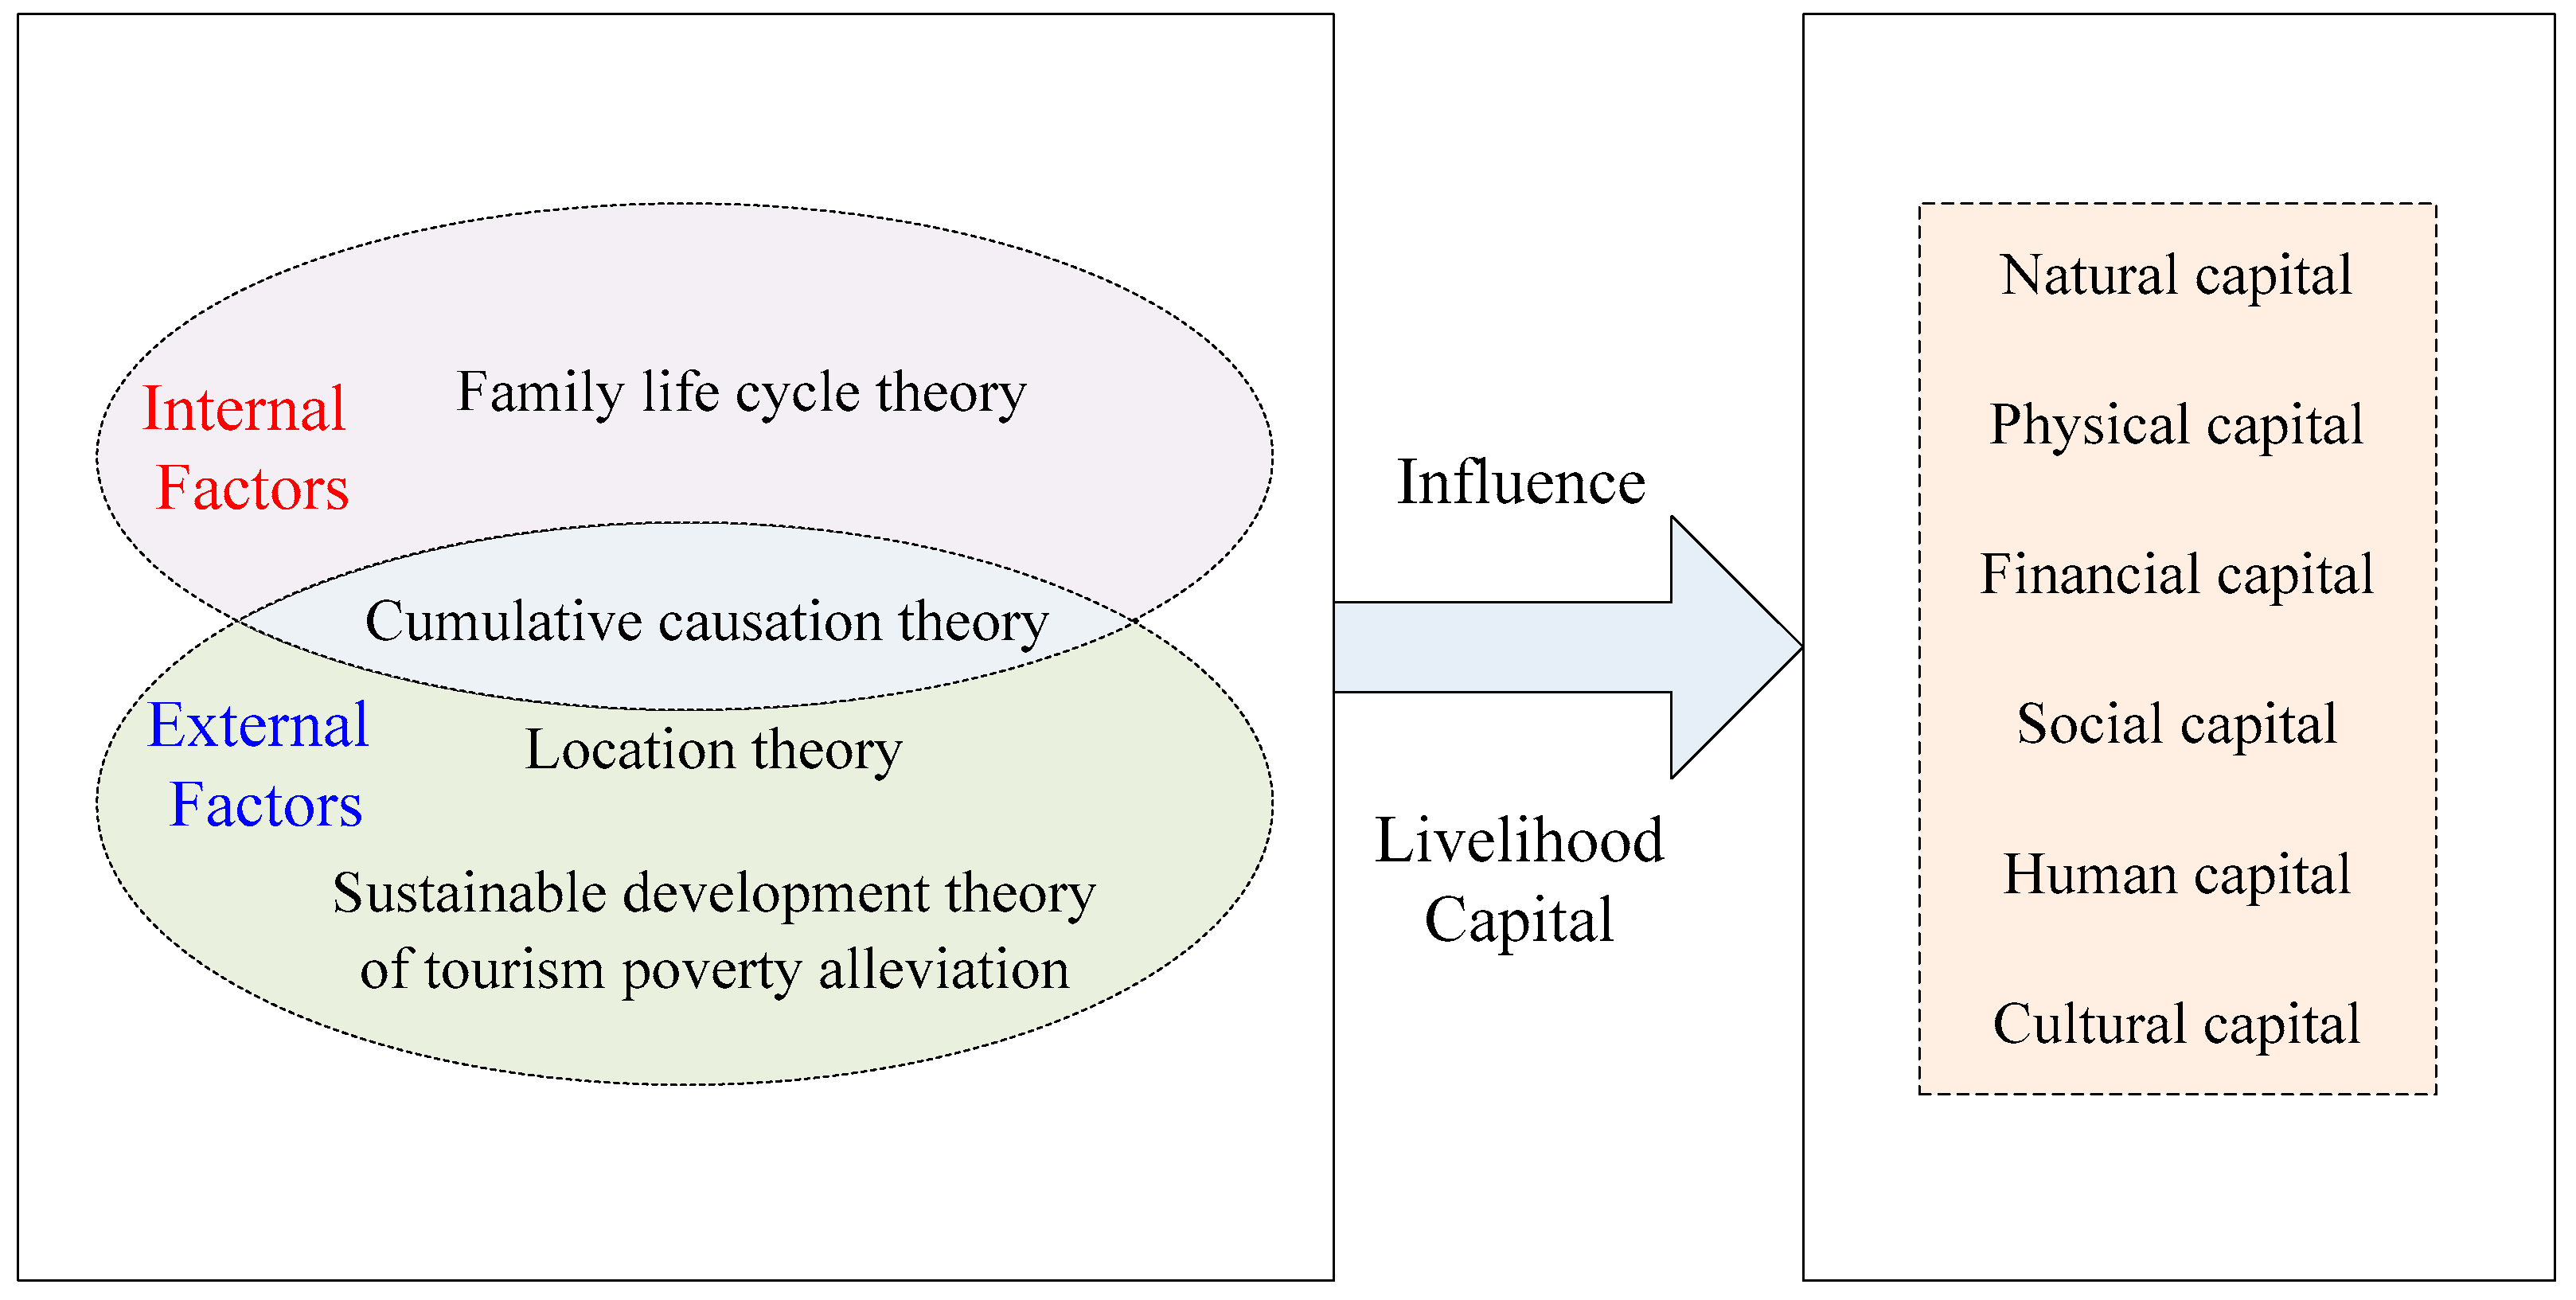
2.2.1. Theoretical Framework

The theory of internal and external factors suggests that, in the process of the development and change of a subject, external and internal factors complement each other and are indispensable, which jointly affect the evolution and development of the subject. A comprehensive consideration of the internal and external factors that affect the subject is conducive to determining their respective correlations, interactions, and possible complementary or substitutive relationships to realize an in-depth analysis of the subject [39].
Thus, the characteristics of farmers are the essential factors that affect their livelihood capital after poverty alleviation relocation, which determines the primary trend and subjective initiative of livelihood capital development. Moreover, the change in environment, as an external factor that affects livelihood capital, is an indispensable condition to realize an improvement in livelihood capital. If farmers only rely on external forces and ignore the critical role of internal factors, they will strengthen their dependence and reduce their initiative. On the contrary, improving their livelihood capital will be challenging if they only focus on internal factors and lack external help. Therefore, farmers can form a complementary mechanism of internal self-development and practical external assistance by fully considering the internal and external factors affecting livelihood capital.
In terms of internal factors affecting farmers’ livelihood capital. The family life cycle theory describes the process of a family from emergence, development, and maturity to extinction [40]. The characteristics of the farmers’ family population will change with the different family life cycles, affecting the family’s livelihood strategy and livelihood capital [41,42].
In terms of external factors affecting farmers’ livelihood capital, location theory integrates human activities and space and puts forward those areas with abundant cultivated land resources, low transportation costs, and convenient transportation, which are more conducive to the development of farmers, providing a scientific basis for poverty alleviation relocation [43]. Therefore, geographical location is the most basic external feature of farmers, and the advantages and disadvantages of location conditions determine the development foundation and conditions of farmers, which play a decisive role in the sustainable development of farmers. At the same time, with the gradual improvement in the theory of sustainable development and the increasing demand for tourism, the sustainable development theory of tourism poverty alleviation has risen rapidly. The theory puts forward that by developing tourism, the natural, economic, social, and cultural fields will be fully developed, thus reducing or eliminating the poverty of local farmers. In addition, relocation can promote farmers to achieve sustainable livelihood by creating employment opportunities and increasing income [44,45]. This theory provides an action guide for the sustainable development of the livelihood capital of relocated farmers.
The cumulative causation theory believes that in a developing society, the change in one factor will make other factors change accordingly, further strengthening this factor and eventually forming a circular development model of self-strengthening and accumulation [46]. The causes of poverty often play a leading role in the sustainable livelihood of farmers. With the development of the economy and society, farmers will further aggravate this poverty phenomenon because of their poverty-causing factors. On the contrary, if farmers have some development advantages from the beginning, they will realize sustainable development based on their existing advantages. The causes of poverty include not only external factors such as water shortage, land shortage, and backward traffic conditions, but also internal factors such as lack of self-development motivation, disability, and illness, which are the primary concerns of sustainable livelihood.
Based on the above analysis, the theoretical framework of internal and external factors affecting the livelihood capital of relocated farmers in Yunnan minority areas was constructed, as shown in Figure 3.

2.2.2. Variables and Data

The study area is Menglai Township, Cangyuan Wa Autonomous County, Yunnan Province. The township is dominated by Wa nationality, and its ethnic structure is complex and diverse. It is a typical representative of minority areas because of its relatively high altitude difference and harsh natural environment. Since the “Thirteenth Five-Year Plan”, Menglai Township has implemented the poverty alleviation relocation project, and the relocated farmers have eliminated poverty. There are seven resettlement sites in Menglai Township, namely: Haibie resettlement site in Manlai Village, Mangmajie resettlement site in Menglai Village, Gonggaji resettlement site in Yong’an Village, Yonggongchadi resettlement site in Gongnong Village, Gongbobo resettlement site in Dinglai Village, Gongyalong resettlement site in Banlie Village, and Gongwang resettlement site in Banlie Village, involving 324 households with 1265 people. The data in this study were obtained from the continuous and in-depth field investigation in Menglai Township, Cangyuan County, from 2015 to 2021. Moreover, we referred to the Statistical Bulletin of National Economic and Social Development, the Yearbook of Lincang, the Yearbook of Cangyuan Wa Autonomous County, and related government documents in Cangyuan County from 2015 to 2021 to provide a good database for this study.
Taking the calculated livelihood capital value as the explained variable, based on theoretical analysis, the number of domestic and foreign tourists, family population, administrative villages (the administrative village was assigned to the farmers in Menglai Village as 1, Yongan Village as 2, Yingge Village as 3, Minliang Village as 4, Manlai Village as 5, Gongnong Village as 6, Gongsa Village as 7, Dinglai Village as 8, and Banlie Village as 9), and causes of poverty (the causes of poverty were divided into capacity loss, increased burden, factor shortage, accidental impact, and lack of self-development motivation, and they are assigned 1 to 5, respectively) were selected as the explanatory variables to explore their influence on the livelihood capital of relocated farmers. Based on the data on livelihood capital and its influencing factors of 144 relocated farmers in Menglai Township from 2015 to 2021, the descriptive statistics of each variable are listed in Table 2.
Before empirical analysis, the multicollinearity needs to be tested first. If the explanatory variables have multiple collinearities, it will lead to pseudo-regression and estimation bias. Thus, the variance inflation factor (VIF) is used to test the multicollinearity problem to improve the accuracy of regression results. The greater the VIF, the more serious the collinearity problem is. The results of the multicollinearity test are shown in Table 3. It can be seen that the maximum VIF is 1.03, the VIF value of each variable is far less than 10, and the average value of VIF is far less than 5; that is, there is no multicollinearity among the influencing factors selected in the study, which meets the requirements of data analysis [47].

2.2.3. Model Construction and Regression Method

To explore the influence of the number of domestic and foreign tourists, family population, administrative villages, and causes of poverty on various capitals and livelihood capital, a regression model is constructed as follows:
c a p i t a l i t = α 0 + α 1 t o u r i s t i t + α 2 p o p u l a t i o n i t + α 3 v i l l a g e i t + α 4 c a u s e i t + ε i t
where i is the farmer, t is the year, c a p i t a l i t represents the farmer’s natural, physical, financial, social, human, cultural, and livelihood capital values, t o u r i s t i t represents the number of domestic and foreign tourists, p o p u l a t i o n i t represents the family population, v i l l a g e i t represents the administrative village to which the farmers belong, and c a u s e i t reflects the causes of poverty of the farmers. α 0 is a constant term, and ε i , t is a random error term.
An F-test, LM-test, and Hausman test were used to determine the regression method of the model, and the statistical test results are shown in Table 4. First, the p value of the F-test is 0.0000, which is significantly less than 0.05, rejecting the original assumption that the mixed regression model is better than the fixed effect model; that is, it is necessary to choose the fixed effect regression model. Second, the p value of LM-test is less than 0.05, which rejects the original hypothesis that the mixed regression model is better than the random effect model, indicating that the random effect model is better. Finally, the original hypothesis of the Hausman test is that the random effect model is superior to the fixed effect model, and the p value of the Hausman test is 0.9968, which is significantly greater than 0.05, indicating that the original hypothesis is accepted; that is, the random effect model is superior to the fixed effect model. Therefore, to make the analysis results more realistic and reasonable, it is necessary to use a random effect model for regression.

3. Results

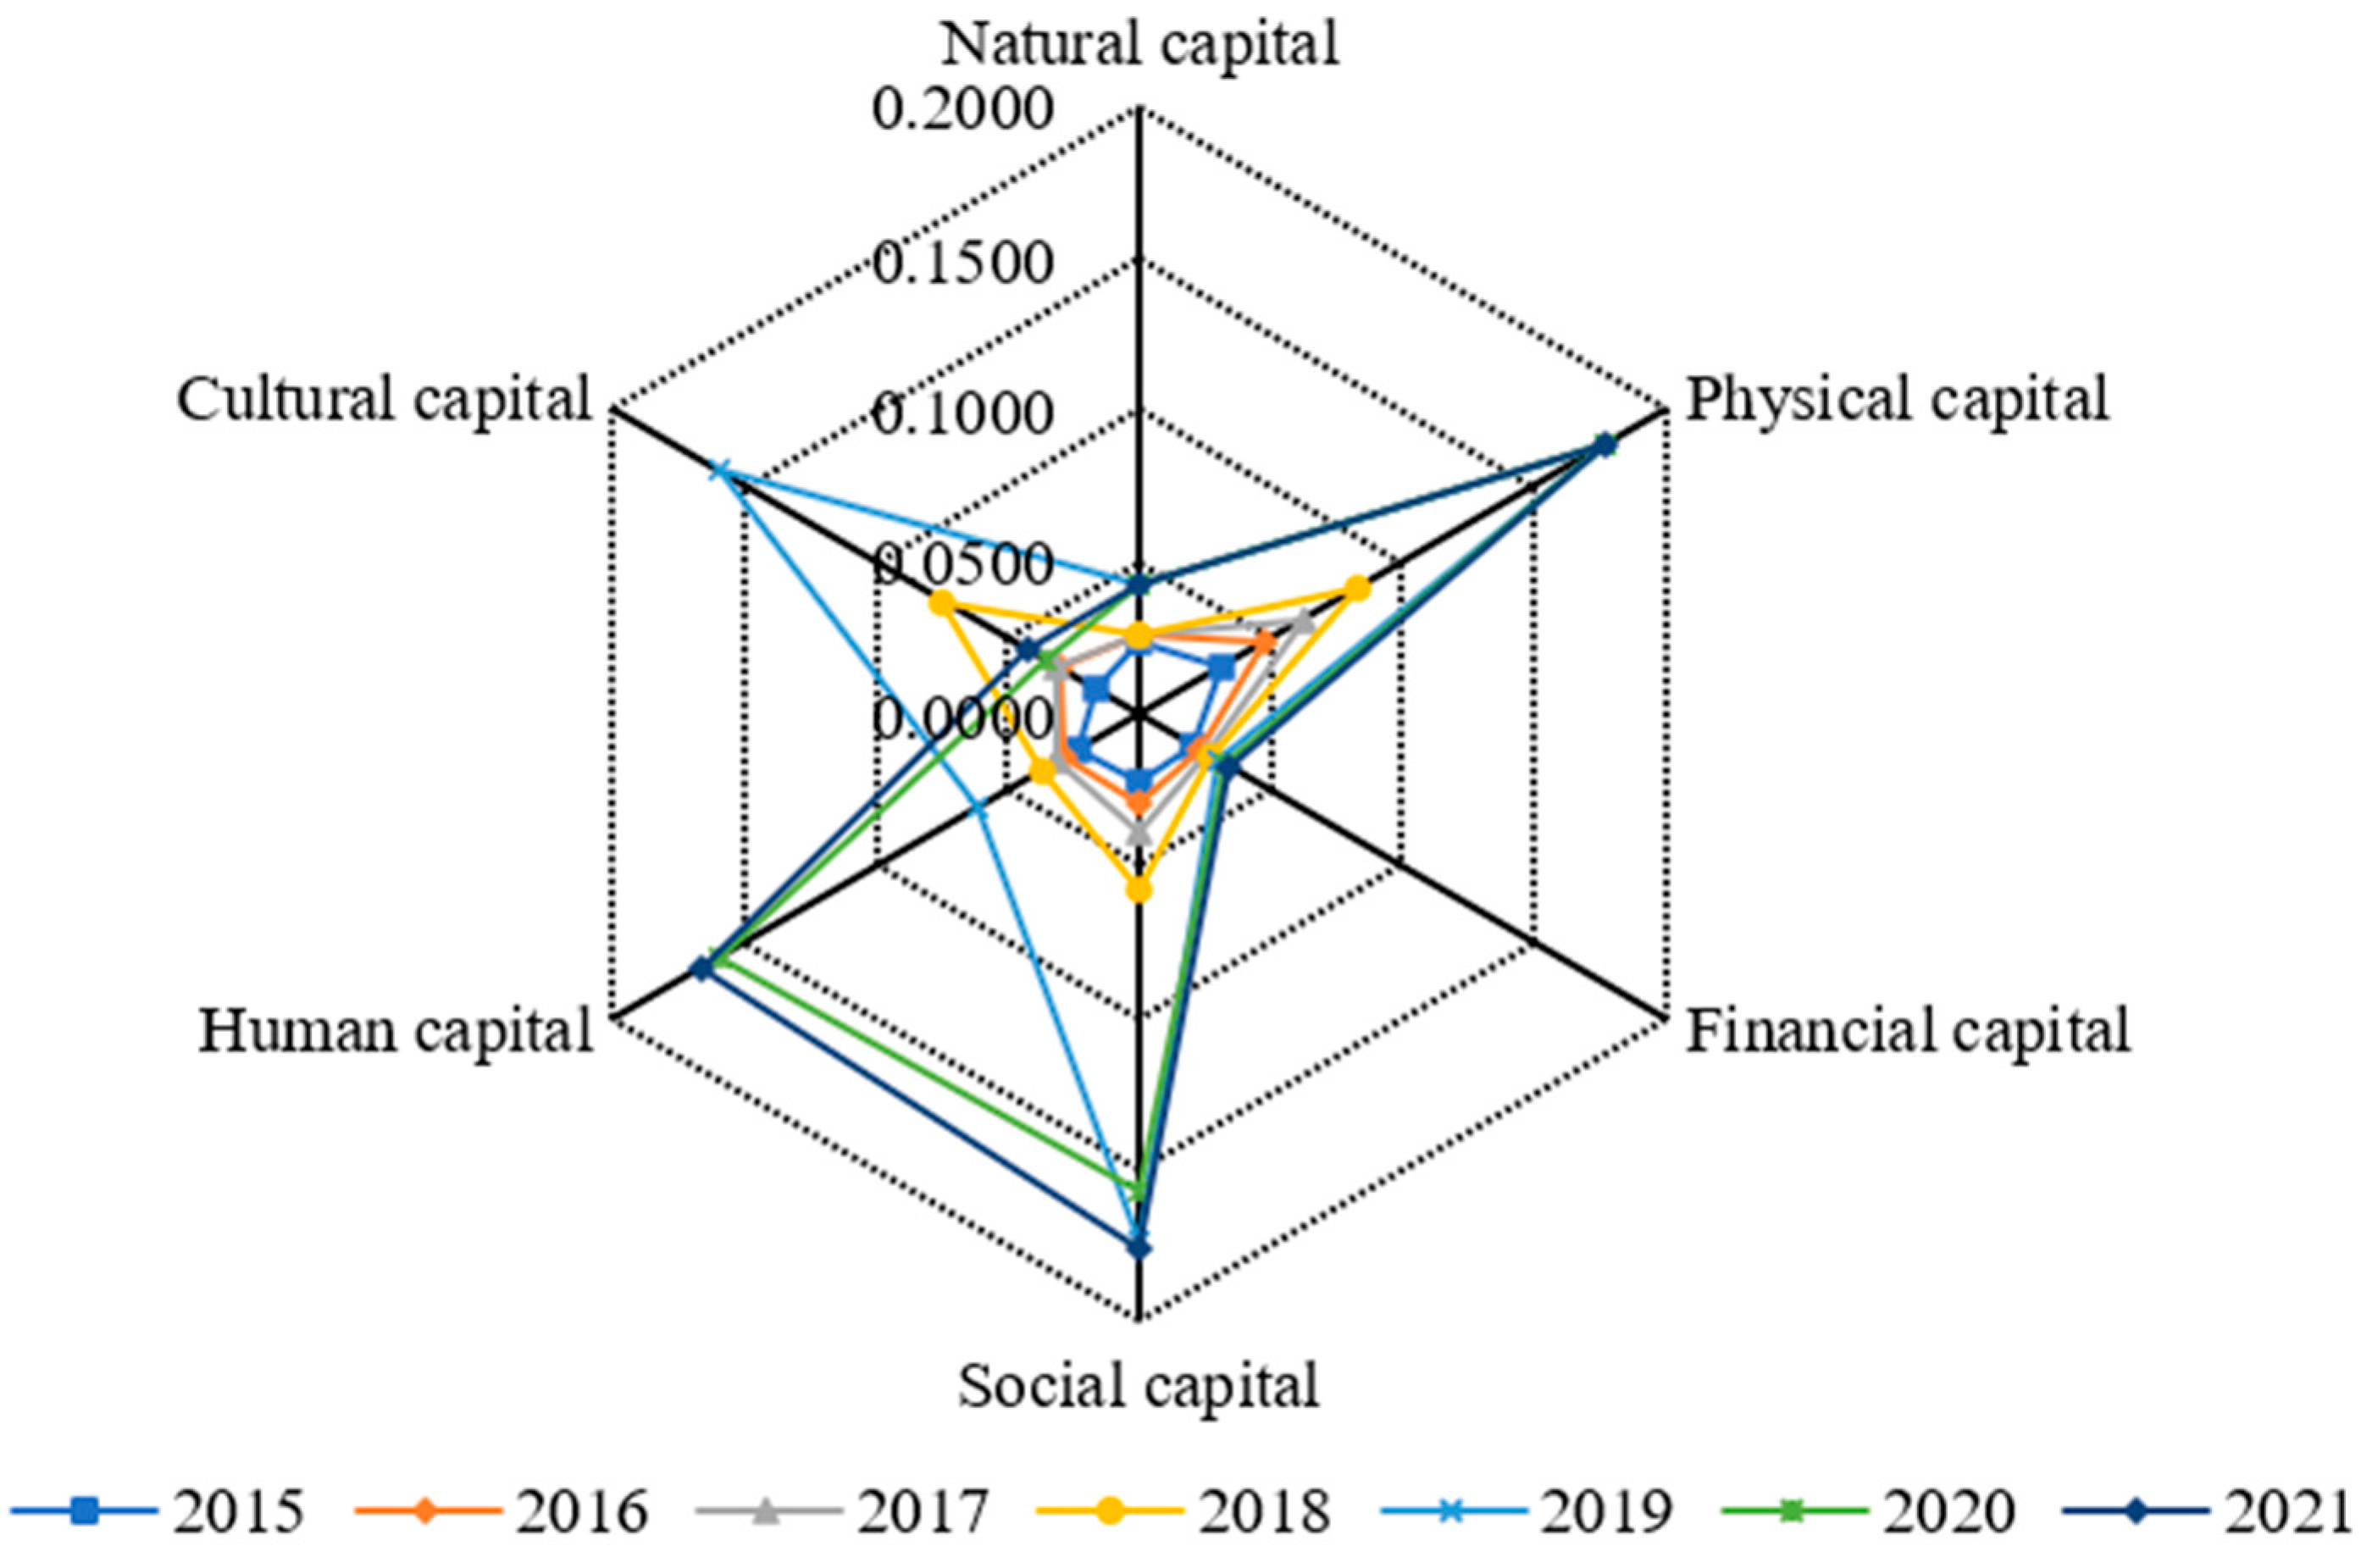
3.1. Measurement of Livelihood Capital

The livelihood capital of relocated farmers from 2015 to 2021 is shown in Figure 4. Before the relocation, farmers’ livelihood capital increased slightly in 2015–2016, and the change was not noticeable. In 2017–2018, with the acceleration of poverty alleviation relocation and the improvement in various support policies, the livelihood capital of farmers increased significantly, reaching a maximum of 0.6451 in 2019 after relocation. Meanwhile, after the relocation was fully completed, various subsidy policies were weakened. Moreover, affected by the COVID-19, farmers’ livelihood capital declined slightly in 2020–2021, but it was still greatly improved compared with the livelihood capital before the relocation.
Specifically, the distribution of farmers’ livelihood capital from 2015 to 2021 is shown in Figure 5. It can be found that all kinds of livelihood capital improved and developed steadily. In terms of natural capital, farmers’ natural capital was 0.0232 and 0.0257 in 2015 and 2016, respectively. After the relocation, the natural capital increased and the average value was 0.0422. In terms of physical capital, farmers’ physical capital before the relocation was 0.0313 and 0.0477, respectively, and the average value of physical capital after relocation was 0.1775, which improved the safety and convenience of farmers’ production and life. In terms of financial capital, farmers’ financial capital in 2015 and 2016 was 0.0205 and 0.0227, respectively. After the relocation, the average financial capital was 0.0322, farmers had more opportunities to increase their income and obtain employment, and their income sources were more stable and diversified. In terms of social capital, farmers’ social capital in 2015 and 2016 was 0.0225 and 0.0295, respectively. After the relocation, the average social capital was 0.1688, which became the capital with the most significant increase. In terms of human capital, farmers’ human capital before the relocation was 0.0237 and 0.0284, respectively. After relocation, the average human capital was 0.1292, and farmers’ knowledge and skills were improved. In terms of cultural capital, farmers’ cultural capital in 2015 and 2016 was 0.0167 and 0.0307, respectively. After the relocation was completed, that is, in 2019–2021, the average cultural capital was 0.0795. By carrying out various cultural activities to enhance the local cultural attraction, the cohesion of farmers has been continuously improved, and cultural activities have been further transformed into productive forces, which have become a source of vitality for promoting the sustainable development of farmers’ livelihood capital.

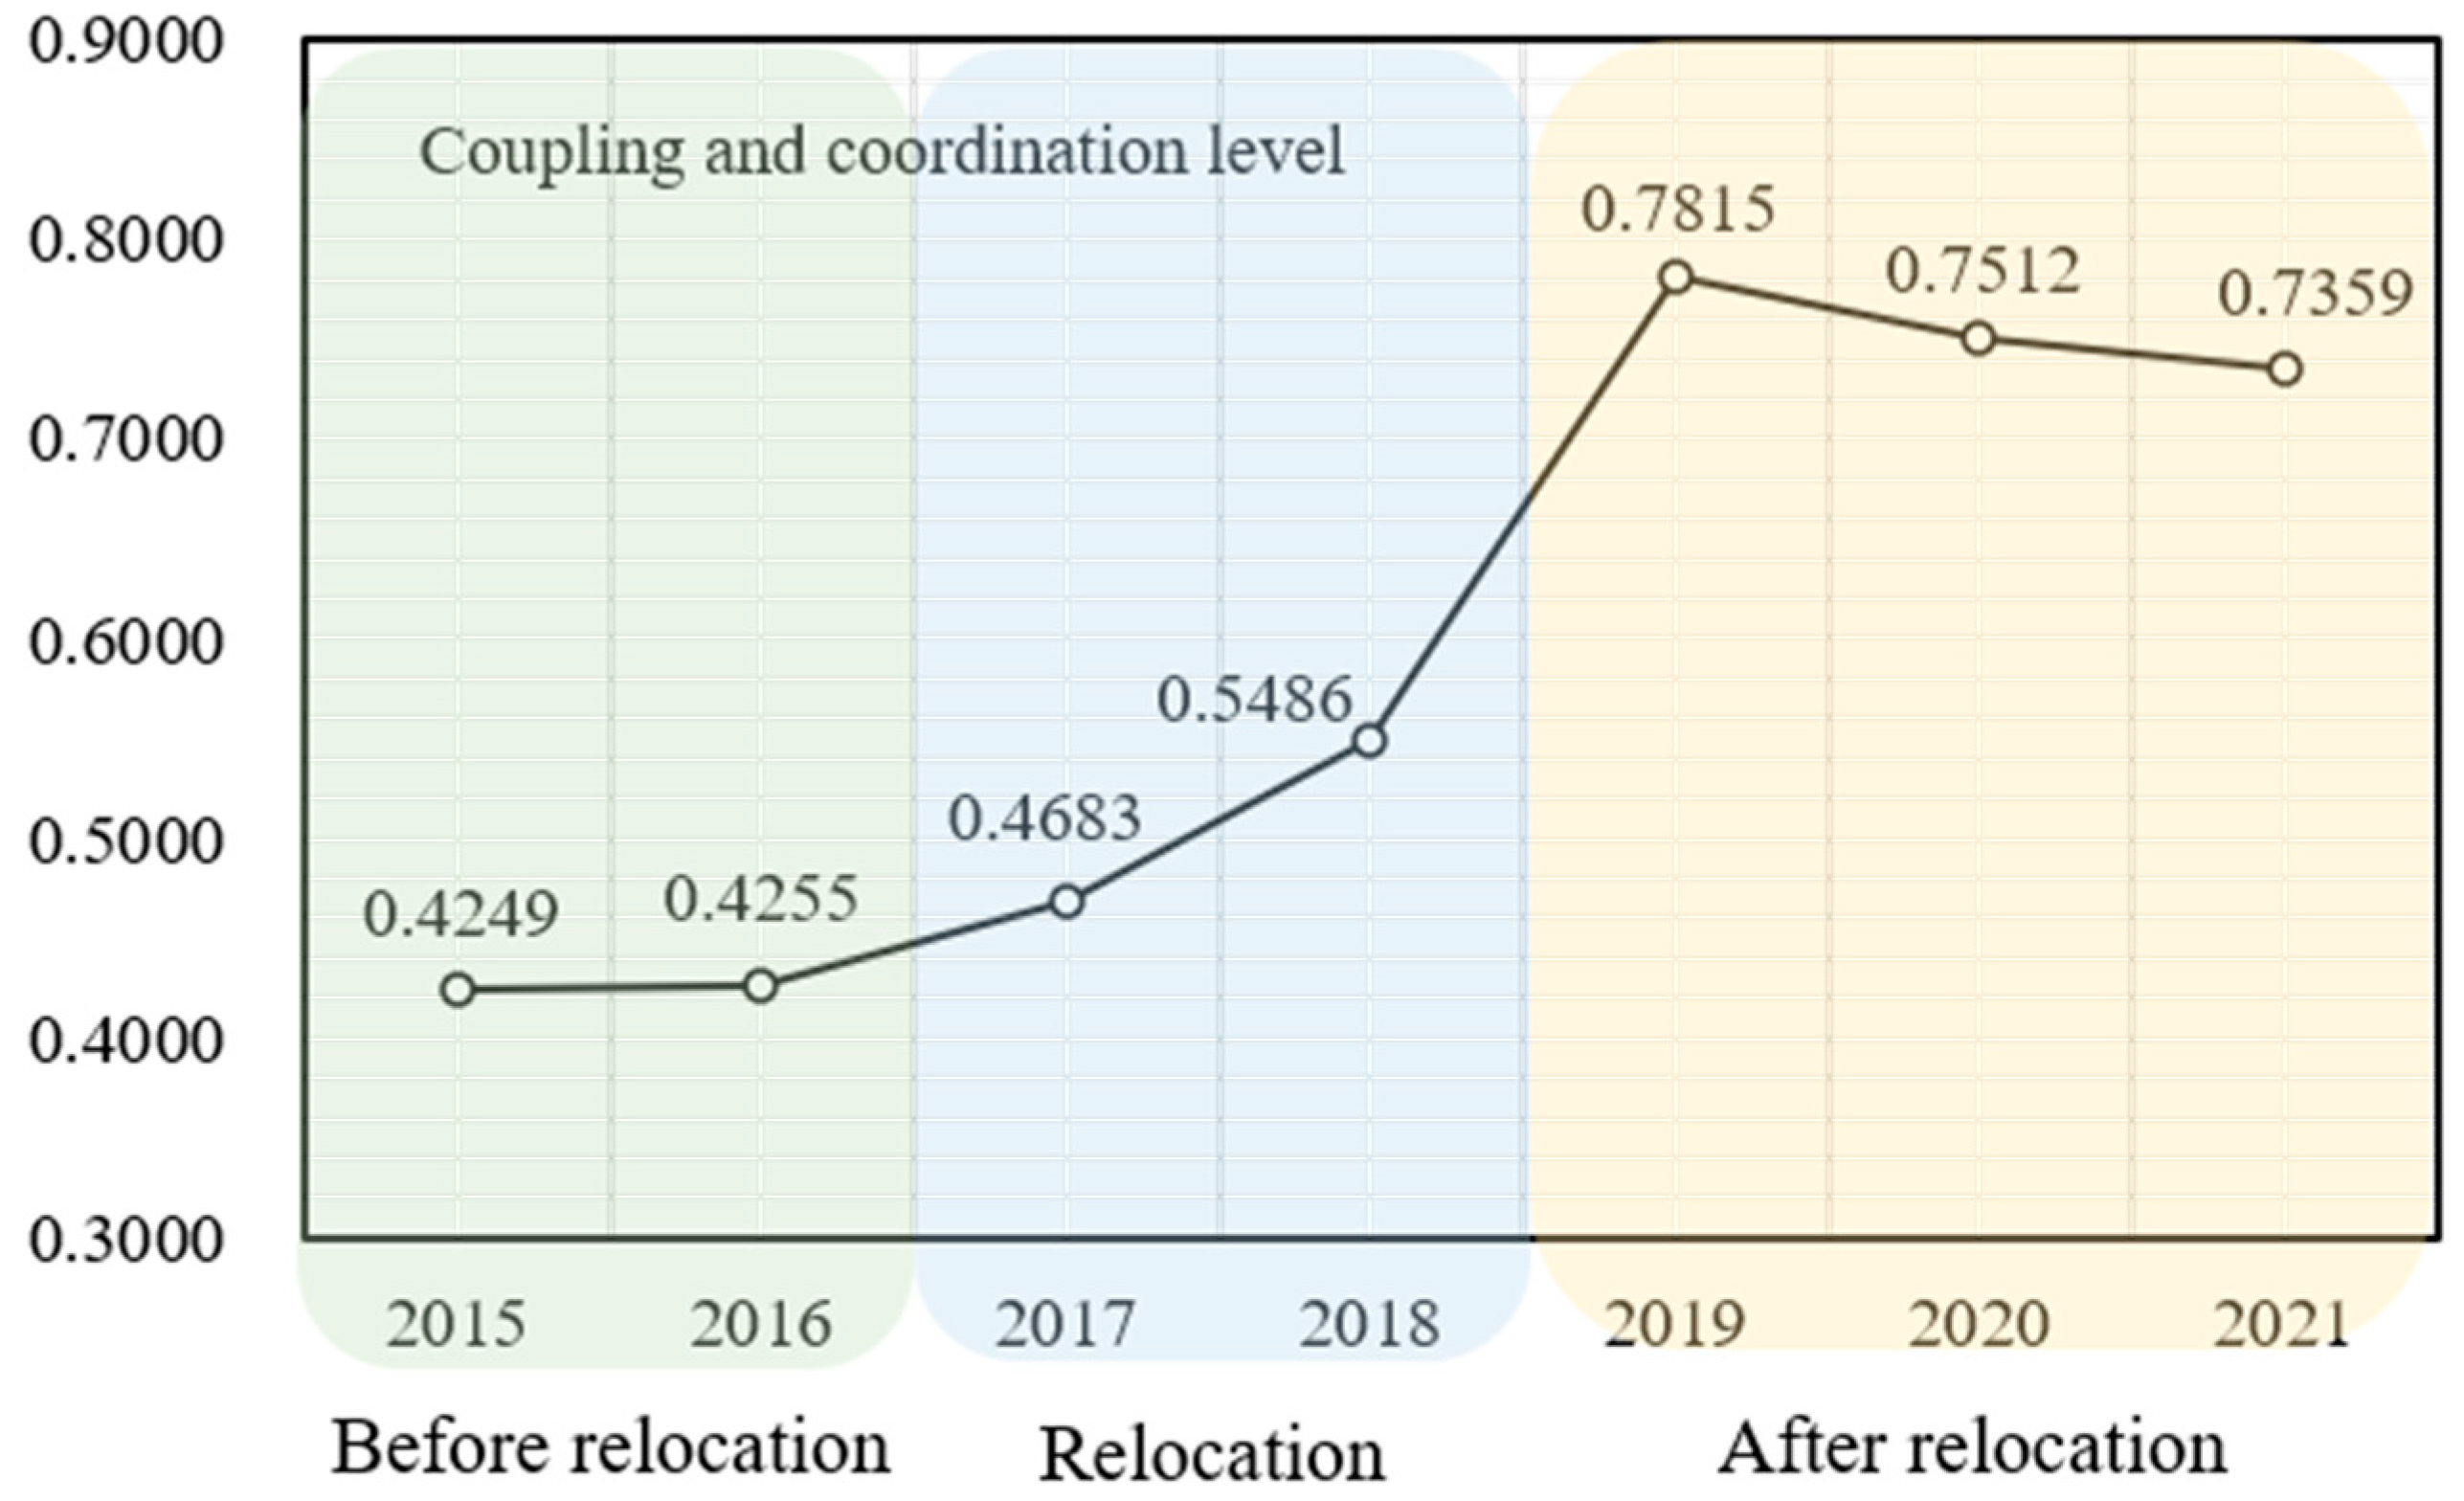
3.2. Coupling and Coordination Level of Livelihood Capital

Figure 6 describes the coupling and coordination level of various capitals of relocated farmers in Menglai Township from 2015 to 2021. Before the relocation, farmers’ capital was on the verge of imminent imbalance. With the promotion of poverty alleviation relocation, the coupling and coordination level of farmers’ livelihood capital was significantly improved by implementing comprehensive support policies. After the relocation, from 2019 to 2021, farmers’ livelihood capital was upgraded to a moderately coordinated state. Although the coupling and coordination level has been significantly improved, the six capitals have yet to reach an extremely coordinated state due to the differences in the initial level and growth rate of each capital. It is necessary to promote the coupled and coordinated development of various capitals, which is not only conducive to the increase in livelihood capital but can also break the barriers of transformation among various capitals and promote the sustainable development of livelihood capital.

3.3. Influencing Factors of Livelihood Capital

3.3.1. Regression Result

Based on the random effect model, the effects of various factors on the livelihood capital and total capital of relocated farmers in minority areas are verified, and the results are shown in Table 5.
(1) Number of domestic and foreign tourists
The regression results show that when the number of domestic and foreign tourists increases by one percentage point, farmers’ natural, physical, financial, social, human, and cultural livelihood capital increase by 0.0273, 0.2191, 0.0191, 0.2311, 0.1388, 0.0207, and 0.7486 percentage points, respectively, at the significance level of 1%, which shows that tourism promotes the livelihood capital of farmers. Among them, the growth of tourists has the most obvious influence on social capital, and its promotion of physical, human, natural, cultural, and financial capital is weakened in turn. Farmers’ social networks can be expanded by vigorously developing tourism, and they can obtain more social support and a sense of belonging and satisfaction. In addition, through skills training and “driven by capable people”, farmers’ labor skills are enriched, and their human capital is improved. Moreover, with tourism development in minority areas, various cultural tourism products with ethnic characteristics have appeared. Farmers’ awareness of environmental protection and “Lucid waters and lush mountains are invaluable assets” has deepened, gradually promoting cultural and natural capital. For farmers, with the increase in the number of domestic and foreign tourists, the most intuitive change is reflected in the improvement in farmers’ income and basic living security, that is, the growth of financial capital and physical capital and the development of tourism has improved farmers’ quality of life and living standards. Finally, farmers’ livelihood capital can be improved by accumulating human, physical, and financial resources that are conducive to development.
(2) Family population
The regression coefficient of the influence of family population on natural capital is 0.0016 at the level of 1% significance, and the family population will influence the promotion of natural capital. Specifically, if every unit of the family population increases, the natural capital of farmers will increase by 0.16%. Furthermore, the influence of family population on farmers’ financial capital is significant at the level of 1%. Every unit of family population increases, farmers’ financial capital increases by 0.17%, and family size positively impacts farmers’ income growth.
(3) Administrative villages
The regression coefficient of administrative villages to natural capital is 0.0005 at the level of 5% significance, and the regression coefficients to physical, financial, and social capital are −0.0018, −0.0006, and −0.0024 at the level of 1% significance, respectively. Thus, the development of livelihood capital expressed by farmers in different administrative villages is quite different. There are often significant differences in geographical conditions, infrastructure, road traffic conditions, economic development level, and social relations of farmers in different administrative villages, which further affect farmers’ livelihood capital.
(4) Causes of poverty
The regression coefficients of the causes of poverty to financial and social capital are −0.0010 and 0.0031 at the level of 1% significance, respectively, indicating that farmers with capacity loss, increased burden, factor shortage, accidental impact, and lack of self-development motivation have different performances in financial and social capital. Therefore, to improve farmers’ livelihood capital and realize sustainable livelihood, it is necessary to attach importance to the orderly connection between various policies and poverty alleviation relocation and implement differentiated assistance and development measures for farmers with different causes of poverty.

3.3.2. Robustness Test

(1) Replacement matching method
To verify the robustness of the research conclusion, OLS and FE estimation methods are used to verify the influence of the number of domestic and foreign tourists, family population, administrative villages, and the causes of poverty on farmers’ livelihood capital. The regression results are shown in Table 6, showing that the significance and direction of most variable coefficients are stable. The research conclusions are consistent with the benchmark regression results, indicating that the empirical analysis results are robust.
(2) Change in time range
The research scope of the sample was adjusted from 2015–2021 to 2016–2020, and the benchmark model and its variables were kept unchanged to verify the robustness of the research conclusion. The empirical results after changing the sample range are shown in Table 7. It can be seen that although the regression coefficients of various influencing factors are different in absolute values, the sign and significance level of the coefficients remain unchanged, which further proves that the benchmark regression results are robust.

4. Discussion

Since the concept of sustainable livelihood was put forward, it has become the core issue of poverty and sustainable development research, which focuses on ability, fairness, and sustainability [30]. Livelihood capital is the core of sustainable livelihood, and scholars have made functional explorations and summaries in the evaluation and promotion of livelihood capital and the study of livelihood capital in specific events.
Most of the existing studies evaluate livelihood capital from five aspects: nature, physical, financial, social, and human capital, according to DFID’s sustainable livelihood analysis framework [48]. Many studies promote the development of livelihood capital through the intervention of external factors and seldom explore the impact of farmers’ factors on livelihood capital [49,50,51,52,53,54]. Moreover, the research on livelihood capital in specific events focuses on climate change [55,56,57]. However, the existing research rarely investigates the influence of relocation on farmers’ livelihood [12], especially the research on farmers’ livelihood capital after poverty alleviation relocation in minority areas, and insufficient attention is paid to cultural capital in minority areas. However, due to the particularity of social history, cultural traditions, and living customs, minority areas need to fully consider and respect local characteristics and development laws, choose development methods based on local conditions, take into account the internal and external influencing factors of livelihood capital, and promote the stock improvement in livelihood capital and the coordinated development of various capitals.
Ecological, economic, and social factors such as natural disasters, environmental pollution, climate change, land tenure deterioration, lack of rural employment opportunities, lack of educational resources, and inadequate health and social welfare are the leading causes of the relocation of farmers. Based on the factors affecting farmers’ livelihood capital in this study, to improve the livelihood capital of relocated farmers, they can be organized to move to areas with tourist resources and increase their income by developing homestays and rural tourism. Eugenics and childcare should be promoted, family members’ education and employment levels should be improved, and their self-development ability should be enhanced. In addition, they can strengthen cooperation between different administrative villages, jointly carry out planting and breeding projects, share resources, and improve production efficiency. Furthermore, government departments need to deeply understand the causes of farmers’ poverty and formulate specific assistance programs. For example, they can encourage young people in impoverished households to start businesses in their hometowns if the family is impoverished due to a lack of labor.
This study has great theoretical and practical significance for academic research and policymaking. On the one hand, by supplementing cultural capital, the original sustainable analysis framework is improved, which provides a scientific theoretical reference for the study of sustainable livelihood issues. Furthermore, the theoretical framework of internal and external factors affecting livelihood capital is constructed, making it possible to pay attention not only to the importance of external assistance but also to farmers’ characteristics and endogenous motivation. On the other hand, this study is conducive to the relevant departments to realize that farmers need not only physical and economic support but also cultural integration after relocation to continuously enrich cultural support carriers, build cultural facilities, enrich national cultural activities, and meet the diverse cultural needs of relocated farmers. Moreover, the internal and external factors that affect farmers’ livelihood capital are comprehensively considered, and the relocated farmers are given specific policies based on different influencing factors.
The limitation of this study is that only one area was taken as an example for field investigation and empirical analysis, and whether the index system and empirical research results are suitable for farmers in other minority areas remains to be discussed. In the future, it will be necessary to expand the research area further and increase the comparative analysis of different regions to enhance the universality of the research conclusions.

5. Conclusions

As the “first project” in the battle against poverty, poverty alleviation relocation is the most effective way to alleviate poverty for farmers in regions where “one’s soil and water cannot support one’s people”. It is also a great feat in the history of human migration and world poverty reduction and an essential part of the “China Plan” for poverty alleviation in the new era. As the main battlefield of poverty alleviation, Yunnan Province integrates frontier, ethnic, mountainous, and poverty. To further consolidate poverty alleviation achievements and enhance the livelihood capital of relocated farmers, this study takes the relocated farmers in Menglai Township, Cangyuan County, Yunnan Province, from 2015 to 2021 as the research object, evaluates the livelihood capital of the farmers, and explores the influencing factors of livelihood capital to provide decision support for the sustainable development of the livelihood capital of the relocated farmers, promote the effective connection between the poverty alleviation achievements and the rural revitalization strategy, prevent the farmers from returning to poverty, and realize the sustainable development goal. The main research contents and conclusions are as follows:
(1) Construct a livelihood capital evaluation system for farmers in Yunnan minority areas. The evaluation system of farmers’ livelihood capital includes 17 indexes, including four third-level indexes of natural capital, three third-level indexes of physical capital, four third-level indexes of financial capital, two third-level indexes of social capital, two third-level indexes of human capital, and two third-level indexes of cultural capital.
(2) Measure the value of livelihood capital and its coupling and coordination level. The livelihood capital and all kinds of farmers’ capital have increased significantly after relocation, and the level of coupling and coordination among the six types of capital has been improved. However, there is still a significant gap in the level of extreme coordination.
(3) Construct the theoretical framework of internal and external factors affecting the livelihood capital of relocated farmers. Integrating the internal and external factors theory, family life cycle theory, location theory, sustainable development theory of tourism poverty alleviation, and the cumulative causation theory, the empirical analysis shows that the number of domestic and foreign tourists, family population, administrative villages, and causes of poverty have different degrees of influence on farmers’ livelihood capital.

Author Contributions

Conceptualization, J.W. and H.Y.; methodology, J.W.; software, J.W.; validation, J.W., H.Y. and J.Z.; formal analysis, J.Z.; investigation, J.W.; resources, H.Y.; data curation, H.Y.; writing—original draft preparation, J.W.; writing—review and editing, J.W.; visualization, J.W.; supervision, J.Z.; project administration, H.Y.; funding acquisition, H.Y. All authors have read and agreed to the published version of the manuscript.

Funding

This research was funded by the National Natural Science Foundation of China (No. 72064025), the Ministry of Education Planning Fund (No. 20XJA630002).

Data Availability Statement

Not applicable.

Conflicts of Interest

The authors declare no conflict of interest.

References

  1. Zhu, Y.; Guan, R.; Yu, J. How Does Poverty Alleviation Relocation Affect the Non-Agricultural Employment of Women’s Labor Forces? Evidence from Southern Shaanxi Province. Land 2023, 12, 84. [Google Scholar] [CrossRef]
  2. Arena, M.; Azzone, G.; Ratti, S.; Urbano, V.M.; Vecchio, G. Sustainable development goals and corporate reporting: An empirical investigation of the oil and gas industry. Sustain. Dev. 2023, 31, 12–25. [Google Scholar] [CrossRef]
  3. Li, W.; Shuai, C.; Shuai, Y.; Cheng, X.; Liu, Y.; Huang, F. How Livelihood Assets Contribute to Sustainable Development of Smallholder Farmers. J. Int. Dev. 2020, 32, 408–429. [Google Scholar] [CrossRef]
  4. Gyawali, S.; Tiwari, S.R.; Bajracharya, S.B.; Skotte, H.N. Promoting sustainable livelihoods: An approach to postdisaster reconstruction. Sustain. Dev. 2020, 28, 626–633. [Google Scholar] [CrossRef]
  5. Natarajan, N.; Newsham, A.; Rigg, J.; Suhardiman, D. A sustainable livelihoods framework for the 21st century. World Dev. 2022, 155, 105898. [Google Scholar] [CrossRef]
  6. Wu, Z.; Liu, T.; Xia, M.; Zeng, T. Sustainable livelihood security in the Poyang Lake Ecological Economic Zone: Identifying spatial-temporal pattern and constraints. Appl. Geogr. 2021, 135, 102553. [Google Scholar] [CrossRef]
  7. Guo, A.; Wei, Y.; Zhong, F.; Wang, P. How do climate change perception and value cognition affect farmers’ sustainable livelihood capacity? An analysis based on an improved DFID sustainable livelihood framework. Sustain. Prod. Consum. 2022, 33, 636–650. [Google Scholar] [CrossRef]
  8. Ankrah, D.A.; Anum, R.; Anaglo, J.N.; Boateng, S.D. Influence of sustainable livelihood capital on climate variability adaptation strategies. Environ. Sustain. Indic. 2023, 18, 100233. [Google Scholar] [CrossRef]
  9. Ghazali, S.; Zibaei, M.; Azadi, H. Impact of livelihood strategies and capitals on rangeland sustainability and nomads’ poverty: A counterfactual analysis in Southwest Iran. Ecol. Econ. 2023, 206, 107738. [Google Scholar] [CrossRef]
  10. Dai, X.; Wu, Z.; Fan, Y.; Li, B.; Yang, Z.; Nan, B.; Bi, X. Characteristics and Determinants of Livelihood Diversification of Different Household Types in Far Northwestern China. Sustainability 2020, 12, 64. [Google Scholar] [CrossRef]
  11. Wang, W.; Lan, Y.; Wang, X. Impact of livelihood capital endowment on poverty alleviation of households under rural land consolidation. Land Use Policy 2021, 109, 105608. [Google Scholar] [CrossRef]
  12. Li, C.; Wang, L.; Feldman, M.W.; Li, S. Poverty and income inequality effects of the relocation program in Shaanxi, China. Asian-Pac. Econ. Lit. 2021, 35, 41–59. [Google Scholar] [CrossRef]
  13. Zhu, D.; Jia, Z.; Zhou, Z. Place attachment in the Ex-situ poverty alleviation relocation: Evidence from different poverty alleviation migrant communities in Guizhou Province, China. Sustain. Cities Soc. 2021, 75, 103355. [Google Scholar] [CrossRef]
  14. Rogers, S.; Li, J.; Lo, K.; Guo, H.; Li, C. China’s rapidly evolving practice of poverty resettlement: Moving millions to eliminate poverty. Dev. Policy Rev. 2020, 38, 541–554. [Google Scholar] [CrossRef]
  15. Guo, Y.; Zhou, Y.; Liu, Y. Targeted poverty alleviation and its practices in rural China: A case study of Fuping county, Hebei Province. J. Rural Stud. 2022, 93, 430–440. [Google Scholar] [CrossRef]
  16. Wu, J.; Yang, H.; Ahmed, T. An assessment of the policy of poverty alleviation in continuous poverty-stricken areas: Evidence from Yunnan Province, China. Environ. Dev. Sustain. 2022, 6, 1–21. [Google Scholar] [CrossRef]
  17. Zhou, Y.; Guo, Y.; Liu, Y.; Wu, W.; Li, Y. Targeted poverty alleviation and land policy innovation: Some practice and policy implications from China. Land Use Policy 2018, 74, 53–65. [Google Scholar] [CrossRef]
  18. Caggiano, G.; Castelnuovo, E.; Kima, R. The global effects of Covid-19-induced uncertainty. Econ. Lett. 2020, 194, 109392. [Google Scholar] [CrossRef]
  19. Feng, G.; Yang, H.; Gong, Q.; Chang, C. What is the exchange rate volatility response to COVID-19 and government interventions? Econ. Anal. Policy 2021, 69, 705–719. [Google Scholar] [CrossRef]
  20. Cernea, M. The risks and reconstruction model for resettling displaced populations. World Dev. 1997, 25, 1569–1587. [Google Scholar] [CrossRef]
  21. Sina, D.; Chang-Richards, A.Y.; Wilkinson, S.; Potangaroa, R. What does the future hold for relocated communities post-disaster? Factors affecting livelihood resilience. Int. J. Disaster Risk Reduct. 2019, 34, 173–183. [Google Scholar] [CrossRef]
  22. Yankson, P.W.K.; Asiedu, A.B.; Owusu, K.; Urban, F.; Siciliano, G. The livelihood challenges of resettled communities of the Bui dam project in Ghana and the role of Chinese dam-builders. Dev. Policy Rev. 2018, 36, O476–O494. [Google Scholar] [CrossRef]
  23. Kura, Y.; Joffre, O.; Laplante, B.; Sengvilaykham, B. Coping with resettlement: A livelihood adaptation analysis in the Mekong River basin. Land Use Policy 2017, 60, 139–149. [Google Scholar] [CrossRef]
  24. Cao, M.; Xu, D.; Xie, F.; Liu, E.; Liu, S. The influence factors analysis of households’ poverty vulnerability in southwest ethnic areas of China based on the hierarchical linear model: A case study of Liangshan Yi autonomous prefecture. Appl. Geogr. 2016, 66, 144–152. [Google Scholar] [CrossRef]
  25. Wu, Z.; Dai, X.; Li, B.; Hou, Y. Livelihood consequences of the Grain for Green Programme across regional and household scales: A case study in the Loess Plateau. Land Use Policy 2021, 111, 105746. [Google Scholar] [CrossRef]
  26. Zhang, L.; Hong, W.; Wang, L.; Hsiao, W. Social capital and farmer’s willingness-to-join a newly established community-based health insurance in rural China. Health Policy 2006, 76, 233–242. [Google Scholar] [CrossRef]
  27. Rodgers, J.A.V.H. Social capital and physical health: An updated review of the literature for 2007–2018. Soc. Sci. Med. 2019, 236, 112360. [Google Scholar] [CrossRef]
  28. Chen, Y.; Qin, Y.; Zhu, Q. Study on the Impact of Social Capital on Agricultural Land Transfer Decision: Based on 1017 Questionnaires in Hubei Province. Land 2023, 12, 861. [Google Scholar] [CrossRef]
  29. Delgado Jiménez, A.; Smith, N.M.; Holley, E.A. Capitals in artisanal and small-scale mining in Marmato, Colombia: Using the sustainable livelihoods framework to inform formalization. Extr. Ind. Soc. 2022, 12, 103355. [Google Scholar] [CrossRef]
  30. Dey, S. Structure and dynamics of livelihoods in rural India: A panel data analysis. Poverty Public Policy 2022, 14, 307–334. [Google Scholar] [CrossRef]
  31. Fabinyi, M.; Evans, L.; Foale, S.J. Social-ecological systems, social diversity, and power: Insights from anthropology and political ecology. Ecol. Soc. 2014, 19, 28. [Google Scholar] [CrossRef]
  32. Curry, G.N.; Nake, S.; Koczberski, G.; Oswald, M.; Rafflegeau, S.; Lummani, J.; Peter, E.; Nailina, R. Disruptive innovation in agriculture: Socio-cultural factors in technology adoption in the developing world. J. Rural. Stud. 2021, 88, 422–431. [Google Scholar] [CrossRef]
  33. Mackeracher, T.; Foale, S.J.; Gurney, G.G.; Purcell, S.W. Adoption and diffusion of technical capacity-building innovations by small-scale artisanal fishers in Fiji. Ecol. Soc. 2019, 24, 3. [Google Scholar] [CrossRef]
  34. Zhao, Y.; Zhang, L.; Jia, X.; Mu, Q.; Han, L.; Liu, Z.; Zhang, P.; Zhao, M. Pattern and Trend of Ecosystem Service Value in the Loess Plateau of Northern Shaanxi. Land 2023, 12, 607. [Google Scholar] [CrossRef]
  35. Xu, L.; Chen, S.S. Coupling coordination degree between social-economic development and water environment: A case study of Taihu lake basin, China. Ecol. Indic. 2023, 148, 110118. [Google Scholar] [CrossRef]
  36. Li, Q.; Yang, L.; Jiang, F.; Liu, Y.; Guo, C.; Han, S. Distribution Characteristics, Regional Differences and Spatial Convergence of the Water-Energy-Land-Food Nexus: A Case Study of China. Land 2022, 11, 1543. [Google Scholar] [CrossRef]
  37. Wu, Q.; Hong, S.; Yang, L.; Mu, H.; Huang, C.; Niu, X.; Zhong, Y.; Yi, J.; He, C. Coupling coordination relationships between air pollutant concentrations and emissions in China. Atmos. Pollut. Res. 2023, 14, 101678. [Google Scholar] [CrossRef]
  38. Xie, H.; Li, Z.; Xu, Y. Study on the Coupling and Coordination Relationship between Gross Ecosystem Product (GEP) and Regional Economic System: A Case Study of Jiangxi Province. Land 2022, 11, 1540. [Google Scholar] [CrossRef]
  39. García Sánchez, I.M. Drivers of the CSR report assurance quality: Credibility and consistency for stakeholder engagement. Corp. Soc. Responsib. Environ. Manag. 2020, 27, 2530–2547. [Google Scholar] [CrossRef]
  40. Qin, Z.; Haili, X.; Xiao, L.; Luwei, D.; Bojie, W.; Fengqi, C.; Haiping, T. Livelihood vulnerability of pastoral households in the semiarid grasslands of northern China: Measurement and determinants. Ecol. Indic. 2022, 140, 109020. [Google Scholar] [CrossRef]
  41. Xu, D.; Ma, Z.; Deng, X.; Liu, Y.; Huang, K.; Zhou, W.; Yong, Z. Relationships between Land Management Scale and Livelihood Strategy Selection of Rural Households in China from the Perspective of Family Life Cycle. Land 2020, 9, 11. [Google Scholar] [CrossRef]
  42. Liu, R.; Ham, J.; Ding, Z.; Jiang, X.; Zhang, H. Sustainable family development: How changes in family life cycle influence household low-carbon use behavior through changing motivations. Sustain. Prod. Consum. 2022, 34, 271–284. [Google Scholar] [CrossRef]
  43. Sun, Y.; Gao, C. Theoretical Study on Poverty Alleviation by Relocation and Resettlement in China in the New Era. J. Anhui Agric. Sci. 2013, 41, 14095–14098. [Google Scholar] [CrossRef]
  44. Wang, J.; Lv, W. Tourism poverty alleviation hotspots in China: Topic evolution and sustainable development. Sustain. Dev. 2023, 12, 1–19. [Google Scholar] [CrossRef]
  45. Pasanchay, K.; Schott, C. Community-based tourism homestays’ capacity to advance the Sustainable Development Goals: A holistic sustainable livelihood perspective. Tour. Manag. Perspect. 2021, 37, 100784. [Google Scholar] [CrossRef]
  46. Richardson, D.; Castree, N.; Goodchild, M.F.; Kobayashi, A.; Liu, W.; Marston, R.A. Cumulative causation, endogenous growth, and regional development. Int. Encycl. Geogr. People Earth Environ. Technol. 2016, 3, 1–13. [Google Scholar] [CrossRef]
  47. Chi, F.; Han, H. The Impact of High-Speed Rail on Economic Development: A County-Level Analysis. Land 2023, 12, 874. [Google Scholar] [CrossRef]
  48. Wu, Z.; Li, B.; Hou, Y. Adaptive choice of livelihood patterns in rural households in a farm-pastoral zone: A case study in Jungar, Inner Mongolia. Land Use Policy 2017, 62, 361–375. [Google Scholar] [CrossRef]
  49. Chen, H.; Zhu, T.; Krott, M.; Calvo, J.F.; Ganesh, S.P.; Makoto, I. Measurement and evaluation of livelihood assets in sustainable forest commons governance. Land Use Policy 2013, 30, 908–914. [Google Scholar] [CrossRef]
  50. Yu, P.; Zhang, J.; Wang, Y.; Wang, C.; Zhang, H. Can tourism development enhance livelihood capitals of rural households? Evidence from Huangshan National Park adjacent communities, China. Sci. Total Environ. 2020, 748, 141099. [Google Scholar] [CrossRef]
  51. Girma, G.; Melka, Y.; Haileslassie, A.; Mekuria, W. Participatory forest management for improving livelihood assets and mitigating forest degradation: Lesson drawn from the Central Rift Valley, Ethiopia. Curr. Res. Environ. Sustain. 2023, 5, 100205. [Google Scholar] [CrossRef]
  52. Thapa Karki, S. Do protected areas and conservation incentives contribute to sustainable livelihoods? A case study of Bardia National Park, Nepal. J. Environ. Manag. 2013, 128, 988–999. [Google Scholar] [CrossRef]
  53. Liu, M.; Feng, X.; Wang, S.; Zhong, Y. Does poverty-alleviation-based industry development improve farmers’ livelihood capital? J. Integr. Agr. 2021, 20, 915–926. [Google Scholar] [CrossRef]
  54. Dang, X.; Gao, S.; Tao, R.; Liu, G.; Xia, Z.; Fan, L.; Bi, W. Do environmental conservation programs contribute to sustainable livelihoods? Evidence from China’s grain-for-green program in northern Shaanxi province. Sci. Total Environ. 2020, 719, 137436. [Google Scholar] [CrossRef] [PubMed]
  55. Akther, H.; Ahmad, M.M. Livelihood under stress: The case of urban poor during and post-flood in Dhaka, Bangladesh. Geogr. J. 2021, 187, 186–199. [Google Scholar] [CrossRef]
  56. Keshavarz, M.; Maleksaeidi, H.; Karami, E. Livelihood vulnerability to drought: A case of rural Iran. Int. J. Disaster Risk Reduct. 2017, 21, 223–230. [Google Scholar] [CrossRef]
  57. Khan, M.A.; Hasan, K.; Kabir, K.H. Determinants of households’ livelihood vulnerability due to climate induced disaster in southwest coastal region of Bangladesh. Prog. Disaster Sci. 2022, 15, 100243. [Google Scholar] [CrossRef]
Figure 1. Research framework and design.
Land 12 01045 g001
Figure 2. Livelihood capital evaluation system.
Land 12 01045 g002
Figure 3. Theoretical framework of internal and external factors.
Land 12 01045 g003
Figure 4. Livelihood capital of relocated farmers from 2015 to 2021.
Land 12 01045 g004
Figure 5. Distribution of farmers’ livelihood capital from 2015 to 2021.
Land 12 01045 g005
Figure 6. Coupling and coordination level of livelihood capital.
Land 12 01045 g006
Table 1. Classification and level of coupling coordination degree.
D-ValueClassificationLevel
0.0000–0.10001Extreme imbalance
0.1001–0.20002Serious imbalance
0.2001–0.30003Moderate imbalance
0.3001–0.40004Mild imbalance
0.4001–0.50005Imminent imbalance
0.5001–0.60006Near coordination
0.6001–0.70007Primary coordination
0.7001–0.80008Moderate coordination
0.8001–0.90009Good coordination
0.9001–1.000010Extreme coordination
Table 2. Descriptive statistics.
VariableObsMeanSDMinMedianMax
Natural capital10080.0330.0130.0170.0280.080
Physical capital10080.1080.0660.0190.0770.186
Financial capital10080.0280.0090.0140.0260.065
Social capital10080.0930.0700.0180.0480.176
Human capital10080.0730.0580.0240.0370.166
Cultural capital10080.0560.0460.0170.0360.160
Livelihood capital10080.3900.2150.1110.3000.708
Number of domestic and foreign tourists10085.8480.4255.0965.8666.418
Family population10083.9171.3641.0004.0009.000
Administrative villages10086.1882.9801.0008.0009.000
Causes of poverty10082.9270.7151.0003.0005.000
Table 3. Multiple collinearity test.
VariableVIF1/VIF
Causes of poverty1.030.969431
Administrative villages1.030.967123
Family population1.030.975598
Number of domestic and foreign tourists1.010.985976
Mean VIF1.03
Table 4. Model statistical test results.
TestOriginal Hypothesisp ValueModel
F-testthe mixed regression model is better than the fixed effect model0.0000fixed effect model
LM-testthe mixed regression model is better than the random effect model0.0000random effect model
Hausman testthe random effect model is better than the fixed effect model0.9968random effect model
Table 5. Regression result.
(1)(2)(3)(4)(5)(6)(7)
Natural CapitalPhysical CapitalFinancial CapitalSocial CapitalHuman CapitalCultural CapitalLivelihood Capital
number of domestic and foreign tourists0.0273 ***
(18.24)
0.2191 ***
(60.89)
0.0191 ***
(17.97)
0.2311 ***
(72.83)
0.1388 ***
(72.11)
0.0207 ***
(45.43)
0.7486 ***
(150.61)
family population0.0016 ***
(5.09)
−0.0001
(−0.13)
0.0017 ***
(8.06)
−0.0007
(−1.21)
0.0004
(0.94)
0.0001
(0.94)
0.0027 ***
(2.94)
administrative villages0.0005 **
(2.41)
−0.0018 ***
(−4.62)
−0.0006 ***
(−4.97)
−0.0024 ***
(−7.77)
−0.0000
(−0.01)
−0.0000
(−0.01)
−0.0043 ***
(−8.83)
causes of poverty−0.0002
(−0.50)
0.0002
(0.20)
−0.0010 ***
(−2.89)
0.0031 ***
(3.18)
−0.0005
(−0.69)
−0.0001
(−0.69)
0.0022
(1.45)
_cons−0.0517 ***
(−32.08)
−0.9865 ***
(−70.29)
−0.0609 ***
(−35.00)
−1.4799 ***
(−230.24)
−0.7602 ***
(−157.48)
−0.1810 ***
(−71.38)
−3.7328 ***
(−242.74)
time effectcontrolcontrolcontrolcontrolcontrolcontrolcontrol
N1008100810081008100810081008
R20.43030.87880.41720.91990.91340.99210.9795
Note: t-values are reported in the parentheses. *** and ** indicate significance at 1% and 5% levels, respectively.
Table 6. Regression results of replacement matching methods.
(1)(2)
OLSFE
number of domestic and foreign tourists0.3346 ***
(27.99)
0.3252 ***
(25.04)
family population0.0110 ***
(2.94)
0.0413 ***
(4.81)
administrative villages−0.0038 **
(−2.20)
0.0000
(.)
causes of poverty0.0057
(0.80)
0.0092
(0.83)
_cons−1.6030 ***
(−21.03)
−1.7003 ***
(−19.86)
time effectcontrolcontrol
N10081008
R20.4510.462
Note: t-values are reported in the parentheses. *** and ** indicate significance at 1% and 5% levels, respectively.
Table 7. Regression results of changing the time range.
(1)(2)(3)(4)(5)(6)(7)
Natural CapitalPhysical CapitalFinancial CapitalSocial CapitalHuman CapitalCultural CapitalLivelihood Capital
number of domestic and foreign tourists0.0229 ***
(15.75)
0.1881 ***
(51.65)
0.0131 ***
(13.07)
0.1851 ***
(64.94)
0.0645 ***
(14.24)
0.1099 ***
(29.79)
0.6069 ***
(126.68)
family population0.0018 ***
(5.04)
0.0002
(0.25)
0.0018 ***
(7.48)
−0.0004
(−0.55)
0.0009
(0.86)
−0.0007
(−0.86)
0.0031 ***
(2.90)
administrative villages0.0005 **
(2.50)
−0.0024 ***
(−5.01)
−0.0006 ***
(−4.49)
−0.0031 ***
(−7.26)
0.0000
(0.07)
−0.0000
(−0.07)
−0.0056 ***
(−10.27)
causes of poverty0.0001
(0.23)
−0.0000
(−0.03)
−0.0009 **
(−2.45)
0.0016
(1.44)
−0.0001
(−0.07)
0.0001
(0.07)
0.0005
(0.31)
_cons−0.1094 ***
(−12.60)
−0.9635 ***
(−44.31)
−0.0493 ***
(−8.25)
−0.9640 ***
(−56.45)
−0.3073 ***
(−10.93)
−0.5817 ***
(−25.38)
−3.1034 ***
(−108.93)
time effectcontrolcontrolcontrolcontrolcontrolcontrolcontrol
N720720720720720720720
R20.40600.83580.34520.89790.41220.61220.9753
Note: t-values are reported in the parentheses. *** and ** indicate significance at 1% and 5% levels, respectively.
Disclaimer/Publisher’s Note: The statements, opinions and data contained in all publications are solely those of the individual author(s) and contributor(s) and not of MDPI and/or the editor(s). MDPI and/or the editor(s) disclaim responsibility for any injury to people or property resulting from any ideas, methods, instructions or products referred to in the content.

