Article

Land-Use/Land-Cover Change and Ecosystem Service Provision in Qinghai Province, China: From the Perspective of Five Ecological Function Zones

1
School of Geographical Science, Qinghai Normal University, Xining 810001, China
2
Academy of Plateau Science and Sustainability, People’s Government of Qinghai Province and Beijing Normal University, Xining 810001, China
3
Qinghai Province Key Laboratory of Physical Geography and Environmental Process, College of Geographical Science, Qinghai Normal University, Xining 810001, China
*
Authors to whom correspondence should be addressed.
Land 2023, 12(3), 656; https://doi.org/10.3390/land12030656
Submission received: 14 February 2023 / Revised: 6 March 2023 / Accepted: 8 March 2023 / Published: 10 March 2023

Abstract

:
Qinghai Province is an important part of the Qinghai-Tibet Plateau and has special importance in the construction of ecological civilisation in China, which is related to the ecological security of the country and long-term development. The land is the basis of terrestrial ecosystem services. Land use/cover change (LUCC) can alter the structure, distribution and processes of terrestrial ecosystems, thereby affecting ecosystem services. Ecological Function Zone (EFZ) is the special zone designated by the government to protect ecosystems more effectively. Studying the response of ecosystem services value (ESV) to LUCC within EFZ is of great significance to the construction of ecological civilization in Qinghai Province. This study uses five periods of land use data from 1980 to 2020 and selects the equivalent factor method, correction method and elasticity model to analyse the characteristics of land use change and its impact on the value of ecosystem services. The conclusions are as follows. (1) The results showed that the ESV of Qinghai Province decreased from 822.559 billion yuan in 1980 to 819.903 billion yuan in 2000, and then increased rapidly to 905.775 billion yuan in 2020, showing a total increase of 83.216 billion yuan (1 RMB equates to 0.144129 USD). The restoration of grassland and the expansion of water bodies are the main reasons for the growth of ESV. (2) The ESV of Sanjiangyuan EFZ was the highest, followed by Qaidam EFZ, Qinghai Lake EFZ and Qilian Mountains EFZ, while Hehuang EFZ was the lowest. (3) The elasticity of the ESV to LUCC generally declined in all EFZs. Every 1% change in the LUCC in the Qaidam EFZ will result in a 4.78% change in ESV, followed by the Sanjiangyuan EFZ (2.56%), Qilian Mountains EFZ (2.1%), Qinghai Lake EFZ (1.01%), and the Hehuang EFZ with the lowest elasticity index (0.53%). (4) The distribution of the high values of the ESV elasticity gradually expands, with a clear spatial distribution characteristic of high west and low east. (5) The most suitable area for urban construction in Qinghai Province is the Hehuang EFZ, and urban construction in the Qaidam EFZ should avoid encroaching on water bodies or polluting water sources. The conclusions can provide a reference for optimising the land use structure and harmonising conservation and development in Qinghai Province.

1. Introduction

Ecosystem services (ES) are the direct or indirect services that human derive from the ecosystem and the relative contribution of natural resources to human society, including provisioning services, regulating services, supporting services and cultural services [1,2,3]. Ecosystem services value (ESV) refers to the economic value of the contribution of ecosystem services to human society. It can objectively reflect the impact on ecosystems of climate change, land use change, urbanization process, etc., and references for environmental protection, ecological function zoning, green development and so on [4,5,6]. The methods of ESV assessment are mainly based on the functional value per unit of service [7] and the unit value equivalent factor [1,8]. Scholars have carried out quantitative research on ecosystem services from the perspective of different disciplines, meaning it has gradually become the frontier and hot spot of research [9].
The American ecologist Bailey first introduced the concept of ecological functional zoning in 1976. For managing forests and rangelands at different scales, he proposed a hierarchy of ecoregions in the United States by dividing them into four classes from an ecosystem perspective: domain, vision, province and section [10,11]. China has proposed the idea of Ecological Function Zones since 2000 and proposed in the “11th Five-Year Plan” to divide the national land space into four categories of main function zones: optimised development, key development, restricted development, and prohibited development. Ecological Function Zones (EFZs) were proposed in the National Plan for Main Function Zones. Firstly, the enhancement of the production capacity of ecological products must be a priority, and industrialization development should be restricted.
The LUCC have raised concerns about corresponding changes in ecosystem services and biodiversity in recent years. The land is an important carrier of terrestrial ecosystems and LUCC is an important factor affecting ecosystem services [12,13]. It has been shown that LUCC by human activities has caused a decline in ecosystem services by approximately 60%, and the degraded ecosystems produce a range of environmental problems such as soil erosion, salinization and desertification [14,15]. Many scholars have focused on the response of ecosystem services to land use change, including assessing the impact of LUCC on ecosystem services [16,17,18,19,20], ESV assessment and its spatial-temporal distribution characteristics in a typical region [21], the impact of land use change on single ecosystem service [22,23], and predicting the future LUCC and calculating ESV [24]. However, there is little research that has been completed on the elasticity of ESV changes in response to LUCC in EFZ. A study on the elasticity of ESV can help to assess the likelihood of environmental problems that endanger human well-being when ecosystems are disturbed by anthropogenic or non-anthropogenic factors. Previous studies of ecosystem services have generally paid close attention to national [18,19,25], inter-provincial and urban factors [26,27,28,29,30], as well as watershed and typical regional ones [31,32,33,34]. Jiang found that the expansion of water bodies and the reduction of bare land and glaciers in the Qinghai-Tibet Plateau from 1990 to 2015 led to an increase of 0.04 billion yuan in the total ESV [21]. Xing et al. calculated the spatial spillover effects of urbanization on ESV in China by adjusting the equivalence factors, and found that spatial and economic urbanization positively affects ecosystem services in some surrounding areas, while population urbanization negatively affects ecosystem services [35]. Sun et al. established the Qilian Mountains glacier service value evaluation system, and by combining various methods to evaluate the ESV of the Qilian Mountains glacier and its spatial and temporal distribution changes, they found that the ESV decreased by 435 million yuan over the course of 60 years [36]. Guan et al. explored the impact of LUCC on ESV in Zhangye Oasis, Gansu Province, and combined natural and socio-economic data with the FLUS model to predict LUCC and analyse future trends in terms of the impact of LUCC on ESV [37]. Ma et al. identified priority conservation areas by analysing the spatial and temporal variability of ecosystem services in the Nanyue Mountain region [38]. Wu et al. used the equivalence factor method to calculate ESV on the Qinghai-Tibet Plateau and found that it first decreases and then increases, and explored the vertical distribution characteristics of ESV on the Qinghai-Tibet Plateau and its influence from topographic factors [39]. Song and Deng (2017) proposed an elasticity model for ESV response to LUCC and the results showed that 1% of LUCC in China would result in approximately 0.1% change in ESV [16]; Han subsequently used this model to estimate that every 1% LUCC in Qinghai Province caused a 0.693% or 1.137% fluctuation in ESV [40]. The Chinese government attaches great importance to ecological protection and national parks or EFZs for ecological protection, and this is why policymakers need scholars to help them develop and revise the system of EFZs. However, few studies have used government-proposed EFZs as a scale of the study and assessed the extent to which their ecosystem services respond to land use change in recent years. Assessing the ESV and response to LUCC of EFZs is not only important for ecological protection, but also informs policymakers.
Qinghai Province is an important part of the Tibetan Plateau—an important recharge area for freshwater resources in China, the area with the highest concentration of biodiversity on the plateau, and a sensitive and important initiation area for climate change in Asia, the northern hemisphere, and even globally [41]. It has excellent ecological value but sensitive and fragile ecology and is difficult to restore after damage [42]. After the reform and opening-up, Qinghai Province has experienced rapid development and accelerated urban expansion based on the advantages of natural resources, but the ecological environment has been damaged. The conversation about development and conservation in Qinghai Province never stops. The province’s ecological fragility means that protecting the environment should be the priority. Yet, how to seek development in the protection of the environment and how to minimise the environmental damage caused by development should be key questions in the study of the ecosystems of Qinghai Province. The research objectives of this paper are therefore as follows: (1) to determine the main LUCC of five EFZs in Qinghai Province from 1980 to 2020; (2) to calculate the value of ecosystem service functions and the temporal and spatial variation of each EFZ; (3) to estimate the degree of response of ESV to the LUCC in each EFZ, and explore how it changes in spatial and temporal distribution; and (4) to reveal the sensitivity of ecosystem service functions to LUCC in each EFZ. The results of the study have important implications for the optimization of land use structure, sustainable development and ecological civilization in Qinghai Province, and provide a reference for policymakers in formulating relevant policies, coordinating economic growth with environmental protection, and optimizing land use structure.

2. Materials and Methods
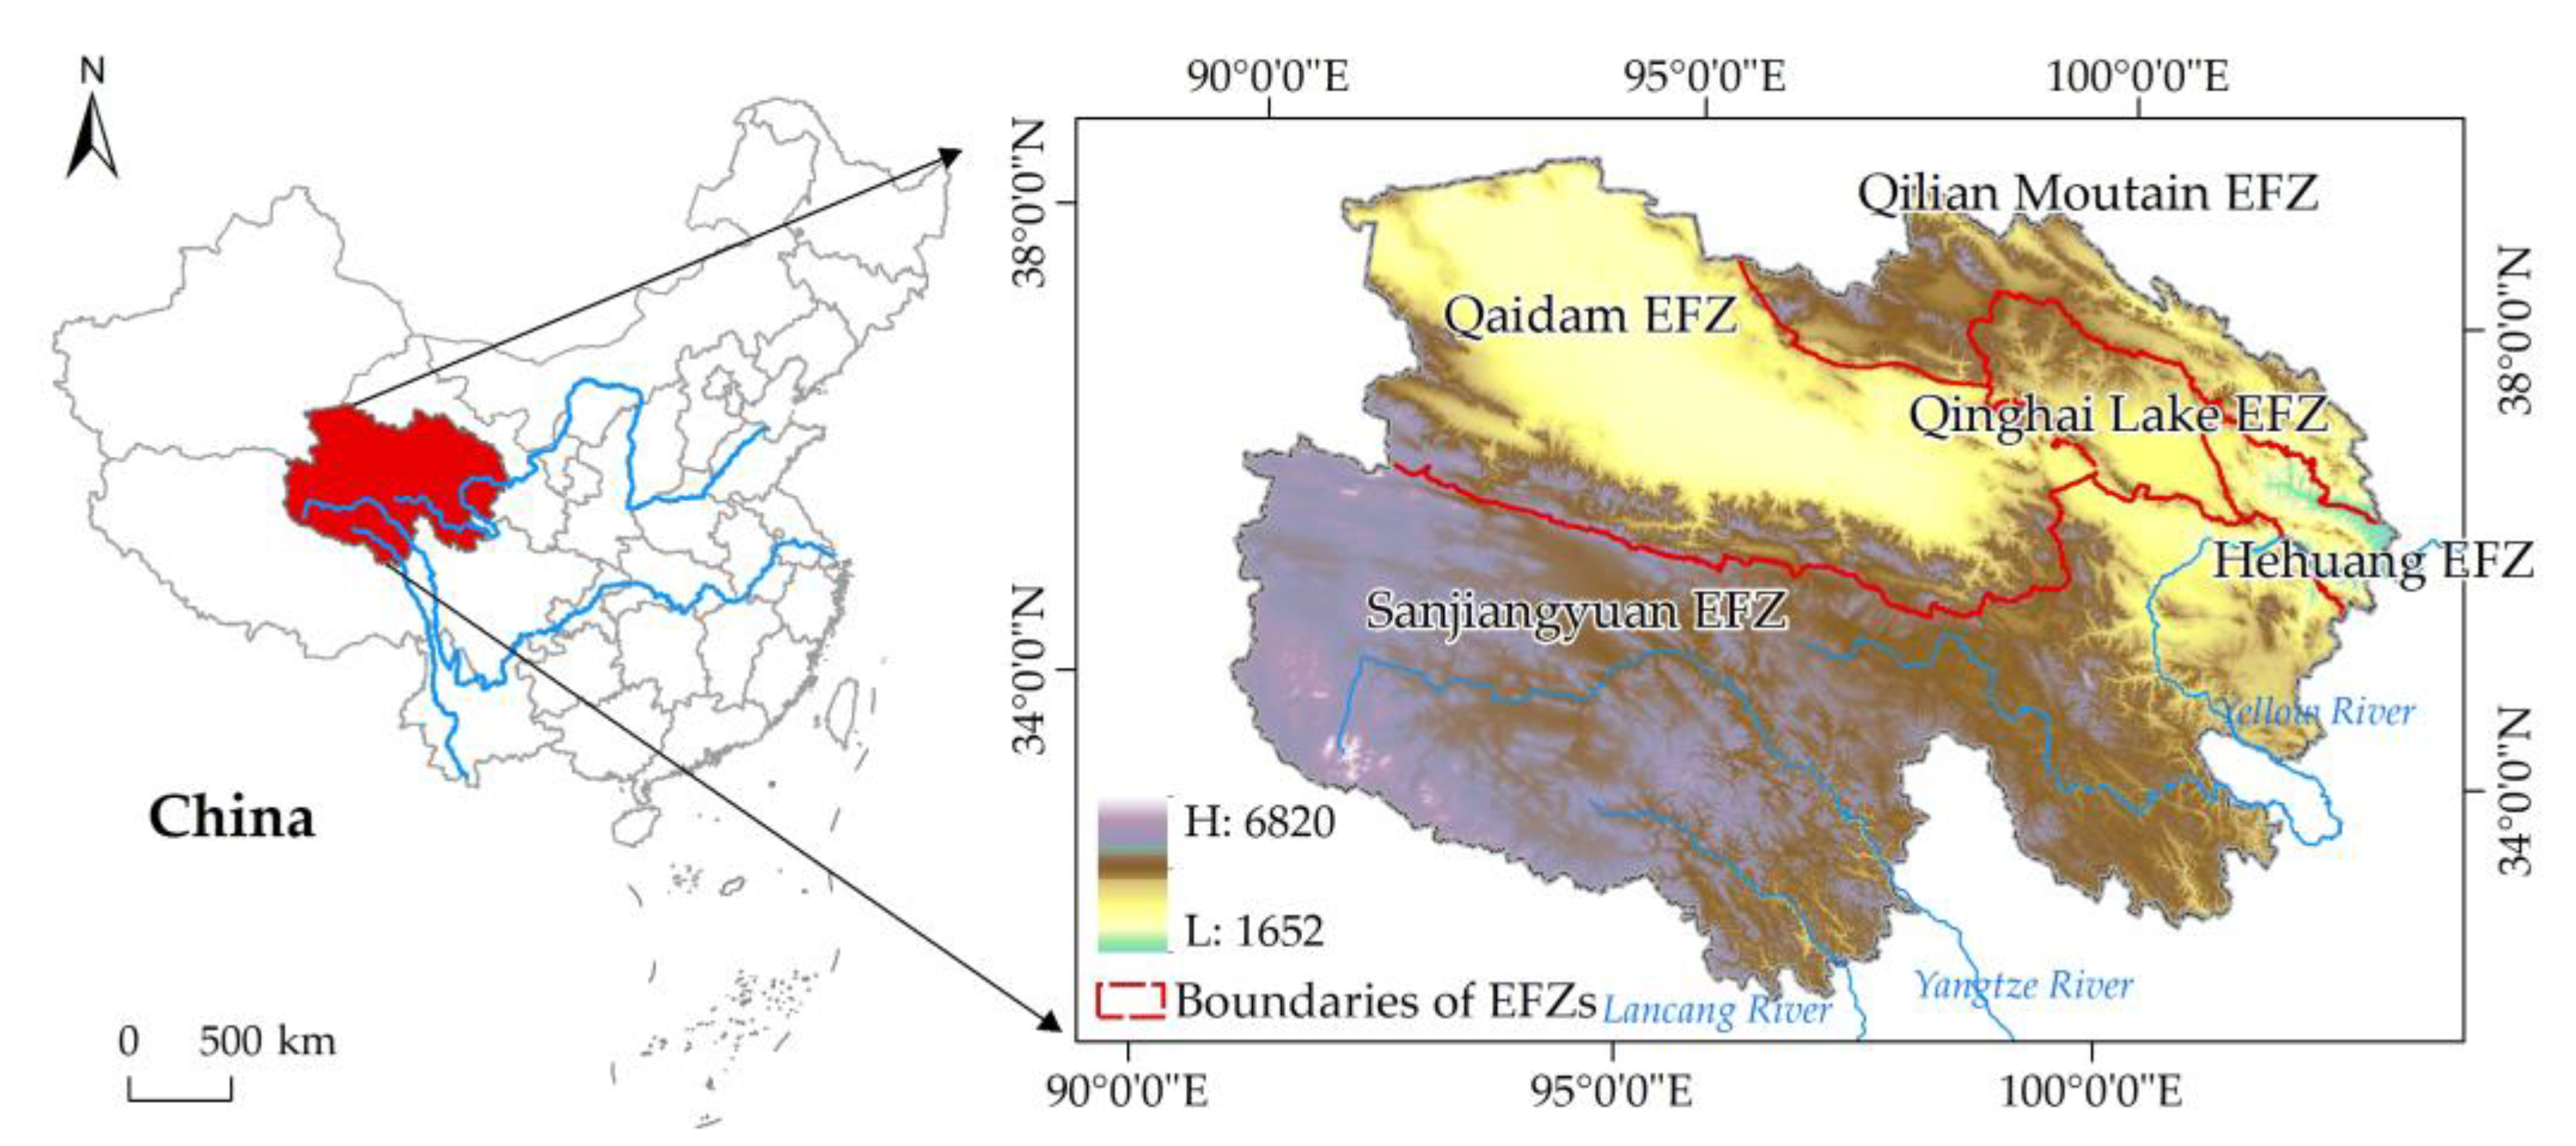
2.1. Study Area

Qinghai Province is located in western China, and the northeastern part of the Qinghai-Tibet Plateau, with a total area of about 72.23 million ha. It has a highland continental climate, with a wide variety of landforms and complex topography. The elevation ranges from 1652 to 6820 m, with the southwest area higher than the northwest and southeast. On the western side of Qinghai Province, population growth and economic development is slower, while in the east the opposite is true. The “13th Five-Year Plan” divides the province into five EFZs based on the positioning of ecological functions in different regions, namely the Sanjiangyuan EFZ, Qilian Mountains EFZ, Qinghai Lake EFZ, Hehuang EFZ and Qaidam EFZ (Figure 1). The aim is to enhance the ecological functions and stability of natural ecosystems in grasslands, forests, wetlands, glaciers, rivers and lakes, and deserts, with a focus on the “Five Ecological Zones”. Grassland and barren land are the main types of land use in Qinghai Province. In addition, grassland is mainly distributed in the Sanjiangyuan EFZ, forest land is mainly distributed in the Qilian Mountains EFZ, farmland is mainly distributed in the Hehuang EFZ and the Qilian Mountains EFZ, water is mainly distributed in the Qinghai Lake EFZ and the Sanjiangyuan EFZ, barren land is mainly distributed in the Qaidam EFZ, and glacier and snow is mainly distributed in the Sanjiangyuan EFZ.
The Sanjiangyuan EFZ Is located in the hinterland of the Qinghai-Tibet Plateau, covering 21 counties (including Tanggula town) and 54.17% of the area of the province, including China’s largest national park—Sanjiangyuan National Park. The alpine meadow-dominated ecosystem of this EFZ is regarded as a unique and typical region of the global ecosystem. The Yangtze, Yellow and Lancang rivers all originate here. It was established to maintain and enhance the functions of water conservation and biodiversity conservation. The Qilian Mountains EFZ is located in the northeastern part of Qinghai Province, and is a water-conserving ecological function area and ecological security barrier in the northwest of China. It has vast forest resources, and plays an important role in biodiversity conservation and ensuring ecological security. The Qinghai Lake EFZ plays an important role in maintaining the ecological security of the northeastern Qinghai-Tibet Plateau. It is rich in natural and humanistic landscapes, and is the concentrated expression of the natural ecology and culture of the third pole Qinghai-Tibet Plateau. Hehuang EFZ is located in the eastern part of Qinghai Province. It is the population, economic and political centre of Qinghai Province, and the green development of the Yellow River Basin plays an important role. The Qaidam EFZ is located in the northwestern part of Qinghai Province and is an important water conservation area, a clean energy production base, and a key region for wind and sand control. It was established to restore grassland and develop solar-thermal resources.
Qinghai Province has formulated many policies for these EFZs, and the first major scientific research project of ecological civilization is based on the EFZs at the level of a case study. Therefore, it is of great practical importance to conduct research on the value of ecosystem services in Qinghai Province at the scale of EFZs, which is an ideal scale for research.

2.2. Methods

To reveal the response of ESV on LUCC, first, we calculated LUCC for each ecological function area; we then estimated the spatiotemporal variations of ESV based on the equivalent factor method of EFZs from 1980 to 2020. We then quantified the elasticity of each ESV to LUCC, and presented the spatial and temporal distribution of ESV and its elasticity to LUCC on a 5 × 5 km grid using ArcGIS 10.4 software. Finally, G* index model was applied to explore the spatial patterns of the elasticity of ESV.

2.2.1. Assignment of ESVs

In this study, the ESV of Qinghai Province was assessed based on the method proposed by Xie. Xie et al. provided the latest revised equivalent coefficients table, based on the previous studies and multiple methods in 2017 [5]. It contains six primary ecosystem classifications with 14 secondary ecosystem classifications, and the equivalent factors were selected according to the actual situation of Qinghai Province. The unit area value equivalent factor method was used, in which the economic value of an ESV equivalent factor is approximately equal to 1/7 of the average grain market value of the year [4]. Many scholars have used the equivalence factor approach to study the impact of ecosystem services to LUCC. The value of ecosystem service function per unit area of various types of ecosystems was also combined. This method has been widely used in ESV evaluation for different regions. The annual planting area, unit yield, and average price of main crops (wheat, corn, highland barley, beans, and potato) in Qinghai Province from 1980 to 2020 were selected. The economic value of grain crops per unit area of farmland ecosystem in Qinghai Province was calculated to be 1008.21 yuan/ha using Equation (1), and the ESV equivalent table per unit area of Qinghai Province was obtained (Table 1).
V C = 1 7 i = 1 m o i p i q i M
where VC represents the economic value of grain crops per unit area of farmland in Qinghai Province, oi represents the planting area of i grain crops, pi represents the yield of i grain crops, qi represents the average price of i grain crops, and M represents the total planting area of three grain crops.
The ESV of the study area will be affected by local economic factors, and it is thus necessary to select appropriate economic parameters to correct the calculation results. Residents’ willingness and ability to pay for local ecosystems will strongly affect the ESV of the study area [43,44,45,46]. Therefore, residents’ ability and willingness to pay were integrated into the calculation of ESV (Equations (2)–(5)).
E S V = i = 1 n ( V i × A i × C )
C = P ( A b i l i t y   t o   p a y   f o r   E S V ) × W ( W i l l i n g n e s s   t o   p a y   f o r   E S V )
where Vi and Ai represent the ESV equivalent (yuan/ha) and area of land type i, respectively, and C is the correction coefficient.
P = G D P s p G D P c p
W = 2 1 + e ( 1 E n u × U + E n r × R 2.5 )
The level of social and economic development can affect residents’ payment capacity for ecosystems. The ratio of the per-capita GDP of Qinghai Province in 2020 to the national per-capita GDP was used as one of the correction coefficients. In addition, the structure of consumer spending can influence the willingness to pay for ES. Using Engel’s coefficient of urban and rural residents in the study area and referring to previous studies, residents’ willingness to pay for ES was calculated [40]. Product C of the two variables was taken as the correction coefficient of ESV. GDPsp and GDPcp represent the per-capita GDP of Qinghai Province and China, respectively. Enu and Enr represent Engel’s coefficient of urban and rural areas in Qinghai Province, respectively. U and R represent the proportion of the urban and rural population in the total population of Qinghai Province in 2020.

2.2.2. Elasticity of ESV Change in Relation to LUCC

Elasticity represents interrelated elements, that is, the degree to which one element responds to a change in another element. Song et al. (2017) proposed an elasticity model for ESV and land use change (Equations (6) and (7)), drawing on the concept of elasticity [16,25]. The model can calculate how each 1% change in LUCC will impact ESV, the higher index, and the higher sensitivity of ecological services to LUCC.
E E L = | ( E S V e n d E S V s t a r t ) / E S V s t a r t × 1 T × 100 % L C P |
L C P = i = 1 7 Δ L U C t i i = 1 7 L U t i × 1 t × 100 %
where EEL is the elasticity index (%); ESVstart and ESVend represent the ESV at the beginning and end of the study period respectively; LCP stands for combined LUCC intensity (%); ΔLUCti represents the converted area of land use type i during the study period, and LUti represents the initial area of land type i.

2.2.3. Hot Spot Analysis (G* Index)

Hot spot analysis (G* index) can be utilized to explore whether the elasticity of ESV spatial change shows high-value agglomeration (hot spot) or low-value agglomeration [47,48]. It can also ascertain the spatial agglomeration of high-value and low-value zones. The hot spot analysis (G* index) was completed in ArcGIS 10.41, selecting cold and hot spots that were statistically significant and had a confidence level greater than 90%.
If the change in the elasticity of ESV is much higher than in the surrounding area, it is a statistically hot spot, called a hot spot of elasticity added, indicating a significant increase in ESV response to LUCC in this region. In contrast, a statistically significant cold point, known as the cold point of loss of ESV elasticity value, is when the change in ESV elasticity within a range is much lower than in the surrounding area, indicating a significant decrease in ESV response to LUCC in this region.

2.3. Data Sources

The land use data (30 m resolution) were obtained from the Chinese Academy of Sciences, Resources and Environment Science and Data Center. The land use types consisted of seven class I types: farmland, forest land, grassland, water bodies, built-up land, barren land, and glacier and snow. The socioeconomic data were taken from the China Agricultural Product Price Survey Yearbook and Qinghai Statistical Yearbook (highland barley prices were drawn from the internet).

3. Results

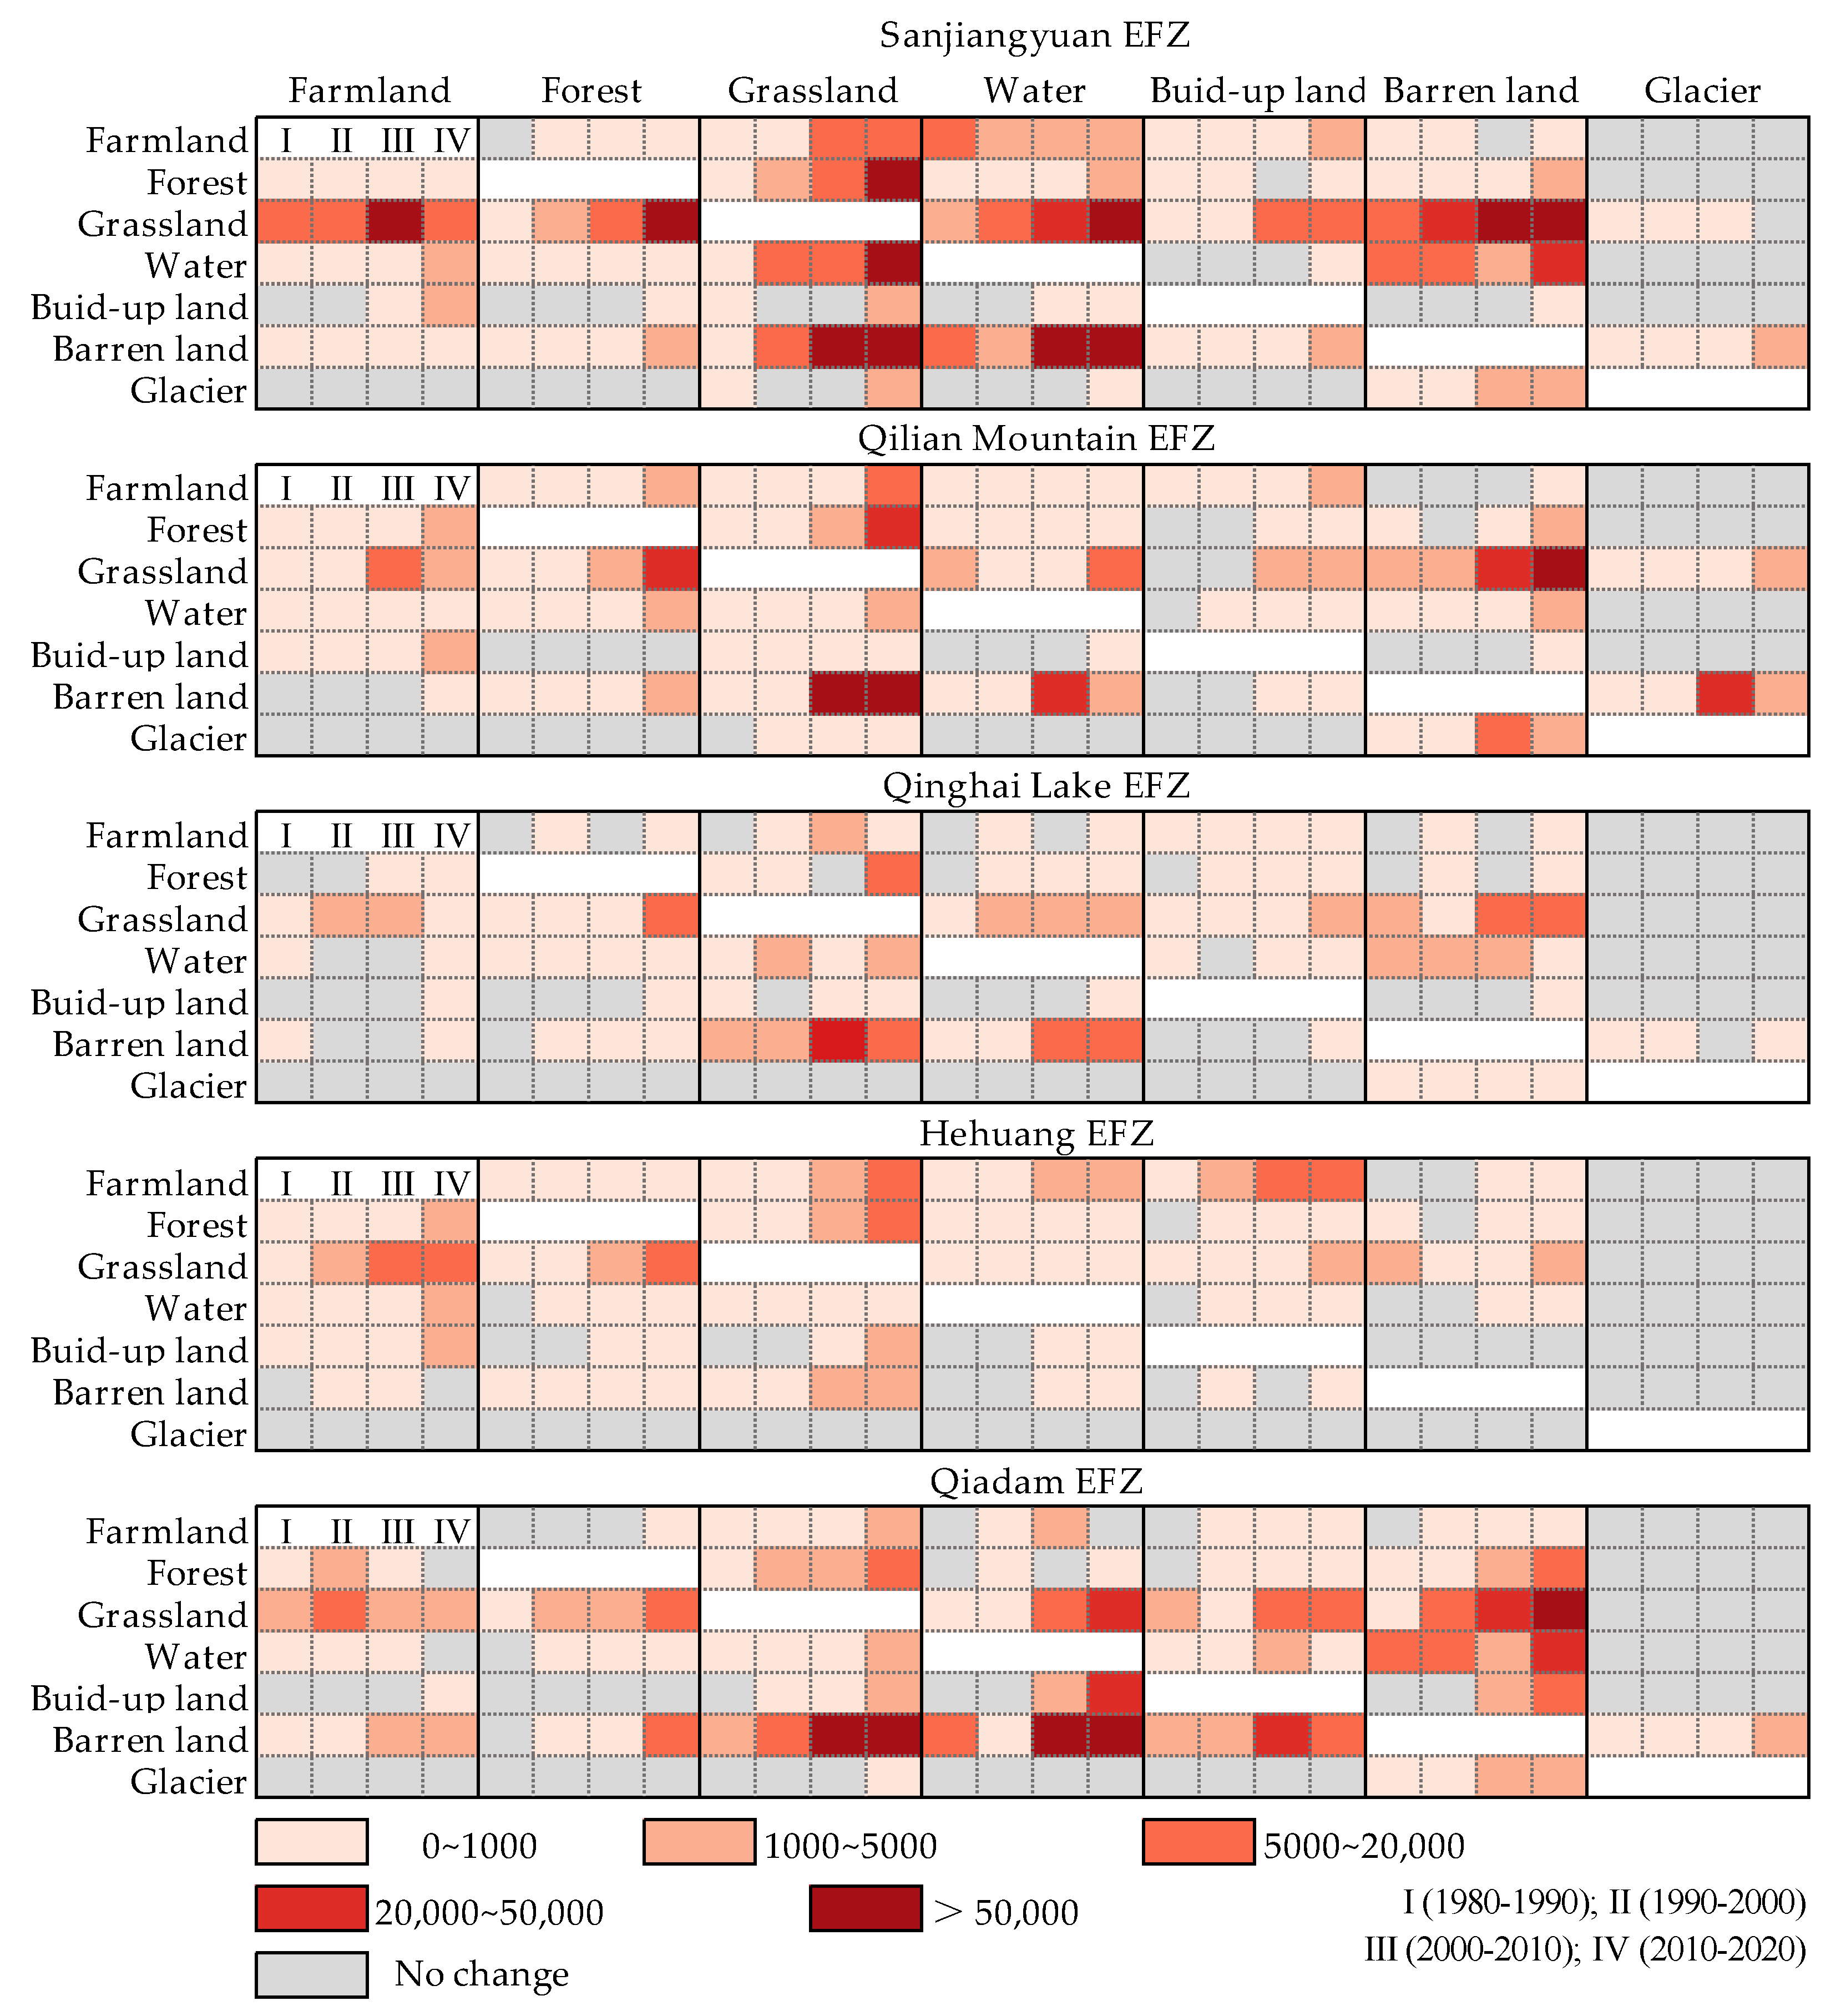
3.1. LUCC Patterns of Qinghai Province

The type of land use in Qinghai Province was mainly grassland, with 37.31 million ha and 39.14 million ha of grassland covered in 1980 and 2020 (Figure 2). Built-up land increased from 85,100 ha in 1980 to 160,800 ha in 2020, an increase of 88.78%, the most rapid growth among all land use types. This was followed by water bodies, farmland, glacial snow and grassland, with increases of 21.34%, 9.6%, 7.42% and 4.89% respectively, while barren land and forest decreased by 9.6% and 0.65% respectively.
There 69.73% of grassland, 63.25% of glacial snow, 58.94% of water and 56.13% of the forest in Qinghai Province are distributed in the Sanjiangyuan EFZ, 57.68% of barren land and 38.37% of farmland are distributed in the Qaidam EFZ and Hehuang EFZ. From 1980 to 2020, both built-up land and water area increased in each EFZ, with the Qaidam EFZ showing the fastest growth rate (3.42% and 2.16% per annum). Hehuang EFZ had the largest reduction in farmland (−0.02% per annum). It is noteworthy that farmland, forest and grassland all showed a decrease in each EFZ from 2010 to 2020.
Compared to the traditional land use transfer matrix, the cross-columned chain table presentation allows for a more intuitive observation of the intensity of LUCC (Figure 3). The four time periods 1980–1990, 1990–2000, 2000–2010 and 2010–2020 are represented by I, II, III and IV, respectively. The darker the colour, the more area of conversion between different land use types.
The LUCC of EFZs in Qinghai Province from 1980 to 2000 is relatively stable, with conversions of areas larger than 50,000 ha occurring mainly during the period 2000–2020. Due to the melting of glacial snow, the Qilian Mountains EFZ, Sanjiangyuan EFZ and Qaidam EFZ all experienced the conversion of glacier and snow to barren land from 1980 to 2020, reaching 980 ha, 6880 ha and 7580 ha, respectively. Melting glaciers have increased the area of lakes, and the expansion of water bodies in the Sanjiangyuan, Qaidam and Qilian Mountains EFZs, amounting to 328,030 ha, 260,660 ha and 425,020 ha respectively. The largest area of conversion occurred between grassland and barren land, with approximately 2.7 million ha of barren land in nature reserves in the western Sanjiangyuan EFZ and southern Qaidam EFZ. However, the eastern part of the Sanjiangyuan and Qaidam EFZ had seen a large amount of grassland degraded, with approximately 0.61 million ha of grassland converted to barren land, and the spatial distribution is mainly in the southeast, where human activities are intensive. Overall, the restoration of grassland in nature reserves and the degradation of grassland in regions of human activity can be seen. The rapid socio-economic development of Qinghai Province led to the rapid expansion of build-up land, especially after 2000, resulting mainly from the expansion of occupied farmland mainly in the Hehuang EFZ (16,100 ha), occupied grassland mainly in the Sanjiangyuan EFZ (20,540 ha), and occupied barren land mainly in the Qaidam EFZ (56,930 ha).

3.2. Figures, Tables and Schemes

3.2.1. Spatial Pattern of ESV in Qinghai Province

The ESVs of Qinghai Province in 1980, 1990, 2000, 2010, and 2020 were 822.56 billion yuan, 822.15 billion yuan, 819.9 billion yuan, 868.62 billion yuan, and 905.78 billion yuan, respectively, with a trend of a decrease followed by an increase. Using a 5 km × 5 km grid to spatially visualize the ESV in Qinghai Province (Figure 4), it can be seen that the ESV in Qinghai Province from 1980 to 2020 exhibits a clear spatial distribution characteristic of recording high levels in the southeast and low levels in the northwest. The high ESV areas in Qinghai Province increased significantly in the central Qaidam EFZ and the western part of the Sanjiangyuan EFZ, while the low-value areas decreased in the eastern and southern margins of the Qaidam EFZ. Table 2 shows the changes in the ESV of each EFZ. It can be seen that ESV has increased at different rates in different EFZs from 1980 to 2020, among which the ESV of Qaidam EFZ increased the fastest (24.46%).
The value of farmland in the Sanjiangyuan EFZ grew the fastest (19.1%), followed by the value of water (13.43%), while the value of barren land, glacier and snow, and forest showed declines (−20.11%, −0.96% and −0.4%). The value of glacier and snow in Qilian Mountains EFZ grew the fastest (90.52%) but declined after 2010, due to the effects of climate change. The grassland value of Qinghai Lake EFZ grew the fastest (20.19%). The value of water and farmland in Qaidam EFZ grew the fastest (98.71% and 46.49%, respectively); however, other land types showed a decline in value (−5.34%, −1.94%, −1.7%, and −0.41%).

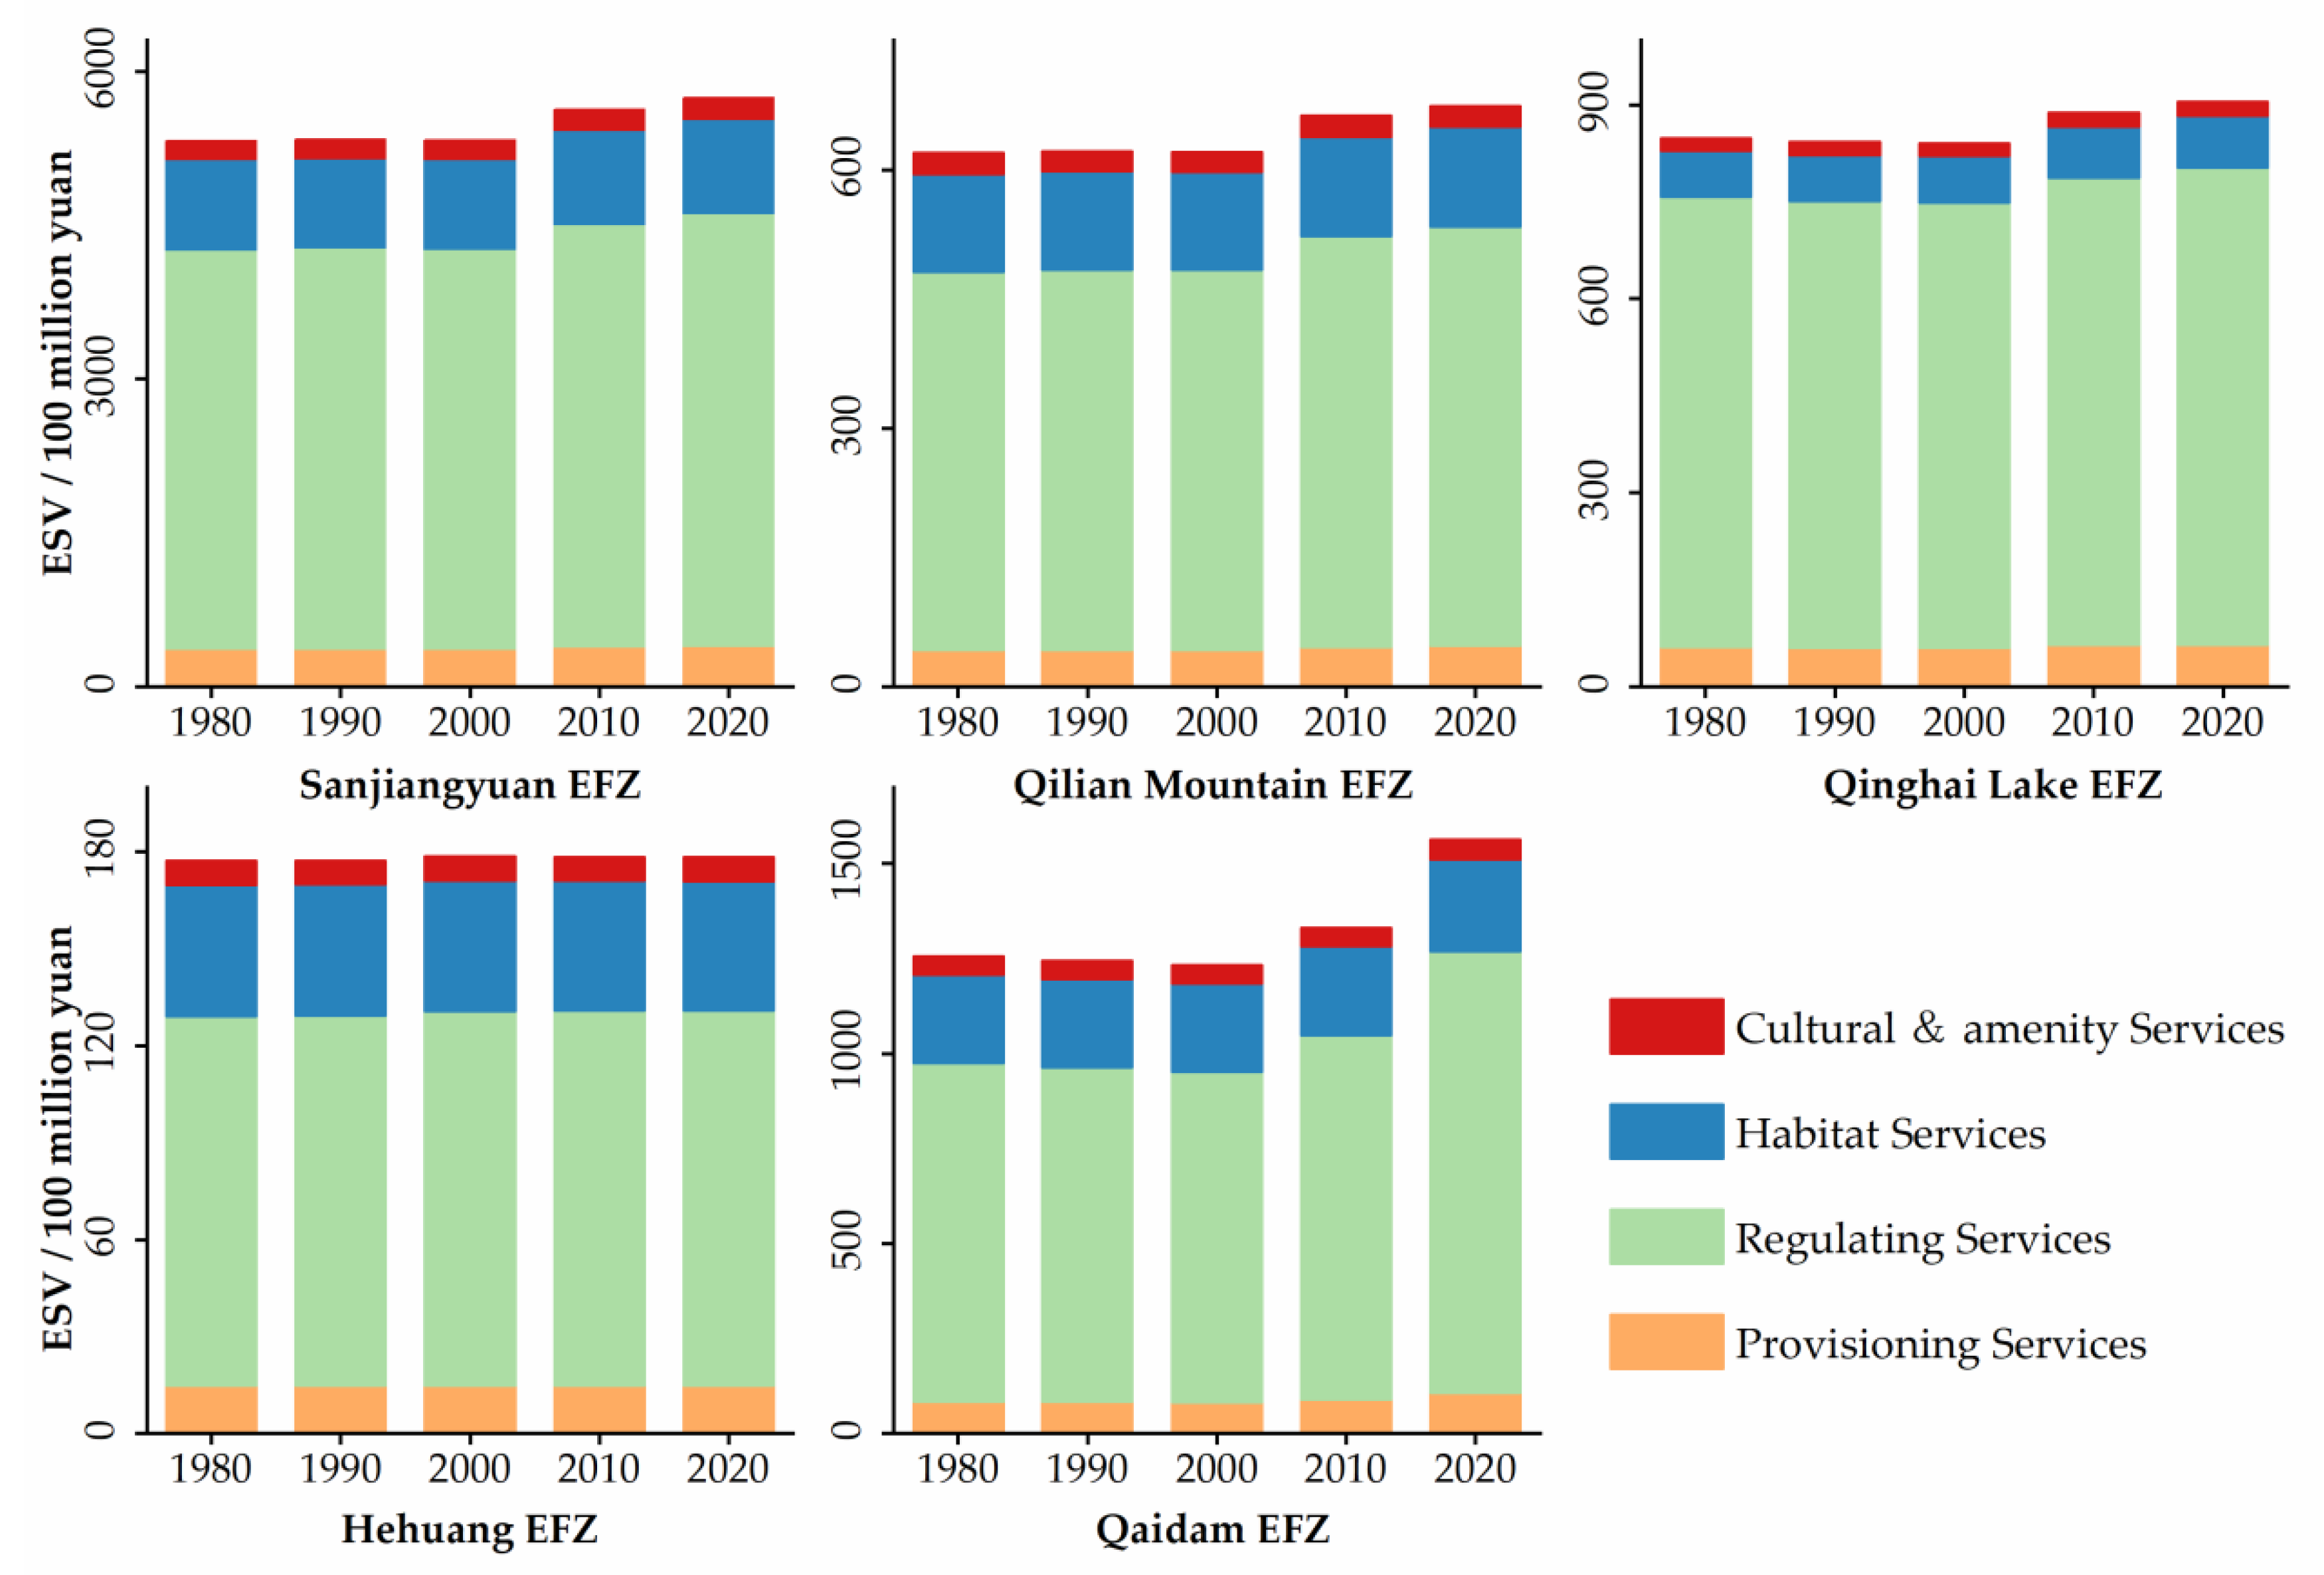
3.2.2. Structure of ESV in Different EFZs

Regulating services account for the highest proportion of ecosystem services in each EFZ, followed by habitat services, provisioning services and cultural services, with regulating services accounting for the largest proportion in the Qinghai Lake EFZ, and provisioning services and habitat services accounting for the largest proportion in the Hehuang EFZ (Figure 5). In general, all services performed in a stable manner across EFZs from 1980 to 2020. The regulating services and habitat services showed an increasing trend in all EFZs. Sanjiangyuan EFZ had the largest growth in regulating services (32.625 billion yuan), followed by the Qaidam EFZ (27.2 billion yuan), while Hehuang EFZ saw a decrease in habitat services and cultural services (−0.36 billion yuan and −0.04 billion yuan).
From 1980 to 2020, only Hehuang EFZ showed a decline in the value of most ESs, while other EFZs showed an increasing trend in the value of ESs (Table 3). The Qinghai Lake EFZ had the highest growth rate of materials production, air quality regulation, climate regulation, erosion prevention, maintenance of soil fertility and cultural and amenity services. The Qaidam EFZ had the highest growth rate of food production, water production, waste treatment and regulation of water flows.
Regulation of water flows and climate regulation are the most important ecosystem services in the Sanjiangyuan EFZ, accounting for 42.12% and 17.16%, with the increasing 10.67% and 5.43% respectively from 1980 to 2020. Regulation of water flows and climate regulation are the most important ecosystem services in Qilian Mountains EFZ, accounting for 36.91% and 18.87%, and recording increases of 19.5% and 1.38% respectively, with water production growing at the fastest rate of 22.41%. Regulation of water flows is the most important ecosystem service in the Qinghai Lake EFZ, accounting for 64.39%, with climate regulation services growing at the fastest rate of 14.35%. Regulation of water flows and climate regulation are the most important ecosystem services in the Hehuang EFZ, accounting for 24.04% and 23.27%, but climate regulation decreases by 0.96% from 1980 to 2020. Climate regulation is the most important ecosystem service in the Qaidam EFZ, accounting for 17.34%, with water production and regulation of water flows growing at the fastest rate, recording 54.08% and 56.96%, respectively.

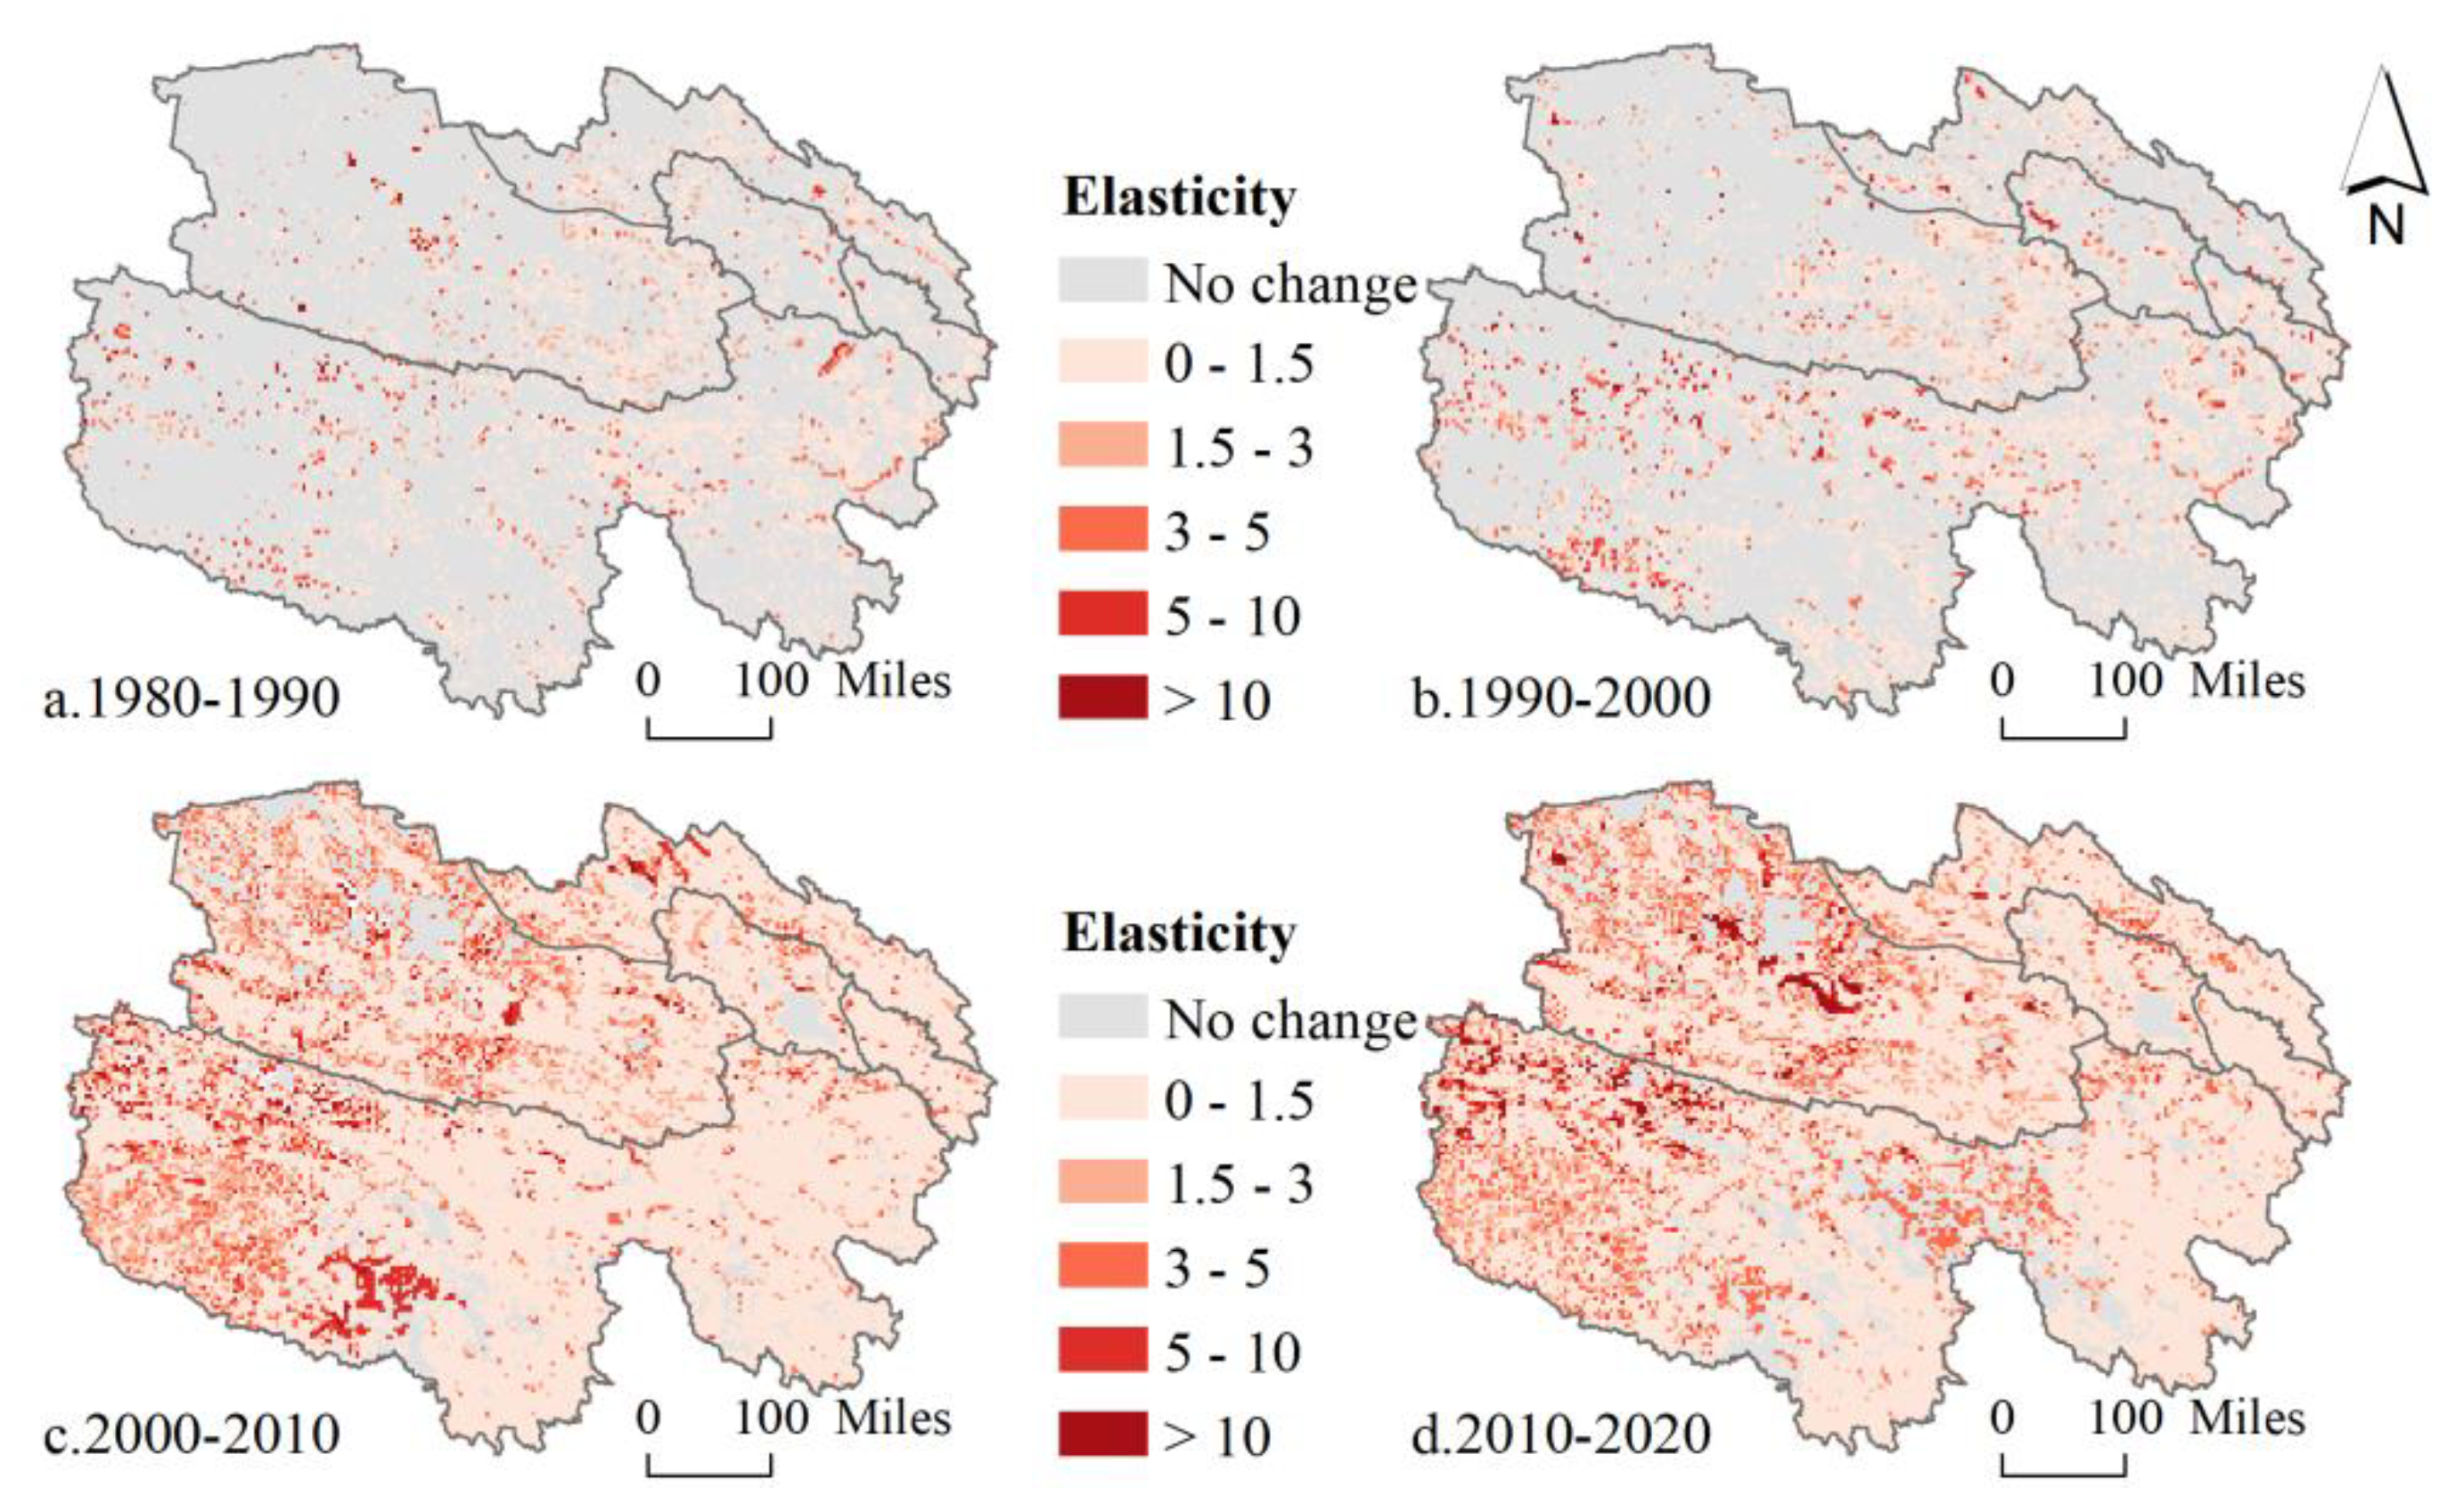
3.3. Elasticity of Ecosystem Service Change with Respect to LUCC

The elasticity index of ESV to land use change is calculated for each EFZ based on Equations (6) and (7) (Table 4). On the one hand, the highest elasticity of ESV is Qaidam EFZ with 4.78%, indicating that conversion of 1% of land area would result in an average change of 4.78% in ESV, followed by the Sanjiangyuan EFZ (2.56%), Qilian Mountains EFZ (2.1%), and Qinghai Lake EFZ (1.01%), while Hehuang EFZ has the lowest elasticity index (0.53%). On the other hand, the elasticity of ESV in EFZs all show a decreasing trend, with the highest decrease of Qilian Mountains EFZ, Indicating that the response of ESV to LUCC decreases over time in each EFZ.
The spatial distribution of the elasticity index varies significantly, showing high values in the west and low values in the east, and the distribution of high-value areas gradually expands (Figure 6). Among them, in 1980–1990 and 1990–2000, the elasticity of ESV varied less in spatial distribution, and the elasticity index of 0–1.5 is mainly distributed contiguously in the eastern part of Qinghai Province and expanded contiguously in the central and eastern parts of the Sanjiangyuan EFZ and Qaidam EFZ. Values greater than 3 are mainly scattered in the western part of the Sanjiangyuan EFZ and the northwestern of the Qaidam EFZ, and a value greater than 10 occurs in the Sanjiangyuan EFZ, Qinghai Lake EFZ and Hehuang EFZ, with scattered distribution characteristics. In the periods 2000–2010 and 2010–2020, the elasticity of ESV shows a clear distribution characteristic of low in the east and high in the west, with values greater than 3 gradually expanding from west to east, especially in the central part of the Sanjiangyuan EFZ and Qaidam EFZ.
In Qinghai Province, the relatively high elasticity of the ESV change to LUCC can be attributed to climate change and reclamation [49]. Climate change caused soil erosion and the drying-up of water from 1980 to 1990 had the greatest impact in the Qaidam EFZ, where the drying-up led to the conversion of water to barren land, amounting to 15,640 ha. The conversion of grassland and water to barren land in Sanjiangyuan EFZ reached 11,010 ha and 830 ha, respectively. Moreover, the government of Qinghai Province has encouraged development in western areas and a great many farmers and educated youth have migrated into Qaidam EFZ since 1990. This drastically increased population has led to a sharp rise in the reclamation of farmland, with a total of 11,070 ha of grassland converted to farmland. LUCCs in these areas has resulted in a great deal of water drying up, grassland degeneration, and reclamation, which have substantially decreased ESV.
From 2000 to 2020, the high value of ESV elasticity is concentrated in the western part of the Sanjiangyuan EFZ and gradually spreads eastwards. Since the establishment of the Sanjiangyuan Nature Reserve in 2000, the policies of ecological migration and restricted overgrazing have led to effective protection of grassland, with 2.21 million ha of barren land converted to grassland. In addition, the expansion of the water area in the central part of the Qaidam EFZ has led to a rapid increase in ESV and the existence of contiguous zones of high elasticity. However, as the Qaidam EFZ is the industrial centre of Qinghai Province, companies such as Salt Lake Chemical, Special Steel and Western Mining are located there, which leads to a sharp increase in built-up land in the area, and then impacts the response of ESV to LUCC.
Cold spots indicate a significant decrease in the sensitivity of ESV to LUCC in the region, and hot spots indicate a significant increase in the sensitivity of ESV to LUCC in the region. Both of them show a tendency to change from fragmented to concentrated distribution (Figure 7). During 1980–2000 (Figure 7a), the cold spots for the elasticity of ESV changes were mainly distributed in eastern and western Sanjiangyuan EFZ, northwestern Qaidam EFZ, and eastern Qilian Mountains EFZ. The hot spot was widely distributed in all EFZs. From 2000–2020 (Figure 7b), the cold spots for the elasticity of ESV changes were mainly distributed in southwestern Sanjiangyuan EFZ, northwestern Qilian Mountains EFZ and Qinghai Lake EFZ. Compared to 1980–2000, the change in the spatial distribution of cold spots and hot spots from 2000 to 2020 shows a clear agglomeration pattern.
The areas where ESV changes were most sensitive to LUCC were mainly those exhibiting increases from low to high ESV values, especially in western Qinghai Province. The high elasticity means that small changes in LUCC can lead to large changes in ESV, and the hotspots are gradually clustering in the west, suggesting that the trend will continue to deepen.

4. Discussion

4.1. Impacts of LUCC Conversion on ESV Change

ESV is the quantification of ecosystem services, which can provide reference and information for decision-makers to formulate ecological conservation planning and management, and promote the harmony and sustainable development of nature and people [50]. During the study period, built-up land, water, farmland, glacial snow and grassland in Qinghai Province continued to grow, while barren land and forest land were decreased, and the total ESV of Qinghai Province showed an increasing trend, which is consistent with the results of other studies [40,51]. In terms of ESV, the largest contribution to ecological services in Qinghai Province is made by Sanjiangyuan EFZ and Qaidam EFZ, followed by Qinghai Lake EFZ and Qilian Mountains EFZ, with the smallest contribution from the Hehuang EFZ. In terms of the spatial distribution of the ESV, it is generally consistent with previous studies [21,40]. We found that the largest net increase in ESV was caused by the expansion of the water and grasslands areas (Table 5). The expansion of water takes up a lot of barren land around the coast, mainly due to global warming, which leads to increased precipitation and the melting of snow from glaciers, resulting in an expansion of the area of the water [52,53,54,55,56,57]. The net increase in total ESV was 62.63 billion yuan, due to the expansion of water occupying barren land along the coast from 1980–2020, including a net increase of 31.24 billion yuan in ESV in the Qaidam EFZ and a net increase of 24.807 billion yuan in the Sanjiangyuan EFZ. The expansion of grassland is another major reason for the increase in total ESV, with a large amount of barren land converted to grassland bringing a net increase of 32.037 billion yuan in ESV, including a net increase of 23.19 billion yuan in the Sanjiangyuan EFZ, followed by a net increase of 3.77 billion yuan in the Qinghai Lake EFZ. This is consistent with the findings of other studies examining the region [58,59]. Sanjiangyuan EFZ and Qinghai Lake EFZ are the main livestock breeding areas in Qinghai Province, which have been affected by climate change and restricted grazing policies in recent years [60,61]. Climate change has restored much of the grassland, and in recent years, as a result of nature reserve policies, grazing has been restricted in most areas, thus slowing degradation. The expansion of existing lakes and pasture recovery accounted for the largest increase in ESV, especially in the central and western parts of the Sanjiangyuan EFZ and the western part of the Qinghai Lake EFZ.
In Qinghai Province, grassland and water are the main sources of ESV, accounting for over 70% of the area. The influences of grassland degeneration and water drying up have the greatest impact on ecosystem services in each EFZ. Water drying up and degradation of grassland for Qinghai Province respectively caused an ESV net loss of 14.59 billion yuan and 10.65 billion yuan from 1980–2020. These were followed by farmland reclamation and urban construction (net loss of 2.14 billion yuan and 1.67 billion yuan, respectively) (Table 5). The water drying up resulted in an ESV net loss of 6.80 billion yuan and 6.12 billion yuan in the Qaidam EFZ and the Sanjiangyuan EFZ, respectively. Grassland degradation resulted in an ESV net loss of 6.38 billion yuan, 2.72 billion yuan and 1.21 billion yuan in Sanjiangyuan EFZ, Qaidam EFZ and Qilianshan EFZ, respectively. The farmland reclamation resulted in an ESV net loss of 1.09 billion yuan in Sanjiangyuan EFZ. The greatest impact of urban expansion on the ESV of Qaidam EFZ resulted in a net loss of 0.86 billion yuan.
Additionally, the ecological safety barrier, ecological protection and ecological civilization in Qinghai Province are of vital importance. Over the decades, environmental protection measures such as returning farmland to forest, limiting overgrazing and protecting water resources have been implemented in Qinghai Province. Here, we list three types of LUCC that can lead to ESV increase, namely pasture recovery, returning farmland to forest, and water expansion, to evaluate the effectiveness. Water expansion and pasture recovery made the largest contributions to ESV growth in Qinghai Province from 1980–2020, reaching 62.63 billion yuan and 32.04 billion yuan respectively, while returning farmland to forest only 0.04 billion yuan to ESV.
During the period 1980–2000, the conversion of water to barren land resulted in an ESV net loss of 2.12 billion yuan and 0.81 billion yuan in Qaidam EFZ and Qinghai Lake EFZ, respectively, and the net loss that resulted from conversions from grassland to other land types was also substantial, with values of 0.54 billion yuan and 0.19 billion yuan in Sanjiangyuan EFZ and Qaidam EFZ. In this period, it may be the urbanization of the Qaidam EFZ caused a net loss of more than 100 million yuan in ESV. This is mainly due to the fact that the Qaidam Basin is rich in mineral resources, and after extensive exploitation of resources such as potash, oil and asbestos late last century, resource-based cities such as Golmud and Delingha, as well as Dachaidan town, were built, and rapid urbanization and rough excavation of resources damaged the local ecological environment. During the period 2000–2020, the establishment of the Sanjiangyuan and Qilian Nature Reserves, and the implementation of strict ecological protection policies such as returning farmland to forest and grasses, and restricting overgrazing, meant ESV had increased in different EFZs except for Hehuang EFZ. The expansion of water and grassland was the most significant feature of the LUCC. The net increase in ESV in the Qaidam EFZ was 30.08 billion yuan, in Sanjiangyuan EFZ 22.69 billion yuan, in Qilian Mountains EFZ 3.72 billion yuan, in Qinghai Lake EFZ 2.72 billion yuan, and in Hehuang EFZ, 0.02 billion yuan.

4.2. Response of ESV to Land Conversion

Song et al. created a model of ESV response to land use change to explore the response of ESV to LUCC, and found that northwest China (including Qinghai Province) was a highly sensitive region for the response of ESV to LUCC [20]. Han et al. found that the response of ESV to LUCC from a province-wide perspective showed an increasing trend in the periods 1988–1998 and 1998–2008, and conducted a corresponding study at the county scale [40]. In this study, we have chosen to look at the five ecological functional areas and extend the study period to 2020. The results showed that different EFZs show different elastic changes and spatial distribution characteristics during the study period. In terms of the average ESV elasticity to LUCC, the Qaidam EFZ has the highest elasticity of 4.78%, followed by the Sanjiangyuan EFZ and Qilian Mountains EFZ at 2.56% and 2.1% respectively, and the Qinghai Lake EFZ and Hehuang EFZ have the lowest elasticities, recording 1.01% and 0.53% respectively. The elasticity of ESV to LUCC was highest in the Qaidam EFZ between 1980 and 2000, and increased substantially in the Sanjiangyuan EFZ and the Hehuang EFZ, while the rest of the EFZs showed a decreasing trend of elasticity during this period. However, due to the different natural environmental conditions and socio-economic development of different EFZs, the reasons for changes in the degree of resilience vary. A large amount of grassland in the Sanjiangyuan EFZ and Qaidam EFZ has been converted to barren land, resulting in a decrease in ESV, while the Hehuang EFZ is densely populated and the rapid social and economic development after reform and opening-up has brought about an increase in the rate of urbanization, with a large amount of farmland around towns being occupied as construction land, resulting in a decrease in ESV. From 2000 to 2020, the elasticity of the Sanjiangyuan EFZ, Qinghai Lake EFZ and Hehuang EFZ increased slightly, while the elasticity of the Qaidam EFZ and Qilian Mountains EFZ showed a decreasing trend. The highest elasticity of ESV in this period is found in the western part of the Sanjiangyuan EFZ and the central part of the Qaidam EFZ (Figure 6d), with the expansion of water and the restoration of grasslands bringing an increase in ESV. These regions are less disturbed by humans, and LUCC is dominated by conversion between grassland, barren land and water. These ecosystems have a greater impact on ecological value per unit area, and are more sensitive. The elasticity of the Hehuang EFZ and Qinghai Lake EFZ was higher during this period, mainly related to the unevenly distributed socio-economics of Qinghai Province. Hehuang EFZ is the political and economic centre of Qinghai Province, and population concentration and rapid socio-economic development have brought about the rapid development of urbanization, with a large amount of arable land and grassland occupied by built-up land. The continued reduction of ESV in this region and the increased degree of elasticity to LUCC suggested that conflicts between socio-economic development and ecosystems are on the rise in the region. The Qinghai Lake EFZ has gradually become a national tourism hotspot in recent years, with Chaika Salt Lake and Qinghai Lake able to attract a large number of tourists from across the country each year, resulting in the accelerated construction of towns around the scenic area, such as the Erlangjian scenic area, Chaika town and Shinahai town.

4.3. Protection Policies for Regions Especially Sensitive to LUCC

In descending order, the elasticity of the ESV response to LUCC is classified as Qaidam EFZ, Sanjiangyuan EFZ, Qilian Mountains EFZ, Qinghai Lake EFZ and Hehuang EFZ. The elasticity of ESV gradually decreases between 1980 and 2020 in each EFZ. The spatial distribution of the elasticity varies significantly, showing a clear spatial distribution of high values in the west and low values in the east, and the distribution of high-value areas gradually expands. Specific ecological protection policies should be adopted for these regions, because of the responses and spatio-temporal variation rules.
In Sanjiangyuan EFZ, the relatively high elasticity of ESV to LUCC can be attributed to climate change and overgrazing. The grassland area accounts for about 70% of the total land area in Sanjiangyuan EFZ. Due to climate change and overgrazing, the conversion of grassland and water to barren land led to a dramatic decline in ESV. Limiting unreasonable human productive activities should be the focus of environmental protection policies here. Since the establishment of nature reserves and national parks in 2000–2020, there has been the establishment of core reserves to protect the ecological environment and improve the quality of life of herders, the government’s policy of restricting overgrazing, and the relocation of herders to towns with ecological compensation. The environmental protection policy for Sanjiangyuan Region EFZ should be to avoid overgrazing to prevent grassland degradation. It is important to note that, due to the largest extent of the Sanjiangyuan ecological function area, there is a large gap between the socio-economic development patterns in the east and west, and therefore, the ecological compensation should be increased for herders who migrate to traditional-use areas in the core protected areas in the west, and herders should be guided to take up employment in towns. The policy of restricting overgrazing should continue to be implemented in the eastern region, with work-relie, and vocational skills learning for herders should be strengthened to increase their income channel. However, ecological migration will lead to rapid population growth in the resettlement area, and it is important to be vigilant about the environmental problems caused by population growth in the resettlement area.
In Qilian Mountains EFZ, the high elasticity of ESV change to LUCC is attributable to climate change and deforestation. Approximately 2907 ha of forest and 116,500 ha of grassland were converted to farmland and barren land in the Qilian Mountains EFZ. The ecological policy for the region should protect the forests and grassland, by continuing to plant trees and strengthening the protection of grassland. All counties in the Qilian Mountains EFZ have husbandry and tourism as their main industries and should increase investment in science and technology for husbandry to create modern farm breeding and reduce the pressure on grassland ecosystems. The Qilian Mountains are known as “the most beautiful Qilian in Qinghai”, but with the onset of the tourism boom in the Northwest Great Circle, the counties in the Qilian Mountains Ecological Function Area have not achieved the desired results in recent years. We believe that the local government should enhance the region’s water conservation function, develop tourism resources in the Qilian Mountains National Park, improve infrastructure to create a high-end eco-tourism destination, secure a place in the Northwest Great Beltline tourism boom, and enhance local cultural and amenity services.
In Qinghai Lake EFZ, the high elasticity of ESV change to LUCC is attributable to rapid urbanization and deforestation. Qinghai Lake has gradually become the most popular tourist attraction in Qinghai Province, with the tourist attractions created around it, such as Erlangjian, Xianniu Lake, Bird Island (closed), and Sand Island (closed), this has also created many environmental problems. The problem of environmental damage caused by tourism activities should be addressed, with emphasis on waste separation and raising awareness of residents.
In Hehuang EFZ, the high elasticity of ESV change to LUCC is attributable to rapid urbanization and reclamation. Different from other EFZs, in 2020, 64.6% of the province’s population and 62.8% of its GDP was concentrated in this region. The dense population and economy puts a lot of pressure on the ecological protection of the region. Due to the topography of the river valley, the contradiction between the scarcity of available land resources and rapid urbanisation is increasingly evident. In the process of the development of urbanization, urban decision makers should pay attention to the set-up of green infrastructure to coordinate production activity, quality of life and ecological space [62]. The ecological conservation policy for the region should aim to protect farmland and forests, and build wetland parks to improve the living environment. Considering the degree of development of the Hehuang EFZ as the population, economic and political centre of Qinghai Province, which is crucial for the future modernization of Qinghai Province, coupled with the increasing trend of ESV elasticity, it should be the most suitable region for urban construction in Qinghai Province, but with attention given to the efficient use of space.
In Qaidam EFZ, the high elasticity of ESV change to LUCC is attributable to climate change, rapid urbanization and reclamation. The large increase in ESV is strongly related to the expansion of water bodies, while the tourism development of salt lakes such as Chacha Salt Lake and Dongjidai Nai Lake (which disappeared in 2019) has enhanced the cultural services. Between 1990 and 2000 the population grew rapidly due to population relocation, especially in the eastern towns where a lot of farmland was reclaimed. The concentration of heavy industry in Qinghai Province, where water resources are scarce. Villages and most industries are built around rivers and lakes, and inadequate supervision may have a greater impact on the environment. In Qaidam EFZ, the cities of Golmud and Mangye, along with Dachaidan town, are important industrial bases in Qinghai Province, where large industrial enterprises such as Salt Lake Chemical, Qinghai Oilfield and the Special Steel plant are located. The fragile environmental base is difficult to repair once damaged, and it is the area with the most serious conflict between economic development and ecological environment among the five EFZs. Thus, ecological protection policies should prioritize the development of a green circular economy and strictly protect water resources from industrial pollution. Finally, the GFG policy should be strengthened.
In recent years, Qinghai Province has enacted various environmental protection policies, while also finding new paths to green development in urban development, industrial structure and new energy sources, with sustainable development as the ultimate goal. However, there are still various contradictions. Initially, policymakers expanded the ecological red line in pursuit of more subsidies when the line was drawn, which led to the obstruction of urban spatial planning at a later stage. Qinghai Province is overly dependent on the state’s financial transfers to achieve its development, lacks endogenous motivation, and has always been disadvantaged in terms of industrial development, failing to attracting investment and talent. In recent years, some of the ecosystem counter-services phenomenon, such as the increase in water, and improve water supply capacity, but also flooded the pasture along the river; biodiversity to enhance the construction of ecological civilization in Qinghai Province plays an important role, but also derives from the problem of human-animal conflict, where wild animals (snow leopards, brown bears, wild Tibetan mastiffs) attack herdsmen and herds of livestock, damage houses, threaten lives, and affect the herdsmen’s psychological emotions, which results herdsmen’s security and prevention costs rise. As a national ecological security barrier, Qinghai Province cannot ignore the socio-economic development of the province.

4.4. Validity and Limitations of This Study

In terms of spatial scale, instead of the traditional administrative divisions of cities or counties, the five EFZs recently proposed by the Qinghai provincial government were chosen as the spatial scale in this paper. Each EFZ is positioned and has less variation in its internal natural environment and socio-economic development, making it easier to enhance the practical value of the thesis from this spatial scale of research. For the data selection, 30 m spatial resolution land use data from RESDC (www.resdc.cn (accessed on 15 March 2022)) was used, which was manually visually calibrated to make the data more accurate. In addition, glacial and snow is one of the important land use types in Qinghai Province, so the glacial snow land use type has been reclassified out of the traditional six land use types. We believe that this new LUCC classification is an improvement over the original six types if we are to more accurately understand the ecosystem services of Qinghai Province. However, the wetland is also one of the important ecosystems in Qinghai Province, but in the original data, we did not distinguish between wetland types, and this needs to be improved in future studies. In terms of research methods, we used Xie et al. to provide the latest revised equivalent coefficients table for ecosystem service value based on multiple methods. This method has been widely accepted by researchers and has the advantage of being easy to calculate and requiring less data. This paper does not improve the parameters proposed by Xie by using more data based on the actual natural environmental conditions and socio-economic development of Qinghai Province. We hope to build on this foundation in future research and propose an equivalent coefficients table for ecosystem service that is well-suited to Qinghai Province. Both the intensity and direction of land-use change have an impact on ecosystem services. This study only assessed the response of the value of ecosystem services to the quantity of land-use change in Qinghai Province, neglecting the mechanisms of transformation of different land-use practices and the spatial spillover effects of different ecosystem functions, which need to be focused on in future research.

5. Conclusions

The combination of land-use data and the equivalent factor method is the most convenient and effective method for estimating regional ecosystem services and is particularly valuable for areas with large scale, difficult field sampling and difficult data access. Significant land use changes significantly in Qinghai Province from1980 to 2020, because of the combined effects of climate change and socioeconomic development as well as the implementation of environmental protection policies. The area of grassland has grown in the study period; however, the area of forest has decreased. Grassland restoration and degradation coexist in the Qaidam EFZ and Sanjiangyuan EFZ, the expansion of build-up land in the Hehuang EFZ is the fastest, and the largest expansion of water in the Sanjiangyuan EFZ.
The ESV in Qinghai Province declined from 822.559 billion yuan to 819.903 billion yuan from 1980 to 2000, then increased to 905.775 billion yuan in 2020. The ESVs ranked in descending order are Sanjiangyuan EFZ, Qaidam EFZ, Qinghai Lake EFZ, Qilian Mountains EFZ and Hehuang EFZ. The elasticity of ESV generally declined from 1980 to 2020 in the five EFZs. Conversion of 1% of land area would result in an average change of 4.78% in the ESV of Qaidam EFZ, followed by Sanjiangyuan EFZ (2.56%), Qilian Mountains EFZ (2.1%), Qinghai Lake EFZ (1.01%), and finally Hehuang EFZ with the lowest elasticity index (0.53%). The distribution of the high elasticity of ESV gradually expands, with a clear spatial distribution characteristic in the high west and low east. The high elasticity of ESV is mainly in the Sanjiangyuan EFZ and Qaidam EFZ, and the spatial-temporal distribution of the cold spots and hot spots of the elasticity changes shows a clear agglomeration.
In terms of the elasticity of ESV, the core protected areas of the Sanjiangyuan EFZ should continue to implement grazing bans and protect water resources to improve water supply capacity. The Qilian Mountains EFZ should continue to plant trees, improve regulating services and improve infrastructure to develop high-end ecological tourism resources. The Qinghai Lake EFZ should improve water conservation capacity and raise awareness of environmental protection among residents. Hehuang EFZ should pay attention to the efficient use of land resources and improve the cultural service function of the environment. The Qaidam EFZ should protect water resources from industrial pollution and develop a green circular economy. Overall, the sustainable development of Qinghai Province should pay attention to the contradiction between the fragile ecological environment and scarcity of available land resources in the context of the demand for land resources for socioeconomic development.

Author Contributions

Conceptualization, methodology, software, writing—original draft preparation, visualization: X.M. and H.Z.; validation, formal analysis, data curation: X.M. and H.Z.; writing—review and editing: X.M. and H.Z.; supervision, project administration, funding acquisition, H.Z. All authors have read and agreed to the published version of the manuscript.

Funding

This study was funded by the Second Tibetan Plateau Scientific Expedition and Research (2019QZKK1005).

Institutional Review Board Statement

Not applicable.

Informed Consent Statement

Not applicable.

Data Availability Statement

The data that support the findings of this study are available on request from the corresponding author. The data are not publicly available due to privacy or ethical restrictions.

Conflicts of Interest

The authors declare no conflict of interest.

References

  1. Costanza, R.; D’Arge, R.; de Groot, R.; Farber, S.; Grasso, M.; Hannon, B.; Limburg, K.; Naeem, S.; O’Neill, R.V.; Paruelo, J.; et al. The value of the world’s ecosystem services and natural capital. Nature 1997, 387, 253–260. [Google Scholar] [CrossRef]
  2. Harris, J. Millennium Ecosystem Assessment. In Ecosystems and Human Well-Being: Synthesis; Island Press: Washington, DC, USA, 2005. [Google Scholar]
  3. Costanza, R.; De Groot, R.; Braat, L.; Kubiszewski, I.; Fioramonti, L.; Sutton, P.; Farber, S.; Grasso, M. Twenty years of ecosystem services: How far have we come and how far do we still need to go? Ecosyst. Serv. 2017, 28, 1–16. [Google Scholar] [CrossRef]
  4. Xie, G.D.; Zhang, C.X.; Zhang, L.M.; Chen, W.H.; Li, S.M. Improvement of the evaluation method for ecosystem service value based on per unit area. J. Nat. Resour. 2015, 30, 1243. [Google Scholar] [CrossRef]
  5. Xie, G.; Zhang, C.; Zhen, L.; Zhang, L. Dynamic changes in the value of China’s ecosystem services. Ecosyst. Serv. 2017, 26, 146–154. [Google Scholar] [CrossRef]
  6. De Groot, R.; Brander, L.; Van Der Ploeg, S.; Costanza, R.; Bernard, F.; Braat, L.; Christie, M.; Crossman, N.; Ghermandi, A.; Hein, L.; et al. Global estimates of the value of ecosystems and their services in monetary units. Ecosyst. Serv. 2012, 1, 50–61. [Google Scholar] [CrossRef]
  7. Zhao, T.Q.; Ouyang, Z.Y.; Wang, X.K.; Miao, H.; Wei, Y.C. Ecosystem services and their valuation of terrestrial surface water system in China. J. Nat. Resour. 2003, 18, 443–452. [Google Scholar]
  8. Xie, G.D.; Lu, C.X.; Leng, Y.F.; Zheng, D.U.; Li, S.C. Ecological assets valuation of the Tibetan Plateau. J. Nat. Resour. 2003, 18, 189–196. [Google Scholar]
  9. Fu, B.J.; Zhou, G.Y.; Bai, Y.F.; Song, C.C.; Liu, J.Y.; Zhang, H.Y.; Xie, G.D. The main terrestrial ecosystem services and ecological security in China. Adv. Earth Sci. 2009, 24, 571–576. [Google Scholar] [CrossRef]
  10. Bailey, R.G. Ecoregions of the United States (Map); 1:7,500,000; US Department of Agriculture, US Forest Service, Intermountain Region: Ogden, UT, USA, 1976.
  11. Bailey, R.G. Explanatory supplement to ecoregions map of the continents. Environ. Conserv. 1989, 16, 307–309. [Google Scholar] [CrossRef]
  12. Chen, W.; Zhao, H.; Li, J.; Zhu, L.; Wang, Z.; Zeng, J. Land use transitions and the associated impacts on ecosystem services in the Middle Reaches of the Yangtze River Economic Belt in China based on the geo-informatic Tupu method. Sci. Total Environ. 2020, 701, 134690. [Google Scholar] [CrossRef]
  13. Hao, F.H.; Lai, X.H.; Ouyang, W.; Xu, Y.M.; Wei, X.F.; Song, K.Y. Effects of land use changes on the ecosystem service values of a reclamation farm in Northeast China. Environ. Manag. 2012, 50, 888–899. [Google Scholar] [CrossRef]
  14. Jew, E.K.; Burdekin, O.J.; Dougill, A.J.; Sallu, S.M. Rapid land use change threatens provisioning ecosystem services in miombo woodlands. In Natural Resources Forum; Blackwell Publishing Ltd.: Oxford, UK, 2019; Volume 43, pp. 56–70. [Google Scholar] [CrossRef] [Green Version]
  15. Vaezi, A.R.; Ahmadi, M.; Cerdà, A. Contribution of raindrop impact to the change of soil physical properties and water erosion under semi-arid rainfalls. Sci. Total Environ. 2017, 583, 382–392. [Google Scholar] [CrossRef]
  16. Song, W.; Deng, X. Land-use/land-cover change and ecosystem service provision in China. Sci. Total Environ. 2017, 576, 705–719. [Google Scholar] [CrossRef]
  17. Arowolo, A.O.; Deng, X.; Olatunji, O.A.; Obayelu, A.E. Assessing changes in the value of ecosystem services in response to land-use/land-cover dynamics in Nigeria. Sci. Total Environ. 2018, 636, 597–609. [Google Scholar] [CrossRef]
  18. Aziz, T. Changes in land use and ecosystem services values in Pakistan, 1950–2050. Environ. Dev. 2021, 37, 100576. [Google Scholar] [CrossRef]
  19. Kusi, K.K.; Khattabi, A.; Mhammdi, N. Analyzing the impact of land use change on ecosystem service value in the main watersheds of Morocco. Environ. Dev. Sustain. 2022, 25, 2688–2715. [Google Scholar] [CrossRef]
  20. Song, F.; Su, F.; Mi, C.; Sun, D. Analysis of driving forces on wetland ecosystem services value change: A case in Northeast China. Sci. Total Environ. 2021, 751, 141778. [Google Scholar] [CrossRef]
  21. Jiang, W.; Lü, Y.; Liu, Y.; Gao, W. Ecosystem service value of the Qinghai-Tibet Plateau significantly increased during 25 years. Ecosyst. Serv. 2020, 44, 101146. [Google Scholar] [CrossRef]
  22. He, X.; Liang, J.; Zeng, G.; Yuan, Y.; Li, X. The effects of interaction between climate change and land-use/cover change on biodiversity-related ecosystem services. Glob. Chall. 2019, 3, 1800095. [Google Scholar] [CrossRef] [Green Version]
  23. Siddik, M.S.; Tulip, S.S.; Rahman, A.; Islam, M.N.; Haghighi, A.T.; Mustafa, S.M.T. The impact of land use and land cover change on groundwater recharge in northwestern Bangladesh. J. Environ. Manag. 2022, 315, 115130. [Google Scholar] [CrossRef]
  24. Xi, H.; Cui, W.; Cai, L.; Chen, M.; Xu, C. Evaluation and prediction of ecosystem service value in the Zhoushan Islands based on LUCC. Sustainability 2021, 13, 2302. [Google Scholar] [CrossRef]
  25. Chen, Z.; Zhang, X. Value of ecosystem services in China. Chin. Sci. Bull. 2000, 45, 870–876. [Google Scholar] [CrossRef]
  26. Ye, Y.; Zhang, J.; Wang, T.; Bai, H.; Wang, X.; Zhao, W. Changes in land-use and ecosystem service value in Guangdong province, southern China, from 1990 to 2018. Land 2021, 10, 426. [Google Scholar] [CrossRef]
  27. Cui, X.; Liu, C.; Shan, L.; Lin, J.; Zhang, J.; Jiang, Y.; Zhang, G. Spatial-Temporal responses of ecosystem services to land use transformation driven by rapid urbanization: A case study of Hubei Province, China. Int. J. Environ. Res. Public Health 2021, 19, 178. [Google Scholar] [CrossRef] [PubMed]
  28. Shang, Y.; Wang, D.; Liu, S.; Li, H. Stability of Land-use/Land-cover in National Nature Reserves of Jilin Province, China. Chin. Geogr. Sci. 2022, 32, 324–339. [Google Scholar] [CrossRef]
  29. Yu, H.; Yang, J.; Sun, D.; Li, T.; Liu, Y. Spatial responses of ecosystem service value during the development of urban agglomerations. Land 2022, 11, 165. [Google Scholar] [CrossRef]
  30. Ding, M.; Liu, W.; Xiao, L.; Zhong, F.; Lu, N.; Zhang, J.; Wang, K. Construction and optimization strategy of ecological security pattern in a rapidly urbanizing region: A case study in central-south China. Ecol. Indic. 2022, 136, 108604. [Google Scholar] [CrossRef]
  31. Gashaw, T.; Tulu, T.; Argaw, M.; Worqlul, A.W.; Tolessa, T.; Kindu, M. Estimating the impacts of land use/land cover changes on Ecosystem Service Values: The case of the Andassa watershed in the Upper Blue Nile basin of Ethiopia. Ecosyst. Serv. 2018, 31, 219–228. [Google Scholar] [CrossRef]
  32. Jiang, W.; Fu, B.; Lü, Y. Assessing impacts of land use/land cover conversion on changes in ecosystem services value on the Loess Plateau, China. Sustainability 2020, 12, 7128. [Google Scholar] [CrossRef]
  33. Wang, Y.; Zhang, S.; Zhen, H.; Chang, X.; Shataer, R.; Li, Z. Spatiotemporal evolution characteristics in ecosystem service values based on land use/cover change in the Tarim River Basin, China. Sustainability 2020, 12, 7759. [Google Scholar] [CrossRef]
  34. Huang, L.; He, C.; Wang, B. Study on the spatial changes concerning ecosystem services value in Lhasa River Basin, China. Environ. Sci. Pollut. Res. 2022, 29, 7827–7843. [Google Scholar] [CrossRef]
  35. Xing, L.; Zhu, Y.; Wang, J. Spatial spillover effects of urbanization on ecosystem services value in Chinese cities. Ecol. Indic. 2021, 121, 107028. [Google Scholar] [CrossRef]
  36. Sun, M.; Ma, W.; Yao, X.; Zhao, L.; Li, Z.; Qin, D. Evaluation and spatiotemporal characteristics of glacier service value in the Qilian Mountains. J. Geogr. Sci. 2020, 30, 1233–1248. [Google Scholar] [CrossRef]
  37. Tan, Z.; Guan, Q.; Lin, J.; Yang, L.; Luo, H.; Ma, Y.; Wang, N. The response and simulation of ecosystem services value to land use/land cover in an oasis, Northwest China. Ecol. Indic. 2020, 118, 106711. [Google Scholar] [CrossRef]
  38. Ma, S.; Wang, L.-J.; Zhu, D.; Zhang, J. Spatiotemporal changes in ecosystem services in the conservation priorities of the southern hill and mountain belt, China. Ecol. Indic. 2021, 122, 107225. [Google Scholar] [CrossRef]
  39. Wu, J.; Wang, G.; Chen, W.; Pan, S.; Zeng, J. Terrain gradient variations in the ecosystem services value of the Qinghai-Tibet Plateau, China. Glob. Ecol. Conserv. 2022, 34, e02008. [Google Scholar] [CrossRef]
  40. Han, Z.; Song, W.; Deng, X. Responses of ecosystem service to land use change in Qinghai Province. Energies 2016, 9, 303. [Google Scholar] [CrossRef] [Green Version]
  41. Li, Z.; Duan, R.; Ke, H.; Liu, X.; Xie, G.; Gao, W.; Song, L.; Zhang, B.; Guii, J.; Xue, J.; et al. Research progress of ecological hydrology based on hydrochemical characteristics in the source region of the Yangtze River. J. Glaciol. Geocryol. 2022, 44, 288–298. [Google Scholar] [CrossRef]
  42. Zhao, M.; Zhao, H.F.; Li, R.Q.; Zhang, L.Y.; Zhao, F.X.; Liu, L.X.; Xu, M. Assessment on grassland ecosystem services in Qinghai Province during 1998–2012. J. Nat. Resour. 2017, 418–433. [Google Scholar] [CrossRef]
  43. Cao, S.; Li, C.; Cao, S.; Peng, Z.; Yang, L. Change in ecosystem service value arising from land consolidation planning in Anhui province. Asian Agric. Res. 2013, 5, 13–16. Available online: https://www.proquest.com/docview/1346178000 (accessed on 2 November 2022).
  44. Fei, L.; Shuwen, Z.; Jiuchun, Y.; Liping, C.; Haijuan, Y.; Kun, B. Effects of land use change on ecosystem services value in West Jilin since the reform and opening of China. Ecosyst. Serv. 2018, 31, 12–20. [Google Scholar] [CrossRef]
  45. Li, Y.; Zhan, J.; Liu, Y.; Zhang, F.; Zhang, M. Response of ecosystem services to land use and cover change: A case study in Chengdu City. Resour. Conserv. Recycl. 2018, 132, 291–300. [Google Scholar] [CrossRef]
  46. Su, K.; Wei, D.Z.; Lin, W.X. Evaluation of ecosystem services value and its implications for policy making in China–A case study of Fujian province. Ecol. Indic. 2020, 108, 105752. [Google Scholar] [CrossRef]
  47. Guo, P.; Zhang, F.; Wang, H. The response of ecosystem service value to land use change in the middle and lower Yellow River: A case study of the Henan section. Ecol. Indic. 2022, 140, 109019. [Google Scholar] [CrossRef]
  48. Gao, X.; Yang, L.; Li, C.; Song, Z.; Wang, J. Land use change and ecosystem service value measurement in Baiyangdian Basin under the simulated multiple scenarios. Acta Ecol. Sin. 2021, 41, 7974–7988. [Google Scholar] [CrossRef]
  49. Chen, J.; Wang, Y.; Sun, J.; Liang, E.; Shen, M.; Yang, B.; Zhang, J. Precipitation dominants synergies and trade-offs among ecosystem services across the Qinghai-Tibet Plateau. Glob. Ecol. Conserv. 2021, 32, e01886. [Google Scholar] [CrossRef]
  50. Zamboni, N.S.; Noleto Filho, E.M.; Carvalho, A.R. Unfolding differences in the distribution of coastal marine ecosystem services values among developed and developing countries. Ecol. Econ. 2021, 189, 107151. [Google Scholar] [CrossRef]
  51. Wang, J.; Zhou, W.; Guan, Y. Optimization of management by analyzing ecosystem service value variations in different watersheds in the Three-River Headwaters Basin. J. Environ. Manag. 2022, 321, 115956. [Google Scholar] [CrossRef]
  52. Yao, T.; Thompson, L.; Yang, W.; Yu, W.; Gao, Y.; Guo, X.; Joswiak, D. Different glacier status with atmospheric circulations in Tibetan Plateau and surroundings. Nat. Clim. Chang. 2012, 2, 663–667. [Google Scholar] [CrossRef]
  53. Liu, J.; Mooney, H.; Hull, V.; Davis, S.J.; Gaskell, J.; Hertel, T.; Li, S. Systems integration for global sustainability. Science 2015, 347, 1258832. [Google Scholar] [CrossRef] [Green Version]
  54. Wang, X.; Chen, R.; Han, C.; Yang, Y.; Liu, J.; Liu, Z.; Song, Y. Response of frozen ground under climate change in the Qilian Mountains, China. Quat. Int. 2019, 523, 10–15. [Google Scholar] [CrossRef]
  55. Zongxing, L.; Qi, F.; Zongjie, L.; Xufeng, W.; Juan, G.; Baijuan, Z.; Pengfei, L. Reversing conflict between humans and the environment-The experience in the Qilian Mountains. Renew. Sustain. Energy Rev. 2021, 148, 111333. [Google Scholar] [CrossRef]
  56. Chang, B.; He, K.; Li, R.; Wang, H.; Wen, J. Trends, Abrupt Changes, and Periodicity of Streamflow in Qinghai Province, the Northeastern Tibetan Plateau, China. Pol. J. Environ. Stud. 2018, 27. [Google Scholar] [CrossRef] [PubMed]
  57. Sun, J.; Zhou, T.; Liu, M.; Chen, Y.; Shang, H.; Zhu, L.; Sha, Y. Linkages of the dynamics of glaciers and lakes with the climate elements over the Tibetan Plateau. Earth-Sci. Rev. 2018, 185, 308–324. [Google Scholar] [CrossRef]
  58. Wang, Z.F.; Xu, J. Impacts of land use evolution on ecosystem service value of national parks: Take Sanjiangyuan National Park as an example. Acta Ecol. Sin. 2022, 42, 6948–6958. [Google Scholar] [CrossRef]
  59. Xiao, J.S.; Qiao, B.; Chen, G.Q.; Shi, F.F.; Cao, X.Y.; Zhu, C.X. Land use change and evolution of ecosystem service value in Maduo County of source region of the Yellow River. Acta Ecol. Sin. 2020, 40, 510–521. [Google Scholar] [CrossRef]
  60. Zhao, J.; Yang, H.; Qu, M.; Yang, S.; Wang, W.; Zhao, W. The interactions among herbaceous diversity, edaphic factors, and topography under typical afforestation in the transition zone between the qinghai–Tibet Plateau and Loess Plateau. J. Plant Interact. 2021, 16, 75–82. [Google Scholar] [CrossRef]
  61. Fu, G.; Uchida, E.; Shah, M.; Deng, X. Impact of the Grain for Green program on forest cover in China. J. Environ. Econ. Policy 2019, 8, 231–249. [Google Scholar] [CrossRef] [Green Version]
  62. Wang, J.; Zhou., W.; Pickett., S.T.A.; Yu, W.; Li, W. A multiscale analysis of urbanization effects on ecosystem services supply in an urban megaregion. Sci. Total Environ. 2019, 662, 824–833. [Google Scholar] [CrossRef]
Figure 1. Study area.
Land 12 00656 g001
Figure 2. Land use of Qinghai Province from 1980 to 2020.
Land 12 00656 g002
Figure 3. Land use type conversion in five EFZs in 1980 to 2020.
Land 12 00656 g003
Figure 4. Spatial distribution of ESV in Qinghai Province from 1980 to 2020 (103 ¥/ha).
Land 12 00656 g004
Figure 5. Structure chart of ecosystem service value of the five ecological function zones.
Land 12 00656 g005
Figure 6. Elasticity of ESV changes in response to LUCC in Qinghai province during the periods 1980–1990 (a), 1990–2000 (b), 2000–2010 (c), and 2010–2020 (d).
Land 12 00656 g006
Figure 7. Spatial distribution effects of cold/hot spots on elasticity of ESV change.
Land 12 00656 g007
Table 1. Ecosystem service equivalent value per unit area of Qinghai province.
Ecosystem ClassificationProvisioning ServicesRegulating ServicesHabitat ServicesCultural & Amenity Services
FPMPWPARCRWTWREPSMHSCaS
Farmland857403.320.16675.5363100.8272.2103812113160.5
Forest191.6433.5221.81422426512913377.517341311583695.7
Grassland221.8332.7181.51149304510082228.114011111280564.6
Water806.6231.98358776.323095596103,07993870.625711905.5
Barren land10.0830.2520.2110.9100.8312.6211.713110.112150.4
Glacier and snow002178181.5544.4161.37188.50010.190.7
Note: FP (food production); MP (materials production); WP (water production); AR (Air quality regulation); CR (climate regulation); WT (waste treatment); WR (regulation of water flows); EP (erosion prevention); SM (maintenance of soil fertility); HS (habitat services); CaS (Cultural & amenity services).
Table 2. ESV changes of five ecological function zones of during 1980 to 2020.
Year/TypesSanjiangyuan EFZQilian Mountains EFZQinghai Lake EFZHehuang EFZQiadam EFZ
ESV19805323.91 619.17 849.36 177.39 1255.76
19905336.12 621.53 842.62 177.49 1243.73
20005325.97 621.06 840.55 178.69 1232.76
20105624.7 663.04 888.75 178.62 1331.08
20205737.4 673.9 905.01 178.53 1562.91
7.77%8.84%6.55%0.65%24.46%
RateFarmland19.10%2.86%14.37%−0.63%46.49%
Forest−0.40%−0.37%−3.65%0.03%−1.70%
Grassland5.78%0.84%20.19%−1.50%−0.41%
Water13.43%31.29%3.52%22.32%98.71%
Barren land−20.11%−4.53%−37.72%−0.62%−1.94%
Glacier−0.96%90.52%8.17%0 −5.34%
Table 3. Change rate of ecosystem service value of the five ecological function zones during 1980—2020.
ESSanjiangyuan EFZQilian Mountains EFZQinghai Lake EFZHehuang EFZQiadam EFZ
%CE %%CE %%CE %%CE %%CE %
FP1.43 6.81 1.6 3.87 1.01 10.56 3.16 −0.57 1.45 11.62
MP1.9 5.11 2.18 1.04 0.94 13.4 3.2 −0.91 2.11 1.85
WP3.49 10.38 3.1 22.41 5.22 4.4 1.88 5.1 3.14 54.08
AR6.53 5.01 7.32 1.13 3.18 13.39 9.57 −0.97 7.3 1.53
CR17.16 5.43 18.87 1.38 8.38 14.35 23.27 −0.96 17.34 2.02
WT7.45 5.3 8.21 4.1 5.79 6.4 7.89 −0.15 9.78 10.11
RW42.12 10.67 36.91 19.5 64.39 4.41 24.04 4.92 37 56.96
RP7.95 5.06 8.94 0.99 3.88 13.47 12.08 −0.96 8.85 1.59
SM0.63 5.11 0.71 1 0.31 13.67 1.02 −0.95 0.7 1.64
HS7.72 5.51 8.34 2.18 4.48 11.2 9.59 −0.77 8.43 5.2
CaS3.62 6.01 3.84 3.49 2.41 9.82 4.28 −0.53 3.86 8.89
Note: FP (food production); MP (materials production); WP (water production); AR (Air quality regulation); CR (climate regulation); WT (waste treatment); WR (regulation of water flows); EP (erosion prevention); SM (maintenance of soil fertility); HS (habitat services); CaS (Cultural & amenity services). CE (change rate).
Table 4. Elasticity of ESVs with respect to LUCCs of five ecological function zones in Qinghai Province.
1980–19901990–20002000–20102010–2020Average
Sanjiangyuan EFZ1.51 7.08 0.79 0.87 2.56
Qilian Mountain EFZ5.31 0.96 1.71 0.41 2.10
Qinghai Lake EFZ2.26 0.46 0.49 0.81 1.01
Hehuang EFZ0.31 1.70 0.02 0.09 0.53
Qiadam EFZ5.21 3.61 5.51 4.76 4.78
Table 5. Impacts of LUCC conversion on ESV change in different EFZ.
ESV Net DecreaseESV Net Increase
UrbanizationGrassland DegenerationWater Dried-UpFarmland ReclamationPasture RecoveryReturning Farmland to ForestWater Expansion
EFZ Other Types—Build-Up LandGrassland—Barren LandWater—Barren LandGrassland & Forest—FarmlandBarren Land—GrasslandFarmland—ForestBarren Land—Water
Qaidam1980–19901.31 0.04 19.63 0.4 0.22 0 10.76
1990–20000.17 0.92 10.36 1.45 0.76 0 0.82
2000–20105.82 4.85 4.71 0.47 10.9 0.001 83.01
2010–20201.29 21.37 33.31 1.02 22.09 0.01 217.81
Qilian1980–19900.001 0.19 0.07 0.0004 0.01 0 0
1990–20000.02 0.23 0.17 0.02 0.07 0 0.02
2000–20100.36 4.89 0.15 0.77 9.85 0.03 32.48
2010–20200.60 6.82 1.76 0.89 6.37 0.16 4.8
Hehuang1980–19900.06 0.12 0 0.08 0 0 0
1990–20000.08 0.0001 0 0.27 0 0 0
2000–20100.88 0.10 0 1.41 0.23 0.03 0.05
2010–20200.83 0.23 0.06 2.46 0.22 0.11 0.15
Qinghai Lake1980–19900.058 0.32 6.12 0.07 0.23 0 0
1990–20000.08 0.07 4.09 0.54 0.12 0 1.06
2000–20100.88 0.90 3.11 0.51 35.7 0.001 12.81
2010–20200.83 1.71 1.15 0.11 1.66 0.002 14.51
Sanjiangyuan1980–19900.01 1.15 10.38 1.66 0.04 0 15.10
1990–20000.08 2.57 12.74 1.34 1.51 0 6.06
2000–20100.45 43 4.4 7.14 213.8 0.01 109.68
2010–20202.82 16.67 33.67 0.8 16.58 0.03 117.23
Total1980–202016.73106.5145.8521.41320.370.38626.3
Disclaimer/Publisher’s Note: The statements, opinions and data contained in all publications are solely those of the individual author(s) and contributor(s) and not of MDPI and/or the editor(s). MDPI and/or the editor(s) disclaim responsibility for any injury to people or property resulting from any ideas, methods, instructions or products referred to in the content.

