Article

Land Use Simulation and Landscape Ecological Risk Assessment on the Qinghai-Tibet Plateau

1
College of Geography, Qinghai Normal University, Xining 810008, China
2
Academy of Plateau Science and Sustainability, Xining 810008, China
*
Author to whom correspondence should be addressed.
Land 2023, 12(4), 923; https://doi.org/10.3390/land12040923
Submission received: 14 February 2023 / Revised: 14 April 2023 / Accepted: 19 April 2023 / Published: 20 April 2023

Abstract

:
The land use and land cover pattern of the Qinghai-Tibet Plateau (QTP) is an important basis for the structure and function of the QTP ecological barrier. It is of great significance to simulate the land use pattern and landscape ecological risk of the QTP under future scenarios for the construction of the QTP barrier area and to promote the sustainable use of land resources. The QTP was selected as the study area. Based on the spatial pattern of land use in 2010 and 2020, the PLUS model was used to predict the land use patterns of the QTP in 2030 under the two scenarios of natural development and ecological conservation. The landscape ecological risk index was constructed to evaluate the past, present, and future landscape ecological risk of the QTP. The natural break point method was used to divide the landscape ecological risk index into five levels: lower ecological risk, low ecological risk, medium ecological risk, high ecological risk, and higher ecological risk. The results showed that: (1) Under the natural development scenario, the area of cropland, forestland, grassland, and unused land decreased continuously, while the areas of water and built-up land increased gradually. Under the ecological conservation scenario, the areas of forestland and grassland increased by 130 km2 and 2293 km2, respectively, compared with the natural development scenario. (2) Under the natural development scenario, the overall ecological risk of the QTP increased from 2010 to 2030, which showed that the proportions of lower ecological risk area decreased, while the proportion of medium and high ecological risk area increased. Under the ecological conservation scenario, compared with the natural development scenario, the area of lower, low, and high ecological risk increased by 4044 km2, 2484 km2, and 6401 km2, respectively, while the areas of medium and higher ecological risk decreased by 6333 km2 and 6597 km2, respectively.

1. Introduction

The Qinghai-Tibet Plateau (QTP) is known as the “roof of the world” and the “world’s third pole” [1]. Its unique geographical location and rich natural resources make it an ecological security barrier for China and even Asia, meaning it plays an important role in ecological conservation [2]. However, the QTP’s ecosystem is fragile and its natural environment is complex [3]. Under the combined influence of human and natural factors, the LUCC, which form an important basis for supporting the structure and function of the QTP ecological barrier, is prone to change. Such change significantly impacts the QTP’s internal ecological environment and its development, thus affecting the whole world [4].
An important topic in ecological risk assessment at the regional scale, landscape ecological risk refers to the possible adverse consequences of the interaction between landscape patterns and ecological processes under the influence of natural or human factors [5]. It affects the intensity of regional ecological risk, and then causes natural disasters [6,7,8]. With the development of computer technology, the models used for land use simulation are developing apace. In CLUE-S, FLUS, and PLUS models [9,10,11], for example, the accuracy of land use model simulation is constantly improving. Therefore, researchers have begun to assess regional ecological risk status from the perspective of landscape ecology by land use pattern [12]. This plays an important role in determining the overall characteristics and trends of change of regional ecological risk and in carrying out ecological risk management.
At present, research on land use change in the QTP mainly focus on densely populated areas and climate sensitive areas. Such areas include the Yellow River-Huangshui River Valley, the “One River and Two Rivers Streams” area [13,14,15,16,17], the Northern Tibet Plateau, the Three-River Headwaters Region [18,19,20,21,22], and the Qomolangma National Nature Reserve [23,24,25]. Moreover, the land use types studied are specific, and there is a lack of systematic understanding of the LUCC process for the whole of the QTP. There is little research on land use simulation of the QTP. Most studies on the landscape ecological risk assessment of the QTP focus on small areas, such as cities, river basins, wetlands, and infrastructure construction areas [26,27,28,29,30,31]. Large-scale systematic landscape ecological risk assessment studies under current and future scenarios for the whole QTP are still lacking. Therefore, the simulation and assessment of land use change and ecological risk for the QTP have become important in the sustainable development and ecological conservation of the QTP. It is, therefore, crucial to better understand the overall characteristics and developmental trends of land use change and ecological risk on the QTP.
The QTP, therefore, was selected as the study area. Using land use data from the QTP for 2010 and 2020, the PLUS model was adopted to predict the land use under natural development and ecological conservation scenarios for 2030. The landscape ecological risk index was constructed to evaluate the overall landscape ecological risk characteristics of the QTP from 2010 to 2020 and different future scenarios for 2030. This study aims to promote the sustainable utilization of land resources on the QTP, to provide a reference for the construction of an ecological conservation barrier area and ecological civilization plateau and to provide a theoretical reference for the LUCC simulation and landscape ecological risk assessment of plateau regions across the world.

2. Materials and Methods
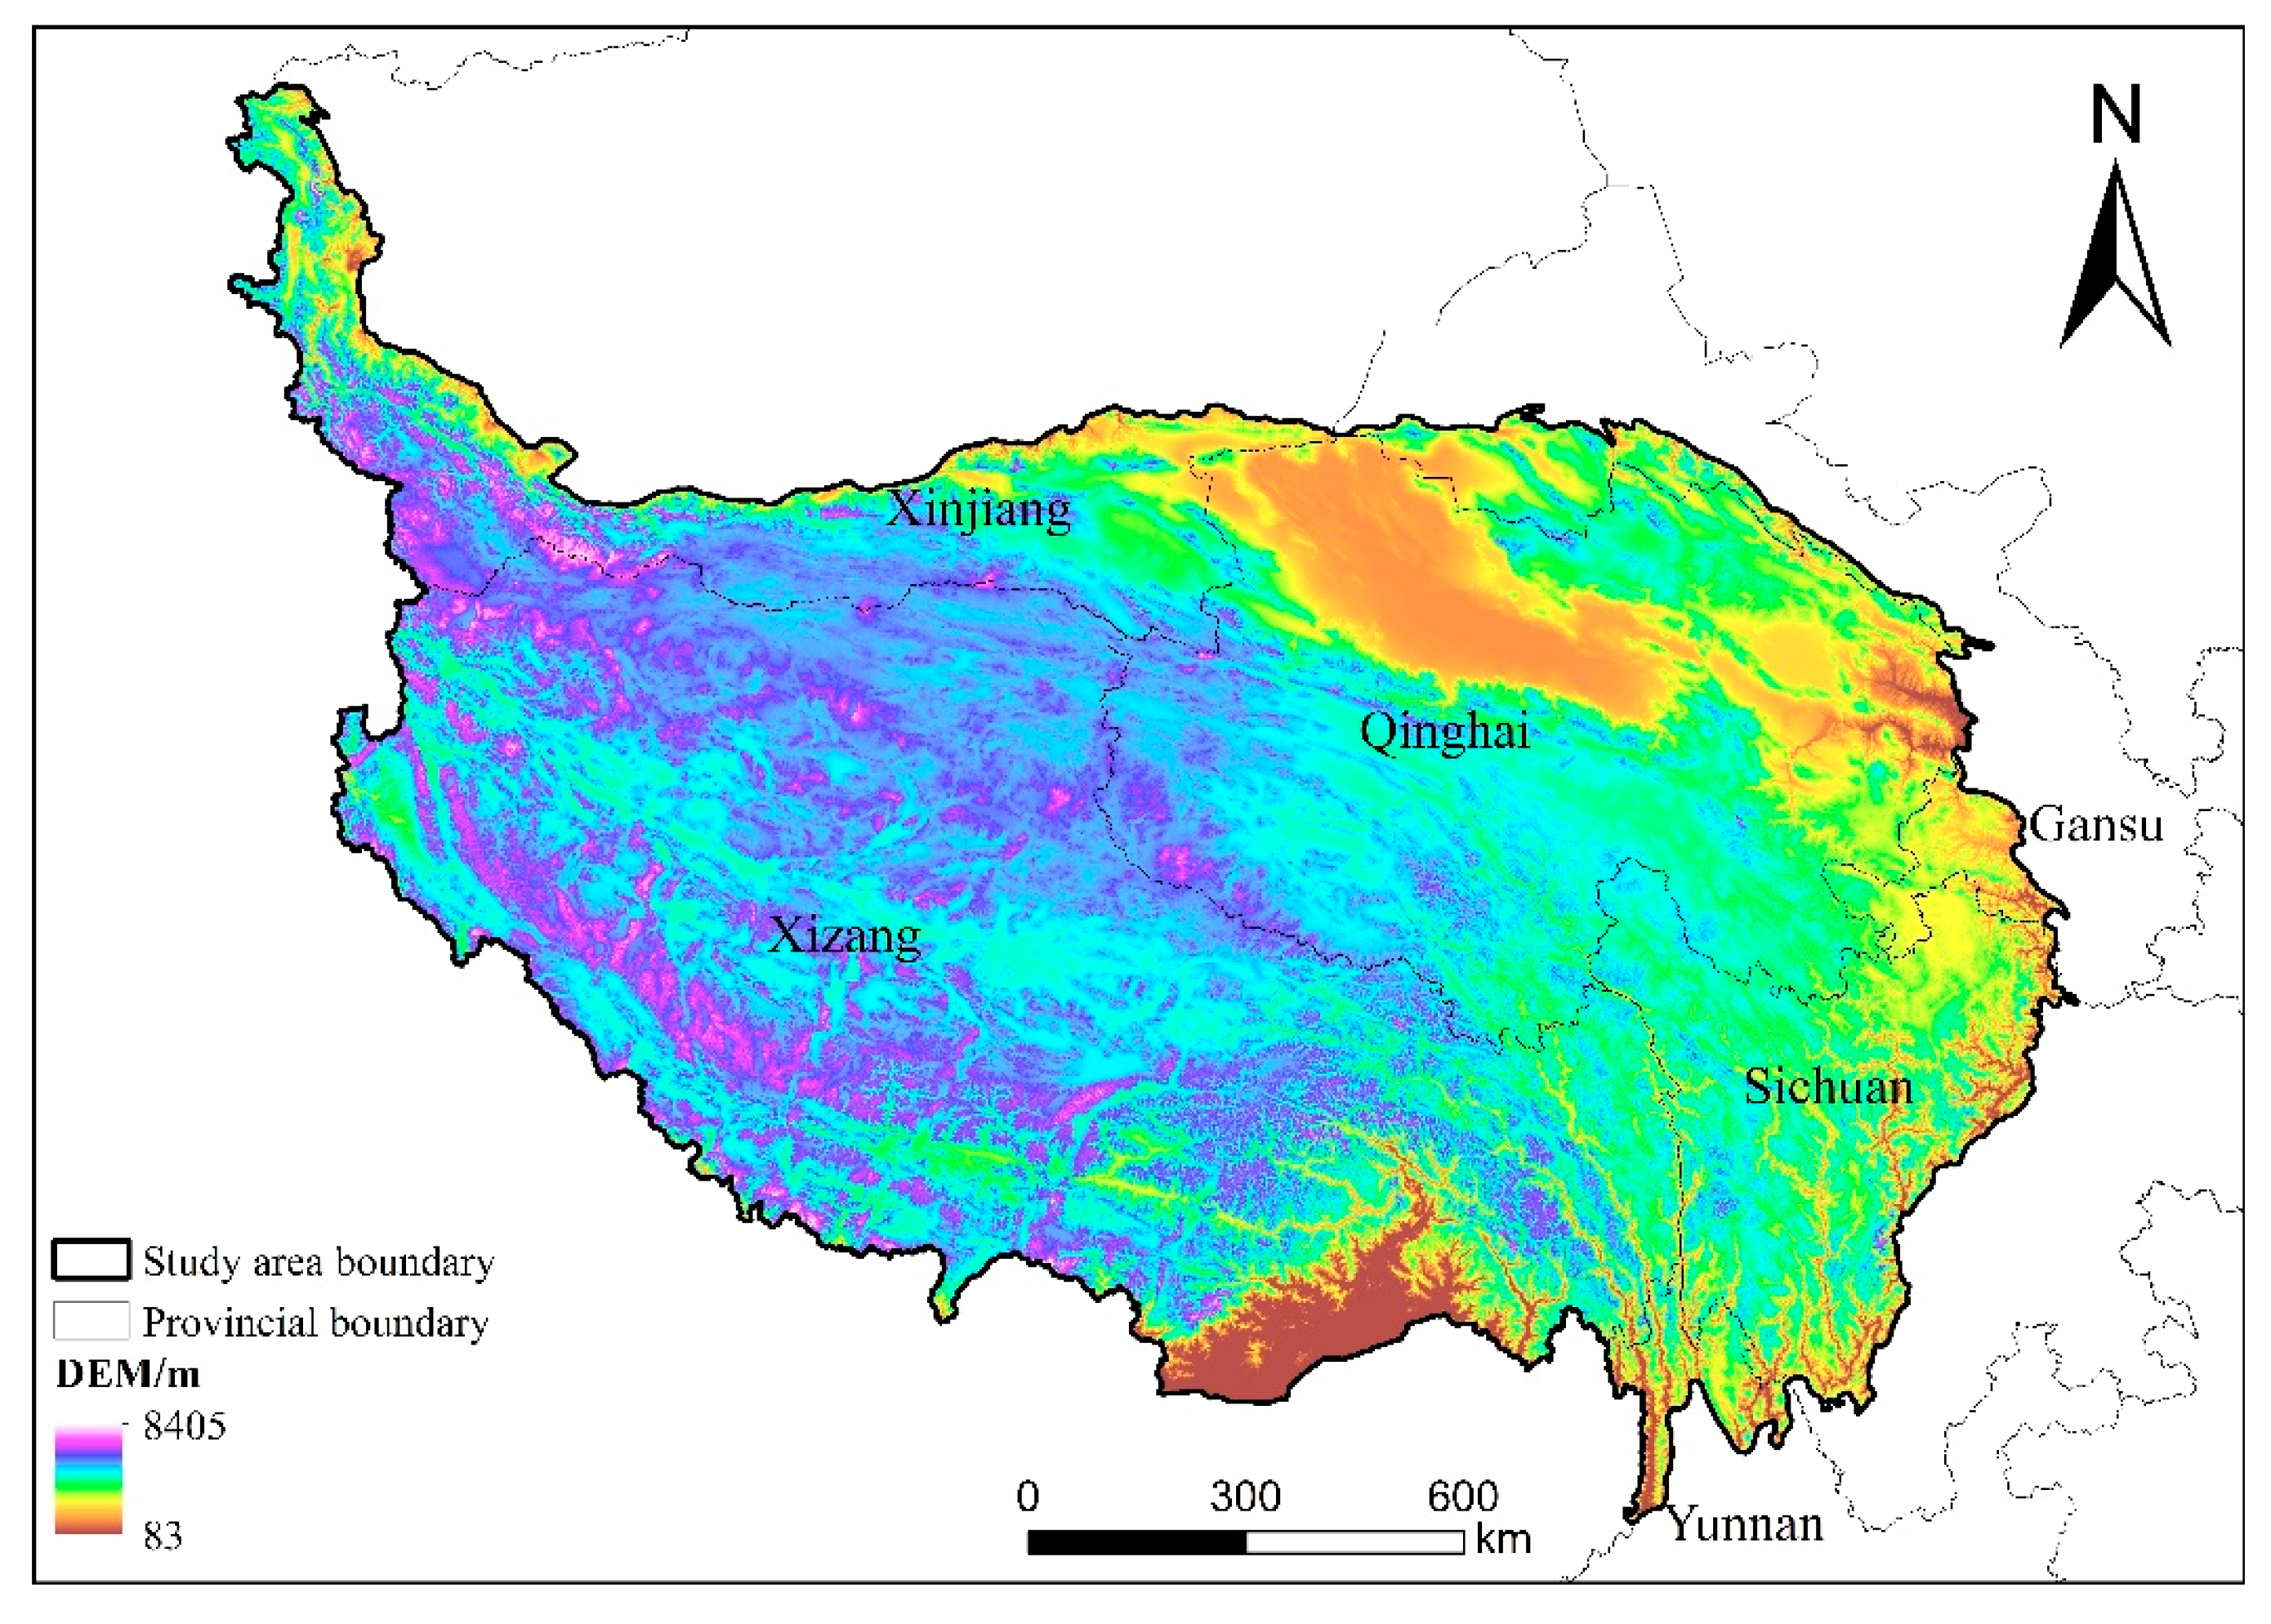
2.1. Study Area

The QTP covers an area of more than 250 × 104 km2 in China, with an average altitude of more than 4200 m covering six regions (Figure 1): Tibet, Qinghai, Gansu, Sichuan, Yunnan, and Xinjiang [32]. The QTP has an average annual temperature of −6–20 °C and annual precipitation of 50–2000 mm [33]. It is the cradle of the great rivers: the Yangtze River, Yellow River, and Yarlung Zangbo River and is known as the “Asian Water Tower” [34]. The QTP has complex terrains, diverse landforms, and a large amount of frozen soil. The frozen soil area of the QTP is about 115.02 × 10⁴ km2, making the QTP rank first among all the frozen soil regions in the middle-latitude of the world [35].

2.2. Data Source

The 30 m land use data from the Data Center for Resources and Environmental Sciences, Chinese Academy of Sciences were reclassified (Table 1), pruned, and resampled to produce land use data sets with a resolution of 1 km for the QTP in 2010 and 2020. The other data source is shown in Table 2.

2.3. Methods

This study focused on the simulation of LUCC under future scenarios and assessed the ecological risk under different scenarios. The framework of this study was as follows: (1) Optimization of PLUS-model parameters. Continuously adjusting the model-run parameters using the two-phase LUCC and driver factors dataset to optimize the accuracy of the simulated LUCC and to obtain data such as land expansion, development potential, and optimal-run parameters. (2) Constructing future scenarios parameters. The land demands under the two scenarios were constructed using Markov chain models, transfer probability matrices, scenario states, and government planning policies. (3) Ecological risk assessment. The landscape ecological risk index was constructed to assess ecological risk.
The overall research framework of the study is shown in Figure 2.

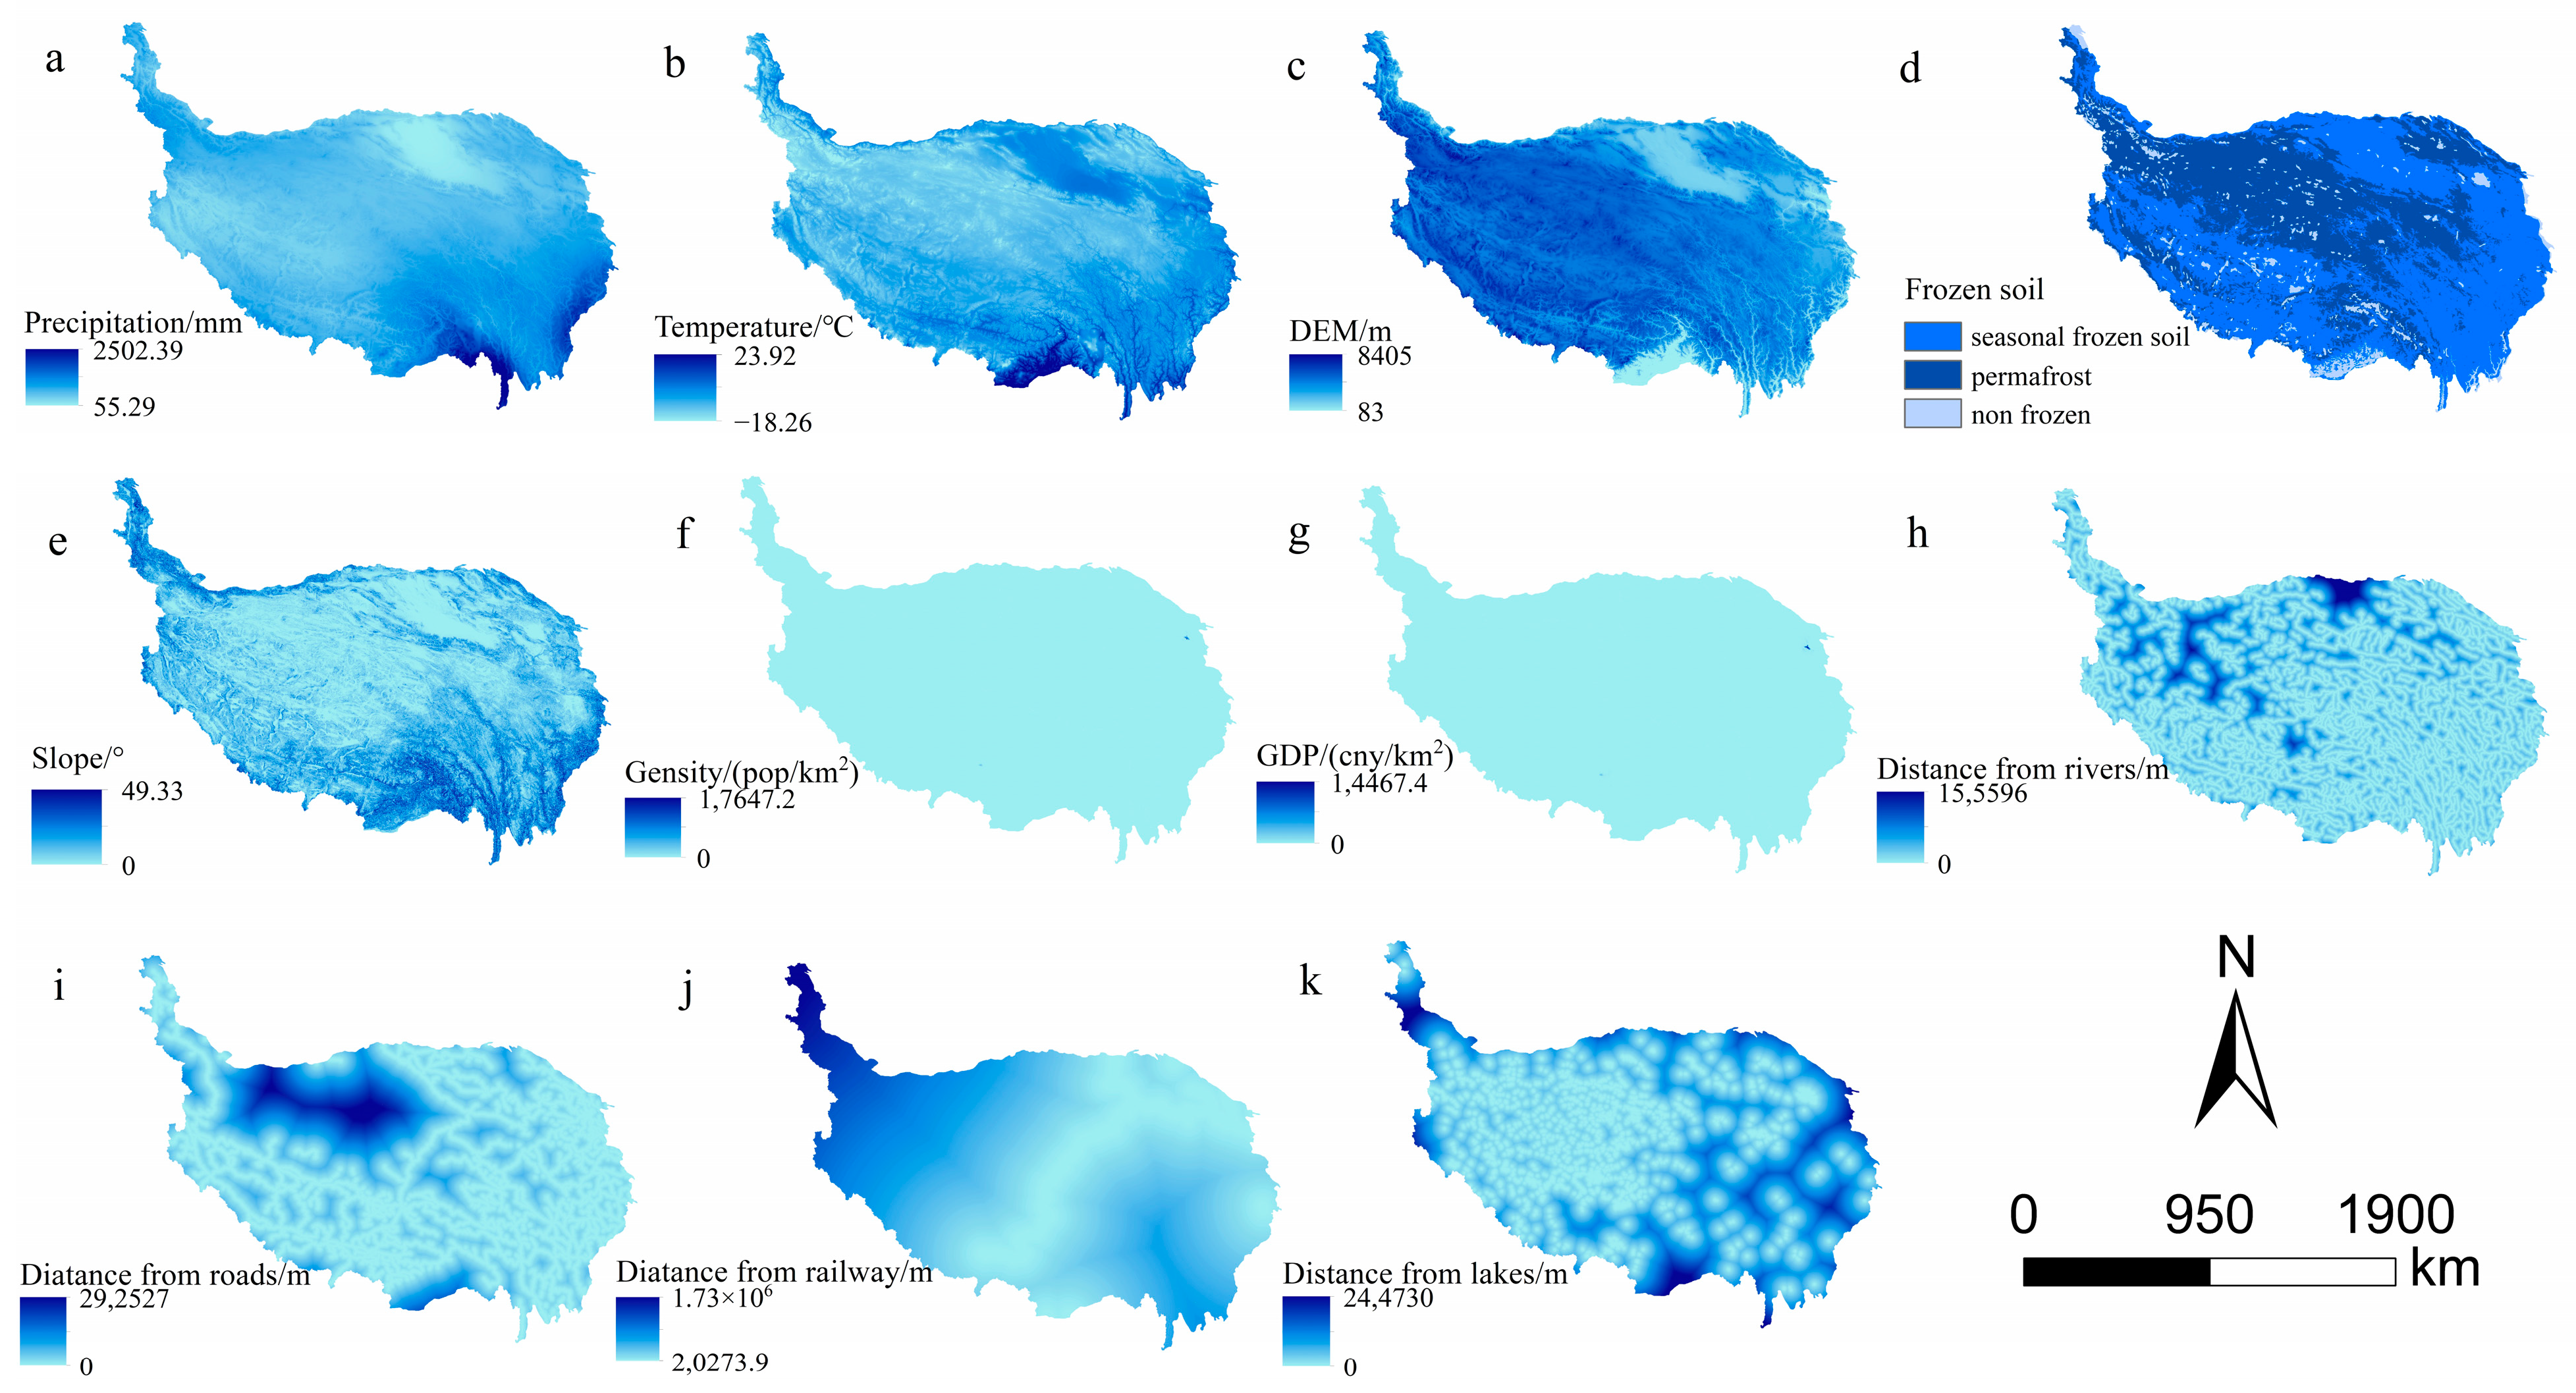
2.3.1. Selection of Driving Factors
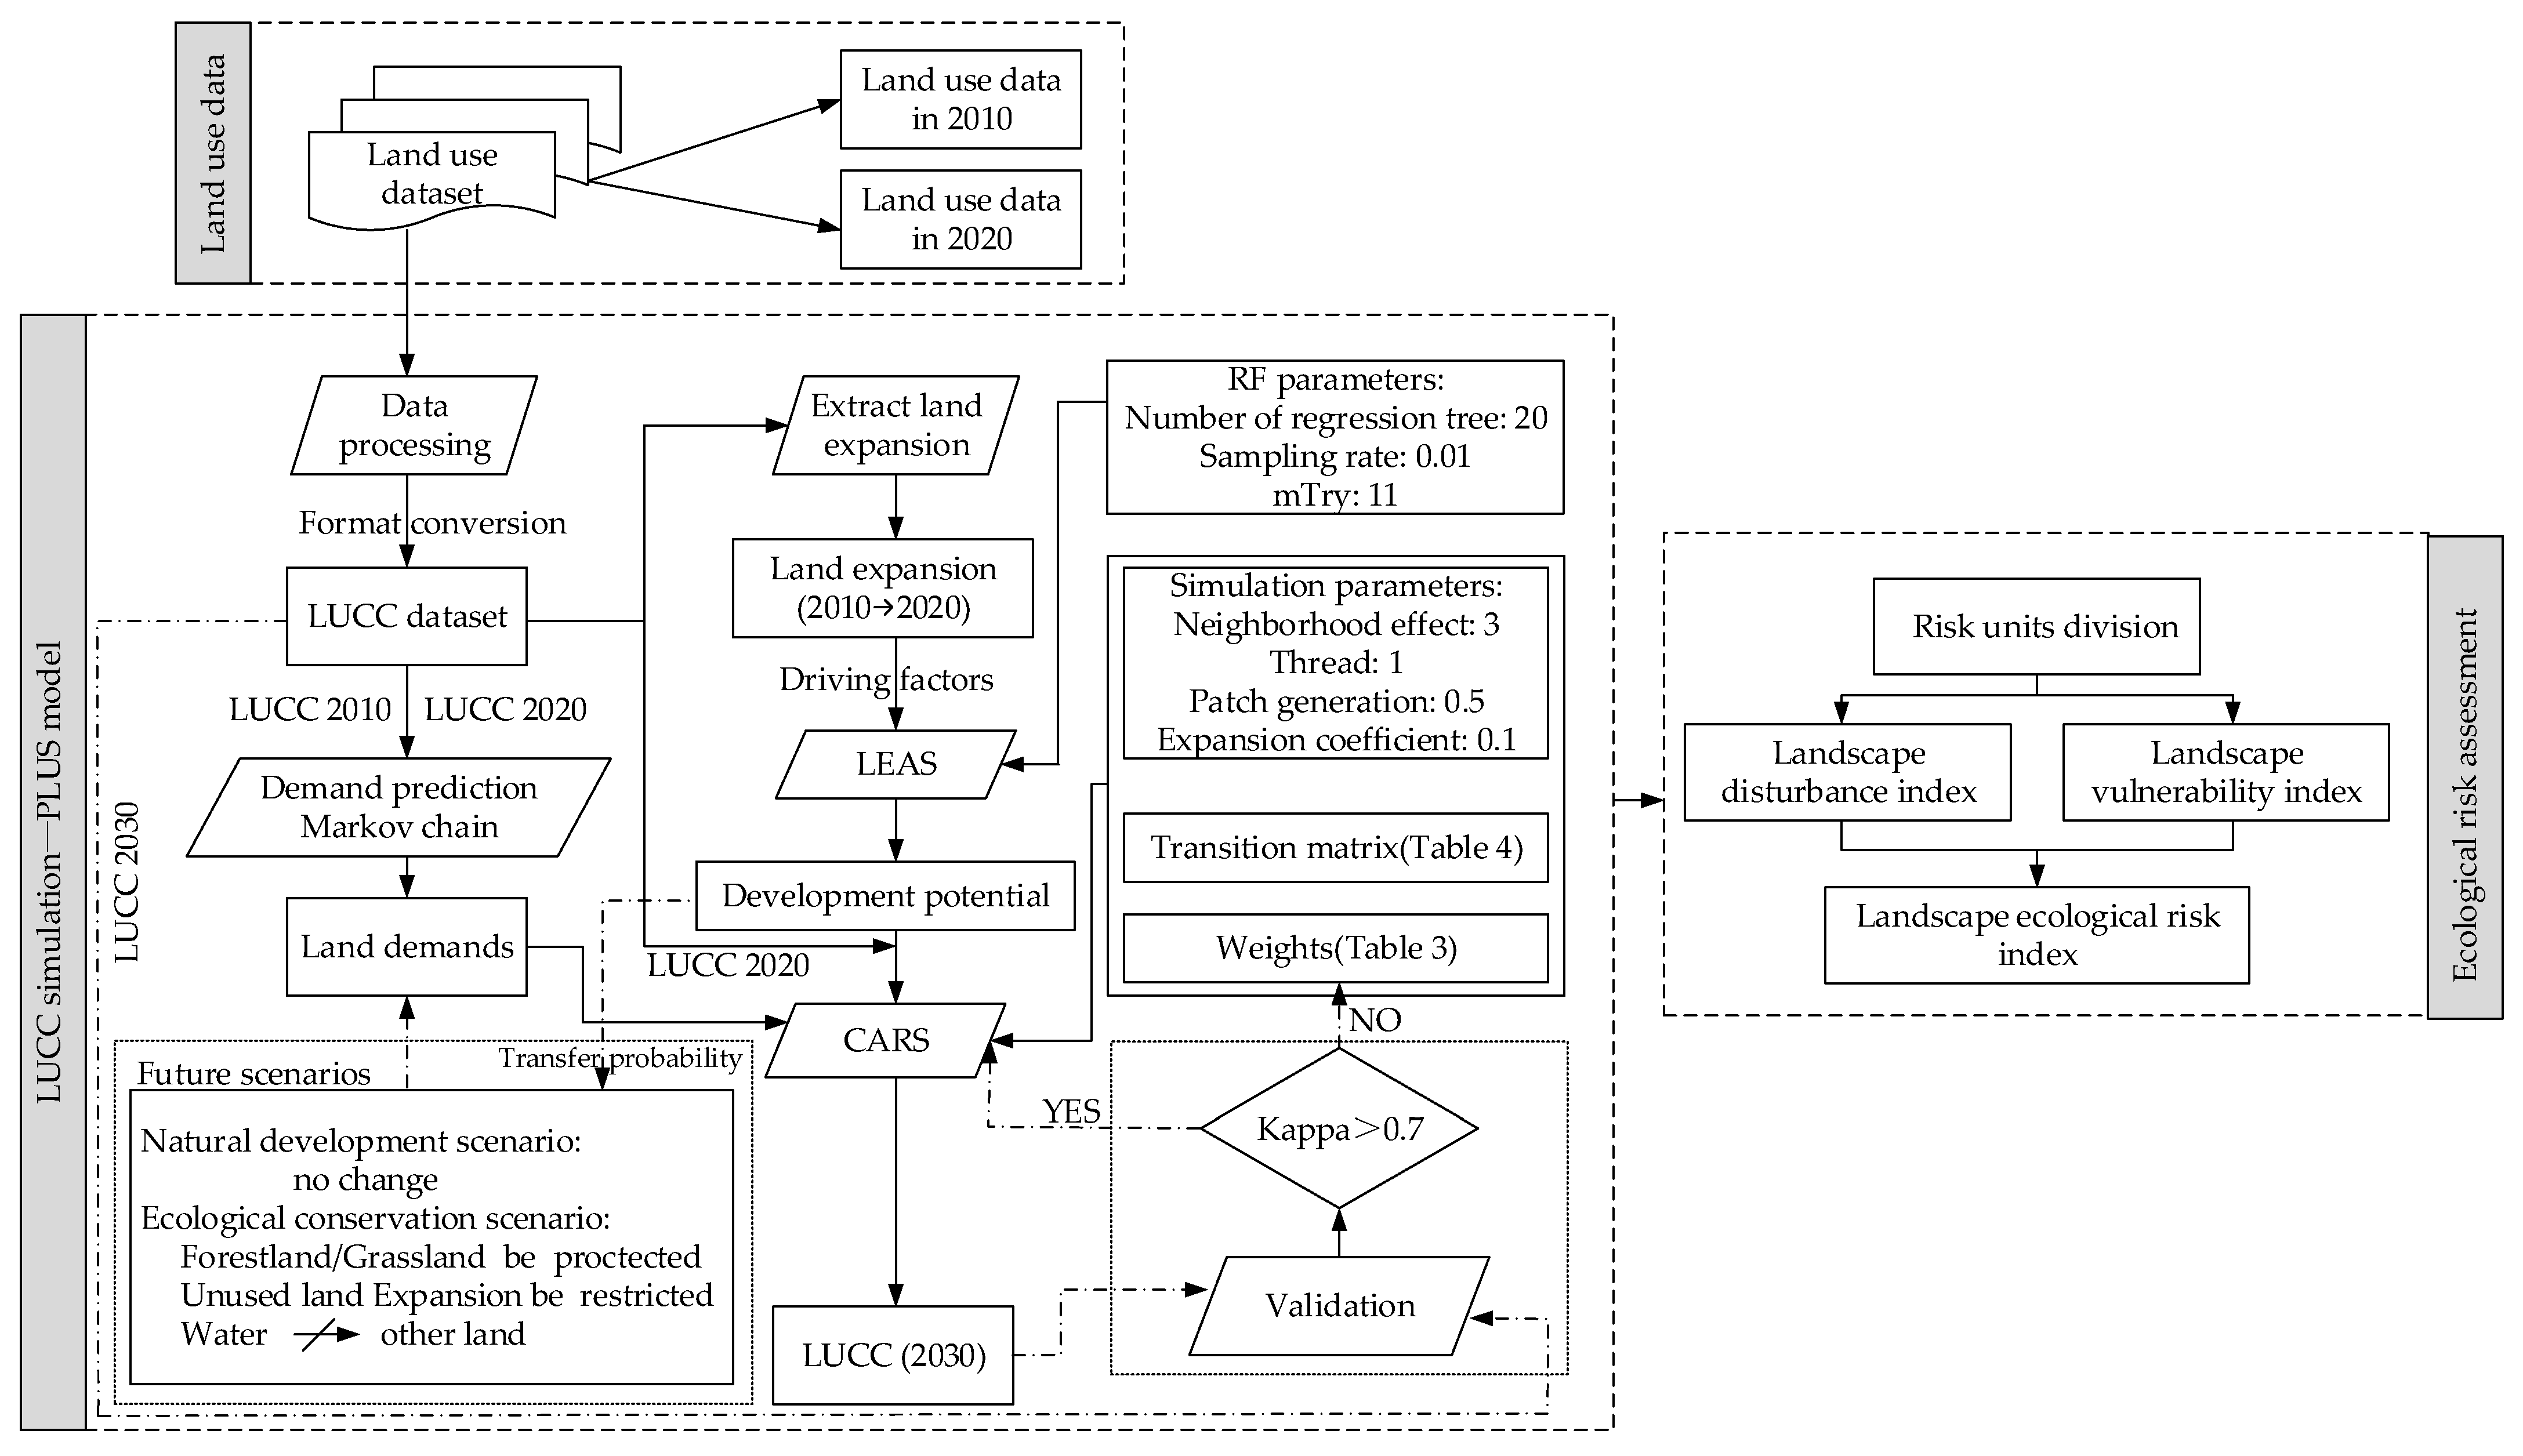
In recent years, the increasing intensity of human activities on the QTP combined with natural conditions, such as an uneven distribution of precipitation and a complex topography, has led to changes in regional land use types [36]. LUCC is the result of the interaction between humans and nature [37,38]. Based on existing research [39,40] combined with the actual situation of the study area, the driving factors of land use simulation were selected from the aspects of nature and socioeconomic; ArcGIS was used to make the driving factors dataset (Figure 3). All the driving factors were resampled into 1 km raster, and the number of rows and columns was 1982 and 2549, respectively. The projection was unified as Asia_Lambert_Conformal_Conic. As there is a large amount of frozen soil in the QTP, which is different from other regions in terms of driving factors selection, this study tested the rationality of the selection of frozen soil factors. With the participation of frozen soil, land use development potential is A. Then, according to the land use data of 2010 and the land use development potential A, the land use data C was simulated. Without the participation of frozen soil, land use development potential is B. Then, according to the land use data of 2010 and the land use development potential B, the land use data D was simulated. Finally, the actual land use data of 2020 and the simulated land use data C and D, for 2020, were tested using a Kappa test. When the sampling rate was 10%, the Kappa coefficient for land use data C was 0.995, which was higher than D. This indicates that the model simulation accuracy was higher when there was frozen soil in the driving factors.

2.3.2. PLUS Model

The full name of the PLUS model is the patch-generating land use simulation model, which was developed by the Guan’s group in 2021 [11]. The PLUS model, an improvement of the FLUS model, achieves higher simulation accuracy and better results than other land use simulation models [41]. The PLUS model mainly consists of two parts: land expansion analysis strategy (LEAS) and Cellular Automata acronym (CA) based on multiple random patch seeds (CARS) [11]. In this study, land demands for equal time intervals were first obtained in the Markov chain module using LUCC from 2010 to 2020. Secondly, we input LUCC for 2010, development potential, conversion constrains, transition matrix, LUCC weights, and land demands and model parameters (Neighborhood Size, Patch generation, and Expansion coefficient) in the CARS module to simulate the LUCC for 2020. Then, the accuracy of Kappa was checked against the actual LUCC (10% of the sampling points were chosen for the Kappa test), the simulation parameters and LUCC weights were continuously adjusted to obtain the best results. The weights for cropland, forestland, grassland, water, built-up land, and unused land are shown in Table 3. Finally, we used the 2020 LUCC as the base year so that the model could be used to predict 2030 LUCC. The Kappa test is a method to verify the accuracy of model results, which can detect and analyze simulation results from both quantity and position. It is often used to measure the accuracy of prediction results [42]. For a sampling rate of 10%, the Kappa coefficient in this study is as high as 0.995, indicating that the PLUS model had extremely high applicability for the QTP. The PLUS model can be downloaded at https://github.com/HPSCIL.

2.3.3. Future Scenarios Analysis

In this study, the natural development and ecological conservation scenarios were combined with the PLUS model to predict multiple scenarios for LUCC on the QTP in 2030. The natural development scenario is one in which the conversion rate of land use remains unchanged; moreover, the influence of various suitability factors on land use change remains consistent with before, and land use change occurs mainly due to the current socioeconomic development status and physical-geographical factors [43]. The ecological conservation scenario is a comprehensive and sustainable future land use change scenario. This scenario follows the principle of sustainable development and emphasizes coordinated development and conservation [44]; it is also an ideal scenario for future land use change on the QTP. Under the ecological conservation scenario forestland and grassland are protected, the transfer of forestland to grassland is prohibited, the expansion of unused land is restricted, and the transfer of water to other land is prohibited. The transition matrix under different scenarios is shown in Table 4.

2.3.4. Landscape Ecological Risk Assessment

In this study, landscape ecological risk assessment for the QTP was realized by constructing the landscape ecological risk index. The landscape ecological risk index ( E R I k ) of the QTP consists of the landscape disturbance index ( E i ) and landscape vulnerability index ( F i ). The landscape disturbance index includes the landscape fragmentation index ( C i ), landscape separation index ( S i ), and landscape dominance index ( D i ). This study area was divided into 10 km × 10 km, comprising a total of approximately 25,000 risk units.
(1)
Landscape disturbance index ( E i )
The landscape disturbance index was used to reflect the degree of external disturbance in the ecosystem represented by different land types on the QTP. The greater the disturbance, the greater the ecological risk [45,46].
(i)
Landscape fragmentation index ( C i )
The landscape fragmentation index represents the process in which patches of each land cover type change from single continuous to complex discontinuous under natural or human disturbance. The greater the value, the lower the stability of the ecosystem of the corresponding land cover type [47]. The formula is:
C i = N i A i
N i is the number of patches of land use type i ; A i is the area of land use type i .
(ii)
Landscape separation index ( S i )
The landscape separation index represents the degree of separation of different patch distributions in a single land cover type. The larger the value, the more geographically dispersed and complex the distribution of the land cover type is [48]. The formula is:
S i = N i × A 2 A i
A is the area of risk assessment unit.
(iii)
Landscape dominance index ( D i )
The landscape dominance index represents the extent to which the land cover structure is dominated by a certain type; it also reflects the influence of the land cover type on the formation and change of the landscape pattern. The larger the landscape dominance index, the higher the landscape ecological risk. The formula is:
D i = Q i + M i / 4 + L i / 2
Q i is the ratio between the number of risk assessment units and the total number of risk assessment units of land use type; i . M i is the ratio of the number of patches of land use type i to the total number of patches in the evaluation unit. L i is the ratio between the patch area of land use type i and the total area of evaluation unit, namely, the relative density of land use type i .
The weights of C i , S i , and D i were, respectively 0.5, 0.3, and 0.2 [49,50,51], and the formula for the landscape disturbance index is as follows:
E i = a × C i + b × S i + c × D i
(2)
Landscape vulnerability index ( F i )
Landscape vulnerability refers to the vulnerability of internal structures of ecosystems represented by different landscapes; it reflects the resistance capacity of different landscape types to external disturbances [52]. According to research results of others [53,54], and the actual situation of the study area, the vulnerability of landscape types in the study area was divided into six levels, from high to low, as follows: for unused land, water, grassland, cropland, forestland, and built-up land the values from high to low were 6, 5, 4, 3, 2, 1. These values were normalized to obtain the F i values of the landscape vulnerability index for each land use type: 0.28, 0.24, 0.19, 0.14, 0.10, and 0.05, respectively.
(3)
Landscape ecological risk index ( E R I k )
The landscape disturbance index and landscape vulnerability index were used to calculate the landscape risk index, and the formula is as follows:
E R I k = i = 1 n A i A E i F i
Semi-variogram fitting and Kriging interpolation method were used to process the data for 2010, 2020, and 2030 to obtain a spatial distribution map of landscape ecological risk.

3. Results

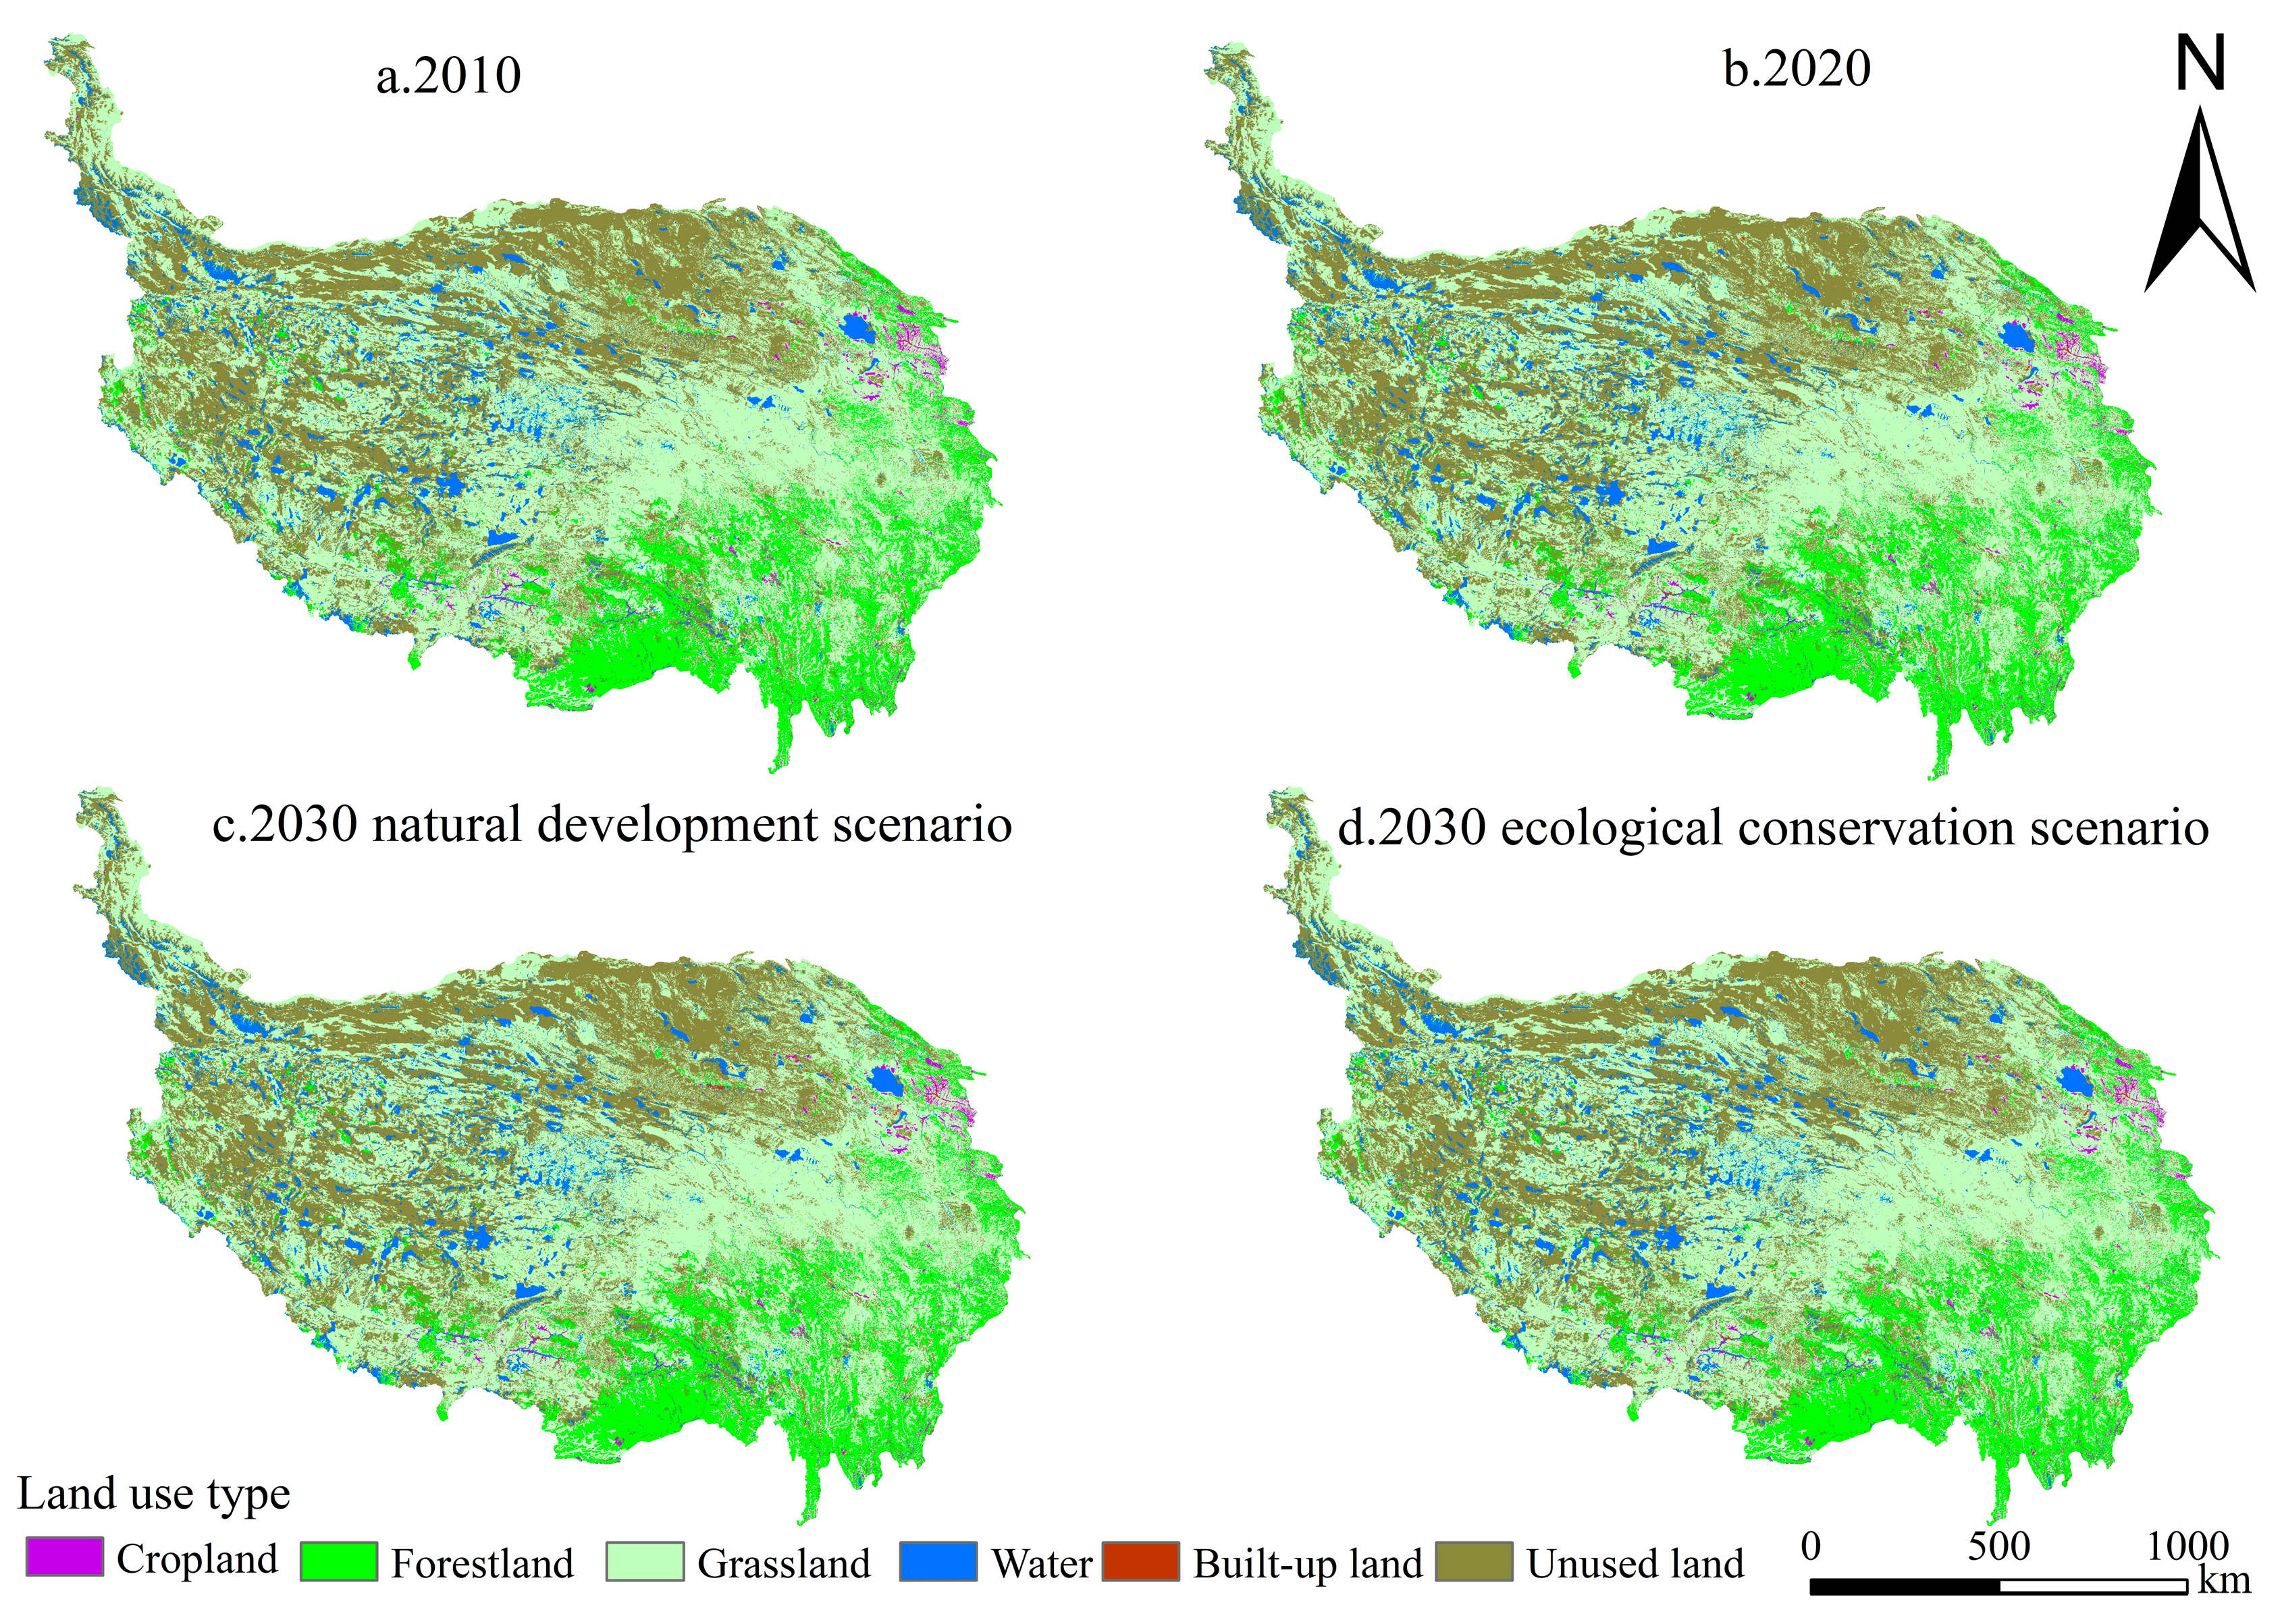
3.1. Land Use Spatiotemporal Change

As can be seen from Figure 4, there was no significant change in land use pattern for the entire QTP in 2010 or 2020, as well as in the natural development and ecological conservation scenarios of 2030. Cropland mainly existed in the northeastern margin of the QTP, One River, and Two Rivers Streams areas, forestland mainly existed in the southeast of the QTP, and grassland existed throughout the QTP. Water mainly existed in the western and northern part of the QTP. Unused land mainly existed in the western and southern part of the QTP. However, the land use transition matrix (Table 5) showed that, from 2010 to 2020, the largest areas of unused land and grassland converted to water were 3581 km2 and 1827 km2, respectively, while the largest areas of cropland, grassland, and unused land converted into built-up land were 223 km2, 349 km2, and 242 km2, respectively. Analysis from another perspective; a total of 5628 km2 of other land were converted to water. The areas were 939 km2 and 848 km2 of other land which were converted to built-up land and unused land, respectively. The main characteristics of land use type transfer from 2010 to 2020 were grassland and unused land converted to water, cropland, grassland, and unused land converted to built-up land.
From 2010 to 2020, the areas of cropland, forestland, grassland, and unused land on the QTP decreased by 156 km2, 132 km2, 2144 km2, and 3147 km2, respectively, while the areas of water and built-up land increased by 4777 km2 and 802 km2, respectively, in Table 6. In 2020, the areas of different land use types on QTP were grassland, unused land, forestland, water, cropland, and built-up land in descending order. In 2020, built-up land accounted for less than 0.1% of the total area, but compared with that in 2010, the built-up land area had increased by nearly 46%, indicating that human activities on the QTP were getting stronger. These likely led to an increase in ecological risk on the QTP.
The trends in land use change for the future natural development scenario and the ecological conservation scenario differ from one another. In the natural development scenario, the land use change trend for 2020 to 2030 is nearly the same as that for 2010 to 2020. The areas of cropland, forestland, grassland, and unused land decrease, while the area of other land increases. In the ecological conservation scenario, the areas of grassland, water, and built-up land gradually increase, while the area of forestland does not change. Cropland and unused land decrease. This indicates that, in the ecological conservation scenario, forestland and grassland, as the main ecological land, are effectively protected. Compared with the natural development scenario, the areas of forestland and grassland increase by 130 km2 and 2293 km2, respectively, and the area of built-up land decreases by 718 km2.

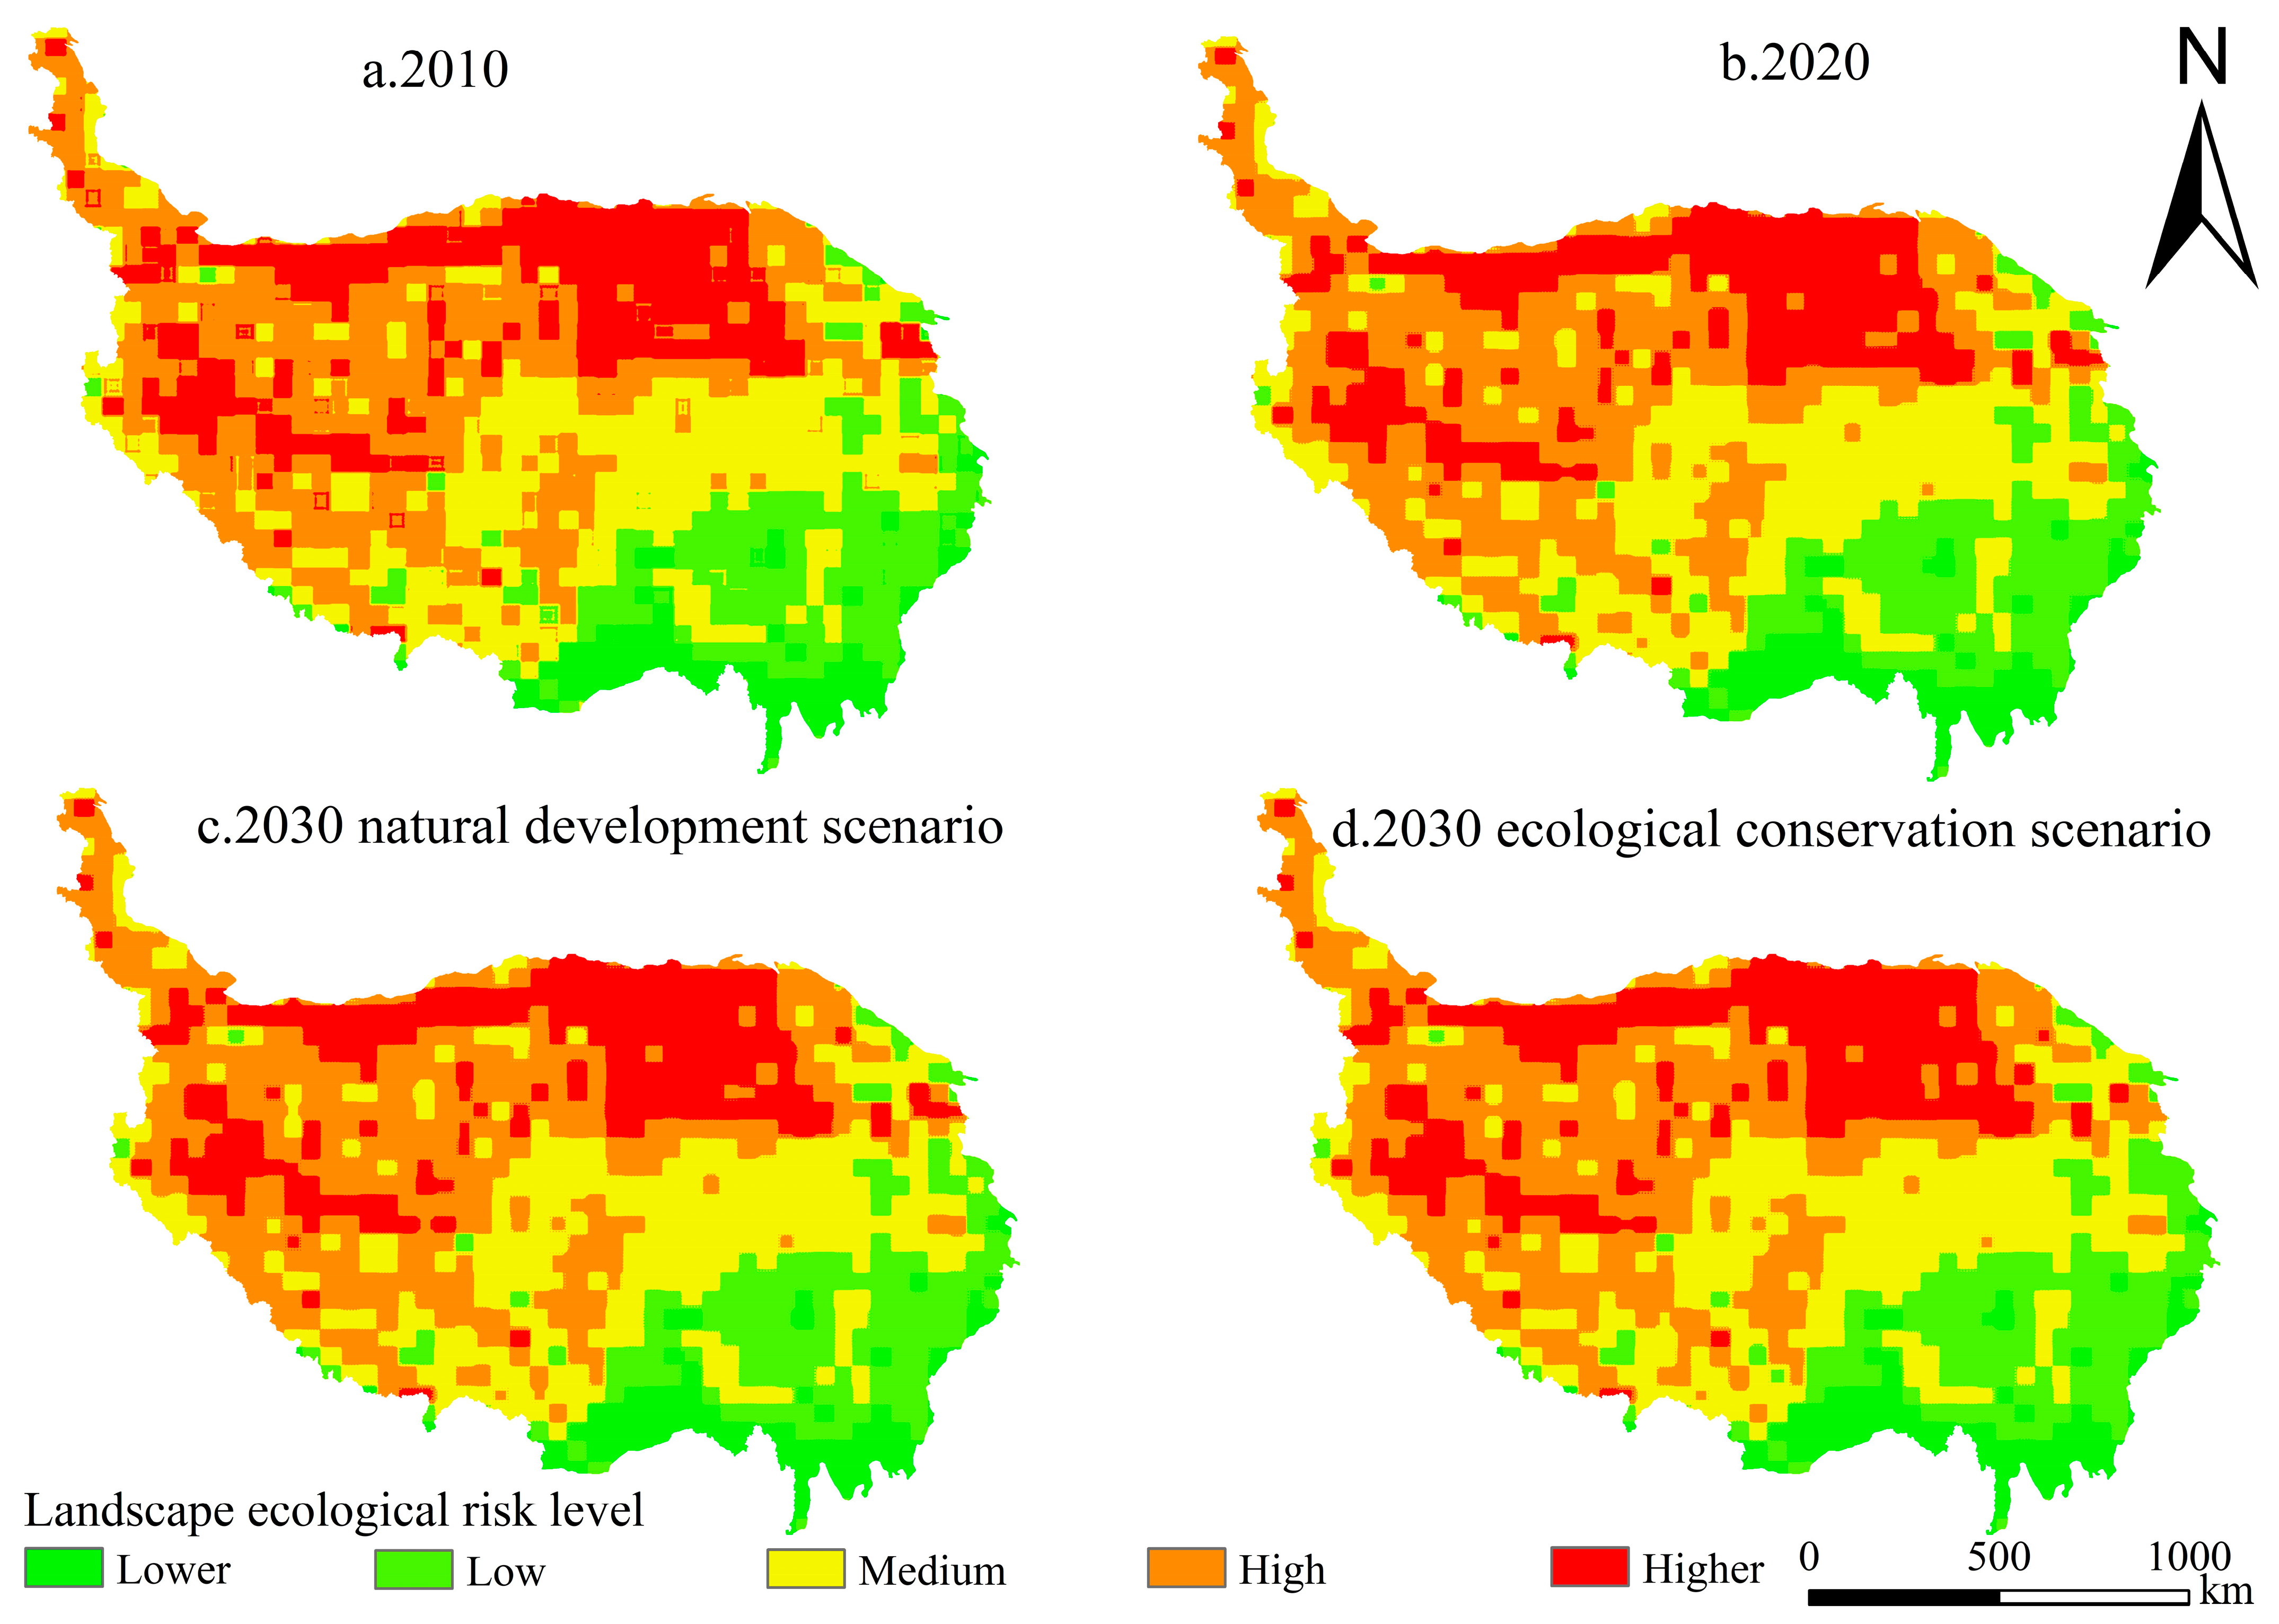
3.2. Landscape Ecological Risk Spatiotemporal Change

Land use type and its change affected landscape ecological risk in the QTP. The natural break point method was adopted to divide the landscape ecological risk value of the QTP into five levels: lower ecological risk ( E R I ≤ 0.014), low ecological risk (0.014 < E R I ≤ 0.024), medium ecological risk (0.024 < E R I ≤ 0.031), high ecological risk (0.031 < E R I ≤ 0.038), and higher ecological risk (0.038 < E R I ).
The higher ecological risk areas of the QTP were mainly distributed in its northern part and that the land use type was mainly unused land in Figure 5. Lower, low, and medium ecological risk areas were mainly distributed in the southern part of the QTP, and the land use types were mainly forestland and grassland. High risk areas were mainly distributed in higher risk areas.
From 2010 to 2020, the areas of low, medium, and high ecological risk on the QTP had an increasing trend, increasing by 505 km2, 12,358 km2, and 9270 km2, respectively; while the areas of lower and higher risk had a decreasing trend, decreasing by 4043 km2 and 18,089 km2, respectively, in Table 7. This indicated that the overall ecological risk of the QTP increased during from 2010 to 2020, but the ecological risk in some higher-risk areas was alleviated. In 2020, the landscape ecological risks on the QTP were mainly medium, high, and higher ecological risks, accounting for 27.85%, 32.57%, and 19.02% of the total area, respectively; 14.37% of the low-risk area and 6.19% of the lower risk area. In the simulation results for 2030 under the two scenarios, the landscape ecological risk area of the QTP at all levels is still dominated by the area proportion of medium, high, and higher ecological risk area. The area proportion of low ecological risk area, and the area proportion of lower ecological risk area is the smallest. Under the natural development scenario, the five types of ecological risk area account for 27.78%, 32.51%, 19.15%, 14.40%, and 6.15%, respectively, while under the ecological conservation scenario, the five types of ecological risk area account for 27.53%, 32.77%, 18.89%, 14.50%, and 6.31%, respectively.
Compared with the natural development scenario, under the ecological conservation scenario, the areas of lower and low ecological risk areas increase by 4044 km2 and 2484 km2, respectively, and the areas of medium and higher ecological risk areas decrease by 6333 km2 and 6597 km2 in 2030, respectively. Therefore, the implementation of ecological conservation does indeed reduce the ecological risk of the QTP.

4. Discussion

4.1. Land Use Simulation and Its Results

Regarding the selection of driving factors for land use simulation, different from Zhou et al. [55], this study not only selected some conventional factors, but also innovatively added the driving factor of frozen soil to participate in the calculation of the model according to the actual situation of the QTP. The reason for this was that there is a large amount of frozen soil distribution on the QTP. Existing studies show that the degradation of frozen soil increases the active layer, which increases soil water infiltration, reduces surface soil water, and leads to vegetation degradation, thus causing a change in land use type [56,57].
According to the simulation results, in both the ecological conservation scenario and the natural development scenario, in 2030, the area of cropland will decrease and the area of water will increase, which is consistent with the research results of Zhou et al. [55]. The decrease in cropland area is due to the implementation of ecological fallowing policies [58], while the increase in water area is due to the melting of glaciers and frozen soil on the QTP. This melting is caused by global warming, increasing surface runoff, and water from lakes and rivers [59]. The differences between this study and that of Zhou et al. are as follows: The Kappa coefficient of this study is higher than that of Zhou et al. Moreover, this study showed the future land use pattern for each land use type, while the study of Zhou et al. did not.

4.2. Landscape Ecological Risk Results

Overall, the results of our study were highly consistent with the results of Wang et al. [60] and Wang et al. [61] regarding the current landscape ecological risk of the QTP; however, differences existed between our study and these two studies with respect to the western QTP. Our landscape ecological risk of the western QTP is higher than that of the two studies because of our higher vulnerability value for grassland. Grassland is an important part of the QTP ecosystem, and grassland degradation has become a major threat to the QTP’s ecological security [62]. Therefore, this study assigns a higher vulnerability value to grassland.

4.3. Policy Implications

In the context of policy formation, we propose that in the high landscape ecological risk areas of the northwestern QTP human activities, especially overgrazing, should be strictly controlled; nature reserves and national parks should be established to reduce the landscape ecological risk. Moreover, protecting frozen soil, in the construction of infrastructure and in mining, should be a priority.

4.4. Advantages, Limitations and Future Work

Landscape ecological risk assessment of the QTP in this study combined geographical processes and ecological processes. Using this combination and a PLUS model effectively revealed the past, present, and future ecological risk changes of the QTP. The potential application of the research results lies in the construction of ecological reserves.
Of course, our study had some limitations. The QTP is a large region and has a complex internal ecosystem, which is composed of a number of physical geographical areas with their own characteristics. However, the results obtained in this study are a whole result, and the landscape ecological risk of each physical geographical area has not been evaluated. Therefore, in the future, the landscape ecological risk analysis of the QTP will be comprehensively analyzed by combining the different natural and social-economic factors of each physical geographical area.

5. Conclusions

In this study, the PLUS model and landscape ecological risk index were used to analyze the past, present, and future land use patterns and landscape-ecological risk changes on the QTP. The results are as follows:
  • Under the natural development scenario, the land use pattern and change trend of the QTP during 2020–2030 were basically the same as that during 2010–2020. The area of cropland, forestland, grassland, and unused land was gradually smaller, while the area of other land use types was constantly increasing. The areas of forest land did not change, the area of cropland and unused land decreased, and the area of forestland and grassland increased by 130 km2 and 2293 km2, respectively, compared with the natural scenario.
  • Under the natural development scenario, the overall ecological risk for the QTP increased from 2010 to 2030.This indicates that the proportion of low ecological risk area decreased, while the proportions of medium and high ecological risk area increased. In the ecological conservation scenario, compared with the natural development scenario, the area of lower, low, and high ecological risk increased by 4044 km2, 2484 km2, and 6401 km2 respectively, while the area of medium and high ecological risk decreased by 6333 km2 and 6597 km2 respectively.

Author Contributions

Conceptualization, N.S., Q.C. and F.L.; Data curation, Y.G.; Formal analysis, N.S.; Funding acquisition, Q.C.; Methodology, N.S. and W.H.; Project administration, N.S.; Resources, Y.G.; Software, W.H.; Supervision, Q.Z.; Writing—original draft, N.S.; Writing—review and editing, N.S., W.H. and Y.G. All authors have read and agreed to the published version of the manuscript.

Funding

This research was funded by the National Natural Science Foundation of China (Grant No. 42061023).

Data Availability Statement

The data presented in this study are available on request from the corresponding author. The data are not publicly available due to privacy.

Conflicts of Interest

The authors declare no conflict of interest.

References

  1. Wu, T. The Qinghai-Tibetan Plateau: How High Do Tibetans Live? High Alt. Med. Biol. 2001, 2, 489–499. [Google Scholar] [CrossRef] [PubMed]
  2. Sun, H.; Zheng, D.; Yao, T.; Zhang, Y. Protection and Construction of the National Ecological Security Shelter Zone on Tibetan Plateau. Acta Geogr. Sin. 2012, 67, 3–12. [Google Scholar]
  3. Qiu, J. China: The Third Pole. Nature 2008, 454, 393–396. [Google Scholar] [CrossRef] [PubMed]
  4. Zhang, Y.; Liu, L.; Wang, Z.; Bai, W.; Ding, M.; Wang, X.; Yan, J.; Xu, E.; Wu, X.; Zhang, B.; et al. Spatial and Temporal Characteristics of Land Use and Cover Changes in The Tibetan Plateau. Chin. Sci. Bull 2019, 64, 2865–2875. [Google Scholar]
  5. Peng, J.; Dang, W.; Liu, Y.; Zong, M.; Hu, X. Review on Landscape Ecological Risk Assessment. Acta Geogr. Sin. 2015, 70, 664–677. [Google Scholar]
  6. Rosa, D.L.; Martinico, F. Assessment of hazards and risk for landscape protection planning in Sicily. J. Environ. Manag. 2013, 127, 155–167. [Google Scholar] [CrossRef]
  7. Fu, B.; Zhang, L. Land-use Change and Ecosystem Services: Concepts, Methods and Progress. Prog. Geog. 2014, 33, 441–446. [Google Scholar]
  8. Chen, Q.; Zhang, Y.; Liu, F.; Zhou, Q.; Wang, S.; Cheng, Y.; Gou, R.; Zhi, Z.; Xu, H. A Review of Land Use Change and Its Influence in The Source Region of Yellow River. Resour. Sci. 2020, 42, 446–459. [Google Scholar] [CrossRef]
  9. Verburg, P.H.; Soepboer, W.; Veldkamp, A. Modeling the Spatial Dynamics of Regional Land Use: The CLUE-S Model. Environ. Manag. 2002, 30, 391–405. [Google Scholar] [CrossRef]
  10. Liu, X.; Liang, X.; Li, X.; Xu, X.; Ou, J.; Chen, Y.; Li, S.; Wang, S.; Pei, F. A Future Land Use Simulation Model (FLUS) for Simulating Multiple Land Use Scenarios by Coupling Human and Natural Effects. Landsc. Urban Plan. 2017, 168, 94–116. [Google Scholar] [CrossRef]
  11. Liang, X.; Guan, Q.; Clarke, K.C.; Liu, S.; Wang, B.; Yao, Y. Understanding the Drivers of Sustainable Land Expansion Using a Patch-generating Land Use Simulation (PLUS) Model: A Case Study in Wuhan, China. Comput. Environ. Urban Syst. 2021, 85, 101569. [Google Scholar] [CrossRef]
  12. Jiang, L.; Yu, J.; Wen, J.; Tang, J.; Qi, M.; Wang, L.; Zhang, M. Risk Assessment of Extreme Flood in The North Bank of The Hangzhou Bay Under Land Use Change Scenarios. Prog. Geogr. 2021, 40, 1355–1370. [Google Scholar] [CrossRef]
  13. Bai, W.; Yao, L.; Zhang, Y.; Wang, C. Spatial-temporal dynamics of cultivated land in recent 35 years in the Lhasa River Basin of Tibet. J. Nat. Resour. 2014, 29, 623–632. [Google Scholar]
  14. Wang, C.; Zhang, Y.; Wang, Z.; Bai, W. Analysis of Landscape Characteristics of the Wetland Systems in the Lhasa River Basin. Resour. Sci. 2010, 32, 1634–1642. [Google Scholar]
  15. Chu, D.; Zhang, Y.; Ciren, B.; Liu, L. Land use dynamics in Lhasa area, Tibetan Plateau. J. Geogr. Sci. 2010, 20, 899–912. [Google Scholar] [CrossRef]
  16. Wan, F.; Deng, Q.; Liu, L.; Li, P.; Yang, X. Spatial and Temporal Evolution of Cultivated Land in Hehuang Valley During 1990–2018. Bull Soil Water Conserv. 2021, 41, 275–282. [Google Scholar]
  17. Sun, X.; Jiao, J.; Wang, H.; Li, J.; Chen, T.; Zhao, W.; Cheng, Y. Land Use Changes and Cold-hot Spot Distribution in Hehuang Valley from 1980–2020. Bull Soil Water Conserv. 2022, 42, 327–334. [Google Scholar]
  18. Cao, X.; Ganzhu, Z.; Liang, Y.; Gao, Q.; Zhang, Y.; Li, Y.; Wan, Y.; Danjiu, L. Temporal and Spatial Distribution of Grassland Degradation in Northern Tibet Based on NDVI. Acta Pratacul. Sin. 2016, 25, 1–8. [Google Scholar]
  19. Li, B. Dynamic Change of Grassland in Northern Tibetan Plateau Based on Remote Sensing and IBIS Model. Master Dissertation, Lanzhou University, Lanzhou, China, 2018. [Google Scholar]
  20. Song, C.; You, S.; Liu, G.; Ke, L.; Zhong, X. Spatio-temporal Pattern and Change of Nagqu Grassland and the Influence of Human Factors. Acta Pratacul. Sin. 2012, 21, 1–10. [Google Scholar]
  21. Xu, Q.; Li, Q.; Chen, D.; He, F.; Chen, X.; Zhao, X.; Zhao, L. The Spatial-temporal Characteristic of Land Use Change in Sanjiangyuan Region and Its Effect Factors. Ecol. Environ. 2017, 26, 1836–1843. [Google Scholar]
  22. Shao, Q.; Xiao, T.; Liu, J.; Qi, Y. Soil Erosion Rates and Characteristics of Typical Alpine Meadow Using137 Cs Technique in Qinghai-Tibet Plateau. Chin. Sci. Bull 2011, 56, 1019–1025. [Google Scholar] [CrossRef]
  23. Bajracharya, B.; Uddin, K.; Chettri, N.; Shrestha, B.; Siddiqui, S.A. Understanding Land Cover Change Using a Harmonized Classification System in the Himalaya. Mt. Res. Dev. 2010, 30, 143–156. [Google Scholar] [CrossRef]
  24. Shi, Y.; Cai, K.; Wu, W.; Xu, Y.; Li, K.; Laba, C.; Gong, Z. Research on Land Use Distribution Based on Topographic Differentiation-A Case Study of Qomolangma National Nature Reserve. Res. Soil Water Conserv. 2021, 28, 394–400. [Google Scholar]
  25. Xu, H. Land use/cover Change and Effectiveness Analysis of Nature Protection in the Himalayan Region. Master Dissertation, Qinghai Normal University, Xining, China, 2022. [Google Scholar]
  26. Chen, H.; Liu, J.; Cao, Y.; Li, S.; Ouyang, H. Ecological Risk Assessment of Regions Along the Roadside of the Qinghai-Tibet Highway and Railway Based on an Artificial Neural Network. Hum. Ecol. Risk Assess. Int. J. 2007, 13, 900–913. [Google Scholar]
  27. Zhou, W.; Zeng, Y.; Chen, S.; Yan, Y. Ecological Risk Appraisal of Programming Infrastructure Construction in Tibet Plateau: A Case Study on Sannan Administrative Region. J. Nat. Disasters 2007, 16, 21–26. [Google Scholar]
  28. Jin, X.; Jin, Y.; Mao, X. Ecological Risk Assessment of Cities on the Tibetan Plateau Based on Land Use/Land Cover Changes–Case Study of Delingha City. Ecol. Indic. 2019, 101, 185–191. [Google Scholar] [CrossRef]
  29. Wang, B.; Ding, M.; Li, S.; Liu, L.; Ai, J. Assessment of Landscape Ecological Risk for a Cross-Border Basin: A Case Study of the Koshi River Basin, Central Himalayas. Ecol. Indic. 2020, 117, 106621. [Google Scholar] [CrossRef]
  30. Hou, M.; Ge, J.; Gao, J.; Meng, B.; Li, Y.; Yin, J.; Liu, J.; Feng, Q.; Liang, T. Ecological Risk Assessment and Impact Factor Analysis of Alpine Wetland Ecosystem Based on LUCC and Boosted Regression Tree on the Zoige Plateau, China. Remote Sens. 2020, 12, 368. [Google Scholar] [CrossRef]
  31. Li, L.; Wu, J.; Lu, J.; Min, X.; Xu, J.; Yang, L. Distribution, Pollution, Bioaccumulation, and Ecological Risks of Trace Elements in Soils of the Northeastern Qinghai-Tibet Plateau. Ecotox. Environ. Saf. 2018, 166, 345–353. [Google Scholar] [CrossRef]
  32. Zhang, Y.; Li, B.; Liu, L.; Zheng, D. Redetermine the Region and Boundaries of Tibetan Plateau. Geogr. Res. 2021, 40, 1543–1553. [Google Scholar]
  33. Li, H.; Zhang, C.; Wang, S.; Ma, W.; Liu, F.; Chen, Q.; Zhou, Q.; Xia, X.; Niu, B. Response of Vegetation Dynamics to Hydro-thermal Conditions on the Qinghai-Tibet Plateau in the Last 40 Years. Acta Ecol. Sin. 2022, 42, 4770–4783. [Google Scholar]
  34. Yao, T.; Wu, G.; Xu, B.; Wang, W.; Gao, J.; An, B. Asian Water Tower Change and Its Impacts. Bull Chin. Acad. Sci. 2019, 34, 1203–1209. [Google Scholar]
  35. Ran, Y.; Li, X.; Cheng, G.; Nan, Z.; Che, J.; Sheng, Y.; Wu, Q.; Jin, H.; Luo, D.; Tang, Z.; et al. Mapping the Permafrost Stability on the Tibetan Plateau for 2005–2015. Sci. China Earth Sci. 2021, 64, 62–79. [Google Scholar] [CrossRef]
  36. Peng, H.; Ren, Y.; Li, Q.; Wei, J. Spatial and Temporal Land Use/Cover Change Characteristics of Qinghai-Tibet Plateau. J. Yangtze River Sci. Res. Inst. 2022, 39, 41–49+57. [Google Scholar]
  37. Li, X. A Review of the International Researches on Land Use/Land Cover Change. Acta Geogr. Sin. 1996, 51, 553–558. [Google Scholar]
  38. Li, P.; Li, X.; Liu, X. Macro-analysis on the Driving Forces of the Land-use Change in China. Prog. Geog. 2001, 20, 129–138. [Google Scholar]
  39. Zhu, Z.; Woodcock, C.E. Continuous change detection and classification of land cover using all available Landsat data. Remote Sens. Env. 2014, 144, 152–171. [Google Scholar] [CrossRef]
  40. Sun, D.; Liang, Y. Multi-scenario simulation of land use dynamic in the Loess Plateau using an improved Markov-CA model. J. Geo.-Inf. Sci. 2021, 23, 825–836. [Google Scholar]
  41. Zhang, S.; Zhong, Q.; Cheng, D.; Xu, C.; Chang, Y.; Lin, Y.; Li, B. Coupling Coordination Analysis and Prediction of Landscape Ecological Risks and Ecosystem Services in the Min River Basin. Land 2022, 11, 222. [Google Scholar] [CrossRef]
  42. Zhang, X.; Zhou, J.; Li, M. Analysis on spatial and temporal changes of regional habitat quality based on the spatial pattern reconstruction of land use. Acta Geogr. Sin. 2020, 75, 160–178. [Google Scholar]
  43. Deng, H.; Shao, J.; Wang, J.; Gao, M.; Wei, C. Land Use Driving Forces and Its Future Scenario Simulation in the Three Gorges Reservoir Area Using CLUE-S model. Acta Geogr. Sin. 2016, 71, 1979–1997. [Google Scholar]
  44. Zhang, Y.; Shi, X.Y.; Tang, Q. Carbon Storage Assessment in the Upper Reaches of the Fenhe River Under Different Land Use Scenarios. Acta Ecol. Sin. 2021, 41, 360–373. [Google Scholar]
  45. Zeng, C.; He, J.; He, Q.; Mao, Y.; Yu, B. Assessment of Land Use Pattern and Landscape Ecological Risk in the Cheng-du-Chongqing Economic Circle, Southwestern China. Land 2022, 11, 659. [Google Scholar] [CrossRef]
  46. Hu, H.; Liu, H.; Hao, J. The Urbanization Effects on Watershed Landscape Structure and their Ecological Risk Assessment. Acta Ecol. Sin. 2011, 31, 3432–3440. [Google Scholar]
  47. Zhang, X.; Shi, P.; Luo, J.; Liu, H.; Wei, W. The Ecological Risk Assessment of Arid Inland River Basin at the Landscape Scale: A Case Study on Shiyang River Basin. J. Nat. Res. 2014, 29, 410–419. [Google Scholar]
  48. Qu, Z.; Zhao, Y.; Luo, M.; Han, L.; Yang, S.; Zhang, L. The Effect of the Human Footprint and Climate Change on Landscape Ecological Risks: A Case Study of the Loess Plateau, China. Land 2022, 11, 217. [Google Scholar] [CrossRef]
  49. Mo, W.; Wang, Y.; Zhang, Y.; Zhuang, D. Impacts of Road Network Expansion on Landscape Ecological Risk in a Megacity, China: A Case Study of Beijing. Sci. Total Environ. 2017, 574, 1000–1011. [Google Scholar] [CrossRef]
  50. Ai, J.; Yu, K.; Zeng, Z.; Yang, L.; Liu, Y.; Liu, J. Assessing the Dynamic Landscape Ecological Risk and Its Driving Forces in An Island City Based on Optimal Spatial Scales: Haitan Island, China. Ecol. Indic. 2022, 137, 108771. [Google Scholar] [CrossRef]
  51. Xie, X.; Chen, Z.; Wang, F.; Bai, M.; Xu, W. Ecological Risk Assessment of Taihu Lake Basin Based on Landscape Pattern. Chin. J. Appl. Ecol. 2017, 28, 3369–3377. [Google Scholar]
  52. Zhang, X.; Yao, L.; Luo, J.; Liang, W. Exploring Changes in Land Use and Landscape Ecological Risk in Key Regions of the Belt and Road Initiative Countries. Land 2022, 11, 940. [Google Scholar] [CrossRef]
  53. Li, C.; Gao, B.; Wu, Y.; Zheng, K.; Wu, Y. Dynamic Simulation of Landscape Ecological Risk in Mountain Towns Based on PLUS Model. J. Zhejiang AF Univ. 2022, 39, 84–94. [Google Scholar] [CrossRef] [PubMed]
  54. Rangel-Buitrago, N.; Neal, W.J.; Jonge, V.N. Risk Assessment as Tool for Coastal Erosion Management. Ocean Coastal. Manag. 2020, 186, 105099. [Google Scholar] [CrossRef]
  55. Zhou, Y.; Zhang, X.; Yu, H.; Liu, Q.; Xu, L. Land Use-Driven Changes in Ecosystem Service Values and Simulation of Future Scenarios: A Case Study of the Qinghai–Tibet Plateau. Sustainability 2021, 13, 4079. [Google Scholar] [CrossRef]
  56. Cheng, G.; Zhao, L.; Li, R.; Wu, X.; Sheng, Y.; Hu, G.; Zhou, D.; Jin, H.; Li, X.; Wu, Q. Characteristic, Changes and Impacts of Frozen Soil on Qinghai-Tibet Plateau. Chin. Sci. Bull 2019, 64, 2783–2795. (In Chinese) [Google Scholar]
  57. Liu, Z.; Wang, S.; Chen, B. Spatial and Temporal Variations of Frozen Ground and Its Vegetation Response in the Eastern Segment of China-Mongolia-Russia Economic Corridor from 2000 to 2015. Acta Geogr. Sin. 2021, 76, 1231–1244. [Google Scholar]
  58. Wang, M.; Pan, K.; Wu, X.; Sun, X.; Zhang, L.; Pan, Z.; Chen, L. Temporal and Spatial Patterns and Driving Factors of Cultivated Land Change in the Qinghai-Tibet Plateau. Chin. J. Appl. Environ. Biol. 2022, 28, 859–868. [Google Scholar]
  59. Zhang, J.; Liu, J.; Jin, J.; Ma, T.; Wang, G.; Liu, H.; Min, X.; Wang, H.; Lin, J.; Bao, Z.; et al. Evolution and Trend of Water Resources in Qinghai-Tibet Plateau. Bull Chin. Acad. Sci. 2019, 34, 1264–1273. [Google Scholar]
  60. Wang, J.; Bai, W.; Tian, G. Spatiotemporal Characteristics of Landscape Ecological Risks on the Tibetan Plateau. Resour. Sci. 2020, 42, 1739–1749. [Google Scholar] [CrossRef]
  61. Wang, S.; Tan, X.; Fan, F. Landscape Ecological Risk Assessment and Impact Factor Analysis of the Qinghai–Tibetan Plateau. Remote Sens. 2022, 14, 4726. [Google Scholar] [CrossRef]
  62. Zhang, X.; Yang, Y.; Piao, S.; Bao, W.; Wang, S.; Wang, G.; Sun, H.; Luo, T.; Zhang, Y.; Shi, P.; et al. Ecological Change on the Tibetan Plateau. Chin. Sci. Bull 2015, 60, 3048–3056. [Google Scholar]
Figure 1. Location of the study area.
Land 12 00923 g001
Figure 2. Research framework of this study.
Land 12 00923 g002
Figure 3. Driving factors for land use simulation (natural factors: (a) (precipitation), (b) (temperature), (c) (dem), (d) (frozen soil), (e) (slope); socioeconomic factors: (f) (population density), (g) (GDP), (h) (distance from rivers), (i) (distance from roads), (j) (distance from railway), (k) (distance from lakes)).
Land 12 00923 g003
Figure 4. Spatial pattern of each land use type in the QTP from 2010 to 2030.
Land 12 00923 g004
Figure 5. Spatial pattern of each landscape ecological risk level from 2010 to 2030.
Land 12 00923 g005
Table 1. Reclassification of land use types for the dataset.
Reclassification NumberReclassification NameOriginal NumberOriginal Description
1Cropland11Paddy field
12Dry land
2Forestland21Forestland
22Shrubland
23Sparse woodland
24Other woodlands
3Grassland31High cover grassland
32Medium cover grassland
33Low cover grassland
4Water41River and canals
42Lakes
43Reservoir pit
44Permanent glacial snow
5Built-up land51Urban land
52Rural settlement
53Other construction land
6Unused land61Sand
62Gobi
63Salt alkali soil
64Wetland
65Bare ground
66Bare rock stony ground
67Other
Table 2. Data source.
DataTimeResolutionSource
DEM20101 kmResource and Environment Science and Data Center
https://www.resc.cn/ (accessed on 31 January 2023)
Temperature2010, 20201 km
Precipitation2010, 20201 km
Population density2010, 20201 km
GDP2010, 20201 km
Frozen soil2010, 20201 kmNational Qinghai Tibet Plateau Scientific Data Center
https://data.tpdc.ac.cn/ (accessed on 31 January 2023)
QTP boundary2019
Roads2010 National Geographic Information Resource Directory Service System https://www.webmap.cn/ (accessed on 31 January 2023)
Railway2010
Rivers2010
Lakes2010 A Big Earth Data Platform for Three Poles
http://poles.tpdc.ac.cn/ (accessed on 31 January 2023)
Table 3. Weights of different land use type.
Land Use TypeWeight
Cropland0.01
Forestland0.01
Grassland0.19
Water0.42
Built-up land0.07
Unused land0.28
Table 4. Land use transition matrix for different future scenarios in PLUS model.
Land UseNatural Development ScenarioEcological Conservation Scenario
TypeCLFLGLWABLULCLFLGLWABLUL
CL111111111000
FL111111010000
GL111111011100
WA111111000100
BL 000010000010
UL111111111111
CL, FL, GL, WA, BL, and UL represent cropland, forestland, grassland, water, built-up land, and unused land; 0 indicates that transition is not allowed, and 1 indicates that transition is allowed.
Table 5. Land use transition matrix from 2010 to 2020.
20102020
CroplandForestlandGrasslandWaterBuilt-Up LandUnused Land
Cropland22,20903522231
Forestland4315,67732761013
Grassland88281,231,264182734997
Water14959126,68124718
Built-up land501192161229
Unused land2571403581242812,841
Table 6. Area and proportion of each land use type.
Land Use Type201020202030
Natural Development
Scenario
2030
Ecological Conservation
Scenario
Area
/km2
Proportion
/%
Area/km2Proportion/%Area
/km2
Proportion/%Area
/km2
Proportion
/%
Cropland22,4880.8922,3320.8922,1800.8822,1720.88
Forestland315,89312.54315,76112.54315,63112.53315,76112.54
Grassland1,233,65348.991,231,50948.911,229,37648.821,231,66948.91
Water127,5325.06132,3095.25134,7245.35136,0005.40
Built-up land17490.0725510.1032880.1325700.10
Unused land816,83632.44813,68932.31812,95232.28809,97932.17
Table 7. The area and proportion of each landscape ecological risk level.
Risk Level201020202030
Natural Development
Scenario
2030
Ecological Conservation
Scenario
Area
/km2
Proportion
/%
Area/km2Proportion/%Area
/km2
Proportion/%Area
/km2
Proportion
/%
Lower159,9026.35155,8596.19155,0106.15159,0546.31
Low361,54714.35362,05214.37362,83114.40365,31514.50
Medium689,05227.36701,41027.85699,74227.78693,40927.53
High811,20132.21820,47132.57818,90132.51825,30232.77
Higher497,09019.74479,00119.02482,30919.15475,71218.89
Disclaimer/Publisher’s Note: The statements, opinions and data contained in all publications are solely those of the individual author(s) and contributor(s) and not of MDPI and/or the editor(s). MDPI and/or the editor(s) disclaim responsibility for any injury to people or property resulting from any ideas, methods, instructions or products referred to in the content.

