Review

Urban Flood Hazard Assessment and Management Practices in South Asia: A Review

1
Key Laboratory of Urban Environment and Health, Institute of Urban Environment, Chinese Academy of Sciences, Xiamen 361021, China
2
University of Chinese Academy of Sciences, Beijing 100049, China
3
Xiamen Key Lab of Urban Metabolism, Institute of Urban Environment, Chinese Academy of Sciences, Xiamen 361021, China
4
Institute of Forestry, Tribhuvan University, Hetauda 44107, Nepal
5
Youth Innovation Lab, Banshidhar Marg, Kathmandu 44600, Nepal
*
Author to whom correspondence should be addressed.
Land 2023, 12(3), 627; https://doi.org/10.3390/land12030627
Submission received: 1 February 2023 / Revised: 28 February 2023 / Accepted: 4 March 2023 / Published: 6 March 2023

Abstract

:
Urban flooding is a frequent disaster in cities. With the increasing imperviousness caused by rapid urbanization and the rising frequency and severity of extreme events caused by climate change, the hydrological status of the urban area has changed, resulting in urban floods. This study aims to identify trends and gaps and highlight potential research prospects in the field of urban flooding in South Asia. Based on an extensive literature review, this paper reviewed urban flood hazard assessment methods using hydraulic/hydrological models and urban flood management practices in South Asia. With the advancement of technology and high-resolution topographic data, hydrologic/hydraulic models such as HEC-RAS/HMS, MIKE, SWMM, etc., are increasingly used for urban flood hazard assessment. Urban flood management practices vary among countries based on existing technologies and infrastructures. In order to control urban flooding, both conventional physical structures, including drainage and embankments, as well as new innovative techniques, such as low-impact development, are implemented. Non-structural flood mitigation measures, such as improved flood warning systems, have been developed and implemented in a few cities. The major challenge in using process-based hydraulic models was the lack of high-resolution DEM and short-duration rainfall data in the region, significantly affecting the model’s simulation results and the implementation of flood management measures. Risk-informed management must be implemented immediately to reduce the adverse effects of climate change and unplanned urbanization on urban flooding. Therefore, it is crucial to encourage emergency managers and local planning authorities to consider a nature-based solution in an integrated urban planning approach to enhances urban flood resilience.

1. Introduction

Among all environmental hazards, flooding is one of the most common and destructive, independent of the impacted nation’s geography, climate, or level of development. Floods accounted for 44% of all disasters, affecting 1.6 billion people worldwide from 2000 to 2019 [1]. In the past, flooding was primarily limited to the river basin and only occurred during rainy seasons. Nowadays, urban flooding has become one of the most common and widely-distributed disasters in urban areas around the world because of the rise in impermeable areas due to haphazard urbanization and the increasing frequency and intensity of extreme events due to a changing climate [2,3]. Urban flooding may result from riverine floods, coastal flooding, pluvial flooding, groundwater, and the failure of artificial drainage systems.
Flooding in cities began to receive more attention due to increasing flood events and devastation, resulting in massive loss of life and damage to property worldwide. A study in more than 616 cities reported that floods endanger more urban areas than any other natural hazard, posing a threat to over 379 million residents [4]. As imperviousness has increased on the surface, drainage construction and renovation have lagged behind the rate of urbanization, adding stress on cities attempting to deal with extreme events. At the same time, urbanization increases rainfall intensity due to the perturbation of urban heat islands [5]. Due to the abundance of economic prospects, there is a significant migration to urban areas; this increases the risk receptors’ exposure through the occupation of floodplains.
Over the past few decades, urbanization rates have risen sharply in various parts of the world. More people now reside in cities than in rural areas worldwide. By 2050, it is predicted that 68% of the world’s population will live in urban agglomerations, up from the current 55% in 2018 [6,7]. Most of the world’s largest cities and over 75 percent of its urban population live in low- and middle-income nations. New towns and urban areas are growing, and existing ones are expanding without carefully considering urban planning. Uncontrolled and rapid urbanization in developing countries, particularly since 2000, has increased the vulnerability of the urban environment [8,9]. Floods in urban areas are often devastating because high densities of people and assets are concentrated in certain areas, resulting in economic loss and human casualties [10,11]. Urban infrastructure, industry, trade, commerce, and utility services are crucial urban sectors severely impacted by floods. As such, regular productivity is hindered during and after significant floods, which increases the vulnerability of city residents [12].

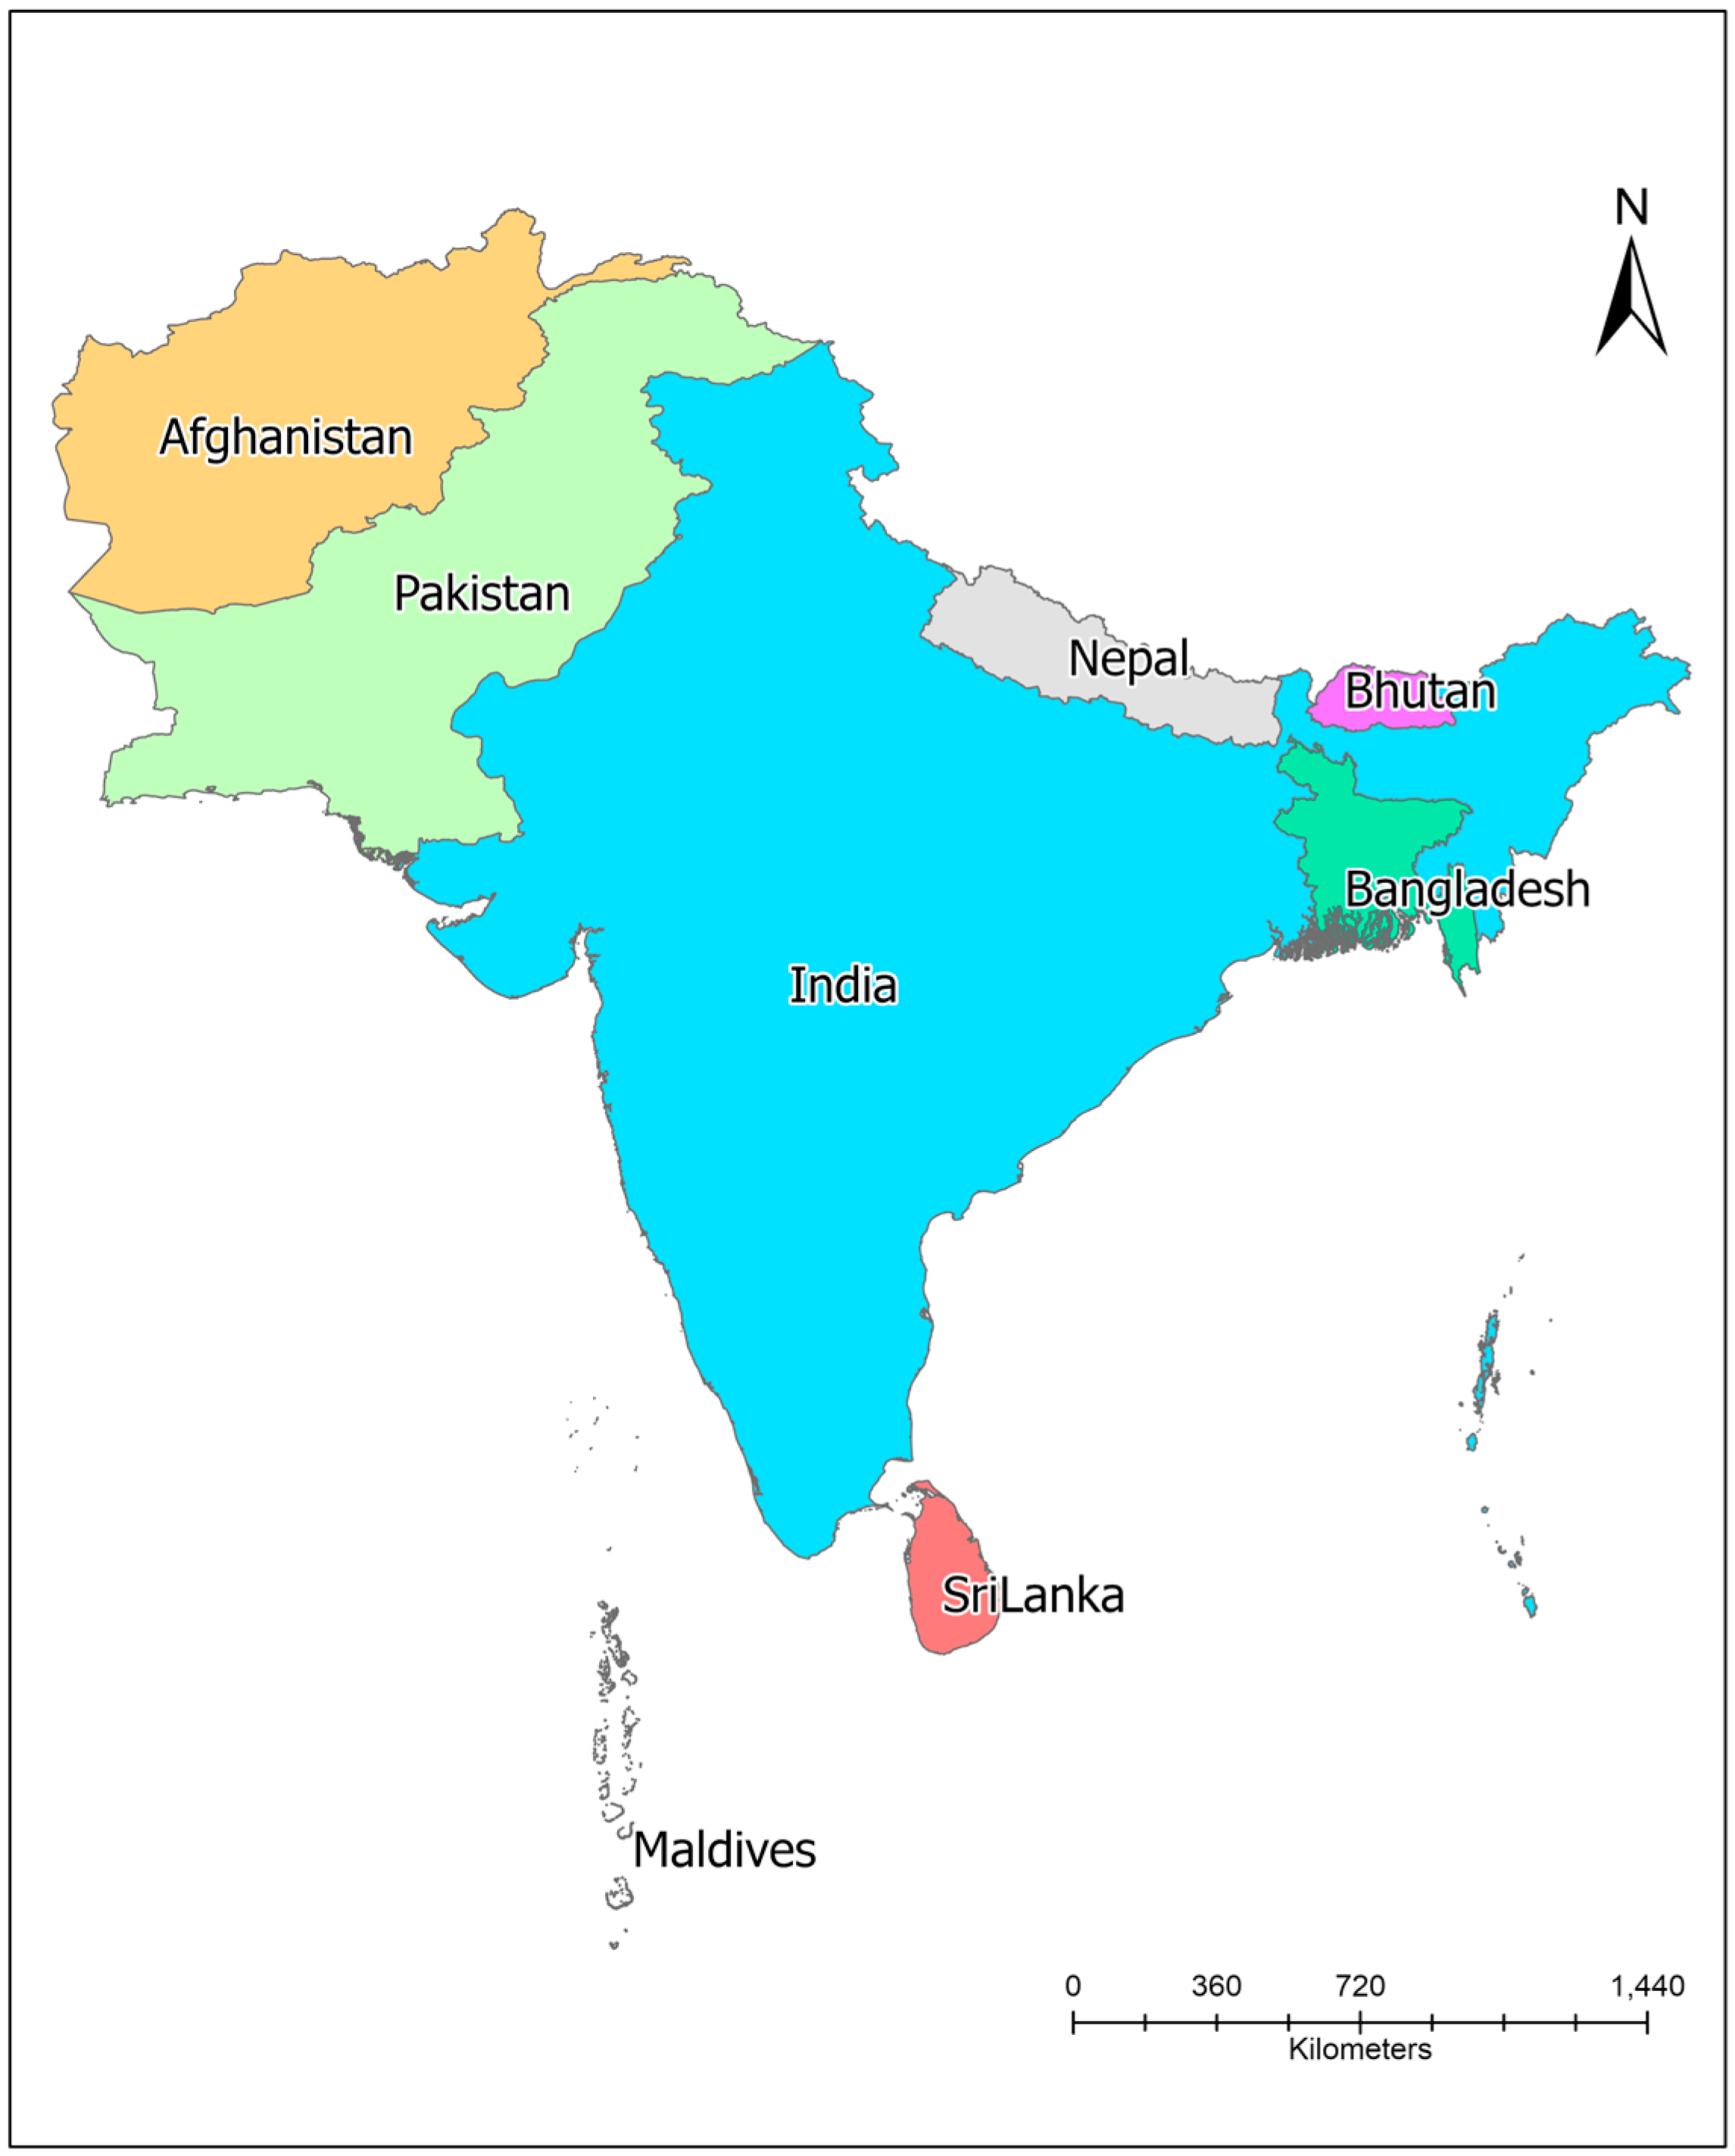
1.1. Urban Flood in South Asia

As shown in Figure 1, Afghanistan, Bangladesh, Bhutan, India, Maldives, Nepal, Pakistan, and Sri Lanka are the eight nations that comprise South Asia. With about 5032 million sq. km., South Asia is a very densely populated area, home to around 24 percent of the world’s population [13]. This vast area has a wide range of climates, from temperate in the north to tropical monsoons in the south. The vast expanses of South Asia are particularly susceptible to frequent disasters due to the increasing rate of urbanization and heavily populated areas.
Flooding significantly impacts Asia, accounting for 41% of global flooding incidents, affecting 1.5 billion people (93% of all flood victims globally). Extreme riverine flooding is becoming more common in countries such as India, Bangladesh, Pakistan, Sri Lanka, and Nepal; this has caught the attention of the international media. The June 2013 floods in India (6054 fatalities) and the July 2010 floods in Pakistan (1985 deaths) were the two deadliest flooding incidents between 2000 and 2019 [1], followed by the mid-June to Aug 2022 Pakistan flood (nearly 1500 deaths) [14]. The global urban exposure to flooding (UEF) increased more than four-fold from 1985 to 2018 with accelerated temporal trends. Asia experienced the most significant increase in UEF (74.1%) [15]. Urban flooding has become an alarming issue in urban areas since the Mumbai flood in 2005, a mega-disaster. Over the past two decades, several megacities–Dhaka in Bangladesh; Mumbai, Kolkata, Chennai, and New Delhi in India; Karachi, Rawalpindi, and Lahore in Pakistan–have suffered numerous flooding incidents. Most of these megacities are situated along the banks of major rivers and coastal areas, which exposes an increasing number of people and assets to floods.

1.2. Causes of Urban Flooding

Evidence indicates that urban floods are increasing due to climate change [16,17]. According to the IPCC report, there is a high likelihood that the risk of pluvial flooding will increase in urban areas where excessive precipitation is expected to persist due to high levels of global warming [18]. In South Asia, climate change severely affects monsoons and tropical cyclones, two significant causes of flooding in the region [19]. There is strong evidence of an increasing trend in extreme rainfall in South Asia [14,20,21]. From 1951 to 2022, extreme rainfall events that produced more than 150 mm of rain in a single day nearly doubled in frequency [22], as shown in Figure 2. Due to climate change, extreme events are becoming more unpredictable, and weather forecasting models cannot predict this increase in chaos. Meanwhile, over central India, the frequency of extreme rainfall events (day rainfall 150 mm) has increased by nearly 75% throughout the period (significant at a 95% confidence level). This indicates that the frequency of extreme incidents is rising by roughly 13 per decade (more than one per year). However, the extremes are becoming more intense over time, as shown by a rise in the 99.5th percentile values [23]. The increase in summer precipitation and river water due to glacier melt in summer may cause extreme summer flash floods over this region in the future [24]. In most of the country’s river basins, extreme precipitation and flood events have increased over the past 20 years. It has been estimated that, under a high-emission scenario, the frequency of multi-day flooding will surge significantly towards the end of the century [25]. Additionally, it is anticipated that, when temperatures rise, snow and glacier ice will melt more quickly, increasing the flows of the Himalayan rivers. Erratic monsoon patterns have seen a geographical shift and a change in the timing of onset and withdrawal, resulting in flooding [26,27].
Parallel to this, flooding has emerged as a significant issue in different South Asian cities due to haphazard urbanization over the last two decades [29,30]. It is a fundamental environmental challenge affecting the lives and livelihoods of millions of urban dwellers whenever urban areas receive intense rainfall [31]. Urbanization-related land-use changes increase the paved area, influencing the local hydrometeorological processes that change the urban microclimate. Urban watersheds dominated by built-up areas inhibit rainwater infiltration, cause extreme runoff [32], and sometimes affect precipitation because of the UHI effect [33]. Urban areas, on average, lose 90% of storm rainfall to runoff [34] because of increased impervious surface area; this is more than a five-fold increase in runoff when compared to agricultural areas or the same size with the same intensity of rainfall [35,36]. Unprecedented rural-to-urban migration has led to reckless urban expansion. This has increased human settlements, industrial growth, and infrastructure expansion over some floodways, where floods may eventually occur, reducing the space into which floods can naturally overflow. An IPCC report also emphasizes that urbanization would worsen climate consequences, including floods, and cause significant economic losses throughout the region [18]. The prospects are worse in fast-growing cities, especially in densely populated urban areas [37]. However, due to global climate change, inadequate drainage systems, and rising urbanization [38], flooding is occurring more frequently, more intensely, and to a greater extent [39]. Increasing urban populations have raised the likelihood and severity of climate-related calamities [40], dramatically increasing the vulnerabilities and risks of urban inhabitants in already exposed areas [41]. With high population densities and concentrations of diverse socioeconomic activities, cities in South Asian countries face the tremendous impact of, and challenges in dealing with, flood-related problems [42], as shown in Table 1.
Urban flooding is an increasingly significant issue in India due to the growth of urban areas [61,62]. From 1985 to 2018, India’s UEF expanded from 171 km2 to 3745 km2, contributing 4.7% to worldwide growth [15]. Cities like Chennai (2015), Bengaluru (2016), Gujarat (2017), Kerala (2018), Maharashtra (2019), Assam (2020), Bihar (2020), Hyderabad (2020), and Delhi (2020) have been affected by urban floods of a greater magnitude [63], causing significant loss of life and devastation to infrastructure and agriculture [64]. Urban flooding from intense rainfall is a recurring phenomenon in Dhaka, Chittagong, Khulna, and Sylhet. Dhaka experienced significant floods in 1988, 1998, 2004, 2007, 2015, 2016, and 2017, caused by the overflowing of the surrounding rivers, affecting communications, livelihoods, and service facilities for many days. Waterlogging occurs in densely populated places where excessive rainfall-induced water is trapped due to poor drainage [65,66]. Pakistan also experienced frequent flooding in 2010, 2011, 2012, 2014, 2015, and 2017 [67]. During the monsoon season, urban flooding is anticipated in Pakistan’s major cities, including Islamabad, Rawalpindi, Peshawar, Lahore, Karachi, Faisalabad, Hyderabad, etc. [68]. Over the past few decades, flooding in Colombo, Sri Lanka, and the nearby suburbs has increased exponentially [69]. In Kathmandu, local climate change and growing surface imperviousness increases the likelihood of regular pluvial floods [70]. Due to high rainfall and poor drainage, urban flooding during the monsoon season has become a major concern on the northern side of Kabul city [71]. It is becoming a challenging daily issue for urban dwellers, authorities, and governments in the region [72]. As most studies focus on riverine floods in the region, there are few urban flood studies examining Afghanistan, Bangladesh, Bhutan, India, Nepal, Pakistan, and Sri Lanka. This study aims to identify trends and gaps and highlight potential research prospects in the field of urban flooding in South Asia. Thus, this paper reviewed the state-of-the-art methodology used for urban flood hazard assessment using the hydraulic/hydrological models and urban flood management practices in south Asian countries based on an extensive literature review of studies conducted in the last two decades (2001–2021).

2. Materials and Methods

This review paper adopted a keyword-based search approach through the Web of Science, Google Scholar, Science Direct, and ResearchGate databases. The keywords ‘urban flood’, ‘urban flood hazard assessment’, and ‘urban flood management’ in major cities of South Asian countries were used. Initially, irrelevant and duplicate publications were excluded based on their titles. Further, the abstracts of the remaining articles were reviewed and prioritized based on the study’s objective. Considering these screening criteria, 105 publications were selected for analysis. Figure 3 shows the framework adopted for this paper, that primarily includes four parts: the first part discusses the current situation and causes of urban floods in South Asian cities. The second part discusses the application of hydrologic/hydraulic models for flood hazard assessment in urban areas of India, Bangladesh, Pakistan, Sri Lanka, Nepal, Bhutan, and Afghanistan. The third part analyzes the structural and non-structural measures applied for flood management in urban areas of South Asian cities. The fourth section examines the gap in urban flood hazard assessment and management practices between South Asian and developed countries.

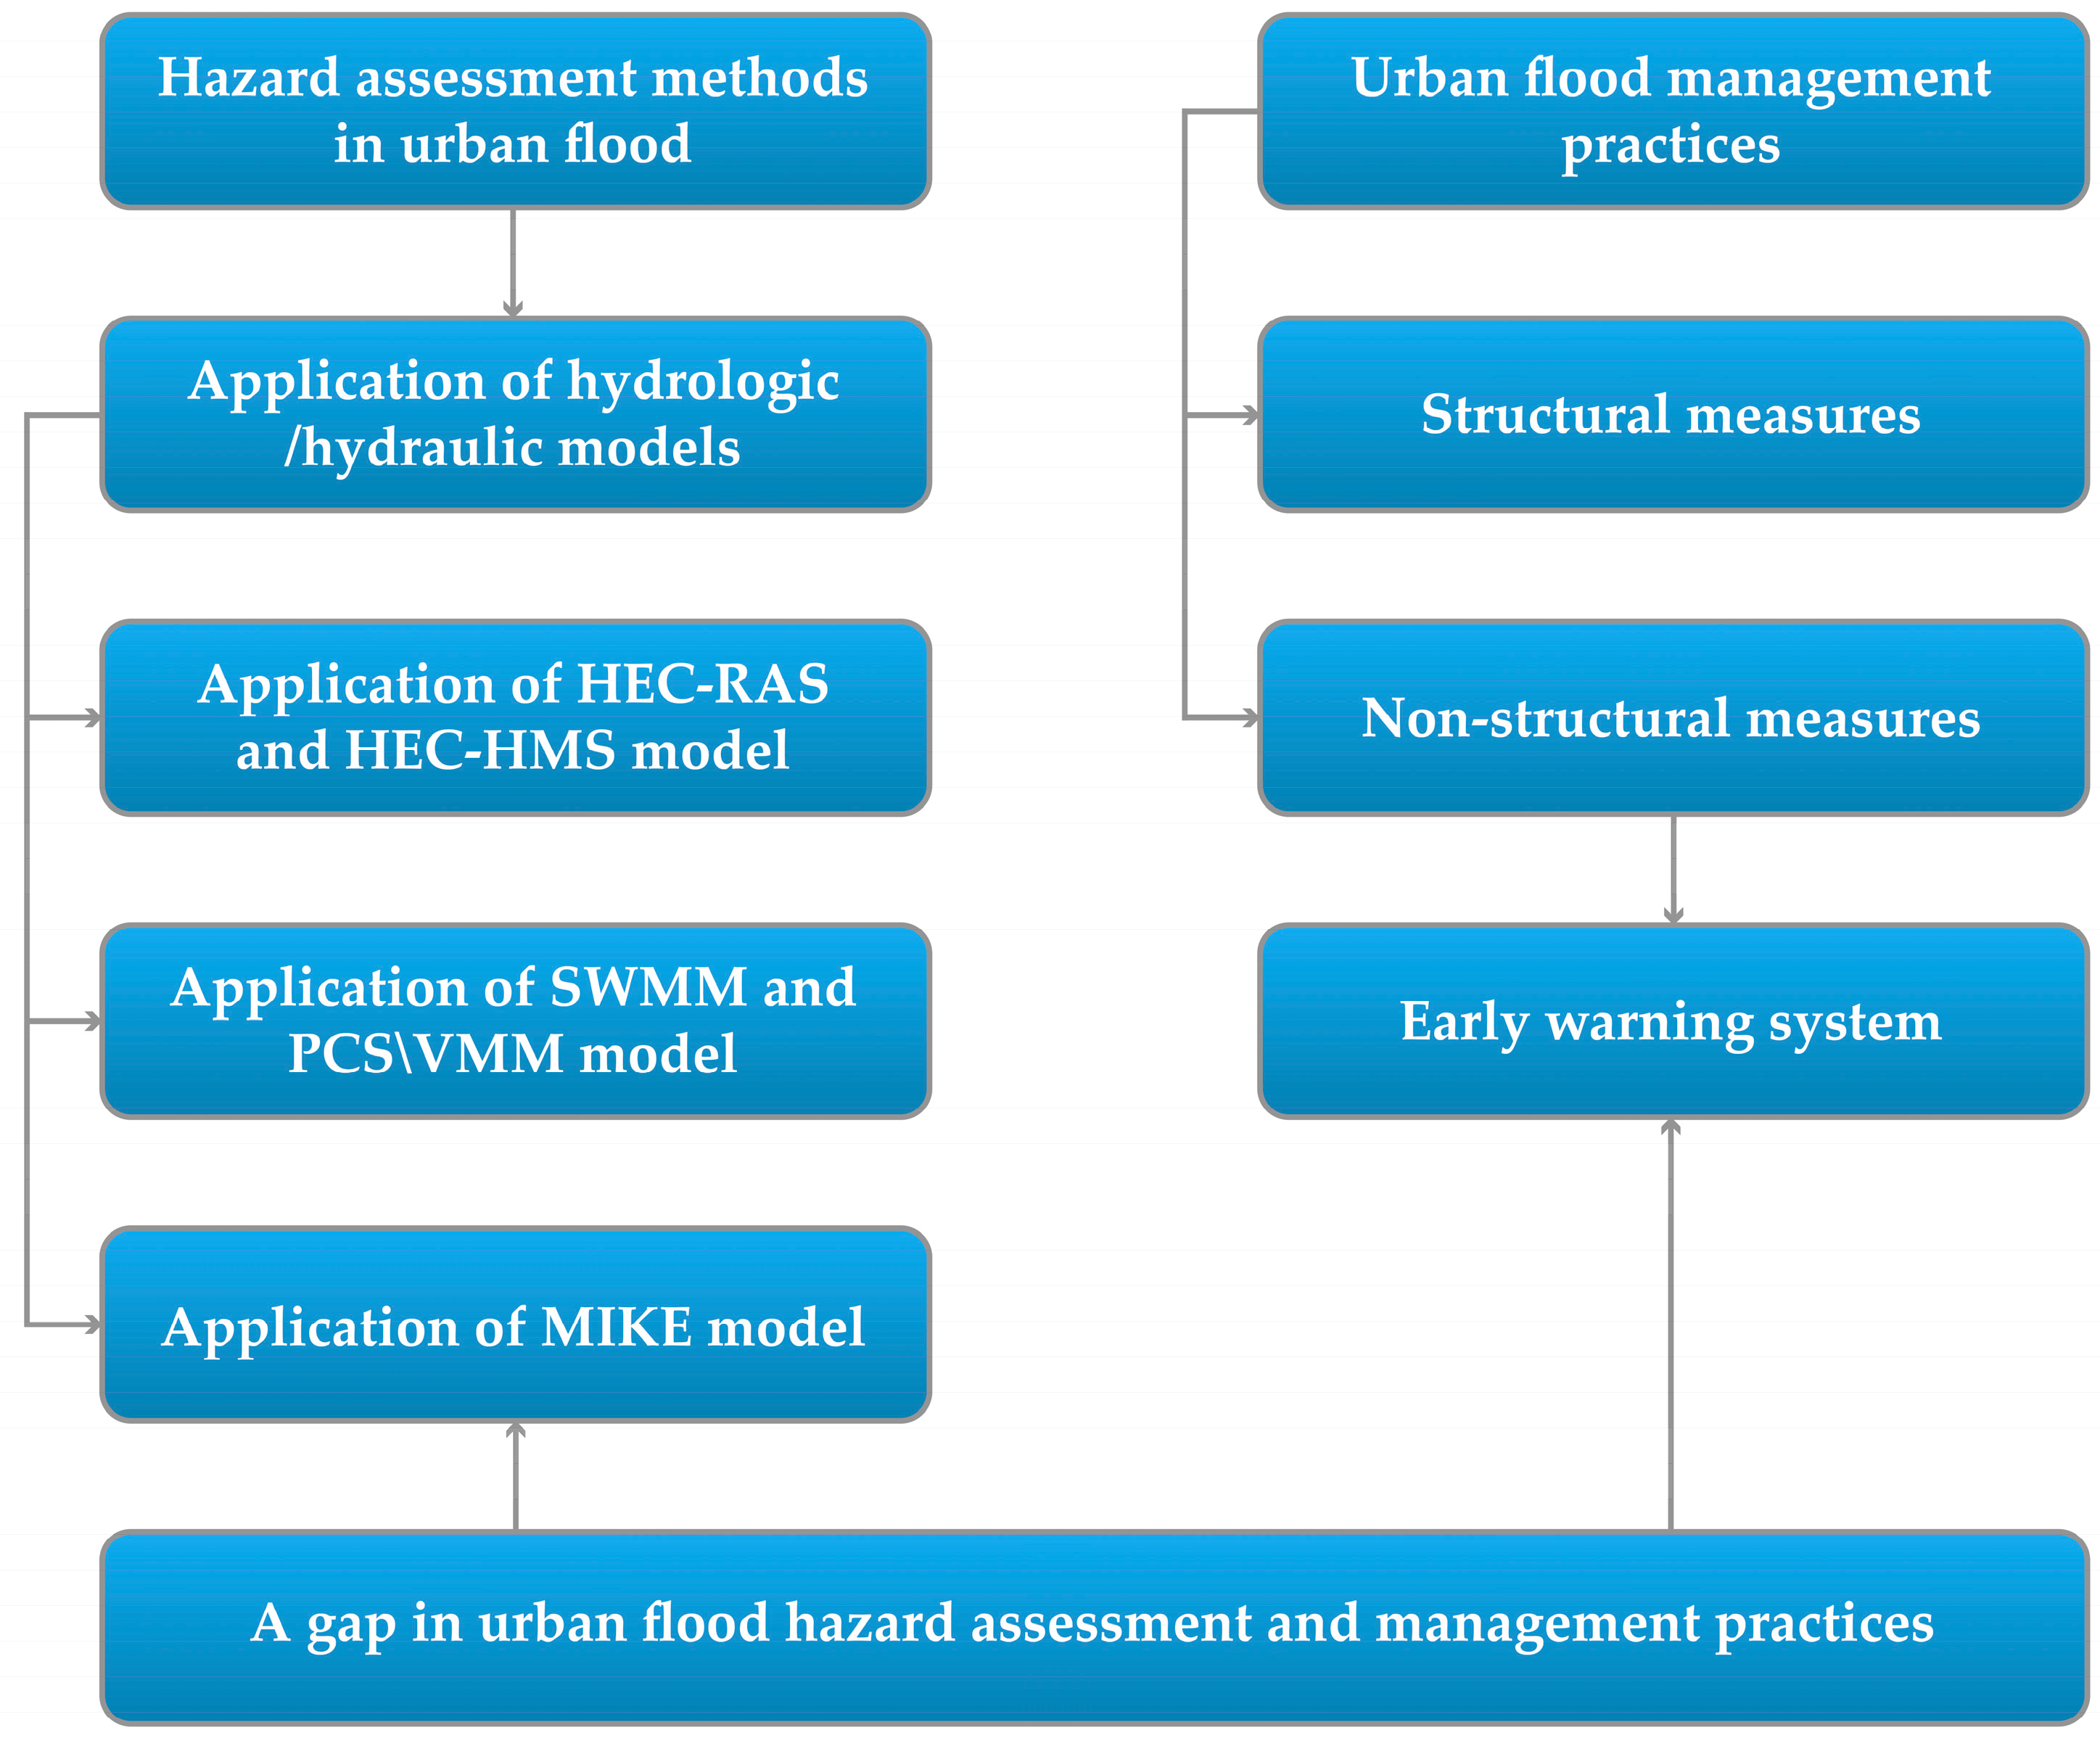
3. Methodology Used for Urban Flood Hazard Assessment in South Asian Cities

Urban flood hazard assessment is the initial step of urban flood management, during which the occurrence probability and the magnitude metrics of the potential flooding over a specific time in a given location are identified [73]. The parameters that commonly indicate the flood hazard are the extent of the flood, the flow rate, the depth, the duration, and the rise in the water level [74]. The assessment of urban flood hazards requires many data. In-depth terrain features are needed, including relief, land use, land cover, soil, channel flow pattern, meteorological parameters, etc. [75,76,77]. Several numerically-based models, physically-based models, and techniques, such as RS and GIS, multi-criteria analysis, and a social survey, have been used to create flood hazard maps in urban areas [78]. In recent years, urban flood susceptibility mapping has successfully utilized a variety of statistical techniques, including advanced soft computing technologies such as machine learning (ML) and artificial intelligence (AI) [79]. This section of the study reviewed the application of hydraulic/hydrological models for flood hazard assessment in the urban areas of South Asia.

3.1. Application of Hydraulic/Hydrological Models

Among the various methods available to undertake urban flood hazard assessment, the most used method is the application of the hydraulic/hydrological modeling approach. These models often work together, as the runoff results from the hydrologic model are used as input for the hydraulic model [80]. With the progress in computational resources and high-resolution topographical data, DEM, the hydrologic and hydraulic modeling approach, is increasingly used for flood hazard assessment in urban catchments [81]. Numerous one-dimensional (1D), two-dimensional (2D), 1D/2D linked, and three-dimensional (3D) numerical models have been developed to simulate the flow dynamics and scope of probable flooding events. These models are available in both open-access and paid ones with different capacities [82,83]. An important concern about hydrodynamic modeling is selecting an appropriate modeling approach. This primarily depends on the purpose of the study, flow conditions, and available data. Geospatial data and techniques have outperformed conventional comprehensive monitoring and assessment approaches, particularly in dynamic and complex urban environments [84]. Despite their benefits, the chaotic and complex nature of floods makes it challenging to develop a credible flood inundation model [85]. Some of the widely applied models in South Asian cities are HEC-RAS and HEC-HMS (US Army), SWMM and PCSWMM (CHI), and MIKE (DHI), among others.

3.1.1. HEC-RAS and HEC-HMS Model

The Hydrologic Engineering Center (HEC) offers a collection of hydrologic and hydraulic modeling software. HEC-RAS (hydraulic) and HEC-HMS (hydrologic) are the most used software packages. HEC-HMS is used to determine rainfall-runoff relationships, and HEC-RAS is used for the hydraulic modeling of rivers and pipes based on watershed characteristics. This open-source software is widely used for flood hazard assessment in South Asian cities, as described below and Table S1.
Many studies have been conducted in the Oshiwara, Mithi, and Poisar river catchments in Mumbai to investigate the impact of LULC and urbanization on floods using the integrated approach of hydrologic (HEC-HMS) and hydraulic models (HEC-RAS) with GIS and RS [86,87,88,89]. In Mumbai, India, the settlement of the world’s largest urban population has caused rapid Land Use Land Cover (LULC) changes on both temporal and spatial scales. Daily time series data of precipitation and temperature, land use, soil, and DEM were used to run the model. Soil Conservation Service—Curve Number (SCS-CN) was used to derive flood hydrographs for different land-use conditions. In turn, flood extent and depth generated by models were used for developing flood hazard maps for the city [87]. Similarly, the 1D HEC-RAS model was employed to determine the water surface profile in the Thirusoolam sub-watershed of Chennai, India. The weighted curve number (CN) was derived based on the land use and hydrologic soil groups. A study shows the flooded area increased from 31.70 sq. km. in 1976 to 36.61 sq. km. in 2005, and the flood depth increased from 3.71 m in 1976 to 4.55 m in 2005; this signifies that the extent and depth of flooding have increased due to urbanization [90]. In 2015, Chennai suffered a devastating flood; simulating such a destructive flood event in a metropolis with expanding urban sprawl and a changing environment is crucial for improving flood preparedness. Therefore, Devi et al. used HEC-HMS and 2D HEC-RAS to model the runoff response of the event for flood inundation extent and depths corresponding to the baseline flood scenario (in 2015) and the future flood scenario (in 2030). A study shows that, considering the worst possible urban sprawl and extreme rainfall, 1.7 times more buildings will be exposed to flood hazards, on average. The average increase in inundation extent will be between 20% and 33% [91].
Similarly, Hyderabad also regularly suffers urban flooding; in 2001, 2003, 2008, 2016, and 2017, many low-lying areas were inundated. In 2019, Rangari et al. developed a regional framework for flood modeling by fusing GIS with HEC-RAS and HEC-HMS for the city. As a starting point, base maps were created using the Shuttle Radar Topography Mission (SRTM) DEM 30 m and LULC map; hourly rainfall and evaporation data, the current drainage network, and future planned new drainage line were also used. Three significant flood events—July 1989, August 2000, and August 2008—were chosen as case studies to analyze the modeling framework, and flood inundation maps were prepared to show the area at risk. According to the model’s findings, 17% of the land is vulnerable to flooding [92]. Also, Rangari et al. developed a 1D–2D urban flood model by integrating GIS with HEC-RAS and HEC-HMS. The model is run under various climate change scenarios (RCP 2.6, RCP 4.5, RCP 6.0, and RCP 8.5) to determine the most vulnerable locations and investigate potential increases in flood risk and hazards due to climate change. According to the model, the likelihood of flooding increases as the RCP scenario’s severity and return interval increase. The study prepared a hazard map of the city based on inundation depth and floodwater velocity [93]. An urban flood event was modeled using HEC-RAS 1D–2D, comparing the 13 October 2020, flood event with the 24 August 2000. According to the study, urban hydrology has been significantly impacted by rapid, unchecked urbanization (16.5% rise) over the past two decades, leading to increased flood volumes after relatively moderate rainfall events [94]. Similarly, Surwase and Manjusree assessed urban flooding using HEC-RAS 2D, PCSWMM, and HAND to identify the vulnerable low-lying areas in the city. The study used 10-m CARTO DEM, hourly rainfall, and stream discharge data. The study shows that, if 144 mm of rainfall occurs uniformly over the catchment within 10–12 h, the catchment will experience flooding [95]. Navasari, a city in Gujarat, India, experienced a devastating flood on 4 August 2004. For urban flood modeling in the city, [96] used the 2D HEC-RAS model for unsteady flow simulation, and [97] used 1D HEC-RAS for steady flow analysis and validated this analysis using the 2004 flood event. The flood depth maps indicate that the city’s low-lying areas are susceptible to flooding when the river discharge exceeds 8836 m3/s and that it will take 11 to 13 h to inundate the town.
Similarly, in Pakistan, the extent of floods in the Malir Basin of Karachi City was investigated using HEC-HMS to simulate runoff and HEC–RAS for flood modeling. For this purpose, historical rainfall data from 1985 to 2014 were used, and drainage networks and streambeds were extracted from SRTM DEM and topographic maps. For the rainfall events in 2013 and 2009, the maximum simulated flows recorded at the river outlet were around 1800 m3/s and 2832 m3/s, with rainfall periods of an hour and four hours, respectively; these events generated massive runoffs that flowed into the stream and hit Karachi’s urban area [98]. In Bangladesh, Masood and Takeuchi used a 1D hydrodynamic simulation based on SRTM DEM and hydrologic field-observed data for 32 years (1972–2004) to assess flood hazards for mid-eastern Dhaka (37.16 km2). The HEC-RAS inundation simulation for a flood with a 100-year return period indicates that the maximum flood depth is 7.55 m in the southeast, and more than 50% of the region is affected. A flood hazard map was created and validated by comparing the degree of flooding with the destructive cyclone Sidr, that hit Bangladesh on 16 November 2007 [99].
HEC-RAS and HEC-HMS have been widely used in flood hazard assessment in urban areas of Nepal. Pandey and Dugar studied urban flood hazards and inundations at Hanumante Basin, near Bhaktapur, using GIS and HEC-RAS 5.0.7 hydraulic modeling. DEM was generated using the survey data and applied for the extraction of the geometry of the river. As the river was not gauged, the extreme river flows were predicted using the Catchment Area Ratio method. The HEC-RAS model prepared floodplain maps that showed that the built-up areas were more vulnerable to flooding from 2005 to 2018 [100]. Talchabhadel et al. conducted citizen science-based urban flood monitoring of the Hanumante River, Bhaktapur, during the 2019 monsoon season. A network of six hydrologic and sixteen precipitation stations were established in the Hanumante River basin, where citizen scientists continuously recorded daily water level and precipitation measurements. A two-dimensional shallow water equation unsteady flow model was then used to simulate the inundation process. The hydrologic model was validated against the observed citizen-based water level measurements [101]. Similar flood mapping was conductede in Tulsipur, Nepal, along the Patu River using HEC-RAS modeling for 25, 50, and 100-year return periods. The Catchment Area Ratio method was used to calculate the peak flood, with estimates of 109.9 m3/s and 158.1 m3/s for the 25- and 100-year return periods. The study shows that only 0.009 km2 of the settlement area was inundated in 2004; this increased to 0.043 km2 and 0.096 km2 in 2010 and 2019, respectively. Rising urbanization near the river has exacerbated the town’s flood risk [102]. A study by Dongol and Bormudoi in the Bishnumati catchment, Kathmandu, analyzed flood hazards and vulnerability using 1D HEC-RAS with the HEC-GeoRAS interface and ArcGIS, which demonstrated that the flood area grew more prominent with increasing flood severity. The outcome reflects the flooding of significant urban areas, indicating that future flood disasters will pose a greater risk to human life [103]. In Bhutan, a study by Tenzin and Bhaskar modeled the flash flood due to heavy rainfall at Sarpang to determine the suitability of integrating HEC-RAS and ArcGIS methods in mountainous terrain. The average discharge of the river outflow was calculated using meteorological data, and SRTM DEM and Landsat 8 OLI satellite images were used as base maps. According to flood simulations, floodwater can reach depths of up to 3 m downstream and stretch up to 200 m to 300 m on either side of the stream’s centerline. The flood extended, and the inundation depth was approximate with the July 2016 flash flood area, validating the model [104]. In Kabul, Afghanistan, a 1D HEC-HMS hydrological model was applied to simulate the effects of pre-and post-development land-use changes on flooding. Climate Hazard Group InfraRed Precipitation with Station (CHIRPS) rainfall data from 2008 to 2018 generated discharge for each urban flooding event. According to the study, between 1960 and 2009, imperviousness increased dramatically, from 7.1% to 59%, while pervious surface decreased from 21% to 6%. A hydrological model simulation revealed that runoff volumes caused by floods might be related to significant LULC changes in the city [71].

3.1.2. Application of SWMM and PCSWMM

The Storm Water Management Model (SWMM) is a dynamic rainfall-runoff model used to simulate the quality and quantity issues related to watershed runoff in urban settings. SWMM primarily calculates the two-dimensional overland surface and one-dimensional flow through drainage pipes. It has been regularly updated to accommodate the dynamic urban setting [84]. PCSWMM is the GIS-based model capable of modeling urban drainage networks using SWMM. Some research that applied SWMM and PCSWMM in the region are described below and Table S2.
In Hyderabad city, India, Rangari et al. developed flood inundation and flood risk maps using a coupled 1D-2D flood modeling approach when extreme rainfall occurred. An SWMM was coupled with a 2D PCSWMM model to simulate extreme flood events to determine the low-lying areas and overflowing drainage nodes that require emergency attention [105]. Similarly, Vemula et al. evaluated the effects of extreme rainfall on the drainage capacity, flood risk, and inundation extent. The runoff simulations were carried out for historical and future extreme rainfall events. The findings indicate that the current network could handle RCP 6.0 with an 82% runoff. However, it was insufficient to transport runoff from RCPs 2.6, 4.5, and 8.5, which shows that Hyderabad could see future intense rains that will increase runoff volumes and result in flooding [50]. At the National Institute of Technology in Telangana, India, Rangari and Prashanth used the SWMM model to analyze the campus’s drainage systems. The model used the LULC maps, the Cartosat 30 m DEM, and other drainage information from the municipal corporation. The model simulated recent storm events with a design storm intensity with a 2-year return period; the study result showed that some parts of the campus are frequently affected by floods [106]. A study by Andimuthu et al. in Chennai evaluated the existing state of stormwater drains under current and future climate scenarios. IPCC CMIP5 models of RCP 4.5 were used to develop possible future climate change scenarios and generated IDF curves for 2, 5, 10, 50, and 100-year return periods. The Differential Geographic Positioning System (DGPS) surveyed the storm drainage network. The HEC-HMS model for watershed runoff and SWMM for storm drainage network was used to estimate the discharge and flooded areas and to suggest mitigation measures [77].
In Bangalore, India, Avinash et al. applied an SWMM hydrological model using a high-resolution LULC map, a 2 m resolution DEM, real-time hydrometeorological data, and stormwater drainage data to construct the flood extent map. A study ran numerous simulations for various rainfall intensities to obtain the runoff details. Then, using the Inp.PINS tool, predicted rainfall and flood extent maps were produced from the SWMM model [107]. In Vijayawada, India, SWMM was used to evaluate the overflow volume. The model’s set-up used the city map, daily rainfall data, and stormwater network drainage. The model simulations assisted in visualizing the runoff from extreme precipitation events, analyzing the correctness of the stormwater network system, and understanding the flood area [108,109]. Similarly, SWMM was employed in Bhubaneswar, India, to understand the urban flood risk based on the degree of urbanization. To set up the model, information on land use and micro-watersheds were gathered using LiDAR data (1 m) and thirty years of hourly rainfall data. The Gumbel Distribution determined the frequencies and probabilities of maximum rainfall for various return periods. This distribution demonstrated the region’s high prevalence of rainfall events, which contribute to the severity of urban flooding in the city [84]. At IIT Kharagpur, India, Bisht et al. tried to solve the stormwater management problem. SWMM and MIKE URBAN models were used to develop a reliable drainage system to simulate flood extent and inundation. Model simulation showed that extreme rainfall events that happen quickly would cause flooding from any drainage system, regardless of the drainage system’s design [79]. Similarly, in Pune, India, used the SWMM 5.1 model to create and simulate urban floods utilizing rainfall events in the past. The model set-up included hourly rainfall data, SRTM 30 m DEM, drainage information, and catchment data. The model simulation considered the two most significant past rainfall events, in August 2007 and July 2016. It proved that the drainage system is insufficient to withstand intense rainfall and is overwhelmed by rainfall [110].
In Bangladesh, urban flooding and waterlogging during the monsoon season become unavoidable due to changes in land use and irregular rainfall. In cities, the current drainage systems frequently need to remove stagnant water. In the Begunbari canal catchment, Eastern Dhaka, Ahammad et al. modeled stormwater management using GeoSWMM, where 10 m DEM, land use, canal cross-sections, water level, discharge, and rainfall data were used as input data. The model simulation results showed that maximum flood depths and inundated areas can be reduced by pumping. To maintain the desired water level, 55 cumecs capacity pumps with a 1.5 sq. km. retention area are needed [111]. Similarly, Akter et al. used 2D PCSWMM to determine the flood depth in Chittagong. Analyses of rainfall trends and frequency were performed, and a model was run for various return periods. The flood hazard map was created using ArcGIS and PCSWMM with simulated flood depths [112]. In Chittagong, urban flooding typically happens during the rainy season. Akter et al. coupled the HEC-RAS inundation model with SWMM to observe the detailed and spatial extent of the flood. The HEC-RAS and remote sensing data-based flood simulations exhibited a good match compared to SWMM-simulated floods, with correlation coefficients of 0.98 and 0.70, respectively [113].
Urban centers in Nepal, such as Kathmandu Valley, Birjung, Banepa, and other emerging cities, pose a severe threat of urban flood risk due to the combined effects of unplanned urbanization and climate change. The study by Salike and Pokharel investigated the connection between increasing urban flooding due to extreme rainfall events brought by climate change and increased imperviousness in Kathmandu. The study used RClimdex, a statistical downscaling model, PCSWMM, and a survey approach for urban flood modeling. A study shows that future climate change will increase pluvial floods in the city at the present state of urbanization [114]. Similarly, KC et al. used the PCSWMM model to assess how urbanization and climate change affect flooding in Kathmandu Metropolitan City. For a 2-year and a 20-year return period, the RCP 4.5 scenario indicates the most significant rise in flood volume (60–90%) for present (75%) and extreme (90%) imperviousness, with the extent of the flood area growing more than the depth. The findings demonstrate that climate change is expected to have a more significant overall impact on pluvial floods than urbanization [70].

3.1.3. Application of MIKE

MIKE Powered by DHI is a range of software products that accurately analyze, model, and simulate any challenge in water environments. Some research conducted with the MIKE application in the region are described below and Table S3. In a study in two south Asian cities, Bharatpur in Nepal and Sylhet in Bangladesh, urban drainage models were created using MIKE11 hydraulic models. The study collected water discharge, drainage networks, cross sections, historical water level, and rainfall data to simulate and calibrate the models. Study results show that under the current scenario, 12.7% of the land in Bharatpur and 22.3% of the land in Sylhet are at risk of flooding. Enhancing the drainage system can decrease the risk area to 5.5% in Bharatpur and 3.6% in Sylhet. However, if solid waste is not managed correctly, the site at risk of urban flooding could rise to 7.6% in Bharatpur and 18.5% in Sylhet in five years [115].
In Dhaka, water logging is a severe problem. This metropolis has two drainage systems: a protected western side with predominantly piped drainage and an unprotected eastern side with primarily open canals. A study by Khan et al. used MIKE Flood to model the one-dimensional drainage and 2D surface flow. An urban rainfall-run-off model was used to estimate the runoff from the rainfall based on the time-area method. The study’s findings indicated that the damage will increase dramatically if the 2004 flood event is repeated in 2050 [116]. In Central Dhaka, Mark et al. developed a flood model using MIKE URBAN, where a time area model simulates the rainfall-runoff process. The urban drainage network was computed using MIKE FLOOD, while the surface flow was calculated using a 2D model with a 10 m grid size. The model was calibrated for water levels in the urban rivers for the flood extent of the 2004 flood and compared with the prepared flood map, showing a good agreement between the detected and simulated flood zones [117]. Dasgupta et al. predicted urban flooding in Western and Central Dhaka using the MIKE Urban coupled 1D-2D model using the 25 m2 grid DEM topography data, historical daily and three-hourly rainfall, drainage network, sedimentation depth, and pump discharge to produce time-series inundation data. Using simulated data, inundation depth, a duration table, and location-specific flood maps were generated [66]. Chen et al. used the MIKE Urban model to simulate urban flooding in Eastern and Central Dhaka. The MOUSE and MIKE FLOOD models simulated storm sewer and river channel flows. The rainfall and water levels in the rivers for flood modeling were calculated based on a statistical analysis of 50 years of historical data from Dhaka’s catchments [118].
Similarly, in the Kolonnawa basin of Colombo, Sri Lanka, the MIKE FLOOD model was used to represent flow and storage on land. The study used the Unit Hydrograph approach to schematize the rainfall-runoff processes and the SCS-CN method to calculate the surface runoff. The 2D overland flow was simulated by MIKE 21 using a standard grid with a resolution of 25 m. The collective model performance was validated, and showed reasonable results for the May 2016 flood event. Due to the disparity between observation and simulation at the Wellawatta outfall location, it underestimated the peak flood level in the canal system by about 0.2 m [119]. Additionally, the complete canal system in the Metro Colombo region of Sri Lanka was modeled using the MIKE11, MIKE21, and MIKE FLOOD models to determine the capacity of the canals to control floods. Lidar created a DEM with 1.0 m horizontal and 0.15 m to 0.20 m vertical accuracy. MIKE FLOOD modeled the canal system with rainfall return periods of 10, 25, and 50 years to produce the corresponding floods. MIKE21 and MIKE11 models were coupled with MIKE FLOOD by specifying the connections between canals and floodplains. The study result showed that, under the current conditions, the canal system can only withstand a 10-year rainfall flood event, and the safe flood level in the basin is 2.0 m [120].

3.2. Application of Remote Sensing and GIS in Urban Flood Studies

Geospatial technology, coupled with remote sensing (RS) and Geographic Information Systems (GIS), has become a powerful tool for urban flood management and thus gained significant attention [86,88,90,93,121,122,123,124,125,126]. The ability of the satellite to map floods has been known for more than 40 years. However, over the last decade, with a proliferation of open-access Earth Observation (EO) data, there has been significant progress in developing EO products and services tailored to various end-user needs, as well as its integration with flood modeling and prediction efforts [127]. Optical to microwave remote sensing has provided the data for flood mapping analysis in all weather conditions. GIS help map flood hazard, potential areas, and vulnerable regions. As such, the use of both technologies has become imperative. Urban flood simulation software frequently inputs DEM and LULC data [128]. New remote sensing technology, such as multisensory systems, radar, and LIDAR, offers vast area coverage and time revisits to measure episodic severe precipitation and the resulting urban floods [129]. Synthetic aperture radar (SAR) is a form of satellite imagery unaffected by weather conditions, such as cloud coverage during flooded periods, making it suitable for detecting floods [130]. Aerial drones have expanded the remote sensing toolkit for disaster management activities [131]. Real-time information acquisition has its benefits, but it also has disadvantages, including the need for verification. The application of open-source data as geospatial tools in urban flood studies, such as OpenStreetMap (OSM), Java OpenStreetMap (JOSM), QGIS, GPS Essentials, and Open Map Kit (OMK), is also increasing [132].
Roy et al. modelled and identified the waterlogging hazard in Siliguri, India, with the help of an integrated analytical hierarchy process (AHP) and GIS techniques. A primary field investigation was conducted to prepare a waterlogging inventory map along with ten parameters related to urban waterlogging conditioning. GIS and remote sensing-based data Landsat 8 OLI/TIRS, ASTER GDEM, and Vector layers were used for spatial analysis, including change detection. NDVI, NDMI, and NDWI were used interactively during analysis. The results suggest that about 46% of the city is located in high to very high waterlogging hazard zones [122]. Wijeratne and Li studied the effects of unplanned urban growth on the rise in hydrological extremes in Sri Lanka’s lower Kelani River basin. The study analyzed various remote sensing data, including night-time light images (NOAA/AVHRR) and Landsat (TM/ETM+/OLI) data of different wavelengths. The study’s findings indicate that there has been a rapid urban spread over the last 23 years and that the overall urban land area has expanded by 130%. Due to urban growth, the flood frequency has also increased significantly over the past 20 years [123]. Singh and Sharma applied geospatial technologies, including IRS-1D LISS IV with PAN satellite data at 5.8 m resolution, Survey of India topo-sheets at 1:50,000 scales, and high-resolution Google-earth data at the sub-meter scale, to prepare urban flood hazard maps in Tapi catchment, India. Time series data on stage and discharge, stored as *.ASCII format files, have been linked with GIS software-based analysis tools, thereby interlinking spatial and temporal data using GIS software and customized DBMS tools [125]. A study by Sadiq et al. used Sentinel-1 imagery to detect flood water in Bhubaneswar and Cuttack, India. The study experimented with two deep learning methods that were trained and tested on an open-source labeled satellite imagery dataset called Sen1Floods11. They then compared the performance of these two deep learning models with a conventional thresholding-based flood segmentation model, Otsu. The flood extent from the model that performed the best was then displayed on a map [130]. A study by Sowmya et al. assessed the flood zoning of Cochin City by applying a multi-criteria evaluation approach in a geographical information system environment with inputs from remotely sensed images acquired by the LISS-III sensor of IRS-P6 satellite with a spatial resolution of 23.5 m and SRTM DEM. The standard software package ArcGIS 9.3 was used for all GIS operations, including database generation and spatial analysis; ERDAS Imagine was used for all image processing [133]. A study by Tomar et al. proposes an integrated remote sensing, geographic information system (GIS), and field survey-based approach for identifying and predicting urban flood-prone areas [126]. A study by Dammalage and Jayasinghe in Colombo analyzes the impact of land-use change on the 2016 flood compared to the land use during the 1989 flood. NDVI, NDBI, and NDWI indices were used to determine land use from Landsat. SVM classification was selected, and change detection was performed with remote sensing and a GIS environment. The comparison of land-use changes between 1989 and 2016 shows that the area of the Kelani river watershed changed into an urban area, significantly impacting flood inundation [134]. Zope et al. assessed the impact of land use–land cover (LULC) change and urbanization on floods for an expanding urban catchment of the Oshiwara River in Mumbai, India. The land use change was mapped for 1966, 2001, and 2009 using the topographic map and satellite images. Advanced spaceborne Thermal and Reflection Radiometer (ASTER), the Global Digital Elevation Model (GDEM) of Terra satellite, and the Shuttle Radar Topography Mission (SRTM) DEM were used for the delineation of the watershed boundary of the study area. The actual surveyed data were used to generate a better geometric profile along the river cross sections. Catchment and drainage networks were generated using the Arc GIS extension of HEC-GeoHMS software [88]. Remote sensing and GIS technologies support disaster management, especially for rapid and sudden urban flood hazards. Combining a remotely sensed hydrography dataset with a hydraulic model enables the accurate modeling of flooding, even in areas with little available data [135]. Rijal et al. monitored underlying land-cover dynamics and flood hazards in Birendranagar, a rapidly urbanizing city in Nepal. A study assessed spatiotemporal urban dynamics and associated LULC changes in the city using Landsat imagery classifications; the results show several settlements and cultivated lands along river banks are at high risk of flood hazards [121].

4. Urban Flood Management Practices in South Asian Cities

Urban floods have become a severe problem in South Asian cities. The management of these floods is vital to ensure people’s safety and maintain socioeconomic conditions [136]. Management practices vary among nations and depend on current infrastructure, technologies, and the level of urban planning [137]. The flood risk is increasing due to poor management and inadequate mitigation measures worldwide, especially in developing countries [138]. Therefore, protecting the wellbeing of people and communities depends on sensible management programs and risk mitigation techniques. Currently, there is increasing attention towards a new paradigm of flood management based on effective risk mitigation (structural flood measures, such as embankments, dikes, and drainage, or low impact development, LID) and adaptation strategies (non-structural soft measures, such as early warning systems, flood awareness, and policy initiatives) [139].

4.1. Structural Measures

Urban flooding is often regarded as an infrastructure issue that can be resolved with engineering technologies since they considerably lower the risk and harm from flooding. In South Asian nations, most government initiatives aim to enhance structural elements such as embankments, retaining walls, levees, culverts, detention ponds, drainage channel upgrades, and removing floodplain barriers. In Surat city, India embankment and the retaining wall on the River Tapi are the city’s most critical flood protection measures. Novel stormwater management strategies and Low Impact Development (LID) have been employed in some cities, including rain gardens (RGs), green roofs, infiltration trenches, rainwater harvesting, and porous pavements to address urban flooding [50], as shown in Table 2. In Hyderabad, India, RGs built with depths ranging from 400 to 500 mm have performed well during the monsoon season. For two years and five years of design with precipitation of 1 h, urban green and open spaces retained 44–50% of the rain [140]. In contrast, bioretention basins were unsuitable for high-intensity rainfall [62]. In Guwahati, India, the flooding in nearby canals has been lessened, but not entirely eradicated, by widening some channels and building detention ponds. A study shows that a detention pond lowered the city’s inundation by 43% and the maximum flood depth by 46% [141]. Similarly, Sarmah and Das designed seven distinct trapezoidal drainage sections to create an integrated drainage network that can, to some extent, “self-heal” urban flood mitigation [142]. The Poisar River basin in Mumbai shows a decrease in peak discharge from 10.7% for the 2-year return period to 34.5% for the 200-year return period when looking at the impact of detention ponds on surface runoff and floodplain extent. Additionally, for LULC in the year 2009, there was a decrease in flood extent from 4.5% for the 25-year return period to 7.7% for the 100-year return period and a decrease in the total flood hazard area of 14.9% [89] due to the use of a detention pond.
In Bangladesh, dikes, embankments, polders, levees, bunds, or floodwalls along the main rivers and estuaries, and retention ponds, pumping stations, and the diversion of flood flows through distributaries are some of the structural flood control techniques commonly employed in urban areas. After the flood hazard in 1988, the western side of Dhaka was surrounded by embankments, floodwalls, and raised roads to protect against riverine floods. A further 2460 km of surface drains that transport stormwater to the significant sewer lines have been built and maintained by the Dhaka City Corporation. Pumps are used at the outputs to remove the stormwater. Due to substantial investments in drainage networks, urban flooding conditions have improved in several areas of Central Dhaka since 2004. The Dhaka Water and Sewerage Authority (DWASA) has enhanced conveyance in pipes and open drains through desilting, installing new drainage pipes, and reclaiming encroached open drains [66]. Similarly, Sirajganj is protected by large detention ponds than can hold water during storm events and flood embankments along the right bank of the Jamuna River [143]. As rainwater harvesting is crucial in reducing water logging in metropolitan areas caused by storm runoff, the government has made it mandatory to install the RWH system in all proposed new buildings [144]. In an urbanized area of Chittagong where urban flooding is frequent, Akter et al. investigated the viability of a distributed rain barrel RWH system as a flood mitigation strategy. As an application of LID, RWH shows that a reduction of 28.66% could be achieved in reducing flood extent. Moreover, the study showed that 10–60% imperviousness of the sub-catchment area could yield a monthly RWH potential of 0.04–0.45 m3 from a square meter of rooftop area [113].
In Pakistan, flood protection involves structural solutions, including flood protective embankments, flood dikes, guided head spurs, flood diversion channels, channel enlargements, and channel straightening [40]. However, such structural mitigation measures are expensive and beyond the financial capability of developing nations like Pakistan [145]. In Sri Lanka, urban flood management uses diversion canals, tunnels to discharge water, a new pumping station, and widening locks as structural adaptation measures; however, stopping wetland encroachment has a much more significant impact [119]. Additionally, rainwater harvesting has been used for many years to prevent urban flooding. RWH has become a mandatory requirement of modern buildings due to the growing trend in urban green buildings and changes in current laws, which will soon increase the total number of RWH systems in use [146]. In Nepal, embankment and drainage construction are the primary structural measures implemented for urban flood management.
A functional drainage system is essential to reduce water logging issues and guarantee adequate sanitation facilities for the urban population. However, due to their limited space, it is challenging to construct structural flood control measures in urban areas [147]. In many urban areas, installed drains are either undersized or nonexistent, primarily because stormwater drainage funding needs to be prioritized [62]. Additionally, these are expensive, particularly for developing nations [148]. In the past, storm sewers were constructed to handle 12 to 20 mm of rain per hour [149]. This makes sewers in many cities small, resulting in significant urban flooding during increasingly extreme events. Similarly, where structures are not routinely examined, they could degrade, collapse during a flood event, and negatively affect people’s lives, livelihoods, and the biophysical environment, creating more problems than they solve. There is a necessity for regular cleaning and maintenance of the drainage system by removing garbage, increasing water infiltration capacity, and decreasing surface runoff. Urban areas urgently need sustainable drainage management schemes [136].

4.2. Non-Structural Measures

Structural mitigation measures may be challenging to implement in highly urbanized locations due to resource and space limitations and the fact that high-density structures have already taken up much of the land surface. Non-structural flood mitigation measures, such as urban floodproofing management, cleaning drainage networks, flood defense systems, evacuation plans, and flood forecasting and early warning systems, are more practical in reducing flood damage. Some examples of non-structural measures being implemented in the region are: a disaster risk awareness-raising program through radio drama in Afghanistan; emergency planning and management, including local flood warning systems, in the Lai Nullah Basin; designing the evacuation plan for Rawalpindi, Pakistan; flood hazard maps called “Flood Atlas” produced by the Central Water Commission (CWC) in India; inundation maps of the entire country up to district level, and of Dhaka city in Bangladesh [150]; and automatic weather stations to disseminate real-time rainfall and flood alerts in Mumbai [151], among others.

Early Warning System

The early warning system (EWS) is considered an essential component of disaster risk reduction by the Hyogo Framework for Disaster Reduction (2005–2015) and the Sendai Framework for Disaster Risk Reduction (2015–2030). Some EWS initiatives have been implemented at the regional and national levels in the region (Table 3). In Chennai, India, an “integrated expert urban flood forecasting system for Chennai” was created and used; it consists of six key, interconnected components. All links are automated to convey information about floods through real-time prediction monitoring and data sharing [152]. Similarly, in Mumbai, automatic weather stations have been installed to track rainfall and send real-time rain and flood notifications via websites and mobile devices [153]. In Guwahati, a fully automated web-based flood warning system was launched in August 2020 to alert local authorities about flash floods, heavy rainfall, and waterlogging with 72 h lead time; this is helpful for taking precautions to avoid unfavorable situations and prepare for flood conditions [154]. In Bangalore, high-intensity rainfall alerts, flood forecast alerts, and early warnings are sent via email, social media, and SMS to zonal heads, ward-level officers, and all concerned line departments in the city. A website and mobile app are developed to notify the public about urban flooding in the town. “VARUNA MITRA,” a 24/7 interactive help desk, offers the general public weather-related data, forecasts, and guidance [107]. For planning and implementing effective control measures in cities, rainfall data with a 5-min resolution is optimum [62]. Accurate forecasting requires real-time data acquisition from telemetry stations. The delays in establishing new telemetry stations and the failure of already established stations explain India’s poor condition for flood forecasting [155]. In the 2015 Chennai floods, social media networks such as Facebook and WhatsApp became early warning systems and disaster management tools for social activism. These networks gathered people worldwide to contribute toward rescue and relief for flood victims [156]. In Kerela, India, schoolchildren log daily rainfall and river-flow measurements in their rain book and send the data by WhatsApp to a group that oversees the operation. Two hundred twenty river gauges and 13 rain gauges are spread across the 1272-square-kilometre watershed. With deep knowledge of the surrounding topography, and aided by the data, students can predict when areas downhill will flood [22].
In Bangladesh, flood forecasting technology protects people’s lives and property [150]. The Flood Forecasting and Warning Center (FFWC) is responsible for forecasting and is based on simulation results of MIKE 11 models. Deterministic forecasts are disseminated from central to district levels through email, website, and cell phone services [157]. However, early warnings only sometimes reach local stakeholders; information needs to be more frequently understood, and insufficient follow-up on activities hinders operations [158]. With financial support worth USD 113 million in 2017, the government enhanced weather forecasting, EWS, and dissemination of information [159]. The current hydrometeorological information services are being upgraded.
Since 1975, Pakistan’s flood preparedness and response system have benefited from the flood forecasting and warning system. The national-level Flood Forecasting Division (FFD), located in Lahore, is responsible for flood forecasting and disseminating information to the warning centers. The 2010 Pakistan flood led the government to establish a flood forecasting and early warning system for the Lai basin, that flows through Islamabad and Rawalpindi. However, the FEW only covers some of the river basins [160]. Some cities have developed flood mitigation strategies, but municipal authorities still need to take more action [40,161].
The 2004 tsunami highlighted Sri Lanka’s urgent need for an efficient National Early Warning System. As the focal point of coordination for the early warning system and its transmission, the Disaster Management Center (DMC) was established. Premasiri and Chandranath worked to create a warning system to lessen the risks of urban flooding in the Panadura urban council region. To monitor and warn of real-time flood events and display a flooding area in the online system, they used GPS, RS, GIS, PIC control circuit, Google API, Arc Server, PHP, JavaScript, and Google My Maps [162].
Since 2010, Nepal’s Early Warning Systems for water-related disasters have used automatic sensing and mobile communication technology to collect and disseminate real-time climate and hydrological data. National early warnings are issued by the Department of Hydrology and Meteorology’s (DHM) Flood Forecasting Section. It is publicly available at http://www.hydrology.gov.np. It provides flood forecasts and real-time river and rainfall gauge data, displaying which rivers are rising or declining and their current warning level. Additionally, it sends mobile SMS to residents in the risk zone. Human casualties have been reduced significantly due to the development of EWS technology. The installation of real-time stations by DHM to monitor the river’s hourly water level and rainfall stations inside the Kathmandu basin has assisted in determining the river’s danger level [163]. However, the flood that occurred due to extreme rainfall in August 2017 in Terai and Kathmandu attests to the urgent need for more preparation and people-centered EWSs that reach all communities [164].
In Bhutan, EWSs were initially introduced by the Department of Hydro-Met Services (DHMS) in 1988 [165]. In 2009, the impact of Cyclone Aila boosted the urgency of and commitment to the development of Bhutan’s early warning system. The hydro-met monitoring network has been upgraded with technology to relay real-time data. Currently, 15 stations transmit real-time data every 15 min to the DHMS servers at the National Weather and Flood Forecasting and Warning Centre (NWFFWC) [166]. In Afghanistan, there needs to be an organized network of EWS. The Afghanistan Meteorological Department issues province-scale flood warnings, which are ineffective for risk reduction. Even though alerts are shared via their websites and social media, there needs to be more comprehensive information at the local or watershed level [167]. In addition, even when the public is informed of early warnings, they may still choose not to leave owing to suspicion of EWS, travel time to shelters, or fear that they cannot return after the flood [168].

5. Existing Gap in Urban Flood Hazard Assessment and Management Practices between SA Countries and the Developed World

A vast gap exists between South Asian and developed countries in urban flood hazard assessment and management practices. In South Asian cities, high-resolution DEM data and short-duration rainfall are still lacking. In contrast, urban flood hazard assessment in developed countries is moving towards refinement and efficiency (as shown below in Table 4). The application of high-resolution DEMs is rising for realistic terrain representation, which is essential for simulating surface runoff [170]. The cellular automata (CA) approach, that requires very fine-resolution data, processing time, and computing resources, is increasing. In Manhattan, New York City, 140 sub-basins were created from a 0.30 m Lidar DEM and multiple flood maps for each sub-basin were created [171]. The risk of a pluvial flood in Olfen, Germany, was assessed using a 2D hydrodynamic model, and ANUGA Software, using 1 m DEM acquired from the laser scan, and plausibility was checked based on the flow paths and sink analysis [172]. In Bacau, Romania, a 2D HEC-RAS model predicted urban flooding with 0.5 m resolution DEMs obtained from airborne LiDAR technology and built-up data digitalized from 0.5 m resolution orthophotos digital image [173]. An investigation in Fengxi New Town, China, used a novel high-accuracy and long lead time urban flood forecasting model by coupling atmospheric and hydrodynamic models. As an atmospheric model, the GRAPE MESO model is used to forecast rainstorms. The reconstructed predicted rainstorm is then used as input data for the hydrodynamic flood model. Moreover, the urban flood inundation was predicted using 2 m DEM and Digital Orthophoto Map (DOM) [174]. In Nanjing, China, a new technique that included data from social media, land use, and other sources was used to analyze the spatiotemporal patterns of public responses to urban flooding during 1–21 July 2016 [175]. In Alcester, UK, numerical experiments have been carried out integrating a 2D shallow-water model using a 10 cm DEM. Studies show that localized, decimetric-scale modifications in the elevation of roads can lead to significant differences in flood inundation [176]. Based on big data, machine learning techniques are utilized in the USA to examine the effects of various flood types [177]. In a study conducted in Fredericton, Canada, the HAND model created a preliminary flood map. After that, pseudo-training samples for a Random Forest model were created utilizing the conditions of height, slope, aspect, distance from the river, and LULC maps. The findings demonstrate that the suggested approach can enhance flood extent prediction without using real-world training data [178]. Using the GIS-based SCS-CN approach, Sabita et al. examined the effects of urbanization-related land use change on surface runoff in Xiamen, China, between 1980 and 2015, a period of intense urban growth. The impact of urbanization shows that the amount of runoff contributed by built-up land use increased from 14.2% to 27.9% with the rise of urban expansion from 1980 to 2015 [179].
Skilodimou et al. applied the analytical hierarchy process (AHP) method and a geographical information system (GIS) to create the flood hazard assessment map in Nea Makri, Greece [180]. A study by Joo et al. in 2019 assessed flood risk for the Midwest region of the Republic of Korea using factor analysis and principal component analysis (PCA). This assessment involved choosing the leading indicators that have the greatest impact on flood damage and weighting them using the analytic hierarchy process (AHP), constant sum scale (CSS), and entropy [181]. A flood risk assessment of urban areas in Kaohsiung along the Dianbao River was carried out by Liu et al. in 2021, based on flood hazards and societal vulnerability. A rainfall-runoff model (HEC-HMS) was selected to simulate discharge for hazard assessment, and the simulated discharges were used as inputs for the inundation model (FLO-2D). Using the flooding depths and extents that would occur in the areas under various rainfall return periods, the validated HEC-HMS and FLO-2D models were used to create hazard maps [182]. Vojtek and Vojtekova defined the flood susceptibility zones for the territory of Slovakia using a multi-criteria approach, particularly the analytical hierarchy process (AHP) technique and geographic information systems (GIS). Seven flood conditioning factors were chosen: hydrography (distance from rivers), river network density; hydrology (flow accumulation); morphometry (elevation, slope); and permeability (curve numbers, lithology). The relative importance of the selected factors prioritized slope degree as the most important factor, followed by river network density, distance from rivers, flow accumulation, elevation, curve number, and lithology. The flood susceptibility map was validated using earlier floods, showing that 70.9% were coincident, thus confirming the effectiveness of the methodology [183]. Khoirunisa assessed precipitation, near-surface air temperature, and maximum wind speed to examine the future climate of and identify potential hazards in Prague using the Regional Model RCA4’s Recipient Concentration Paths (RCP) 4.5 and 8.5 scenarios. Based on the model scenario RCP 8.5, it was determined that Prague will experience increased urban flooding over several years up until 2060. The results could serve as the foundation for an urban early-warning system [184].
Regarding urban flood management in South Asia, cities still focus on enhancing gray infrastructure over building sustainable solutions to strengthen the urban drainage system. Cities in developed countries focus on using green infrastructure (or gray + green) to alleviate urban flooding because gray infrastructure alone cannot control stormwater. It is insufficient to handle current and anticipated future extreme weather occurrences by relying on expensive, inflexible gray infrastructure. The use of climate-proofing strategies in urban planning today could significantly lower expenses in the future. For example, Low Impact Developments (LID) in the USA, Sustainable Urban Drainage Systems (SuDs) in the UK, Water Sensitive Urban Design (WSUD) in Australia, Low Impact Developments Urban Design (LIDUD) in New Zealand, and Sponge City in China were introduced to address challenges linked to urban water management and surface-water flooding that occur yearly [185]. However, green infrastructure and nature-based solutions are more efficient in urban development when used in the planning stages. Their implementation in built-up areas is challenging due to various considerations, such as few green spaces, the uncertainty of land ownership, etc.
According to a study conducted in Beijing, the baseline volume capture ratio could be raised from 59.9% to 82.2% by installing green roofs on 30% of roof surfaces, rain gardens in 10% of the green areas, and permeable pavement in 35% of the paved areas. This signifies that Sponge City’s goals can be achieved at realistic levels through LID implementation [186]. In Zhuhai, China, LID effectively reduces runoff from small and moderate rainfall amounts by capturing 52.9% of yearly rainfall volume for long-term operation and 28% of annual runoff [187]. In the Nakagyo area of Kyoto, as part of LID practices, rain gardens effectively manage rainfall over a five-year return period and increase resistance to short-term rainstorms [188]. In Eindhoven, the Netherlands, several nature-based solutions, including green roofs, vegetated grid pavement to ordinary parking lots, and inserting swales or bio-swales for stormwater storage in traffic islands, were evaluated for urban flood control depending on the location and available space. The Infoworks I.C.M. numerical model was used to simulate the effects of NBS scenarios for floods with different return periods. Overall, the simulated NBS reduced flood risk by reducing the flood area and depth. Studies show that green infrastructure alternatives to gray infrastructure for managing urban flooding are more affordable and provide more co-benefits [189]. In the developed world, water-wise urban development is becoming more popular. Cities use a hybrid approach of integrated green and gray infrastructure solutions at the municipal, neighborhood, and city levels to increase flood resilience [190]. Technical solutions are essential for reducing the risk of flooding. A study by Goniewicz and Burkle in 2019 in Poland showed how to consolidate information regarding hazardous events and gather them in a professional Information Technology (IT) system, using an integrated database and a modern module for disseminating information to end users. An IT system for the Country’s Protection against Extreme Hazards is being developed, that emphasizes reducing the risks of natural disasters and minimizing crisis management problems. One such initiative is creating an early warning system for inhabitants to help guard against the extraordinary threat associated with natural disasters, especially floods. The creation of such a system is aimed at increasing public safety and limiting losses caused by the occurrence of natural, technological, and synergistic hazards [191] The eastern region of Belgium observed a devastating flood in July 2021, where rainfall equivalent to three months fell in two days. Castro et al. assessed hazards and vulnerability in those municipalities mostly affected along the Vesdre River. It shows that, even though the country and the region have flood early warning systems, 99% of the population received no formal warning, and less than 50% implemented mitigation measures [192].

6. Conclusions

Floods that devastate urban areas are becoming more common and affecting more people in South Asian cities. The primary causes of increased flood risk in the region are climate change and uncontrolled urbanization. Flood impact can be reduced by using hazard mapping to predict potential flood areas accurately. However, selecting the appropriate model for a particular purpose is crucial. Hydraulic/hydrological models, HEC-RAS/HMS, SWMM/PCSWMM, and MIKE are primarily used to assess urban flood hazards in South Asian cities. The region’s primary challenge in hazard assessment is the need for high-resolution DEM and short-duration rainfall data, that significantly affect the model’s simulation results and negatively affect the implementation of flood management measures. South Asian cities still rely on structural flood protection measures, i.e., mainly optimizing urban drainage systems and embankments. At the same time, only a few places have introduced LID, rain gardens, and detention basins. Depending on the capacity of the countries, improved flood EWSs have been developed and implemented in some cities. However, EWS frequently fails to reach local stakeholders. In developed countries, urban flood hazard assessment is moving towards refinement and efficiency by applying a high-resolution DEM representing realistic terrain and rainfall of short duration, which plays a fundamental role in modeling surface processes. Cities use a water-prudent hybrid strategy of integrated nature-based solutions, green and gray infrastructure solutions, at the street, neighborhood, and city levels to increase flood resilience.
Despite advancements in scientific technologies and numerous international and national initiatives to reduce disaster risk, the social and economic effects of disasters on developing nations are growing. In South Asian cities, it is urgent to begin risk-based management to lessen the detrimental effects of urban flooding. Establishing a robust disaster information system should be a top priority of the local government to enable risk-based, comprehensive, and contextualized urban development and hazard mapping. Urban development in the region needs to be reevaluated, and local planning authorities must be encouraged to consider the role of nature-based solutions, which can lead to a stronger relationship between the built and natural environments, improving the quality of life of urban residents.

Limitations of Study

In South Asian countries, urban flood study is still at the early stage, as more focus is given to riverine floods. A major limitation of this study is that the study considers the application of only three hydrodynamic models, HEC-RAS/HMS, PC/SWMM, and MIKE, for urban flood hazard assessment in the region. The literature review on urban risk management practices might not have been fully captured as documentation of good practices at the local level in the South Asian region is still in its infancy.

Supplementary Materials

The following supporting information can be downloaded at: https://www.mdpi.com/article/10.3390/land12030627/s1, Table S1: Application of HEC-RAS/HMS in flood hazard assessment in the urban area of South Asian cities; Table S2: Application of SWMM/PCSWMM in flood hazard assessment in the urban area of South Asian cities; Table S3: Application of MIKE in flood hazard assessment in the urban area of South Asian cities.

Author Contributions

B.M.: (First author) Conceptualization, Methodology, Investigation/Collect Data, Data Curation, Analysis, Writing—Original Draft, Writing Review and Editing, Visualization. S.C.: Conceptualization, Supervision, Project administration, Funding acquisition, Writing—review and editing. L.W.: Data Curation, Writing—review and editing. S.S.: Conceptualization, review and editing. All authors have read and agreed to the published version of the manuscript.

Funding

This research was funded by the National Natural Science Foundation of China (Grant Nos.: 41661144032), the international partnership program of the Chinese Academy of Sciences “Multifunctional urban green space planning based on transdisciplinary learning” (Grant Nos.: 132C35KYSB20200007), and the International (Regional) Cooperation and Exchange Program, the National Natural Science Foundation of China (Grant Nos.:32261143730).

Data Availability Statement

Not applicable.

Acknowledgments

Acknowledgement to Diva-GIS and Survey Department of Nepal for providing GIS shapefile. We would like to acknowledge Greater K. Oyejobi, Kadir Uludag for English editing.

Conflicts of Interest

The authors declare no conflict of interest.

References

  1. CRED; UNDRR. Human Cost of Disasters an Overview of the Last 20 Years 2000–2019; UNDRR: Geneva, Switzerland, 2020. [Google Scholar]
  2. Shariat, R.; Roozbahani, A.; Ebrahimian, A. Risk Analysis of Urban Stormwater Infrastructure Systems Using Fuzzy Spatial Multi-Criteria Decision Making. Sci. Total Environ. 2019, 647, 1468–1477. [Google Scholar] [CrossRef] [PubMed]
  3. Zhou, Q.; Leng, G.; Su, J.; Ren, Y. Comparison of Urbanization and Climate Change Impacts on Urban Flood Volumes: Importance of Urban Planning and Drainage Adaptation. Sci. Total Environ. 2019, 658, 24–33. [Google Scholar] [CrossRef] [PubMed]
  4. Sundermann, L.; Schelske, O.; Hausmann, P. Mind the Risk a Global Ranking of Cities under Threat from Natural Disasters; Swiss Re: Zürich, Switzerland, 2014; pp. 1–30. [Google Scholar]
  5. Rosenfeld, D. Suppression of Rain and Snow by Urban and Industrial Air Pollution. Science 2000, 287, 1793–1796. [Google Scholar] [CrossRef] [PubMed]
  6. O’Donnell, E.C.; Thorne, C.R. Drivers of Future Urban Flood Risk. Philos. Trans. R. Soc. A Math. Phys. Eng. Sci. 2020, 378, 20190216. [Google Scholar] [CrossRef] [Green Version]
  7. United Nations. World Urbanization Prospects: The 2018 Revision (ST/ESA/SER.A/420); Department of Economic and Social Affairs, Population Division, United Nations: New York, NY, USA, 2019; ISBN 9789211483192.
  8. Hernantes, J.; Maraña, P.; Gimenez, R.; Sarriegi, J.M.; Labaka, L. Towards Resilient Cities: A Maturity Model for Operationalizing Resilience. Cities 2019, 84, 96–103. [Google Scholar] [CrossRef]
  9. Seto, K.C.; Güneralp, B.; Hutyra, L.R. Global Forecasts of Urban Expansion to 2030 and Direct Impacts on Biodiversity and Carbon Pools. Proc. Natl. Acad. Sci. USA 2012, 109, 16083–16088. [Google Scholar] [CrossRef] [PubMed] [Green Version]
  10. Kong, F.; Ban, Y.; Yin, H.; James, P.; Dronova, I. Environmental Modelling & Software Modeling Stormwater Management at the City District Level in Response to Changes in Land Use and Low Impact Development. Environ. Model. Softw. 2017, 95, 132–142. [Google Scholar] [CrossRef]
  11. Xie, J.; Wu, C.; Li, H.; Chen, G. Study on Storm-Water Management of Grassed Swales and Permeable Pavement Based on SWMM. Water 2017, 9, 840. [Google Scholar] [CrossRef] [Green Version]
  12. Denissen, A.-K. Climate Change & Its Impacts on Bangladesh. 2012, pp. 86–95. Available online: http://www.ncdo.nl/artikel/climate-change-its-impacts-bangladesh (accessed on 5 April 2021).
  13. Li, A.; Deng, W.; Zhao, W.; Liu, B.; Zhang, J.; Kong, B.; Nan, X.; Bian, J.; Koirala, H.L.; Gilani, H.; et al. A Geo-Spatial Database about the Eco-Environment and Its Key Issues in South Asia. Big Earth Data 2018, 2, 298–319. [Google Scholar] [CrossRef] [Green Version]
  14. Otto, F.E.L.; Zachariah, M.; Saeed, F.; Siddiqi, A.; Shahzad, K.; Mushtaq, H.; AchutaRao, K.; T, C.S.; Barnes, C.; Philip, S.; et al. Climate Change Likely Increased Extreme Monsoon Rainfall, Flooding Highly Vulnerable Communities in Pakistan. World Weather Attrib. 2022, 10, 12. [Google Scholar]
  15. Cao, W.; Zhou, Y.; Güneralp, B.; Li, X.; Zhao, K.; Zhang, H. Increasing Global Urban Exposure to Flooding: An Analysis of Long-Term Annual Dynamics. Sci. Total Environ. 2022, 817, 153012. [Google Scholar] [CrossRef]
  16. Emilsson, T.; Sang, Å.O. Impacts of Climate Change on Urban Areas and Nature-Based Solutions for Adaptation. In Nature-based Solutions to Climate Change Adaptation in Urban Areas, Theory and Practice of Urban Sustainability Transitions; Kabisch, N., Korn, H., Stadler, J., Aletta, B., Eds.; Springer: Berlin/Heidelberg, Germany, 2017; pp. 15–27. ISBN 9783319560915. [Google Scholar]
  17. Zhou, Q. A Review of Sustainable Urban Drainage Systems Considering the Climate Change and Urbanization Impacts. Water 2014, 6, 976–992. [Google Scholar] [CrossRef] [Green Version]
  18. IPCC. Regional Fact Sheet—Urban Areas; IPCC: Geneva, Switzerland, 2021. [Google Scholar]
  19. Douglas, I. Climate Change, Flooding and Food Security in South Asia. Food Secur. 2009, 1, 127–136. [Google Scholar] [CrossRef]
  20. Mukherjee, S.; Aadhar, S.; Stone, D.; Mishra, V. Increase in Extreme Precipitation Events under Anthropogenic Warming in India. Weather Clim. Extrem. 2018, 20, 45–53. [Google Scholar] [CrossRef]
  21. Ali, H.; Mishra, V. Contrasting Response of Rainfall Extremes to Increase in Surface Air and Dewpoint Temperatures at Urban Locations in India. Sci. Rep. 2017, 7, 1228. [Google Scholar] [CrossRef] [Green Version]
  22. Vaidyanathan, G. How India Is Battling Deadly Rain Storms. Nature 2023, 614, 210–213. [Google Scholar] [CrossRef]
  23. Roxy, M.K.; Ghosh, S.; Pathak, A.; Athulya, R.; Mujumdar, M.; Murtugudde, R.; Terray, P.; Rajeevan, M. A Threefold Rise in Widespread Extreme Rain Events Over Central India. Nat. Commun. 2017, 8, 708. [Google Scholar] [CrossRef] [Green Version]
  24. Krishnan, R.; Sabin, T.P.; Ayantika, D.C.; Kitoh, A.; Sugi, M.; Murakami, H.; Turner, A.G.; Slingo, J.M.; Rajendran, K. Will the South Asian Monsoon Overturning Circulation Stabilize Any Further? Clim. Dyn. 2013, 40, 187–211. [Google Scholar] [CrossRef]
  25. Ali, H.; Modi, P.; Mishra, V. Increased Flood Risk in Indian Sub-Continent under the Warming Climate. Weather Clim. Extrem. 2019, 25, 100212. [Google Scholar] [CrossRef]
  26. Milesi, C.; Churkina, G. Measuring and Monitoring Urban Impacts on Climate Change from Space. Remote Sens. 2020, 12, 3494. [Google Scholar] [CrossRef]
  27. Mujumdar, M.; Bhaskar, P.; Ramarao, M.V.S.; Uppara, U.; Goswami, M.; Borgaonkar, H.; Chakraborty, S.; Ram, S.; Mishra, V.; Rajeevan, M.; et al. Assessment of Climate Change over the Indian Region; Springer: Singapore, 2020; ISBN 9789811543272. [Google Scholar]
  28. Wang, B.; Biasutti, M.; Byrne, M.P.; Castro, C.; Chang, C.P.; Cook, K.; Fu, R.; Grimm, A.M.; Ha, K.J.; Hendon, H.; et al. Monsoons Climate Change Assessment. Bull. Am. Meteorol. Soc. 2021, 102, E1–E19. [Google Scholar] [CrossRef]
  29. Schreider, S.Y.; Smith, D.I.; Jakeman, A.J. Climate Change Impacts on Urban Flooding. Clim. Chang. 2000, 47, 91–115. [Google Scholar] [CrossRef]
  30. Dutta, D.; Herath, S.; Musiake, K. A Mathematical Model for Flood Loss Estimation. J. Hydrol. 2003, 277, 24–49. [Google Scholar] [CrossRef]
  31. McMichael, A.J.; Woodruff, R.E.; Hales, S. Climate Change and Human Health: Present and Future Risks. Lancet 2006, 367, 859–869. [Google Scholar] [CrossRef] [PubMed]
  32. Shanableh, A.; Al-Ruzouq, R.; Yilmaz, A.G.; Siddique, M.; Merabtene, T.; Imteaz, M.A. Effects of Land Cover Change on Urban Floods and Rainwater Harvesting: A Case Study in Sharjah, UAE. Water 2018, 10, 631. [Google Scholar] [CrossRef] [Green Version]
  33. Richards, D.R.; Edwards, P.J. Using Water Management Infrastructure to Address Both Flood Risk and the Urban Heat Island. Int. J. Water Resour. Dev. 2018, 34, 490–498. [Google Scholar] [CrossRef]
  34. Sheng, J.; Wilson, J.P. Watershed Urbanization and Changing Flood Behavior across the Los Angeles Metropolitan Region. Nat. Hazards 2009, 48, 41–57. [Google Scholar] [CrossRef]
  35. Li, Y.; Wang, C. Impacts of Urbanization on Surface Runoff of the Dardenne Creek Watershed, St. Charles County, Missouri. Phys. Geogr. 2009, 30, 556–573. [Google Scholar] [CrossRef]
  36. Kumar, M.; Sharif, M.; Ahmed, S. Impact of Urbanization on the River Yamuna Basin. Int. J. River Basin Manag. 2019, 18, 461–475. [Google Scholar] [CrossRef]
  37. Du, S.; Cheng, X.; Huang, Q.; Chen, R.; Ward, P.J.; Aerts, J.C.J.H. Brief Communication: Rethinking the 1998 China Floods to Prepare for a Nonstationary Future. Nat. Hazards Earth Syst. Sci. 2019, 19, 715–719. [Google Scholar] [CrossRef] [Green Version]
  38. Vorobevskii, I.; Al Janabi, F.; Schneebeck, F.; Bellera, J.; Krebs, P. Urban Floods: Linking the Overloading of a Storm Water Sewer System to Precipitation Parameters. Hydrology 2020, 7, 35. [Google Scholar] [CrossRef]
  39. Morita, M. Flood Risk Impact Factor for Comparatively Evaluating the Main Causes That Contribute to Flood Risk in Urban Drainage Areas. Water 2014, 6, 253–270. [Google Scholar] [CrossRef] [Green Version]
  40. Rahman, A.U.; Shaw, R. Flood Risk and Reduction Approaches in Pakistan. In Disaster Risk Reduction Approaches in Pakistan; Rahman, A.U., Khan, A.N., Shaw, R., Eds.; Springer: Berlin/Heidelberg, Germany, 2015; pp. 145–160. ISBN 9784431553694. [Google Scholar]
  41. Lyu, H.; Dong, Z.; Roobavannan, M.; Kandasamy, J.; Pande, S. Rural Unemployment Pushes Migrants to Urban Areas in Jiangsu Province, China. Palgrave Commun. 2019, 5, 92. [Google Scholar] [CrossRef] [Green Version]
  42. Montoya, L. Geo-Data Acquisition through Mobile GIS and Digital Video: An Urban Disaster Management Perspective. Environ. Model. Softw. 2003, 18, 869–876. [Google Scholar] [CrossRef]
  43. WMO. Integrated Flood Management Case Study Pakistan: Lai Nullah Basin Flood Problem Islamabad-Rawalpindi Cities; WMO: Geneva, Switzerland, 2004. [Google Scholar]
  44. Okubo, K.; Khan, M.S.A.; Hassan, M.Q. Hydrological Processes of Adsorption, Sedimentation, and Infiltration into the Lake Bed during the 2004 Urban Flood in Dhaka City, Bangladesh. Environ. Earth Sci. 2010, 60, 95–106. [Google Scholar] [CrossRef]
  45. Lei, M.; Niyogi, D.; Kishtawal, C.; Pielke, R.A.; Beltr, A. Effect of Explicit Urban Land Surface Representation on the Simulation of the 26 July 2005 Heavy Rain Event over Mumbai, India. Atmos. Chem. Phys 2008, 8, 5975–5995. [Google Scholar] [CrossRef] [Green Version]
  46. Alam, A.; Bhat, M.S.; Farooq, H.; Ahmad, B.; Ahmad, S.; Sheikh, A.H. Flood Risk Assessment of Srinagar City in Jammu and Kashmir, India. Int. J. Disaster Resil. Built Environ. 2018, 9, 114–129. [Google Scholar] [CrossRef]
  47. Narasimhan, B.; Bhallamudi, S.M.; Mondal, A.; Ghosh, S.; Mujumdar, P. Chennai Floods 2015 A Rapid Assessment; Interdisciplinary Centre for Water Research (ICWaR): Bengaluru, India, 2016. [Google Scholar]
  48. Devi, N.N.; Sridharan, B.; Bindhu, V.M.; Narasimhan, B.; Bhallamudi, S.M.; Bhatt, C.M.; Usha, T.; Vasan, D.T.; Kuiry, S.N. Investigation of Role of Retention Storage in Tanks (Small Water Bodies) on Future Urban Flooding: A Case Study of Chennai City, India. Water 2020, 12, 2875. [Google Scholar] [CrossRef]
  49. Zia, S.; Shirazi, S.A. Spatio-Temporal Analysis of Areas Vulnerable to Urban Flooding: A Case Study of Lahore, Pakistan. Int. J. Econ. Env. 2019, 10, 85–89. [Google Scholar]
  50. Vemula, S.; Raju, K.S.; Veena, S.S.; Kumar, A.S. Urban Floods in Hyderabad, India, under Present and Future Rainfall Scenarios: A Case Study. Nat. Hazards 2018, 95, 637–655. [Google Scholar] [CrossRef]
  51. Gehrels, H. Protecting Colombo against Future Floods. Available online: https://www.deltares.nl/en/projects/protecting-colombo-against-future-floods/ (accessed on 15 December 2021).
  52. Jadhav, R.; Bhat, S. Death Toll from Mumbai Floods Jumps to 14, Rain Eases Up. Available online: https://www.reuters.com/article/us-india-monsoon-idUSKCN1BA0GH (accessed on 30 August 2021).
  53. Bhatta, B.P.; Pandey, R.K. Bhaktapur Urban Flood Related Disaster Risk and Strategy after 2018. J. APF Command. Staff. Coll. 2020, 3, 72–89. [Google Scholar] [CrossRef]
  54. Mishra, A.K.; Nagaraju, V. Space-Based Monitoring of Severe Flooding of a Southern State in India during South-West Monsoon Season of 2018. Nat. Hazards 2019, 97, 949–953. [Google Scholar] [CrossRef]
  55. Sangomla, A. Mumbai Rains Once Again Prove Climate Change Is No Hoax. Available online: https://www.downtoearth.org.in/news/climate-change/mumbai-rains-once-again-prove-climate-change-is-no-hoax-65387 (accessed on 2 July 2021).
  56. Wadhawan, S.K.; Singh, B.; Ramesh, M.V. Causative Factors of Landslides 2019: Case Study in Malappuram and Wayanad Districts of Kerala, India. Landslides 2020, 17, 2689–2697. [Google Scholar] [CrossRef]
  57. Read, C. Flash Floods DEVASTATE Afghanistan Killing 20 and Destroying 2000 Homes. Available online: https://www.express.co.uk/news/world/1094803/afghanistan-floods-death-toll-Kandahar-city-united-nations (accessed on 20 October 2021).
  58. Uprety, M. A Dramatic Start to Nepal’s 2019 Monsoon Season. Available online: https://floodresilience.net/blogs/a-dramatic-start-to-nepals-2019-monsoon-season/ (accessed on 4 November 2021).
  59. Shams, S. Urban Flooding—Who Is Responsible for Karachi’s Woes? DW Made Minds; Deutsche Welle (DW): Bonn, Germany, 2020. [Google Scholar]
  60. Priyam, S. Four Die, Houses Crumble as Heavy Monsoon Rains Swamp Delhi-NCR. More Rains Forecast. Available online: https://weather.com/en-IN/india/monsoon/news/2020-07-20-two-die-houses-crumble-roads-flood-heavy-monsoon-rains-delhi-ncr-more (accessed on 30 June 2021).
  61. Atta-ur-Rahman; Shaw, R.; Surjan, A.; Parvin, G.A. Urban Disasters and Approaches to Resilience. Urban Disasters Resil. Asia 2016, 1–19. [Google Scholar] [CrossRef]
  62. Gupta, K. Challenges in Developing Urban Flood Resilience in India. Philos. Trans. R. Soc. A Math. Phys. Eng. Sci. 2020, 378, 20190211. [Google Scholar] [CrossRef] [Green Version]
  63. Surampudi, S.; Yarrakula, K. Mapping and Assessing Spatial Extent of Floods from Multitemporal Synthetic Aperture Radar Images: A Case Study on Brahmaputra River in Assam State, India. Environ. Sci. Pollut. Res. 2020, 27, 1521–1532. [Google Scholar] [CrossRef]
  64. Ray, K.; Pandey, P.; Pandey, C.; Dimri, A.P.; Kishore, K. On the Recent Floods in India. Curr. Sci. 2019, 117, 204–218. [Google Scholar] [CrossRef]
  65. Kabir, M.H.; Ahmed, I.; Von Meding, J.; Forino, G.; Ghosh, A.K. Impacts of Prolonged Waterlogging on Educational Continuity at Schools in Peri-Urban Areas of Dhaka, Bangladesh. Dhaka Univ. J. Earth Environ. Sci. 2021, 9, 13–23. [Google Scholar] [CrossRef]
  66. Dasgupta, S.; Zaman, A.; Roy, S.; Huq, M.; Jahan, S.; Nishat, A. Urban Flooding of Greater Dhaka in a Changing Climate; World Bank Publications: Washington, DC, USA, 2015; ISBN 9781464807107. [Google Scholar]
  67. UNDRR. Disaster Risk Reduction in Pakistan: Status Report 2019; UNDRR: Bangkok, Thailand, 2019. [Google Scholar]
  68. Shah, S.M.H.; Mustaffa, Z.; Teo, F.Y.; Imam, M.A.H.; Yusof, K.W.; Al-Qadami, E.H.H. A Review of the Flood Hazard and Risk Management in the South Asian Region, Particularly Pakistan. Sci. African 2020, 10, e00651. [Google Scholar] [CrossRef]
  69. Manawadu, L.; Wijeratne, V.P.I.S. Anthropogenic Drivers and Impacts of Urban Flooding—A Case Study in Lower Kelani River Basin, Colombo Sri Lanka. Int. J. Disaster Risk Reduct. 2021, 57, 102076. [Google Scholar] [CrossRef]
  70. Kc, S.; Shrestha, S.; Ninsawat, S.; Chonwattana, S. Predicting Flood Events in Kathmandu Metropolitan City under Climate Change and Urbanisation. J. Environ. Manag. 2021, 281, 111894. [Google Scholar] [CrossRef]
  71. Manawi, S.M.A.; Nasir, K.A.M.; Shiru, M.S.; Hotaki, S.F.; Sediqi, M.N. Urban Flooding in the Northern Part of Kabul City: Causes and Mitigation. Earth Syst. Environ. 2020, 4, 599–610. [Google Scholar] [CrossRef]
  72. Villordon, M.B.B.L.; Gourbesville, P. Community-Based Flood Vulnerability Index for Urban Flooding: Understanding Social Vulnerabilities and Risks. Springer Water 2016, 2014, 75–96. [Google Scholar] [CrossRef] [Green Version]
  73. Yin, J.; Ye, M.; Yin, Z.; Xu, S. A Review of Advances in Urban Flood Risk Analysis over China. Stoch. Environ. Res. Risk Assess. 2014, 29, 1063–1070. [Google Scholar] [CrossRef]
  74. De Moel, H.; Van Alphen, J.; Aerts, J.C.J.H. Flood Maps in Europe—Methods, Availability and Use. Nat. Hazards Earth Syst. Sci. 2009, 9, 289–301. [Google Scholar] [CrossRef] [Green Version]
  75. Jain, G.V.; Agrawal, R.; Bhanderi, R.J.; Jayaprasad, P.; Patel, J.N.; Agnihotri, P.G.; Samtani, B.M. Estimation of Sub-Catchment Area Parameters for Storm Water Management Model (SWMM) Using Geo-Informatics. Geocarto Int. 2016, 31, 462–476. [Google Scholar] [CrossRef]
  76. Jacobson, C.R. Identification and Quantification of the Hydrological Impacts of Imperviousness in Urban Catchments: A Review. J. Environ. Manag. 2011, 92, 1438–1448. [Google Scholar] [CrossRef]
  77. Andimuthu, R.; Kandasamy, P.; Mudgal, B.V.; Jeganathan, A.; Balu, A.; Sankar, G. Performance of Urban Storm Drainage Network under Changing Climate Scenarios: Flood Mitigation in Indian Coastal City. Sci. Rep. 2019, 9, 7783. [Google Scholar] [CrossRef] [PubMed] [Green Version]
  78. Rahmati, O.; Darabi, H.; Panahi, M.; Kalantari, Z.; Naghibi, S.A.; Ferreira, C.S.S.; Kornejady, A.; Karimidastenaei, Z.; Mohammadi, F.; Stefanidis, S.; et al. Development of Novel Hybridized Models for Urban Flood Susceptibility Mapping. Sci. Rep. 2020, 10, 12937. [Google Scholar] [CrossRef]
  79. Bisht, D.S.; Chatterjee, C.; Kalakoti, S.; Upadhyay, P.; Sahoo, M.; Panda, A. Modeling Urban Floods and Drainage Using SWMM and MIKE URBAN: A Case Study. Nat. Hazards 2016, 84, 749–776. [Google Scholar] [CrossRef]
  80. Feng, B.; Wang, J.; Zhang, Y.; Hall, B.; Zeng, C. Urban Flood Hazard Mapping Using a Hydraulic–GIS Combined Model. Nat. Hazards 2020, 100, 1089–1104. [Google Scholar] [CrossRef]
  81. Rajib, A.; Golden, H.E.; Lane, C.R.; Wu, Q. Surface Depression and Wetland Water Storage Improves Major River Basin Hydrologic Predictions. Water Resour. Res. 2020, 56, e2019WR026561. [Google Scholar] [CrossRef] [PubMed]
  82. Henonin, J.; Russo, B.; Mark, O.; Gourbesville, P. Real-Time Urban Flood Forecasting and Modeiling—A State of the Art. J. Hydroinformatics 2013, 15, 717–736. [Google Scholar] [CrossRef]
  83. Jiang, L.; Chen, Y.; Wang, H. Urban Flood Simulation Based on the SWMM Model. In Proceedings of the RSHS14 and ICGRHWE14, Guangzhou, China, 24–27 August 2014; Volume 368. [Google Scholar]
  84. Bhattacharjee, S.; Kumar, P.; Thakur, P.K.; Gupta, K. Hydrodynamic Modelling and Vulnerability Analysis to Assess Flood Risk in a Dense Indian City Using Geospatial Techniques. Nat. Hazards 2021, 105, 2117–2145. [Google Scholar] [CrossRef]
  85. Bellos, V.; Kourtis, I.M.; Tsihrintzis, V.A. A Simplified Methodology for Flood Simulation in Urban Catchments. Eur. Water 2017, 57, 307–313. [Google Scholar]
  86. Pathak, S.; Liu, M.; Jato-Espino, D.; Zevenbergen, C. Social, Economic and Environmental Assessment of Urban Sub-Catchment Flood Risks Using a Multi-Criteria Approach: A Case Study in Mumbai City, India. J. Hydrol. 2020, 591, 125216. [Google Scholar] [CrossRef]
  87. Zope, P.E.; Eldho, T.I.; Jothiprakash, V. Impacts of Urbanization on Flooding of a Coastal Urban Catchment: A Case Study of Mumbai City, India. Nat. Hazards 2015, 75, 887–908. [Google Scholar] [CrossRef]
  88. Zope, P.E.; Eldho, T.I.; Jothiprakash, V. Impacts of Land Use-Land Cover Change and Urbanization on Flooding: A Case Study of Oshiwara River Basin in Mumbai, India. Catena 2016, 145, 142–154. [Google Scholar] [CrossRef]
  89. Zope, P.E.; Eldho, T.I.; Jothiprakash, V. Hydrological Impacts of Land Use–Land Cover Change and Detention Basins on Urban Flood Hazard: A Case Study of Poisar River Basin, Mumbai, India. Nat. Hazards 2017, 87, 1267–1283. [Google Scholar] [CrossRef]
  90. Suriya, S.; Mudgal, B.V. Impact of Urbanization on Flooding: The Thirusoolam Sub Watershed—A Case Study. J. Hydrol. 2012, 412–413, 210–219. [Google Scholar] [CrossRef]
  91. Devi, N.N.; Sridharan, B.; Kuiry, S.N. Impact of Urban Sprawl on Future Flooding in Chennai City, India. J. Hydrol. 2019, 574, 486–496. [Google Scholar] [CrossRef]
  92. Rangari, V.A.; Sridhar, V.; Umamahesh, N.V.; Patel, A.K. Floodplain Mapping and Management of Urban Catchment Using HEC-RAS: A Case Study of Hyderabad City. J. Inst. Eng. Ser. A 2019, 100, 49–63. [Google Scholar] [CrossRef]
  93. Rangari, V.A.; Umamahesh, N.V.; Patel, A.K. Flood-Hazard Risk Classification and Mapping for Urban Catchment under Different Climate Change Scenarios: A Case Study of Hyderabad City. Urban Clim. 2021, 36, 100793. [Google Scholar] [CrossRef]
  94. Rangari, V.A.; Bhatt, C.M.; Umamahesh, N.V. Rapid Assessment of the October 2020 Hyderabad Urban Flood and Risk Analysis Using Geospatial Data. Curr. Sci. 2021, 120, 1840–1847. [Google Scholar] [CrossRef]
  95. Surwase, T.; Manjusree, P. Urban Flood Simulation—A Case Study of Hyderabad City. In Proceedings of the National Conference on Flood Early Warning for Disaster Risk Reduction, Hyderabad, India, 30–31 May 2019; pp. 133–143. [Google Scholar]
  96. Pathan, A.I.; Agnihotri, P.G.; Patel, D.; Prieto, C. Improving Assessment of Flood Inundation of Navsari (India) via Open-Source Data and HEC-RAS Model. In Proceedings of the vEGU21: Gather Online, Online, 19–30 April 2021. [Google Scholar] [CrossRef]
  97. Pathan, A.I.; Agnihotri, P.G. Application of New HEC-RAS Version 5 for 1D Hydrodynamic Food. Pdf. Model. Earth Syst. Environ. 2020, 7, 1133–1144. [Google Scholar] [CrossRef]
  98. Zafar, S.; Zaidi, A. Impact of Urbanization on Basin Hydrology: A Case Study of the Malir Basin, Karachi, Pakistan. Reg. Environ. Chang. 2019, 19, 1815–1827. [Google Scholar] [CrossRef]
  99. Masood, M.; Takeuchi, K. Assessment of Flood Hazard, Vulnerability and Risk of Mid-Eastern Dhaka Using DEM and 1D Hydrodynamic Model. Nat. Hazards 2012, 61, 757–770. [Google Scholar] [CrossRef]
  100. Pandey, P.; Dugar, S. Flood Hazard Mapping in an Urban Context: A Case Study of Hanumante Stream, Bhaktapur (Nepal). Proc. IOE Grad. Conf. 2019, 6, 435–444. [Google Scholar]
  101. Talchabhadel, R.; Prajapati, R. Numerical Simulation of Urban Inundation Using Citizen-Based Data: A Case Study of Monsoon 2019 in Hanumante River Basin, Kathmandu Valley. In Proceedings of the 8th International Conference on Flood Management, Iowa City, IA, USA, 17–19 August 2021. [Google Scholar]
  102. Basnet, K. Flood Modelling of Patu River in Tulsipur City of Nepal and Analysis of Flooding Impact on Encroached Settlement along the River. Int. J. Adv. Res. Ideas Innov. Technol. ISSN 2020, 6, 375–384. [Google Scholar]
  103. Dangol, S.; Bormudoi, A. Flood Hazard Mapping and Vulnerability Analysis of Bishnumati River, Nepal. Nepal. J. Geoinformatics Surv. Dep. Nepal 2015, 14, 20–24. [Google Scholar] [CrossRef]
  104. Tenzin, J.; Bhaskar, A.S. Modeling of the Precipitation Induced Flash Flood in Sarpang, Bhutan Using HEC-RAS. Rasayan J. Chem. 2017, 10, 399–406. [Google Scholar]
  105. Rangari, V.A.; Gonugunta, R.; Umamahesh, N.V.; Patel, A.K.; Bhatt, C.M. 1D-2D Modeling of Urban Floods and Risk Map Generation for the Part of Hyderabad City. Int. Arch. Photogramm. Remote Sens. Spat. Inf. Sci. 2018, XLII–5, 445–450. [Google Scholar] [CrossRef] [Green Version]
  106. Rangari, V.A.; Sai Prashanth, S. Simulation of Urban Drainage System Using a Storm Water Management Model (SWMM). Asian J. Eng. Appl. Technol. 2018, 7, 7–10. [Google Scholar] [CrossRef]
  107. Avinash, S.; Prasad, K.L.; Reddy, G.S.S.; Mukund, D. Urban Flood Forecast System—A Case Study of Bangalore, India Urban Flood Forecast System—A Case Study of Bangalore, India. Univers. Rev. 2018, 7, 170–179. [Google Scholar]
  108. Harsha, S.S.; Agarwal, S.; Kiran, C.H. Regional Flood Forecasting Using SWMM for Urban Catchment. Int. J. Eng. Adv. Technol. 2020, 9, 1027–1031. [Google Scholar] [CrossRef]
  109. Harsha, S.S.; Agarwal, S.; Kiran, C.H. Urban Flood Modelling and Management Using Storm Water Management Model. Test Eng. Manag. 2020, 83, 6160–6167. [Google Scholar]
  110. Sonavane, N.; Rangari, V.A.; Waikar, M.L.; Patil, M. Urban Storm-Water Modeling Using EPA SWMM-a Case Study of Pune City. In Proceedings of the 2020 IEEE Bangalore Humanitarian Technology Conference (B-HTC), Vijiyapur, India, 8–10 October 2020; pp. 9–13. [Google Scholar] [CrossRef]
  111. Ahammad, M.; Tarek, M.H.; Khan, M.S.M. Stormwater Management in Begunbari Canal Catchment of Dhaka, Bangladesh. In Proceedings of the World Environmental and Water Resources Congress 2018, Minneapolis, MN, USA, 3–7 June 2018; Volume 1, p. 489. [Google Scholar]
  112. Akter, A.; Asce, M.; Alam, M.T. Urban Flood Hazard Modeling and Mapping Using PCSWMM. In Proceedings of the International Conference on Sustainable Infrastructure 2019, Online, 6–10 December 2018. [Google Scholar]
  113. Akter, A.; Tanim, A.H.; Islam, M.K. Possibilities of Urban Flood Reduction through Distributed-Scale Rainwater Harvesting. Water Sci. Eng. 2020, 13, 95–105. [Google Scholar] [CrossRef]
  114. Pradhan-Salike, I.; Raj Pokharel, J. Impact of Urbanization and Climate Change on Urban Flooding: A Case of the Kathmandu Valley. J. Nat. Resour. Dev. 2017, 7, 56–66. [Google Scholar] [CrossRef] [Green Version]
  115. Pervin, I.A.; Rahman, S.M.M.; Nepal, M.; Haque, A.K.E.; Karim, H.; Dhakal, G. Adapting to Urban Flooding: A Case of Two Cities in South Asia. Water Policy 2020, 22, 162–188. [Google Scholar] [CrossRef]
  116. Khan, D.M.; Veerbeek, W.; Chen, A.S.; Hammond, M.J.; Islam, F.; Pervin, I.; Djordjević, S.; Butler, D. Back to the Future: Assessing the Damage of 2004 Dhaka Flood in the 2050 Urban Environment. J. Flood Risk Manag. 2018, 11, S43–S54. [Google Scholar] [CrossRef]
  117. Mark, O.; Jørgensen, C.; Hammond, M.; Khan, D.; Tjener, R.; Erichsen, A.; Helwigh, B. A New Methodology for Modelling of Health Risk from Urban Flooding Exemplified by Cholera—Case Dhaka, Bangladesh. J. Flood Risk Manag. 2018, 11, S28–S42. [Google Scholar] [CrossRef] [Green Version]
  118. Chen, A.S.; Hammond, M.J.; Djordjević, S.; Butler, D.; Khan, D.M.; Veerbeek, W. From Hazard to Impact: Flood Damage Assessment Tools for Mega Cities; Springer Nature: Berlin/Heidelberg, Germany, 2016; Volume 82, ISBN 1106901622. [Google Scholar]
  119. Wagenaar, D.J.; Dahm, R.J.; Diermanse, F.L.M.; Dias, W.P.S.; Dissanayake, D.M.S.S.; Vajja, H.P.; Gehrels, J.C.; Bouwer, L.M. International Journal of Disaster Risk Reduction Evaluating Adaptation Measures for Reducing Fl Ood Risk: A Case Study in the City of Colombo, Sri Lanka. Int. J. Disaster Risk Reduct. 2019, 37, 101162. [Google Scholar] [CrossRef]
  120. Moufar, M.M.M.; Perera, E.D.P. Floods and Countermeasures Impact Assessment for the Metro Colombo Canal System, Sri Lanka. Hydrology 2018, 5, 11. [Google Scholar] [CrossRef] [Green Version]
  121. Rijal, S.; Rimal, B.; Sloan, S. Flood Hazard Mapping of a Rapidly Urbanizing City in the Foothills (Birendranagar, Surkhet) of Nepal. Land 2018, 7, 60. [Google Scholar] [CrossRef] [Green Version]
  122. Roy, S.; Bose, A.; Singha, N.; Basak, D.; Chowdhury, I.R. Urban Waterlogging Risk as an Undervalued Environmental Challenge: An Integrated MCDA-GIS Based Modeling Approach. Environ. Chall. 2021, 4, 100194. [Google Scholar] [CrossRef]
  123. Wijeratne, V.P.I.S.; Li, G. Urban Sprawl and Its Stress on the Risk of Extreme Hydrological Events (EHEs) in the Kelani River Basin, Sri Lanka. Int. J. Disaster Risk Reduct. 2022, 68, 102715. [Google Scholar] [CrossRef]
  124. Bui, D.T.; Khosravi, K.; Li, S.; Shahabi, H.; Panahi, M.; Singh, V.P.; Chapi, K.; Shirzadi, A.; Panahi, S.; Chen, W.; et al. New Hybrids of ANFIS with Several Optimization Algorithms for Flood Susceptibility Modeling. Water 2018, 10, 1210. [Google Scholar] [CrossRef] [Green Version]
  125. Singh, A.K.; Sharma, A.K. GIS and a Remote Sensing Based Approach for Urban Flood-Plain Mapping for the Tapi Catchment, India. Iahs-Aish Publ. 2009, 331, 389–394. [Google Scholar]
  126. Tomar, P.; Singh, S.K.; Kanga, S.; Meraj, G.; Kranjčić, N.; Ðurin, B.; Pattanaik, A. Gis-Based Urban Flood Risk Assessment and Management—A Case Study of Delhi National Capital Territory (NCT), India. Sustainability 2021, 13, 12850. [Google Scholar] [CrossRef]
  127. Schumann, G.; Giustarini, L.; Tarpanelli, A.; Jarihani, B.; Martinis, S. Flood Modeling and Prediction Using Earth Observation Data. Surv. Geophys. 2022, 1–26. [Google Scholar] [CrossRef]
  128. Mondal, B.K.; Sahoo, S. Application of Geospatial Techniques for Urban Flood Management: A Review. In Spatial Modelling of Flood Risk and Flood Hazards. GIScience and Geo-Environmental Modelling; Pradhan, B., Shit, P.K., Bhunia, G.S., Adhikary, P.P., Pourghasemi, H.R., Eds.; Springer Nature: Berlin/Heidelberg, Germany, 2022; pp. 225–236. [Google Scholar] [CrossRef]
  129. Lammers, R.; Li, A.; Nag, S.; Ravindra, V. Prediction Models for Urban Flood Evolution for Satellite Remote Sensing. J. Hydrol. 2021, 603, 127175. [Google Scholar] [CrossRef]
  130. Sadiq, R.; Akhtar, Z.; Imran, M.; Ofli, F. Integrating Remote Sensing and Social Sensing for Flood Mapping. Remote Sens. Appl. Soc. Environ. 2022, 25, 100697. [Google Scholar] [CrossRef]
  131. Kucharczyk, M.; Hugenholtz, C.H. Remote Sensing of Environment Remote Sensing of Natural Hazard-Related Disasters with Small Drones: Global Trends, Biases, and Research Opportunities. Remote Sens. Environ. 2021, 264, 112577. [Google Scholar] [CrossRef]
  132. Suthakaran, S.; Jayakody, S.; Subasinghe, S.; Seneviratne, N.; Alahakoon, R. Mapping the Flood Risk Exposure Using Open-Source Geospatial Tools and Techniques: A Case of Gampaha Divisional Secretariat Division, Sri Lanka. J. Geosci. Environ. Prot. 2022, 10, 18–31. [Google Scholar] [CrossRef]
  133. Sowmya, K.; John, C.M.; Shrivasthava, N.K. Urban Flood Vulnerability Zoning of Cochin City, Southwest Coast of India, Using Remote Sensing and GIS. Nat. Hazards 2015, 75, 1271–1286. [Google Scholar] [CrossRef]
  134. Dammalage, T.L.; Jayasinghe, N.T. Land-Use Change and Its Impact on Urban Flooding: A Case Study on Colombo District Flood on May 2016. Eng. Technol. Appl. Sci. Res. 2019, 9, 3887–3891. [Google Scholar] [CrossRef]
  135. Smith, A.; Bates, P.D.; Wing, O.; Sampson, C.; Quinn, N.; Neal, J. New Estimates of Flood Exposure in Developing Countries Using High-Resolution Population Data. Nat. Commun. 2019, 10, 1814. [Google Scholar] [CrossRef] [Green Version]
  136. Notaro, V.; Fontanazza, C.M.; Freni, G.; La Loggia, G. Assessment of Modelling Structure and Data Availability Influence on Urban Flood Damage Modelling Uncertainty. Procedia Eng. 2014, 89, 788–795. [Google Scholar] [CrossRef] [Green Version]
  137. Hula, M.A.; Udoh, J.C. An Assessment of the Impact of Flood Events in Makurdi, Nigeria. Civ. Environ. Res. 2015, 7, 53–60. [Google Scholar]
  138. Texier, P. Floods in Jakarta: When the Extreme Reveals Daily Structural Constraints and Mismanagement. Disaster Prev. Manag. An Int. J. 2008, 17, 358–372. [Google Scholar] [CrossRef]
  139. Kubal, C.; Haase, D.; Meyer, V.; Scheuer, S. Integrated Urban Flood Risk Assessment—Adapting a Multicriteria Approach to a City. Nat. Hazards Earth Syst. Sci. 2009, 9, 1881–1895. [Google Scholar] [CrossRef] [Green Version]
  140. Kadaverugu, A.; Nageshwar, C.; Viswanadh, R.G.K. Quantification of Flood Mitigation Services by Urban Green Spaces Using InVEST Model: A Case Study of Hyderabad City, India. Model. Earth Syst. Environ. 2020, 7, 589–602. [Google Scholar] [CrossRef]
  141. Sahoo, S.N.; Pekkat, S. Detention Ponds for Managing Flood Risk Due to Increased Imperviousness: Case Study in an Urbanizing Catchment of India. Nat. Hazards Rev. 2018, 19, 05017008. [Google Scholar] [CrossRef]
  142. Sarmah, T.; Das, S. Urban Flood Mitigation Planning for Guwahati: A Case of Bharalu Basin. J. Environ. Manag. 2018, 206, 1155–1165. [Google Scholar] [CrossRef]
  143. Ali, M.H.; Bhattacharya, B.; Islam, A.K.M.S.; Islam, G.M.T.; Hossain, M.S.; Khan, A.S. Challenges for Flood Risk Management in Flood-Prone Sirajganj Region of Bangladesh. J. Flood Risk Manag. 2019, 12, e12450. [Google Scholar] [CrossRef] [Green Version]
  144. Bashar, M.Z.I.; Karim, M.R.; Imteaz, M.A. Reliability and Economic Analysis of Urban Rainwater Harvesting: A Comparative Study within Six Major Cities of Bangladesh. Resour. Conserv. Recycl. 2018, 133, 146–154. [Google Scholar] [CrossRef]
  145. Khan, A.N.; Ali, A. Disaster Risk Reduction Methods, Approaches and Practices; Springer: Berlin/Heidelberg, Germany, 2015; pp. 281–294. [Google Scholar] [CrossRef]
  146. Lo, K.F.A.; Koralegedara, S.B. Effects of Climate Change on Urban Rainwater Harvesting in Colombo City, Sri Lanka. Environments 2015, 2, 105–124. [Google Scholar] [CrossRef] [Green Version]
  147. Jonkman, S.N.; Dawson, R.J. Issues and Challenges in Flood Risk Management—Editorial for the Special Issue on Flood Risk Management. Water 2012, 4, 785–792. [Google Scholar] [CrossRef] [Green Version]
  148. Sahu, A.; Bose, T.; Samal, D.R. Urban Flood Risk Assessment and Development of Urban Flood Resilient Spatial Plan for Bhubaneswar. Environ. Urban. ASIA 2021, 12, 269–291. [Google Scholar] [CrossRef]
  149. CPHEEO. Manual on Sewerage and Sewage Treatment; Ministry of Urban Development: New Delhi, Indai, 2013.
  150. Jha, A.K.; Bloch, R.; Lamond, J. Cities and Flooding: A Guide to Integrated Urban Flood Risk Management for the 21st Century; World Bank: Washington, DC, USA, 2012. [Google Scholar]
  151. Gupta, K. Urban Flood Resilience Planning and Management and Lessons for the Future: A Case Study of Mumbai, India. Urban Water J. 2007, 4, 183–194. [Google Scholar] [CrossRef]
  152. Ghosh, S.; Karmakar, S.; Saha, A.; Mohanty, M.P.; Ali, S.; Raju, S.K.; Krishnakumar, V.; Sebastian, M.; Behera, M.R.; Ashrit, R.; et al. Development of India’s First Integrated Expert Urban Flood Forecasting System for Chennai. Curr. Sci. 2019, 117, 741–745. [Google Scholar] [CrossRef]
  153. Gupta, K.; Nikam, V. Technological and Innovative Measures to Improve Flood Disaster Recovery Following Mumbai 2005 Mega-Flood. In Disaster Recovery: Used or Misused Development Opportunity; Shaw, R., Ed.; Springer: Tokyo, Japan, 2014; pp. 287–297. ISBN 978-4-431-54255-1. [Google Scholar]
  154. Das, K. Guwahati Gets an Experimental Flood Warning System. Sci. Wire. 2020. Available online: https://science.thewire.in/environment/guwahati-assam-flood-warning-system/ (accessed on 10 October 2021).
  155. Mohanty, M.P.; Mudgil, S.; Karmakar, S. Flood Management in India: A Focussed Review on the Current Status and Future Challenges. Int. J. Disaster Risk Reduct. 2020, 49, 101660. [Google Scholar] [CrossRef]
  156. Bhuvana, N.; Arul Aram, I. Facebook and Whatsapp as Disaster Management Tools during the Chennai (India) Floods of 2015. Int. J. Disaster Risk Reduct. 2019, 39, 101135. [Google Scholar] [CrossRef]
  157. Riaz, K.; Hassan, A.; Fakhruddin, S.H. Community Participation in Flood Management. In Options for Flood Risk and Damage Reduction in Bangladesh; Siddiqui, K., Hossain, A.N., Eds.; The University Press Ltd.: Dhaka, Bangladesh, 2010. [Google Scholar]
  158. Deltares. Mobile Services for Flood Early Warning in Bangladesh: Final Report; Deltares: Silver Spring, MD, USA, 2015. [Google Scholar]
  159. World Bank Bangladesh and World Bank Sign $113 Million to Improve Weather Forecasting and Early Warning Systems. Available online: https://www.worldbank.org/en/news/press-release/2017/04/05/bangladesh-and-world-bank-sign-113-million-to-improve-weather-forecasting-and-early-warning-systems (accessed on 20 August 2021).
  160. Rahman, A.U.; Shaw, R. Disaster Resilience: Generic Overview and Pakistan Context. In Disaster Risk Reduction Approaches in Pakistan; Rahman, A.U., Khan, A.N., Shaw, R., Eds.; Springer: Berlin/Heidelberg, Germany, 2015. [Google Scholar]
  161. Mustafa, D.; Gioli, G.; Qazi, S.; Waraich, R.; Zahoor, R. Gendering Flood Early Warning Systems: The Case of Pakistan. Environ. Hazards 2015, 7891, 312–328. [Google Scholar] [CrossRef]
  162. Premasiri, R.; Chandranath, R. Development of Warning System for Mitigation of Urban Flood Hazard. In Proceedings of the 37th Asian Conference Remote Sensing, ACRS 2016, Colombo, Sri Lanka, 17–21 October 2016; Volume 3, pp. 1771–1777. [Google Scholar]
  163. Budimir, M.; Donovan, A.; Brown, S.; Shakya, P.; Gautam, D.; Uprety, M.; Cranston, M.; Sneddon, A.; Smith, P.; Dugar, S. Communicating Complex Forecasts: An Analysis of the Approach in Nepal’s Flood Early Warning System. Geosci. Commun. 2020, 3, 49–70. [Google Scholar] [CrossRef] [Green Version]
  164. UNDRR. Disaster Risk Reduction in Nepal: Status Report 2019; UNDRR: Bangkok, Thailand, 2019. [Google Scholar]
  165. DHMS. Flood Early Warning. Available online: http://www.hydromet.gov.bt/?q=21 (accessed on 5 June 2021).
  166. ICIMOD. Flood Early Warning Systems in Bhutan; ICIMOD: Kathmandu, Nepal, 2016. [Google Scholar]
  167. Noori, M.M.; Sherzad, M.H. Current State of Early Warning System in Afghanistan: An Outlook of the Flood Early Warning System; UN: New York, NY, USA, 2020. [Google Scholar]
  168. Roy, C.; Sarkar, S. The Current Cyclone Early Warning System in Bangladesh: Providers’ and Receivers’ Reviews. Int. J. Disaster Risk Reduct. 2015, 12, 285–299. [Google Scholar] [CrossRef] [Green Version]
  169. Brouwer, R.O.Y.; Akter, S.; Brander, L.; Haque, E. Economic Valuation of Flood Risk Exposure and Reduction in a Severely Flood Prone Developing Country. Environ. Dev. Econ. 2009, 14, 397–417. [Google Scholar] [CrossRef]
  170. Leitão, J.P.; Boonya-aroonnet, S.; Prodanović, D.; Maksimović, Č. The Influence of Digital Elevation Model Resolution on Overland Flow Networks for Modelling Urban Pluvial Flooding. Water Sci. Technol. 2009, 60, 3137–3149. [Google Scholar] [CrossRef]
  171. Al-Suhili, R.; Cullen, C.; Khanbilvardi, R. An Urban Flash Flood Alert Tool for Megacities-Application for Manhattan, New York City, USA. Hydrology 2019, 6, 56. [Google Scholar] [CrossRef] [Green Version]
  172. Othmer, F.J.; Becker, D.; Schulte, L.M.; Greiving, S. A Methodological Approach to Municipal Pluvial Flood Risk Assessment Based on a Small City Case Study. Sustainability 2020, 12, 10487. [Google Scholar] [CrossRef]
  173. Mihu-pintilie, A.; Alexandru, U.; Cuza, I.; Cimpianu, C.I.; Alexandru, U.; Cuza, I.; Stoleriu, C.; Alexandru, U.; Cuza, I. Using High-Density LiDAR Data and 2D Streamflow Hydraulic Modeling to Improve Urban Flood Hazard. Water 2019, 11, 1832. [Google Scholar] [CrossRef] [Green Version]
  174. Chen, G.; Hou, J.; Zhou, N.; Yang, S.; Tong, Y.; Su, F.; Huang, L.; Bi, X. High-Resolution Urban Flood Forecasting by Using a Coupled Atmospheric and Hydrodynamic Flood Models. Front. Earth Sci. 2020, 8, 545612. [Google Scholar] [CrossRef]
  175. Wang, B.; Loo, B.P.Y.; Zhen, F.; Xi, G. Urban Resilience from the Lens of Social Media Data: Responses to Urban Flooding in Nanjing, China. Cities 2020, 106, 102884. [Google Scholar] [CrossRef]
  176. de Almeida, G.A.M.; Bates, P.; Ozdemir, H. Modelling Urban Floods at Submetre Resolution: Challenges or Opportunities for Flood Risk Management? J. Flood Risk Manag. 2018, 11, S855–S865. [Google Scholar] [CrossRef] [Green Version]
  177. Saravi, S.; Kalawsky, R.; Joannou, D.; Casado, M.R.; Fu, G.; Meng, F. Use of Artificial Intelligence to Improve Resilience and Preparedness against Adverse Flood Events. Water (Switzerland) 2019, 11, 973. [Google Scholar] [CrossRef] [Green Version]
  178. Esfandiari, M.; Abdi, G.; Jabari, S.; McGrath, H.; Coleman, D. Flood Hazard Risk Mapping Using a Pseudo Supervised Random Forest. Remote Sens. 2020, 12, 3206. [Google Scholar] [CrossRef]
  179. Shrestha, S.; Cui, S.; Xu, L.; Wang, L.; Manandhar, B.; Ding, S. Impact of Land Use Change Due to Urbanisation on Surface Runoff Using GIS-Based SCS–CN Method: A Case Study of Xiamen City, China. Land 2021, 10, 839. [Google Scholar] [CrossRef]
  180. Skilodimou, H.D.; Bathrellos, G.D.; Alexakis, D.E. Flood Hazard Assessment Mapping in Burned and Urban Areas. Sustain. 2021, 13, 4455. [Google Scholar] [CrossRef]
  181. Joo, H.; Choi, C.; Kim, J.; Kim, D.; Kim, S.; Kim, H.S. A Bayesian Network-Based Integrated for Flood Risk Assessment (InFRA). Sustainability 2019, 11, 3733. [Google Scholar] [CrossRef] [Green Version]
  182. Liu, W.C.; Hsieh, T.H.; Liu, H.M. Flood Risk Assessment in Urban Areas of Southern Taiwan. Sustainability 2021, 13, 3180. [Google Scholar] [CrossRef]
  183. Vojtek, M.; Vojteková, J. Flood Susceptibility Mapping on a National Scale in Slovakia Using the Analytical Hierarchy Process. Water 2019, 11, 364. [Google Scholar] [CrossRef] [Green Version]
  184. Khoirunisa, R. Forecasted Climate Analysis from 2000 to 2100 Using RCP 4.5 and RCP 8.5 Model Scenario as A Hazard Early-Warning System in Prague City, Czech Republic. Smart City 2022, 2, 4. [Google Scholar] [CrossRef]
  185. Chan, F.K.S.; Griffiths, J.A.; Higgitt, D.; Xu, S.; Zhu, F.; Tang, Y.T.; Xu, Y.; Thorne, C.R. “Sponge City” in China—A Breakthrough of Planning and Flood Risk Management in the Urban Context. Land Use Policy 2018, 76, 772–778. [Google Scholar] [CrossRef]
  186. Randall, M.; Sun, F.; Zhang, Y.; Jensen, M.B. Evaluating Sponge City Volume Capture Ratio at the Catchment Scale Using SWMM. J. Environ. Manag. 2019, 246, 745–757. [Google Scholar] [CrossRef]
  187. Yin, D.; Evans, B.; Wang, Q.; Chen, Z.; Jia, H.; Chen, A.S.; Fu, G.; Ahmad, S.; Leng, L. Integrated 1D and 2D Model for Better Assessing Runoff Quantity Control of Low Impact Development Facilities on Community Scale. Sci. Total Environ. 2020, 720, 137630. [Google Scholar] [CrossRef]
  188. Zhang, L.; Ye, Z.; Shibata, S. Assessment of Rain Garden Effects for the Management of Urban Storm Runoff in Japan. Sustainability 2020, 12, 9982. [Google Scholar] [CrossRef]
  189. Costa, S.; Peters, R.; Martins, R.; Postmes, L.; Keizer, J.J.; Roebeling, P. Effectiveness of Nature-Based Solutions on Pluvial Flood Hazard Mitigation: The Case Study of the City of Eindhoven (The Netherlands). Resources 2021, 10, 24. [Google Scholar] [CrossRef]
  190. Goswami, S.; Basak, S. Is Urban India Going Underwater Again? Available online: https://wri-india.org/blog/urban-india-going-underwater-again (accessed on 12 July 2021).
  191. Goniewicz, K.; Burkle, F.M. Analysis of the Potential of IT System Support in Early Warning Systems: Mitigating Flood Risk in Poland. Prehosp. Disaster Med. 2019, 34, 563–565. [Google Scholar] [CrossRef]
  192. Rodriguez Castro, D.; Roucour, S.; Archambeau, P.; Cools, M.; Erpicum, S.; Habchi, I.; Hardy, J.; Pirotton, M.; Weber, L.; Teller, J.; et al. Modelling Direct Flood Losses: What Can We Learn from the July 2021 Flood in the Meuse Basin (Belgium)? KAHR Sci. Conf. 2022, 2021–2022. [Google Scholar]
  193. Zhou, Q.; Panduro, T.E.; Thorsen, B.J.; Arnbjerg-Nielsen, K. Adaption to Extreme Rainfall with Open Urban Drainage System: An Integrated Hydrological Cost-Benefit Analysis. Environ. Manag. 2013, 51, 586–601. [Google Scholar] [CrossRef] [PubMed] [Green Version]
  194. Arnbjerg-Nielsen, K.; Fleischer, H.S. Feasible Adaptation Strategies for Increased Risk of Flooding in Cities Due to Climate Change. Water Sci. Technol. 2009, 60, 273–281. [Google Scholar] [CrossRef] [PubMed]
  195. Zhou, Q.; Mikkelsen, P.S.; Halsnæs, K.; Arnbjerg-Nielsen, K. Framework for Economic Pluvial Flood Risk Assessment Considering Climate Change Effects and Adaptation Benefits. J. Hydrol. 2012, 414–415, 539–549. [Google Scholar] [CrossRef]
  196. Pyke, C.; Warren, M.P.; Johnson, T.; Lagro, J.; Scharfenberg, J.; Groth, P.; Freed, R.; Schroeer, W.; Main, E. Landscape and Urban Planning Assessment of Low Impact Development for Managing Stormwater with Changing Precipitation Due to Climate Change. Landsc. Urban Plan. 2011, 103, 166–173. [Google Scholar] [CrossRef]
  197. Zahmatkesh, Z.; Burian, S.J.; Karamouz, M.; Tavakol-davani, H.; Goharian, E. Low-Impact Development Practices to Mitigate Climate Change Effects on Urban Stormwater Runoff: Case Study of New York City. J. Irrig. Drain. Eng. 2015, 141, 04014043. [Google Scholar] [CrossRef]
  198. Kang, N.; Kim, S.; Kim, Y.; Noh, H.; Hong, J.S. Urban Drainage System Improvement for Climate Change Adaptation. Water 2016, 8, 268. [Google Scholar] [CrossRef] [Green Version]
  199. Sebti, A.; Fuamba, M.; Bennis, S. Optimization Model for BMP Selection and Placement in a Combined Sewer. J. Water Resour. Plan. Manag. 2016, 142, 04015068. [Google Scholar] [CrossRef]
  200. Olsson, J.; Amaguchi, H.; Alsterhag, E. Adaptation to Climate Change Impacts on Urban Storm Water: A Case Study in Arvika, Sweden. Clim. Chang. 2013, 116, 231–247. [Google Scholar] [CrossRef]
  201. Tscheikner-gratl, F.; Zeisl, P.; Kinzel, C.; Leimgruber, J.; Ertl, T.; Rauch, W.; Kleidorfer, M. Lost in Calibration: Why People Still Do Not Calibrate Their Models, and Why They Still Should—A Case Study from Urban Drainage Modelling. Water Sci. Technol. 2016, 74, 2337–2348. [Google Scholar] [CrossRef] [Green Version]
  202. Babovic, F.; Mijic, A. Economic Evaluation of Adaptation Pathways for an Urban Drainage System Experiencing Deep Uncertainty. Water 2019, 11, 531. [Google Scholar] [CrossRef] [Green Version]
Figure 1. Map of South Asia (data source: https://www.diva-gis.org/gdata (accessed on 12 July 2021) and Survey Department, Nepal).
Land 12 00627 g001
Figure 2. Frequency of extreme rain events exceeding 150 mm day−1 yr−1 over central India for the summer monsoon (June–September) during 1950–2015. The trend lines are significant at a 95% confidence level [28].
Land 12 00627 g002
Figure 3. A research framework for assessing and analyzing urban flood hazard assessment and management practices in South Asian cities.
Land 12 00627 g003
Table 1. Major Urban Flood events in South Asian Cities.
DateLocationMeteorological DriverReported ImpactsRef.
23 July 2001Islamabad and Rawalpindi, Pakistan620 mm rainfall in just 10 hrs.74 people lost their lives, and affected 400,000 people[43]
September 2004Dhaka, Bangladesh341 mm rainfall in a day and >600 mm in 5 days730 people lost their lives, and 30 million people were made homeless[44]
26 July 2005Mumbai, India944 mm of rainfall in 24 hrs.At least 400 people and 20,000 cattle lost their lives.[45]
September 2014Srinagar, Jammu and Kashmir, IndiaDischarge of ~1, 15,218 upstream at Sangam and ~72,585 cusecs downstream282 people lost their lives, and 253,000 houses were damaged[46]
November–
December 2015
Chennai, India>400 mm of rainfall400 people lost their lives and caused enormous economic damages[47]
December 2015Chennai, Tamil Nadu494 mm of rain over a 24-hDeaths of around 250 people[48]
28 August 2016Lahore, Pakistan12 h and 30 min of intense rainfall of 59 mmLahore district was inundated by urban flooding[49]
23 September 2016Hyderabad, Telangana, India165 mm rainfallEconomic losses of 137,839 USD[50]
15 May 2016Colombo, Sri Lanka256 mm rainfallDeath of 3 lives and 185,000 people were directly affected[51]
29 August 2017Mumbai, India468 mm of rainfall in 12 hConfirmed death of 14 people[52]
11–12 July 2018Kathmandu, Nepal129.6 mm of rain in 10 hDamaged 522 houses, 15 sheds, 28 industries, and factories, including petrol pumps[53]
14–15 August 2018Kerala, IndiaRainfall range of 270–300 mm.483 people lost their lives, and 5000 thousand people were affected, with a 200 billion USD loss[54]
27 June 2019Mumbai, IndiaFive days received 137.8 mm of rainfall32 people lost their lives, and the transportation was disrupted[55]
4–8 August 2019Malappuram and Wayanad districts of Kerala, India400% over the normal average rainfall81 people lost their lives, >39 houses and a walkover bridge washed away[56]
1 March 2019Kandahar city, AfghanistanRainfall of 97 mm in 30 h20 people lost their lives, and many houses collapsed[57]
11–12 July 2019Kathmandu, NepalAround 150 mm of rainfall in 12 h100 families were affected, and Balkhu and Kuleshwor witnessed levels of flooding never seen before[58]
25–27 August 20202020 Karachi, Pakistan345 mm rainfall for a single dayMore than 40 people lost their lives[59]
19 July 2020Delhi, IndiaRecorded nearly 100 mm of rainfallFour people lost their lives[60]
Table 2. Application of structural measures in urban flood management in South Asian cities.
LocationBGI ConsideredResultsRef.
Hyderabad, IndiaRain gardensRGs with a depth varying from 400 to 500 mm have shown excellent performance during the monsoon season[62]
Mumbai, IndiaBioretention basinsFound unsuitable for heavy rainfall intensity[62]
Hyderabad, IndiaGreen spaces44–50% of the precipitation is retained by the urban green and open spaces[140]
Hyderabad, IndiaPorous pavements and vegetated roofsReduced surface runoff[50]
Guwahati city, IndiaDetention pond, widening of the channelsMaximum flood depth and inundated area reduced flooding adjacent to the channels. [141]
Guwahati city, IndiaDe-siltation and cleaning of drains; rainwater harvesting; establishing new pumping stationsIntegrated drainage network act as ‘self-healing’ to flood certain extent[142]
Mumbai, IndiaDetention pondsDecrease in peak discharge and total flood hazard area[89]
Sirajganj town, BangladeshDetention pondsStore water during storm events[143]
BangladeshRWH system in all the proposed new buildingsControlling water logging in urban areas[144].
Metro Colombo basin, Sri LankaDiversionThe flood water level at different locations was reduced[120]
Sri LankaMandatory requirement of RWH in modern buildingsReduce water logging in urban areas[146]
Table 3. Some of the early warning systems in operation.
LocationEarly Warning SystemDesigned byRef.
ChennaiIntegrated expert urban flood forecasting system with a real-time forecast, monitoring, and data sharingChennai Flood Warning System (C-FLOWS) designed by NCCR[152]
MumbaiAutomatic weather stations were installed for rainfall monitoring and dissemination of real-time rainfall, flood alerts on the webpage as well as on smartphonesMunicipal Corporation of
Greater Mumbai (MCGM)
area
[153]
GuwahatiFully automated web-based flood warning systemEnergy and Resources Institute (TERI) in New Delhi and National Disaster Management Authority (NDMA)[154]
Bangalore city IndiaHigh-intensity rainfall alerts and rainfall Forecasts Alerts, Flood forecasts, Early warningsKarnataka State Natural Disaster Monitoring Center (KSNDMC)[107]
BangladeshProduce up to 48- to 72-h—forecasts, disseminating forecasts from national to district levels through email, website, and cell phone services.Flood Forecasting and Warning Center of the Bangladesh Water Development Board[169]
BangladeshFlood EWS at the community level, using existing 48-hrs. forecastsThe Center for Environmental and Geographical Information Service[157]
Panadura urban council area Sri LankaGPS, RS, GIS techniques, PIC Control circuit, Google API, Arc Server, PHP, JavaScript, and Google My maps to monitor and warn real-time flood event displays flooding area in the web system [162]
NepalEarly Warning Systems for water-related hazards utilize automatic sensing and mobile communication technology for real-time climate and hydrological data acquisition and warning dissemination and send mobile SMS to residents of the risk zone.Flood Forecasting Section of the DHM, Nepal[163]
BhutanThe hydrometeorological observation network transmits real-time data at a pre-set interval of 15 min.Department of Hydro-Met Services (DHMS)[166]
AfghanistanFlood warnings are disseminated to the public through websites and social media accounts at the scale of a provinceAMD and NWARA[167]
Table 4. Models, data used, and adaptation methods used in developed countries.
CountryCityModelTopographic and Rainfall DataAdaptation MethodRef.
DenmarkAarhus1D–2D coupled urban inundation modelDEM derived from LIDAR data of grid resolution 2 m, Chicago Design Storms (CDSs)Pipe enlargement, LID, Open Urban Drainage Systems (OUDs)/recreational basins[193]
DenmarkRoskilde and
Aalborg
Mike UrbanTopography data were obtained using laser scanning from aircraft, CDSsSewer enlargement, open basin strategy, dikes.[194]
DenmarkOdenseMike Urban and Mike FloodDEM of 1.6 m * 1.6 m resolution, rainfall scenarios A2 based on RCM HIRHAM4, CDSsSewer enlargement and infiltration[195]
USASouth Weymouth
Naval Air
Station
SG WATERDaily precipitation data, six precipitation scenariosConventional practices and LID practices[196]
USABronx river
watershed, New
York
SWMMDaily precipitation is disaggregated to hourly precipitation using the CFARainwater harvesting, bioretention, and permeable pavements[197]
KoreaIncheonXP-SWMMDaily rainfall data produced from the HadGEM3-RA climate modelSewer enlargement[198]
CanadaGreater Montreal
region,
Quebec
Improved
Rational
Hydrograph
method and
SWMM
Sewer network, rainfall dataDetention ponds; infiltration trenches; green roofs; and rain gardens[199]
SwedenArvikaMOUSE and TSRLand-use map, high-resolution DEM, a network map of the main sewer pipes, time series of 30-min precipitation intensities from a matrix of 3×3 RCA3 grid boxesSewer enlargement and detention ponds[200]
AustriaTyrol municipalitySWMMSewer system network, land use map, precipitation data temporal resolution of 1 minSewer rehabilitation[201]
UKLondonInfoworks ICM
(1D-2D)
The current drainage system, precipitation dataGreen roofs, porous pavements, lake deepening, sewer enlargement, and combinations[202]
Disclaimer/Publisher’s Note: The statements, opinions and data contained in all publications are solely those of the individual author(s) and contributor(s) and not of MDPI and/or the editor(s). MDPI and/or the editor(s) disclaim responsibility for any injury to people or property resulting from any ideas, methods, instructions or products referred to in the content.

