Article

Post-Flood Resilience Assessment of July 2021 Flood in Western Germany and Henan, China

1
Key Laboratory of Urban Environment and Health, Institute of Urban Environment, Chinese Academy of Sciences, Xiamen 361021, China
2
University of Chinese Academy of Sciences, Beijing 100049, China
3
Xiamen Key Lab of Urban Metabolism, Institute of Urban Environment, Chinese Academy of Sciences, Xiamen 361021, China
4
Institute of Forestry, Tribhuvan University, Hetauda 44107, Nepal
5
Youth Innovation Lab, Banshidhar Marg, Kathmandu 44600, Nepal
*
Author to whom correspondence should be addressed.
Land 2023, 12(3), 625; https://doi.org/10.3390/land12030625
Submission received: 3 February 2023 / Revised: 23 February 2023 / Accepted: 2 March 2023 / Published: 6 March 2023

Abstract

:
In July 2021, devastating floods occurred in western Germany and Henan, China, resulting in extreme loss of life and property damage. Despite the differences in context, climate change contributed to these events. Flood resilience generally means the system’s ability to recover from floods. A post-flood resilience assessment seeks to determine the impact of the flood on the area, the duration it took to recover, the effectiveness of the measures taken to reduce the risk of flooding, and ways to enhance flood resilience. The post-flood review capacity method was used to assess the event and calculate the flood resilience index. Western Germany experienced a 500-year return period flood in connection with the low-pressure system, Bernd, while Zhengzhou in Henan experienced a 1000-year return period flood with the influence of Typhoon In-Fa and the Western Pacific subtropical high. More than 107,000 people were affected in Germany, with 205 deaths that account for USD 40 billion in economic losses, whereas in Henan, 14.786 million people were affected, and 398 people died, which accounts for USD 18.9 billion in losses. Germany was more impacted and took longer to restore essential services than Henan, China. The flood resilience index shows that the resilience level of both countries is low. The severe rainstorms in Zhengzhou and the Ahr River Valley exposed weaknesses in urban disaster management, particularly in urban areas, such as subway flooding and risk communication with the public. The events highlighted the need to better understand risks and their consequences, early warning systems, preparedness, and emergency response.

1. Introduction

According to the World Meteorological Organization (WMO), 2021 was the sixth warmest year since 1880 [1], with the global average temperature 1.04 °C above the average of 1880–1900 [2]. Furthermore, the year 2021 recorded unprecedented climate extremes at both global and regional levels, including extreme rainfall, floods, droughts, heat waves, cold waves, and storms in various regions worldwide [3]. For instance, the US and Canada experienced heat waves, while Germany, Belgium, and China faced devastating floods. Meanwhile, Siberia, Turkey, and Greece witnessed wildfires, and India suffered from floods and landslides. These events resulted in a tragic death toll and tremendous economic loss, with 432 recorded catastrophic incidents, much more than the average of 357 each year between 2001 and 2020. Devastating floods were among the most common types of disasters, with increasing severity, duration, and frequency due to climate change, land use change, infrastructure, and population growth. There were 223 occurrences, up from the average of 163 annual flood occurrences reported between 2001 and 2020 [4], resulting in 4393 fatalities, accounting for 41.87% of all disaster-related deaths, and more than USD 74.6 billion in direct economic losses, or roughly 30% of all direct disaster economic losses [5].
Climate change intensifies the water cycle and affects rainfall patterns, resulting in more intense rainfall and flooding in many regions. The Sixth Assessment Report of the Intergovernmental Panel on Climate Change (IPCC) highlighted that global hydrological models project that more land areas will experience increased river flooding than decreased river flooding (medium confidence). With 1.5 °C global warming, heavy precipitation and related flooding are expected to worsen and become more frequent in Africa and Asia (high confidence) and Europe (medium confidence). The effects of sea level rise, storm surge, and heavy rainfall will amplify the risk of compound flooding (high confidence). In addition, projected flood damages are estimated to be 1.4 to 2 times higher at 2 °C and 2.5 to 3.9 times higher at 3 °C compared to 1.5 °C global warming, without adaptation (medium confidence) [6].
Predicting rainfall can aid emergency decision making, but short-term forecasting is challenging due to the complex relationships and quick changes in meteorological variables that arise during an event. Furthermore, the computational complexity of physically based models makes it difficult to provide real-time predictions. To address this issue, Xu et al. (2023) proposed a hybrid modeling strategy that integrates a physically based model with the LightGBM model for the quick prediction of urban floods on Haidian Island in Hainan province, China [7]. To mitigate flood risk, it is vital to understand how compound floods may impact an area. To evaluate the compound flood risk in the coastal city of Haikou, China, Xu et al. (2022) employed an integrated approach that linked the copula-based design of precipitation and storm tides with the hydrological model [8]. Pirone et al. (2022) developed a machine-learning model for the probability of rainfall at 10 min intervals for lead times ranging from 30 min to 6 h in southern Italy. The model uses only present rainfall as input, and 95 machine learning models were trained individually for 19 recording stations, using 359 recorded rain events. The study shows that short-term rainfall can be predicted accurately using only the most recent observations as input, providing a quick, simple, and practical nowcasting approach [9]. A study by Lama et al. (2021) shows the significance of implementing hydraulic engineering solutions that might consider the preservation of ecosystems’ environmental quality, as underlined by the growing role of climate change and the design of flood risk management in urban settings [10]. The study by Lama et al. (2021) is a breakthrough in the experimental and numerical eco-hydraulic analysis of vegetated channels using UAV tools and imagery to acquire rapid and precise monitoring of the eco-hydrodynamic status of the vegetated water body [11]. To enhance cities’ flood resilience, it is essential to employ modeling methods that advance the knowledge and forecasting of flood threats. Shen et al. (2022) addressed this need by applying a modeling approach to quantify the impact of potential future climate scenarios on transportation infrastructure in Norfolk, Virginia, USA. This approach integrated ocean modeling with land surface modeling to resolve urban drainage systems within the city [12].
The worldwide importance of adaptation and building resilience against the consequences of climate change is becoming more urgent as the amount of greenhouse gases in the atmosphere continues to increase. Investing in climate change adaptation and resilience may be cost-effective for protecting communities, livelihoods, and enterprises while fostering economic growth and development. Due to rapid urbanization and extreme climate events, cities are particularly vulnerable to water-related problems such as flooding, water stagnation, and water scarcity. Since cities are hybrid socioecological systems, it is essential to consider both engineering and ecological resilience strategies. Nature-based solutions (NBS) are also gaining traction and are linked to flood resilience [13]. Reducing flood hazards and improving the quality of life in urban areas requires building flood resilience. Cities employ various development strategies to address these challenges and enhance flood resilience. For instance, low impact developments (LID) in the USA, sustainable urban drainage systems (SuDs) in the UK, water-sensitive urban design (WSUD) in Australia, and low-impact developments in urban design (LIDUD) in New Zealand have been introduced to manage urban water and mitigate surface-water flooding that occurs annually [14]. In India, a combination of nature-based solutions, planning, and technological and infrastructural interventions are implemented to reduce floods and build water resilience [15]. Similarly, in China, the Sponge City Program, which is a nature-based technique, has been implemented to tackle serious water issues in cities. However, to address the increasing challenges caused by climate change, the approach must be extended to larger catchment areas [16]. In Africa, flood hazards are often linked to rapid and haphazard urbanization, which calls for radical change, but this is difficult to achieve given the state of the climate. Discouraging settlement in flood-prone areas and emphasizing the importance of early warning systems can be effective [17]. In Beira, Mozambique, a comprehensive approach that combines engineering and nature-based solutions has successfully reduced urban flood risks that were once prevalent [18]. Tazen et al. (2018) investigated the trends in flood events and their correlation with extreme rainfall in the city of Ouagadougou in Burkina Faso. The findings indicated that the significant increase in flood risk in recent years is due to a combination of factors, including extreme rainfall events and human and environmental factors stemming from haphazard urbanization and insufficient investment in flood-resistant infrastructure and flood management strategies [19]. Ajjur and Al-Ghamdi (2022) investigated the relation between urbanization, climate change, and flood risk in Doha, Qatar. The findings revealed that urban growth had a more significant impact on the increase in runoff by 422% than changes in climatic parameters. The study suggests including flood risk reduction strategies in neighborhood urban development and climate change adaptation plans. An integrated urban design must expand areas that restrict flood and encourage greater precipitation to recharge aquifers [20]. Similarly, unplanned urban expansion was identified as a primary cause of urban issues in Seoul, South Korea. A study by Lee and Brody (2018) recommended the implementation of resilient urban development to reduce the effects of flood losses [21]. Therefore, long-term planning for urban areas must consider the flood risk to create more sustainable and resilient communities, particularly in increasingly urbanized regions [22].
The world is witnessing an increase in catastrophic extreme weather events due to climate change and socioeconomic factors, resulting in higher global risk and exposure. Floods are impacting new areas and communities that have never experienced them before. Therefore, increasing flood resilience has become a major concern for flood-prone cities and countries. Evidence suggests that investing in disaster risk reduction (DRR) can yield substantial returns, with every USD 1 spent on DRR potentially saving between USD 4 and USD 11 in losses from various disaster events, including flooding, wildfires, and storm surges [23,24,25,26]. Despite this, only 13% of aid money is allocated to pre-event risk reduction and resilience, with 87% spent on post-event relief [27]. Though it is commonly accepted that ex ante interventions are more cost-effective than ex post emergency responses, not enough is being spent on them to avoid and reduce climate- and weather-related disasters today and in the future [18]. A better understanding of flood risks, their causes, and their effects have revealed flaws in the current flood risk management strategies. As a result, there is a growing emphasis on the resilience approach to flood risk management, which aims to reduce the impact of flooding and enhance communities’ ability to recover from its effects. Building flood resilience requires a comprehensive, multifaceted approach that addresses both local and global drivers. It is necessary to consider many uncertainties and complexities, adopt a holistic view of the issue, and strengthen preparedness and preventative measures to improve communities’ social, human, natural, financial, and physical capacities. The practical implementation of flood resilience faces several changes, particularly in terms of measurement. This study aims to assess the effectiveness of flood resilience measures and evaluate their impact on affected regions. Specifically, the study will examine the duration of recovery (availability level) and the success of risk reduction measures, measure the flood resilience index, and identify areas for improvement in flood resilience. The study will focus on the July 2021 extreme flood events and evaluate the post-flood resilience of western Germany and Henan, China. Through these analyses, the study aims to contribute to improving flood management practices globally.

2. Flood Resilience and Flood Resilience Assessment

The concept of resilience can be defined differently according to the type of hazards and the disciplinary context in which it is being used [28]. At its most basic level, resilience refers to the ability of a system to recover its functionality after experiencing a disturbance. In the context of hazardous events and disruptions, resilience is defined as ‘the capacity of social, economic, and environmental systems to adapt to adverse events while maintaining their fundamental functions, identity, and structure’ [29]. Resilience is the capability to cope with and bounce back from disasters without systemic collapse, i.e., resilience is the capacity to prevent, mitigate, and respond effectively to shocks [30]. The author in [31] define flood resilience as the ability of communities (or businesses, governments, or individuals) to lower flood risks, be ready for potential flood events, and possess the ability to react quickly and effectively to and recover from floods. When considering the concept of resilience in the context of climate-related extreme events, such as heavy precipitation, it generally refers to the system’s ability to recover from the flood.
Many scholars agree that a framework for assessing resilience is essential to understanding and operationalizing resilience for flood disasters and hazard management. Although it has received significant attention, operationalizing resilience is still challenging because it is difficult to measure resilience [32]. Measuring resilience would be a valuable decision-making tool for efficiently deploying scarce resources and serve as a foundation for monitoring resilience-related changes related to source development. While several theories attempt to clarify the connection between disaster impacts, resilience capability, and the determinants of resilience, it is important to mention that these theories are still evolving and under testing [33]. A reliable framework is essential in monitoring hazard resilience [34]. In 2017, Keating et al. [35] highlighted the importance of continually developing frameworks and tools that are theoretically sound, empirically validated, and practical in effectively targeting initiatives to enhance resilience and assess how various capacities, actions, and hazards contribute to changes in resilience. According to the United Nations Development Program, there is currently no widely accepted measurement framework for disaster resilience [36]. However, several measurement techniques are currently in use, including the Coastal Resilience Index, the Resilience Inference Measurement (RIM) framework, the PEOPLES Resilience Framework, the Communities Advancing Resilience Toolkit (CART), the FRMC framework and tool developed by Zurich Flood Resilience Alliance, Global Resilience Analysis (GRA) [37], the Flood Resilience Index (FRI) [38], the Flood Resilience Index [39], and the Flood Resilience Index (FReSI) [40].
Resilience is a complex multidimensional concept that involves economic, social, institutional, environmental, and ecological factors. Despite various resilience-related analyses and models, there is no one-size-fits-all formula or guideline that all sectors and communities can adopt [41]. De Bruijn et al. (2004) proposed a set of indicators that covers the three aspects of resilience: amplitude of the reaction, graduality of the increase in the reaction with increasingly severe flood waves, and recovery rate. Integrating these indicators could provide a comprehensive view of the resilience of flood risk management systems [42]. In 2019, Batica et al. [38] initiated efforts to enhance resilience in integrated flood risk management by using a framework that uses five dimensions to assess the degree of disruption and capacity to survive and continue to operate during and after flooding. Considering its institutional, economic, social, and societal features, the framework was applied to the city of Nice. In 2016, Kotzee and Reyers [39] introduced a quantitative approach that utilized 24 flood-related variables and relevant social, ecological, infrastructural, and economic factors to create an index for assessing and mapping the distribution of resilience across the region.
Similarly, in 2021, Ghasemzadeh et al. developed a framework/assessment tool to measure Tehran’s resilience to flooding risks. The analytic process revealed 3 themes, 15 categories, 40 subcategories, and 235 codes. The identified themes were social, economic, and organizational, while the recognized categories included culture and education, participation, trust, attitude, solidarity, resources, empowerment, flexibility, credit, supervision, intercommunication, norms, specialty, and research [41]. In 2021, Wang et al. assessed Nanjing’s urban flood resilience using social, economic, environmental, physical, human, political, and institutional resilience. The findings indicated that economic, political, and physical resilience significantly impacted urban flood resilience. Additionally, political resilience was a mediating factor for economic and physical resilience [43]. In 2021, Almeida et al. proposed a risk-based technique by addressing sectors’ interdependencies to assess Lisbon flood resilience by establishing patterns of exposure and susceptibility to floods for both the present and scenarios of climate change [44]. Barreiro et al. (2021) proposed a simple index-based technique for assessing and measuring urban resilience to floods based on research produced by the EU H2020 RESCCUE project. A set of five indicators are proposed to compute the Integrated Urban Resilience Index (IURI), allowing to classification of resilience according to a proposed range of rankings. This technique takes into account both a sectorial approach, which applies 1D/2D computational modeling of the urban drainage network, and a multisectoral approach, which reflects the interconnectedness of services [45].
The resilience capacity of a community refers to the inherent set of features that enable the community to respond effectively to and recover from extreme events. Community-centered engagement is vital to enhancing resilience by promoting a high-level commitment to interacting with communities for risk identification and action to save lives and limit property damage [46]. Studies have shown the significance of community-led efforts for resilience. For instance, in Aceh, Indonesia, a government-initiated, community-based tsunami preparedness and resilience program focused on local schools and involved local and international NGOs. The program successfully created networks and strengthened ties with the local community [47]. Cretney (2018) revealed that robust community networks and community-led preparation programs have successfully boosted community resilience in the wake of the New Zealand earthquakes [48]. In response to the inadequacy of flood control systems under uncertainty, building community resilience has emerged as a crucial concern in contemporary flood risk management for flood mitigation and recovery alternatives. Existing frameworks appear to be insufficiently addressing the multidimensional character of resilience, and assessments of community flood resilience are frequently inconsistent. According to Bulti et al. (2019), most of the community flood resilience measuring tools ignore the significance of evaluating and increasing community competency in building flood resilience [49]. Communities that understand local flood risks and how to increase resilience can gradually enhance their quality of life despite frequent flooding.
Although every flood is unique and poses new challenges, it also offers an opportunity for learning. By evaluating flood preparedness, we can analyze and demonstrate the real benefits of the improvements made. We must act quickly after a flood, as applying the lessons learned from previous floods is essential to prepare for the next one. This requires a standard operating procedure that includes in-depth forensic analysis after major flood disasters [50]. A post-event review is a critical component of a comprehensive resilience assessment, providing insight into the many facets of a flood event. It goes beyond simply counting causalities and property damage and identifies lessons learned from the event. This review evaluates the effectiveness of measures taken to reduce flood risk and increase resilience, highlighting what worked and what did not. Communities can use this knowledge to enhance their flood defenses, protect lives, and improve the welfare of flood victims [51]. A post-flood assessment is crucial in identifying issues that can be addressed to enhance flood resilience and reduce the impacts of future floods. This assessment can be utilized by governments, NGOs, businesses, and research groups to analyze the performance of flood mitigation and response activities and to more accurately estimate and budget for future interventions. By conducting a post-flood resilience assessment, it will be feasible to appreciate how the local flood resilience system functions throughout the DRM cycle, which can lead to increased financial, social, and political investments in developing flood resilience [52].

3. Materials and Methods

3.1. Study Area: Western Germany

Germany has five major river basins: the Elbe, upper Danube, Rhine, Weser, and Ems. For the past 50 years, Germany has experienced a rise in flood risk. West, south, and central Germany have experienced the most flood behavior change. Moreover, the seasonal study showed that winter changes were more significant than summer changes. Extreme rainfall events in the Rhine in 1993/1994 and 1995, Oder in 1997, and Danube and Elbe in 2002 and 2013 have frequently caused flood catastrophes with significant damage [53], and the July 2021 flood mostly affected western Germany (Figure 1).
Climate-related changes are already being seen in several European rivers; for instance, the Danube River now experiences floods approximately twice as frequently as it did fifty years ago. In these incidents, flood defenses were overwhelmed by extremely significant rain that fell over a short period—roughly the amount of rain that falls in a year [54]. Large, slow-moving storms that can stay stationary for extended periods and produce downpours such as those in Germany and Belgium would likely occur more frequently due to climate change. Storms of this nature might occur 14 times more often by the end of the century [55]. If nothing more is done to prepare, flood damage on the continent may rise to EUR 48 billion per year by 2100, up from EUR 7.8 billion presently, and the number of impacted people might be more than doubled to approximately 350,000 [56]. Table 1 below shows yearly precipitation from 2013 to 2022.

3.2. Study Area: Henan, China

China is the second-largest economy in the world, with widely varying geographic and climate features [58]. China frequently experiences natural disasters, of which flooding is the most serious. The Yellow River Basin, the second largest river in China, has unique river valley topography. Climate change brought abundant rainfall and frequent storm floods to the north and central region of Henan province, where the Yellow River meanders. Consequently, the persistent and heavy precipitation led to several floods in the cities of Zhengzhou, Kaifeng, and Xinxiang in the north center of Henan province between 2004 and 2009 [53], 2010, 2012, 2016, and 2021 [59]. Figure 2 below shows the land use of Henan province, and Table 2 shows the historical rainstorms in the region.
In 2021, China experienced nine extreme events, ranging from a quick change from cold to warm extremes, sandstorms in the spring, and a string of droughts in southern China. Severe thunderstorms occurred in the first six months, as well as extreme rainfall over Henan and Hubei provinces in the summer, heat waves, persistent heavy rain, and a cold surge in the fall. Across a wider area of eastern China, extreme events such as extreme precipitation and temperature were observed, and some could be attributed to human-induced climate change [1]. While China experiences severe flooding yearly, causing loss of life and property, 2021’s intensity was unmatched, as the central Henan province witnessed its heaviest rainfall in 1000 years. The typhoon and the air currents carried atmospheric water, concentrating on Zhengzhou city, surrounded by mountains, creating a basin effect resulting deadly flood [54].
Despite the differences in context, the deadly floods that claimed lives and properties in Germany and Belgium in western Europe and Henan province in central China show that the world’s weather is becoming increasingly extreme due to climate change. The statistics do not support a causal relationship between weather events such as these floods and climate change. However, a warming atmosphere increases severe weather events, such as heavy rain and flooding, and many single events have been exacerbated by global warming.

3.3. Methods

This study conducted a post-flood resilience assessment of the July 2021 floods in western Germany and Henan, China, caused by extreme rainfall events to understand the flood resilience capacity of the affected regions based on post-flood review capacity within one year after the event [51]. This assessment evaluates the effects of the flood to provide valuable suggestions for reducing future damage. It points out weaknesses in preparedness, crisis management, and the reconstruction phase [60]. It follows secondary source analysis as a research technique. Bulks of data were collected about the event from the first day until one year after; published reports, articles, and news about the event were organized and investigated. The research analyzed resilience based on 14 outcome variables assigned to the context within seven resilience themes (assets, livelihoods, natural environment, living and health, lifelines, governance, and social norms), as shown in Table 3. The outcome variables were graded based on the Post-Flood Study—User Guide of Flood Resilience Measurement for Communities (FRMC) framework [51,52], i.e., a grade of A, B, C, or D is assigned to outcome measures based on less impact, or time to more impact, or time required to resume essential services after the flood event within the one-year interval, as shown in Table 4. Three ‘hazard trait’ variables regarding the flood frequency, flood duration, and people impacted were not graded.

3.4. Flood Resilience Index Based on Post-Flood Resilience Assessment Grading

The flood resilience index for case studies was measured based on [61]. Different levels of functioning of essential services and action variables after flooding processes indicate a different level of flood resilience. In this context, the availability of the set of essential services (recovery) and action variables (coverage) was used as an instrument to measure flood resilience. Different levels of availability were assigned, ranging from 4 (Grade A), where the essential service was recovered quickly and action variables had high coverage, to 1 (Grade D), where the essential service was recovered slowly, or action variables had low coverage based on the post-flood resilience assessment grading, as shown in Table 5.
F R I = { i = 1 5 r e w i + i = 1 3 r a w i } i = 1 8 w i
where
  • FRI = Flood Resilience Index;
  • re = essential service availability level (recovery);
  • ra = action variables availability (coverage);
  • wi = weights.
The recommendations for weights are assigned in response to various flood features and give users a mechanism to evaluate the applicability and significance of criteria for certain flood events. The weights are set based on the priority and importance of the services (as shown in Table 6). This is one of the subjective characteristics of the proposed methodology. In this sense, the weights reflect the importance of essential services and action variables (as shown in Table 7). As this study was conducted after flooding, the weights were assigned accordingly.
The Flood Resilience Index is categorized as follows: very low, low, medium, and high for a study area, as shown in Table 8.

4. Results

4.1. Germany Flood

From 12 to 19 July 2021, several European countries were affected by floods in connection with the low-pressure system named Bernd. It started in the United Kingdom as a flash flood. Later, floods affected several river basins in central and northern Europe, including Austria, Belgium, Germany, Luxembourg, the Netherlands, Switzerland, and Italy [62]. Even though the main flood event in Germany unfolded between 13 and 15 July, there was initially a localized overflow of small watercourses and flash floods. Small rivers across the Rhine Basin rapidly increased their water levels, overflowing at the locations close to these watercourses. The central parts of the state were affected locally. However, the western part of Rhineland-Palatinate and the southern half of North Rhine-Westphalia were extensively affected on the evening of 14 July, as shown in Figure 3 [63]. Germany’s weather service, Deutscher Wetterdienst (DWD), shows that at least seven locations recorded more than 150 mm of rain in 72 h to 15 July 2021 (Table 9). Köln Stammheim station in the Cologne region received rainfall of 154 mm in 24 h, ending on the morning of the 15 July. Figure 4 shows that this region received nearly double its monthly average for July, and the maximum hourly rainfall reached 23 mm, exceeding the record. The water level on the Ahr (Altenahr) river significantly exceeded its previous record in 2016 (3.71 m, discharge: 236 m3/s) due to the flooding; however, the measuring station failed at a value of 5.05 m (discharge: 332 m3/s) [64]. It was six times more than July’s average heaviest rainfall days. The Federal State Office for the Environment Rhineland-Palatinate’s (LfU RLP) preliminary calculations of the return period for the event yielded values of 1 in over 500 years [63]. At other locations, water retention by dams provoked flooding in upstream areas from reservoirs, while subsequent sudden dam openings caused extensive flooding at downstream sites. Medium-sized and bigger rivers, including the Ahr, Emscher, Erft, Kyll, Lippe, and Prum, were affected as the precipitation persisted. Additionally, the banks of the Wupper, Sieg, Ruhr, and Rur broke. As a result, significant flooding occurred, beginning in Eifel (Rhineland-Palatinate) and extending down to southern Westphalia via the Rhineland and the Ruhr region (North Rhine-Westphalia) [63].

4.1.1. Area Directly Impacted by Flood

According to Germany’s Federal Civil Protection Agency (BBK), flooding after torrential rain on 14 July 2021 severely affected the North Rhine-Westphalia and Rhineland-Palatinate states [66]. Flooding affected the Ahr, Volme, Dhünn, Moselle, Inde, Kyll, and Jagst river basins and caused a massive impact on the districts of Hagen, Rhein-Erft-Kreis, Städteregion Aachen in North Rhine-Westphalia; Landkreis Ahrweiler, Eifelkreis Bitburg-Prüm, Trier-Saarburg, and Vulkaneifel in Rhineland-Palatinate; and the Hof district in Bavaria [67]. Table 10 below presents a flood impact based on Copernicus EMS Rapid Mapping in Erftstadt, one of the most affected regions (as shown in Figure 5).

4.1.2. Death and Injury Due to Flooding

Unfortunately, the devastating flood resulted in many fatalities and injuries. The flooding resulted in at least 205 deaths and 766 injuries in Germany [67]. The flooding affected 65,000 people in the RLP and 42,000 in the Ahr valley [66].

4.1.3. Property Loss

The central European floods and landslides resulted in USD 40 billion (EUR 33 billion) in economic costs in Germany alone and were recorded as the second most costly disaster [4]. Overlaying the flood inundation maps derived from the near real-time Radar-Produced Inundation Diary (RAPID) system on the CORINE land cover map study estimated that a 2470 km2 area was affected by the flooding, with 57% representing agricultural land. Among the inundated agricultural land, 36% of the area was pasture, while 33% was arable land [68].

4.1.4. Building Losses and Damage

In Germany, the event caused significant damage to residential and commercial structures and critical infrastructure (e.g., hospitals, railways, bridges, water, and electricity supplies), as shown in Figure 6. The number of buildings impacted by the flooding was 37,662. Among them, 10,539 encountered significant damage, 10,587 medium damage, and 16,536 low damage [69].

4.1.5. Education Provision

The flood impacted over 8000 students, damaging 19 daycare centers and 17 schools in the Rheinland-Pfalz region. Four months after the flood event, the Bad Neuenahr-Ahrweiler region set up temporary school facilities using 297 containers. These buildings hosted classrooms, offices, and cafeteria areas [70]. Even after the summer holiday, 14 institutions in Ahr Valley remained closed, and the losses to schools alone were estimated to be worth more than EUR 100 million [60].

4.1.6. Healthcare Provision

The flood catastrophe damaged approximately 105 general practitioner practices. Depending on the impact, structures were destroyed or rendered inoperable due to a loss of energy and flowing water. In the most impacted areas of Rheinland-Pfalz, medical care was assured after 1.5 months. In the town of Eschweiler, the hospital’s basement, outbuildings, and entire outside area were all submerged. After the building’s power supply failed and the equipment was destroyed, some 300 patients had to be evacuated by helicopter. After 3.5 weeks, partial operations were resumed at the hospital. After three months, all hospital services were restored [70].

4.1.7. Communications Infrastructure

Mobile network services were disrupted in all severely affected areas. Emergency communication masts restored 100% coverage of Rheinland-Pfalz after two weeks. Most of the network’s service levels were back to normal within a month. In addition, the broadband service was restored in less than four months [70].

4.1.8. Road and Transportation Infrastructure

The road and railway infrastructure were severely damaged by the flooding, as shown in Figure 7. More than 130 km of motorways were closed after the incident, and 50 km were closed for more than two months. A month after the flood, only 35 of the 112 bridges in the 40 km of the flooded Ahr Valley (Rheinland-Pfalz) were in use, with 62 bridges destroyed and 13 severely damaged [70]. The southbound portion of the A61 reopened at the end of September 2021, and the northbound part opened at Christmas that same year. The A1 only reopened for traffic during Easter 2022 [60]. The effects on trains were extremely severe. In NRW, more than 600 km of track was affected. Over 40 signal boxes, 1000 catenary and signal masts, 180 level crossings, elevators, lighting systems, electricity supply systems, and 600 km of rails were damaged [70]. In RLP, Ahr, and the Eifel routes, at least seven railroad bridges along the Ahr Valley Railway were destroyed. Officials of Deutsche Bahn claim that the Eifel railway will be restored by the end of 2023 [60].

4.1.9. Drinking Water Supply

In the severely devastated town of Bad Münstereifel in the state of North Rhine-Westphalia, drinking water was restored five days after the flood disaster (often through emergency tanks), and immediately after that, about half of the city center was reconnected to the freshwater network. The Rheinland-Pfalz region’s drinking water supply was primarily restored within two months [70]. However, for about one month, water had to be boiled before drinking. The drinking water supply in Altenahr and Lind in RLP was restored in the first few days of October 2021. Up until that time, emergency supplies were offered [60].

4.1.10. Electricity and Gas Supply

The electricity infrastructure was seriously damaged in North Rhine-Westphalia and Rheinland-Pfalz. At the peak of the incident, about 200,000 people were without power. However, after two days of short-term repairs and upgrades, about 50% of the electricity services resumed. Backup generators were no longer necessary after eight weeks because most of the damaged electrical system had recovered. The flood calamity also harmed the entire gas network along the Ahr. In total, 8500 gas meters, 3400 house pressure regulators, 7220 network connections, 31 gas pressure regulators, 85 measuring systems, and 133 km of natural gas pipes were destroyed. After the flood event, the gas supply fully recovered within four months [70].

4.1.11. Early Warning System Function

Forecasting and early warning systems are the most successful strategies for preventing fatalities and minimizing flash flood damage. On 9 and 10 July, warnings issued by the European Flood Awareness System (EFAS) predicted a high likelihood of flooding in the Rhine river basin, hitting Switzerland and Germany. The first EFAS notifications were disseminated to the relevant national authorities on 10 July with the regularly updated projections. By 14 July, more than 25 notifications had been issued for specific parts of the Rhine and Meuse river basins [71]. The German Weather Service (DWD), a national institution responsible for providing weather warnings to public services and the population, issued its first warning on Monday, 12 July, at noon [60]. The DWD issued heavy precipitation warnings on 13 July, and by 14 July, more and more warnings of rain and flooding had been issued. These were limited to the northern part of the affected regions, particularly the Düsseldorf and Hochsauerland districts, until 18:30, and then they triggered additional warnings in the southern part (Rhein-Sieg-Kreis, Euskirchen, and Trier districts). For Rhein-Sieg-Kreis, this was directly at warning level 1 until 1:00 a.m. on 15 July, triggering further warnings in Wuppertal, Solingen, Trier, Vulkaneifel, Bitburg-Prüm, Bernkastel-Wittlich, and Trier-Saarburg. In total, 16 warnings reached the highest level, 1. NRW and RLP triggered 145 warnings, and their updates were in MoWaS from July 12–20, 2021. Operational and experimental flood forecasting systems (e.g., EFAS, HS2S) forecasted or were able to predict the catastrophic German flood during the 14th and the 15 July in the state of North Rhine-Westphalia (NRW). However, people living along the river Ahr’s valleys, such as Altenahr, were not warned. A poll conducted by [62] revealed that of those who received a warning, 85% did not expect a severe flood. Many seemed unfamiliar with flood situations as they had not experienced a surge before [60].

4.1.12. Insurance

The German Insurance Association (GDV) stated that only 46% of properties were financially protected against natural hazards through insurance at the time of the event. In the NRW state, the coverage was about 47%, and 37% in the RLP state. Event losses were spread across the country, even though around 250,000 claims were made, mainly in NWR and RLP. The insured losses were split between property (EUR 7.7 billion) and motor (EUR 0.45 billion) insurance [60]. This event became the costliest event on record in Germany, Belgium, and Luxembourg for the insurance industry and became the industry’s second most expensive flooding event globally, behind the 2011 Thailand flood (USD 18.5 billion in 2021) [72].

4.1.13. Emergency Response and External Flood Assistance

More than 15,000 police officers, troops, and emergency service personnel were deployed to assist in the search and rescue. More than 4500 civil defense workers and firefighters were sent to help with clean-up efforts in the badly affected Ahr valley region of Rhineland-Palatinate [73]. During the event, the Federal Agency for Technical Relief (THW) pumping crews successfully prevented several dams from bursting [74]. To help safeguard local houses and businesses, the 52nd Civil Engineer Squadron and many volunteers from the US air base at Spangdahlem packed and distributed hundreds of sandbags [75]. At least 850 soldiers and tens of thousands of emergency workers were sent to the impacted areas to conduct rescue operations and search for survivors in the wreckage of demolished structures [76]. Around 300 people were used to provide emergency psychosocial care. Infrastructure was severely destroyed, making it challenging to conduct rescue operations. Numerous roads were either impassable or damaged, and numerous areas did not have access to a phone or internet service. On 18 July, German Chancellor Angela Merkel visited the demolished town of Adenau. She described the scene as terrifying [56]. Hagen city declared a state of emergency after the Volme River burst its banks [77].
On 21 July 2021, Germanys cabinet approved a roughly USD 472 million (EUR 400 million) package of immediate aid for flood victims and vowed to rebuild devastated areas [78]. The Rhineland-Palatinate state government decided on emergency aid of up to EUR 3500 per household for those affected in the state. The money was paid out via the district administrations as quickly as possible without a means test [79]. Companies and farms in the flood area were reimbursed 100% of their appraisal costs. EUR 8.57 million was received by the state’s central donation account, granted to those affected through the districts and municipalities [80]. To assist the affected locals, destroyed enterprises, and other bodies with reconstruction efforts, the Federal Cabinet allocated EUR 30 billion for the long-term reconstruction of regions hit by the floods [81]. About EUR 2 billion was directly used by the federal government to repair and reconstruct national infrastructure, while the rest was distributed between the most affected people in the NRW and RLP states. NRW set aside EUR 300 million for emergency relief and paid out EUR 102.4 million to private households, EUR 35.7 million to businesses and industry, and EUR 65 million to local authorities. RLP distributed EUR 118.9 million to local governments, EUR 13.1 million to businesses and industry, and EUR 35.3 million to private households. Reconstruction support was available for up to 80% of the property value for locations damaged in the 2021 floods [60].

4.2. Henan Flood

From 17 to 23 July 2021, Henan province witnessed rare and extremely heavy rain under the combined influence of an unusually powerful Western Pacific subtropical high and Typhoon In-Fa, resulting in an extreme flood event named the 7.20 Henan rainstorms. Zhengzhou received 201.9 mm of rainfall from 16:00 to 17:00 on 20 July, 382 mm in 6 h, and 552.5 mm in 24 h, breaking the highest record of 198.5 mm in one hour in 75.8 on the Chinese mainland. The average rainfall for the whole province was 222.9 mm. The maximum daily rainfall registered at Zhengzhou station was 624.1 mm, close to the total annual rainfall of 641 mm for the station and 3.39 times the maximum daily rainfall since the establishment of the station (184.1 mm, 1 July 1978), as shown in Table 11 and Figure 8. Following this incident, the total annual precipitation in 39 counties exceeded 50% of the climatological mean; 10 counties, including Zhengzhou, Huixian, and Qixian, received more total precipitation than the mean annual rainfall. Approximately 32.8% of Henan province received more than 250 mm [1]. Over three days, 1073 mm of rain was reported due to the unique weather system and local topography. The downpour led to the breach of several dams. Guojiazui reservoir was flooded by overflowing water, threatening more than ten thousand people downstream. Although there were no dam failures or casualties, the flood caused significant economic losses and social impacts [82]. Such an intense rainstorm considerably exceeded the planned capacity of the local flood control and drainage systems, causing urban floods and waterlogging the severely flooded public facilities in residential areas [83]. Despite the application of a sponge city, protecting Zhengzhou from the downpour intensity on 20 July 2021 was almost unfeasible given the state of design and technological advancements. The design rainfall varied from 15.7 to 26.5 mm for several locations and watersheds in Zhengzhou city. However, Zhengzhou city received 201.9 mm of rain between 16:00 and 17:00 on 20 July alone, which is about ten times the design rainfall of the sponge cities [84]. A massive once-in-1000-years flood resulted in the tremendous loss of life and assets in Henan [85], as shown in Figure 9, showing the flooding captured by the MODIS on 26 July 2021 compared with 20 July 2020.
Table 11. Top 10 stations with the highest six-day accumulated rainfall during 0800 LST 17 July to 0800 LST 23 July 2021 [86].
RegionAccumulated Rainfall (mm)
17–23 July 2021
Hebi City Science and Technology Center1122.6
Xinmi Baizhai, Zhengzhou city993.1
Fenghuang Mountain, Xinxiang city965.5
Hou Zhai, Zhengzhou city936.0
Makino township, Xinxiang city935.2
Hebi Foreign Languages923.4
Shibangou, Xingyang, Zhengzhou city905.8
Jiangang, Zhengzhou city899.5
Zhengzhou Gongyi Culture Station895.3
No. 65 Middle School, Anyang city889.7

4.2.1. Area Directly Impacted by Flood

In Henan, since 17 July 2021, 150 counties (cities, districts) and 1664 towns have been affected by severe flooding. The worst-hit areas are Zhengzhou, Xinyang, Xinxiang, Zhumadian, Zhoukou, Anyang, Shangqiu, Kaifeng, Puyang, and Hebi [88].

4.2.2. Death and Injury Due to Flooding

The catastrophe caused 398 deaths, including 380 in Zhengzhou; at least 39 drowned in underground areas such as basements, underground tunnels, and subways [82]. The inundation of Metro Line 5 claimed the lives of 14 people, and Jingguang Road Tunnel (JRT) claimed six lives [89]. In 150 counties (cities, districts) in the province, the disaster affected 14.786 million people.

4.2.3. Property Loss

The severe flood resulted in a direct economic loss of CNY 120.06 billion (about USD 18.91 billion), with a sizeable portion occurring in Zhengzhou, accounting for 34.1% of the province [82]. It caused infrastructure paralysis, collapsed buildings, washed-away cars, flooded facilities, resource outages, and so on [72]. Although there was some damage to agricultural production, replanting was completed successfully. The crop area affected was 10,802 km2, which is 13.6% of the total sowing area in autumn, and the dead harvest area was 3424.7 km2, with approximately 4.3% being wiped out completely [88]. Across Henan, the rains flooded 1678 larger-scale farms, killing more than a million animals [90].

4.2.4. Building Losses and Damage

In Henan, 35,325 houses collapsed and 53,535 were heavily damaged [88]. The flooding also caused irreversible damage to historical sites such as museums, archaeological sites, Longmen Grottoes, and the Shaolin Temple [84].

4.2.5. Education

Record-breaking rains impacted about 7139 schools in the province [91]. A flooded nursery school required the rescue of children [92]. It is estimated that the flood damaged 4700 schools in the rural Henan area, with some being wholly ruined [93].

4.2.6. Healthcare Provision

The disaster destroyed numerous hospitals in Henan, and patients and medical staff were locked inside while they waited to be evacuated. Zhengzhou University’s No. 1 affiliated hospital, with more than 7000 beds, was flooded and lost electricity, requiring nearly 600 critically ill patients to shift to upper floors and other hospitals. The hospital lost a significant amount of medical supplies kept on the ground floor and in the basement. The hospital began to receive patients again on Monday, 26 July 2021, with fewer inpatient beds and some services delivered by mobile units. The Fuwai Central China Cardiovascular Hospital in the county of Zhongmu was also damaged [94].

4.2.7. Communications Infrastructure

China has transformed its metropolitan areas into smart cities, which creates problems when there is disruption to internet services. The heavy rains destroyed 3359 optical cables with a length of 3500 km and at least 61,900 telecommunications base stations. Network failure severely impeded the rescue efforts. In Mihe township, Gongyi city, a drone was dispatched to provide mobile signal coverage for an area of about 50 sq. km. [95]. By 27 July 2021, Zhengzhou city had recovered internet access except for some regions submerged in water [96]. However, the neighboring towns and rural areas suffered from prolonged cell tower damage and a scarcity of mobile power equipment. As of 8 August 2021, 98.5% of the non-serving communication base stations had been reinstalled [88].

4.2.8. Road and Transportation Infrastructure

The floods led to the virtual paralysis of the city’s transport and utility infrastructure: 29 sections of 26 national and regional highways were closed to traffic. More than 876 km. of highways and 6944 km. of rural roads were damaged, as shown in Figure 10 and Figure 11. Over 80 bus lines were suspended during the event, and more than 100 were temporarily detoured. The four most heavily impacted cities, Zhengzhou, Xinxiang, Anyang, and Hebi, had reopened bus and taxi services by 8 August 2021 [97]. Zhengzhou’s 339 public bus routes all resumed service with greater frequency [98]. Additionally, the subway service was temporarily halted. On 20 July, a low-lying, kilometer-long stretch of Zhengzhou’s Metro Line 5 tunnel between Shakoulu and Haitanshi station filled with water, trapping more than 500 passengers inside a subway train and resulting in 14 fatalities. Many cars were stranded within the severely flooded JRT. On 12 and 15 September 2021, the city’s five subway lines reopened in two phases. At the peak of the incident, Zhengzhou’s airport canceled 260 flights into and out of the region. At the same time, many freight and high-speed rail lines were suspended or operated at limited capacity. Three high-speed and seven normal railways suffered damage in more than 1100 places. On 8 August 2021, all of the railroads damaged by the severe rains were reopened, except for the line running from Taiyuan in Shanxi province in northeastern China to Jiaozuo in Henan [98].

4.2.9. Drinking Water Supply

Several residential neighborhoods in the city were without tap water due to the rainstorms. In Zhengzhou, 1577 out of 1844 affected household units had resumed their water supply by 1 August 2021 [98].

4.2.10. Electricity and Gas Supply

The rainstorms caused power outages in several city neighborhoods, which had been relatively uncommon in Zhengzhou for generations. In Zhengzhou, out of the 473 building estates, more than 200 households were without electricity during the event’s peak [98]. A total of 67 high-voltage transmission lines in the city were damaged, and eight substations halted operation, disrupting the power supply to 775,000 households [96]. To restore Zhengzhou’s power supply, the National Development and Reform Commission coordinated approximately 10,000 maintenance workers, 181 power generation vehicles, and more than 1000 high-power generators in 24 provinces and cities, as well as around 3600 technicians in Henan [95]. By 30 July 2021, the power supply had mainly been restored for 1194 residential districts, with 99% regained in Zhengzhou, thanks to effective organization by governments at all levels and tremendous support from around the nation. By 8 August 2021, 98.5% of the 1807 damaged distribution lines, 47 transmission lines, 42 power substations, 98.3% of the 58,000 distribution stations, and 98.5% of the communication base stations that were no longer in use had been fixed or upgraded [88]. Moreover, in 111 residential areas, the gas supply was restored by 2 August 2021 [99].

4.2.11. Early Warning System Function

During the event, Zhengzhou’s meteorological department closely monitored the weather changes. It provided high-frequency and progressive meteorological forecast services to the party government, relevant departments for flood control and disaster relief, and the public to avoid danger and seek help. The meteorological department issued nine red early warnings during the rainstorm [99]. The Provincial Flood Control and Drought Relief Center began an emergency flood response at 17:00 on 19 July, starting with a level IV, then upgrading to a level II at 18:00 on 20 July and a level I at 3:00 on 21 July to improve the rainfall defensive response. The much-hyped smart city technologies in Zhengzhou, which were meant to assist planners with urban management and safety, came under intense criticism after floods severely damaged the city infrastructure and resulted in scores of fatalities in the JRT and the city’s metro system. The city officials needed to be faster in organizing an emergency response as the floodwaters started to overrun the city’s defenses because they disregarded a series of early warnings issued by Zhengzhou’s meteorological bureau. The failure to act quickly proved disastrous, as many people died in central Zhengzhou and its neighboring towns throughout the afternoon and early evening on 20 July. Many citizens went to work as usual without realizing the danger they were facing. In Zhengzhou city, more connections between emergency actions and forecast information must be made as the lack of efficiency and coordination among different agencies has failed to turn system signals into timely public warnings [82].

4.2.12. Insurance

Insurance is an effective tool for spreading risk in the face of disasters. During the event, more than 552,000 insurance claims were made, and the local Henan insurance industry estimated total losses of USD 1.9 billion. For Chinese insurance, this was the most expensive weather event ever recorded [72]. The province’s insurance business saw rates of 51.38% settled claims and 35.06% paid out in claim settlements. Agricultural insurance, vehicle insurance, house property insurance, and life insurance each had settlement rates of 74.94%, 56.70%, 44.85%, and 42.62%, respectively, with corresponding settlement payouts of 63.62%, 51.06%, 7.05%, and 67.64%. A total of 346,000 cases were resolved, with a total settlement amount of CNY 6.885 billion (about USD 1.064) [88]. However, even though the event primarily affected the densely populated city of Zhengzhou, only about 10% of the overall economic cost was covered by insurers [72].

4.2.13. Emergency Response and External Flood Assistance

The emergency response involved local, provincial, and national civil defense and military support. On 21 July 2021, Chinese President Xi Jinping emphasized that the lifesaving aspect of flood prevention and rescue should come first. The President noted the need to reduce casualties while maintaining hygiene and disease control to prevent epidemics. More than 3000 PLA soldiers, generally considered the central force for disaster relief in China, were mobilized in the rescue effort. With a peak of 1,470,800 people needing relocation, the province put up emergency shelters for 933,800 people [90]. On 20 July, the Henan province Fire and Rescue Department immediately raised the rescue level, and a rescue team from Jiaozuo, Xuchang, Luohe, Xinxiang, Shangqiu, and Zhumadian, consisting of 43 fire engines, 180 firefighters, and 22 boats, arrived in Zhengzhou. They assisted with personnel search and rescue, drainage clearance, and people transfers. The People’s Republic of China’s Ministry of Emergency Management started the cross-regional reinforcement of the fire and rescue teams on 21 July. Seven expert provincial fire and rescue teams, including 1800 firefighters, 250 boats, 7 sets of high-power drainage vehicles, more than 18,500 pieces of flood rescue equipment, and 11 sets of remote water delivery systems, were sent out overnight from Hebei, Shanxi, Jiangsu, Anhui, Jiangxi, Shandong, and Hubei. At 22:00 on 22 July, 64 remote water supply and drainage vehicles, 100 rubber boats, and 510 firefighters were sent out from the five provinces/cities of Beijing, Shanghai, Jiangsu, Shandong, and Hunan to perform drainage rescue and relief overnight. The third round, consisting of two emergency drainage teams from the provinces of Hubei and Shaanxi, each with 300 individuals and 103 sets of drainage equipment, was sent to the city of Xinxiang to perform drainage rescue on the evening of 23 July. More than two million people helped with the rescue as of 2 August; 256 sets of large-scale drainage equipment, 532 boats, and 4859 firefighters were mobilized. After completing the relief effort, the cross-regional rescue troops left Henan on 4 August [88]. Remote-controlled paddle boards, unmanned aerial vehicles, motored floating platforms, and special-purpose pumping machines were some of the equipment used in the rescue operations. Helicopters dropped food to stranded people. Heavy machinery removed mud and debris, and those in danger were transferred on motorized rubber rafts.
Emergency funding of CNY 8.271 billion (about USD 1.27 billion) was allotted for disaster relief. Businesses and local individuals from all over China donated rescue materials, food, and clean drinking water to the affected people. According to the press release, from 22 July to 2 August, the provincial authority provided 11 times the relief funds of CNY 4.725 billion (about USD 0.73 billion). It was disbursed as a financial subsidy of 43%, natural disaster relief of 25%, a living allowance of 14%, agricultural production and water conservancy of 14%, and small business subsidies of 4% [88]. At the end of July 2021, the focus shifted from emergency rescue and relief to recovery and reconstruction. The Information Office, Henan, held six press conferences on accelerating post-disaster reconstruction from 4 to 16 August. The State Council of China approved an overall plan for the recovery and restoration work in the flood-affected areas. The plan intends to complete the restoration of water conservation projects, repair damaged homes, and reconstruct self-built homes in rural communities. According to the plan for 2021–2024, the task of reconstruction should be finished in three years, with a significant improvement in the ability to avoid and mitigate disasters and living conditions, and social and economic development fully recovered to reach pre-disaster levels. Reconstruction work starts with specified primary targets and timetables for each task [100].

5. Discussion

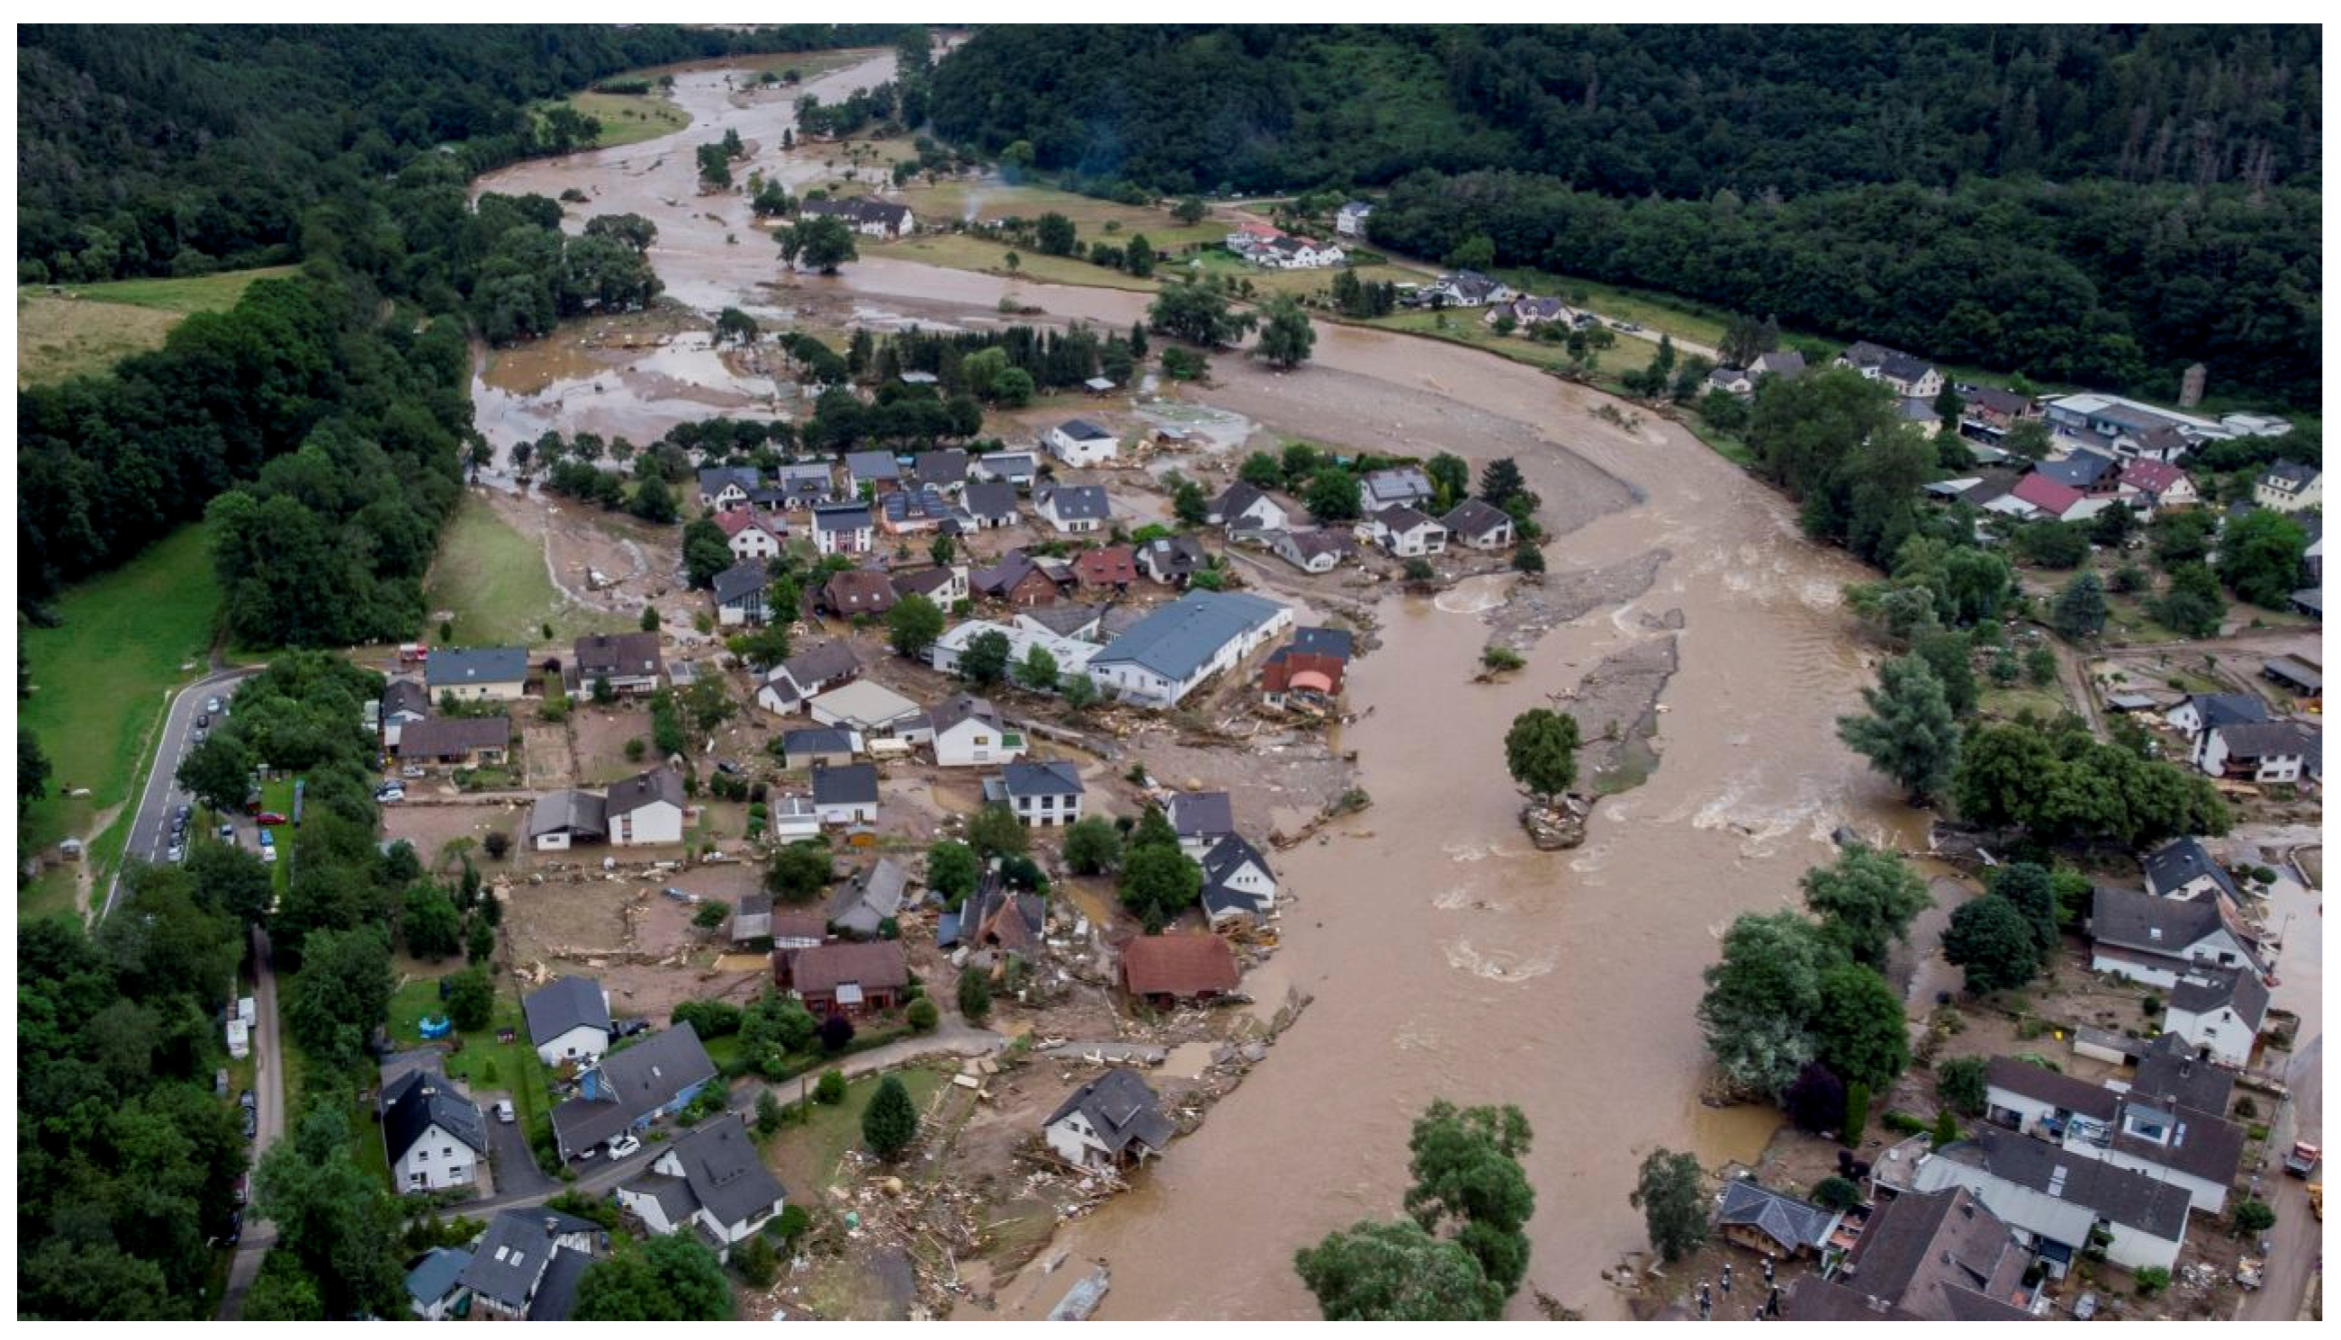
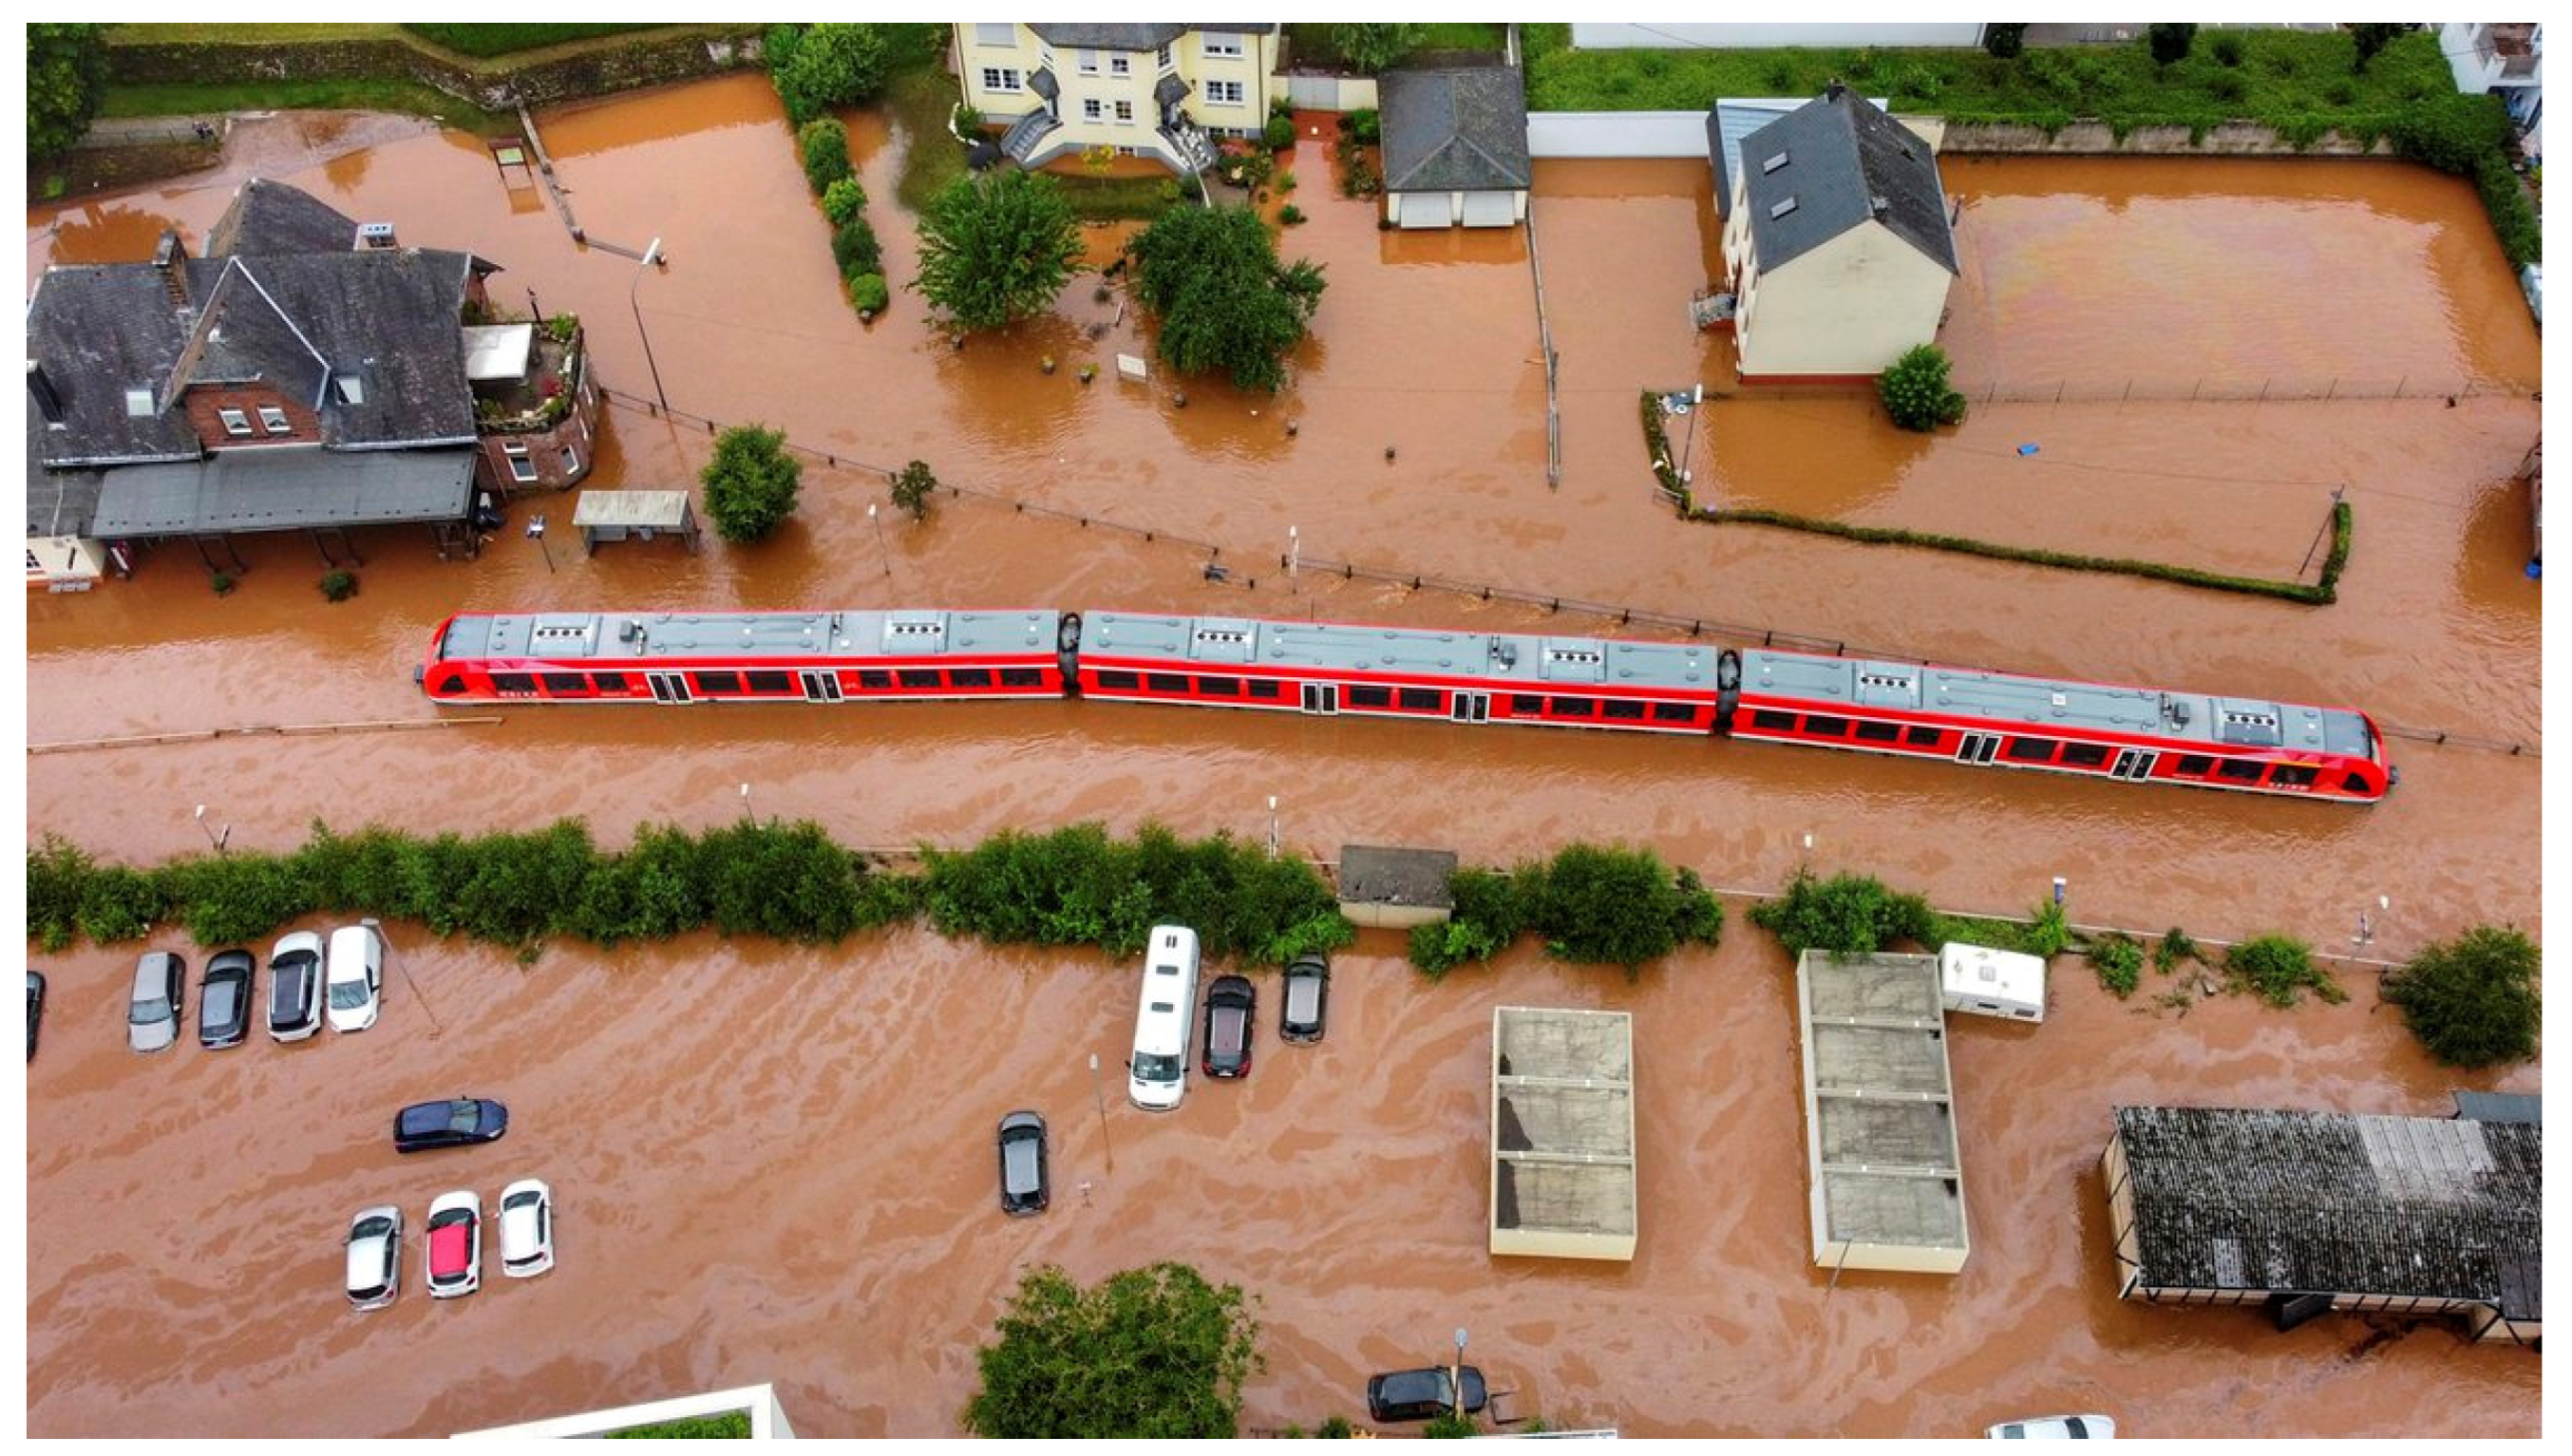
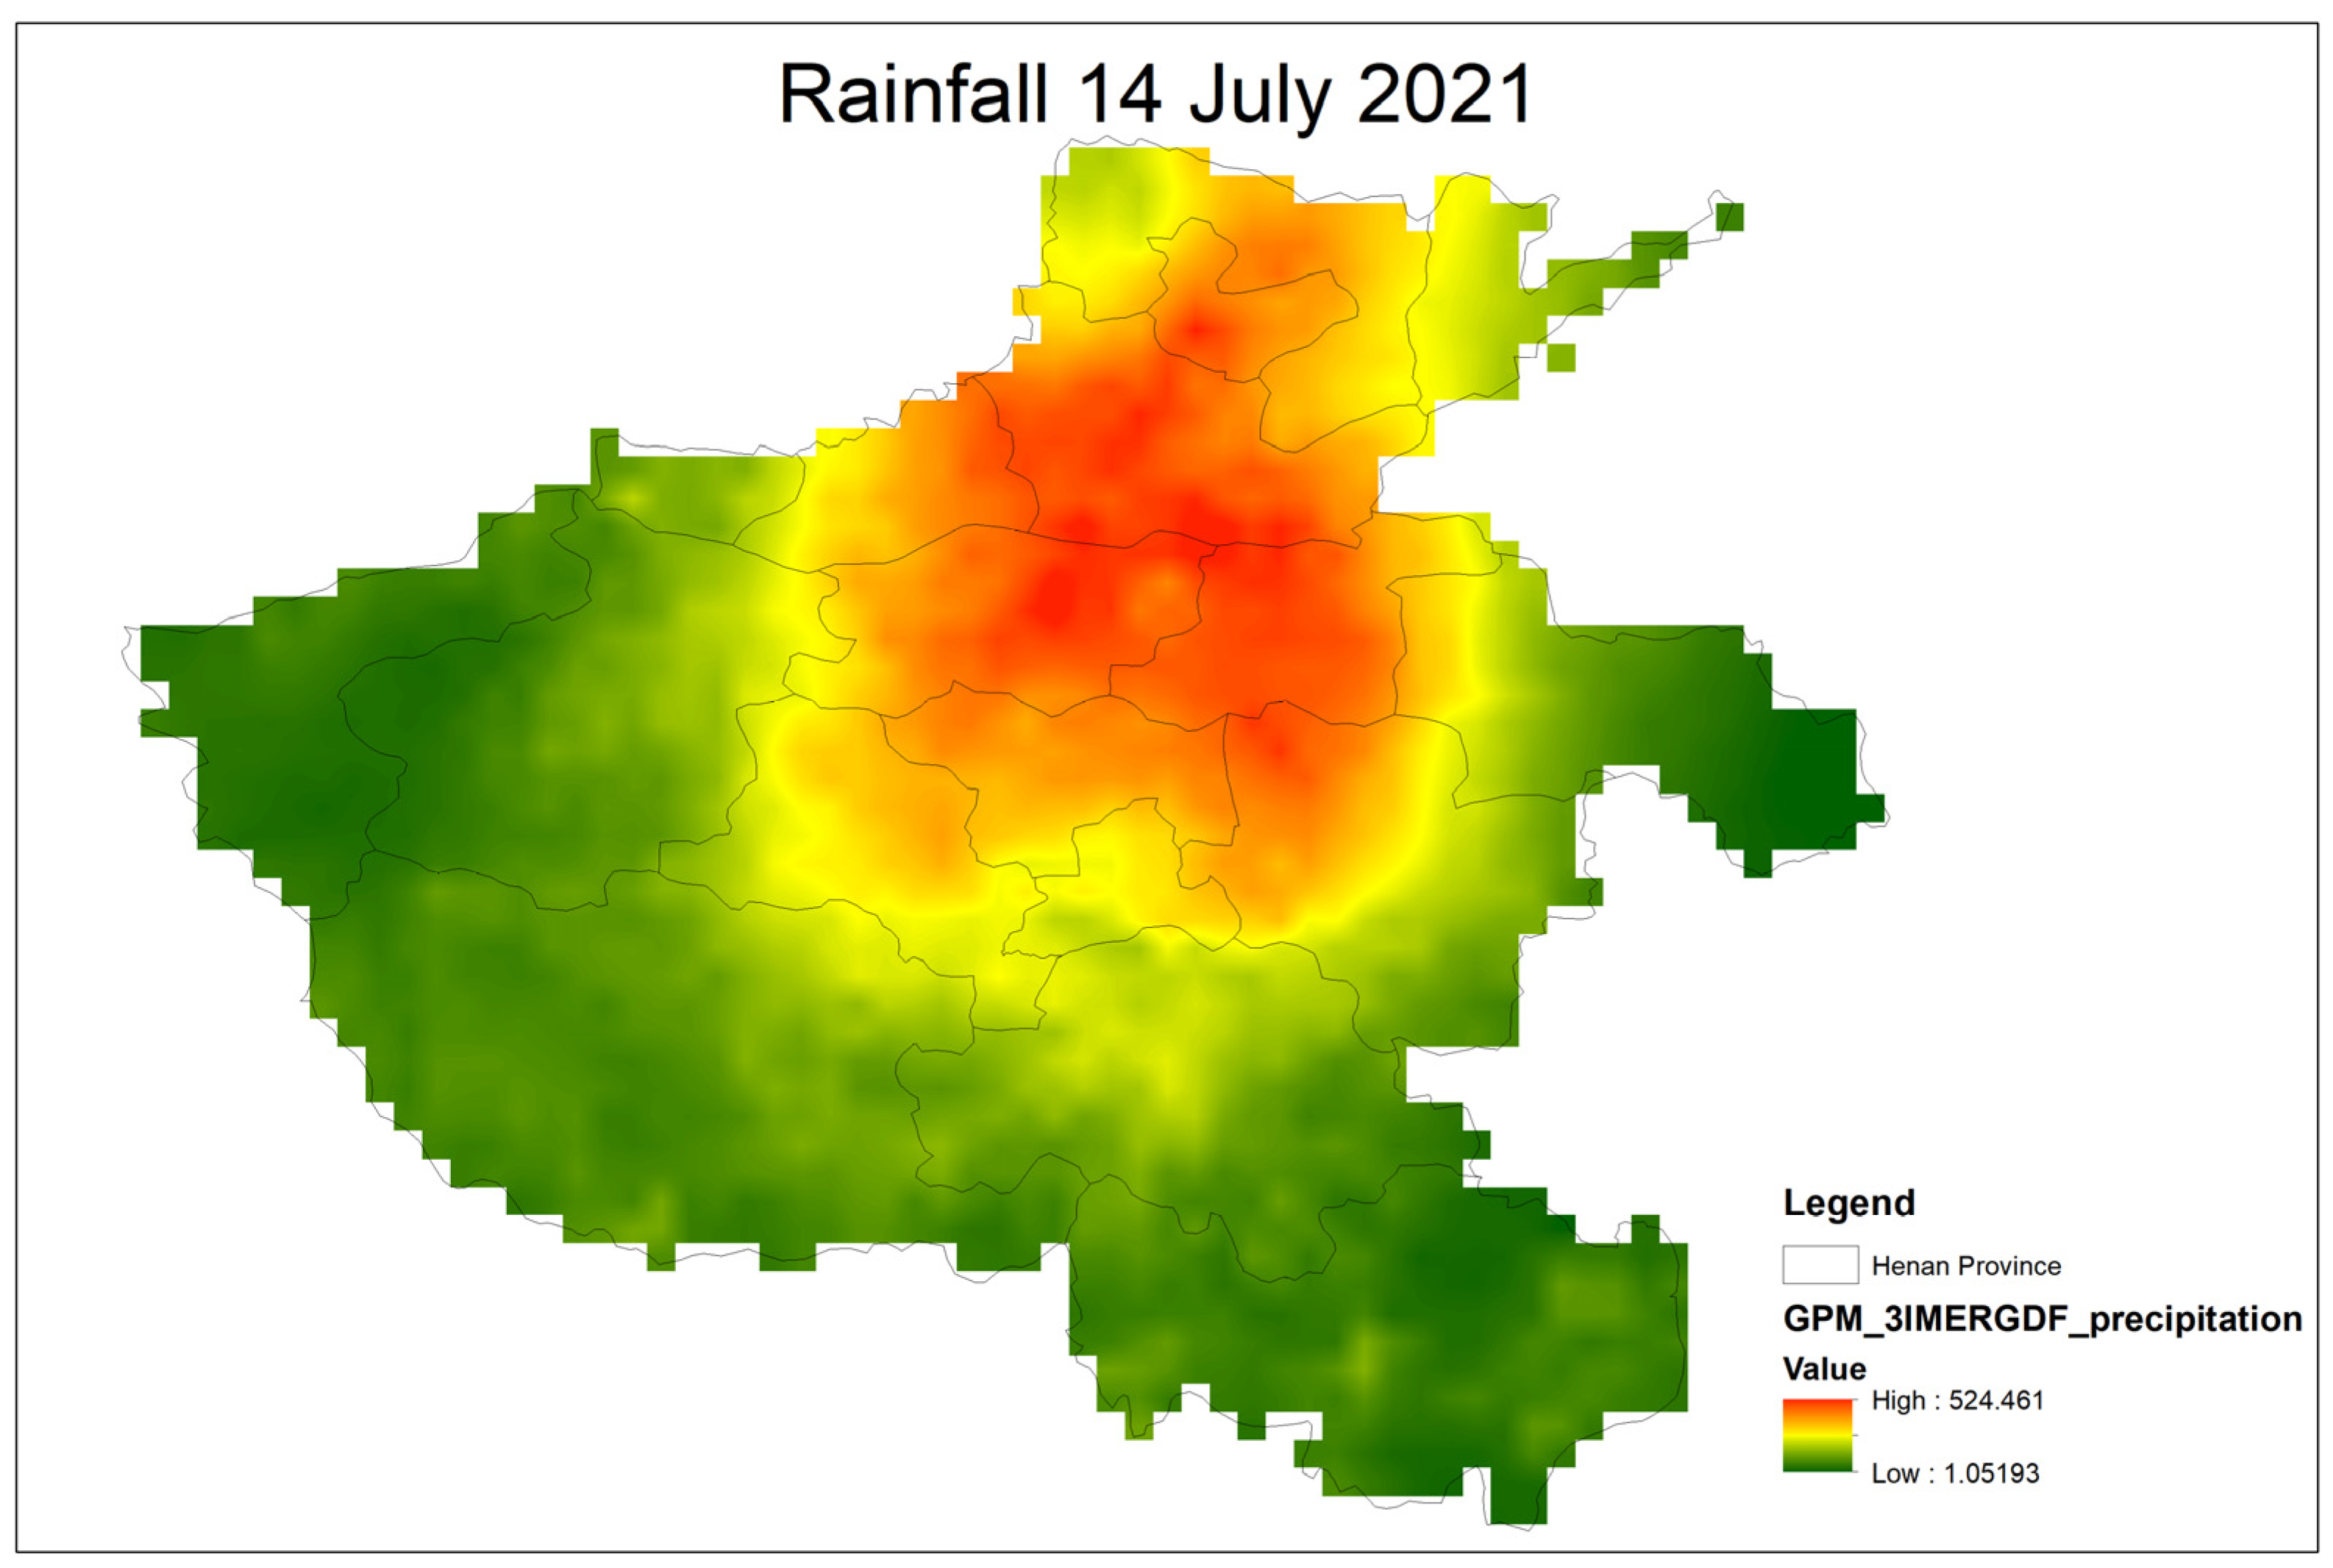
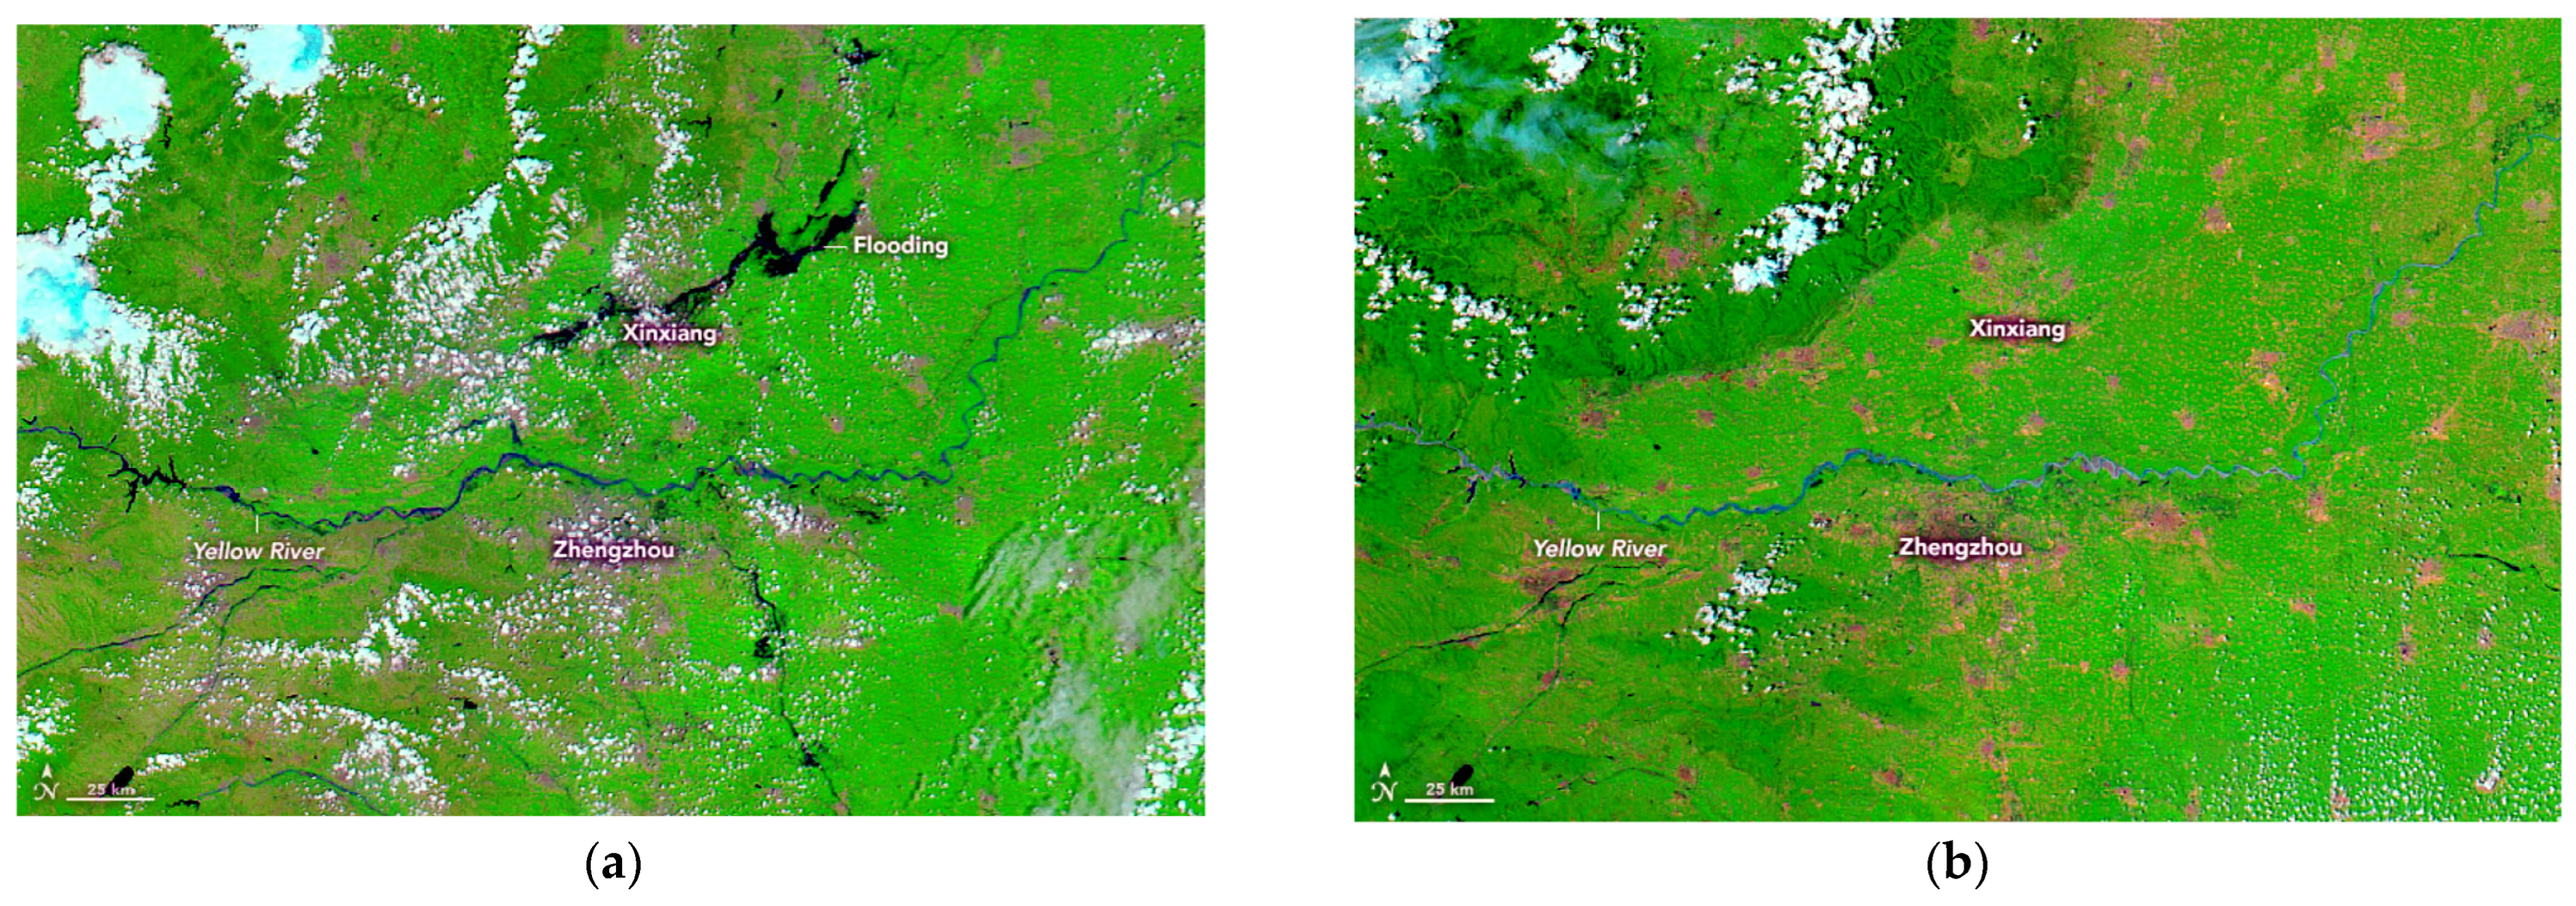
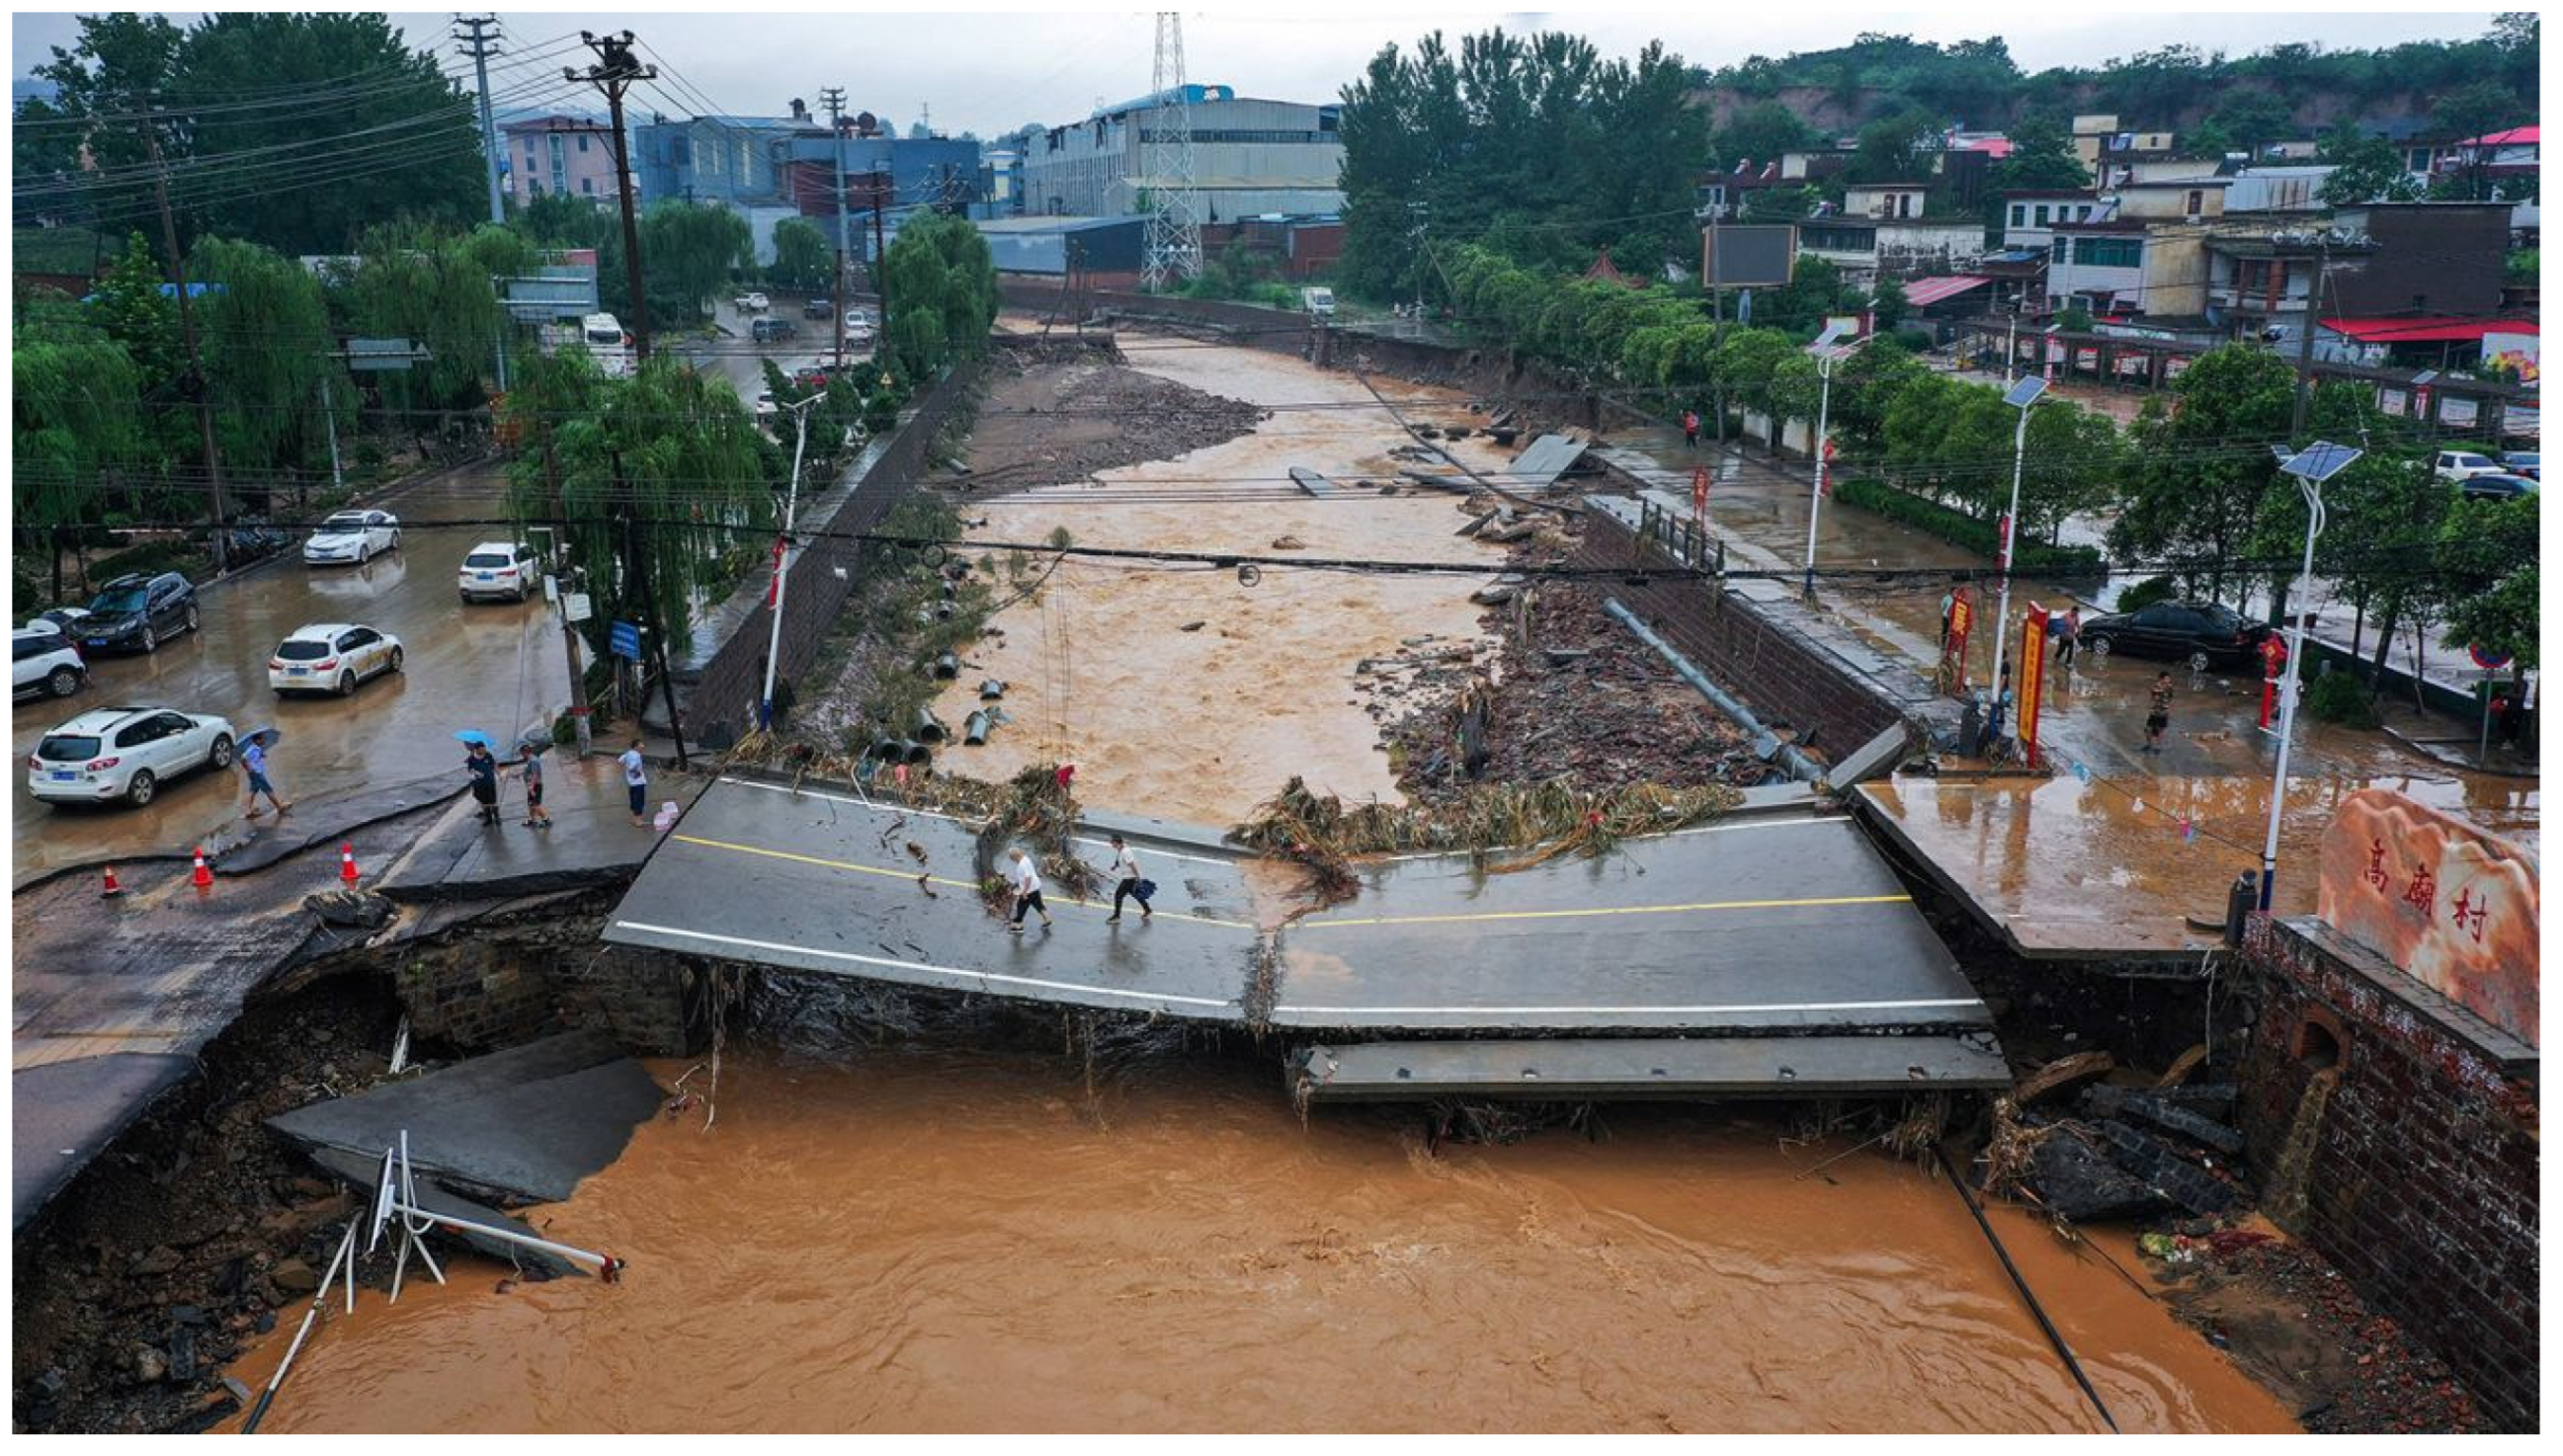
Post-flood resilience assessment reflects the resilience capacity to improve disaster risk reduction. The floods in western Germany and Henan demonstrated how susceptible densely populated and developed places are to severe flooding and other natural calamities. Western Germany experienced a flood with a 500-year return period, while Henan experienced a flood with a 1000-year return period; however, in terms of economic losses, Germany accounted for USD 40 billion (EUR 33 billion), while Henan accounted for USD 18.9 billion (CNY 120 billion). In Germany, more than 65,000 people were affected in the RLP and 42,000 in the Ahr valley, with 205 people losing their lives, whereas in Henan, 14.786 million people were affected, and 398 people died (as shown in Table 12). While 37,662 buildings were destroyed in Germany, 35,325 houses collapsed in Henan. Germany’s federal government declared USD 35 billion (EUR 30 billion) in flood assistance, whereas Henan allocated CNY 8.271 billion (about USD 1.27 billion) to the emergency disaster relief fund. The insurance coverage was approximately 47% in NRW and 37% in RLP, whereas in Zhengzhou, only about 10% of the overall economic cost was covered by insurers.
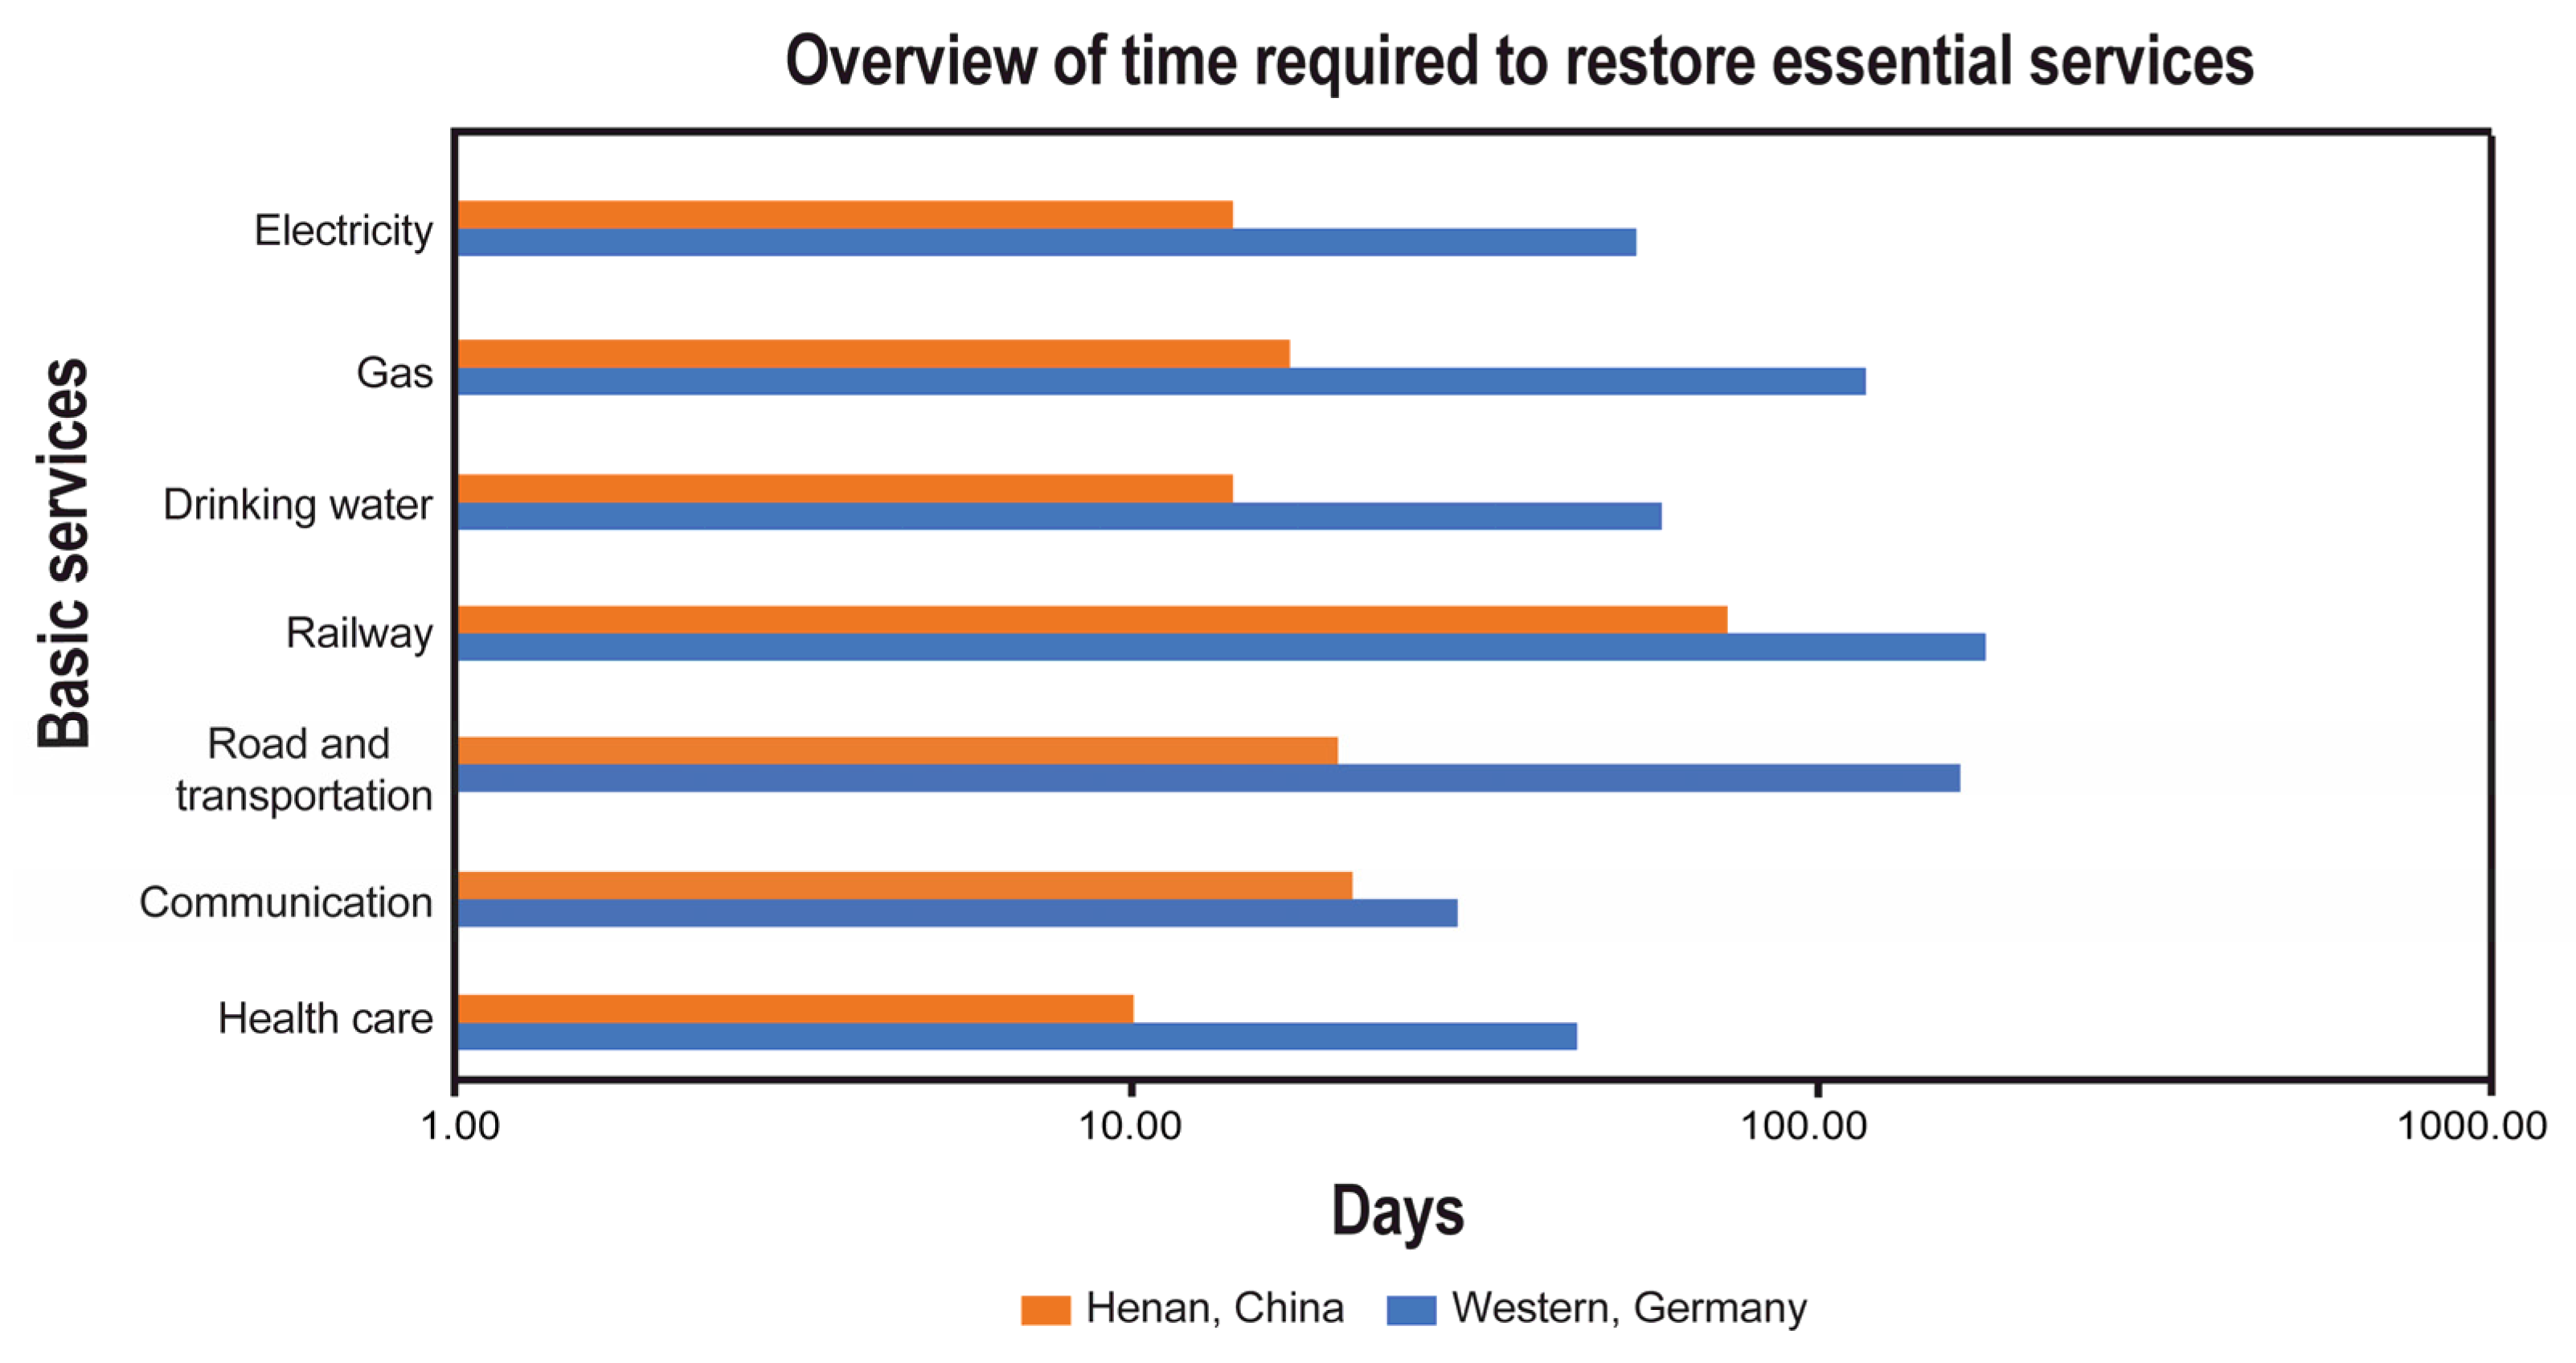
In Germany, Rheinland-Pfalz resumed medical care after 1.5 months; in Eschweiler, it took three months, whereas the Zhengzhou University No. 1 Affiliated Hospital in Henan resumed patient admissions on 26 July 2021, less than two weeks after the incident. In Germany, installing emergency communication masts took two weeks to guarantee complete communication coverage. Most of the network had pre-disaster service levels within one month, but it took four months to bring broadband back to the worst-affected districts. In the case of Henan, Zhengzhou had its internet service restored by 27 July and had installed 98.5% of the non-serving communication base stations by 8 August 2021 in three weeks. Both disasters significantly damaged the nation’s road and transportation infrastructure; in Germany, road repairs required months or years, taking two years for all railway lengths to be operational. It took until the end of September 2021 to reopen the southbound part of the A61 and until Christmas 2021 for the northbound part. The A1 was only reopened at Easter 2022. Moreover, 9 out of 14 affected rail stretches became functional within six months, while the Eifel track will take till the end of 2023 to renovate. In Henan, the four cities most severely affected by the flooding—Zhengzhou, Xinxiang, Anyang, and Hebi—reopened bus and taxi services by 8 August 2021. Additionally, a railway route connecting Taiyuan in the Shanxi province of northeastern China and Jiaozuo in Henan was reopened on 8 August. Metro Line 5 was out of service until 14 September 2021. In Germany, Rheinland-Pfalz restored the drinking water supply within two months, and in North Rhine-Westphalia, five days after the flood event, through emergency tanks. About 50% of the city center was reconnected to the freshwater network quickly, whereas Zhengzhou restored water supply by 1 August 2021 9 (two weeks). In Germany, the gas supply was almost fully restored four months after the event, and in Zhengzhou, Henan, the supply was fixed by 2 August 2021, in less than three weeks. Germany restored most of the power infrastructure within eight weeks, and Zhengzhou restored the power supply by 30 July 2021, within two weeks. Figure 12 and Table 13, illustrating the post-flood resilience assessment grading, show that western Germany was more impacted and took longer to restore the essential services of transportation, gas, communication, electricity, health, and drinking water, ranging from one month to six months. In contrast, Henan was less impacted and took less time to restore the essential services, ranging from 10 days to 2.5 months.
Based on the calculations of the Flood Resilience Index, Germany achieves 2.16 and Henan, China, reaches 2.4, which shows that Henan is slightly more resilient than Germany, as shown in Table 14. The FRI shows that both study sites’ flood resilience scale is low (2–3). It shows that both study sites have low flood awareness and motivation to address this. The capacity building of human resources still needs to be improved.
Despite the differences in context, these deadly floods showed that the world’s weather is becoming increasingly extreme due to climate change. A warming atmosphere increases severe weather events, such as heavy rain and flooding, and global warming has exacerbated many events. In both cases, several weather prediction models correctly forecast the meteorological situation days in advance. It is challenging to predict the consequences of extreme events because of the difference between the precision of meteorological forecasts and inadequate flood hazard forecasting and communication. While information about the hazards existed, it did not trickle down to every community and person, leading to a lag in preventing disasters. The severe rainstorms in Zhengzhou and the Ahr River Valley exposed weaknesses in urban disaster management. The approach overlooks disaster scenarios such as subway flooding and inadequate risk communication with the public due to incomplete disaster contingency plans, insufficient cooperation between organizations, and weak public awareness of disaster risk prevention. The sponge city project in Zhengzhou demonstrates that the effect is limited in the face of extreme events [16,84]. Both countries paid close attention to providing emergency relief for flood victims and pledged to reconstruct the affected areas. From this experience, both countries aim to use post-disaster reconstruction as an opportunity to improve their resilience level. Germany aims to boost resilience by protecting people and their livelihoods, as well as the adaptability and resilience of communities against devastating events. The flood maxima at the Ahr River were equivalent to the historically significant occurrences recreated in 1804 and 1910, but were not considered in the current evaluation of flood risk. A comparison of the 2021 flood with those in the past revealed variances in the hydro-morpho-dynamic processes, increasing the flood risk as a result of changes in the organization and occupancy of the landscape. With further global warming, it is anticipated that such precipitation-related disasters may become increasingly more intense, with subsequent floods [101]. After the event, the authorities updated the Ahr River Valley flood zone maps, delineating where new construction is no longer permitted [102]. In China, the reconstruction plan aims to significantly increase the country’s capacity to prevent and reduce disasters and improve living conditions and social and economic development to surpass pre-disaster levels. After the tragic flooding of a road tunnel and portions of the metro network in Zhengzhou, underground infrastructure has received the most attention. The National Development and Reform Commission (NRDC) directed local governments nationwide to enhance their emergency response systems and map which structures pose a risk of flooding. In addition, it emphasizes improving the exchange of knowledge and experience among Chinese cities on catastrophe risk reduction [103]. Such catastrophes are likely to occur more frequently in the future due to climate change. Even though a flood of this magnitude might occur at any time, taking the proper non-technical and technological precautions would greatly lessen its effects. However, these actions always necessitate a comprehensive understanding and knowledge of previous events and comparable processes [104].

6. Conclusions

The extreme flood events in western Germany and Henan, China, in July 2021 exposed climate vulnerability. Post-flood resilience assessment grading shows that Germany was more impacted and took longer to restore essential services than Henan, China. The Flood Resilience Index shows that resilience levels of both countries are low. It revealed that more knowledge of such extreme circumstances is urgently required, along with increasing public awareness and risk perception of these scenarios and their consequences, early warning systems, preparedness, emergency response, and risk insurance. There needs to be more clarity between issuing meteorological warnings and triggering an emergency response. Government agencies must respond more quickly to improve the disaster prevention and management system, and cross-departmental, multi-stakeholder cooperation must be reinforced. Establishing a well-equipped rescue team to search for survivors, nurse the injured, dispense daily commodities, and operate a temporary holding center is vital. Both nations must use the opportunity provided by post-disaster reconstruction to increase their levels of resilience.
The results of our investigation were consistent with those of related studies; in Mersin city, Turkey, the City Water Resilient Approach (CWRA) is used for assessing flood resilience by calculating the scores. It shows the city’s resilience is very low, and some actions must be taken to make it resilient [105]. In three European cities—Flanders (Belgium), Niedersachsen (Germany), and Calabria (Italy)—Schelfaut et al. (2011) attempted to put resilience into practice based on flood risk management and found that institutional interplay, flood management tools, and risk communication are three major components of resilience [106]. A study conducted in the United States, England, and Germany reveals that the escalating socioeconomic effects of floods have become a national issue, especially in the immediate wake of flood catastrophes. The degree of risk awareness and the use of risk data in decision making vary substantially among stakeholders. FRM systems are still typically reactive to flooding, demonstrating the need for a more predictive, coordinated, and systems-based approach to managing increasing risk [107]. A comparative study on flood risk management approaches in the UK and China by Rubinato et al. (2019) suggests the engagement of all stakeholders to ensure a proactive approach to land use planning, early warning systems, and water-sensitive urban design [108]. Individuals impacted by catastrophes are not just the victims; they also play an important role as first responders during emergency operations and collaborators in recovery and resilience-building. The government should actively involve the community in decision making during the evaluation, preparation, reaction, and recovery phases [109]. The EWS and its timely communication are crucial pillars of flood-resilient communities as they connect with absorptive capacity. Nevertheless, stakeholders need to do more to strengthen flood-prone communities’ absorptive, adaptive, and transformative capacities [110]. To increase flood resilience, infrastructure standards, water conservation initiatives, and water conservation education should all be increased [111]. Indicators frequently used to gauge community resilience should be evaluated and explicitly expressed in relation to other indicators and empirical findings of community resilience [112]. According to Laurien et al. (2022), future advancements in resilience measurement should make it possible to analyze the interconnections between various stressors at various scales and among systemic hazards [113]. Upton et al. (2022) conducted a comparative assessment of three resilience measurement methods. The result of the study suggests that resilience measurement has many opportunities for improvement, which will help better assess resilience program development [114]. As no one method measures resilience universally, before deciding which methodologies to use, the researcher should carefully assess their epistemology of resilience, measurement objectives, and resource and data availability [115].
Despite several hazard-oriented strategies already in place, integrated approaches are necessary to prevent negative consequences from extreme events. There is a need to explore and strengthen current frameworks and techniques that could reduce hazards, impacts, and vulnerability and enhance resilience, adaptive capacity, and sustainability. Furthermore, given the already predicted future challenges associated with climate variability, better land use planning and reducing the density of residential buildings in potentially affected areas are essential. Therefore, planning that integrates ecological, digital, managerial, predictive, insurance, and political strategies is necessary to minimize the effects of extreme weather events. These tragedies are a wake-up call for nations to do more to make the planet safer. The devastating floods have demonstrated that the world is unprepared in terms of slowing climate change. Every country must adapt and prepare for loss and damage from climate change impacts. It is mandatory for the people in every country to be made aware of the climate hazards they may be facing and be better prepared by adapting to and recovering from the inevitable loss and damage they will cause. Climate change must be taken into account in all of our activities. Creating a super infrastructure to prepare for a severe flood might be unaffordable. We must consider how nature might promote resilience and adaptability with every investment.

Limitations and Uncertainties of the Study

A thematic analysis of the challenges in conceptualizing and applying flood resilience has revealed several issues, including concerns about the equity and fairness of the applied approaches, the lack of sufficient data and widely accepted methods, and the uncertainty surrounding shifting risks due to climate change. As this study was conducted based on a secondary source of data, no or limited data availability on the same theme for both cases for undertaking this complex assessment is the study’s major limitation.

Author Contributions

B.M.: conceptualization, methodology, investigation/data collection, data curation, analysis, writing—original draft, writing—review and editing, visualization. S.C.: conceptualization, supervision, project administration, funding acquisition, writing—review and editing. L.W.: data curation, writing—review and editing. S.S.: conceptualization, writing—review and editing. All authors have read and agreed to the published version of the manuscript.

Funding

This research was funded by the National Natural Science Foundation of China (Grant No.: 41661144032), the international partnership program of the Chinese Academy of Sciences “Multifunctional urban green space planning based on transdisciplinary learning” (Grant No.: 132C35KYSB20200007), and the International (Regional) Cooperation and Exchange Program, the National Natural Science Foundation of China (Grant No.: 32261143730).

Data Availability Statement

Not applicable.

Acknowledgments

Deutscher Wetterdienst and Global Precipitation Measurement (GPM) for rainfall data, Copernicus EMS Rapid Mapping EMSR517 for rapid mapping data, NASA for providing MODIS data, ESRI for land use data, and the Resource and Environment Science and Data Center for the shapefile of China and rainfall station data from Henan province.

Conflicts of Interest

The authors declare no conflict of interest.

References

  1. Zhou, T.; Zhang, W.; Zhang, L.; Clark, R.; Qian, C.; Zhang, Q.; Qiu, H.; Jiang, J.; Zhang, X. 2021: A Year of Unprecedented Climate Extremes in Eastern Asia, North America, and Europe. Adv. Atmos. Sci. 2022, 39, 1598–1607. [Google Scholar] [CrossRef]
  2. NOAA. State of the Climate: Monthly Global Climate Report for Annual 2021; NOAA: Washington, DC, USA, 2022.
  3. WMO. State of the Global Climate 2020; WMO: Geneva, Switzerland, 2021; ISBN 9789263112644. [Google Scholar]
  4. CRED. 2021 Disasters in Numbers; CRED: Brussels, Belgium, 2021. [Google Scholar]
  5. GNDAR. Global Natural Disaster Assessment Report 2020. UN Annu. Rep. 2021, 1–80. [Google Scholar]
  6. IPCC. Summary for Policymakers; IPCC: Geneva, Switzerland, 2022.
  7. Xu, K.; Han, Z.; Xu, H.; Bin, L. Rapid Prediction Model for Urban Floods Based on a Light Gradient Boosting Machine Approach and Hydrological–Hydraulic Model. Int. J. Disaster Risk Sci. 2023, 14, 79–97. [Google Scholar] [CrossRef]
  8. Xu, H.; Zhang, X.; Guan, X. Amplification of Flood Risks by the Compound Effects of Precipitation and Storm Tides Under the Nonstationary Scenario in the Coastal City of Haikou, China. Int. J. Disaster Risk Sci. 2022, 13, 602–620. [Google Scholar] [CrossRef]
  9. Pirone, D.; Cimorelli, L.; Del Giudice, G.; Pianese, D. Short-Term Rainfall Forecasting Using Cumulative Precipitation Fields from Station Data: A Probabilistic Machine Learning Approach. J. Hydrol. 2023, 617, 128949. [Google Scholar] [CrossRef]
  10. Cesare Lama, G.F.; Giovannini, M.R.M.; Errico, A.; Mirzaei, S.; Chirico, G.B.; Preti, F. The Impacts of Nature Based Solutions (NBS) on Vegetated Flows’ Dynamics in Urban Areas. In Proceedings of the 2021 IEEE International Workshop on Metrology for Agriculture and Forestry (MetroAgriFor), Trento-Bolzano, Italy, 3–5 November 2021; pp. 58–63. [Google Scholar] [CrossRef]
  11. Cesare Lama, G.F.; Crimaldi, M.; De Vivo, A.; Battista Chirico, G.; Sarghini, F. Eco-Hydrodynamic Characterization of Vegetated Flows Derived by UAV-Based Imagery. In Proceedings of the 2021 IEEE International Workshop on Metrology for Agriculture and Forestry (MetroAgriFor), Trento-Bolzano, Italy, 3–5 November 2021; pp. 273–278. [Google Scholar] [CrossRef]
  12. Shen, Y.; Tahvildari, N.; Morsy, M.M.; Huxley, C.; Chen, T.D.; Goodall, J.L. Dynamic Modeling of Inland Flooding and Storm Surge on Coastal Cities under Climate Change Scenarios: Transportation Infrastructure Impacts in Norfolk, Virginia USA as a Case Study. Geosciences 2022, 12, 224. [Google Scholar] [CrossRef]
  13. Miguez, M.G.; Veról, A.P.; Rezende, O.M.; de Sousa, M.M.; Guimarães, L.F. Flood Resilient Cities. In Disaster Risk Reduction for Resilience; Springer: Cham, Switzerland, 2022. [Google Scholar]
  14. Chan, F.K.S.; Griffiths, J.A.; Higgitt, D.; Xu, S.; Zhu, F.; Tang, Y.T.; Xu, Y.; Thorne, C.R. “Sponge City” in China—A Breakthrough of Planning and Flood Risk Management in the Urban Context. Land Use Policy 2018, 76, 772–778. [Google Scholar] [CrossRef]
  15. Leader, T.; Wallingford, H. Building Flood Resilience Measures; FloodProBE: Deltares, Netherlands, 2012. [Google Scholar]
  16. Peng, X.; Heng, X.; Li, Q.; Li, J.; Yu, K. From Sponge Cities to Sponge Watersheds: Enhancing Flood Resilience in the Sishui River Basin in Zhengzhou, China. Water 2022, 14, 3084. [Google Scholar] [CrossRef]
  17. Di Baldassarre, G.; Montanari, A.; Lins, H.; Koutsoyiannis, D.; Brandimarte, L.; Blöschl, G. Flood Fatalities in Africa: From Diagnosis to Mitigation Flood Fatalities in Africa: From Diagnosis to Mitigation. Geophys. Res. Lett. 2010, 37. [Google Scholar] [CrossRef] [Green Version]
  18. Dicker, S.; Unsworth, S.; Byrnes, R.; Ward, B. Saving Lives and Livelihoods: The Benefits of Investments in Climate Change Adaptation and Resilience; CCCEP: Leeds, UK, 2021. [Google Scholar]
  19. Tazen, F.; Diarra, A.; Kabore, R.F.W.; Ibrahim, B.; Bologo/Traoré, M.; Traoré, K.; Karambiri, H. Trends in Flood Events and Their Relationship to Extreme Rainfall in an Urban Area of Sahelian West Africa: The Case Study of Ouagadougou, Burkina Faso. J. Flood Risk Manag. 2019, 12, e12507. [Google Scholar] [CrossRef] [Green Version]
  20. Ajjur, S.B.; Ghamdi, S.G. Al Exploring Urban Growth–Climate Change–Flood Risk Nexus in Fast Growing Cities. Sci. Rep. 2022, 12, 12265. [Google Scholar] [CrossRef] [PubMed]
  21. Lee, Y.; Brody, S.D. Examining the Impact of Land Use on Flood Losses in Seoul, Korea. Land Use Policy 2018, 70, 500–509. [Google Scholar] [CrossRef]
  22. Lumbroso, D. Flood Risk Management in Africa. J. Flood Risk Manag. 2020, 13. [Google Scholar] [CrossRef]
  23. Wharton, E.; Vu, W.; Iiasa, A.; Practical, C. Making Communities More Flood Resilient: The Role of Cost Benefit Analysis and Other Decision-Support Tools in Disaster Risk Reduction; IASA: Laxenburg, Austria, 2014. [Google Scholar]
  24. Multi-Hazard Mitigation Council. Natural Hazard Mitigation Saves; National Institute of Building Sciences: Washington, DC, USA, 2019. [Google Scholar]
  25. Stefanidis, S.; Alexandridis, V.; Theodoridou, T. Flood Exposure of Residential Areas and Infrastructure in Greece. Hydrology 2022, 9, 145. [Google Scholar] [CrossRef]
  26. Qiang, Y. Flood Exposure of Critical Infrastructures in the United States. Int. J. Disaster Risk Reduct. 2019, 39, 101240. [Google Scholar] [CrossRef]
  27. Kellett, J.; Caravani, A. Financing Disaster Risk Reduction a 20 Year Story of International Aid; WMO: Geneva, Switzerland, 2013. [Google Scholar]
  28. Fisher, L. More than 70 Ways to Show Resilience. Nature 2015, 518, 35. [Google Scholar] [CrossRef] [Green Version]
  29. IPCC. Summary for Policy Makers; IPCC: Geneva, Switzerland, 2014.
  30. World Bank. Building Urban Resilience Main Title Goes Here Two of Main Title; World Bank: Washington, DC, USA, 2019. [Google Scholar]
  31. Mehryar, S.; Surminski, S. Investigating Fl Ood Resilience Perceptions and Supporting Collective Decision-Making through Fuzzy Cognitive Mapping. Sci. Total Environ. 2022, 837, 155854. [Google Scholar] [CrossRef]
  32. Oladokun, V.O.; Montz, B.E. Towards Measuring Resilience of Flood-Prone Communities: A Conceptual Framework. Nat. Hazards Earth Syst. Sci. 2019, 19, 1151–1165. [Google Scholar] [CrossRef] [Green Version]
  33. Hochrainer-Stigler, S.; Velev, S.; Laurien, F.; Campbell, K.; Czajkowski, J.; Keating, A.; Mechler, R. Differences in the Dynamics of Community Disaster Resilience across the Globe. Sci. Rep. 2021, 11, 17625. [Google Scholar] [CrossRef]
  34. Cutter, S.L. Linkages between Vulnerability and Resilience. In In Vulnerability and Resilience to Natural Hazards; Fuchs, S., Thaler, T., Eds.; Cambridge University Press: Cambridge, UK, 2018. [Google Scholar]
  35. Keating, A.; Campbell, K.; Szoenyi, M.; Mcquistan, C.; Nash, D.; Burer, M. Development and Testing of a Community Flood Resilience Measurement Tool. Nat. Hazards Earth Syst. Sci. 2017, 17, 77–101. [Google Scholar] [CrossRef] [Green Version]
  36. Winderl, T. Disaster Resilience Measurements Stocking of Ongoing Efforts in Developing Systems for Measuring Resilience; The United Nations Development Programme: New York, NY, USA, 2014.
  37. Mugume, S.N.; Gomez, D.E.; Fu, G.; Farmani, R.; Butler, D. A Global Analysis Approach for Investigating Structural Resilience in Urban Drainage Systems. Water Res. 2015, 81, 15–26. [Google Scholar] [CrossRef] [PubMed] [Green Version]
  38. Batica, J.; Gourbesville, P. Flood Resilience Index-Methodology and Application How Does Access to This Work Benefit You? Let Us Know; CUNY Academic Works: New York, NY, USA, 2014. [Google Scholar]
  39. Kotzee, I.; Reyers, B. Piloting a Social-Ecological Index for Measuring Flood Resilience: A Composite Index Approach. Ecol. Indic. 2016, 60, 45–53. [Google Scholar] [CrossRef]
  40. Miguez, M.G.; Veról, A.P. A Catchment Scale Integrated Flood Resilience Index to Support Decision Making in Urban Flood Control Design. Environ. Plan. B Urban Anal. City Sci. 2016, 44, 925–946. [Google Scholar] [CrossRef]
  41. Ghasemzadeh, B.; Sadat, Z.; Zarabadi, S.; Majedi, H.; Behzadfar, M. A Framework for Urban Flood Resilience Assessment with Emphasis on Social, Economic and Institutional Dimensions: A Qualitative Study. Sustainability 2021, 13, 7852. [Google Scholar] [CrossRef]
  42. De Bruijn, K.M. Resilience Indicators for Flood Risk Management Systems of Lowland Rivers. Int. J. River Basin Manag. 2004, 2, 199–210. [Google Scholar] [CrossRef]
  43. Wang, P.; Li, Y.; Zhang, Y. An Urban System Perspective on Urban Flood Resilience Using SEM: Evidence from Nanjing City, China. Nat. Hazards 2021, 109, 2575–2599. [Google Scholar] [CrossRef]
  44. Jo, M.; Morais, M. Multisector Risk Identification to Assess Resilience to Flooding. Climate 2021, 9, 73. [Google Scholar]
  45. Barreiro, J.; Lopes, R.; Ferreira, F. Index-Based Approach to Evaluate City Resilience in Flooding Scenarios. Civ. Eng. J. 2021, 7, 197–207. [Google Scholar] [CrossRef]
  46. Johnston, K.A.; Taylor, M.; Ryan, B. Engaging Communities to Prepare for Natural Hazards: A Conceptual Model. Nat. Hazards 2022, 112, 2831–2851. [Google Scholar] [CrossRef]
  47. Suryani, R.; Shiwaku, K.; Munadi, K.; Shaw, R. Enhancing Community Resilience towards Disaster: The Contributing Factors of School-Community Collaborative Network in the Tsunami a Ff Ected Area in Aceh. Int. J. Disaster Risk Reduct. 2018, 29, 3–12. [Google Scholar] [CrossRef]
  48. Cretney, R.M. Beyond Public Meetings: Diverse Forms of Community Led Recovery Following Disaster. Int. J. Disaster Risk Reduct. 2018, 28, 122–130. [Google Scholar] [CrossRef]
  49. Tesema, D.; Birhanu, B.; Tebarek, G.; Megento, L. Community Flood Resilience Assessment Frameworks: A Review. SN Appl. Sci. 2019, 1, 1663. [Google Scholar] [CrossRef] [Green Version]
  50. Dohmen, A.; Szönyi, M.; Gywat, O. Risk Nexus Central European Floods 2013: A Retrospective; Zurich Insurance Company Ltd.: Zurich, Switzerland, 2013. [Google Scholar]
  51. Venkateswaran, K.; MacClune, K.; Keating, A.; Szönyi, M. The PERC Manual. Learning from Disasters to Build Resilience: A Simple Guide to Conducting a Post Event Review; IASA: Laxenburg, Austria, 2015. [Google Scholar]
  52. Keating, A.; Szonyi, M.; Etienne, E.; Ianni, F. Post-Flood Study–User Guide; FRMC: Zurich, Switzerland, 2019. [Google Scholar]
  53. Schaller, N.; National, S.; Foundation, S.; Van Oldenborgh, G.J.; Nederlands, K.; Instituut, M.; Sparrow, S. The Heavy Precipitation Event of May–June 2013 in the Upper Danube and Elbe Basins; American Meteorological Society: Boston, MA, USA, 2014. [Google Scholar]
  54. Srivastava, S. Strengthening Climate Resilience through Better Flood Management. Available online: https://www.unescap.org/blog/strengthening-climate-resilience-through-better-flood-management# (accessed on 12 December 2021).
  55. Kahraman, A.; Kendon, E.J.; Chan, S.C.; Fowler, H.J. Geophysical Research Letters-2021-Kahraman-Quasi-Stationary Intense Rainstorms Spread Across Europe Under Climate (1).Pdf. Geophys. Res. Lett. 2021, 48, e2020GL092361. [Google Scholar]
  56. Warren, C. Europe’s Deadly Floods Leave Scientists Stunned. Available online: https://www.science.org/content/article/europe-s-deadly-floods-leave-scientists-stunned#:~:text=By%202100%2C%20flood%20damage%20on,European%20Commission’s%20Joint%20Research%20Centre (accessed on 28 July 2021).
  57. DWD CDC-Climate Data Center. Available online: https://cdc.dwd.de/portal/ (accessed on 12 February 2023).
  58. Kantamaneni, K.; Li, Q.; Wu, H.; Zhu, M.; Apostolopoulou, A.; Xu, W. Towards a Combined Physical and Social Evaluation of Climate Vulnerability Towards a Combined Physical and Social Evaluation of Climate Vulnerability in Coastal Urban Megacities. Water 2023, 15, 712. [Google Scholar] [CrossRef]
  59. Deng, G.; Chen, H.; Wang, S. Risk Assessment and Prediction of Rainstorm and Flood Disaster Based on Henan Province, China. Math. Probl. Eng. 2022, 2022, 5310920. [Google Scholar] [CrossRef]
  60. Szönyi, M.; Roezer, V.; Deubelli, T.; Ulrich, J.; MacClune, K.; Laurien, F.; Norton, R. PERC Flood Event Review ‘Bernd’; Zurich Insurance Company: Zurich, Switzerland, 2022. [Google Scholar]
  61. Batica, J. Methodology for Flood Resilience Assessment in Urban Environments and Mitigation Strategy Development. Ph.D. Thesis, Université Nice Sophia Antipolis, Nice, France, 2015; p. 229. [Google Scholar]
  62. Thieken, A.H.; Bubeck, P.; Heidenreich, A.; Von Keyserlingk, J.; Dillenardt, L.; Otto, A.; Thieken, A. Performance of the Flood Warning System in Germany in July 2021-Insights from Affected Residents. EGUshpere, 2022; preprint. [Google Scholar] [CrossRef]
  63. Kreienkamp, F.; Philip, S.Y.; Tradowsky, J.S.; Kew, S.F.; Lorenz, P.; Belleflamme, A.; Bettmann, T.; Caluwaerts, S.; Chan, S.C.; Ciavarella, A.; et al. Rapid Attribution of Heavy Rainfall Events Leading to the Severe Flooding in Western Europe during July 2021; WWA: Kansas, MO, USA, 2021. [Google Scholar]
  64. Karlsruhe Institute of Technology Flood Risks Were Clearly Underestimated. Available online: https://www.kit.edu/kit/english/pi_2021_070_flood-risks-were-clearly-underestimated.php (accessed on 4 August 2021).
  65. Copernicus EMS Rapid Mapping EMSR517: Flood in Western Germany. Available online: https://emergency.copernicus.eu/mapping/list-of-components/EMSR517 (accessed on 12 August 2021).
  66. Fekete, A.; Sandholz, S. Here Comes the Flood, but Not Failure? Lessons to Learn after the Heavy Rain and Pluvial Floods in Germany 2021. Water 2021, 13, 3016. [Google Scholar] [CrossRef]
  67. Guha-Sapir, D.; Below, R.H.P. EM-DAT: The CRED/OFDA International Disaster Database. Available online: https://www.emdat.be/ (accessed on 12 December 2021).
  68. He, K.; Yang, Q.; Shen, X.; Anagnostou, E.N. Brief Communication: Western Europe Flood in 2021: Mapping Agriculture Flood Exposure from SAR. Nat. Hazards Earth Syst. Sci. 2021, 22, 2921–2927. [Google Scholar] [CrossRef]
  69. ICEYE. Flood Solutions Historic Floods in Western Europe; ICEYE: Espoo, Finland, 2021. [Google Scholar]
  70. Koks, E.; Van Ginkel, K.; Van Marle, M.; Lemnitzer, A. Brief Communication: Critical Infrastructure Impacts of the 2021 Mid-July Western European Flood Event. Nat. Hazards Earth Syst. Sci. Discuss. 2021, 22, 3831–3838. [Google Scholar] [CrossRef]
  71. The Copernicus Emergency Management Service the Copernicus Emergency Management Service Forecasts, Notifies, and Monitors Devastating Floods in Germany, Netherlands, Belgium and Switzerland. Available online: https://emergency.copernicus.eu/mapping/ems/copernicus-emergency-management-service-forecasts-notifies-and-monitors-devastating-floods (accessed on 20 July 2021).
  72. AON. 2021 Weather, Climate and Catastrophe Insight; AON: London, UK, 2021. [Google Scholar]
  73. Washington Post World Digest: July 22, 2021. Available online: https://www.washingtonpost.com/national/world-digest-july-22-2021/2021/07/22/3316332c-eae3-11eb-8950-d73b3e93ff7f_story.html (accessed on 23 July 2021).
  74. Kohlmann, T. How Germany’s Disaster Management System Works. Available online: https://www.dw.com/en/why-germanys-disaster-management-works-from-the-bottom-to-the-top/a-58571507 (accessed on 22 July 2021).
  75. Gohn, S. Amidst Devastating Floods in Germany, Displaced U.S. Military Families Can Lean on USO. Available online: https://kaiserslautern.uso.org/stories/18 (accessed on 28 July 2021).
  76. Casey, R. The Town Has Been Destroyed’: Germany Deals with Flood Aftermath. Available online: https://www.aljazeera.com/news/2021/7/17/this-is-climate-change-germany-deals-with-flood-aftermath (accessed on 18 July 2021).
  77. Oltermann, P. At Least 58 Dead in Germany as Heavy Rains Bring Catastrophic Flooding. Available online: https://www.theguardian.com/world/2021/jul/14/firefighter-drowns-and-army-deployed-amid-severe-flooding-in-germany (accessed on 15 July 2021).
  78. APNews German Cabinet Approves Some $472 Million in First Flood Aid. Available online: https://apnews.com/article/europe-business-government-and-politics-environment-and-nature-floods-a3f662c153903121eb62183427b8d460 (accessed on 22 July 2021).
  79. All News Press after a Flood Disaster: The Federal Government Decides to Provide Emergency Aid. Available online: https://allnewspress.com/after-a-flood-disaster-the-federal-government-decides-to-provide-emergency-aid/ (accessed on 22 July 2021).
  80. Teller Report Damage Balance Rhineland-Palatinate: “A Colossal, Apocalyptic Dimension”. Available online: https://www.tellerreport.com/news/2021-07-22-damage-balance-rhineland-palatinate--%22a-colossal--apocalyptic-dimension%22.H1zbA8eDA_.html (accessed on 22 July 2021).
  81. Federal Ministry of Finance Federal Government and Länder Support Flood-Hit Regions. Available online: https://www.bundesfinanzministerium.de/Content/EN/Pressemitteilungen/2021/2021-08-18-flood-relief-fund.html (accessed on 20 August 2021).
  82. State Council Disaster Investigation Team. Investigation Report on the “7–20” Extreme Rainfall Event in Zhengzhou, Henan Province; Ministry of Emergency Management: Beijing, China, 2022. (In Chinese)
  83. Hun-wei, J.L.; Xiaotao, C.; Qinglan, L. IAHR Comments on 2021.7.20 Flood in Zhengzhou, China. Available online: https://www.iahr.org/index/detail/479 (accessed on 24 July 2021).
  84. Wang, J.; Wah Yu, C.; Cao, S.J. Urban Development in the Context of Extreme Flooding Events. Indoor Built Environ. 2022, 31, 3–6. [Google Scholar] [CrossRef]
  85. Fan, J.; Hambly, B.D.; Sun, Y.; Bao, S. Simultaneous Compound Disasters from COVID-19 and Catastrophic Flooding. J. Flood Risk Manag. 2021, 15, e12779. [Google Scholar] [CrossRef]
  86. Liang, X.; Xia, R.; Bao, X.; Zhang, X.; Wang, X.; Su, A.; Fu, J.; Li, H.; Wu, C.; Yu, M.; et al. Preliminary Investigation on the Extreme Rainfall Event during July 2021 in Henan Province and Its Multi-Scale Processes. Chinese Sci. Bull. 2022, 67, 997–1011. [Google Scholar] [CrossRef]
  87. NASA Flooding in Central China. Available online: https://earthobservatory.nasa.gov/images/148623/flooding-in-central-china (accessed on 1 September 2021).
  88. Tao, Z.; Han, L. Emergency Response, Influence and Lessons in the 2021 Compound Disaster in Henan Province of China. Int. J. Environ. Res. Public Health 2022, 19, 488. [Google Scholar] [CrossRef] [PubMed]
  89. Dong, B.; Xia, J.; Li, Q.; Zhou, M. Risk Assessment for People and Vehicles in an Extreme Urban Flood: Case Study of the “7.20” Flood Event in Zhengzhou, China. Int. J. Disaster Risk Reduct. 2022, 80, 103205. [Google Scholar] [CrossRef]
  90. U-INSPIRE Alliance 7.20 Catastrophic Flood of Henan Province. Available online: https://uinspirealliance.org/2021/08/23/u-inspire-huaxias-response-to-the-7-20-catastrophic-flood-of-henan-province-china/ (accessed on 1 September 2021).
  91. Chou, C. Joe Tsai Foundation Donates US$3.1 Million to Help Flooded Henan Schools Rebuild. Available online: https://www.alizila.com/joe-tsai-foundation/?fbclid=IwAR1vZD55CLOi40kqDBtKjMeh4aBMqrLp0x8AfxLy4VTF4Yw0jwlA-IBMW9s (accessed on 18 August 2021).
  92. BBC China Floods: 12 Dead in Zhengzhou Train and Thousands Evacuated in Henan. Available online: https://www.bbc.com/news/world-asia-china-57861067 (accessed on 22 July 2021).
  93. China Development Brief Charities Form Partnerships to Rebuild Flood-Damaged Henan. Available online: https://chinadevelopmentbrief.org/reports/charities-form-partnerships-to-rebuild-flood-damaged-henan/ (accessed on 25 August 2021).
  94. Xinhua China Focus: Race to Evacuate Patients as Hospitals Flooded by Rainstorms. Available online: http://www.xinhuanet.com/english/2021-07/22/c_1310078104.htm (accessed on 23 July 2021).
  95. Xinhua Efforts Pour in to Fix Damaged Infrastructure in Rain-Ravaged Henan. Available online: http://www.xinhuanet.com/english/2021-07/23/c_1310080763.htm (accessed on 25 July 2021).
  96. Global Times Highly Digitalized Chinese Cities Withstand Test of Rains, Floods as Telecom Failures Hamper Rescue. Available online: https://www.globaltimes.cn/page/202107/1230073.shtml (accessed on 8 August 2021).
  97. Global Times Henan Officials Vow to Fully Restore Services in Areas Hit by Flooding. Available online: https://www.globaltimes.cn/page/202108/1231021.shtml (accessed on 10 August 2021).
  98. GuyCarpenter Post Event Report Henan Flood July 17–21. Available online: https://www.guycarp.com/insights/2021/07/post-event-report-henan-flood-july-17-21.html (accessed on 28 July 2021).
  99. Xiaotao, C.; Jindong, C. Challenges of extreme rainstorm events and countermeasures in China. In Hydrolink; International Association for HydroEnvironment Engineering and Research (IAHR): Madrid, Spain, 2021; pp. 114–117. [Google Scholar]
  100. ChinaDaily. China Releases Post-Disaster Reconstruction Plan for Flood-Hit Henan. Available online: https://www.chinadaily.com.cn/a/202203/15/WS622ff58da310cdd39bc8c9e5.html (accessed on 15 March 2022).
  101. Ludwig, P.; Ehmele, F.; Franca, M.J.; Mohr, S.; Caldas-Alvarez, A.; Daniell, J.E.; Ehret, U.; Feldmann, H.; Hundhausen, M.; Knippertz, P.; et al. A Multi-Disciplinary Analysis of the Exceptional Flood Event of July 2021 in Central Europe. Part 2: Historical Context and Relation to Climate Change. Nat. Hazards Earth Syst. Sci. Discuss. 2022, 1–42. [Google Scholar]
  102. Muller, N.; King, N. After the Flood: Rebuild or Relocate? Available online: https://www.dw.com/en/climate-change-flooding-germany-dernau-rebuilding-homes/a-59640272 (accessed on 16 November 2021).
  103. Ye, Q.; Dadi, Z.; Xiaofan, Z.; Huimin, L.; Yufei, W.; Qin, C.; Bingyan, W. 2021 Enchancing Climate Risk Governance in China; Science Press: Beijing, China, 2021. [Google Scholar]
  104. Lehmkuhl, F.; Schüttrumpf, H.; Schwarzbauer, J.; Brüll, C.; Dietze, M.; Letmathe, P.; Völker, C.; Hollert, H. Assessment of the 2021 Summer Flood in Central Europe. Environ. Sci. Eur. 2022, 34, 107. [Google Scholar] [CrossRef]
  105. Yeğin, M. Flood Resilience Assessment and Possible Solutions to Decrease Flood Vulnerability of a City. Available online: https://mcr2030.undrr.org/news/flood-resilience-assessment-and-possible-solutions-decrease-flood-vulnerability-city (accessed on 21 February 2023).
  106. Schelfaut, K.; Pannemans, B.; van der Craats, I.; Krywkow, J.; Mysiak, J.; Cools, J. Bringing Flood Resilience into Practice: The FREEMAN Project. Environ. Sci. Policy 2011, 14, 825–833. [Google Scholar] [CrossRef]
  107. Golnaraghi, M.; Surminski, S.; Kousky, C. Building Flood Resilience in a Changing Climate; The Geneva Association: Zurich, Switzerland, 2020. [Google Scholar]
  108. Rubinato, M.; Nichols, A.; Peng, Y.; Zhang, J.; Lashford, C.; Cai, Y.; Lin, P.; Tait, S. Urban and River Flooding: Comparison of Flood Risk Management Approaches in the UK and China and an Assessment of Future Knowledge Needs. Water Sci. Eng. 2019, 12, 274–283. [Google Scholar] [CrossRef]
  109. World Bank; Water Partnership Program. China Country Water Resources Partnership Startegy (2013–2020); World Bank: Washington, DC, USA, 2020. [Google Scholar]
  110. Pandey, C.L.; Joseph, J.; Deshar, R.; Niraula, P. Transboundary Flood Resilience: Insights from Narayani and Mahakali Basins. Int. J. Disaster Risk Reduct. 2023, 86, 103535. [Google Scholar] [CrossRef]
  111. Zhang, H.; Yang, J.; Li, L.; Shen, D.; Wei, G.; Dong, S. Measuring the Resilience to Floods: A Comparative Analysis of Key Flood Control Cities in China. Int. J. Disaster Risk Reduct. 2021, 59, 102248. [Google Scholar] [CrossRef]
  112. Gu, D.; Dillard, M.; Gerst, M.; Loerzel, J. Validating Commonly Used Indicators for Community Resilience Measurement. Nat. Hazards Rev. 2023, 24, 04023008. [Google Scholar] [CrossRef]
  113. Laurien, F.; Martin, J.G.C.; Mehryar, S. Climate and Disaster Resilience Measurement: Persistent Gaps in Multiple Hazards, Methods, and Practicability. Clim. Risk Manag. 2022, 37, 100443. [Google Scholar] [CrossRef]
  114. Upton, J.; Constenla-Villoslada, S.; Barrett, C.B. Caveat Utilitor: A Comparative Assessment of Resilience Measurement Approaches. J. Dev. Econ. 2022, 157, 102873. [Google Scholar] [CrossRef]
  115. Jones, L. Resilience Isn’t the Same for All: Comparing Subjective and Objective Approaches to Resilience Measurement. Wiley Interdiscip. Rev. Clim. Chang. 2019, 10, e552. [Google Scholar] [CrossRef] [Green Version]
Figure 1. Land use map of western Germany.
Land 12 00625 g001
Figure 2. Land use map of Henan, China.
Land 12 00625 g002
Figure 3. Flood inundation in western Germany. Source: [65].
Land 12 00625 g003
Figure 4. 24 h rainfall on 14 July 2021 in most affected states in Germany. Source: [57]).
Land 12 00625 g004
Figure 5. Erftstadt flood delineation. Source: [65].
Land 12 00625 g005
Figure 6. Ahr river in Insul, Germany, on 15 July after heavy rainfall (Thomas Frey/Picture Alliance/Getty Images).
Land 12 00625 g006
Figure 7. Regional train sitting in flood waters at the local station in Kordel, Germany, on 15 July 2021 (Sebastian Schmitt/dpa via AP).
Land 12 00625 g007
Figure 8. Precipitation in Henan province on 17–23 July (Global Precipitation Measurement (GPM)-derived).
Land 12 00625 g008
Figure 9. Flooding captured by the Moderate Resolution Imaging Spectroradiometer (MODIS) on 26 July 2021, compared with 20 July 2020 (the vegetation is bright green and the water is dark blue). [87]. 26 July 2021 (a); 20 July 2020 (b).
Land 12 00625 g009
Figure 10. A damaged bridge following heavy rains that caused severe flooding in Gongyi in China’s central Henan province on 21 July 2021 (STR/AFP/Getty Images).
Land 12 00625 g010
Figure 11. Cars at the entrance of a tunnel after flooding in Zhengzhou city, Henan, on 22 July 2021. (Noel Celis/AFP).
Land 12 00625 g011
Figure 12. Overview of time required to restore essential services.
Land 12 00625 g012
Table 1. Precipitation by year in Germany (German Weather Service, DWD) [57].
YearAmount of Precipitation per Year (mm)
2013778.7
2014727.1
2015701.3
2016733.1
2017858.7
2018586.3
2019735.0
2020704.9
2021801.1
2022669.1
Table 2. Historical rainstorms and precipitation in Henan province [59].
TimeCityMax Accumulated Rainfall (mm)
28 July–6 August 1996Xinyang Zhumadian438
25 June–26 June 2005Kaifeng Zhumadian496
2 August–3 August 2007Zhengzhou Nanyang374
22 July–23 July 2008Nanyang542
18 July–20 August 2010Zhengzhou Luoyang596
19 August–20 August 2012Zhengzhou295
18 July–20 July 2016Anyang732
16 July–20 July 2021Zhengzhou617
Table 3. Ex post outcome measures showing the variable types and themes.
SnOutcome MeasureVariable TypeTheme
1Death and injury due to floodingDirect impactLife and health
2Building losses and damageDirect impactAssets and livelihoods
3Health care provisionIndirect impactLife and health
4Education provisionIndirect impactEducation
5Communications infrastructureIndirect impactTransport and communications
6Road and transportation infrastructureIndirect impactTransport and communications
7Drinking waterIndirect impactWater
8ElectricityIndirect impactEnergy
9Early warning system functionActionGovernance
10External flood assistanceActionGovernance
11InsuranceActionAssets and livelihoods
12Flood frequency and severityHazard trait
13The number of people affectedHazard trait
14Flood durationHazard trait
Table 4. Post-flood resilience assessment grading based on post-flood study—User guide [52].
Grading Criteria
SnOutcome MeasureABCD
1Death and injury due to floodingDuring the flooding, maximum possible prevention of fatalities and injuries was achievedSome actions were taken to prevent deaths and serious injuries worked reasonably wellSome actions were taken to prevent fatalities and serious injuries; however, there is room for improvementNo actions were taken to prevent deaths and serious injuries
2Building losses and damage0% of houses and business premises damaged and 80% of all damage is expected to be repaired within three monthsLess than 10% of houses and business premises were damaged and 80% of all damage is expected to be repaired within six monthsLess than 40% of houses and business premises were damaged and 80% of all damage is expected to be repaired within 12 monthsMore than 40% of houses and business were damaged and/or 80% of all damage is expected to take longer than 12 months to repair
3Healthcare provisionWithin three months, the affected community had access to healthcare servicesWithin three months, the community had access to healthcare services that met their needs, with minor disruptionsWithin three months, the community had limited access to healthcare services that met their needs, with major disruptionsWithin three months, the community had little or no healthcare services, with major disruptions
4Communication infrastructureCommunication service remained accessible to allLimited interruptions occurred; however, did not undermine the overall ability to communicate internally and externallyCommunication means were interrupted, restricting the ability to communicate internally and externallyCommunication means were severely interrupted, undermining the functionality to communicate internally and externally
5Road and transportation infrastructureTransportation means remained functional, reliable, and accessible after floodsLimited interruptions occurred; however, they did not undermine the overall accessibility of the main areasTransportation means were hampered, restricting access; however, they were repaired or substituted quickly enoughTransportation links were hampered such that the community was cut off
6Drinking waterNo negative impacts on
access to drinking water
The flood had no negative impacts on the community’s access to drinking water to meet their needsThe flood negatively impacted the community’s access to safe water, which was restored in less than one monthThe flood had negative impacts on the community’s access to safe water, which took longer than one month to be restored
7Electricity and gas supplyNo negative impacts on
electricity and fuel supply systems
Negative impacts on energy and gas supply systems; however, these were repaired or substituted quicklySevere negative impacts on energy and gas supply systems, but alternative, ad hoc supplies provided to meet basic needsSevere negative impacts on energy and gas supply systems, severely hampering ability to meet their basic needs
8Early warning system (EWS) functionEWS functioned wellEWS functioned reasonably well, although some improvements could be made to ensure all receive, understand, and trust the warningEWS was there; however, it functioned poorly. It was only received by some, or was not understood, or was not trusted, or came too late to take actionEWS was present, but did not function at all
9External flood assistanceAssistance for response and recovery was accessed by those who needed itAssistance for response and recovery was accessed by most who needed itLimited assistance for response or recovery was accessed by a small proportion of the communityNo external assistance for response or recovery was accessed by the community
10InsuranceMore than 80% of affected households and business held flood insurance that covered their damageMore than 50% of affected households and business held flood insurance that covered their damageMore than 20% of affected households and business held flood insurance that covered their damageLess than 20% of affected households and businesses held flood insurance that covered their damage
Table 5. Availability levels of essential service and action variables.
Post-Flood Resilience Assessment GradingLevel (re, ra)
A4
B3
C2
D1
Table 6. Weight for FRI.
Weight wiDescription
1, 2Very low to low importance
3Medium importance
4, 5Medium-high to high importance
Table 7. Weights for essential services and action variable availability.
Essential ServicesWeightsAction VariablesWeights
Drinking water5External flood assistance5
Healthcare4Insurance4
Communication3Early warning system3
Electricity3
Roads3
Table 8. Scale for flood resilience index.
ScaleDescription
Very low
0–2
The activities are not clear and coherent in overall flood risk management (5R). Awareness is very low on the issues and motivation to address them. Interventions have a short-term character. Actions limited to crisis response.
Low
2–3
Awareness is low on the issues, and motivation to address them exist. The capacity building of human resources remains limited. The capacity to act is improved and substantial. Interventions are more numerous and long-term. There is development and implementation of solutions.
Medium
3–4
Integration and implementation of solutions is higher. Interventions are extensive, covering all main aspects of the ‘problem’, and they are linked within a coherent long-term strategy.
High
4–5
A ‘culture of safety’ exists among all stakeholders, where the resilience concept is embedded in all relevant policies, planning, practice, attitudes, and behavior.
Table 9. Daily precipitation sums at selected measurement gauges from 13 July 2021 and 14 July 2021 [57].
RegionPrecipitation (mm)Precipitation (mm)Accumulated Rainfall (mm)
13 July 202114 July 2021
Cologne-Stammheim11.6153.5165.1
Wipperfürth-Gardeweg53.1111.8164.9
Kall-Sistig16.5144.8161.3
Wuppertal-Buchenhofen6490.8154.8
Aachen-Orsbach5598.7153.7
Hückeswagen (Bevertalsperre)50.5101.1151.6
Gevelsberg-Oberbröking71.178.9150
Lüdenscheid31.6114.4146
Simmerath (Kalltalsperre)49.993.5143.4
Schleiden-Morsbach36.5102.7139.2
Schneifelforsthaus13.5124.1137.6
Table 10. Impact of 14 July 2021 flood on Erftstadt.
EMSR517 AOI: 07 Erftstadt Delineation
Consequences within the AOIDestroyedDamagedPossibly Damaged *Total Affected **Total in AOI
Flooded areaha 15.9
Landslideha 37.7
Flood traceha 1055.3
Estimated population 498436,078
Built-upNo.1025171717521752
Transportationkm0.51.752.454.6349.6
Facilitiesha0.04.410.014.414.4
Land usehaNANANA1105.35112.5
* Presence of damage proxies and proximity with destroyed/damaged asset. ** Sum of Destroyed, Damaged, and Possibly damaged.
Table 12. Hazard traits and impacts of flood.
SnOutcome MeasureWestern GermanyHenan, China
1Flood duration12 to 15 July17 to 23 July
2Flood frequency and severity500-year return period1000-year return period
3Death due to flooding205 people lost their life398 people lost their lives
4Number of people affectedMore than 40,000 people in Ahr valley and 65,000 people in RLP14.786 million people
5Building losses and damage37,662 building impacted by floods53,535 homes sustained significant damage, and 35,325 homes collapsed.
6Economic lossesEUR 33 billion (USD 40 bn)CNY 120 billion Yuan (USD 18.9 billion)
7External flood assistanceEUR 30 billion from the federal government (USD 35 billion)Emergency disaster relief funds of CNY 8.271 billion (USD 1.27 billion)
8Insurance claimed250,000 claims552,000 claims
Table 13. Post-flood resilience assessment grading [52].
SnOutcome MeasureGrading
Western GermanyHenan, China
1Death and injury due to floodingCC
2Building losses and damageCC
3Healthcare provisionAA
4Communications infrastructureCC
5Road and transportation infrastructureDC
6Drinking waterDC
7ElectricityCB
8Early warning system functionCC
9External flood assistanceBB
10InsuranceCD
Table 14. Calculation of Flood Resilience Index (FRI) based on post-flood resilience assessment grading.
SnOutcome MeasureWestern GermanyHenan, ChinaWeight (wi)
Level (re, ra)Level (re, ra)
1Healthcare provision444
2Communications infrastructure223
3Road and transportation infrastructure123
4Drinking water125
5Electricity233
6External flood assistance335
7Insurance214
8Early warning system function223
F R I = { i = 1 5 r e w i + i = 1 3 r a w i } i = 1 8 w i 2.162.430
Disclaimer/Publisher’s Note: The statements, opinions and data contained in all publications are solely those of the individual author(s) and contributor(s) and not of MDPI and/or the editor(s). MDPI and/or the editor(s) disclaim responsibility for any injury to people or property resulting from any ideas, methods, instructions or products referred to in the content.

