Article

Physical Model Test on the Interface of Loess Fill Slope

1
Department of Geological Engineering, Chang’an University, Xi’an 710054, China
2
Key Laboratory of Western China′s Mineral Resources and Geological Engineering, Ministry of Education, Chang′an University, Xi′an 710054, China
*
Author to whom correspondence should be addressed.
Land 2022, 11(8), 1372; https://doi.org/10.3390/land11081372
Submission received: 5 July 2022 / Revised: 11 August 2022 / Accepted: 16 August 2022 / Published: 22 August 2022

Abstract

:
The interface between the filling slope and the original slope is inevitable in the process of building a city in the loess area, which will affect the deformation and stability of the filling slope. In this paper, the loess fill slope of mountain excavation and city construction project in Yan’an City, China, is taken as the research object, and, based on field investigation and sampling, the effect of Loess Fill Slope Interface (LFSI) under rainfall is revealed by physical model test. The test samples were taken from a Loess Fill in Qilipu community, Yan’an, and three layers of sensors were arranged at the left and right interfaces of the original slope and the filled slope to monitor the water content, pore water pressure and deformation and failure characteristics during the experiment. The results show that ILFS is a rainfall dominant seepage channel, and the infiltration of rainfall along the interface lags behind. In addition, the variation laws of water content and pore water pressure at the interface between fill slope and original slope under rainfall are obtained. Finally, the failure process of loess fill slope under rainfall is summarized: local mud flow failure at the toe of the slope → erosion in the middle of the slope → crack initiation on the shoulder of the slope → local slip on the slope → crack propagation on the shoulder of the slope → shallow slip on the shoulder of the slope, and the instability mechanism of loess fill slope under rainfall is further revealed. The research results can provide theoretical and experimental reference for the protection of fill slopes in loess areas.

1. Introduction

Large-scale mountain excavation and city construction project in the Loess Plateau of China not only brings great opportunities for development, but also risks of slope disasters and safety hazards [1,2]. Loess is loose in texture and easily softened by water [3]. Rainfall is a common source of surface water, which may infiltrate along the interface between loess fill slope and original slope, affecting the stability of loess fill slope in mountain excavation and city construction project [4,5], triggering slip and instability (Figure 1). Filling body is the main part of city building project, and is the most important part of the whole project; its strength directly affects the success of the whole project. Therefore, the stability of filling slope seriously affects the safety construction and operation of the project, and it is more important to study the interface effect and instability mechanism between fill slope and original slope under rainfall [6].
For the filling slope, predecessors have done a lot of research. Day [7] studied the filled slope and concluded that the slope was unstable due to the loading of the top of the slope and the shallow slope was not cleared in time. The damaged slope can be repaired by removing the sliding soil and building a retaining wall. Cheuk et al. [8] discussed the characteristics of soil nailing in fill slope by numerical simulation. The results show that the soil nailing structure can reduce the deformation of the loose fill slope caused by rainfall infiltration, so as to maintain the stability of the slope. Zhang [9] carried out the centrifugal model test of loess high fill embankment to study the development process and distribution of embankment settlement. The results show that the settlement in the middle of the embankment is greater than that of the shoulder, and the stability of the embankment slope will be significantly reduced when the slope rate is too large or the construction speed is too fast. Duan et al. [10] took the high fill slope as an example, the deformation and stability were analyzed by finite element method and limit equilibrium method, and compared with the monitoring data in construction. It was found that the stress and displacement results calculated by finite element method were in good agreement with the field monitoring data, indicating that the combination of finite element calculation and monitoring analysis can guide the construction and reinforcement of high fill slope. Zhao et al. [11] divided the rainfall infiltration process of the newly filled slope into three stages: free infiltration, scouring infiltration and stable infiltration. During rainfall, the slope top is mainly vertical expansion and contraction deformation, while the slope surface is mainly lateral free surface displacement. Wang et al. [12] combined the relative displacement sensing technology and GSM technology to monitor the fill slope near an airport, and the monitoring results can be fed back to the monitoring station in real time, which successfully warned the collapse of the monitoring point. The interface between the original slope and the fill slope will inevitably be generated in the process of mountain excavation and city construction project, and sliding failure may occur due to the different strength properties of the soil on both sides. Through indoor physical model tests, Chang et al. [13] monitored and analyzed the hydromechanical parameters of the loess fill slope, simulated the failure mode of the loess fill slope, and proposed engineering measures to prevent and control the instability of the loess fill slope.
Rainfall can induce slope failure [14,15,16], and more attention should be paid to the effect of rainfall on loess filled slope. Through a series of laboratory slope failure tests, Tohari et al. [17] recorded the hydrological response of the model slope to the saturation process by using the volumetric soil moisture sensor, and proposed the concept of slope failure prediction method induced by rainfall. Saadatkhah et al. [18] used the instantaneous rainfall infiltration and grid-based regional slope stability analysis model, combined with spatial rainfall distribution model, found that local daily rainfall is not the only factor affecting slope stability, and long-term early rainfall may play a certain role in the formation of slope failure mechanism. Hakro [19] believed that the failure of a slope is caused by the increase of water content and pore pressure through indoor rainfall model test, and the pore pressure will increase sharply in the failure process. Gallage et al. [20] studied the influence of slope inclination on slope stability by artificial rainfall test. The results show that the slope is more prone to sudden collapse with the increase of slope angle in the process of rainfall. Model test is an important means to study the deformation and failure mechanism of slope affected by rainfall [21]. Therefore, a physical model test can be carried out on loess filled slope.
In summary, previous scholars have studied the deformation and failure process, instability mechanism, seepage field and stability of fill slope by using physical model test, field test, field monitoring, numerical simulation or a combination of multiple methods, and achieved a series of important results. However, there is a little research on the interface effect between the loess fill slope and the original slope, and the research on the variation of water content and pore pressure at the loess filling interface and the stability of the slope under rainfall conditions is not deep enough. In this paper, the variation of hydrological parameters of original slope and fill slope caused by rainfall infiltration and some understandings of the interface effect of loess fill slope are obtained by physical model test. The deformation characteristics and failure process of loess fill slope caused by rainfall are also summarized. The research results can provide reference for the deformation and stability of fill slope in mountain excavation and city construction project.

2. Experimental Design

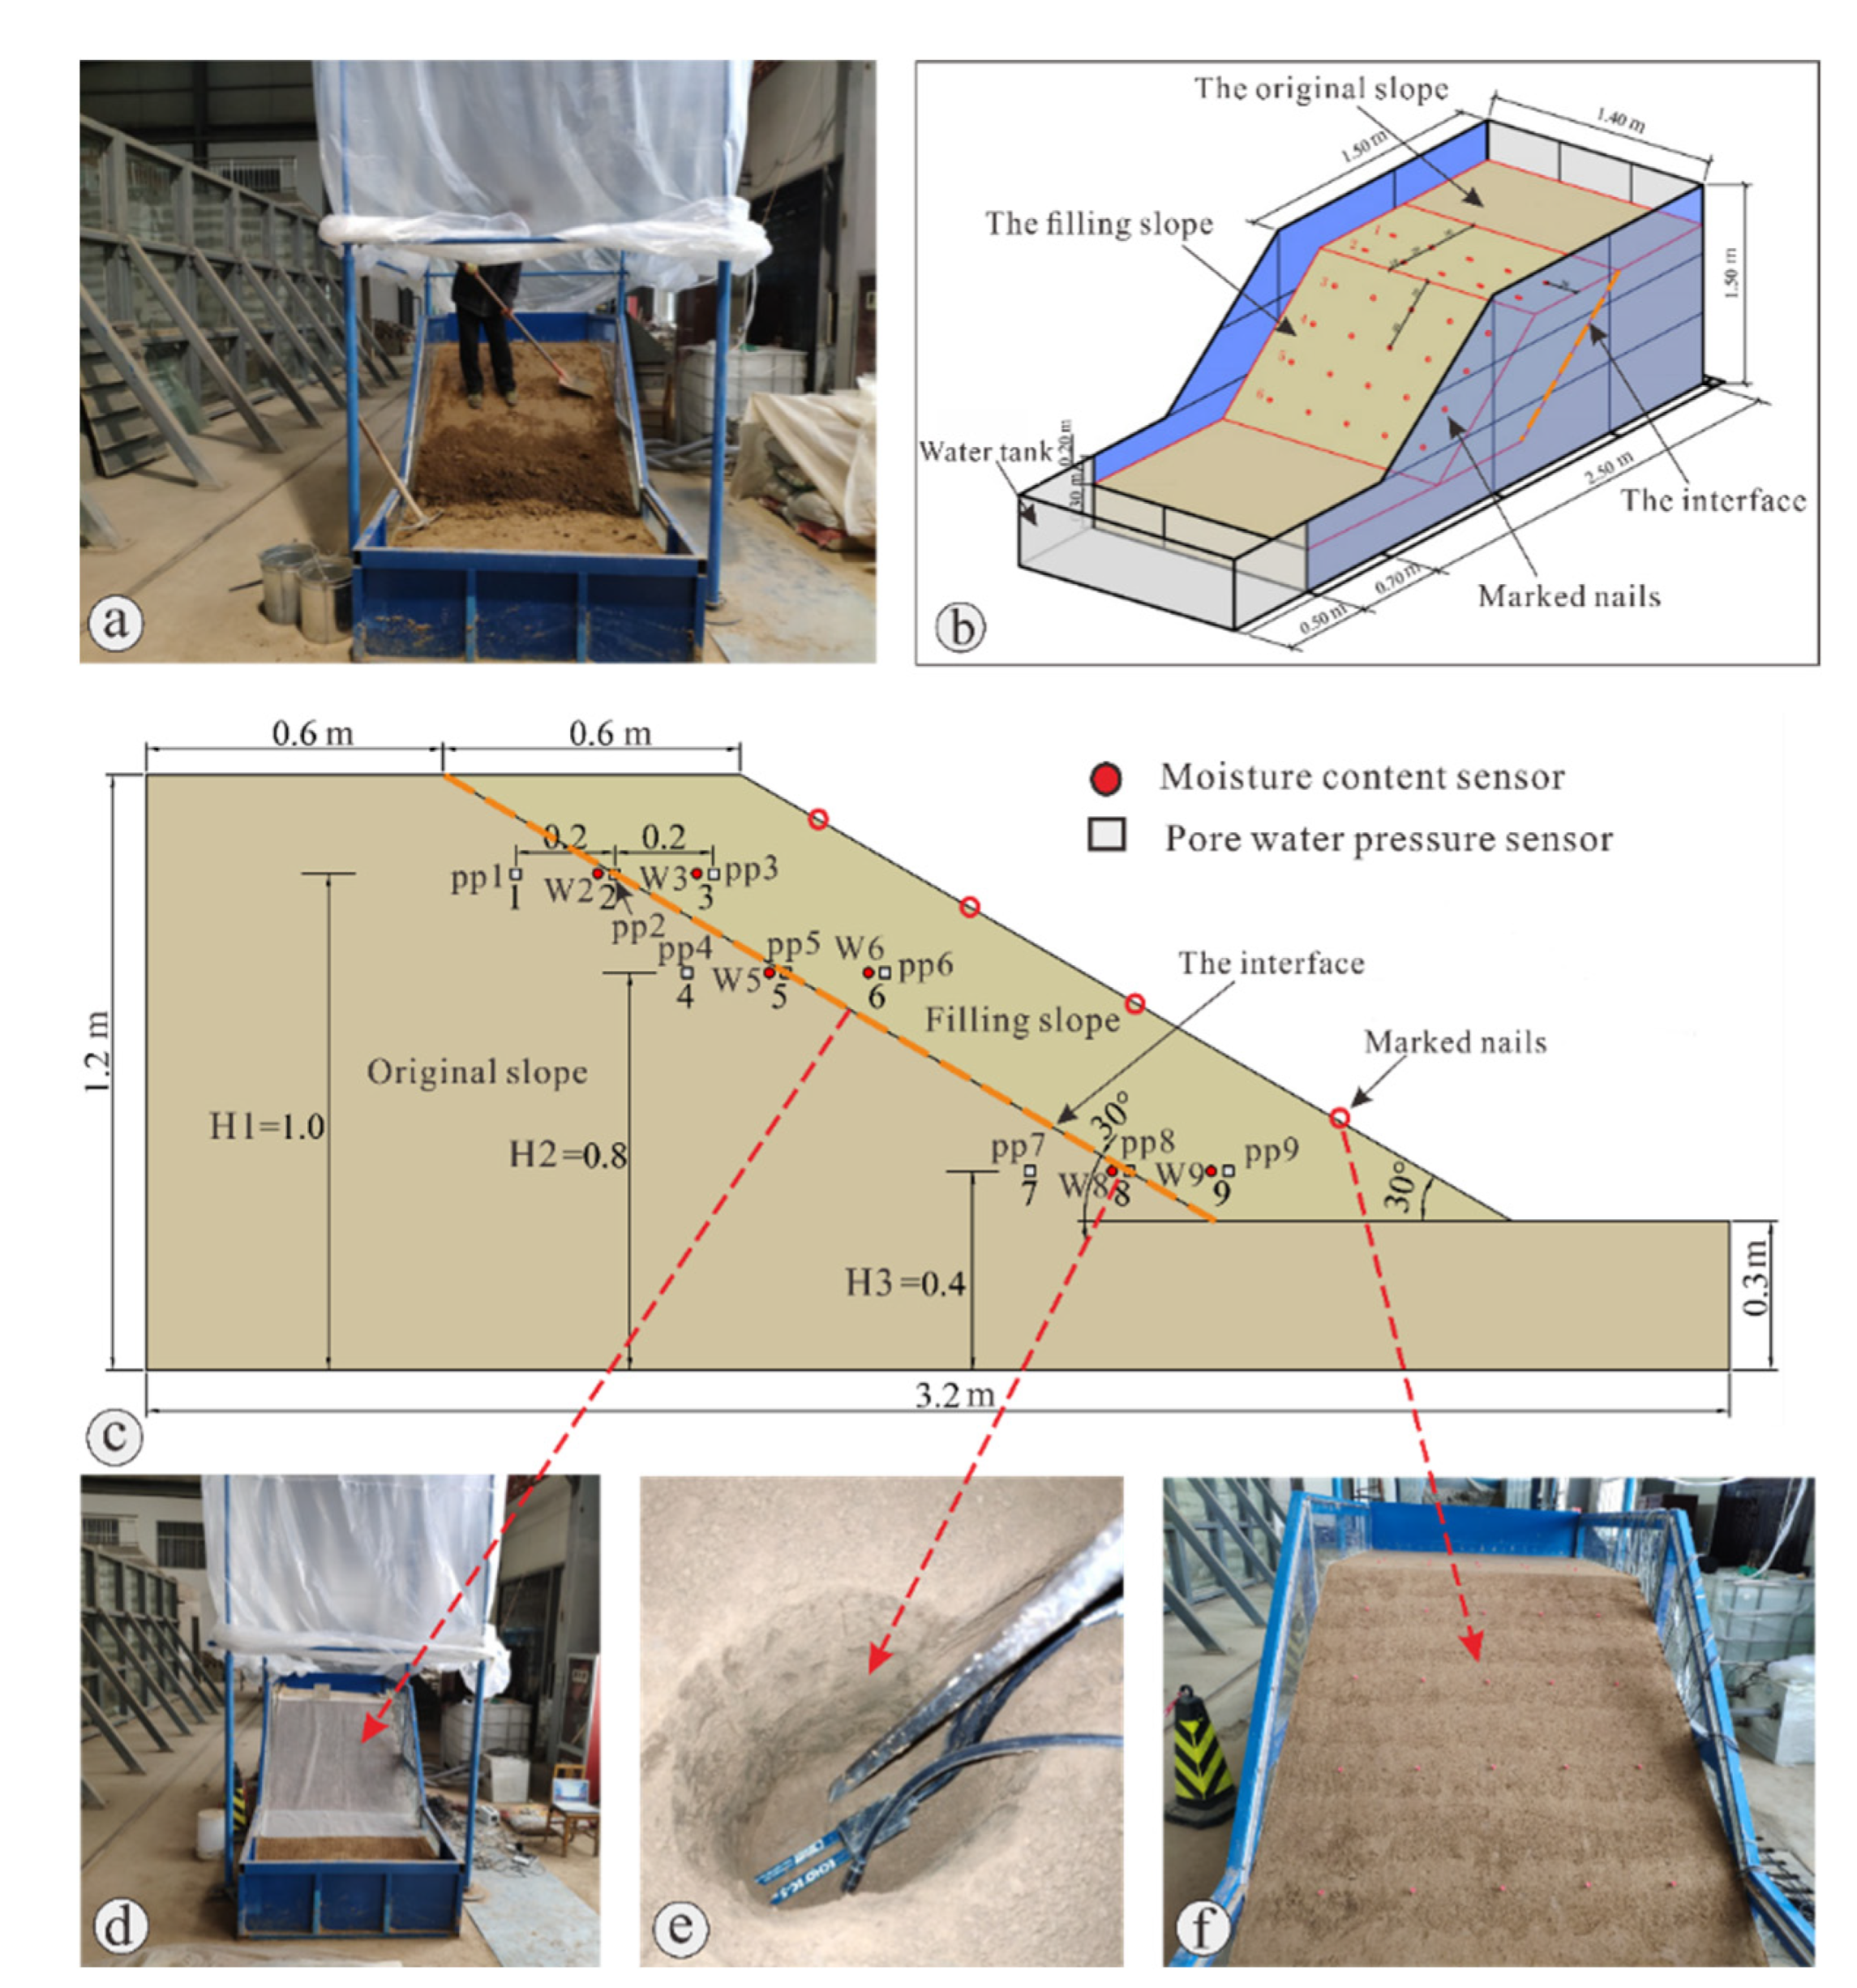
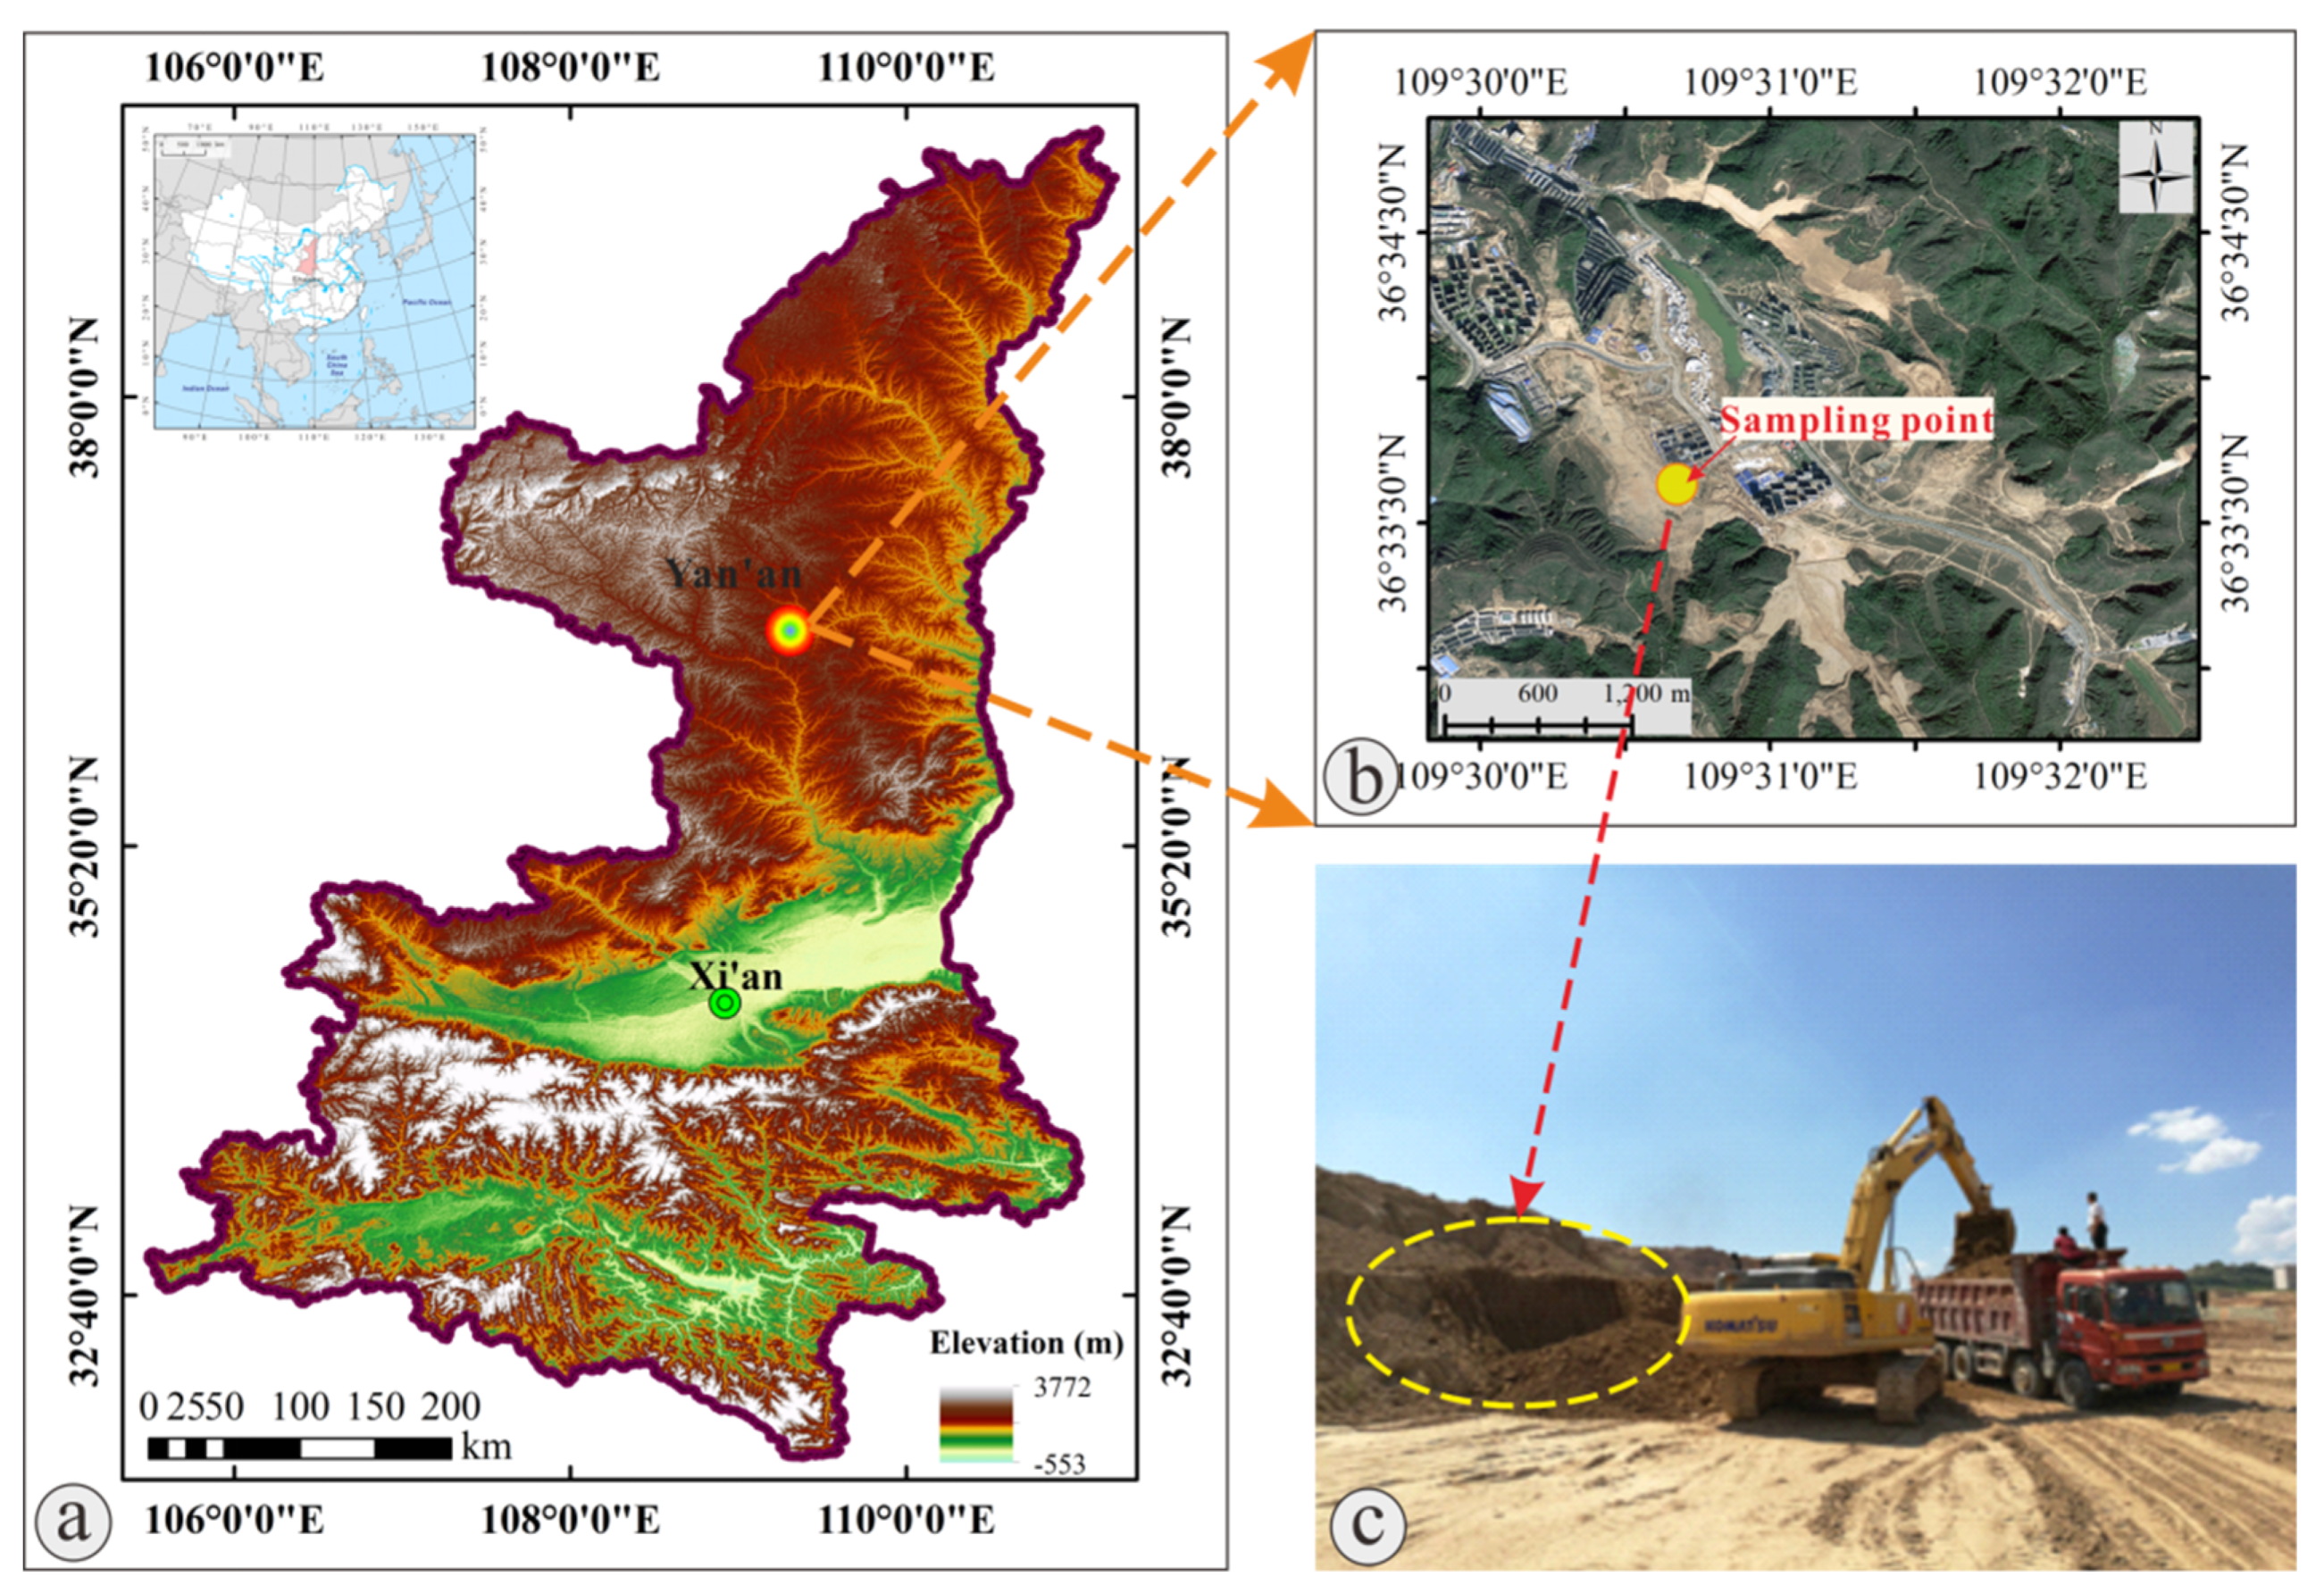
2.1. Experimental Flume

A rigid model box with transparent organic glass on both sides is selected for physical model test, and the front end is a water tank (Figure 2a,b). The size of the model box is 3.2 m × 1.4 m × 1.5 m and the size of the water tank is 1.4 m × 0.5 m × 0.3 m.

2.2. Instrumentation

The experiment mainly includes rainfall device and sensor monitoring equipment. The rainfall device is mainly composed of water pipeline, water tank, water pump, rainfall sprinkler, portable control center and rainfall meter. In order to ensure the uniformity of rainfall, the rainfall height was designed to be 6 m according to the top area and height of the model. In the control system interface, the continuous change of rainfall intensity can be realized by adjusting the opening degree of 0–150 mm/h, and the specific rainfall intensity value can be obtained by connecting the rain gauge with the control system. The sensors are pore water pressure sensor and moisture content sensor. The range of pore water pressure sensor is −20–20 kpa, the output voltage range is 0–5 v, and the acquisition frequency can reach 1 Hz, that is, 1 s can collect a datum. The moisture content sensor can collect one datum in one minute, and the mass moisture content can be obtained by dividing the corresponding dry density.

2.3. Materials and Methods

The test samples were taken from a Loess Fill in Qilipu community, Yan’an, Shaanxi, China (Figure 3), and the retrieved soil samples were screened for 5 mm to remove large particles and impurities. According to the actual situation, the dry density of the original slope in the model test is 1.63 g/cm3, the water content is 13.5%, and the natural gravity (the natural gravity of soil refers to the weight of soil under the condition of natural moisture content, which is equal to the ratio of the total weight of soil to the total volume of soil) is 18.53 kg/m3. The dry density of the fill slope is 1.58 g/cm3, the moisture content is 10%, and the natural gravity is 17.38 kg/m3. Before the beginning of the model test, the moisture content of the packaged soil was measured by the drying method, and the moisture content was about 16.3%. Therefore, the soil needs to be turned and aired. The measured water content after airing was about 14.2%. Considering the water loss in the filling process, the original slope was filled directly with the water content. Test slope model length × wide × Height = 3.2 m × 1.4 m × 1.2 m, the filling slope height is 0.9 m, and the interface between the original slope and the filling body and the filling slope angle are taken as 30° (Figure 2).
The modeling idea is to use the dry density and moisture content to jointly control the manual compaction. Each 10 cm is divided into one layer, and the required mass of each layer is calculated. Taking into account the slope shape to be formed in the later stage, the soil that is appropriate greater than the calculated mass is weighed. The filling of the layer is carried out, and the density of the compacted soil layer is measured by the ring knife method. After meeting the requirements, the next layer of filling is carried out. Firstly, the original slope is filled on the left side, and it is placed for a week. Then, the dry density and moisture content of the filling area are controlled on the right side. The slope on the right side is filled as the filling slope. When filling the filling slope, the penetration test ring knife sample is taken to fill the filling area. The sensor part is buried using Luoyang shovel. According to the meteorological data of Yan ‘an, the maximum rainfall in an hour was 62 mm (1979) and the maximum daily rainfall was 139.9 mm (1981). According to the similarity ratio of rainfall intensity, the model rainfall intensity is 12.4 mm/h. Since the uniformity of rainfall device is poor at low rainfall intensity, and considering the uniformity of rainfall time, by controlling the hourly rainfall to be 12.4 mm, 9 h–18 h per day, the rain intensity was 24.8 mm/h. Observation and data collection are carried out during and after rainfall. In the evening, the model was covered with plastic cloth to keep moisture until the slope no longer changed significantly, and the experiment lasted for eight days. Three layers of sensors were arranged on the left and right interface of the original slope and the filled slope, with elevations of 1.0 m, 0.8 m and 0.4 m, respectively (Figure 2c,e). There were six moisture measuring points and nine pore pressure measuring points in total, and the collection interval of the two sensors was 1 min, which was mainly used to analyze the interface effect on the same horizontal line.
In order to simulate the interface effect between loess fill and original slope, plastic mesh is used as sliding zone in this test [22] (Figure 2d). After the completion of slope filling, marked nails are placed on the slope and the top of the fill slope in order to observe the deformation characteristics of the slope and the top of the fill slope and analyze the deformation and failure process of the fill slope (Figure 2f). Specifically, set for the top of the slope inserts two rows, slope inserts four rows and each row inserts five marked nails.

3. Results

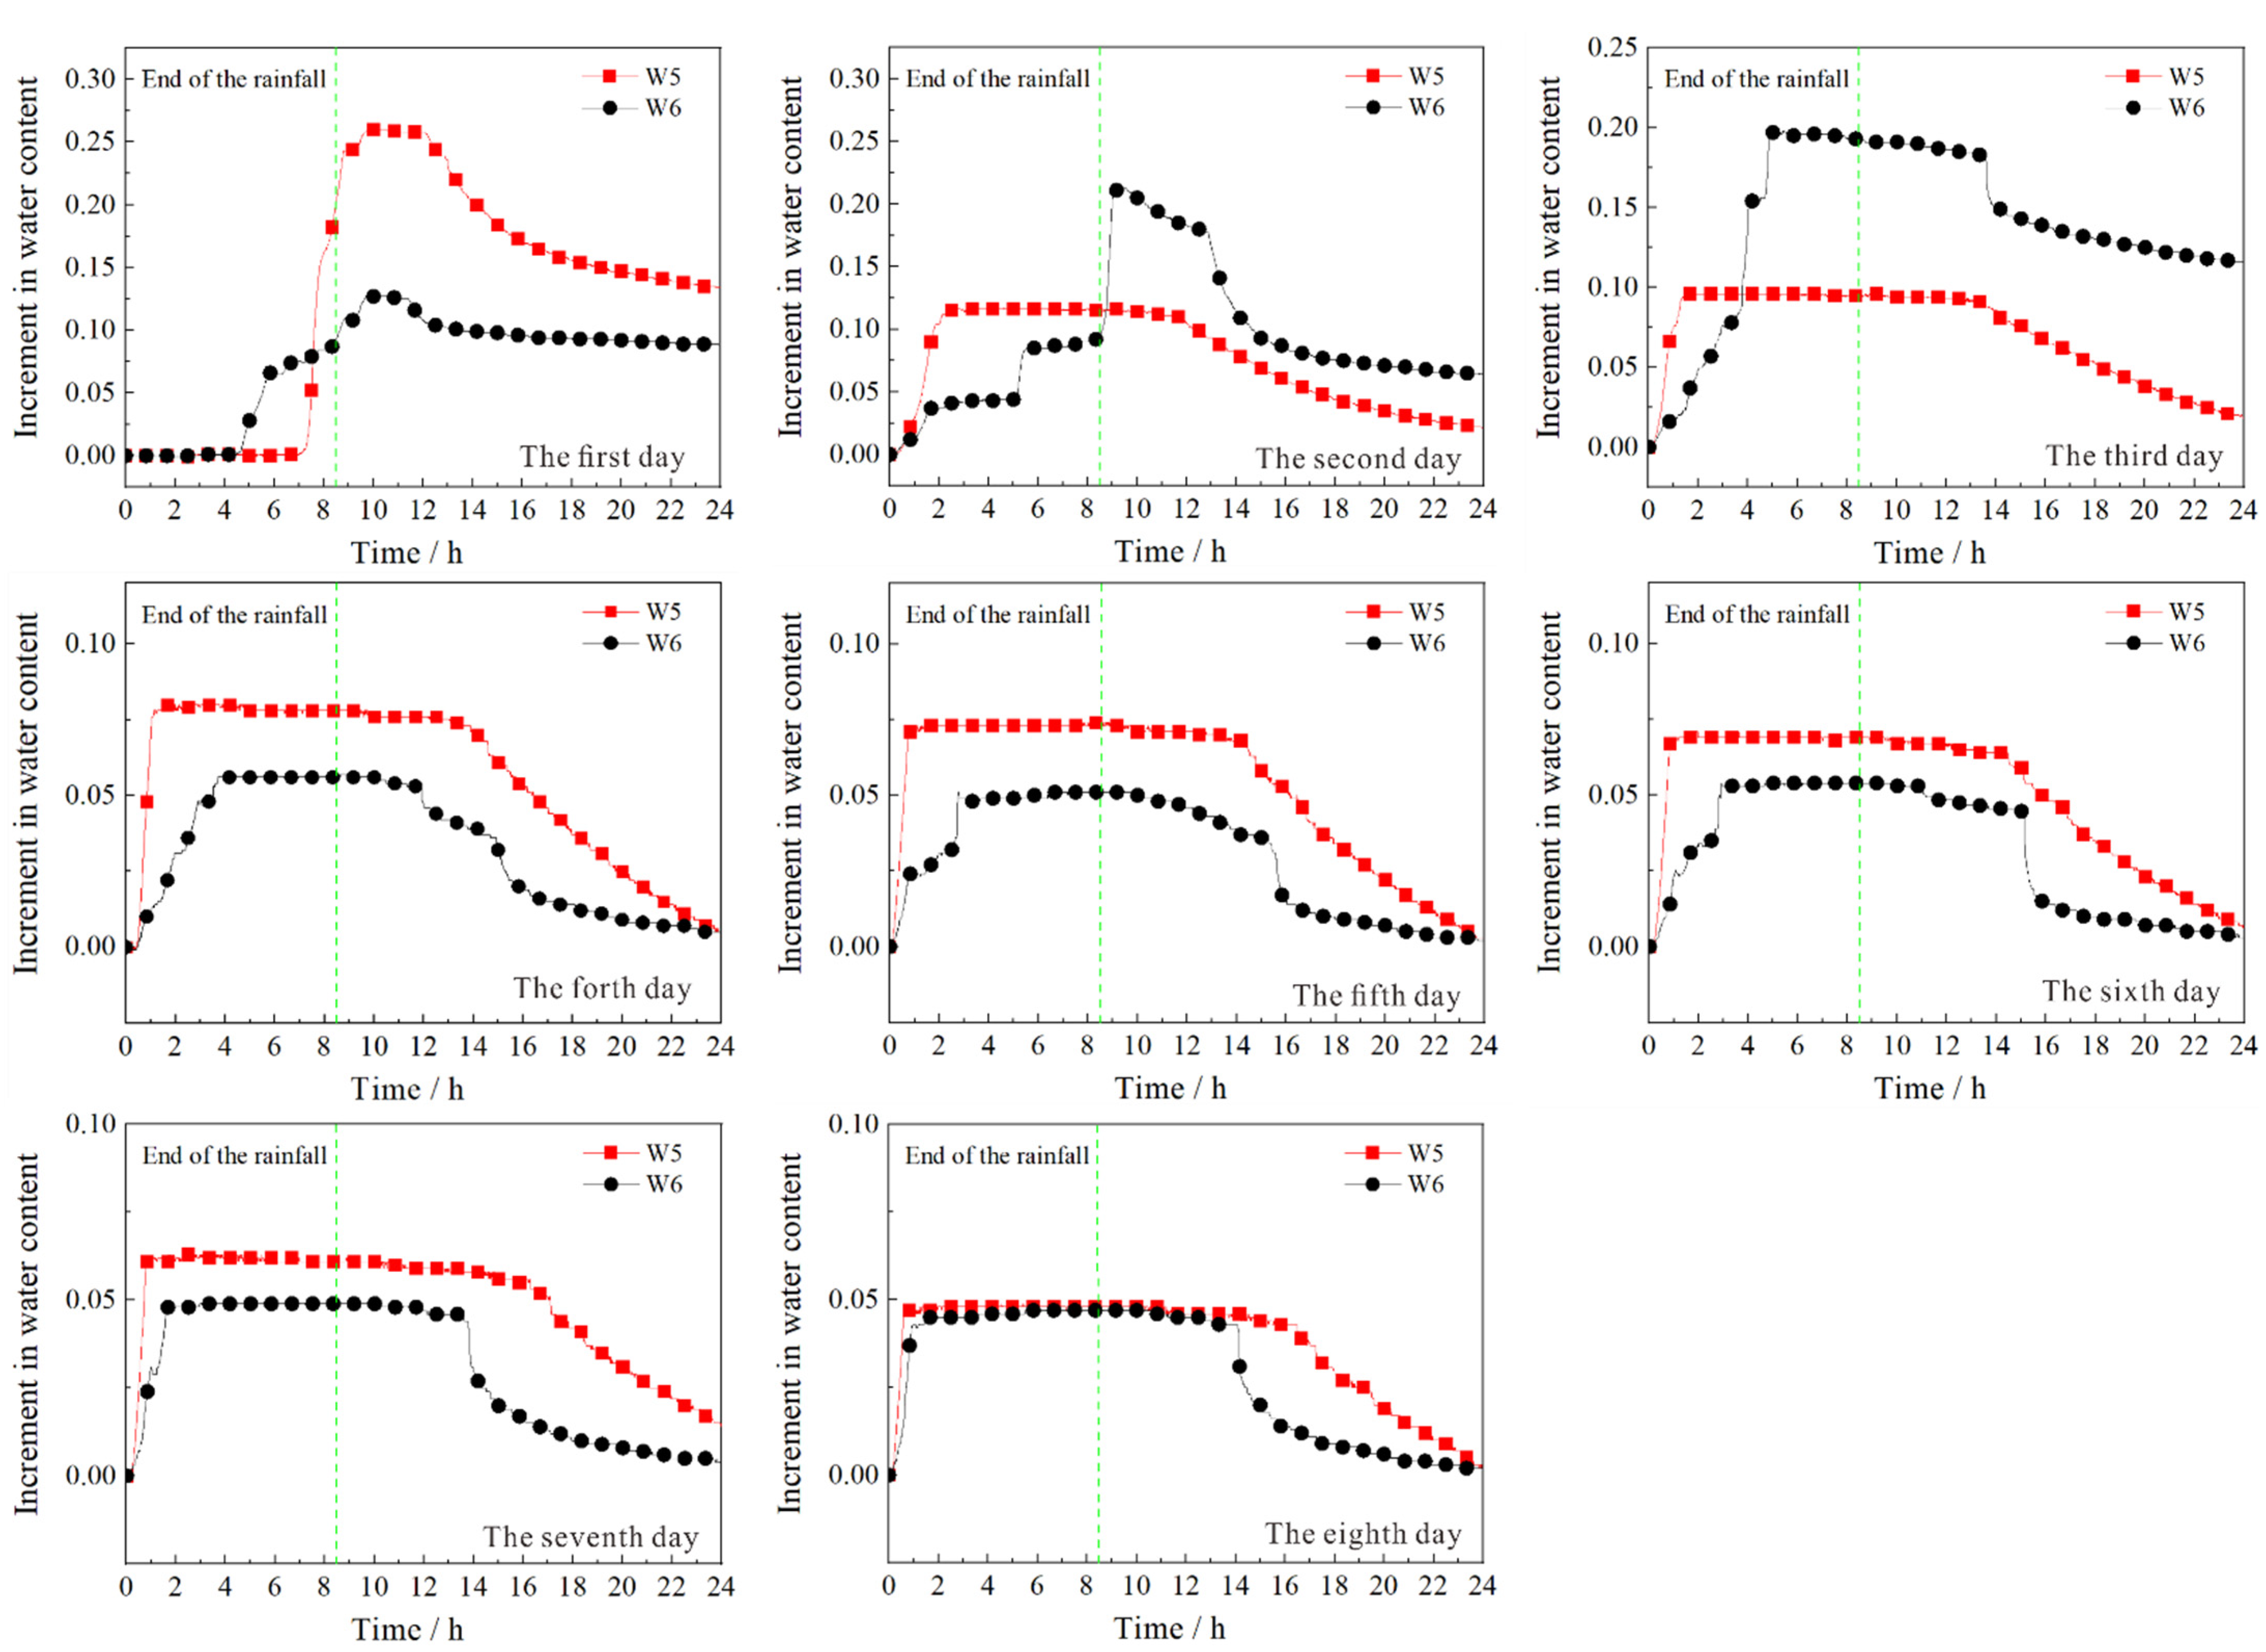
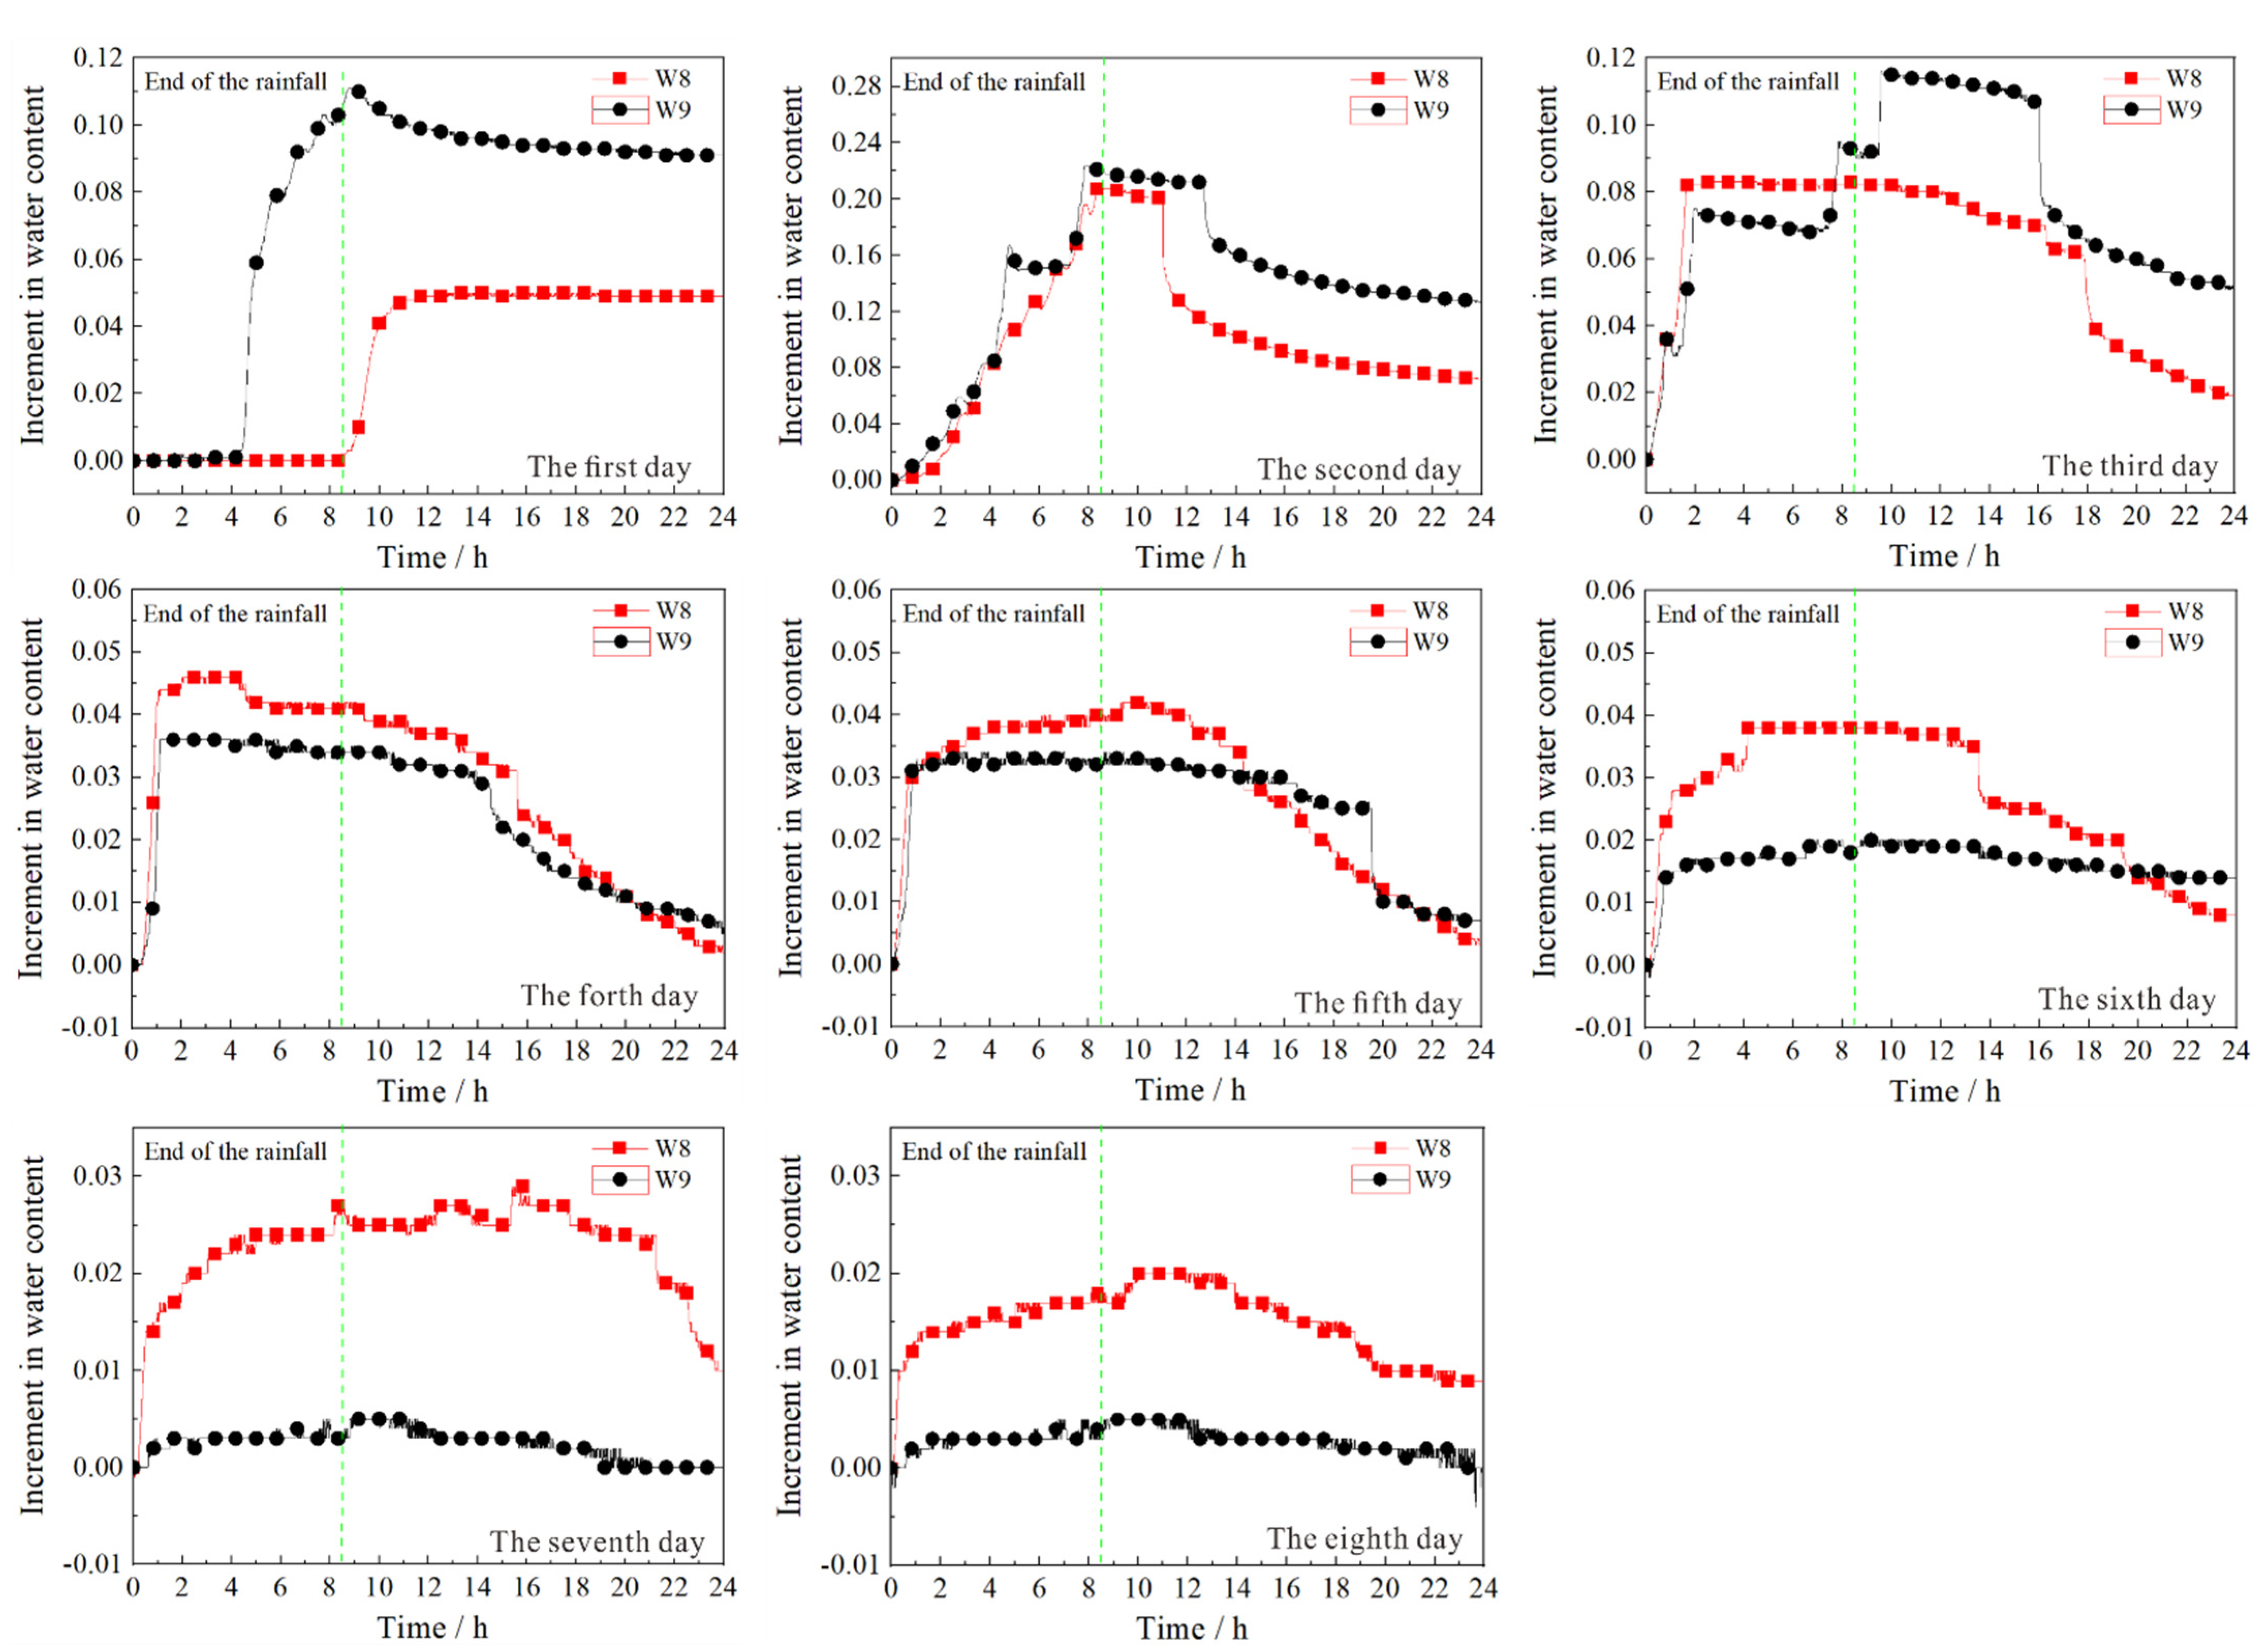
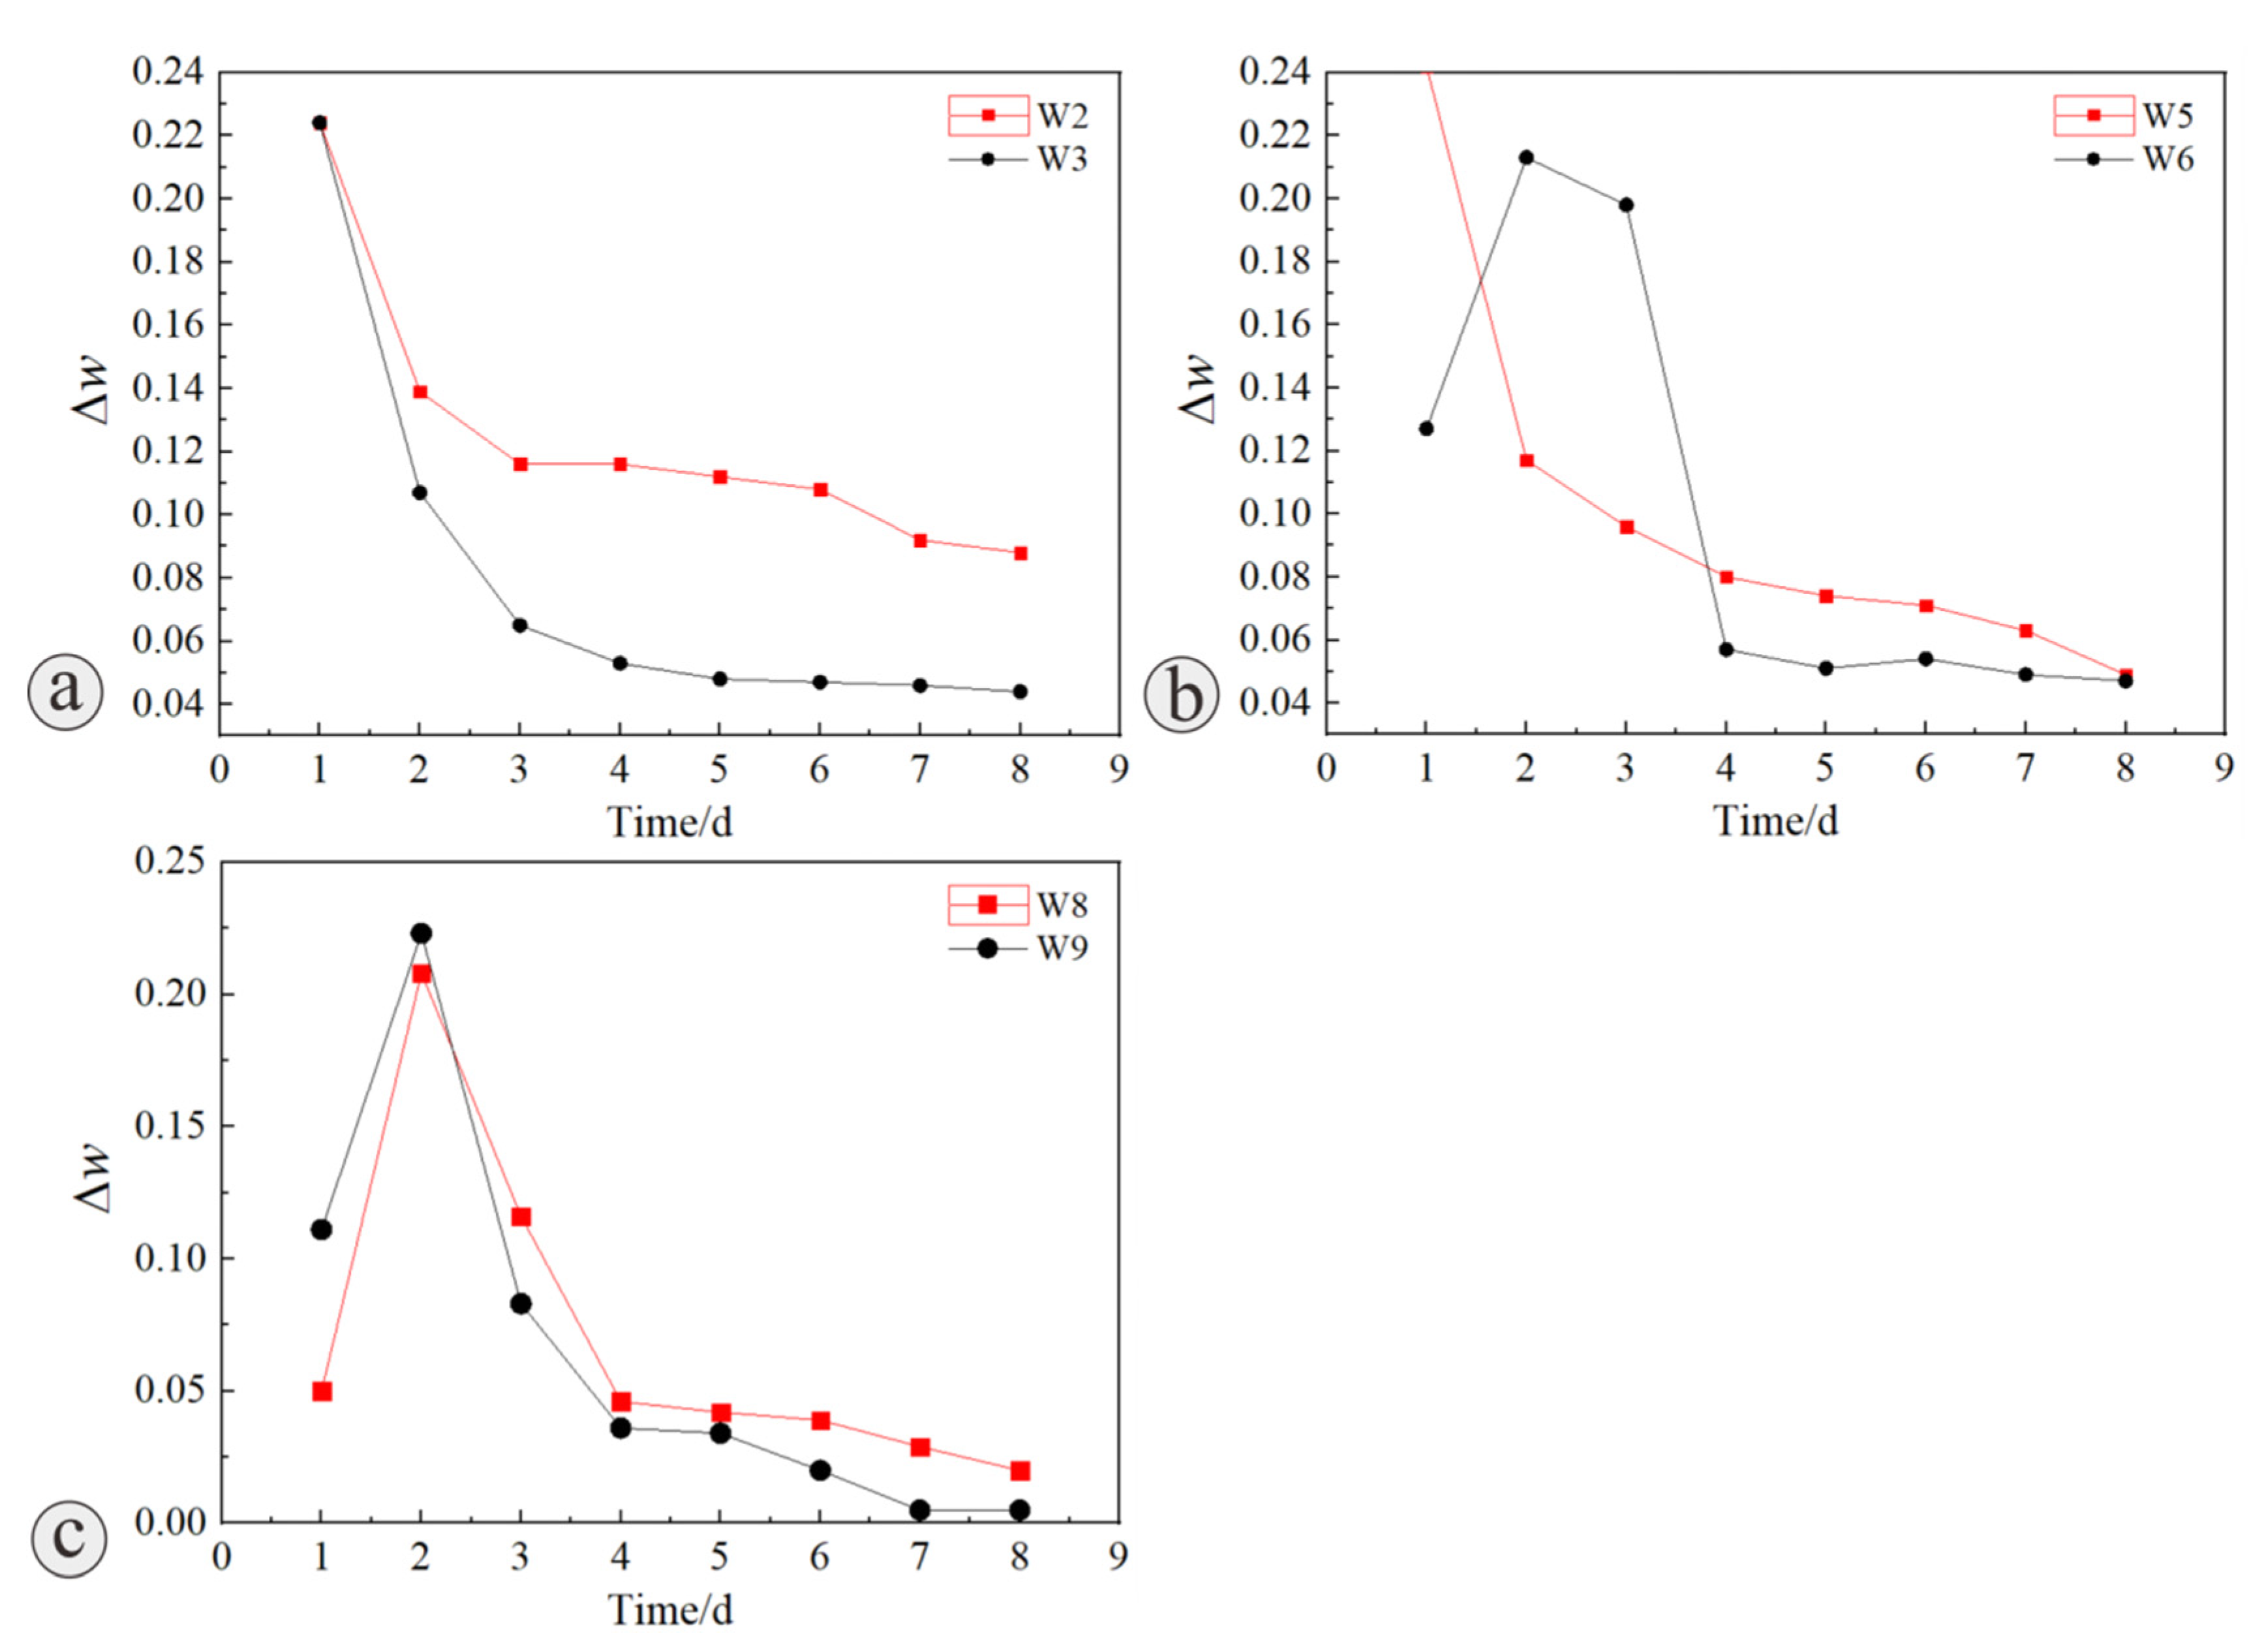
3.1. Variation of Slope Water Content

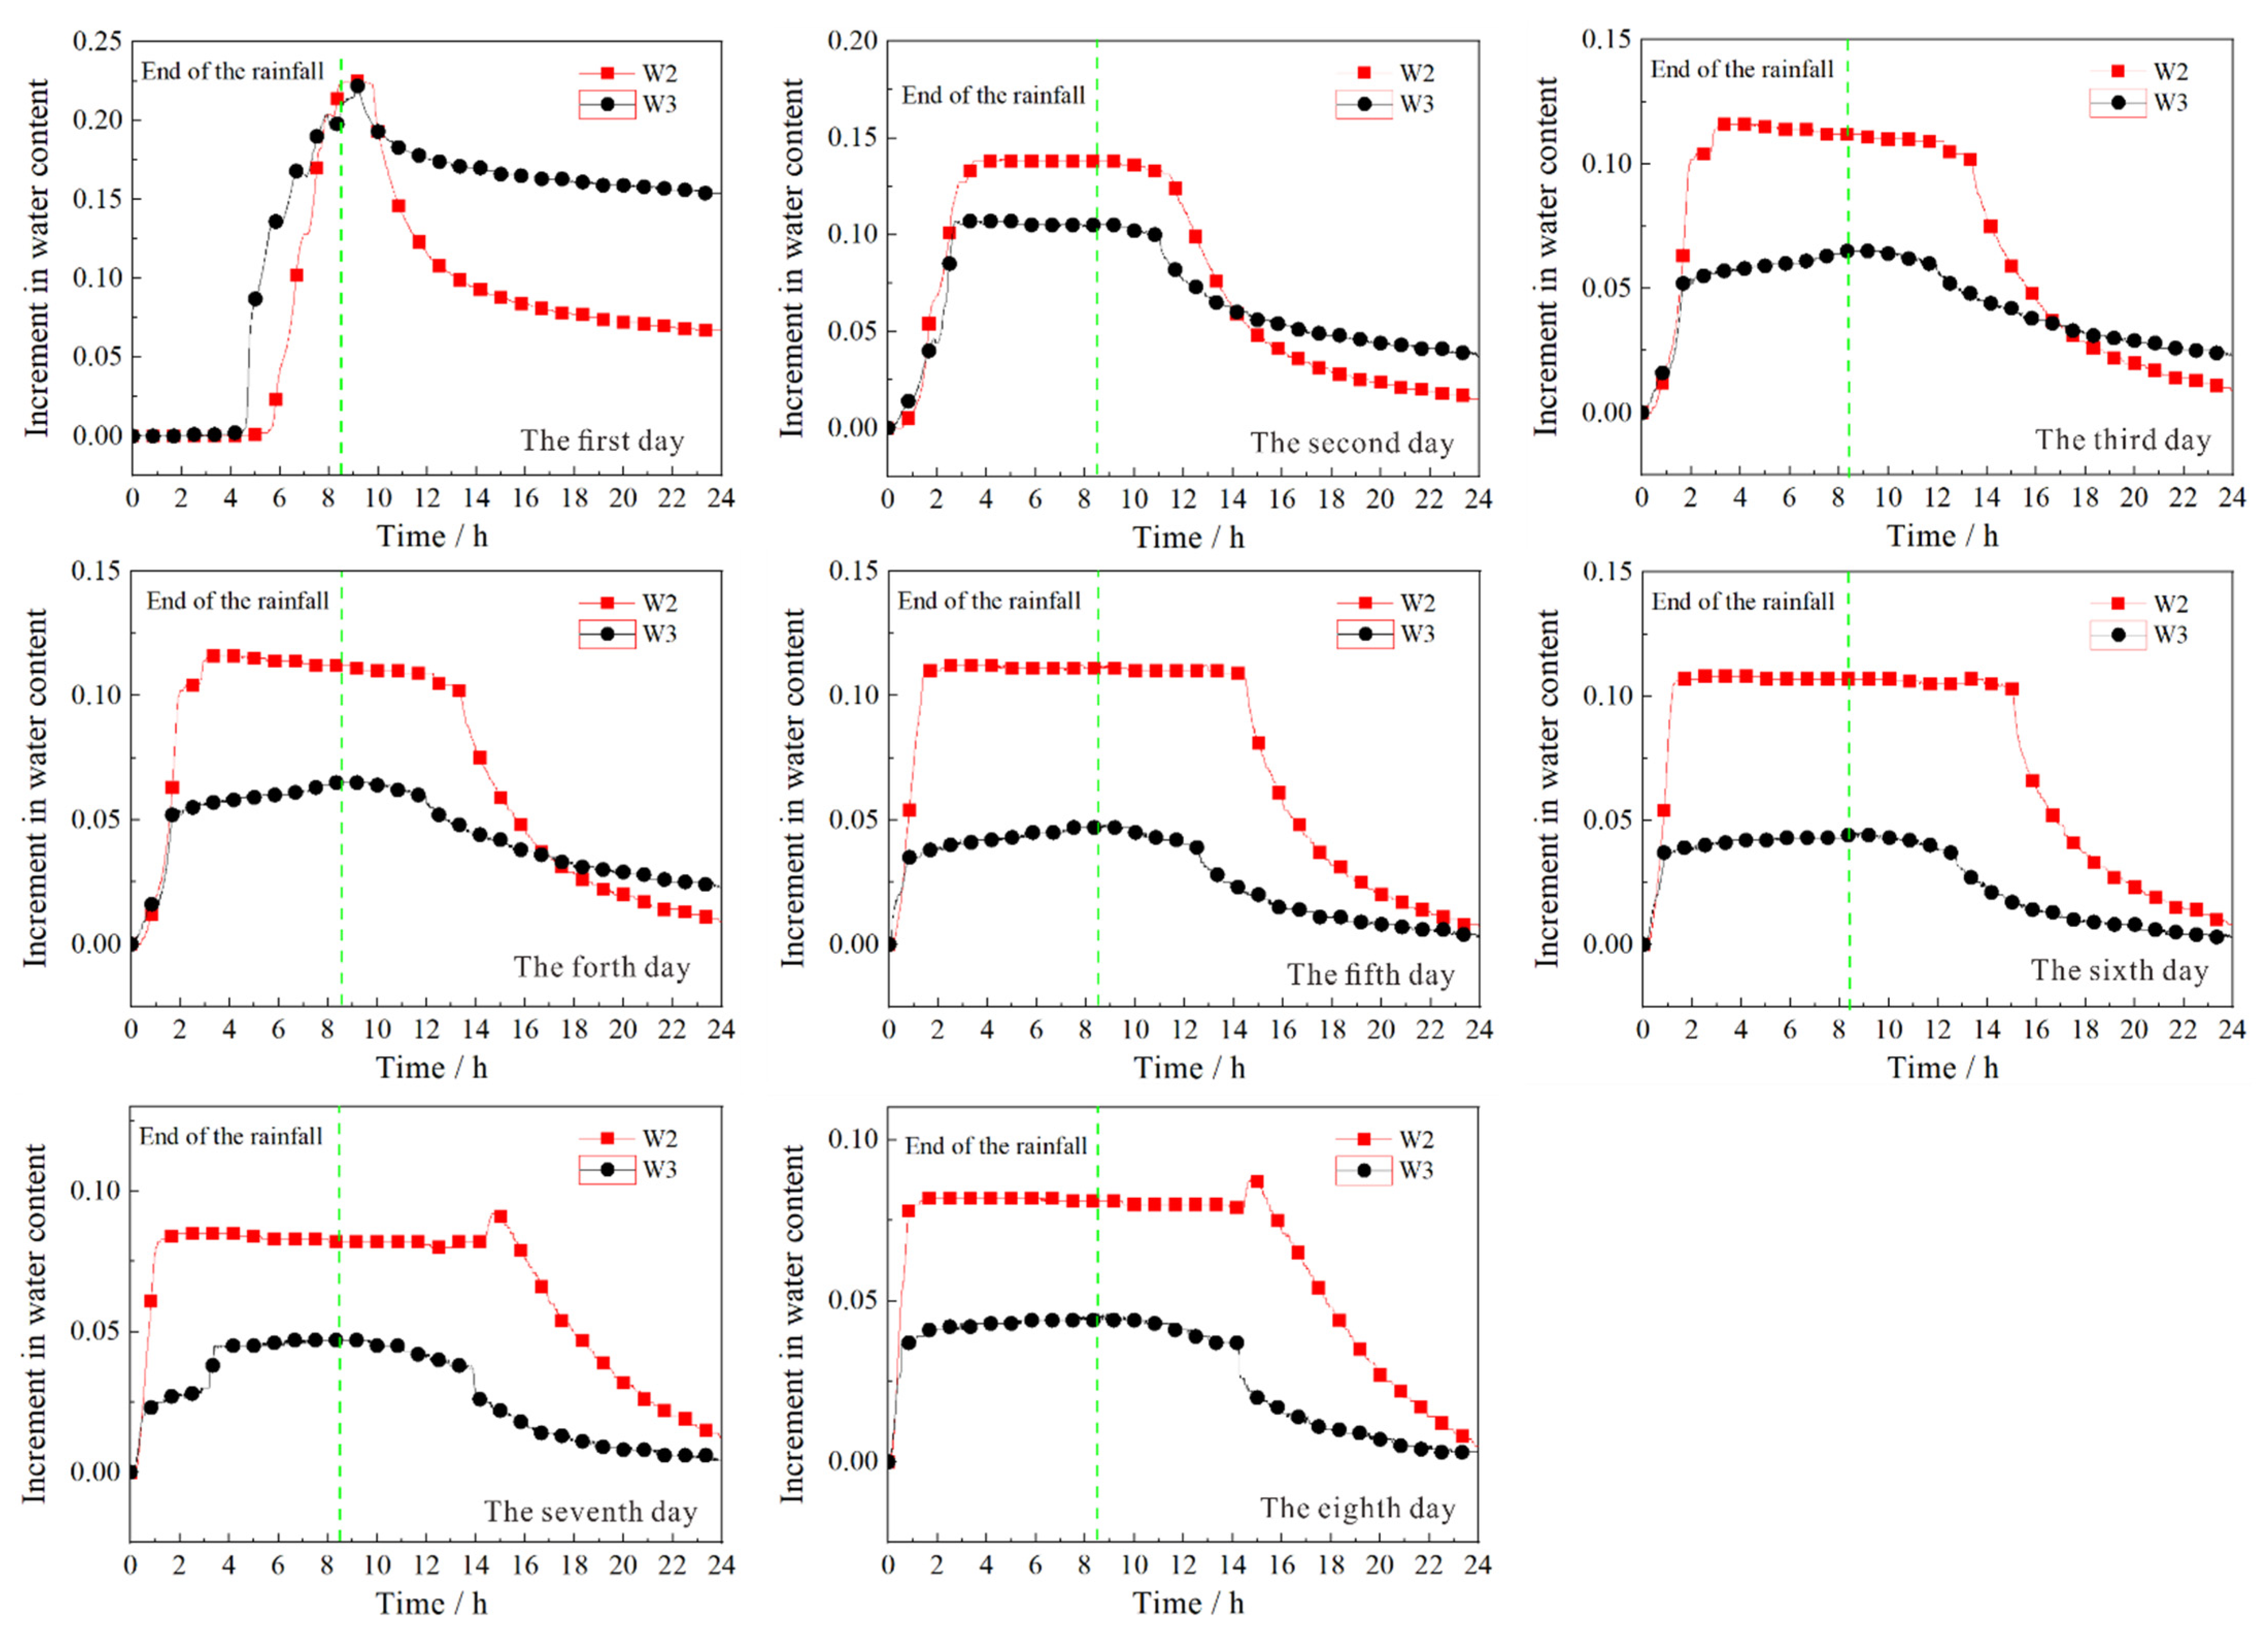
3.1.1. Variation of Water Content at Top of Slope (H1 = 1.0 m)

Figure 4 shows the variation curve of water content increment with time at different measuring points at the top of the slope (H1 = 1.0 m). In the LFSI and the filling slope, the variation of water content with time under the action of rainfall is similar: the water content first increases gradually, and then gradually decreases after a period of rainfall when it reaches a certain stable value or maximum value. Before the end of the daily rainfall, the increment of volumetric water content at the interface W2 is greater than that in the filling body W3, indicating that LFSI is an easy channel for rainfall seepage. The time of water content decline at W2 measurement point was later than that at W3 after the end of rainfall, indicating that part of the water will accumulate at LFSI and continue to permeate along LFSI after rainfall, and the water at W2 at the interface is supplemented, resulting in the lag of water content decline at W2.

3.1.2. Variation of Water Content in the Middle and Upper Slope (H2 = 0.8 m)

Figure 5 shows the variation of water content in the middle and upper slope (H2 = 0.8 m) (W5 is located at LFSI and W6 is located in the filling body). It can be found that the water content in the middle and upper part of the slope increases gradually with time under the action of rainfall. When it increases to a certain stable value or maximum value, it gradually decreases after a period of rainfall, which is basically consistent with the variation trend of W2 and W3 measuring points at the top of the slope. The increment of volume moisture content before the end of rainfall shows that water content W5 is greater than W6, indicating that LFSI has infiltration advantage. The reason for the abnormality on the third day may be that the water content at W6 increased for a period after the rainfall on the second day. It is speculated that cracks occur near W6, and the rainwater is easy to gather at the measuring point, resulting in the increment of moisture content of W6. At 17 h 26 min on the third day, a shallow slope slip occurred, and the stress inside the slope was redistributed, resulting in no obvious seepage advantage at W6. Therefore, the advantageous seepage at the interface is reflected again after the fourth day. The time of water content decline in W5 after the end of rainfall was later than that in W6, indicating that water distribution at the end of rainfall was collected at the interface and continued to infiltrate along the interface, supplementing water content in W5, resulting in lagging water content decline in W5.

3.1.3. Variation of Water Content in Slope Toe (H3 = 0.4 m)

Figure 6 shows the variation of water content increment at different measuring points at the foot of slope (H3 = 0.4 m) with time (W8 is located at LFSI and W9 is located in the filling body). From the fourth day of rainfall, with the increase of rainfall time, the increment of moisture content of W8 began to be greater than that of W9, which also indicates that there is a lag phenomenon of rainfall infiltration along LFSI.
According to the analysis of the above test results, the essence of the “interface effect” of the loess fill slope is that the interface is a rainfall dominant seepage channel, and there is a lag phenomenon of rainfall infiltration along the interface (Figure 4, Figure 5 and Figure 6), that is, after the end of rainfall, part of the water will continue to be collected at LFSI and penetrate along LFSI.

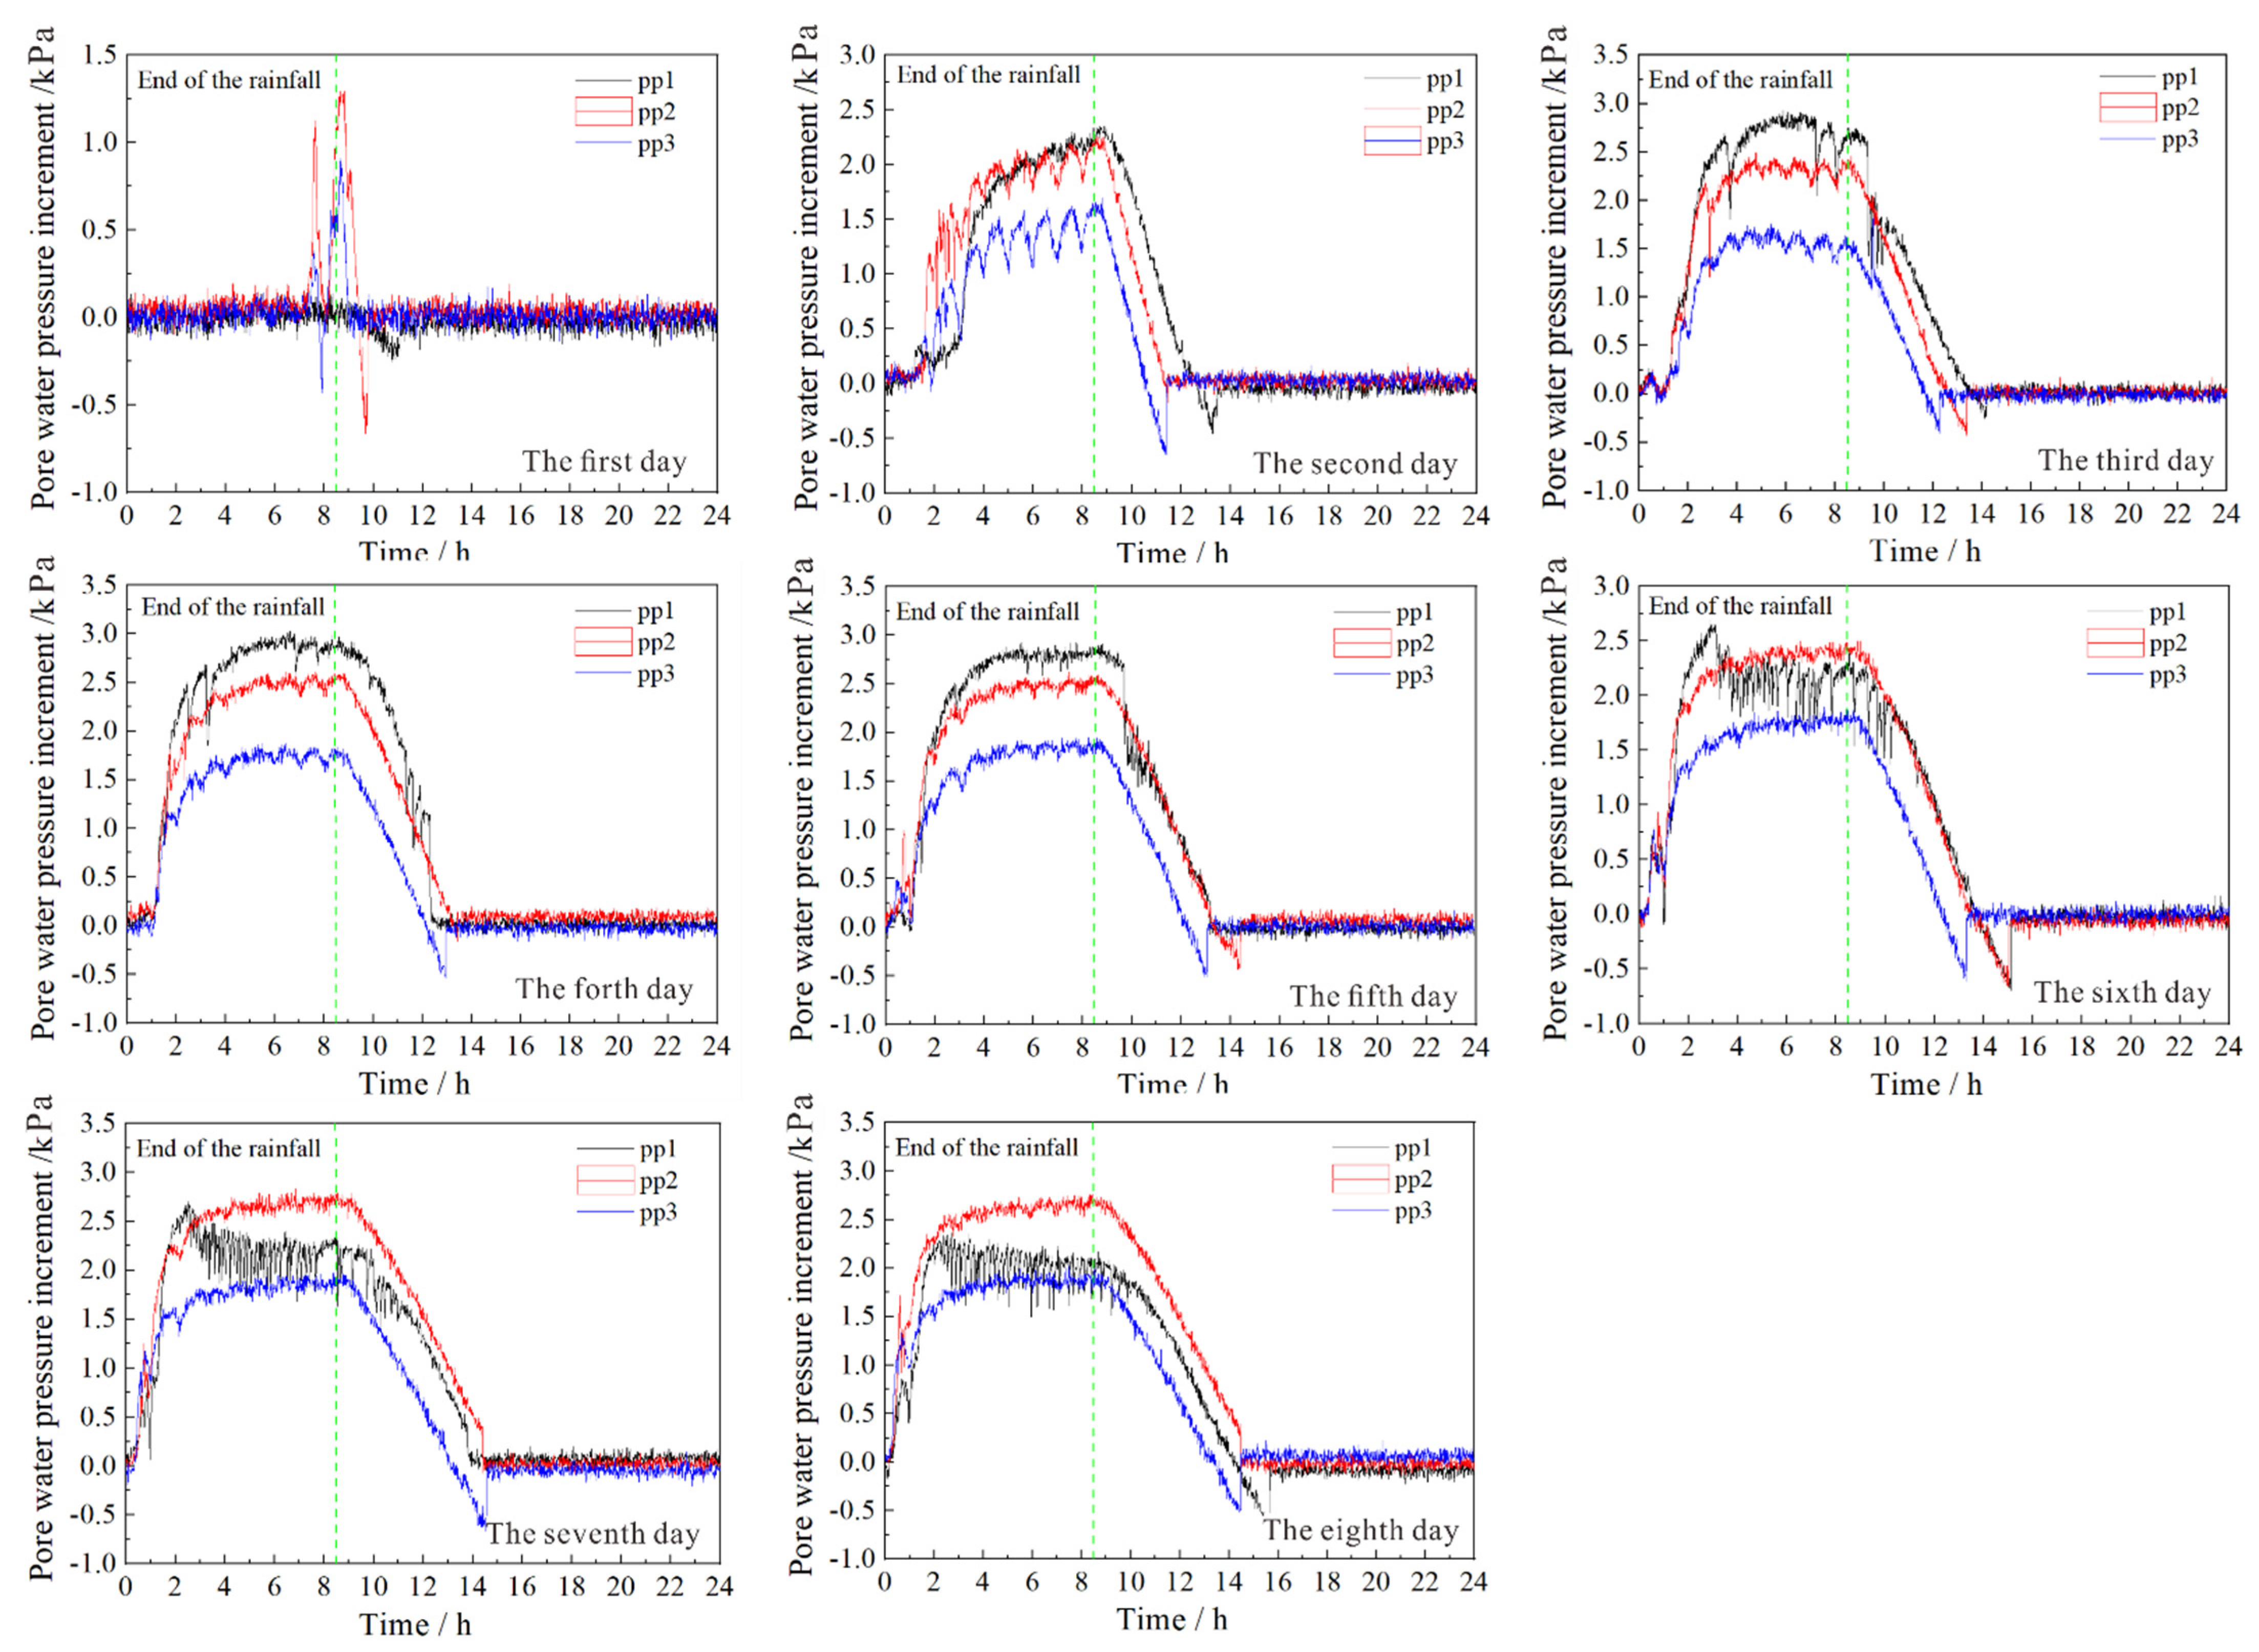
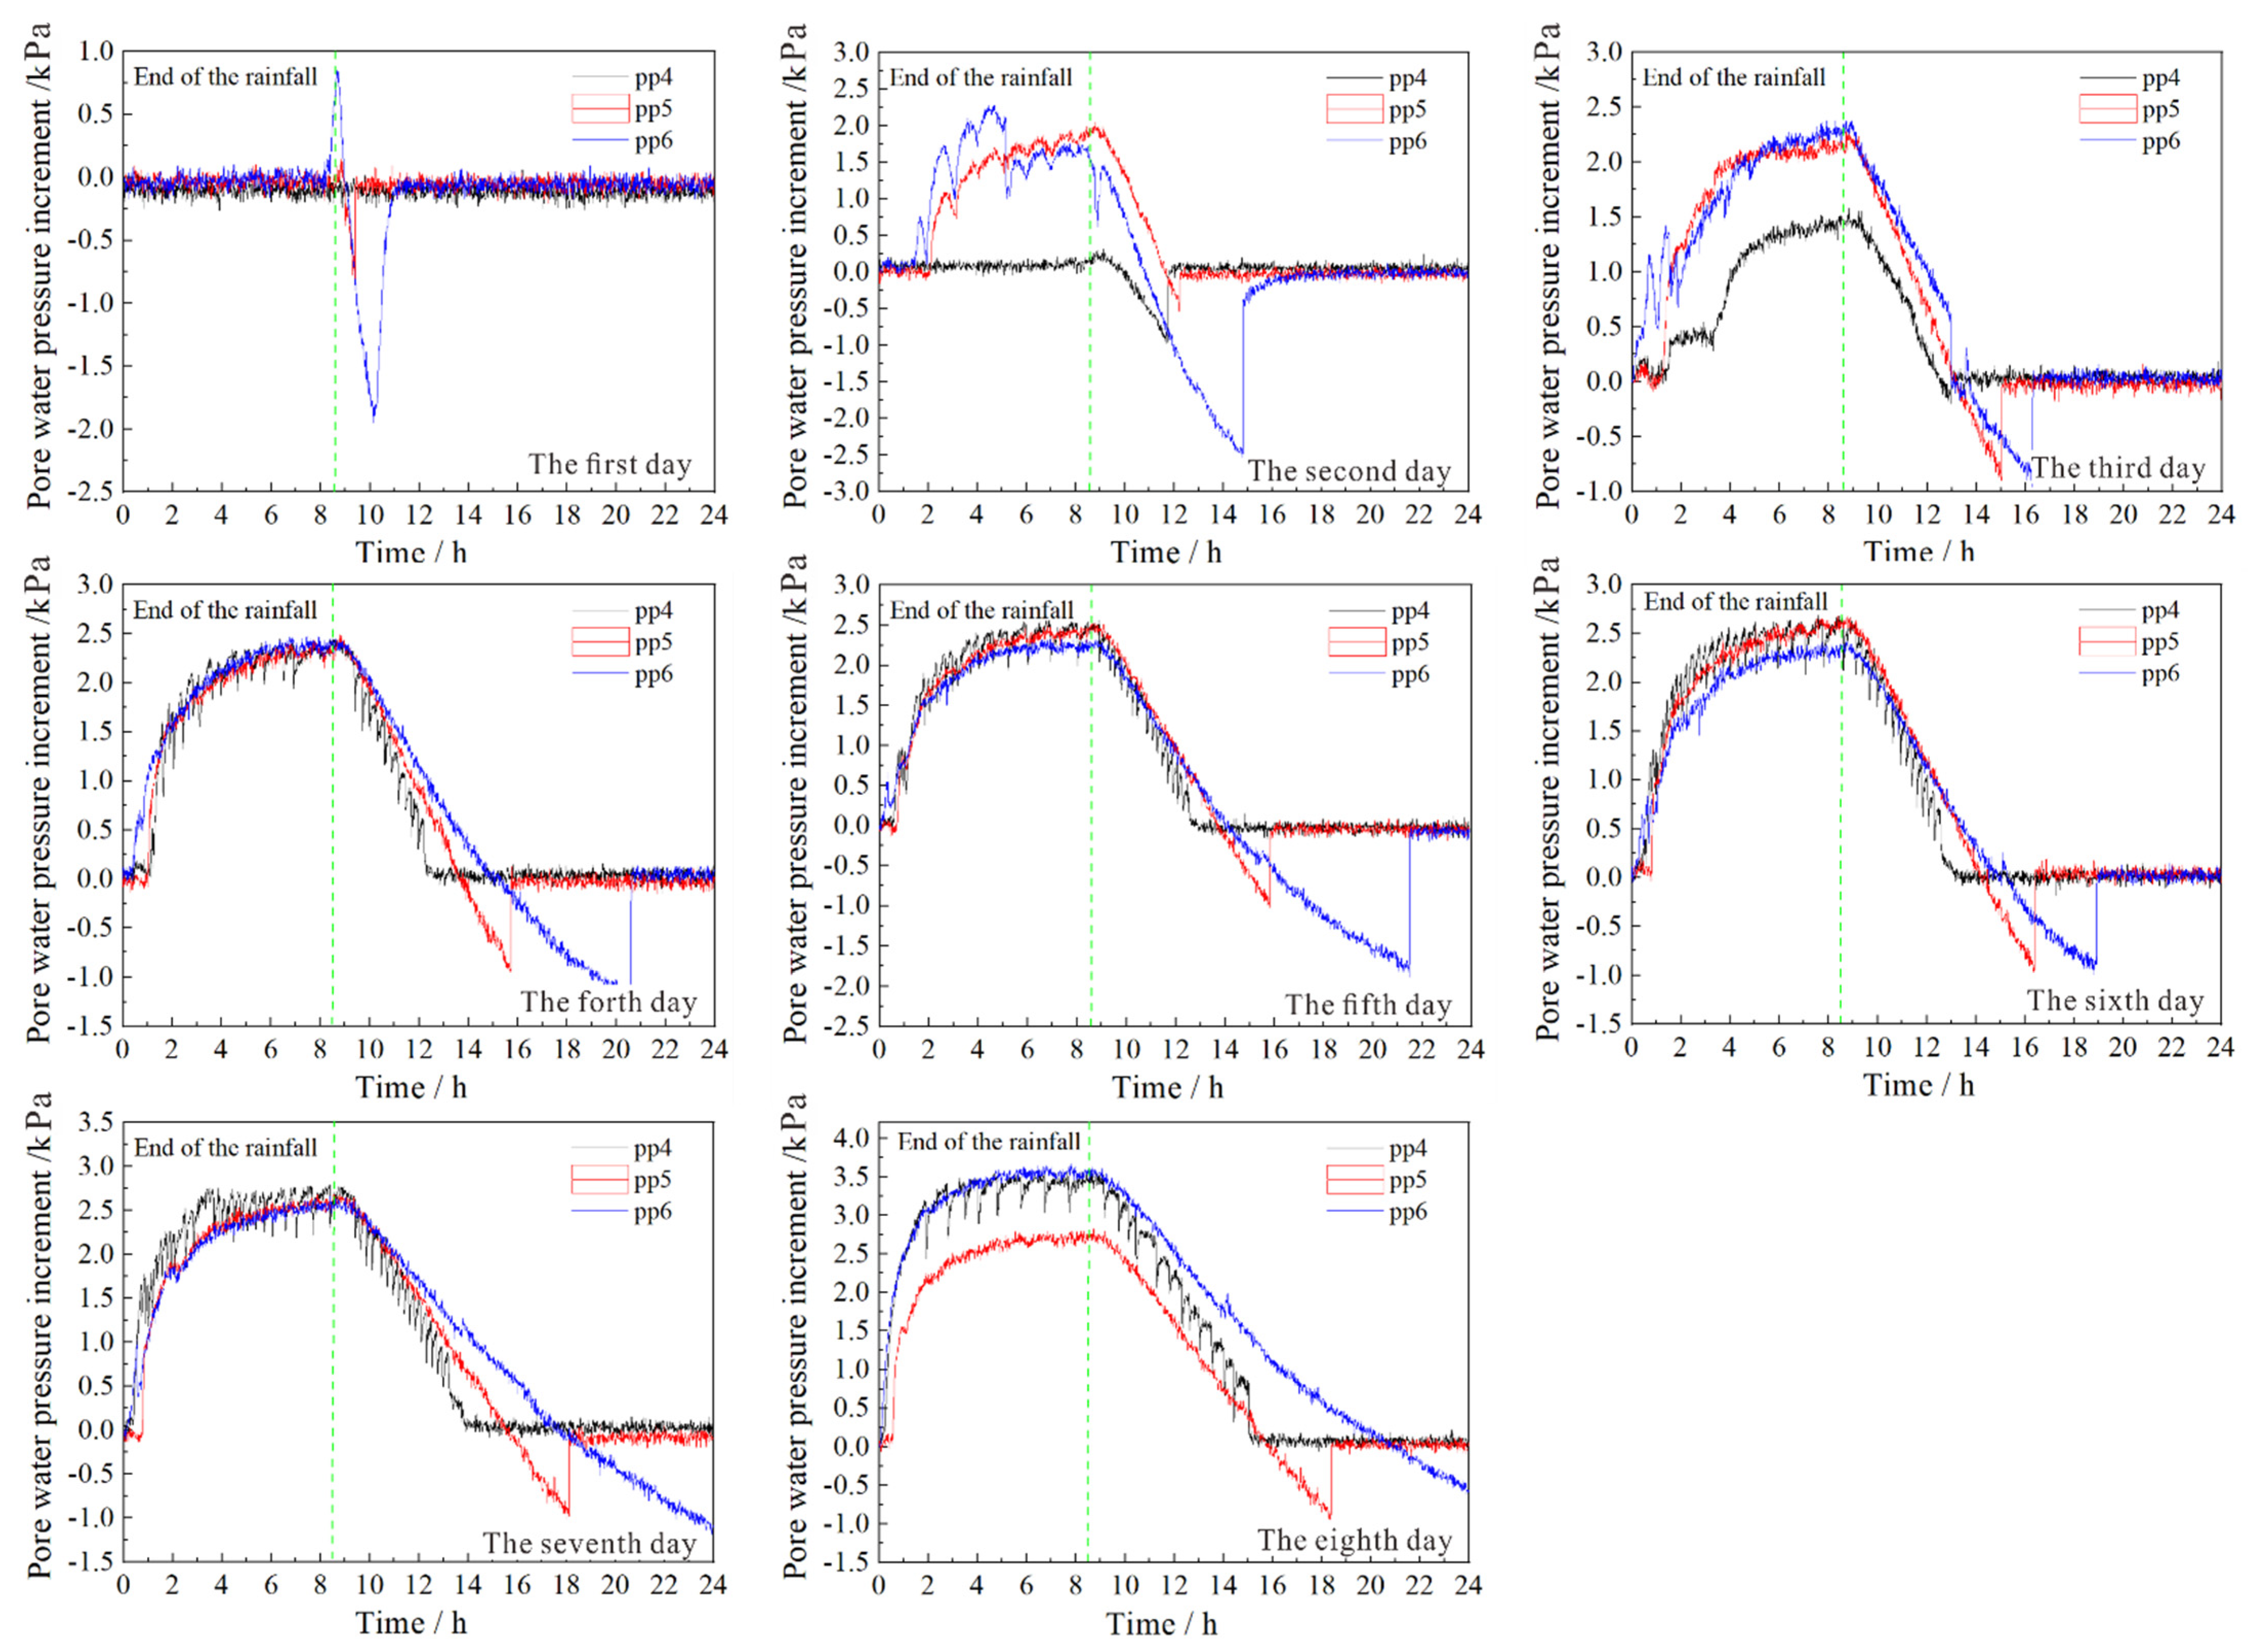
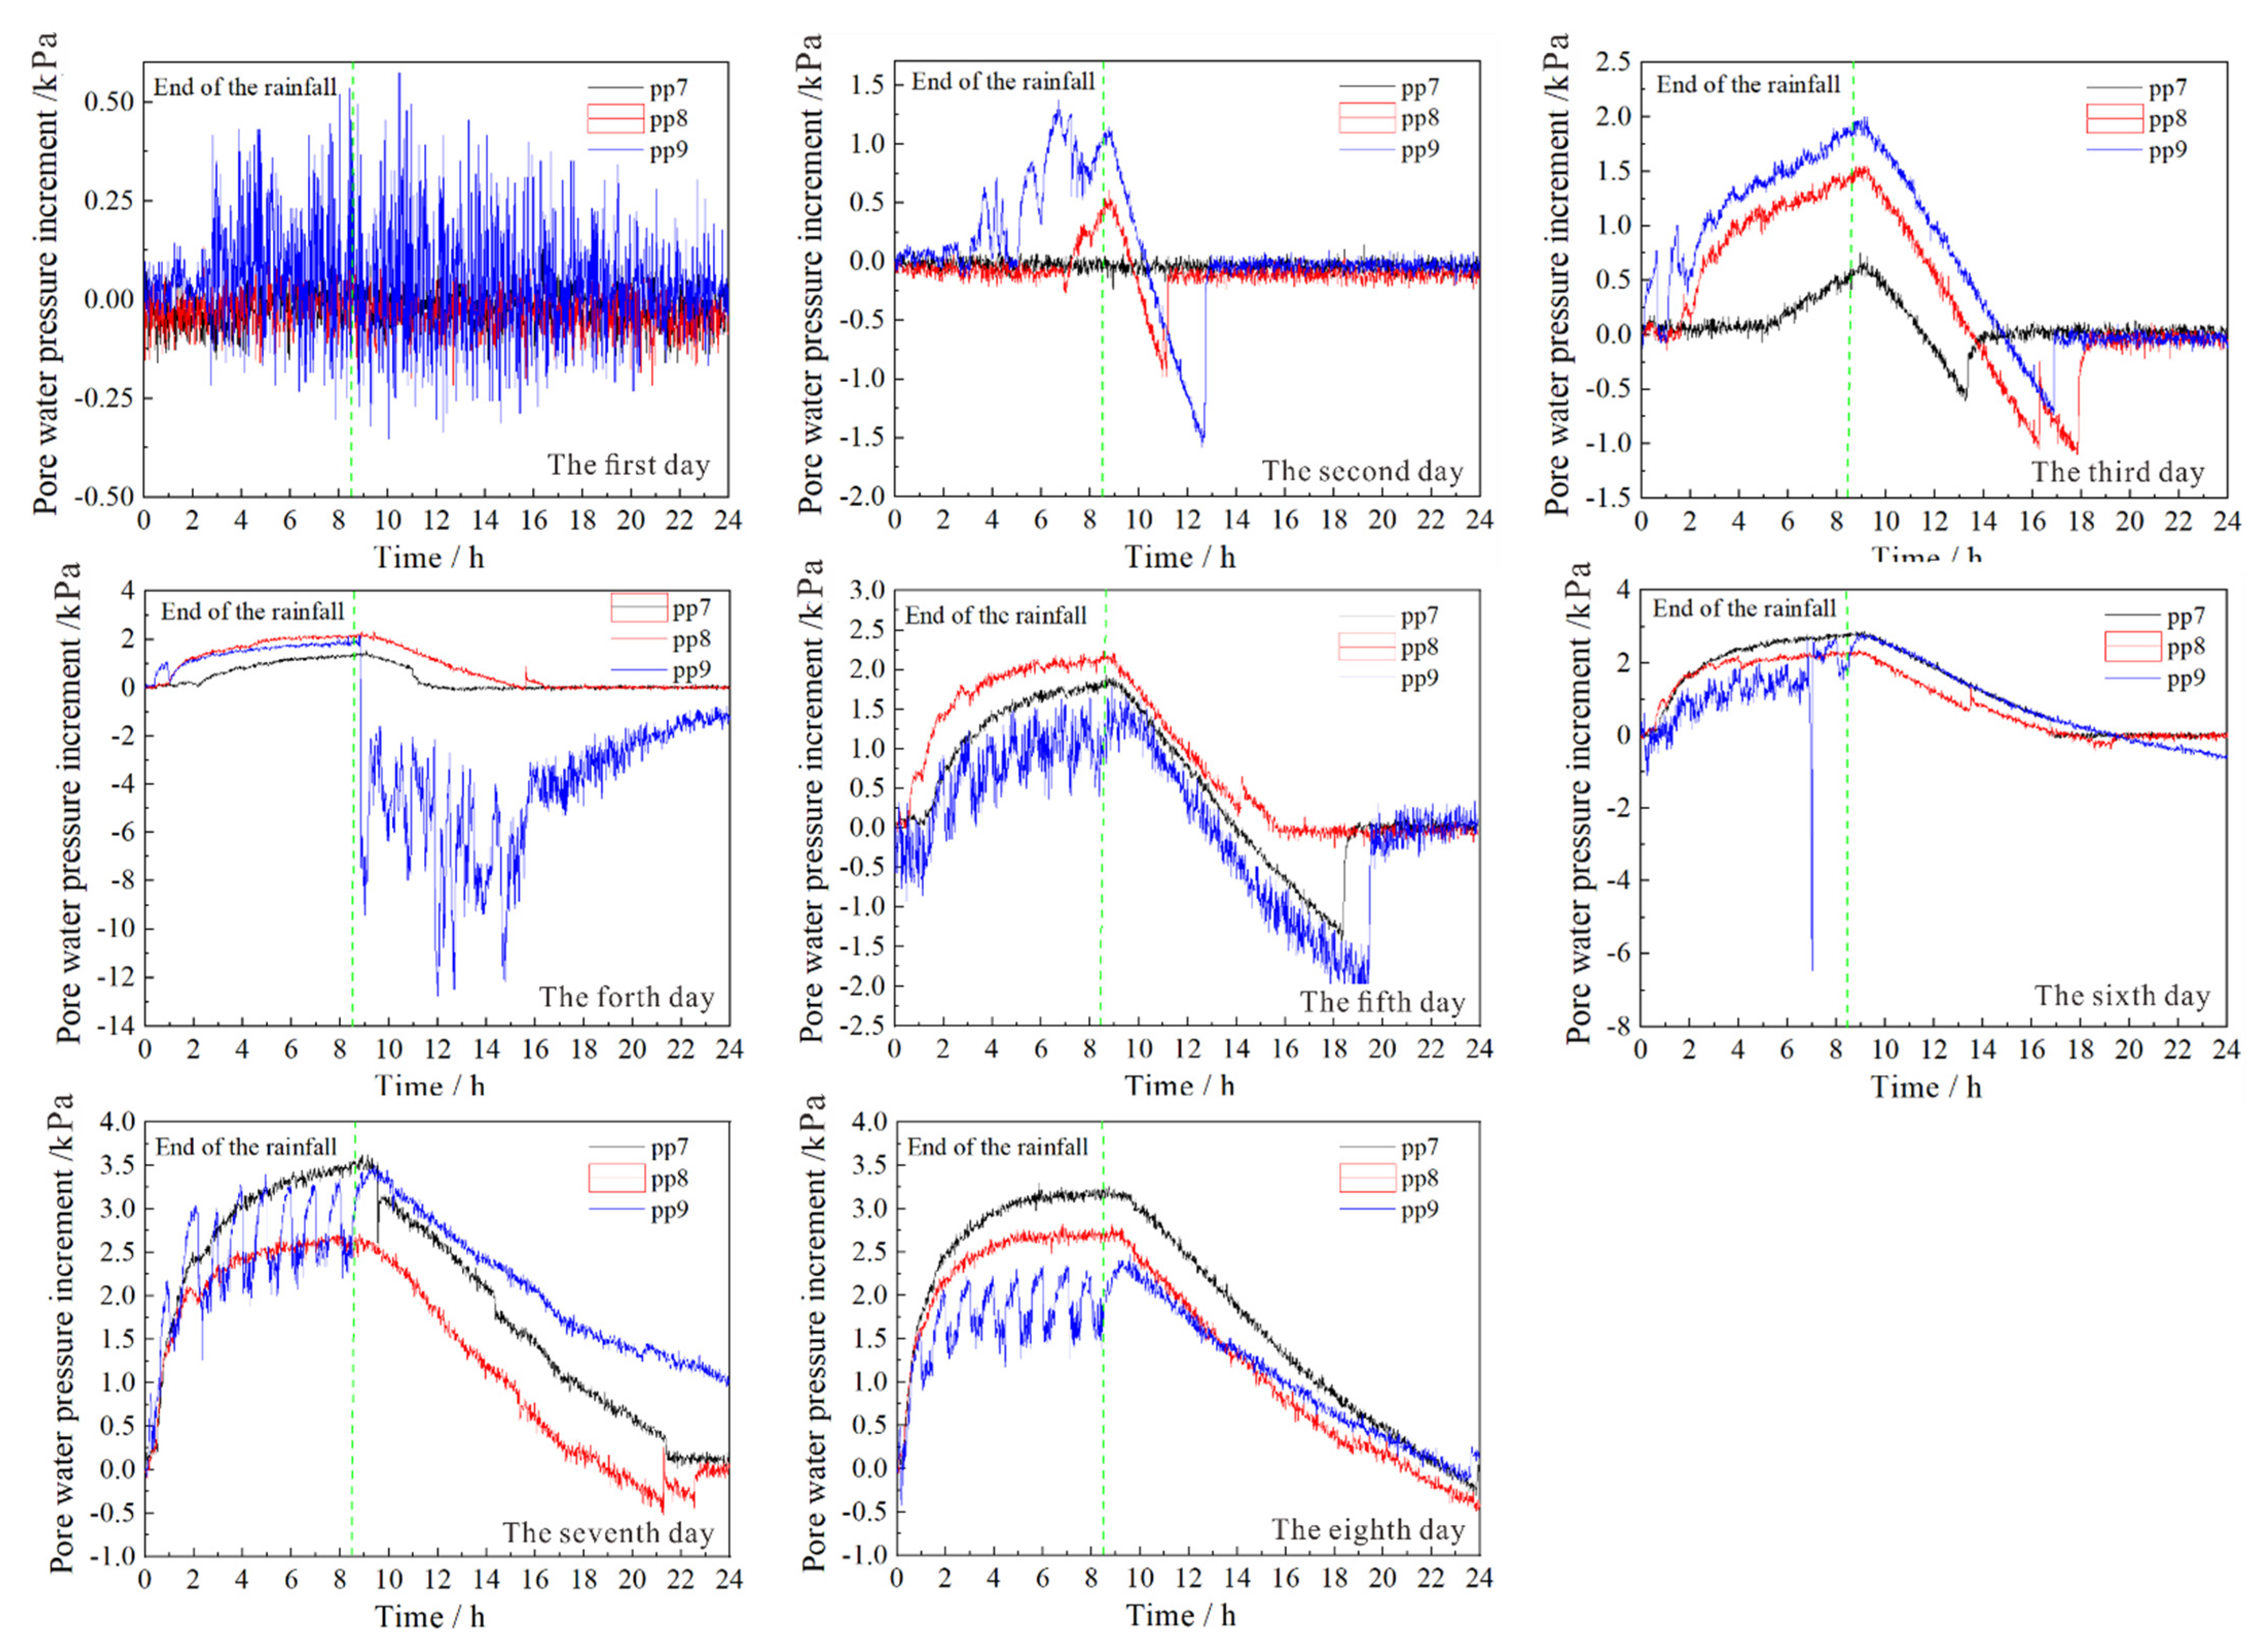
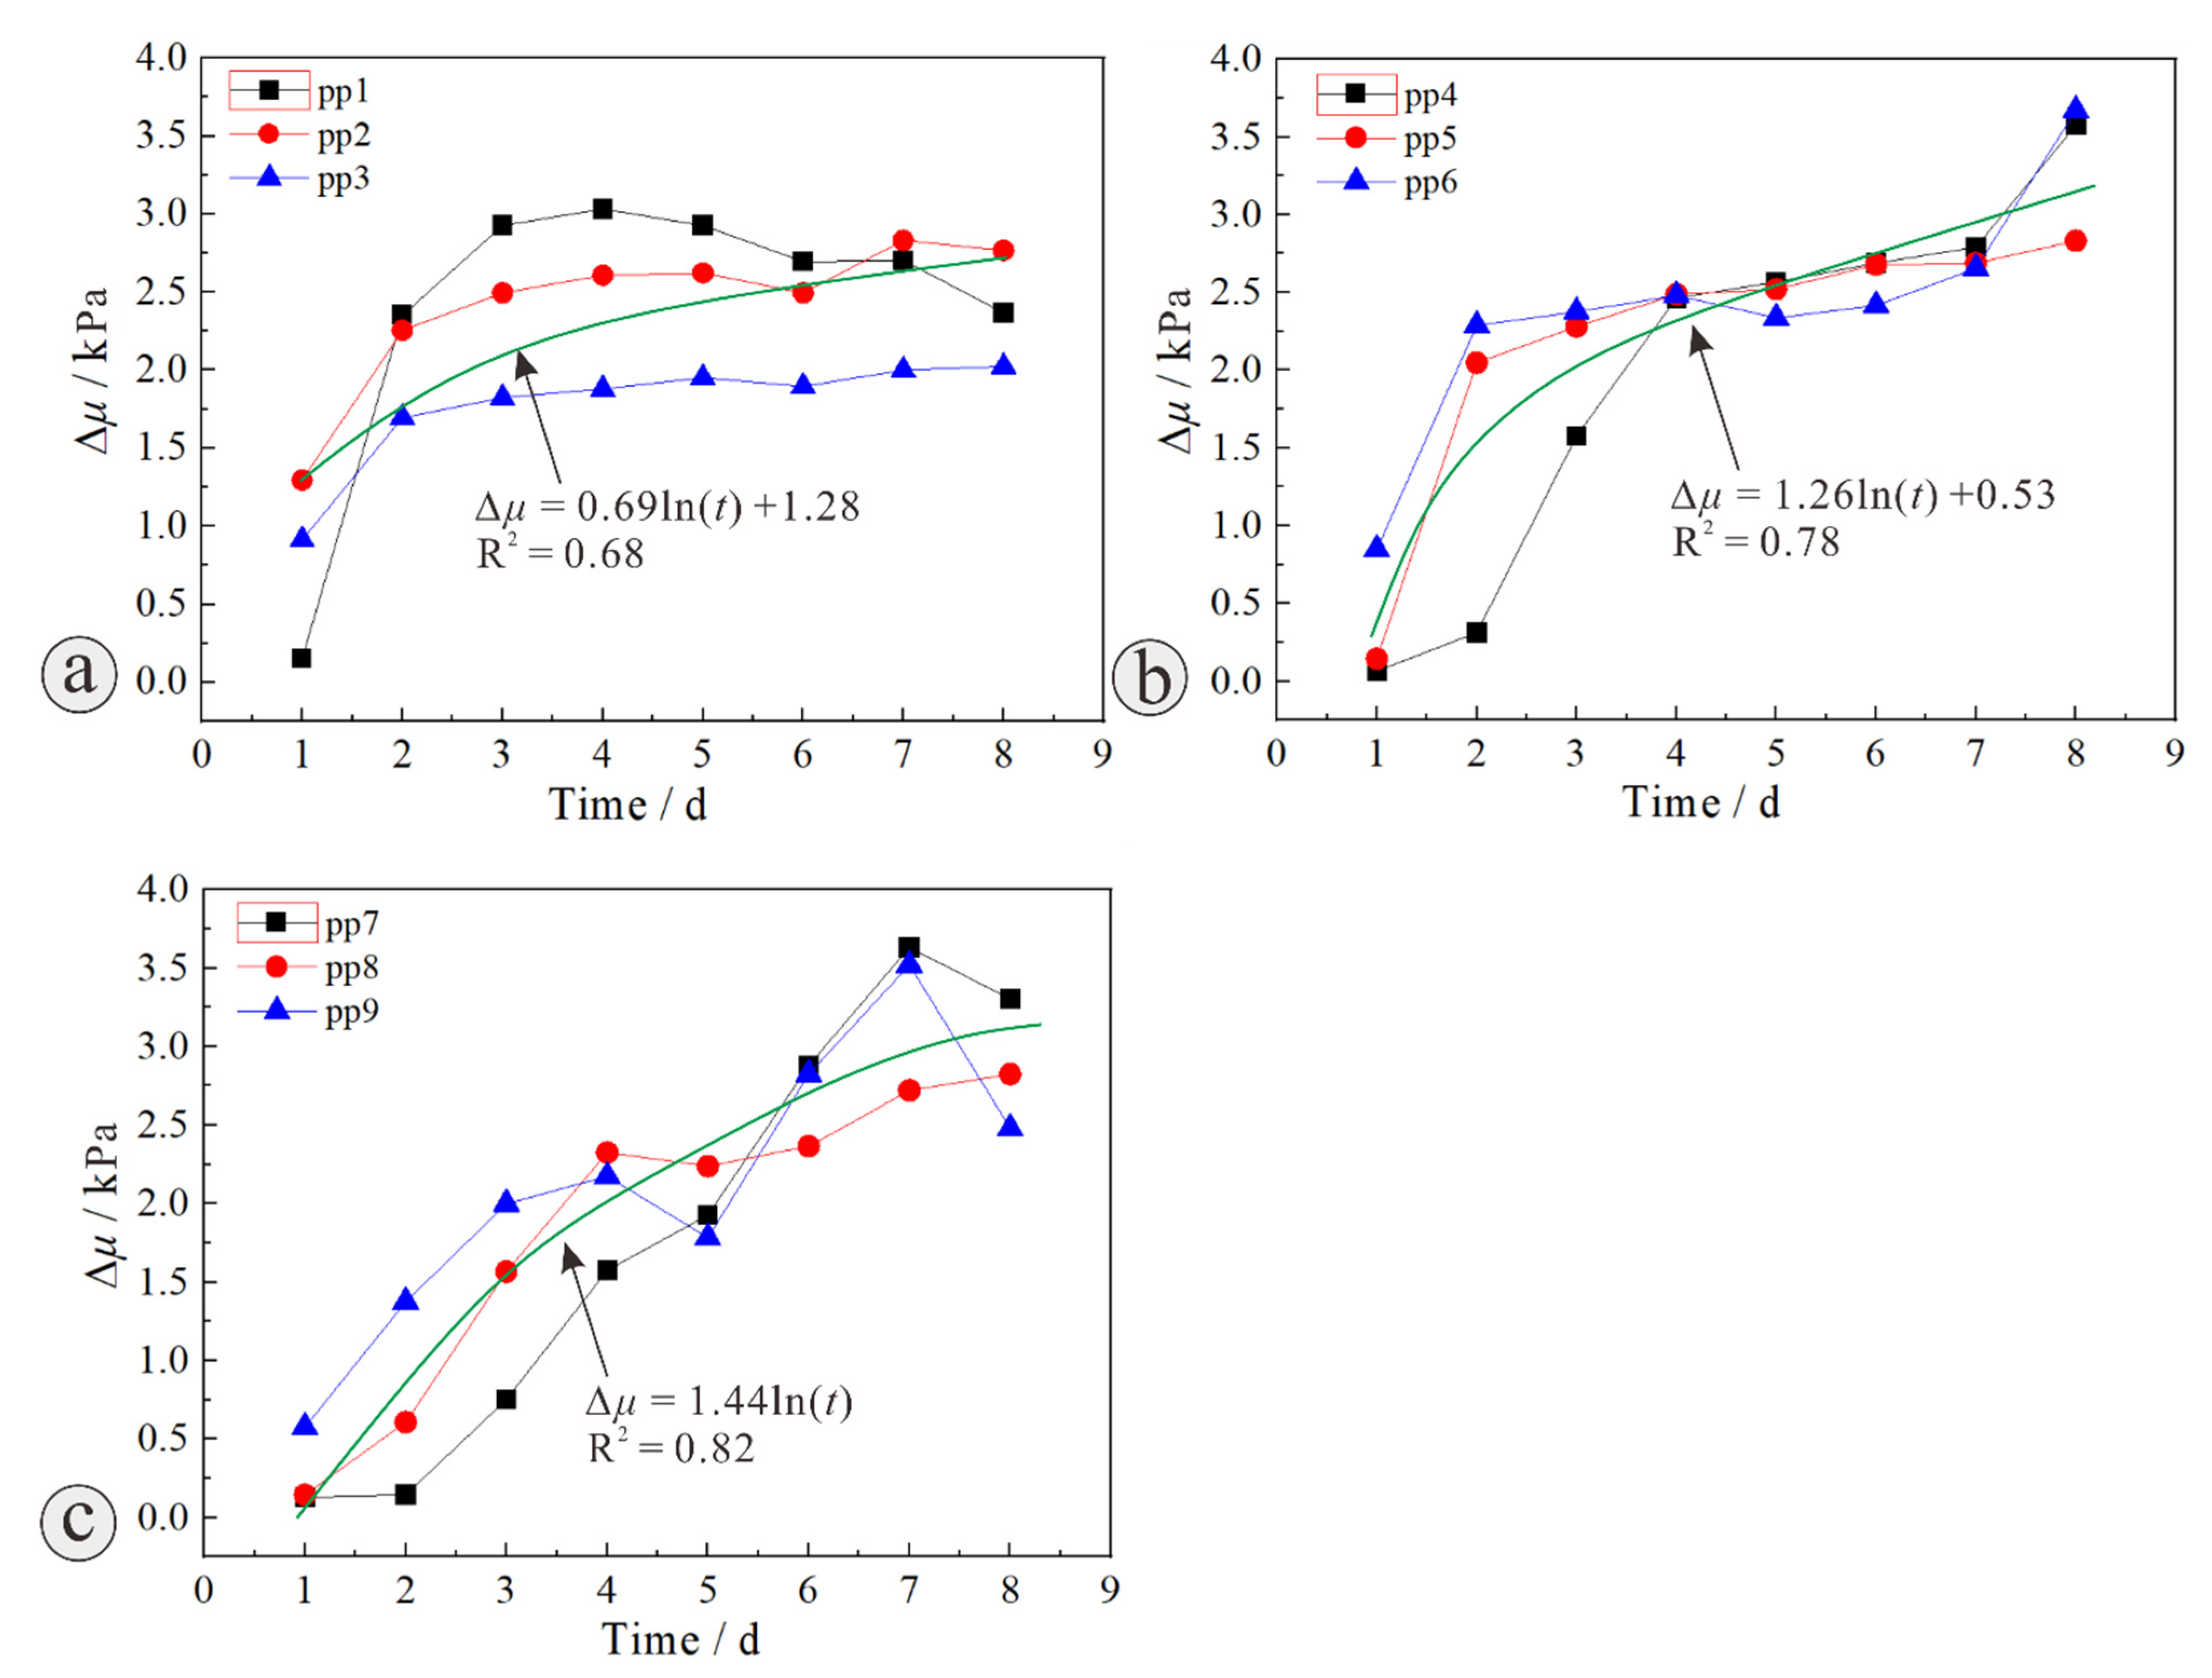
3.2. Variation of Pore Water Pressure of Slope

Pore water pressure increment (the pore water pressure measured at each point at each time was subtracted from the pore water pressure before the test (9 h per day)) is adopted for analysis.

3.2.1. Variation of Pore Water Pressure at Top of Slope (H1 = 1.0 m)

Figure 7 shows the curve of pore water pressure increment versus time at the top of slope (H1 = 1.0 m) (pp1 is located in the original slope, pp2 is located in the LFSI, and pp3 is located in the fill slope, where pp represents pore water pressure, the number is the corresponding measuring point position number). It can be found that the pore pressure at each measuring point increases sharply first and then decreases in the process of rainfall. The change of pore water pressure mainly comes from seepage. In the process of rainfall, rainwater infiltrates from the top of the slope and the slope surface, and seepage occurs inside the slope, which makes the pore water pressure gradually increase. As the infiltration of rainwater gradually forms a transient saturated zone on the surface of the slope body, the infiltration rate of rainwater decreases, resulting in a slow or declining increase of pore pressure. Pore water pressure decreases gradually after rainfall due to the lack of water replenishment and evaporation of slope.

3.2.2. Variation of Pore Water Pressure in Middle and Upper Slope (H2 = 0.8 m)

Figure 8 shows the curve of pore water pressure increment versus time in middle and upper slope (H2 = 0.8 m) (pp5 is located in the original slope, pp6 is located in the LFSI, and pp6 is located in the fill slope). It can be found that the pore pressure at each measuring point gradually increases sharply, then increases slowly or decreases, and decreases gradually after the end of rainfall.

3.2.3. Variation of Pore Water Pressure in Slope Toe (H3 = 0.4 m)

Figure 9 shows the curve of pore water pressure increment versus time in slope toe (H3 = 0.4 m) (pp7 is located in the original slope, pp8 is located in the LFSI, and pp9 is located in the fill slope). As can be seen from Figure 9, pore water pressure at each measuring point first rises sharply, then rises slowly or decreases, and gradually decreases after the end of rainfall. The pore pressure data fluctuated significantly after the rainfall at pp9 measurement point on the fourth day, which may be caused by the mudflow destruction at the foot of slope on the third day and the rainfall on the fourth day, resulting in the development of cracks near pp9 measurement point, and the pore pressure oscillated significantly under the action of rainfall in the following days.

4. Discussion

4.1. Variation Characteristics of Water Content and Pore Pressure

Figure 10a shows the daily maximum increment change curves of water content at W2 and W3 at the top of the slope (H1 = 1.0 m). It can be seen that the maximum daily increment of water content Δw gradually decreases with the increase of rainfall days, and the cumulative increment value is 99.5% and 63.4%, respectively, which may be because with the increase of rainfall days, the soil at W2 and W3 is closer to the saturated water content [23], resulting in the decrease of the maximum increment, which is consistent with the model test conclusion of Crosta [24] and Li et al. [25]. In Figure 10b, W5 shows a similar law with the W2 and W3, and the cumulative increment value is 79.2%, while the daily maximum increment of water content of W6 in the filling slope increases first and then decreases gradually with the increase of rainfall days. It can be seen from Figure 10c that the daily maximum increment of water content at W8 and W9 increased first and then decreased gradually with the increase of rainfall days, and both reached the maximum value on the second day of rainfall, but the cumulative increment value is55.0% and 51.7%, respectively. It is speculated that this may be related to scouring damage in the middle of slope on the second day of rainfall.
Figure 11a shows the daily maximum increment change curves of pore water pressure at the top of the slope (H1 = 1.0 m). On the first to fourth day of rainfall, pp1, pp2 and pp3 near the top of the slope showed that the daily maximum pore water pressure increment Δμ gradually increases and the increasing speed is slower with the increase of rainfall days. Under the action of rainfall, the daily maximum pore pressure increment at LFSI (pp2) near the top of the slope is greater than that of the fill slope (pp3), which once again shows that rainfall at LFSI is easy to infiltrate. As can be seen from Figure 11b, the daily maximum pore pressure increments at pp4, pp5 and pp6 are characterized by a sharp increase at the beginning of the rainfall, then a steady increase, and finally an increase trend. The daily maximum increments at LFSI and within the filling slope are greater than those within the original slope (pp4 measuring point), while the daily maximum pore pressure increment at pp5 at LFSI is basically stable in the later stage of rainfall. It can be seen from Figure 11c that the daily maximum pore pressure increment of each measuring point pp7, pp8 and pp9 on the first to fourth day of rainfall gradually increases with the increase of rainfall days. Locally, the daily maximum pore pressure increment of pp9 at the foot of the fill slope first decreases, then increases and finally decreases, which is closely related to the process of water enrichment at the foot of the slope and water seepage after slump, and also consistent with the experimental results of Chueasamat et al. [26] and Orense et al. [27].

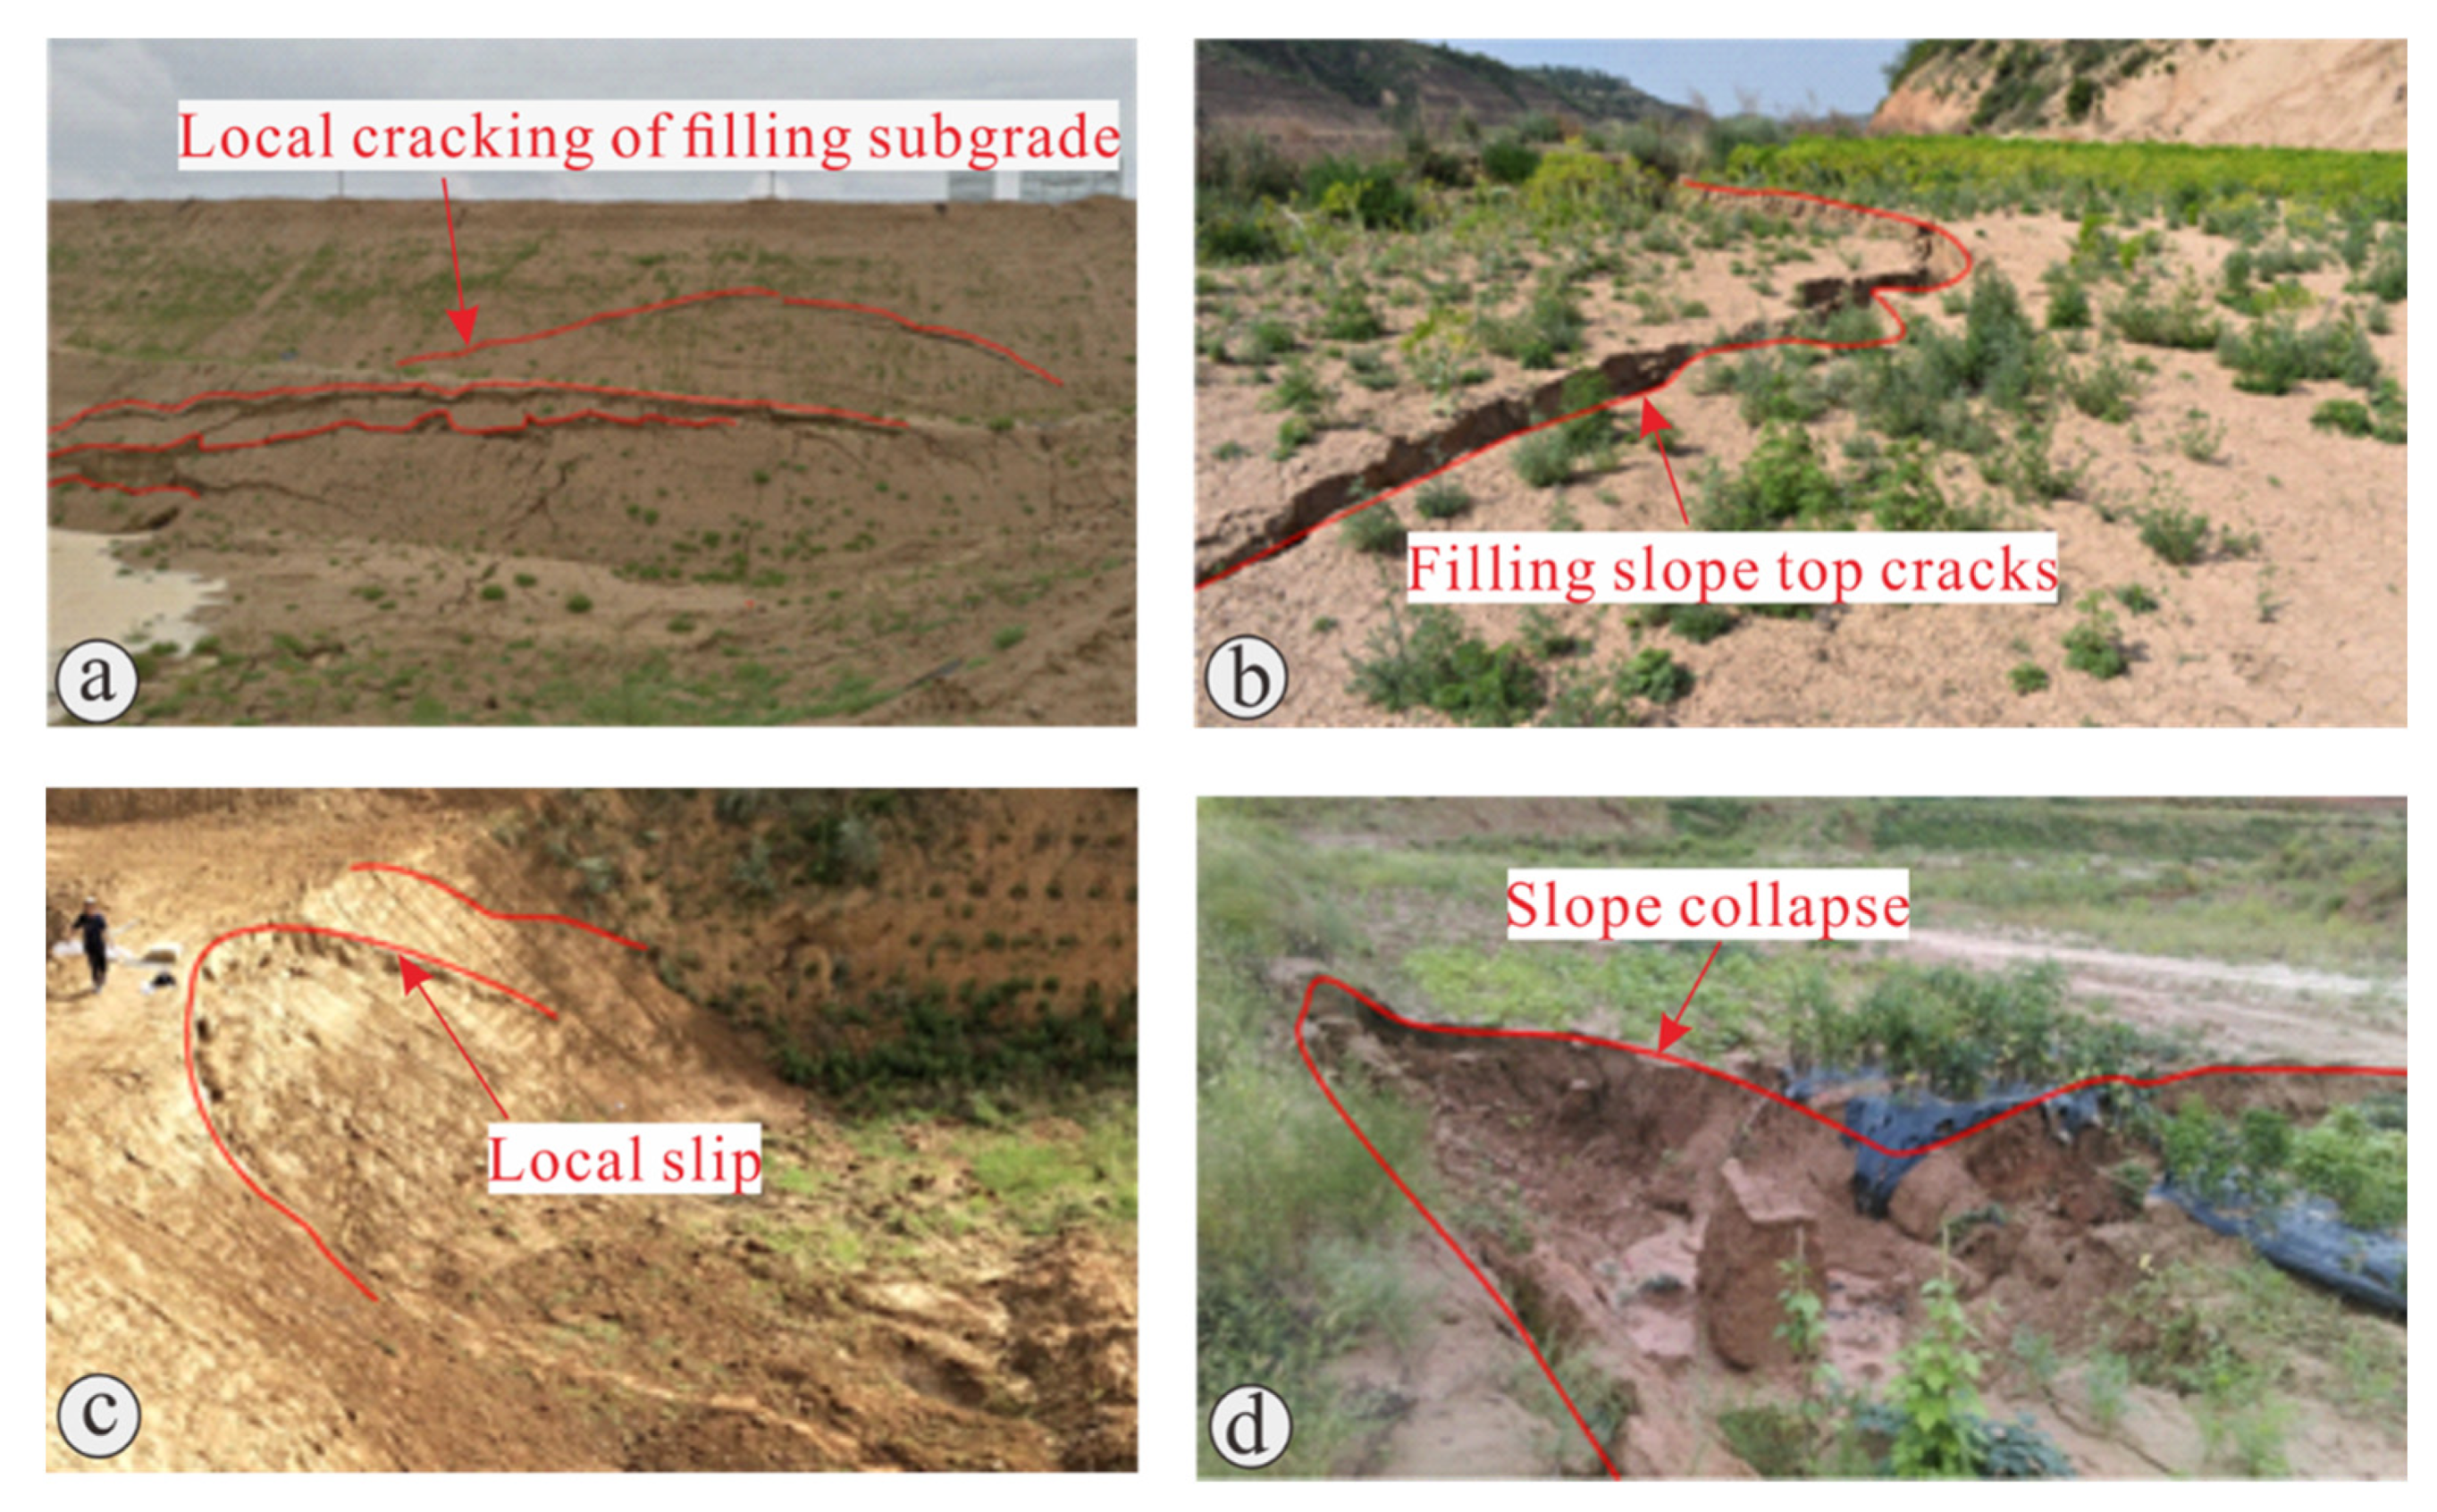
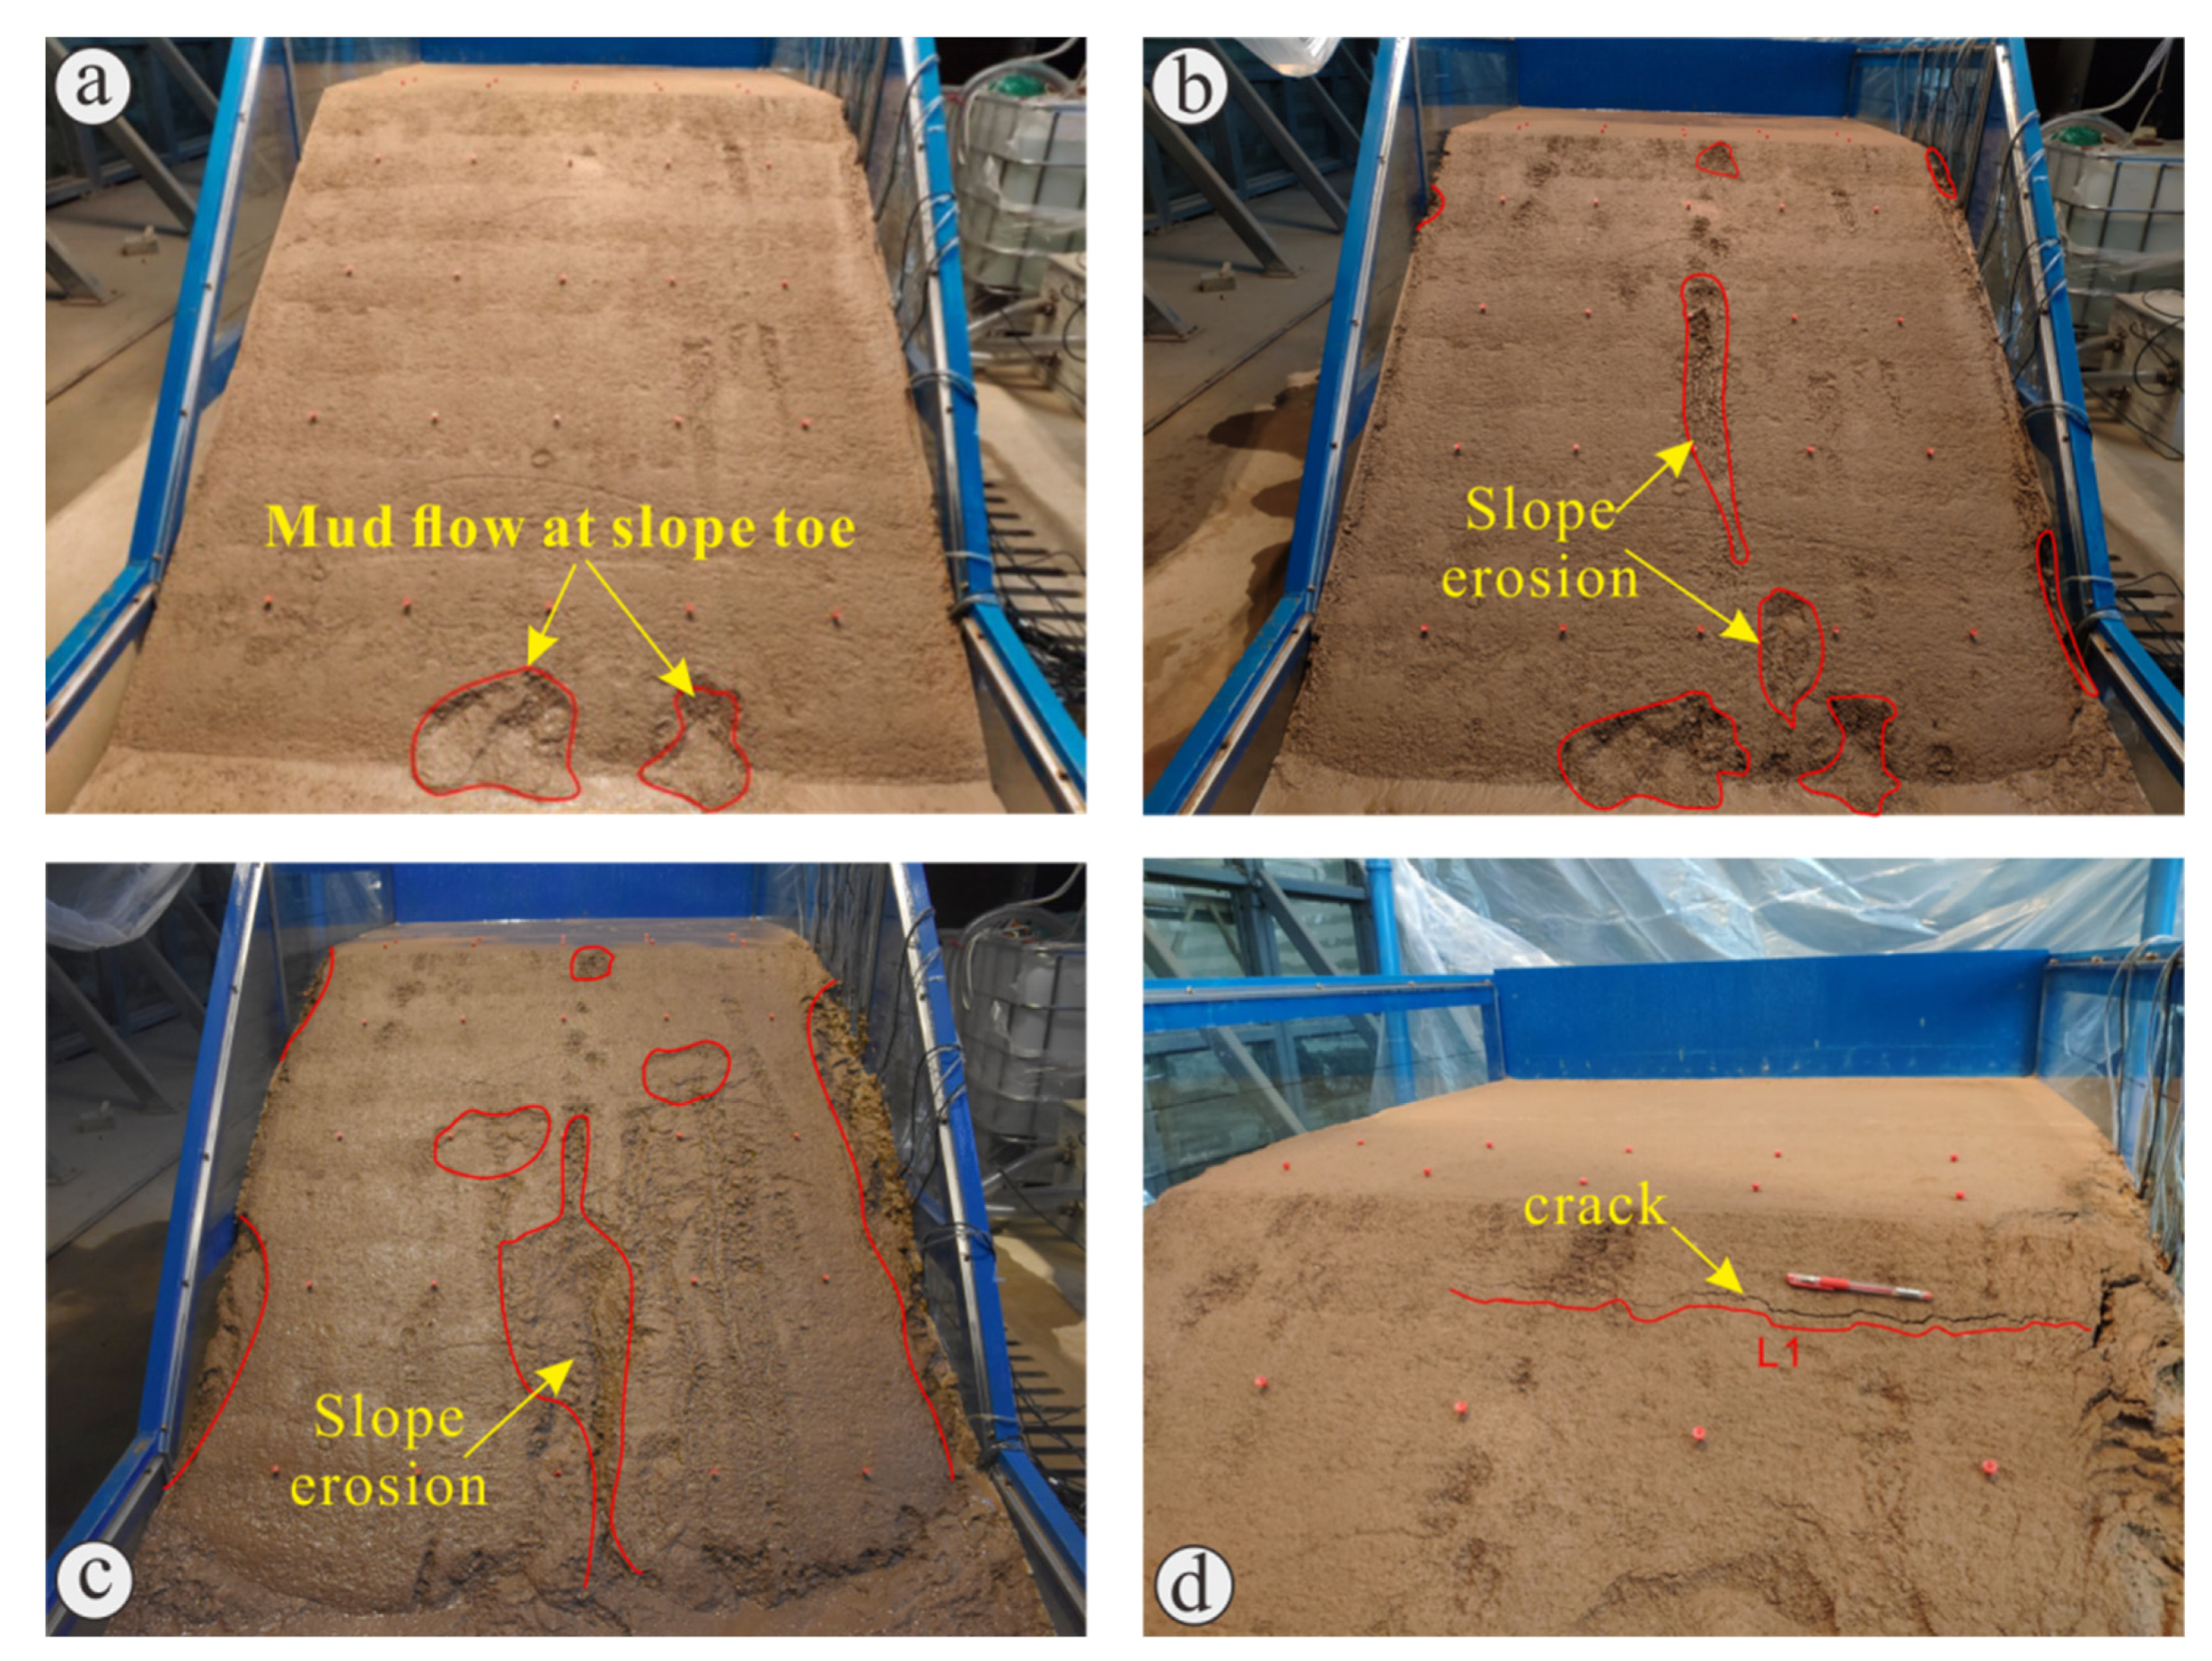
4.2. Analysis of Slope Deformation Characteristics and Failure Process

The increase of pore water pressure will cause slope failure during rainfall [28,29,30]. The foot of the filled slope is the most vulnerable place to damage under the action of rainfall [13,17,26,27], which is due to the low terrain at the toe of the slope, the rainwater is easy to collect, and the soil is soaked [17,27,31], resulting in the reduction of shear strength. At 14 h 25 min on the first day of rainfall, two mud flow failures occurred at the slope toe (Figure 12a). Figure 12b shows that there are many small-scale mud flow damages on the slope surface at 17 h 45 min after the end of rainfall on the first day, and local erosion damages occur in the middle and both sides. Figure 12c shows the picture of slope surface 18 h after the end of rainfall on the second day. The slope erosion continued to intensify on the second day of rainfall, and the erosion on the right side is the most serious. Obvious cracks appeared at 8 h 50 min before rainfall on the third day near the slope shoulder (Figure 12d), which may be related to the evaporation of water at night on the previous day. The crack L1 was about 18 cm from the slope shoulder, about 90 cm in length, and about 47 cm from the left side of the model box.
At 17 h 26 min on the third day of rainfall, two large-scale shallow sliding failures occurred at about 0.85 m from the bottom of the slope (Figure 13a). The sliding width of the left side is about 74.2 cm and the right sliding width is about 65.8 cm, and the right sliding trailing edge was 22 cm more than the left sliding trailing edge. It can also be seen from slope monitoring landmarks 6-2 and 6-4 that there is also a small scale of sliding damage above shallow sliding. Under the action of long-term rainfall, shallow sliding failure is more likely to occur in the lower part of the slope, which is consistent with Wu et al. [32] and Kim et al. [33] model test. At 8 h 50 min before the rainfall on the fourth day, there were five cracks near the slope shoulder (Figure 13b), and four new cracks (L2, L3, L4 and L5) were generated on the slope surface and slope top near the slope shoulder. The length of L1 does not change, but the width increases; L2 and L3 are located on the slope, L2 is about 38 cm long, 22 cm away from the slope shoulder, and L3 is about 32 cm long, 35 cm away from the slope shoulder; L4 and L5 are located on the slope top, L4 is about 52 cm long, and the longest distance slope shoulder is about 14 cm and L5 is about 31 cm long, 12 cm away from the slope shoulder. The development of cracks indicates that the continuous action of rainfall produces the change of stress field in the slope [34,35], and the tensile stress is generated near the top and shoulder of the slope, which is easy to produce tensile failure [35,36].
Figure 14a shows the change of shoulder cracks in the first 8 h 50 min of daily rainfall from day four to day nine. Under the action of continuous rainfall, the cracks near the slope shoulder gradually increased, expanded and deepened, L4 and L5 cracks began to connect from the sixth day, and gradually developed in the later stage, but there was no significant change in the overall shape of the slope from the third day. Moreover, on the eighth day of rainfall, the slope body was still not damaged along the crack, which may be due to the blockage of the shear outlet of the sliding body on the slope shoulder by the mud flow accumulated at the slope foot (Figure 14b). Considering the gentle angle of the slope itself and no further change in the overall shape of the slope since the mud flow at the foot of the slope, the test was stopped after the rainfall on the eighth day.
In summary, the deformation and failure mode of loess fill slope under rainfall is shallow slip, and the failure process can be summarized as follows: local mud flow failure at the toe of the slope → erosion in the middle of the slope → crack initiation on the shoulder of the slope → local slip on the slope → crack propagation on the shoulder of the slope → shallow slip on the shoulder of the slope. Under the long-term effect of rainfall, the loess fill slope of mountain excavation and city construction project will first appear small mud flow damage at the foot of the slope, and then cracks appear at the shoulder of the slope. Rainwater infiltrates along the interface between the original slope and the filling slope and cracks, resulting in a sharp increase in the internal moisture content and pore pressure of the filling slope, which reduces the strength of the slope soil. Especially, under the action of repeated rainfall, the shallow surface soil will suffer obvious damage by dry-wet cycle [36,37], rainwater is more easily infiltrated, and the shear strength of soil will be reduced [38,39], resulting in the shallow landslide disaster of the filling slope. Therefore, it is necessary to pay attention to the treatment of slope shoulder and interface, and strengthen drainage and ecological protection measures for loess fill slope of mountain excavation and city construction project [13].

5. Conclusions

Taking the typical mountain excavation and city construction project fill slope in Yan’an as the research background, through the physical model test of filling slope considering interface effect under rainfall, the following conclusions are drawn:
(1)
The essence of the “interface effect” of loess fill slope is that the interface is a dominant seepage channel of rainfall, and there is lag phenomenon of rainfall infiltration along the interface; that is, some water will continue to accumulate at the interface of loess fill slope after rainfall, and continue to infiltrate along the interface;
(2)
The increase of pore water pressure will cause slope failure during rainfall, and the foot of the filled slope is the most vulnerable place to damage under the action of rainfall, which is due to the low terrain at the toe of the slope, the rainwater is easy to collect, and the soil is soaked, resulting in the reduction of shear strength. The appearance picture of slope deformation characteristics shows that shallow sliding failure is more likely to occur in the lower part of the slope under long-term rainfall;
(3)
The deformation and failure mode of loess fill slope under rainfall is shallow slip, and the failure process can be summarized as follows: local mud flow failure at the toe of the slope → erosion in the middle of the slope → crack initiation on the shoulder of the slope → local slip on the slope → crack propagation on the shoulder of the slope → shallow slip on the shoulder of the slope.
The interface and its effect in the geological body is a very complex, difficult and meaningful research topic. As for the simulation of the original slope in the indoor model test of the excavated and filled slope of the City-building gully, since the original slope is formed for a long time and has its own structure in practical engineering, and it is impossible to simulate the original slope in the laboratory through simple ramming. Therefore, how to simulate the original slope needs further discussion and verification. In addition, the interface simulation is difficult in the model test. The slope is formed by tamping; therefore, the original slope and filling are simulated by plastic window gauze, and the test effect is not ideal. How to simulate the interface and reflect the interface effect in the model test needs further discussion and verification.

Author Contributions

Writing—original draft preparation, W.T.; conceptualization, Q.H.; writing—review and editing, Q.H. and X.C.; visualization, W.T. All authors have read and agreed to the published version of the manuscript.

Funding

This work was supported by The National key research and development program of China (NO.2021YFC3000404), The State Key Research Development Program of China (Grant No. 2017YFD0800501) and Major projects of the National Natural Science Foundation of China (41790443) are gratefully acknowledged.

Institutional Review Board Statement

Not applicable.

Informed Consent Statement

Not applicable.

Data Availability Statement

Not applicable.

Conflicts of Interest

The authors declare no conflict of interest.

References

  1. Peng, J.; Fan, Z.; Wu, D.; Huang, Q.; Wang, Q.; Zhuang, J.; Che, W. Landslides triggered by excavation in the loess plateau of China: A case study of Middle Pleistocene loess slopes. J. Asian Earth Sci. 2019, 171, 246–258. [Google Scholar] [CrossRef]
  2. Li, P.; Qian, H.; Wu, J. Environment: Accelerate research on land creation. Nat. News 2014, 510, 29. [Google Scholar] [CrossRef] [PubMed]
  3. Derbyshire, E.; Dijkstra, T.; Smalley, I.; Li, Y. Failure mechanisms in loess and the effects of moisture content changes on remoulded strength. Quat. Int. 1994, 24, 5–15. [Google Scholar] [CrossRef]
  4. Wang, X.; Lian, B.; Liu, K.; Luo, L. Trigger mechanism of loess-mudstone landslides inferred from ring shear tests and numerical simulation. J. Mt. Sci. 2021, 18, 2412–2426. [Google Scholar] [CrossRef]
  5. Zhang, S.; Zhao, L.; Delgado-Tellez, R.; Bao, H. A physics-based probabilistic forecasting model for rainfall-induced shallow landslides at regional scale. Nat. Hazards Earth Syst. Sci. 2018, 18, 969–982. [Google Scholar] [CrossRef] [Green Version]
  6. Solgi, A.; Naghdi, R.; Zenner, E.K.; Hemmati, V.; Behjou, F.K.; Masumian, A. Evaluating the Effectiveness of Mulching for Reducing Soil Erosion in Cut Slope and Fill Slope of Forest Roads in Hyrcanian Forests. Croat. J. For. Eng. 2021, 42, 259–268. [Google Scholar] [CrossRef]
  7. Day, R.W. Fill-Slope Failure and Repair. J. Perform. Constr. Facil. 1992, 6, 161–168. [Google Scholar] [CrossRef]
  8. Cheuk, C.; Ng, C.; Sun, H. Numerical experiments of soil nails in loose fill slopes subjected to rainfall infiltration effects. Comput. Geotech. 2005, 32, 290–303. [Google Scholar] [CrossRef]
  9. Zhang, W.; Tang, L. Settlement and deformation laws of high loess-filled embankment based on centrifugal model test. Appl. Mech. Mater. 2011, 90, 222–229. [Google Scholar] [CrossRef]
  10. Duan, L.; He, G.; Yi, J.; Li, Y. Numerical simulation and monitoring analysis for high-fill slope. Adv. Mater. Res. 2013, 639, 274–278. [Google Scholar] [CrossRef]
  11. Zhao, J.; Wang, J.; Gu, T. Study on deformation characteristic and mechanism of expansive soil fill slope under precipitation-evaporation cycle. J. Nat. Disasters 2013, 22, 116–124. [Google Scholar]
  12. Wang, H.; Tuo, X.; Zhang, G.; Peng, F. Panzhihua airport landslide (3 October 2009) and an emergency monitoring and warning system based on the internet of things. J. Mt. Sci. 2013, 10, 873–884. [Google Scholar] [CrossRef]
  13. Chang, Z.; Huang, F.; Huang, J.; Jiang, S.; Zhou, C.; Zhu, L. Experimental study of the failure mode and mechanism of loess fill slopes induced by rainfall. Eng. Geol. 2021, 280, 105941. [Google Scholar] [CrossRef]
  14. Askarinejad, A.; Akca, D.; Springman, S. Precursors of instability in a natural slope due to rainfall: A full-scale experiment. Landslides 2018, 15, 1745–1759. [Google Scholar] [CrossRef] [Green Version]
  15. Rosi, A.; Peternel, T.; Jemec-Aufli, M.; Komac, M.; Segoni, S.; Casagli, N. Rainfall thresholds for rainfall-induced landslides in Slovenia. Landslides 2016, 13, 1571–1577. [Google Scholar] [CrossRef]
  16. Lee, L.; Kassim, A.; Gofar, N. Performances of two instrumented laboratory models for the study of rainfall infltration into unsaturated soils. Eng. Geol. 2011, 117, 78–89. [Google Scholar] [CrossRef]
  17. Tohari, A.; Nishigaki, M.; Komatsu, M. Laboratory Rainfall-Induced Slope Failure with Moisture Content Measurement. J. Geotech. Geoenviron. Eng. 2007, 133, 575–587. [Google Scholar] [CrossRef]
  18. Saadatkhah, N.; Kassim, A.; Lee, L.M.; Rahnamarad, J. Spatiotemporal regional modeling of rainfall-induced slope failure in Hulu Kelang, Malaysia. Env. Earth Sci. 2015, 73, 8425–8441. [Google Scholar] [CrossRef] [Green Version]
  19. Hakro, M.; Harahap, I. Laboratory experiments on rainfall-induced flowslide from pore pressure and moisture content measurements. Nat. Hazards Earth Syst. Sci. Discuss. 2015, 3, 1575–1613. [Google Scholar]
  20. Gallage, C.; Abeykoon, T.; Uchimura, T. Instrumented model slopes to investigate the effects of slope inclination on rainfall-induced landslides. Soils Found. 2021, 61, 160–174. [Google Scholar] [CrossRef]
  21. Hu, X.; He, C.; Zhou, C.; Xu, C.; Zhang, H.; Wang, Q.; Wu, S. Model test and numerical analysis on the deformation and stability of a landslide subjected to reservoir filling. Geofluids 2019, 2019, 5924580. [Google Scholar] [CrossRef] [Green Version]
  22. Liu, H.; Men, Y.; Li, X.; Yan, J.; Zhang, T. Study on slip material in landslide model tests. J. Catastrophol. 2011, 26, 10–13. (In Chinese) [Google Scholar]
  23. Tu, X.; Kwong, A.; Dai, F.; Tham, L.; Min, H. Field monitoring of rainfall infiltration in a loess slope and analysis of failure mechanism of rainfall-induced landslides. Eng. Geol. 2009, 105, 134–150. [Google Scholar] [CrossRef]
  24. Crosta, G. Regionalization of rainfall thresholds: An aid to landslide hazard evaluation. Environ. Geol. 1998, 35, 131–145. [Google Scholar] [CrossRef]
  25. Li, A.; Tham, L.; Yue, Z.; Lee, C.; Law, K. Comparison of field and laboratory soil-water characteristic curves. J. Geotech. Environ. Eng. 2005, 131, 1176–1179. [Google Scholar] [CrossRef]
  26. Chueasamat, A.; Hori, T.; Saito, H.; Sato, T.; Kohgo, Y. Experimental tests of slope failure due to rainfalls using 1g physical slope models. Soils Found. 2018, 58, 290–305. [Google Scholar] [CrossRef]
  27. Orense, R.; Shimoma, S.; Maeda, K.; Towhata, I. Instrumented model slope failure due to water seepage. J. Nat. Disaster Sci. 2004, 26, 15–26. [Google Scholar] [CrossRef] [Green Version]
  28. Li, W.; Lee, L.; Cai, H.; Li, H.; Dai, F.; Wang, M. Combined roles of saturated permeability and rainfall characteristics on surficial failure of homogeneous soil slope. Eng. Geol. 2013, 153, 105–113. [Google Scholar] [CrossRef]
  29. Dyer, M. Performance of flood embankments in England and Wales. Proceedings of the 490 Institution of Civil Engineers. Water Manag. 2004, 157, 177–186. [Google Scholar]
  30. Huang, C.; Ju, Y.; Hwu, L.; Lee, J. Internal soil moisture and piezometric responses to rainfall-induced shallow slope failures. J. Hydrol. 2009, 370, 39–51. [Google Scholar]
  31. Hakro, M.; Harahap, I.; Memon, I. Model experiment on rainfall-induced slope failures with moisture content measurements. Res. J. Appl. Sci. Eng. Technol. 2016, 13, 122–130. [Google Scholar] [CrossRef]
  32. Wu, L.; Zhang, L.; Zhou, Y.; Xu, Q.; Yu, B.; Liu, G.; Bai, L. Theoretical analysis and model test for rainfall induced shallow landslides in the red-bed area of Sichuan. Bull. Eng. Geol. Environ. 2018, 77, 1343–1353. [Google Scholar] [CrossRef]
  33. Min, S.; Yuichi, O.; Taro, U.; Jin, K.; Young, S. Effect of seepage on shallow landslides in consideration of changes in topography: Case study including an experimental sandy slope with artificial rainfall—Sciencedirect. CATENA 2018, 161, 50–62. [Google Scholar]
  34. Qi, S.; Vanapalli, S. Simulating hydraulic and mechanical responses of unsaturated expansive soil slope to rainfall: Case study. Int. J. Geomech. 2018, 18, 05018002.1–05018002.17. [Google Scholar] [CrossRef]
  35. Pu, X.; Wang, L.; Wang, P.; Chai, S. Study of shaking table test of seismic subsidence loess landslides induced by the coupling effect of earthquakes and rainfall. Nat. Hazards 2020, 103, 923–945. [Google Scholar] [CrossRef]
  36. Zhang, J.; Luo, Y.; Zhou, Z.; Victor, C.; Duan, M. Research on the rainfall-induced regional slope failures along the Yangtze river of Anhui, China. Landslides 2021, 18, 1801–1821. [Google Scholar] [CrossRef]
  37. Yang, L.; Kaisheng, C.; Mengfei, L.; Yingchao, W. Study on failure of red clay slopes with different gradients under dry and wet cycles. Bull. Eng. Geol. Environ. 2020, 79, 4609–4624. [Google Scholar] [CrossRef]
  38. Lian, B.; Peng, J.; Zhan, H.; Huang, Q.; Wang, X.; Hu, S. Formation mechanism analysis of irrigation-induced retrogressive loess landslides. CATENA 2020, 195, 104441. [Google Scholar] [CrossRef]
  39. Wang, X.; Wang, J.; Zhan, H.; Li, P.; Hu, S. Moisture content effect on the creep behavior of loess for the catastrophic Baqiao landslide. CATENA 2020, 187, 104371. [Google Scholar] [CrossRef]
Figure 1. Loess filling slope disaster. (a) Local cracking of filling subgrade, (b) filling slope top cracks, (c) local slip of fill slope and (d) collapse of channel fill slope.
Land 11 01372 g001
Figure 2. Schematic diagrams of the experiment design. (a) Original slope cutting, (b) model stereogram, (c) model side view, (d) slip zone model-Plastic mesh, (e) sensor embedding and (f) layout of slope tracing points-Plastic mesh.
Land 11 01372 g002
Figure 3. Location map of sampling points. (a) Sampling site, Shanxi Province; (b) loess fill in Qilipu community, Yan’an; (c) soil samples for test.
Land 11 01372 g003
Figure 4. Variation of water content in the following days, from the first to the eighth (H1 = 1.0 m).
Land 11 01372 g004
Figure 5. Variation of water content in the following days, from the first to the eighth (H2 = 0.8 m).
Land 11 01372 g005
Figure 6. Variation of water content in the following days, from the first to the eighth (H3 = 0.4 m).
Land 11 01372 g006
Figure 7. Variation of pore water pressure in the following days, from the first to the eighth (H1 = 1.0 m).
Land 11 01372 g007
Figure 8. Variation of pore water pressure in the following days, from the first to the eighth (H2 = 0.8 m).
Land 11 01372 g008
Figure 9. Variation of pore water pressure in the following days, from the first to the eighth (H3 = 0.4 m).
Land 11 01372 g009
Figure 10. Daily maximum increment of moisture content at different measuring points (a) H1 = 1.0 m, (b) H2 = 0.8 m and (c) H3 = 0.4 m.
Land 11 01372 g010
Figure 11. Daily maximum increment of pore pressure increment at different measuring points (a) H1 = 1.0 m, (b) H2 = 0.8 m and (c) H3 = 0.4 m.
Land 11 01372 g011
Figure 12. The deformation characteristics and failure process of slope. (a,b) Mud flow at slope toe and slope erosion on the first day, (c) slope erosion on the second day and (d) slope cracks on the third day.
Land 11 01372 g012
Figure 13. Large-scale shallow sliding failures. (a) Shallow sliding of slope toe, and (b) slope top and surface cracks.
Land 11 01372 g013
Figure 14. Deformation and failure process of fill slope under rainfall. (a) Crack development process near slope shoulder and (b) shallow sliding process.
Land 11 01372 g014
Publisher’s Note: MDPI stays neutral with regard to jurisdictional claims in published maps and institutional affiliations.

