Article

Analysis of Meandering River Morphodynamics Using Satellite Remote Sensing Data—An Application in the Lower Deduru Oya (River), Sri Lanka

by
Vindhya Basnayaka
1,
Jayanga T. Samarasinghe
2,
Miyuru B. Gunathilake
3,4,
Nitin Muttil
5,6,*,
Dileepa C. Hettiarachchi
7,
Amila Abeynayaka
8 and
Upaka Rathnayake
1
1
Department of Civil Engineering, Faculty of Engineering, Sri Lanka Institute of Information Technology, Malabe 10115, Sri Lanka
2
Department of Earth Environmental and Resource Sciences, University of Texas, El Paso, TX 79968, USA
3
Environment and Natural Resources, Norwegian Institute of Bioeconomy and Research, 1433 Ås, Norway
4
Water, Energy and Environmental Engineering Research Unit, Faculty of Technology, University of Oulu, 8000 Oulu, Finland
5
Institute for Sustainable Industries & Liveable Cities, Victoria University, P.O. Box 14428, Melbourne, VIC 8001, Australia
6
College of Engineering and Science, Victoria University, Melbourne, VIC 8001, Australia
7
Department of Irrigation, Office of Director of Irrigation, Airport Road, Anuradhapura 50000, Sri Lanka
8
Institute for Global Environmental Strategies (IGES), 2108-11 Kamiyamaguchi, Hayama 240-0115, Japan
*
Author to whom correspondence should be addressed.
Land 2022, 11(7), 1091; https://doi.org/10.3390/land11071091
Submission received: 2 July 2022 / Revised: 14 July 2022 / Accepted: 15 July 2022 / Published: 16 July 2022

Abstract

:
River meandering and anabranching have become major problems in many large rivers that carry significant amounts of sediment worldwide. The morphodynamics of these rivers are complex due to the temporal variation of flows. However, the availability of remote sensing data and geographic information systems (GISs) provides the opportunity to analyze the morphological changes in river systems both quantitatively and qualitatively. The present study investigated the temporal changes in the river morphology of the Deduru Oya (river) in Sri Lanka, which is a meandering river. The study covered a period of 32 years (1989 to 2021), using Landsat satellite data and the QGIS platform. Cloud-free Landsat 5 and Landsat 8 satellite images were extracted and processed to extract the river mask. The centerline of the river was generated using the extracted river mask, with the support of semi-automated digitizing software (WebPlotDigitizer). Freely available QGIS was used to investigate the temporal variation of river migration. The results of the study demonstrated that, over the past three decades, both the bend curvatures and the river migration rates of the meandering bends have generally increased with time. In addition, it was found that a higher number of meandering bends could be observed in the lower (most downstream) and the middle parts of the selected river segment. The current analysis indicates that the Deduru Oya has undergone considerable changes in its curvature and migration rates.

1. Introduction

River morphodynamics are an intriguing subject and much research has been carried out to study the dynamics of the fluvial processes. Meandering is one important river process that has attracted the attention of researchers worldwide. The process is associated with outer bank erosion and deposition at the inner bank. The velocity and the shear stress distribution asymmetry in curved river segments are the reasons for these erosions and accretion [1]. Estimating and predicting the meandering features of a certain river over time have great importance in engineering and geological applications, such as management of infrastructure, erosion, and agricultural land. Meandering has become a prevailing issue for many major rivers in the world that carry a significant amount of sediment load, including the Amazon River and Yangtze River, and many other alluvial riverine environments. The process is highly dynamic in nature and needs to be assessed with a close examination over a considerable period that is sufficient to capture the dynamics of the river morphology. According to Constantine et al. [2], these large meandering rivers with high sediment transport rates can sometimes have migrations of several meters in a year.
The studies on river meandering in the literature can be categorized into three types based on the method they follow in extracting the meandering parameters. Some studies have adopted analytical methods to analyze the process [3], whereas others have used field measurements [4,5]. Furthermore, some studies have used numerical models to extract the meandering features of rivers [6]. However, with the recent development of remote sensing technologies, the data available for analysis have significantly increased. These remotely sensed data are widely used in many disciplines and for different applications, including geospatial analysis, agricultural management, morphological analysis, etc. Hence, in recent years, several algorithms and programs have been developed to analyze these remotely sensed data [7]. The ability to capture real-time environments using remote sensing technologies within a short time and improved computing capacities have increased the use of remotely sensed images in the estimation of river morphodynamics [8].
Many Sri Lankan rivers are facing major issues due to river meandering, such as the erosion of agricultural land, reduction of flood plain areas, and effects on infrastructure, such as bridge failures, etc. The erosion of outer banks can result in the exposure of the bridge abutments and subsequent failures. Therefore, understanding and predicting the meandering morphodynamics of a certain river have great importance in river management. The Kelani River, the Kalu River, the Deduru Oya, the Gin River, and the Mahaweli River are a few examples of rivers where a significantly meandering process can be observed [9,10,11]. The meandering process can clearly be witnessed downstream of the rivers. However, research efforts to identify the meandering problem are still lacking for many major rivers in Sri Lanka. Several studies have discussed the meandering behavior of Sri Lankan rivers; however, most were focused on various issues related to the meandering process, such as water quality [9,10,11,12,13]. None tried to analyze these rivers in Sri Lanka by using Landsat-based remote sensing data to represent their meandering behavior. Therefore, the search for sustainable solutions in a country like Sri Lanka, which has a radial river system, is challenging. Thus, the research presented herein aimed to provide information about these morphodynamical features for one of the major rivers in Sri Lanka, the Deduru Oya. This is the first attempt to use Landsat remote sensing data in Sri Lankan rivers to capture the meandering behavior, and the findings will be helpful in designing and managing the riverine environment of the Deduru Oya.

Remote Sensing Applications in the Fluvial Context
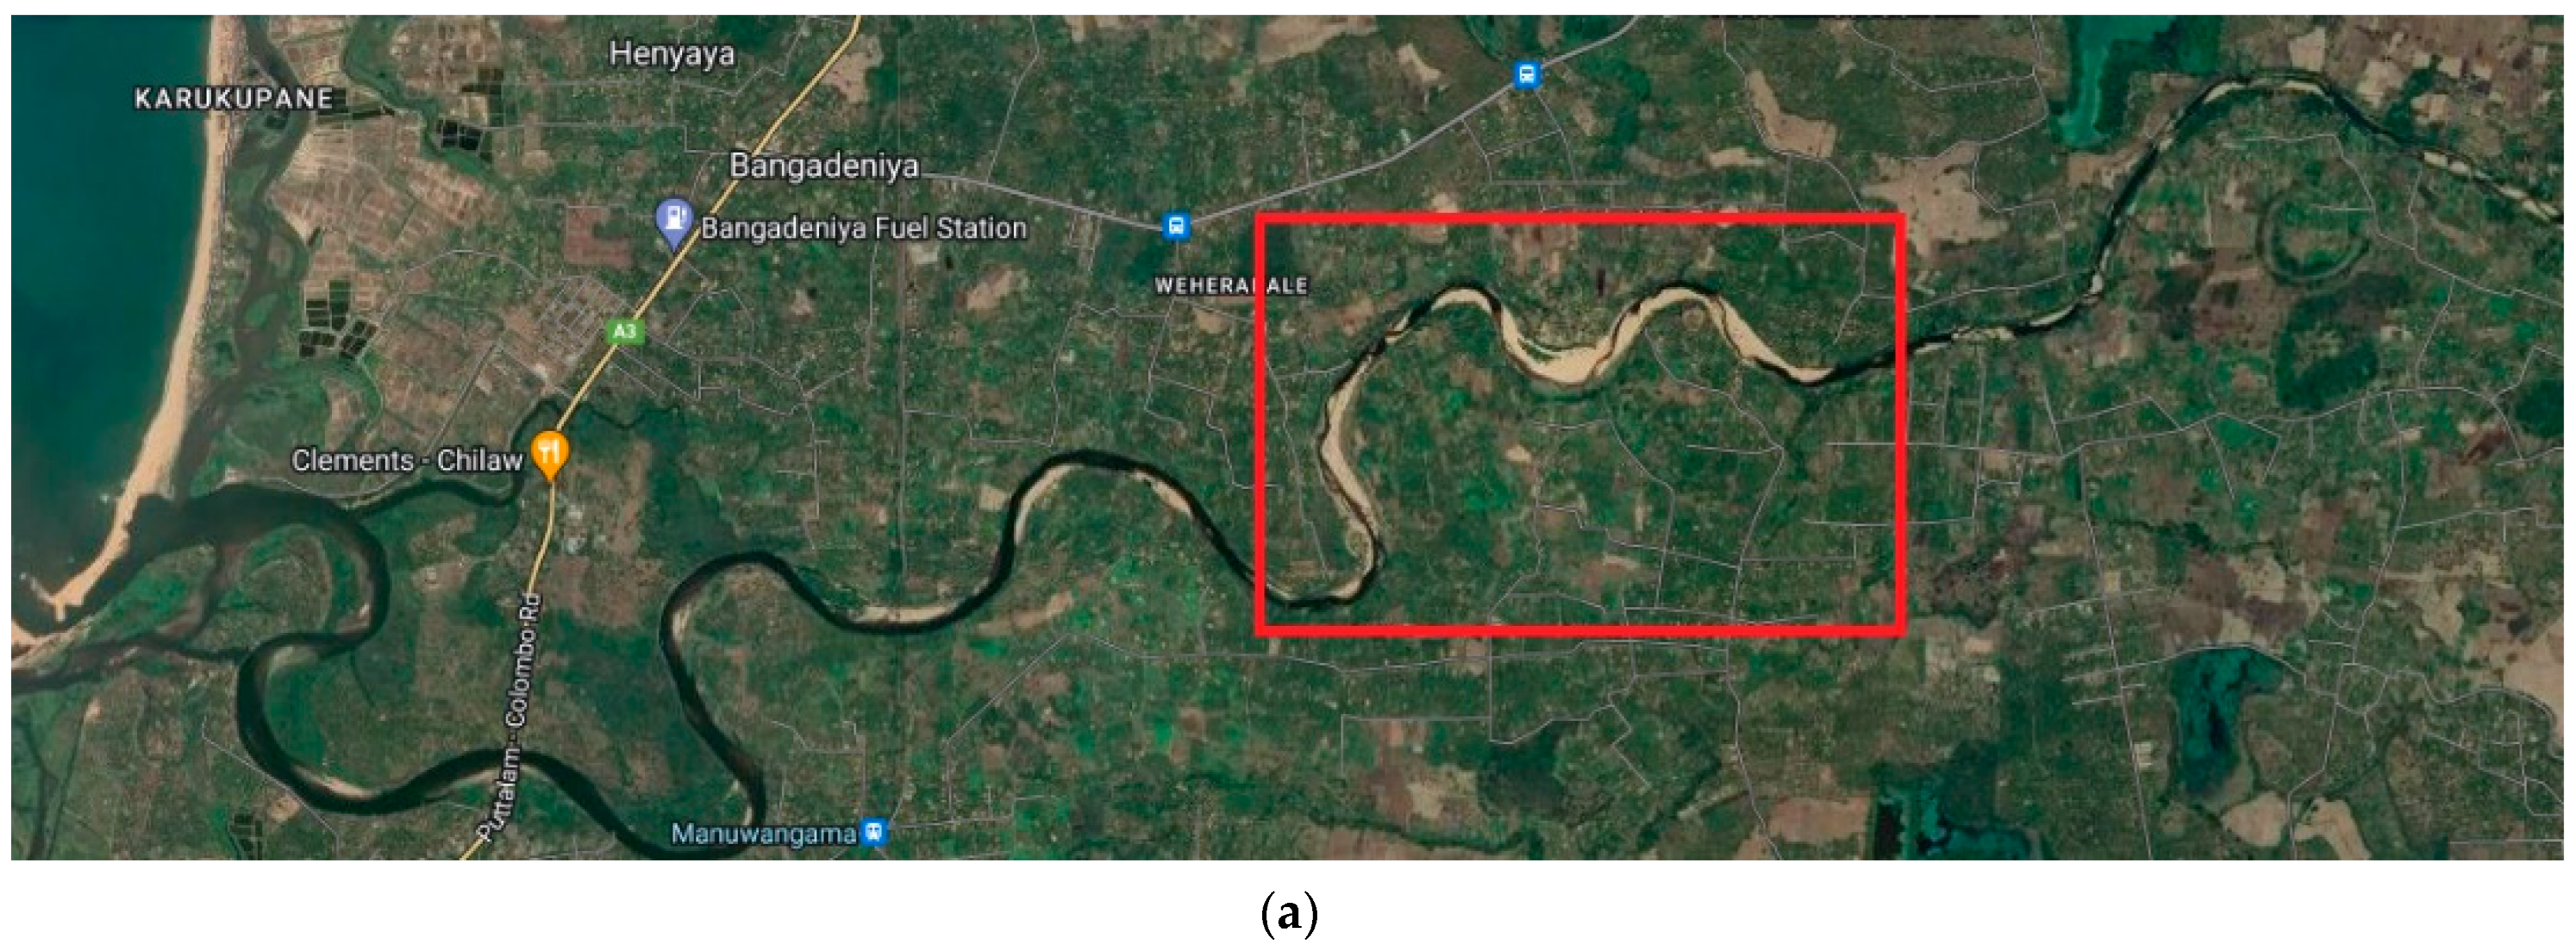
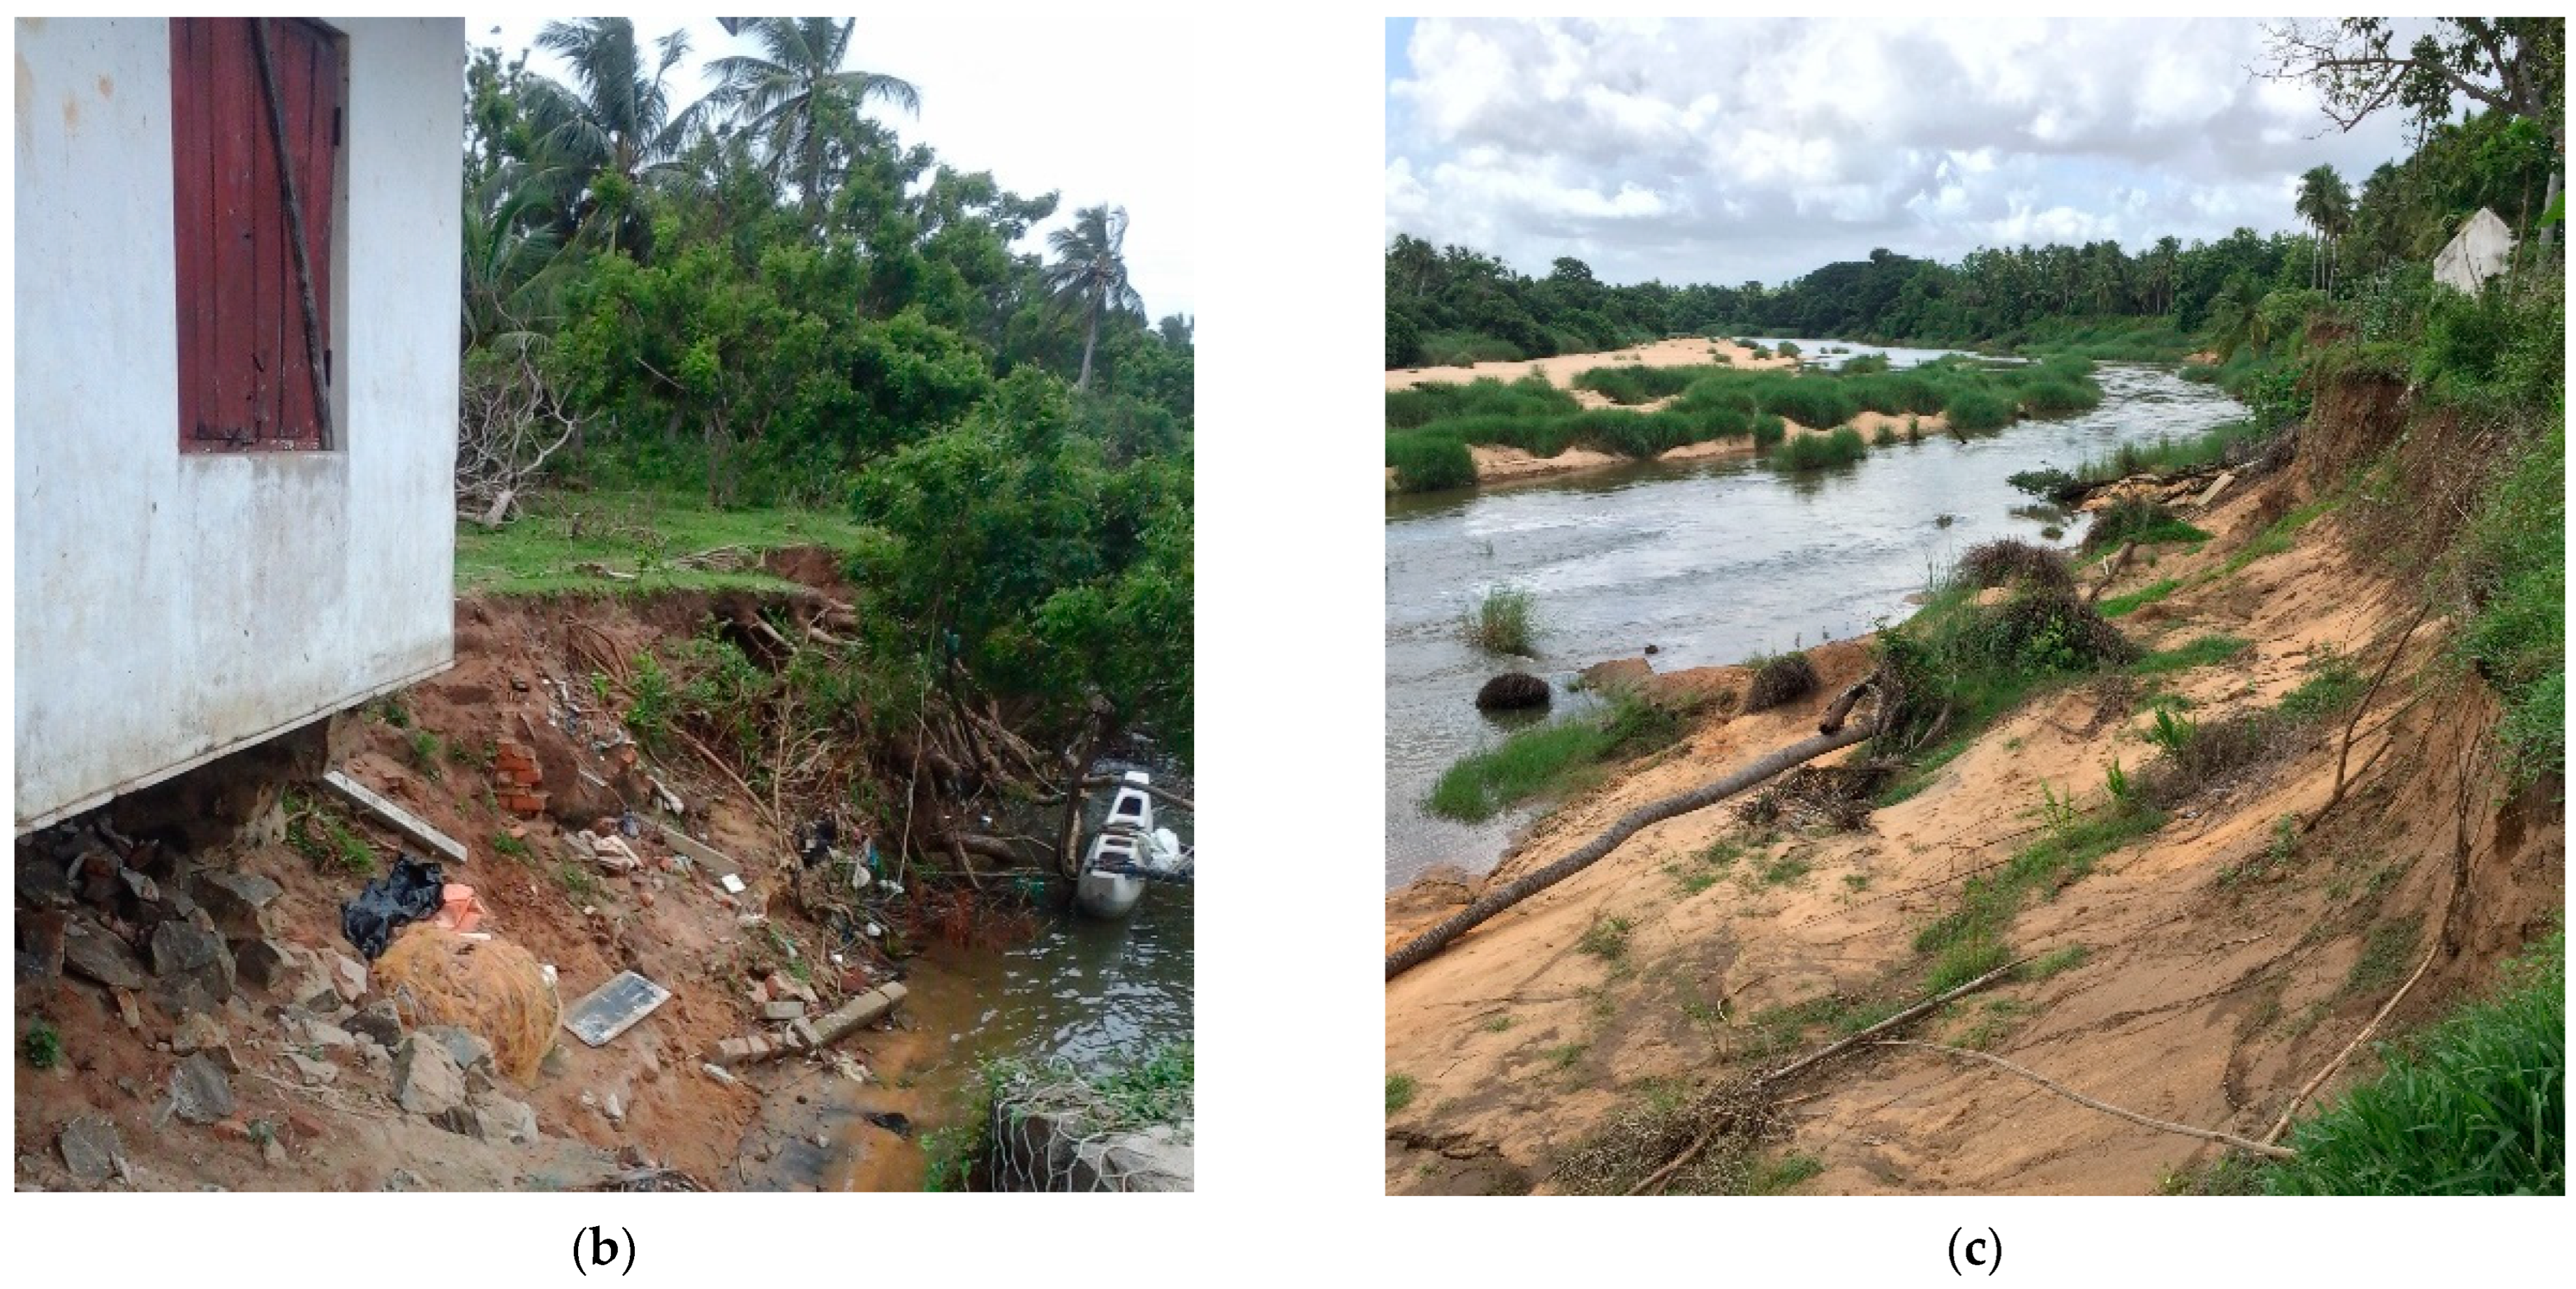
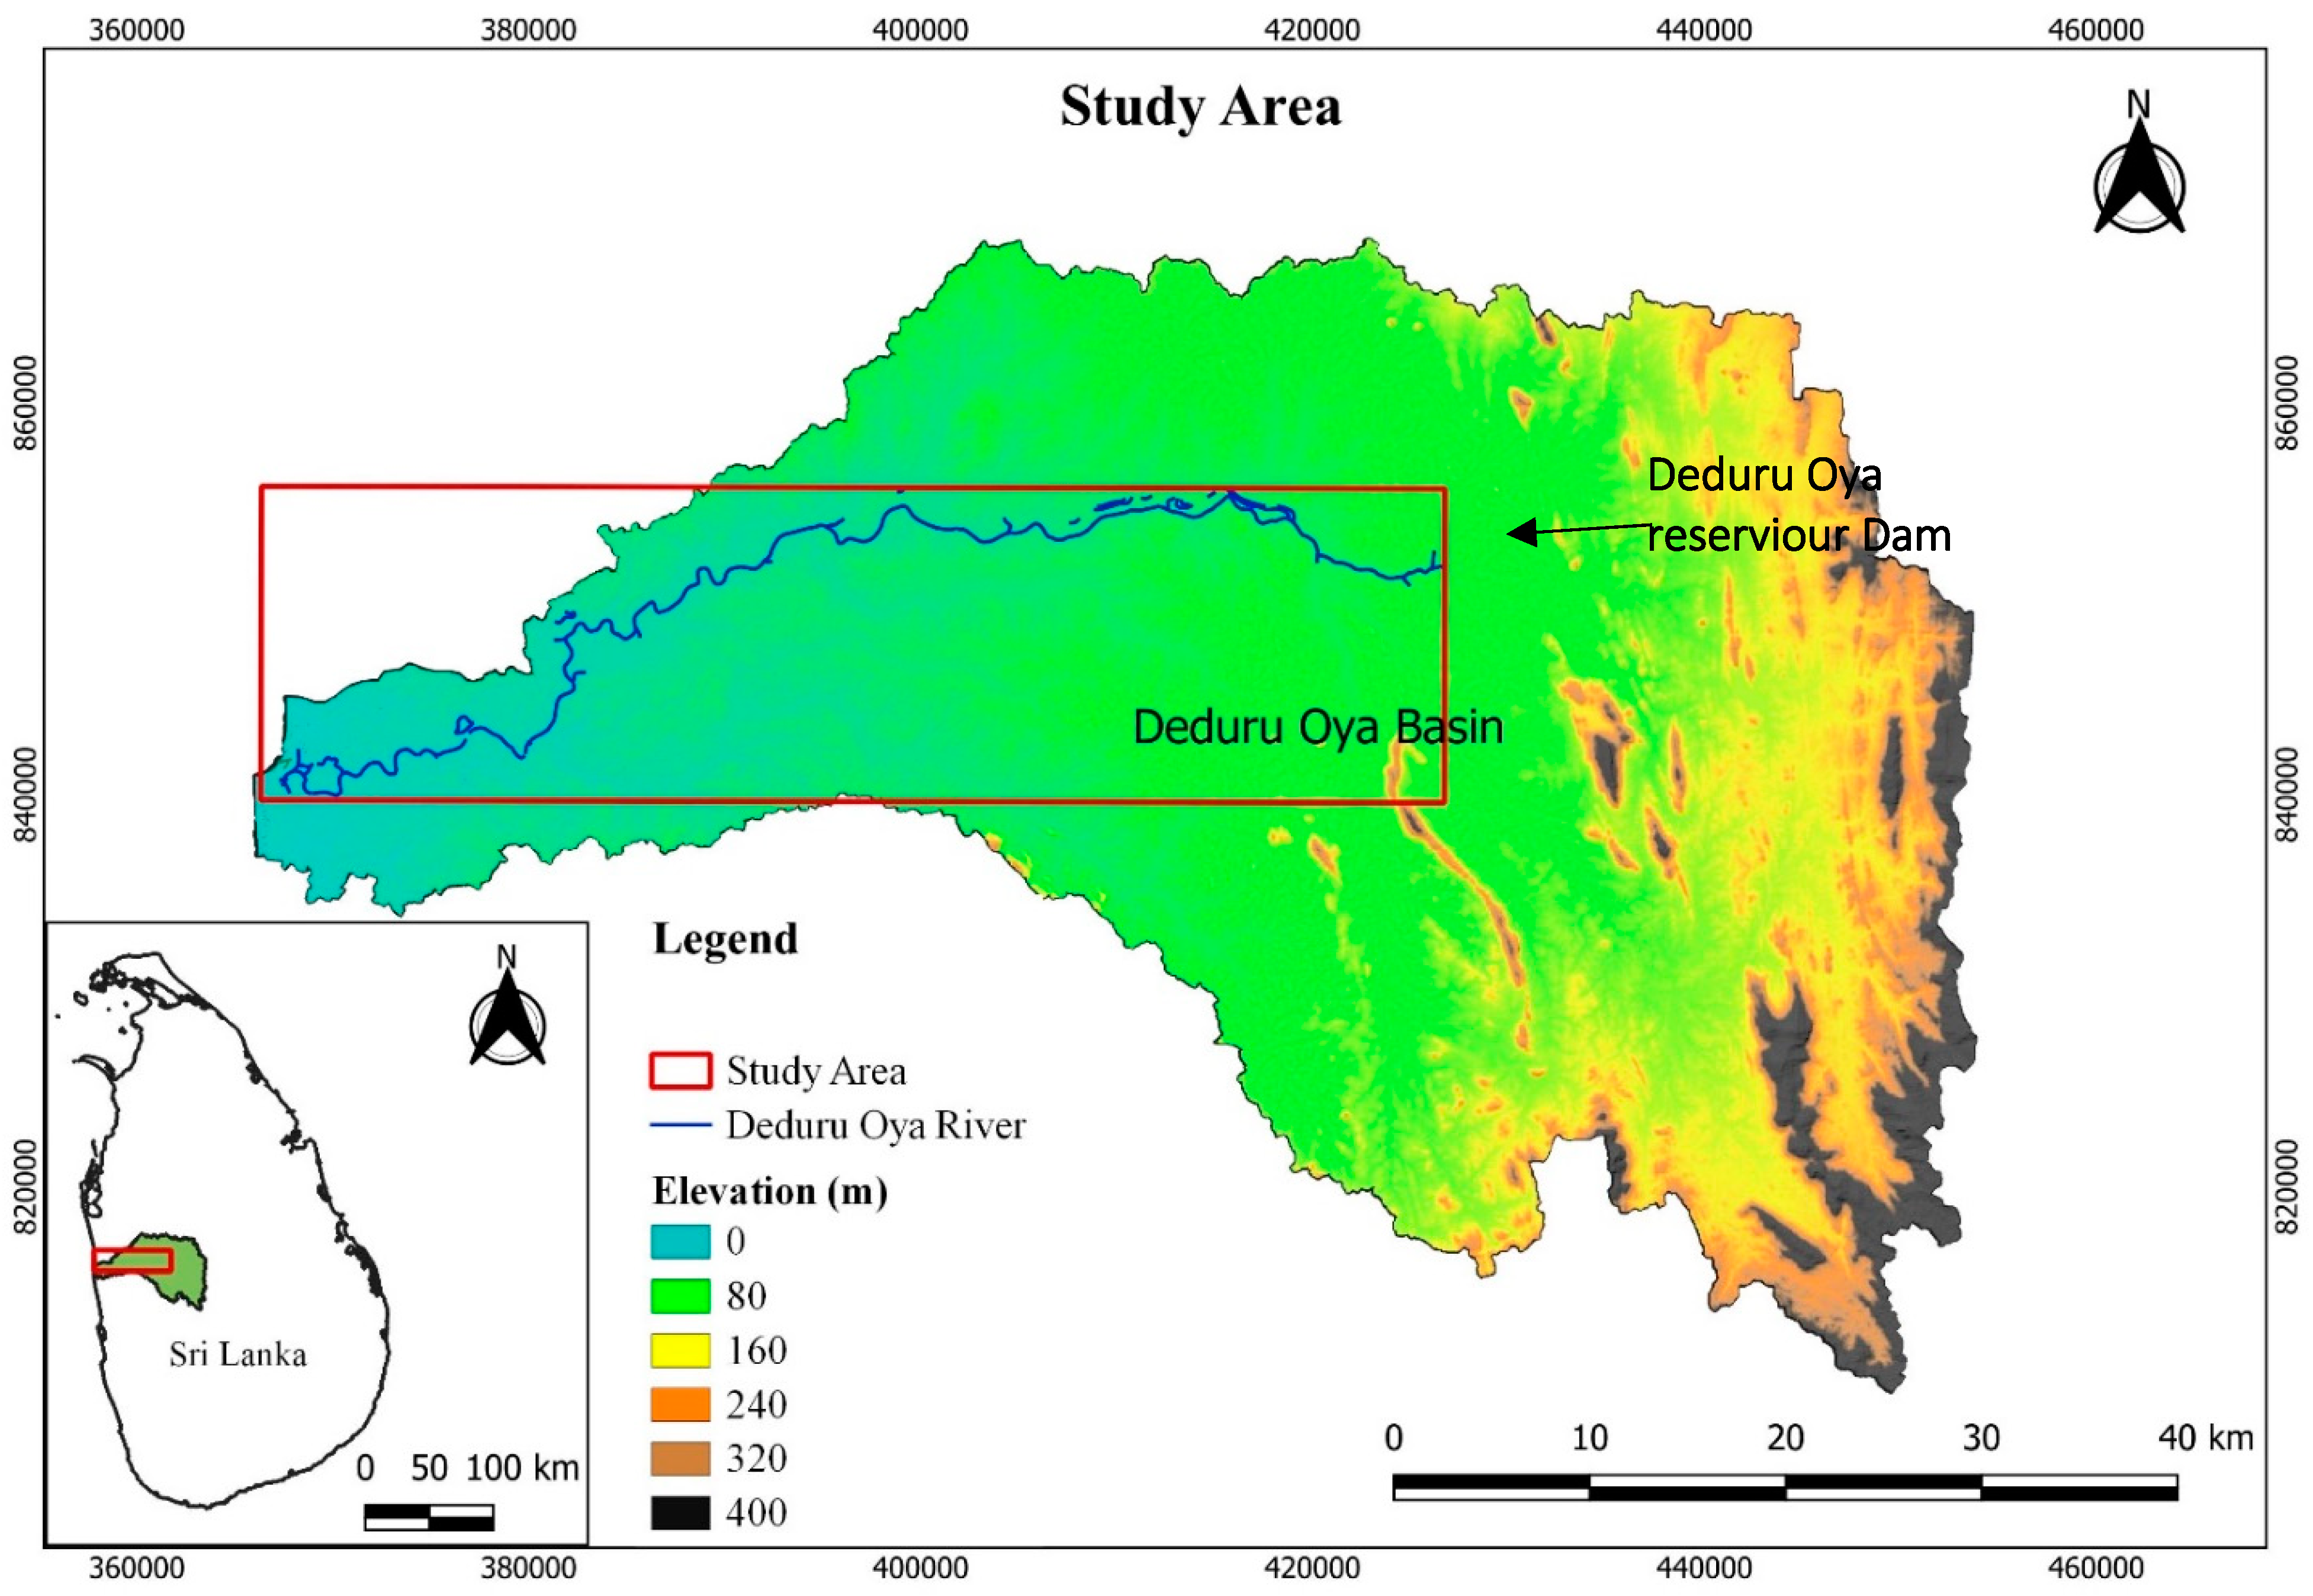
Remotely sensed satellite data are used in many applications, including geological studies, agricultural management, coastal management, spatial planning, land-use management, river management, disaster risk analysis, and GIS mapping [14,15,16,17,18]. Among these applications, the raster-based digital elevation models are useful. The raster-based digital elevation models (DEMs) take satellite images as an input to derive elevations. These DEMs are used in many studies as sources of topographic data because they are easy to access and available over the whole world. Satellite-derived meteorological data (rainfall data, temperature data, evapotranspiration estimates, etc.) are used in data-scarce regions in particular, and these satellite technologies are becoming a good source of data because of their free availability and easy access [19,20]. The recent development of these technologies has significantly increased the availability of satellite images and the tools and software used for analysis. Therefore, in the monitoring and modeling of fluvial processes, remote sensing data are frequently used to estimate river floods and to detect the fluvial planform changes and the controlling processes [21].
The morphological changes in the Bislak and Cagayan Rivers in the Philippines were studied by Boothroyd et al. [22] for a period of over 30 years using Landsat satellite images and the Google Earth Engine (GEE) cloud platform. To estimate the river planform changes, riverbank erosion, and accretion, Rowland et al. [23] introduced an algorithm called Spatially Continuous Riverbank Erosion and Accretion Management (SCREAM), which uses satellite remote sensing data to extract river properties. RivaMap is another algorithm that has been developed to analyze and map river features from remotely sensed satellite images [24]. Indian satellite remote sensing (IRS) data were used by Boruah et al. [25] to map the geomorphology and physical habitats of the Brahmaputhra River close to the Himalayas, where the river is braided and has instabilities.
Combining the available knowledge from this literature, the meandering behavior of the Deduru Oya in Sri Lanka is qualitatively presented in this research.

2. Study Area

Sri Lanka is a water-rich country that has 103 major river basins. The Deduru Oya is one of the major rivers in Sri Lanka, originating in the Western part of the central highlands (in Matale and Kandy districts) and reaching the Indian Ocean on the west coast of Sri Lanka near the Chilaw urban area. Nearly 97% of the river basin lies in the northwestern province and only 3% belongs to the central province [26]. The basin is located in the intermediate agro-climatic zone. Based on the terrain features, the catchment of the Deduru Oya is categorized into two classes: uplands and lowlands. The mainstream of the river has a length of 115 km and an annual discharge of 1608 million cubic meters (MCM) into the sea [27,28]. The average annual rainfall received by the catchment is 1609 mm and the maximum amounts are recorded in October and November [28].
The digital elevation model (DEM) shows that the lower Deduru Oya river basin has almost flat terrain compared to the upland area, which could be a reason for the frequently observed river meandering. Furthermore, the downstream area of the river is facing the problem of erosion and could undergo the possible exposure of bridge foundations at the outer banks and accretion of sediment at the inner banks (see the area in the red square in Figure 1a). In addition, much damage to the infrastructure due to eroded banks can be easily observed (see Figure 1b). Furthermore, the meandering bend and its sand deposition can be clearly seen in Figure 1c. These were observed by the authors during their field visits to the area.
The study area reached from downstream of the Deduru Oya reservoir dam to the river mouth (sea outfall), which is about a 70 km long stretch along the river. The Deduru Oya river basin and the selected river segment are presented in Figure 2.

3. Data and Methods

The meandering morphodynamics of the river were estimated through a spatiotemporal analysis of the river planform using freely available remotely sensed satellite data. Many geospatial analysis tools can calculate pixel-based indices using different band combinations from the remotely sensed images. The mapping of different features, such as water, vegetation, and soil properties, was carried out using combinations of these pixel-based indices.
The remotely sensed satellite image data were used to identify the river mask, planform, and centerline in this study. Through a temporal analysis performed for a selected period, the meandering dynamics of the Deduru Oya were estimated using remotely sensed satellite data, semi-automated digitizing software, and a QGIS mapping tool.

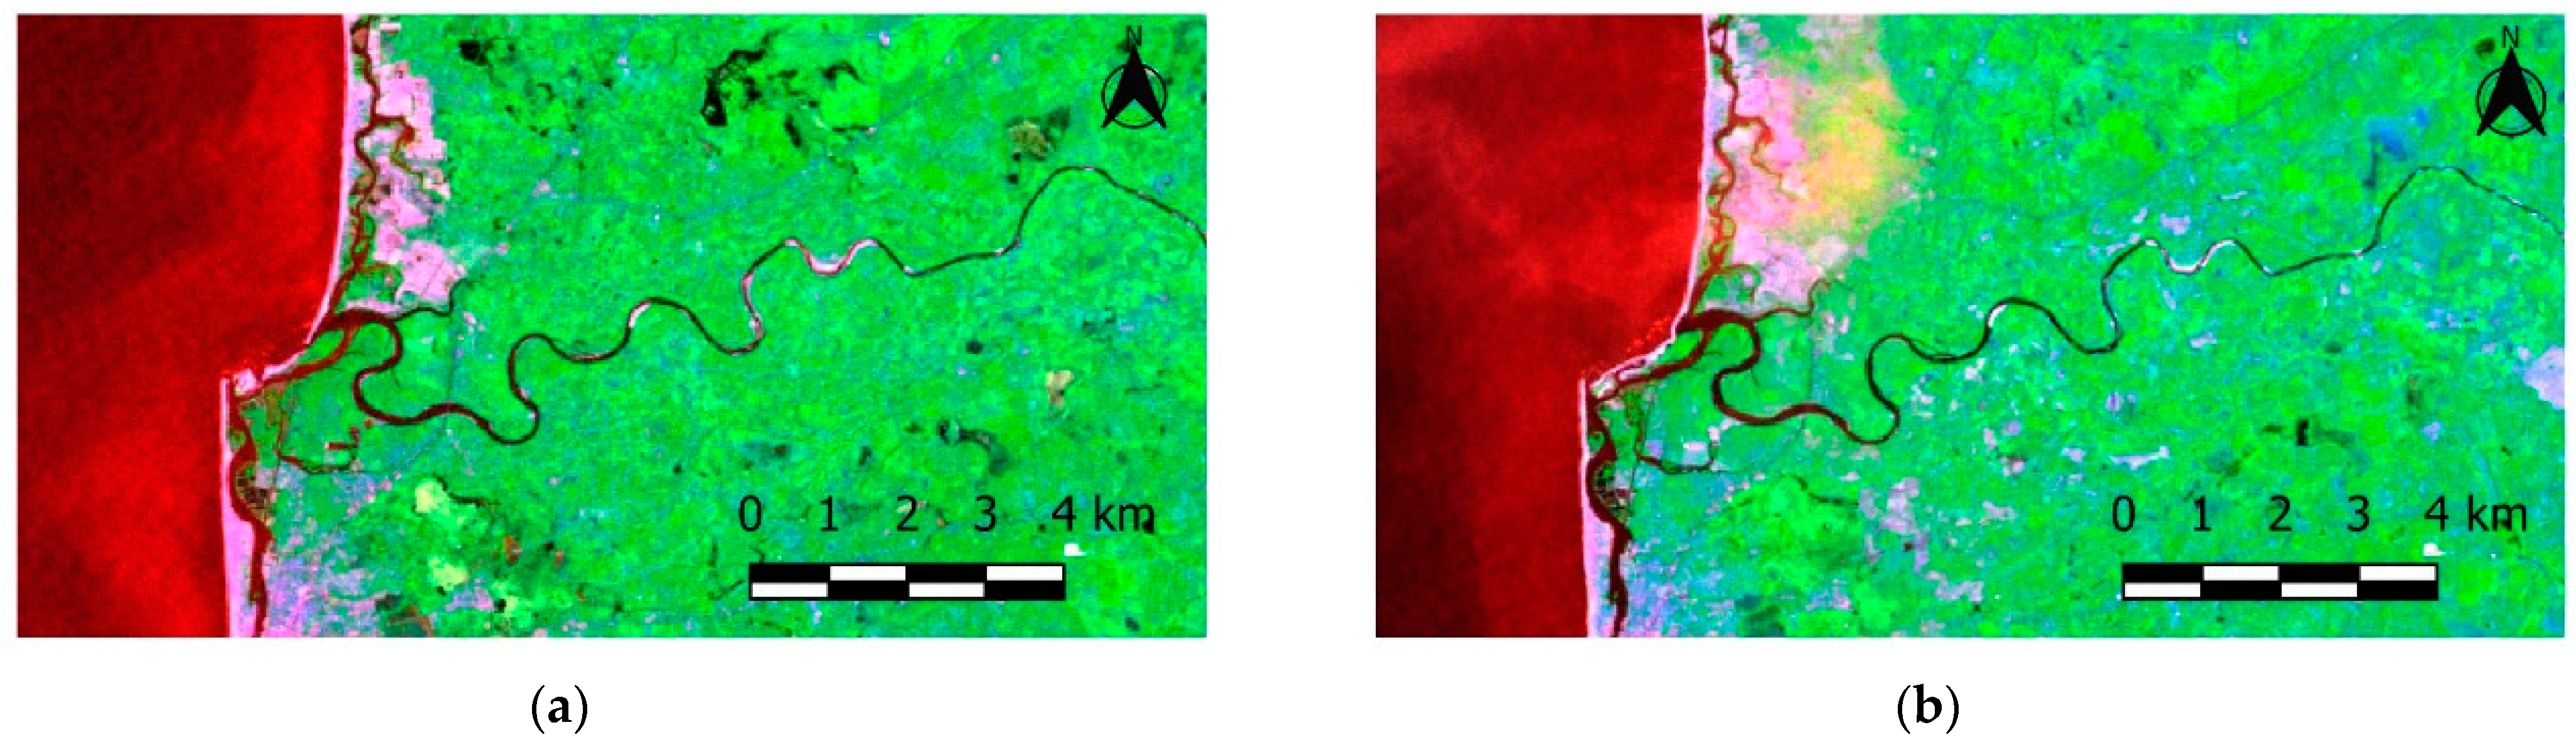
3.1. Landsat Satellite Data Acquisition

Four Landsat products are available: Landsat 1–5 MSS, Landsat 4–5 TM, Landsat 7, and Landsat 8–9. In the current study, we used the Landsat 4–5 Thematic Mapper (TM), Landsat 7 Enhanced Thematic Mapper (ETM+), and Landsat 8 Operational Land Imager (OLI) and Thermal Infrared Sensors (TIRS) products to calculate the meandering morphodynamics. The temporal availability, resolutions, and number of bands for each Landsat data type are given in Table 1.
The data were extracted from the USGS Earthexplorer website (https://earthexplorer.usgs.gov/, accessed on 2 May 2022) and covered 32 years from 1989 to 2021. These Landsat images were filtered based on the cloud cover criterion. The maximum cloud cover threshold for the land area was taken to be 20%, thereby removing the images where the river was significantly covered by clouds. Further, there were Landsat images with transverse no-data stripes in the images taken after 2003. These images were also excluded when selecting the satellite images for our analysis. Additionally, poorly georeferenced images among the available Landsat images were removed. The selected Landsat data and the dates of acquisition of the images are listed in Table 2.
These Landsat images can be downloaded as tiles and each tile contains 5000 × 5000 30 m pixels obtained on a given day. Before the analysis, the images were cropped to our study area to reduce the image processing time. As mentioned in Section 3.1, this area was the lower Deduru Oya, downstream of the Deduru Oya reservoir. Figure 3 shows two Landsat images of the downstream Deduru Oya taken in 2008 and 2010.

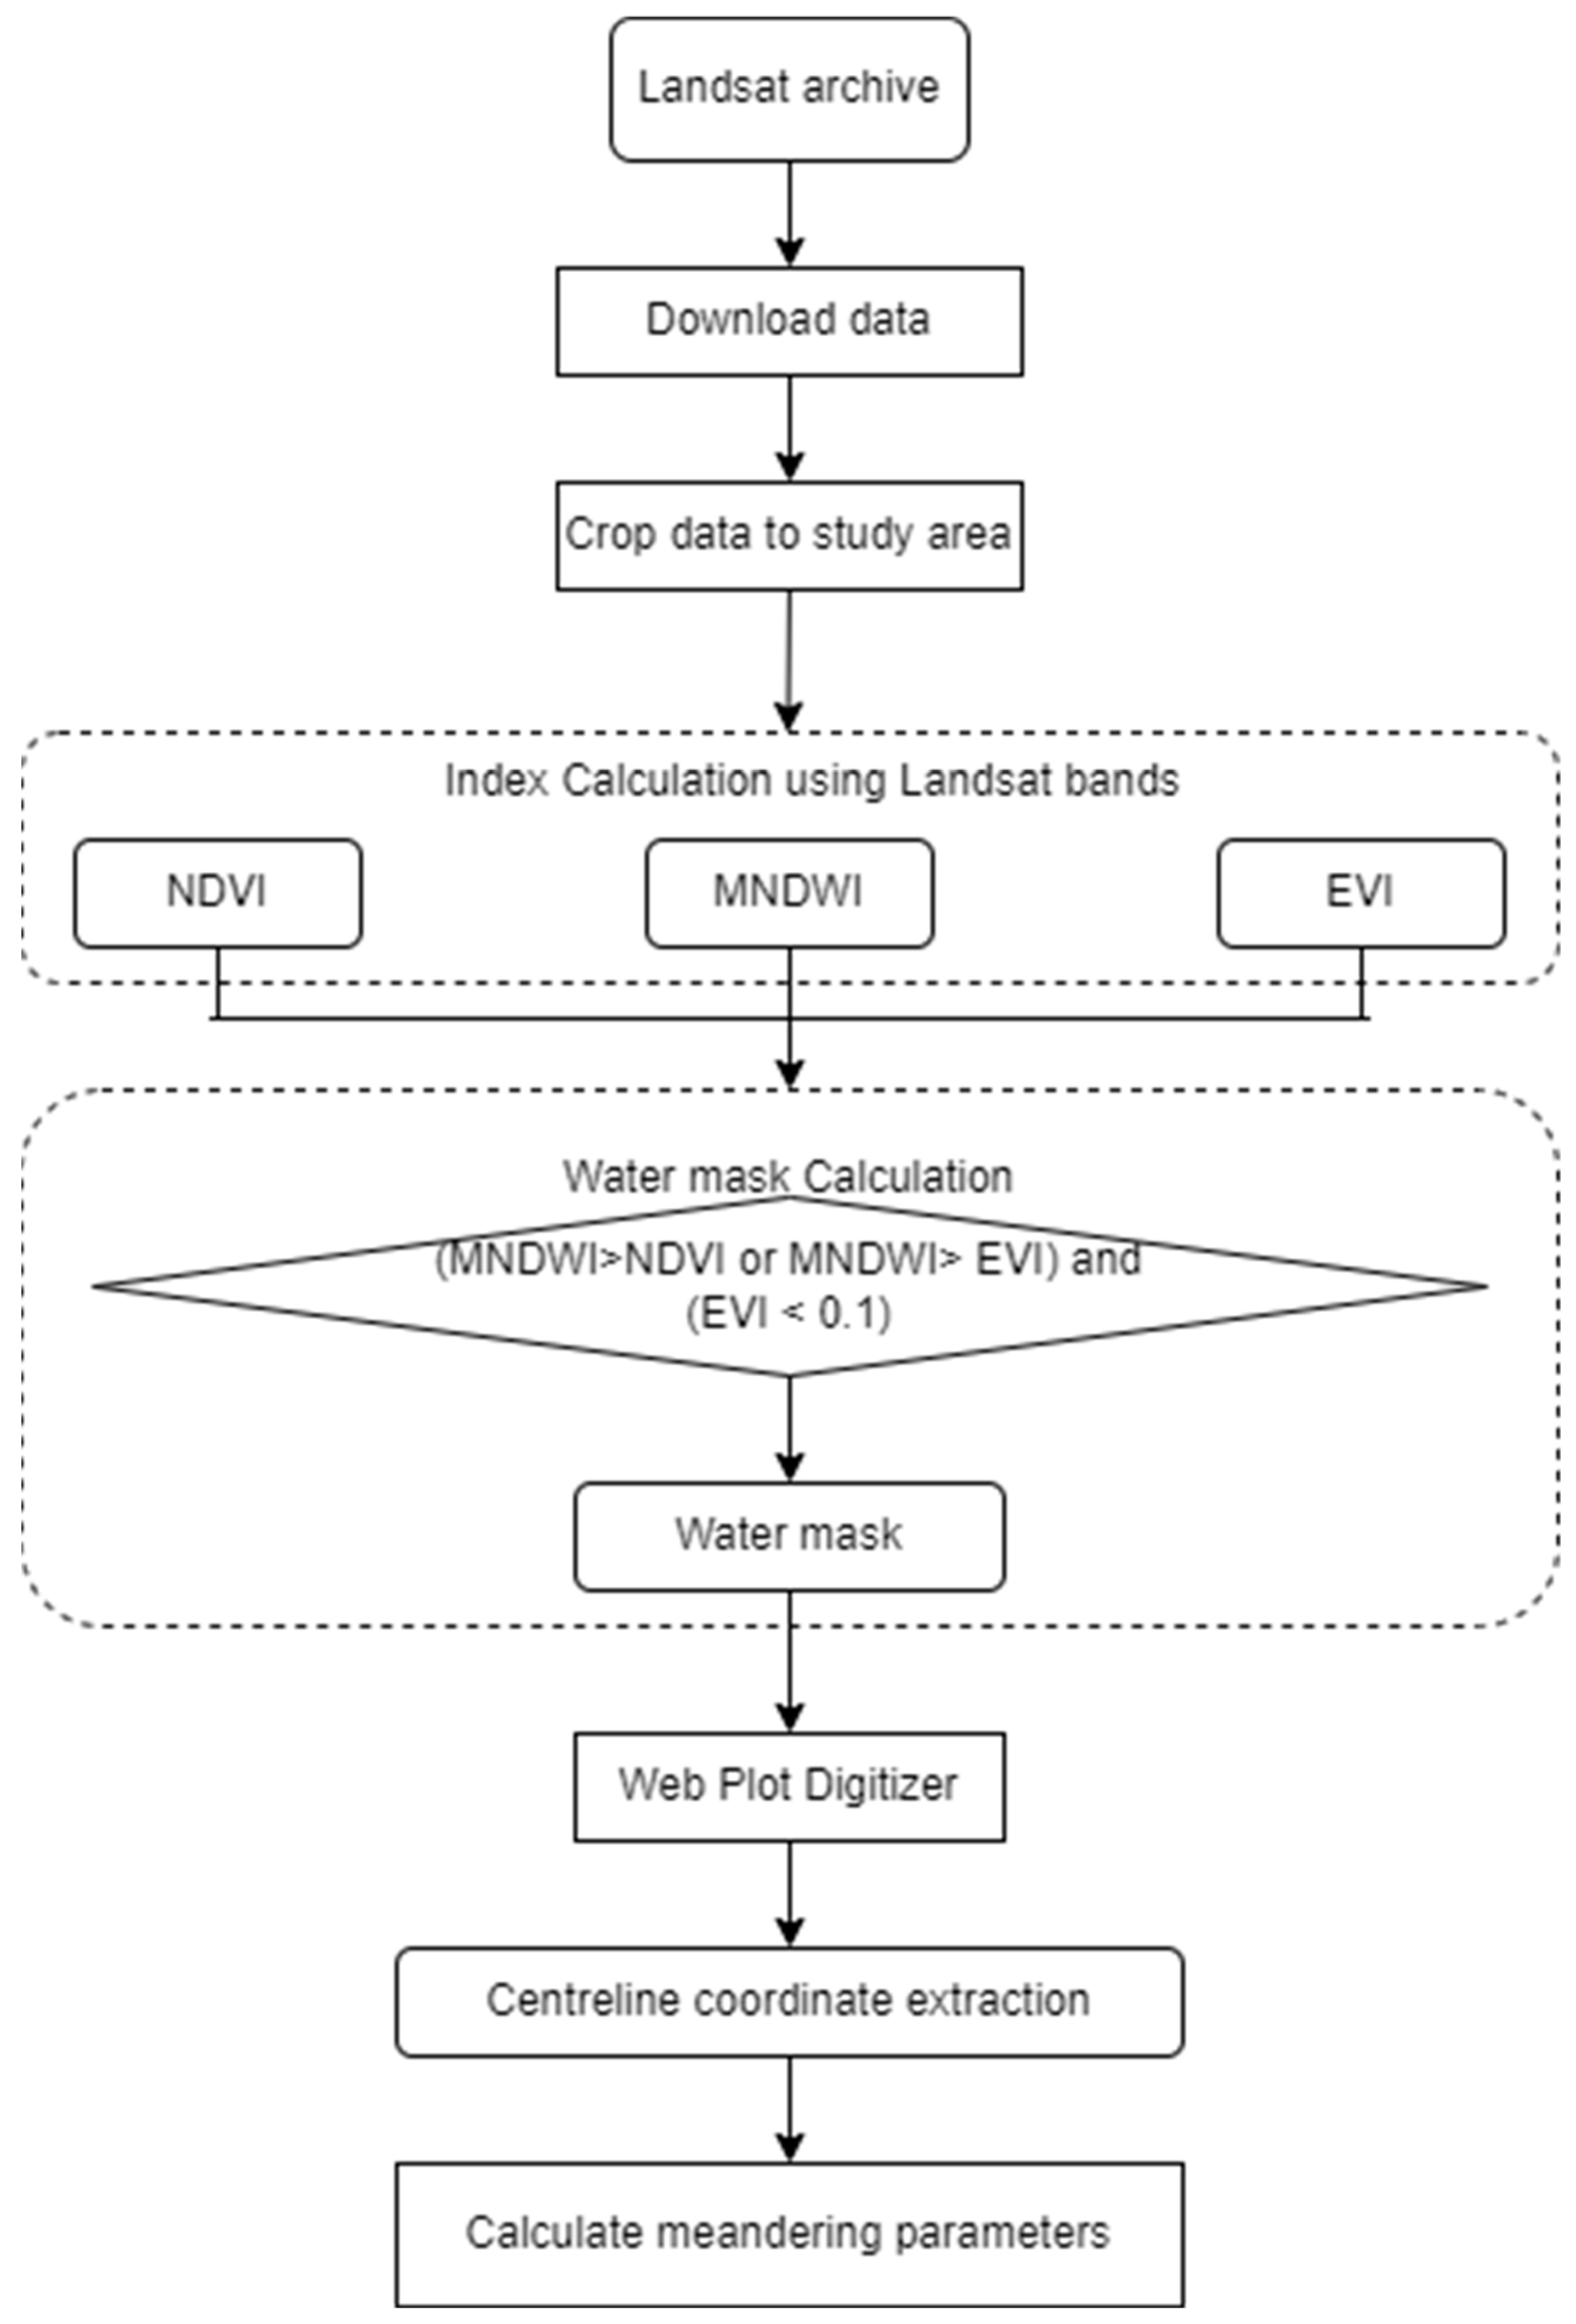
3.2. Extraction of Water Mask

One important aspect of the Landsat data is the availability of multispectral bands, and these bands can be combined to calculate indices that represent the relative abundances of different features, such as water, vegetation, and built-up areas [29]. Due to this capability, Landsat images are commonly used when calculating land use/land cover and vegetation properties, when identifying water bodies, and for flood mapping. Considering the above properties, it was decided to use the Landsat images for the extraction of the river water masks.
The first step of the process was to extract the river mask using the different Landsat band collections from the Landsat images. Landsat satellite data types, including Landsat 4–5 TM, Landsat 7 ETM+ and Landsat 8 OLI, and Landsat 8 TIRS, were used to extract the river mask. The extraction was performed based on three indices calculated using the Landsat image bands.
  • NDVI—normalized difference vegetation index
  • MNDWI—modified normalized difference water index
  • EVI—enhanced vegetation Index
MNDWI is frequently used when identifying water bodies because of its ability to suppress the noise from built-up land. However, misclassifications can still happen when using only the MNDWI, mainly due to mixed distributions of water and vegetation, especially in wetland areas [30]. Therefore, it has been suggested in the literature [30,31,32,33] that MNDWI should be used together with NDVI and EVI to avoid these classification errors. The calculated values for the NDVI represent the percentage of vegetation in each pixel (30 m × 30 m pixels) and the MNDWI indicates water and non-water pixels. The NDVI, MNDWI, and EVI are defined by Equations (1)–(3). In these equations, ρ N I R is a near-infrared band and ρ S W I R 1 is a mid-infrared band; for example, in Landsat 5 TM images, band 4 represents the infrared band and band 5 represents the shortwave infrared band, and in the Landsat 8 images, band 5 represents the infrared band and band 6 represents the shortwave infrared band.
N D V I = ρ N I R ρ R e d ρ N I R + ρ R e d
M N D W I = ρ G r e e n ρ S W I R 1 ρ G r e e n + ρ S W I R 1
E V I = ρ N I R ρ R e d ρ N I R + 6 ρ R e d 7.5 ρ B l u e
Considering the above facts and the previous work by Xia et al. [30], it was decided to use the criteria MNDWI > NDVI and MNDWI > EVI to extract the water pixels, with the water signals being stronger than the vegetation signals. Further, to avoid the interference of wetland vegetation, the condition EVI < 0.1 was used. The water mask extraction process was automated using a simple python script and GIS environment. The resulting raster images were then used to extract the river centerline.

3.3. River Centreline Delineation

River planform extraction was performed with the extracted water mask. The centerline of the river had to be identified using the river mask created in the previous step. Several methods have been proposed in the literature to identify the centerline of a certain river. One method is to identify the shortest flow path in a multi-branching channel. The main channel might not always be the shortest flow path, especially in cases where there are chute channels. However, the main channel has a higher discharge compared to the chute channels.
A semi-automated digitizing software package called WebPlotDigitizer version 4.5 [34] was used to extract the river centerline coordinates from the water mask images. After importing the 2D water mask image to the WebPlotDigitizer, it was calibrated using the axis coordinates of a few selected known points. The software allows the user to perform the digitization manually or using automatic digitization algorithms. There are several automatic extraction algorithms available in the software for extracting a large number of data points within a short time. In our study, we used the averaging window method as the automatic extraction algorithm. Then, these automatically extracted points were adjusted manually to fit them to the actual river by comparing the background image of the water mask and the points generated by the automatic extraction algorithm. Finally, the extracted points were saved as comma-separated value (.csv) files and these data were used to calculate the geometric parameters for the channel. A brief overview of the overall methodology followed in the study is presented in Figure 4.

3.4. Estimating Planform Geometry

For a certain point ( x i ,   y i ) , the centerline arc length ( S i ), the inflection angle ( θ i ), and the curvature ( c i ) were calculated using Equations (4)–(6).
S i = ( x i x ( i 1 ) ) 2 + ( y i y ( i 1 ) ) 2
θ i = t a n 1 ( y i y ( i 1 ) x i x ( i 1 ) )
c i = θ ( i + 1 ) θ ( i 1 ) S ( i + 1 ) S ( i 1 )
The zero-crossing points of the spatial variation of the centerline curvature ( c i ) indicate the inflection points or the separation of individual meander bends [8]. Therefore, the variation of the centerline curvature was plotted against the river length to identify the individual meandering bends of the Deduru Oya. After separating the bends, the geometry of meandering bends was estimated based on two parameters. Meandering length ( M L ) was defined as the axial length of an individual meander along the direction of flow, and the sinuosity as the ratio between the actual channel length and the direct axial length of the river [35].

3.5. Estimation of Centreline Migration

The evolution of a planform can be analyzed by estimating the centerline migration rates. This was carried out by calculating the rates of migration in the river centerline between two consecutive years. This was undertaken with the use of the Geometric Attribute tools in the QGIS software package. First, transects were created to each river centerline with constant distances. Then, the intersecting points on the river centerlines were ranked based on the distance along the river, and distances were calculated between the transects based on their ranks. Finally, the annual river migration rates were estimated by calculating the distance of the migration during the selected time interval and dividing the migrated distance by the time taken for the migration.

4. Results and Discussion
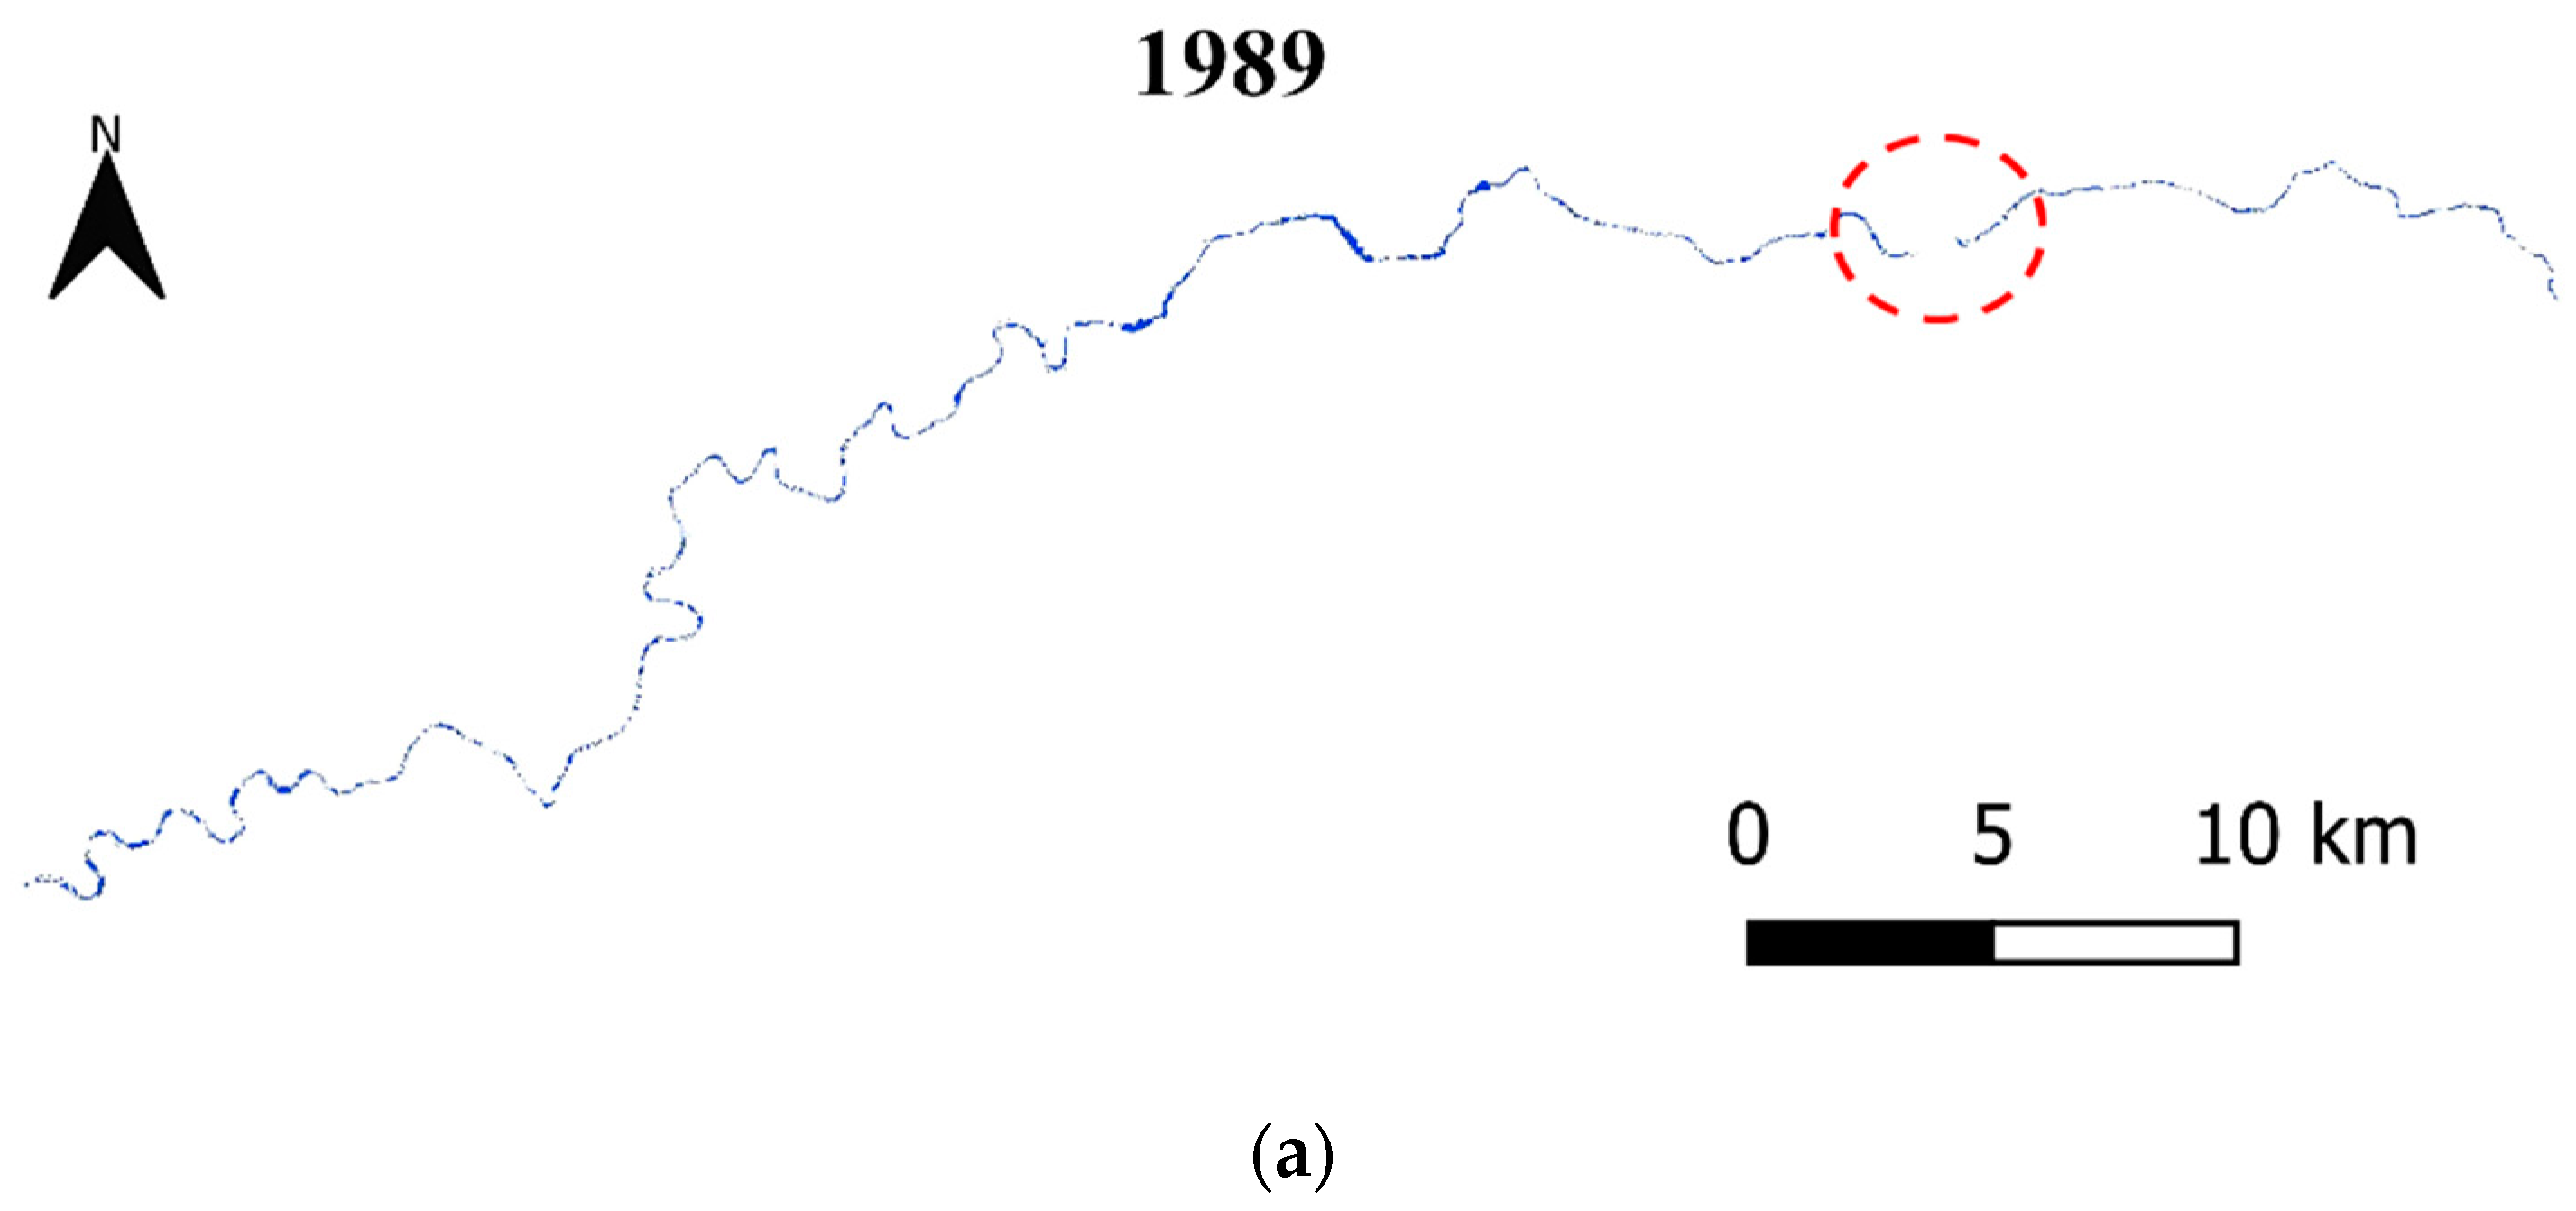
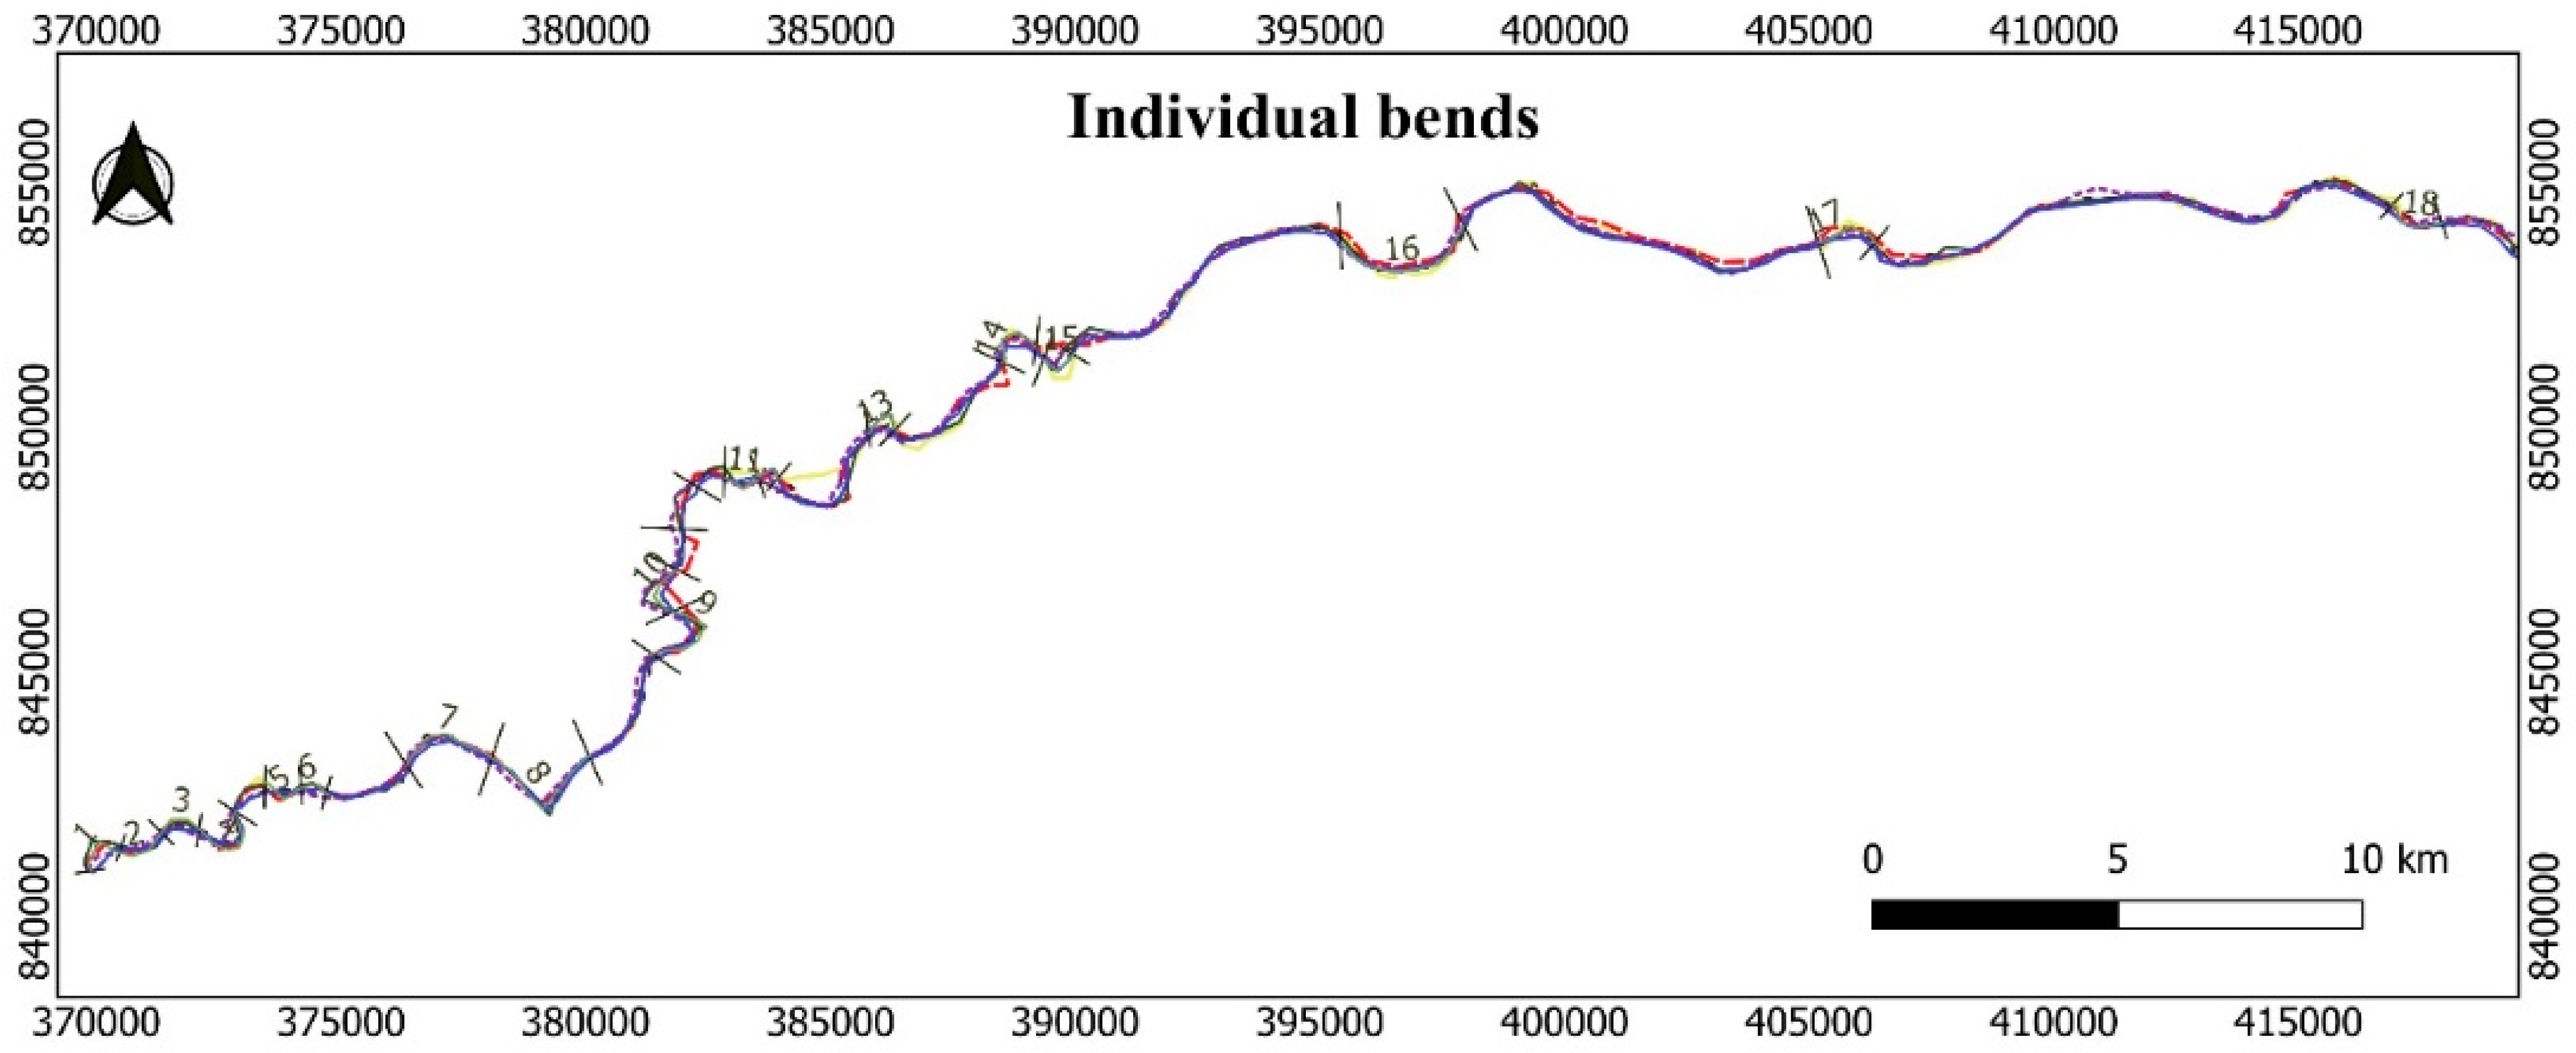
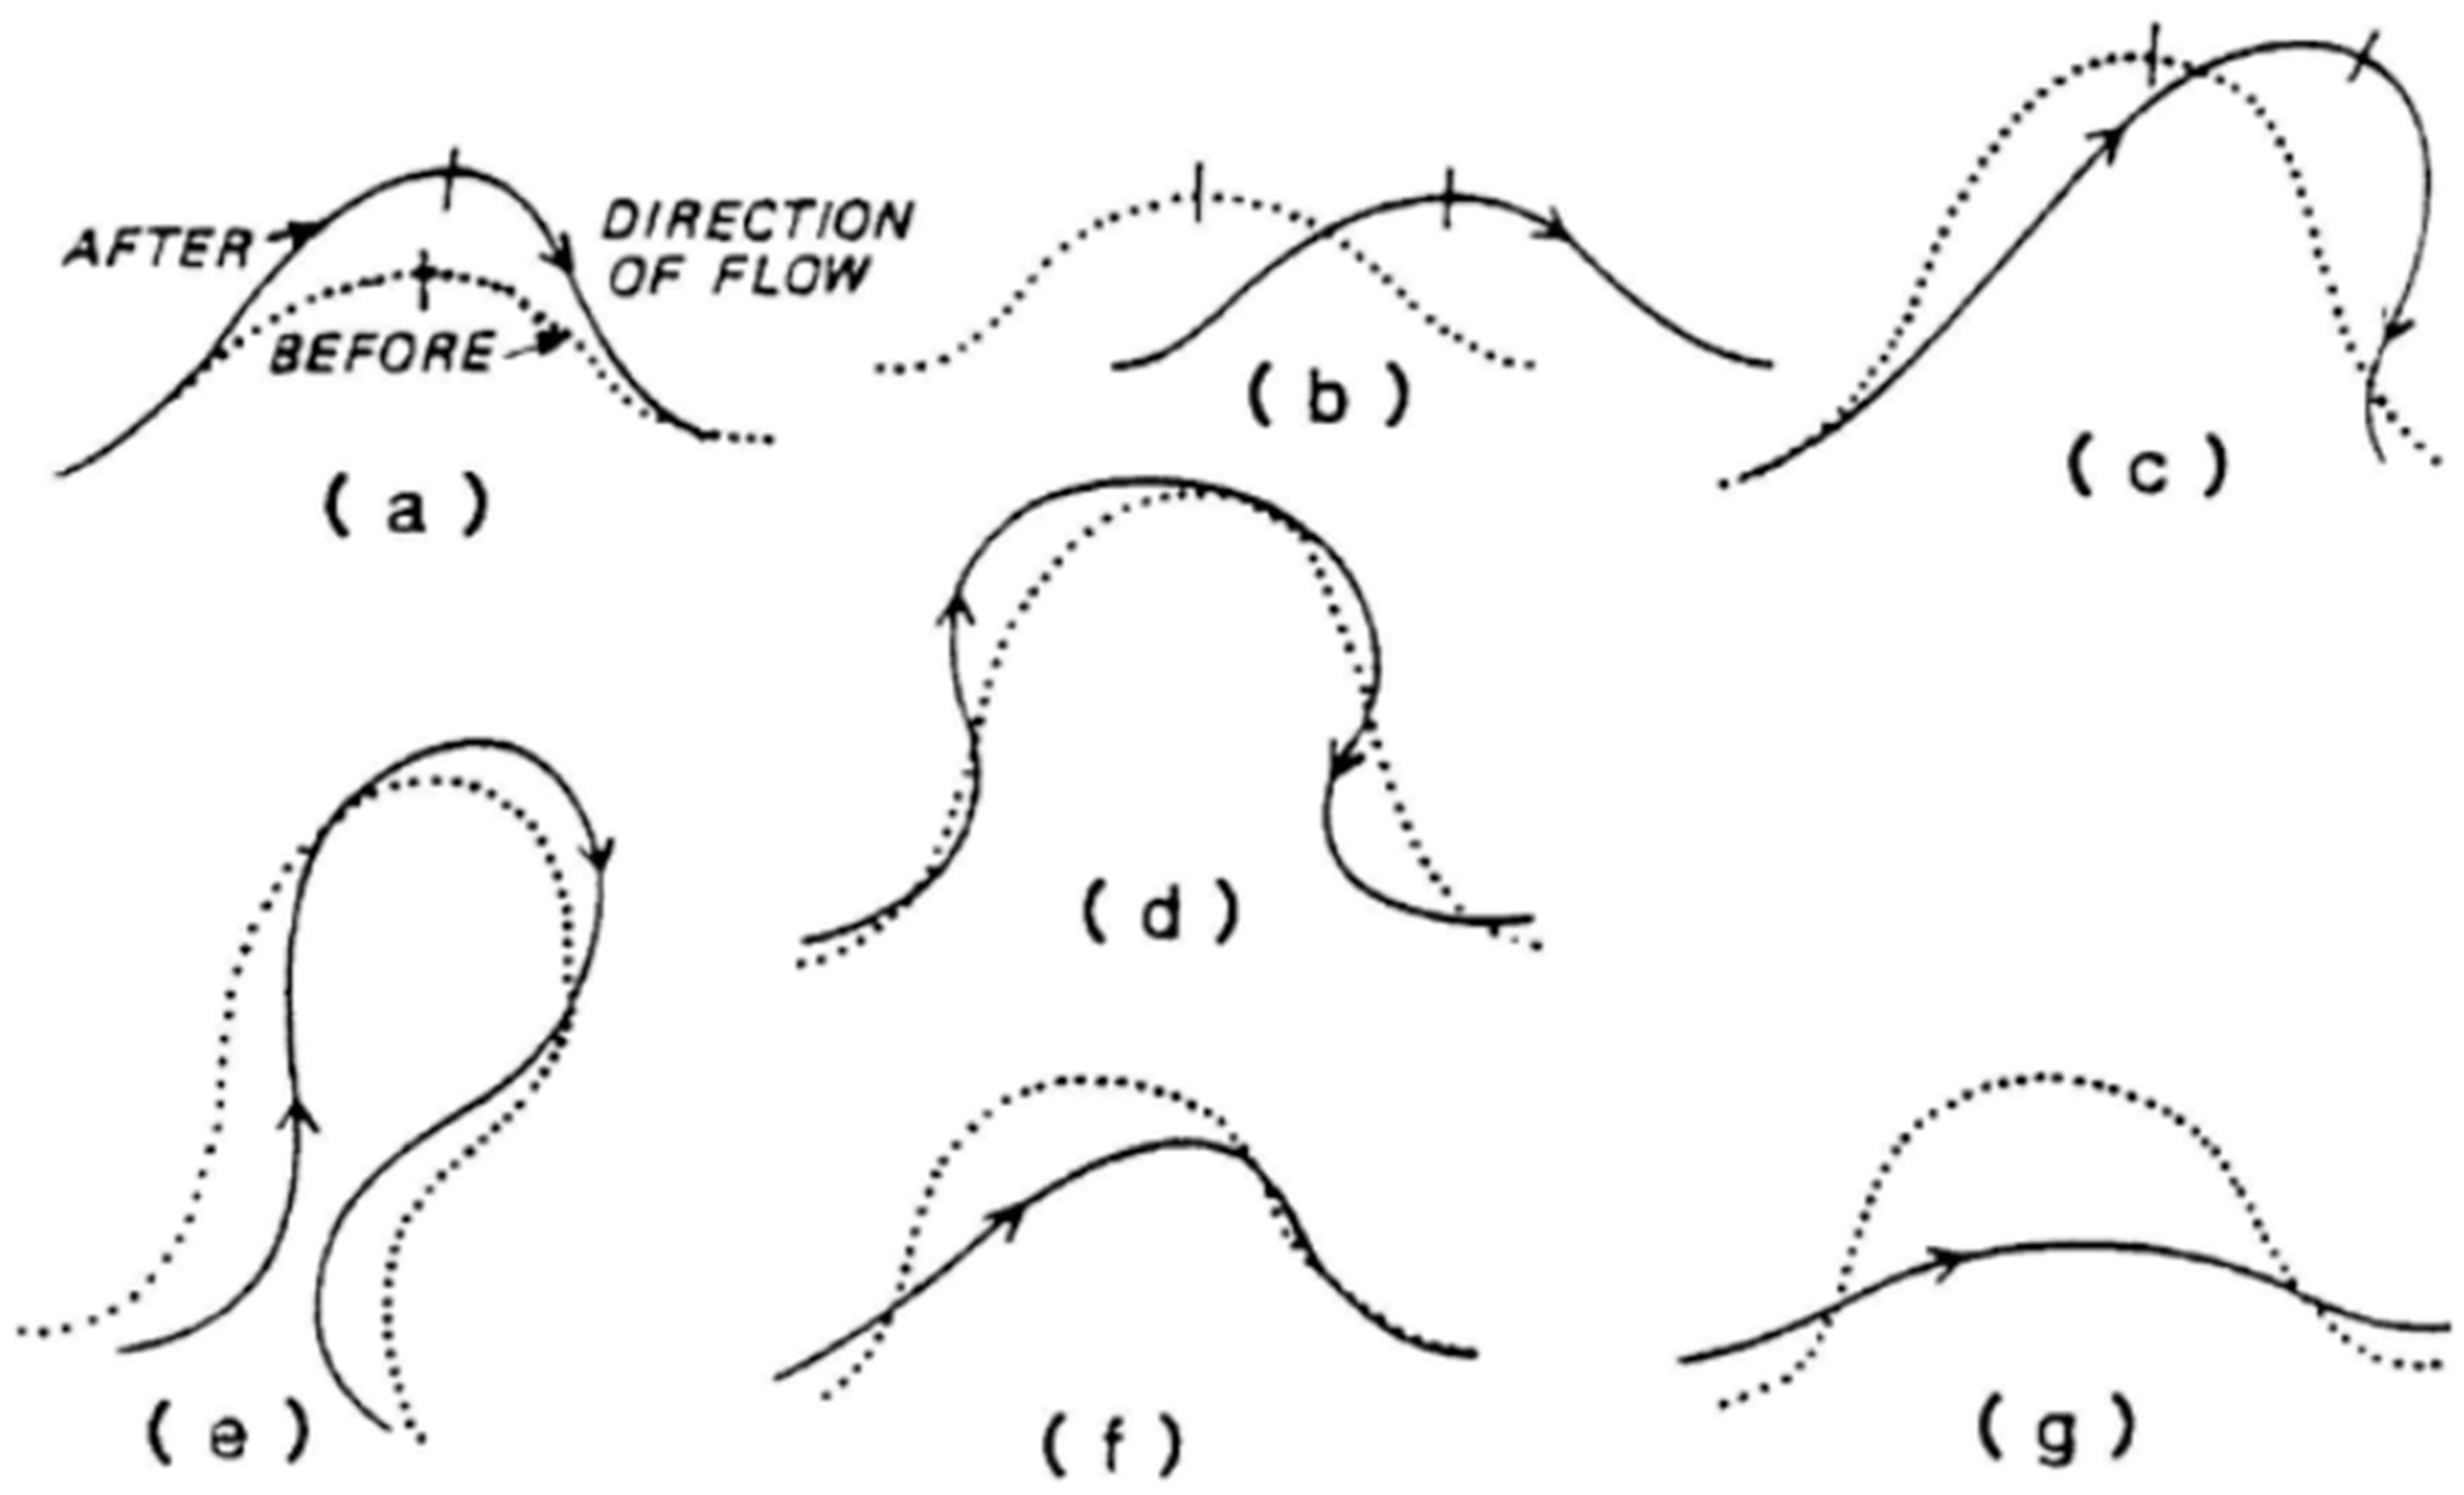
4.1. River Planform

The river masks extracted based on the three indices described in Section 3.3 are presented in Figure 5 (data only shown for 1989, 2005, and 2021). The results indicated that the river masks in some images did not have continuous connections (see the dashed red circles). This can be attributed to the misclassifications that occurred due to the low resolution of the satellite images and the possible cloud cover in some images. The selected river segment of the Deduru Oya has a river width of about 50 m upstream and 200 m near the outlet. However, the resolution of Landsat 5 and Landsat 8 images is 30 m. Therefore, the representation of the river was difficult for the narrow sections. This was one of the major limitations of our study of the morphology of the Deduru Oya. Further, this limitation could also have reduced the accuracy of the delineated river planform. Misclassifications due to the mixture of water, sediment, and vegetation can also cause erroneous water mask classifications.
In addition, the blue patch shown in Figure 5c (see green dashed rectangle) represents the recently constructed Deduru Oya reservoir, which is mainly used for irrigation purposes. However, the study took place downstream of this reservoir.

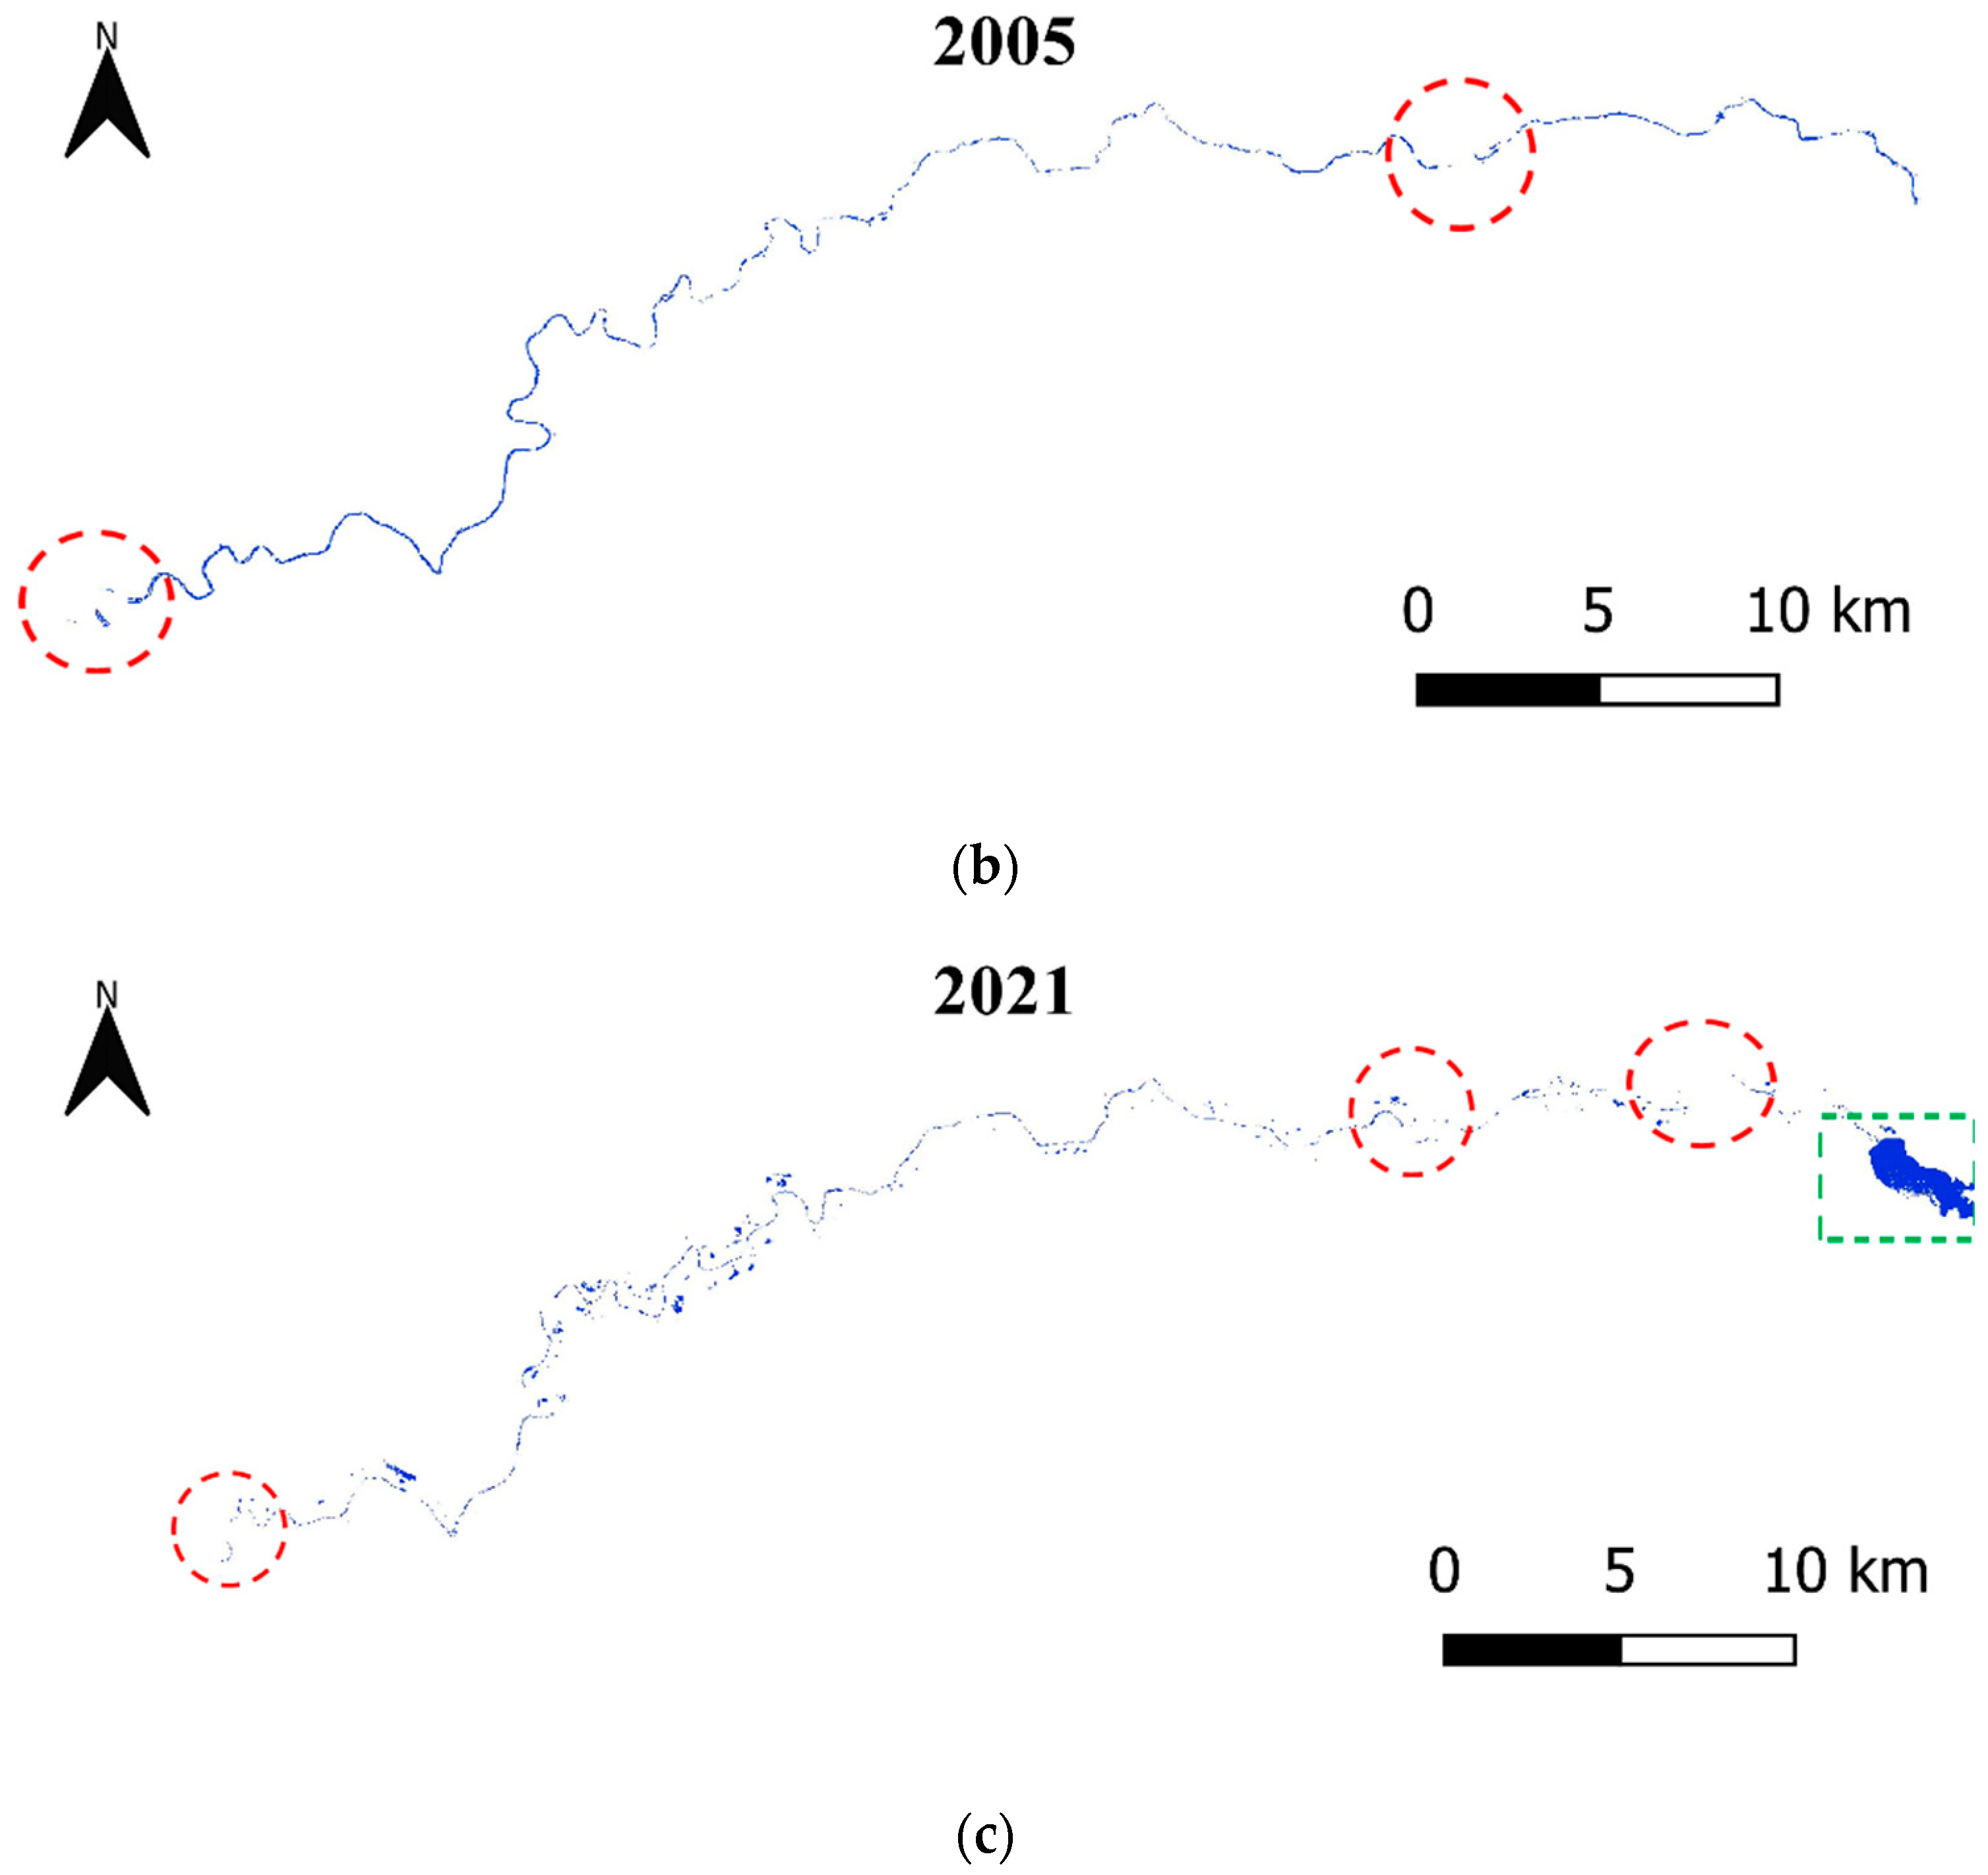
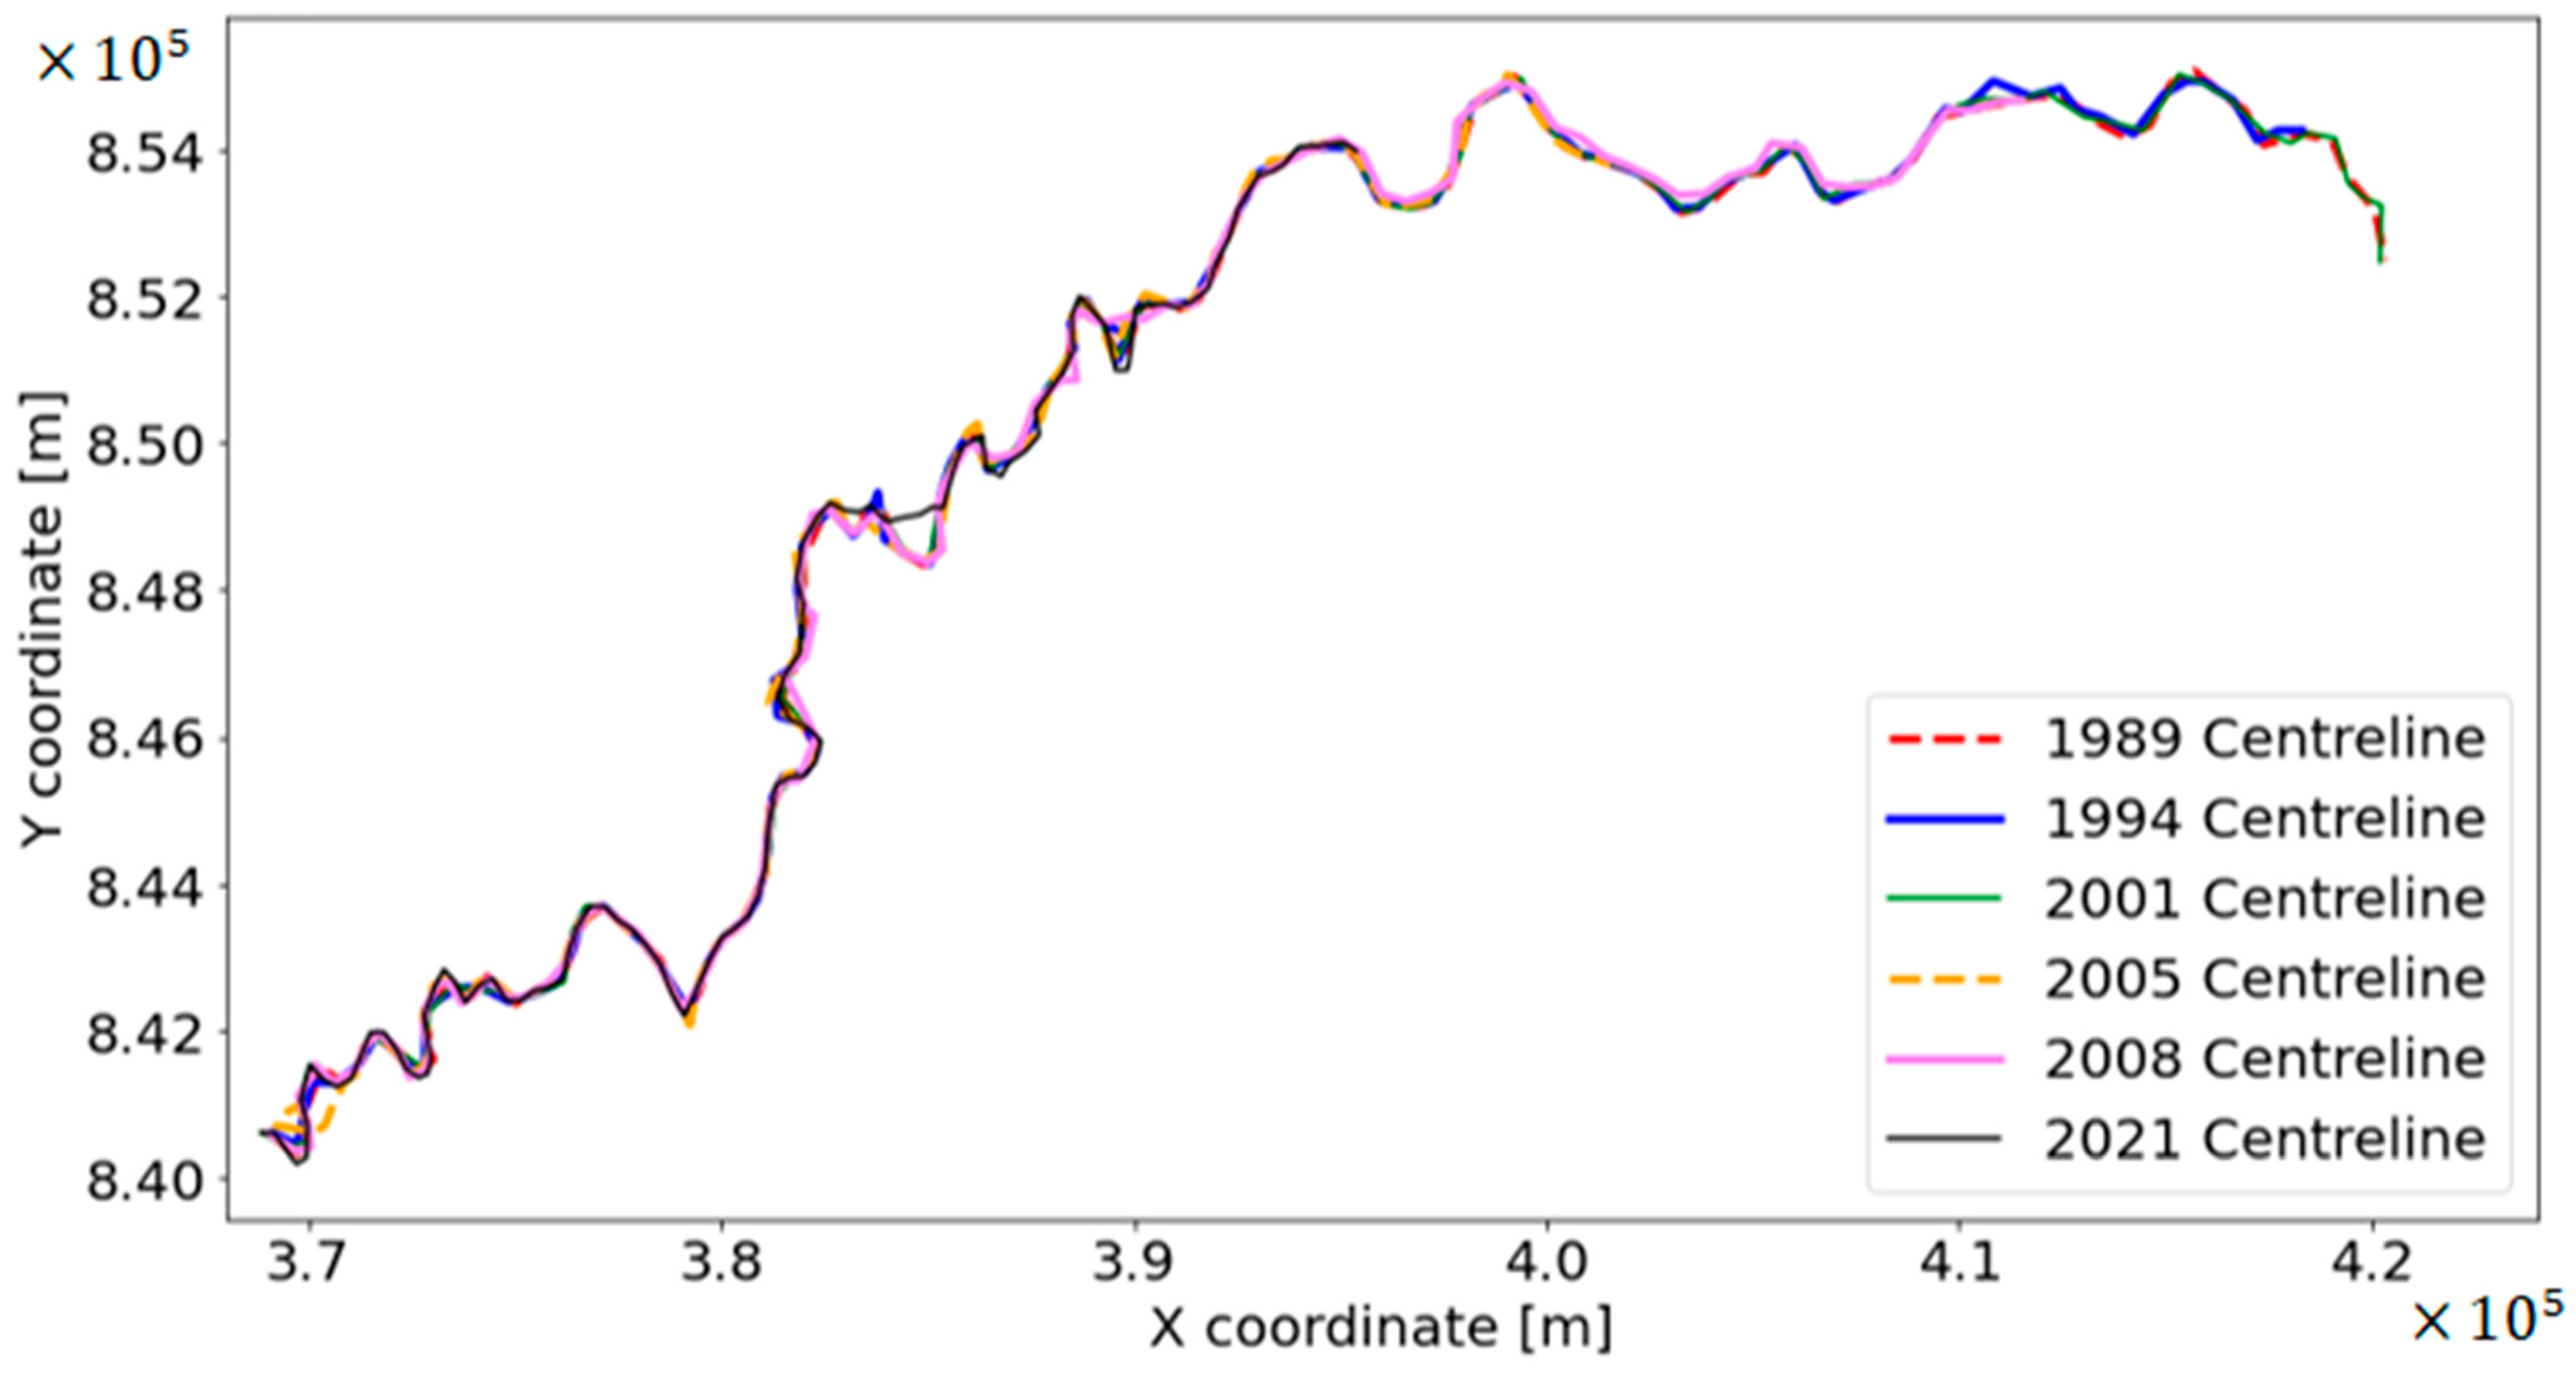
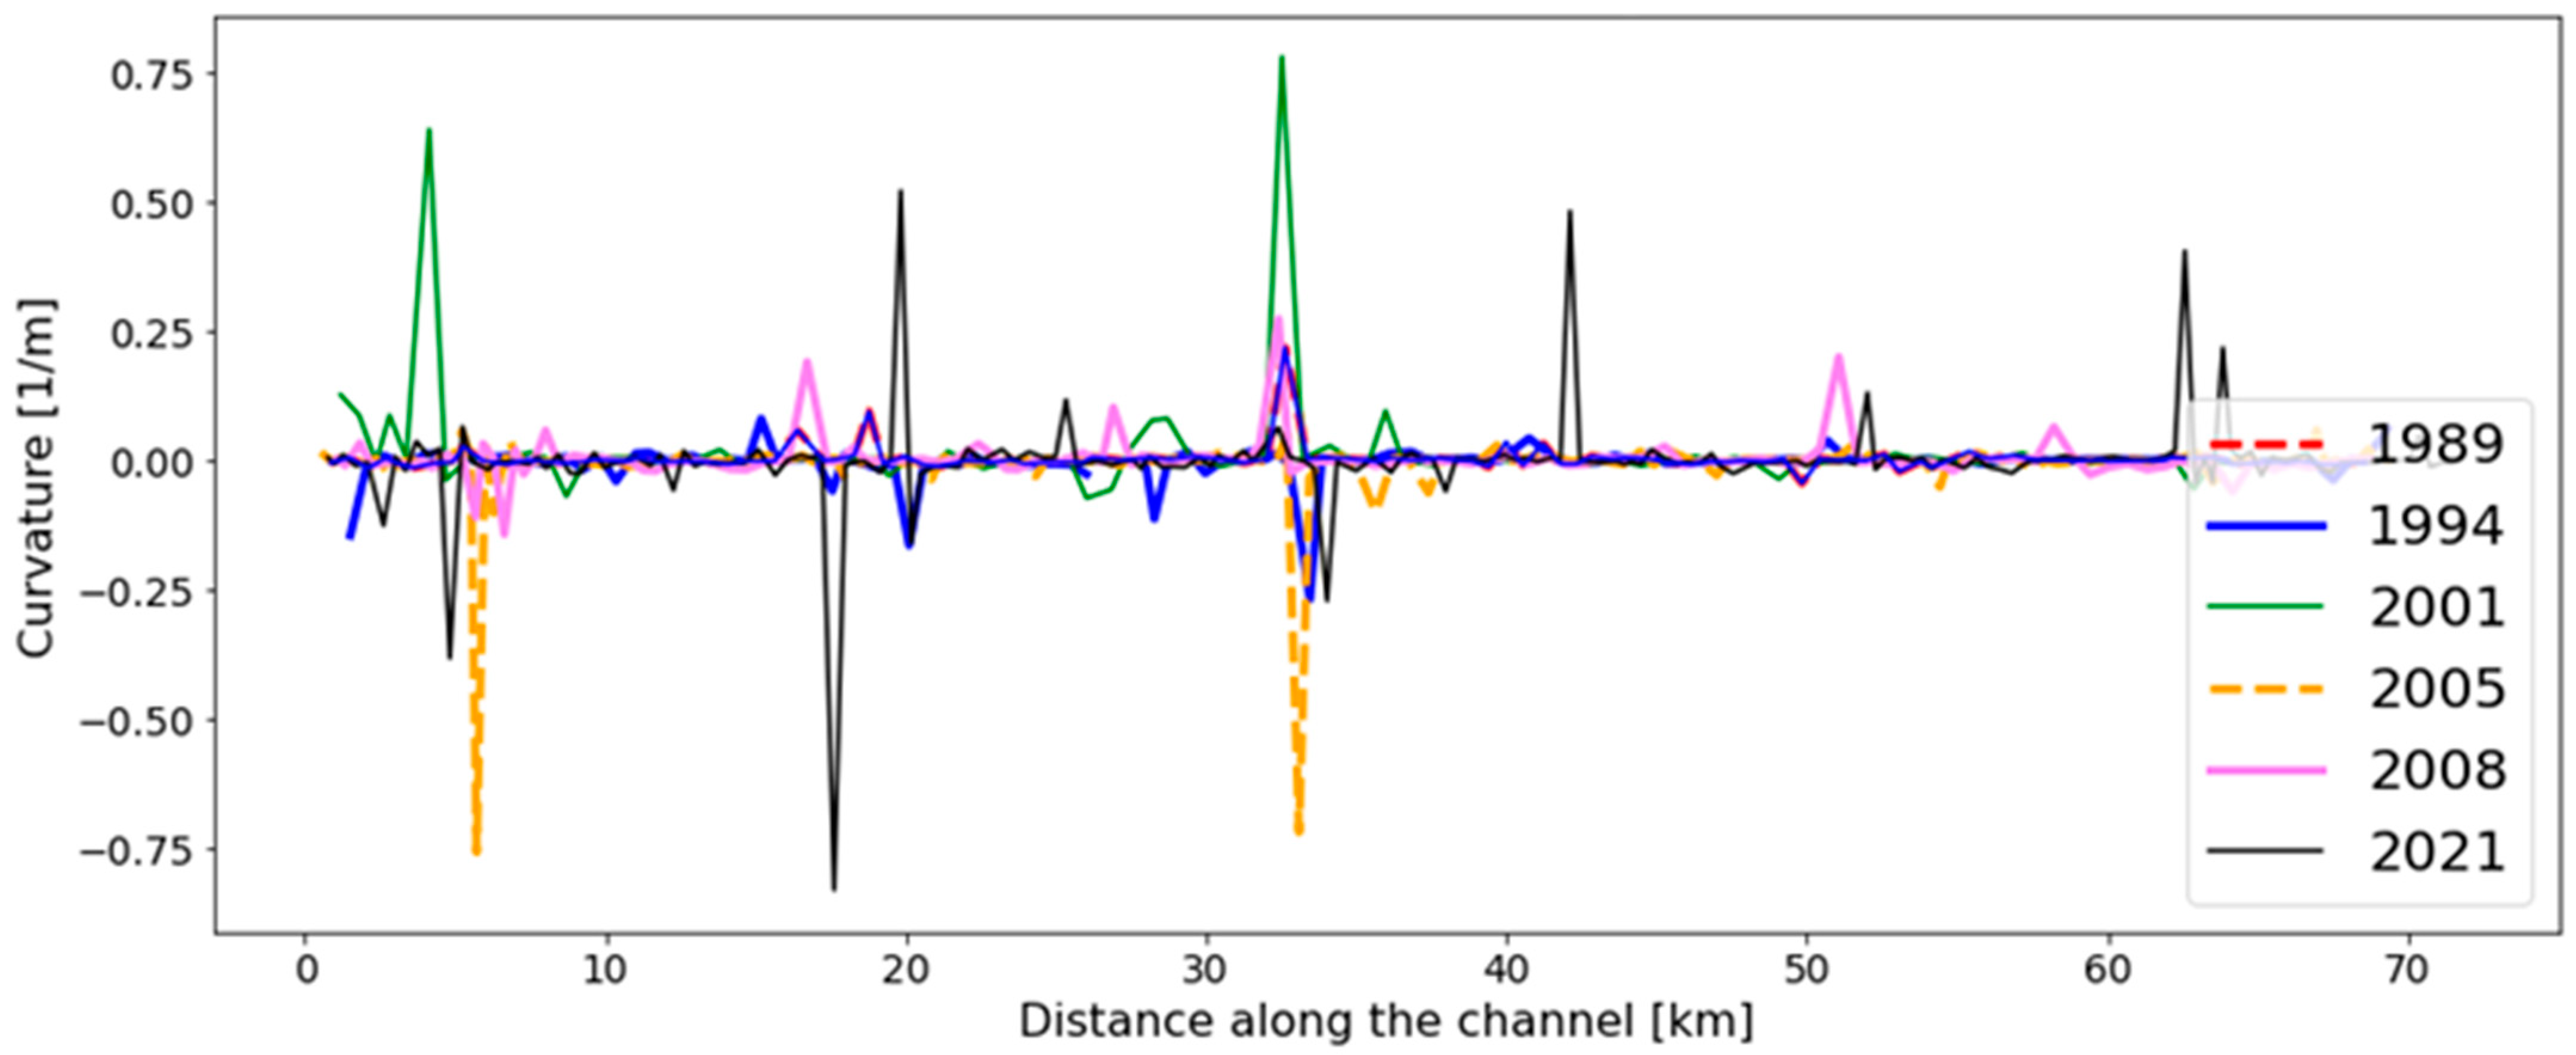
4.2. River Centerline Variation

The centerlines were generated for the selected six years with the use of a digitization tool. The extracted centerlines for each year are presented in Figure 6. Significant variations can be clearly seen at the bends of the Deduru Oya. This is clear evidence of river meandering in the Deduru Oya. The changes are significant and, therefore, the riverbanks and the surrounding vicinity at the bends are highly vulnerable to erosion (sedimentation).
The spatial distributions for the river curvature for the six analyzed years are shown in Figure 7. The figure clearly shows the possible meander bends and their locations along the river centerline. In addition, the values for the curvature give an idea of the meandering sinuosity. When analyzing the temporal changes in the river curvature, the highest degree of curvature in the bends was observed in the years 2021 and 2005, while the lowest bend curvature values were observed for 1989. These curvature estimates were used to separate the individual bends.

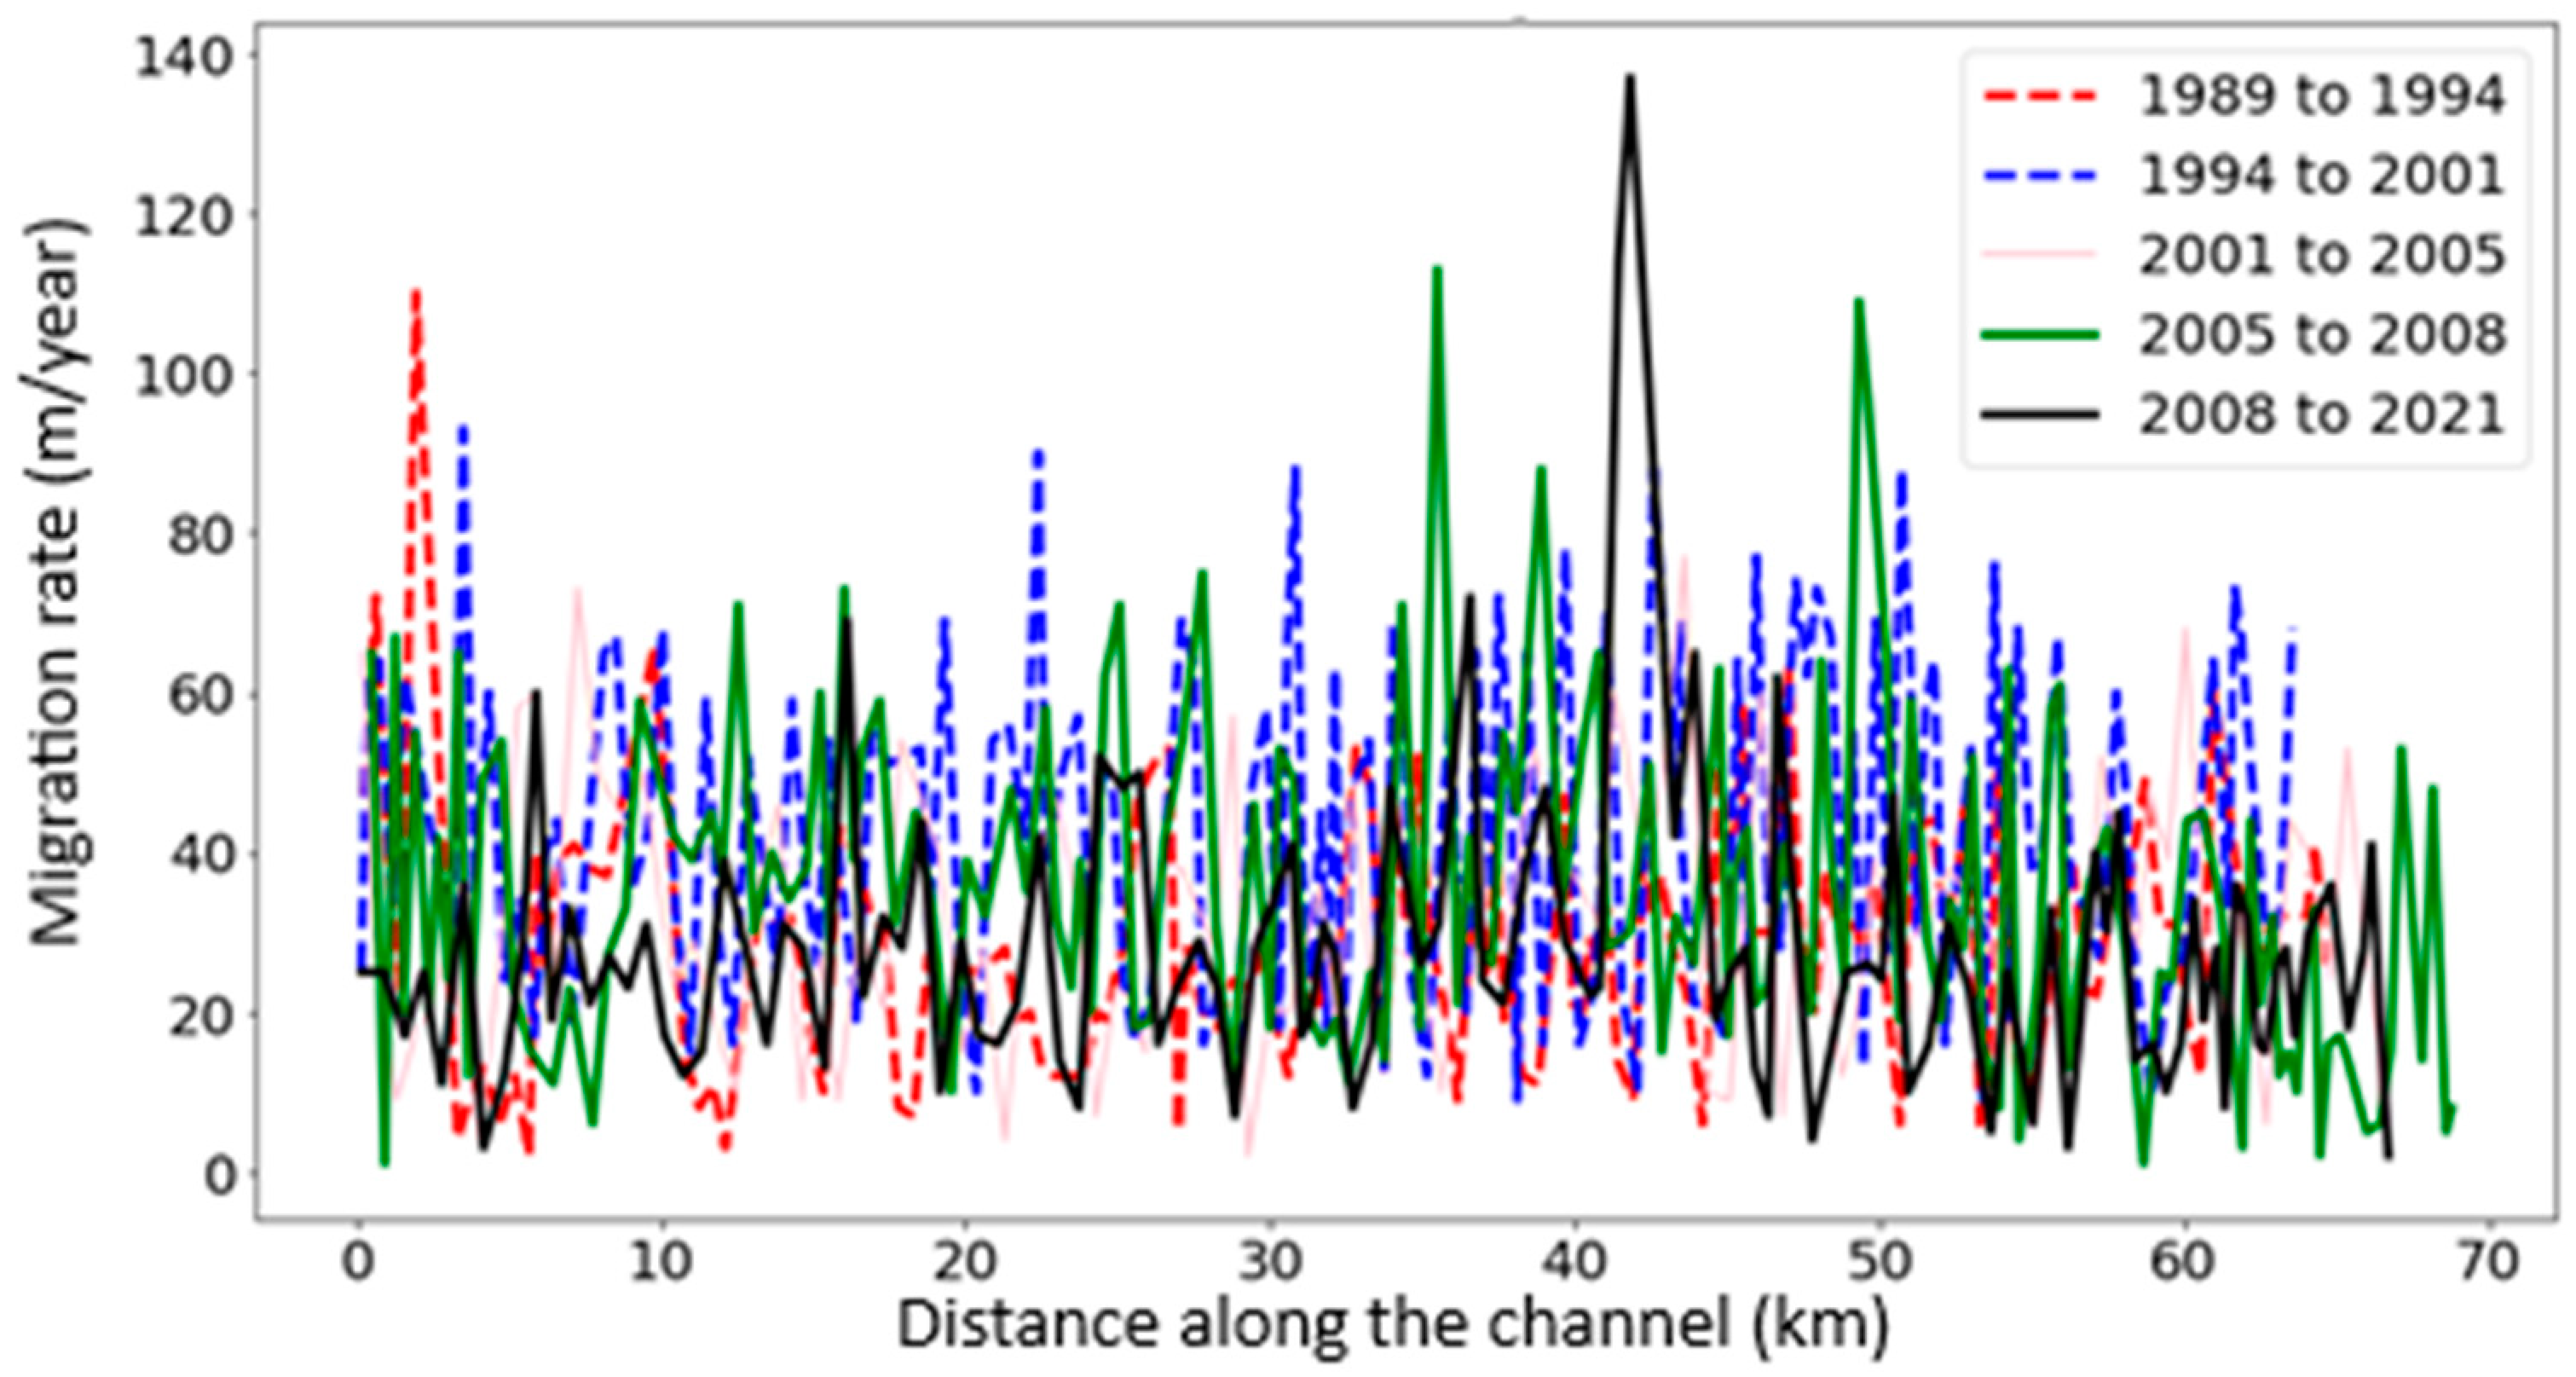
4.3. River Centerline Migration

The rate of total migration along the channel was plotted and the graph is presented in Figure 8. This was used to identify the variations in the migration rates on the spatial and temporal scales.
According to the estimated annual centerline migration rates, the minimum migration amounts were observed during the period from 1989 to 1994 and the maximum amount of total river migration occurred during the period from 2005 to 2008. These migration rates are significant and can also be seen in Figure 2. The damage resulting from these migrations is thus disastrous.
The meandering bends identified in the study region of the Deduru Oya are shown in Figure 9 in a coordinate system. These bends were further analyzed, and the meandering length and sinuosity of each bend were calculated using the Geometric Attribute tools in QGIS.
Different types of meandering bend migration are described in the literature [35,36] depending on the direction and nature of the migrations. The concept of an inflection point was used to separate the individual meander bends and qualitatively study the types of bends. These bends are shown in Figure 10. Deb et al. [35] and Lagasse [36] classified meander bend migrations according to the patterns of the centreline migrations of rivers.
The bends detected in Figure 9 were compared with these different modes of meandering loop development described in the literature and classified by visually inspecting the changes in the river channel during the selected period. These results are shown in Table 3.
The extension bend migration type was the most frequently found bend migration type in the study area (see Table 3). Therefore, the curvature is increasing in the Deduru Oya. In addition, the maximum meander lengths were observed to be at the fourth, seventh, eighth, and ninth bends (see Figure 9). These bends were located downstream of the study area. In addition, the nine bend, which was classified as a translation, exhibited the maximum sinuosity. Therefore, this bend is moving along the river. Interestingly, the 16th bend showcased the migration type involving a neck cutoff by a chute. Therefore, the meandering behavior of the bend is becoming reduced over time and straightening the river at the 16th bend. Furthermore, the lowest meander length was observed at the 12th bend.
The identification of the bend migration type is important for any future riverbank conservation and protection services. The planners can introduce necessary steps suitable for each river bend.

5. Summary and Conclusions

Studying river migration patterns is an important factor when designing critical infrastructure, such as bridges, roads, etc. In addition, it is highly important for managing river flows. The results of this study will therefore be useful for planning river management activities (conservation) and designing infrastructure close to the river.
The current study was conducted to develop a simple method to investigate the river meandering features of a narrow river using freely available remote sensing satellite data and GIS tools. The method was applied to a meandering river in Sri Lanka (the Deduru Oya) to investigate the change in the active channel during the past three decades from 1989 to 2021. This is the first such study undertaken for the river basins in Sri Lanka and, more importantly, for the Deduru Oya (as per the authors’ knowledge). The method developed used Landsat satellite image data to identify the river planform and this was then digitized to calculate the river geometry, the changes over time, and the meandering features of the Deduru Oya.
The current analysis indicated that the highest number of meandering bends could observed in the lower (most downstream) and the middle parts of the selected river segment. It was also observed that the Deduru Oya has undergone considerable change in its curvature and migration rates. According to the results obtained, the curvatures of the critical meandering bends have increased over time between 1989 and 2021. Similarly, the annual meandering rates were observed to be higher in recent years compared to the past. The meandering bends identified were classified according to the bend types defined by Lagasse [36]. This information can be effectively used by the Irrigation Department of Sri Lanka to restore and conserve the riverbanks and their surroundings. This is very important as the Deduru Oya has been identified as one of the rivers in Sri Lanka that has been most intensely mined for construction sand. Therefore, the riverbanks are often mined legally and illegally. The riverine ecosystem always affects the meandering process and vice versa. For example, the existence of vegetation close to the river banks slows down meander bend migration, and the river meandering can also turn the vegetated areas into wetlands, completely changing the ecosystem features. Thus, the findings of this research are very useful for the management of the river ecosystem. In addition, the Deduru Oya floods annually. Knowledge about the meandering patterns of the Deduru Oya river will help to reduce flood-related erosion risks in the riverine environment. Therefore, the results can be used for flood risk analysis of the Deduru Oya river. Furthermore, the mathematical representations of these meandering bends could also be investigated in a future study.
The usefulness of Landsat satellite data for studying river channel morphodynamics is widely acknowledged in the literature [2,8,22,35,36,37,38,39]. However, the accuracy of the geomorphological applications of these satellite data is highly dependent on the resolution of the images and the river width. Analyzing the narrow channels (i.e., river width < 100 m) using medium-resolution images (Landsat, Sentinel, etc.) can reduce the accuracy of the results [21]. The width of the Deduru Oya changes from about 50 m in the upstream areas to about 200 m near the sea outfall. Hence, there are limitations regarding feature extraction and classification when using these freely available Landsat images, which can cause misclassifications and reduce the accuracy of the extracted river representation. Therefore, it is recommended to use satellite data that have higher resolutions in future studies. Another limitation of the current method is that it is only able to estimate the centerline changes over time and cannot be used to identify sediment bars or to determine the dynamics of sediment in rivers. Therefore, the method could be developed to calculate the sediment bar dynamics in the Deduru Oya in future research.

Author Contributions

Conceptualization, U.R.; methodology, V.B. and J.T.S.; software, V.B., J.T.S. and M.B.G.; formal analysis, V.B. and J.T.S.; resources, M.B.G. and D.C.H.; data curation, V.B. and J.T.S.; writing—original draft preparation, V.B. and J.T.S.; writing—review and editing, U.R., N.M. and A.A.; visualization, V.B. and J.T.S.; supervision, U.R.; project administration, U.R. and N.M.; funding acquisition, N.M. All authors have read and agreed to the published version of the manuscript.

Funding

This research received no external funding.

Institutional Review Board Statement

Not applicable.

Informed Consent Statement

Not applicable.

Data Availability Statement

The data presented in this research work can be obtained from the corresponding authors for research purposes.

Conflicts of Interest

The authors declare no conflict of interest.

References

  1. Sylvester, Z.; Durkin, P.; Covault, J.A.; Sharman, G.R. High curvatures drive river meandering. Geology 2019, 47, e486. [Google Scholar] [CrossRef]
  2. Constantine, J.A.; Dunne, T.; Ahmed, J.; Legleiter, C.; Lazarus, E.D. Sediment supply as a driver of river meandering and floodplain evolution in the Amazon Basin. Nat. Geosci. 2014, 7, 899–903. [Google Scholar] [CrossRef] [Green Version]
  3. Ikeda, S.; Parker, G.; Sawai, K. Bend theory of river meanders. Part 1. Linear development. J. Fluid Mech. 1981, 112, 363–377. [Google Scholar] [CrossRef]
  4. Hooke, J.M.; Yorke, L. Channel bar dynamics on multi-decadal timescales in an active meandering river. Earth Surf. Process. Landf. 2011, 36, 1910–1928. [Google Scholar] [CrossRef]
  5. Seminara, G. Meanders. J. Fluid Mech. 2006, 554, 271–297. [Google Scholar] [CrossRef]
  6. Asahi, K.; Shimizu, Y.; Nelson, J.; Parker, G. Numerical simulation of river meandering with self-evolving banks. J. Geophys. Res. Earth Surf. 2013, 118, 2208–2229. [Google Scholar] [CrossRef]
  7. Monegaglia, F. Meandering Rivers Morphodynamics–Integrating Nonlinear Modeling and Remote Sensing. Ph.D. Thesis, University of London, London, UK, 2017; p. 250. Available online: http://qmro.qmul.ac.uk/xmlui/handle/123456789/33927 (accessed on 15 May 2022).
  8. Monegaglia, F.; Zolezzi, G.; Güneralp, I.; Henshaw, A.J.; Tubino, M. Automated extraction of meandering river morphodynamics from multitemporal remotely sensed data. Environ. Model. Softw. 2018, 105, 171–186. [Google Scholar] [CrossRef]
  9. Surasinghe, T.; Kariyawasam, R.; Sudasinghe, H.; Karunarathna, S. Challenges in Biodiversity Conservation in a Highly Modified Tropical River Basin in Sri Lanka. Water 2019, 12, 26. [Google Scholar] [CrossRef] [Green Version]
  10. Liyanage, G.; Illango, A.; Manage, P. Prevalence and Quantitative Analysis of Antibiotic Resistance Genes (ARGs) in Surface and Groundwater in Meandering Part of the Kelani River Basin in Sri Lanka. Water Air Soil Pollut. 2021, 232, 351. [Google Scholar] [CrossRef]
  11. Jayapadma, J.; Souma, K.; Ishidaira, H.; Magome, J.; Wickramaarachchi, T. The Effect of Incorporation of Embankment Information for Flood Simulation of the Gin River, Sri Lanka. J. Disaster Res. 2022, 17, 475–486. [Google Scholar] [CrossRef]
  12. Mahagamage, M.; Pathirage, M.; Manage, P. Contamination Status of Salmonella spp., Shigella spp. and Campylobacter spp. in Surface and Groundwater of the Kelani River Basin 2020, Sri Lanka. Water 2020, 12, 2187. [Google Scholar] [CrossRef]
  13. Jayasuriya, A. A new forest vegetation type in Sri Lanka: Dry Canal-associated Evergreen Forest. Ceylon J. Sci. 2019, 48, 375–381. [Google Scholar] [CrossRef]
  14. Huang, Y.; Chen, Z.; Yu, T.; Huang, X.; Gu, X. Agricultural remote sensing big data: Management and applications. J. Integr. Agric. 2018, 17, 1915–1931. [Google Scholar] [CrossRef]
  15. Sheffield, J.; Wood, E.; Pan, M.; Beck, H.; Coccia, G.; Serrat-Capdevila, A.; Verbist, K. Satellite Remote Sensing for Water Resources Management: Potential for Supporting Sustainable Development in Data-Poor Regions. Water Resour. Res. 2018, 54, 9724–9758. [Google Scholar] [CrossRef] [Green Version]
  16. Zhao, M.; Zhou, Y.; Li, X.; Cao, W.; He, C.; Yu, B.; Li, X.; Elvidge, C.D.; Cheng, W.; Zhou, C. Applications of Satellite Remote Sensing of Nighttime Light Observations: Advances, Challenges, and Perspectives. Remote Sens. 2019, 11, 1971. [Google Scholar] [CrossRef] [Green Version]
  17. Fathololoumi, S.; Vaezi, A.; Alavipanah, S.; Ghorbani, A.; Saurette, D.; Biswas, A. Improved digital soil mapping with multitemporal remotely sensed satellite data fusion: A case study in Iran. Sci. Total Environ. 2020, 721, 137703. [Google Scholar] [CrossRef] [PubMed]
  18. Alvarez-Vanhard, E.; Corpetti, T.; Houet, T. UAV & satellite synergies for optical remote sensing applications: A literature review. Sci. Remote Sens. 2021, 3, 100019. [Google Scholar] [CrossRef]
  19. Perera, H.; Fernando, S.; Gunathilake, M.; Sirisena, T.; Rathnayake, U. Evaluation of Satellite Rainfall Products over the Mahaweli River Basin in Sri Lanka. Adv. Meteorol. 2022, 2022, 1926854. [Google Scholar] [CrossRef]
  20. Makumbura, R.; Samarasinghe, J.; Rathnayake, U. Multidecadal Land Use Patterns and Land Surface Temperature Variation in Sri Lanka. Appl. Environ. Soil Sci. 2022, 2022, 2796637. [Google Scholar] [CrossRef]
  21. Gilvear, D.; Bryant, R. Analysis of remotely sensed data for fluvial geomorphology and river science. In Tools in Fluvial Geomorphology; John Wiley & Sons, Ltd.: Hoboken, NJ, USA, 2016; pp. 103–132. [Google Scholar] [CrossRef]
  22. Boothroyd, R.J.; Williams, R.D.; Hoey, T.B.; Barrett, B.; Prasojo, O.A. Applications of Google Earth Engine in fluvial geomorphology for detecting river channel change. Wiley Interdiscip. Rev. Water 2021, 8, e21496. [Google Scholar] [CrossRef]
  23. Rowland, J.C.; Shelef, E.; Pope, P.A.; Muss, J.; Gangodagamage, C.; Brumby, S.P.; Wilson, C.J. A morphology independent methodology for quantifying planview river change and characteristics from remotely sensed imagery. Remote Sens. Environ. 2016, 184, 212–228. [Google Scholar] [CrossRef] [Green Version]
  24. Isikdogan, F.; Bovik, A.; Passalacqua, P. RivaMap: An automated river analysis and mapping engine. Remote Sens. Environ. 2017, 202, 88–97. [Google Scholar] [CrossRef]
  25. Boruah, S.; Gilvear, D.; Hunter, P.; Sharma, N. Quantifying channel planform and physical habitat dynamics on a large braided river using satellite data—the Brahmaputra, India. River Res. Appl. 2008, 24, 650–660. [Google Scholar] [CrossRef]
  26. Wickramaarachchi, T.N. Preliminary assessment of surface water resources-a study from Deduru Oya Basin of Sri Lanka. In APHW Proceeding; Suntec International Convvention and Exhibition Center: Singapore, 2004. [Google Scholar]
  27. Jayasena, H.; Chandrajith, R.; Gangadhara, K. Water Management in Ancient Tank Cascade Systems (TCS) in Sri Lanka: Evidence for Systematic Tank Distribution. J. Geol. Soc. Sri Lanka 2011, 14, 29–34. [Google Scholar]
  28. PGSomaratne, K.J.; Perera, L.R.; Ariyaratne, B.R.; Bandaragoda, D.J.; Makin, I.W. Developing Effective Institutions for Water Resources Management: A Case Study in the Deduru Oya Basin, Sri Lanka; Working Paper 58; IWMI: Colombo, Sri Lanka, 2003; p. 104. Available online: http://www.iwmi.cgiar.org/publications/iwmi-working-papers/iwmi-working-paper-58/ (accessed on 30 May 2022).
  29. Boothroyd, R.; Nones, M.; Guerrero, M. Deriving Planform Morphology and Vegetation Coverage from Remote Sensing to Support River Management Applications. Front. Environ. Sci. 2021, 9, 657354. [Google Scholar] [CrossRef]
  30. Xia, H.; Zhao, J.; Qin, Y.; Yang, J.; Cui, Y.; Song, H.; Ma, L.; Jin, N.; Meng, Q. Changes in water surface area during 1989–2017 in the Huai River Basin using Landsat data and Google earth engine. Remote Sens. 2019, 11, 1824. [Google Scholar] [CrossRef] [Green Version]
  31. Chen, B.; Xiao, X.; Li, X.; Pan, L.; Doughty, R.; Ma, J.; Dong, J.; Qin, Y.; Zhao, B.; Wu, Z.; et al. A mangrove forest map of China in 2015: Analysis of time series Landsat 7/8 and Sentinel-1A imagery in Google Earth Engine cloud computing platform. ISPRS J. Photogramm. Remote Sens. 2017, 131, 104–120. [Google Scholar] [CrossRef]
  32. Zou, Z.; Dong, J.; Menarguez, M.A.; Xiao, X.; Qin, Y.; Doughty, R.B.; Hooker, K.V.; David Hambright, K. Continued decrease of open surface water body area in Oklahoma during 1984–2015. Sci. Total Environ. 2017, 595, 451–460. [Google Scholar] [CrossRef]
  33. Zou, Z.; Xiao, X.; Dong, J.; Qin, Y.; Doughty, R.B.; Menarguez, M.A.; Zhang, G.; Wang, J. Divergent trends of open-surface water body area in the contiguous United States from 1984 to 2016. Proc. Natl. Acad. Sci. USA 2018, 115, 3810–3815. [Google Scholar] [CrossRef] [Green Version]
  34. Rohatgi, A. Webplotdigitizer: Version 4.5. 2021. Available online: https://automeris.io/WebPlotDigitizer (accessed on 15 June 2022).
  35. Deb, M.; Das, D.; Uddin, M. Evaluation of Meandering Characteristics Using RS & GIS of Manu River. J. Water Resour. Prot. 2012, 04, 163–171. [Google Scholar] [CrossRef]
  36. Lagasse, P.F. Handbook for Predicting Stream Meander Migration; National Cooperative Highway Research Program; Transportation Research Board, National Research Council: Washington, DC, USA, 2004. [Google Scholar]
  37. Dey, A.; Bhattacharya, R.K. Monitoring of River Center Line and Width-A Study on River Brahmaputra. J. Indian Soc. Remote Sens. 2014, 42, 475–482. [Google Scholar] [CrossRef]
  38. Hamilton, S.K.; Kellndorfer, J.; Lehner, B.; Tobler, M. Remote sensing of floodplain geomorphology as a surrogate for biodiversity in a tropical river system (Madre de Dios, Peru). Geomorphology 2007, 89, 23–38. [Google Scholar] [CrossRef]
  39. Wang, D.; Ma, Y.; Liu, X.; Huang, H.Q.; Huang, L.; Deng, C. Meandering-anabranching river channel change in response to flow-sediment regulation: Data analysis and model validation. J. Hydrol. 2019, 579, 124209. [Google Scholar] [CrossRef]
Figure 1. River meandering behavior: (a) meandering behavior and sediment deposition along the Deduru Oya (source: Google maps); (b) eroded riverbanks and damaged houses (photo credit—D.C.H); (c) meandering bend (photo credit—D.C.H).
Land 11 01091 g001aLand 11 01091 g001b
Figure 2. Map of the Deduru Oya river basin and the river segment selected for the analysis.
Land 11 01091 g002
Figure 3. Illustrative maps of meandering features of the Deduru Oya using Landsat data: (a) for 2008—Landsat false color composite bands on LT05_L1TP_142055_20081229_20200828_02_T1_B (1, 4, 7); (b) for 2010—Landsat false color composite bands on LT05_L1TP_142055_20100218_20200824_02_T1_B (1, 4, 7).
Land 11 01091 g003
Figure 4. Overview of the methodology of the study.
Land 11 01091 g004
Figure 5. Extracted water masks for: (a) 1989; (b) 2005; (c) 2021.
Land 11 01091 g005aLand 11 01091 g005b
Figure 6. Temporal variation of river centerline.
Land 11 01091 g006
Figure 7. Spatiotemporal variation of curvature along the river centerline.
Land 11 01091 g007
Figure 8. Centerline migration rates for the Deduru Oya.
Land 11 01091 g008
Figure 9. Separation of individual meander bends along the Deduru Oya.
Land 11 01091 g009
Figure 10. Different types of bend migrations: (a) extension; (b) translation; (c) rotation; (d) conversion to a compound loop; (e) neck cutoff by closure; (f) diagonal cutoff by chute; (g) neck cutoff by chute (extracted from Lagasse [36]).
Land 11 01091 g010
Table 1. Landsat data availability (https://earthexplorer.usgs.gov/, accessed on 2 May 2022).
Landsat DataResolutionAvailable PeriodNumber of Bands
Landsat 1–5 MSS60 m1972–201204
Landsat 4–5 TM30 m1982–201207
Landsat 7 ETM+30 m1999 to present08
Landsat 8 OLI and TIRS30 mApril 2013 to present11
Landsat 9 OLI30 mFebruary 2022 to present11
Table 2. Landsat data used for the present analysis.
YearLandsat Data TypeExtracted Date
1989Landsat 5 TM2 December 1989
1994Landsat 5 TM11 September 1994
2001Landsat 5 TM14 September 2001
2005Landsat 5 TM17 March 2005
2008Landsat 5 TM4 November 2008
2021Landsat 8 OLI23 October 2020
Table 3. Classification of meandering bend migrations in the lower Deduru Oya.
Bend IDLocation CoordinatesMeander Length (m)SinuosityType of Bend Migration
Starting Point Endpoint
1(369,891, 840,926)(370,469, 841,322)11471.67Diagonal cutoff by chute
2(370,469, 841,322)(371,392, 841,643)10741.12Rotation
3(371,392, 841,643)(372,085, 841,713)9701.26Extension
4(372,085, 841,713)(372,744, 842,194)17472.14Extension
5(373,439, 842,829)(374,175, 842,607)9581.28Extension
6(374,175, 842,607)(374,658, 842,408)6021.14Conversion to compound loop
7(376,310, 843,127)(378,050, 843,167)21371.22Extension
8(378,050, 843,167)(380,069, 843,259)29371.48Extension
9(381,376, 845,347)(381,803, 846,241)20522.16Translation
10(381,803, 846,241)(381,770, 847,127)12391.42Conversion to compound loop
11(382,838, 849,184)(383,484, 849,056)7931.13Extension
12(383,484, 849,056)(383,897, 848,928)5811.39Extension
13(385,793, 849,733)(386,464, 850,102)9481.74Translation
14(388,671, 851,246)(389,186, 851,590)13041.75Rotation
15(389,427, 851,590)(389,864, 851,679)8501.41Extension
16(395,413, 853,972)(397,947, 854,106)31361.23Neck cutoff by chute
17(405,221, 853,671)(406,338, 853,766)13611.18Extension
18(417,035, 854,669)(417,950, 854,127)12771.17Translation
Publisher’s Note: MDPI stays neutral with regard to jurisdictional claims in published maps and institutional affiliations.

