
Dynamic Changes of Nitrogen Loads in Source–Sink Landscapes under Urbanization


Abstract
:1. Introduction
2. Materials and Methods
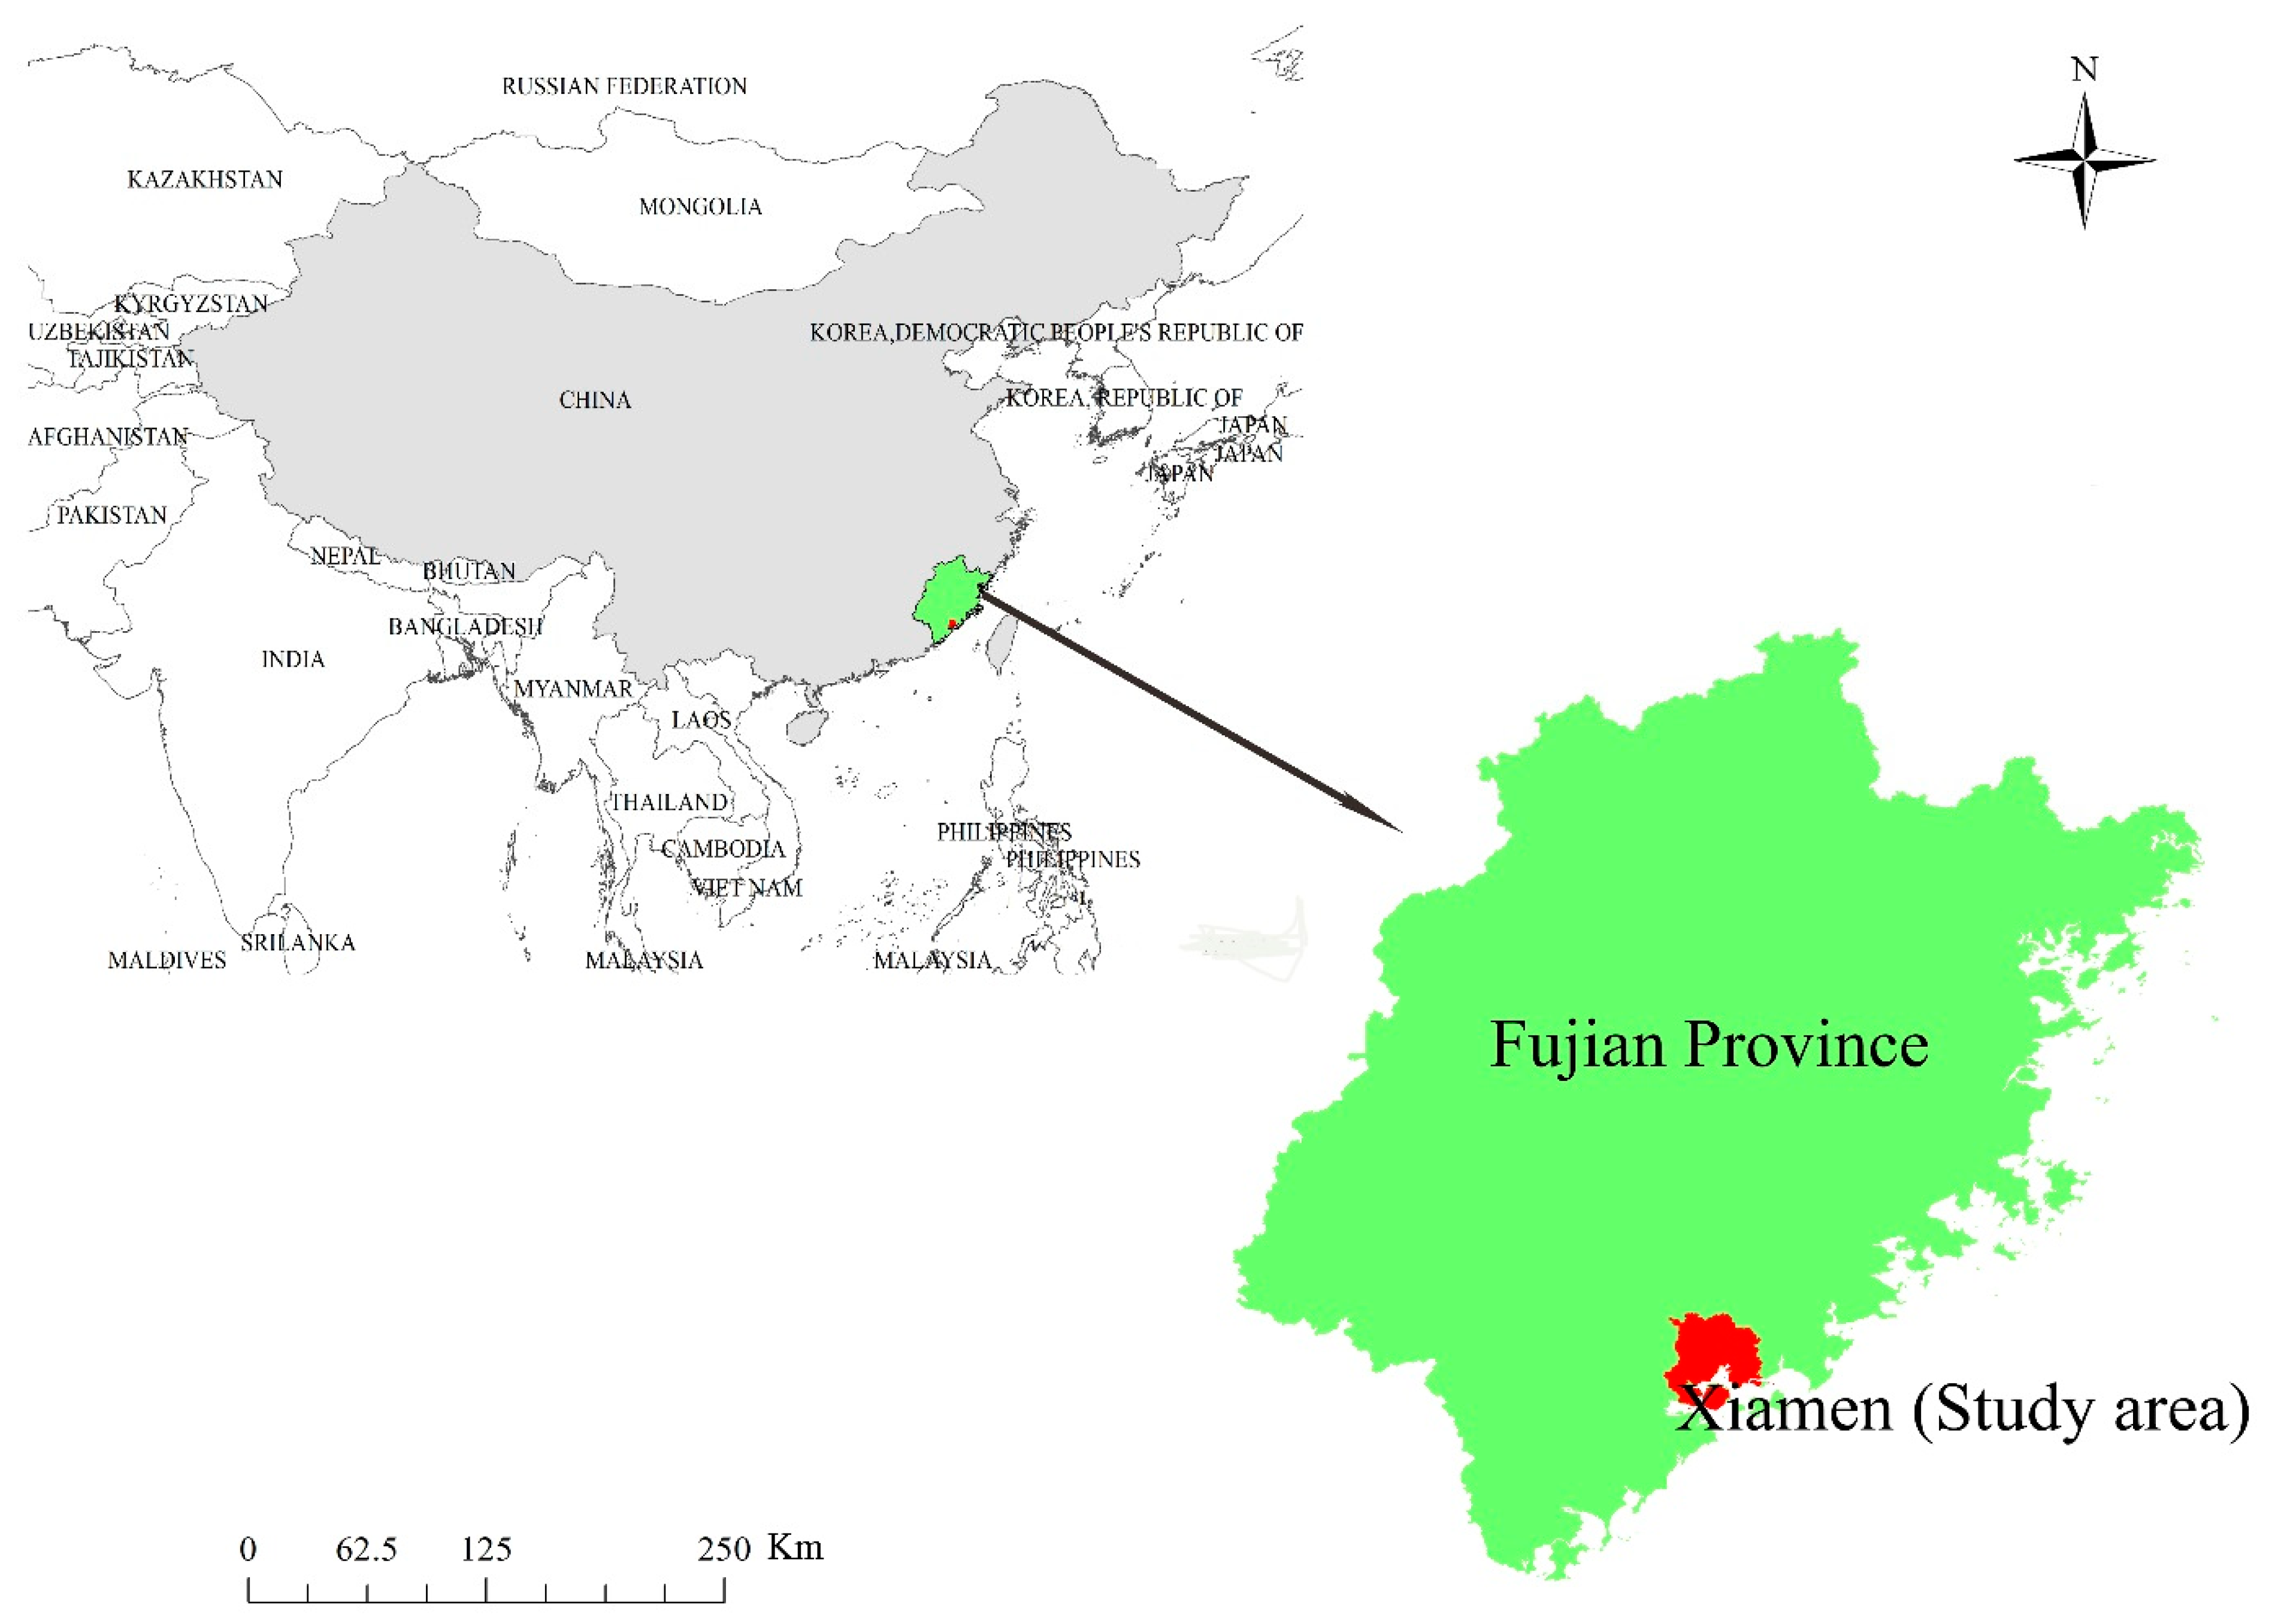
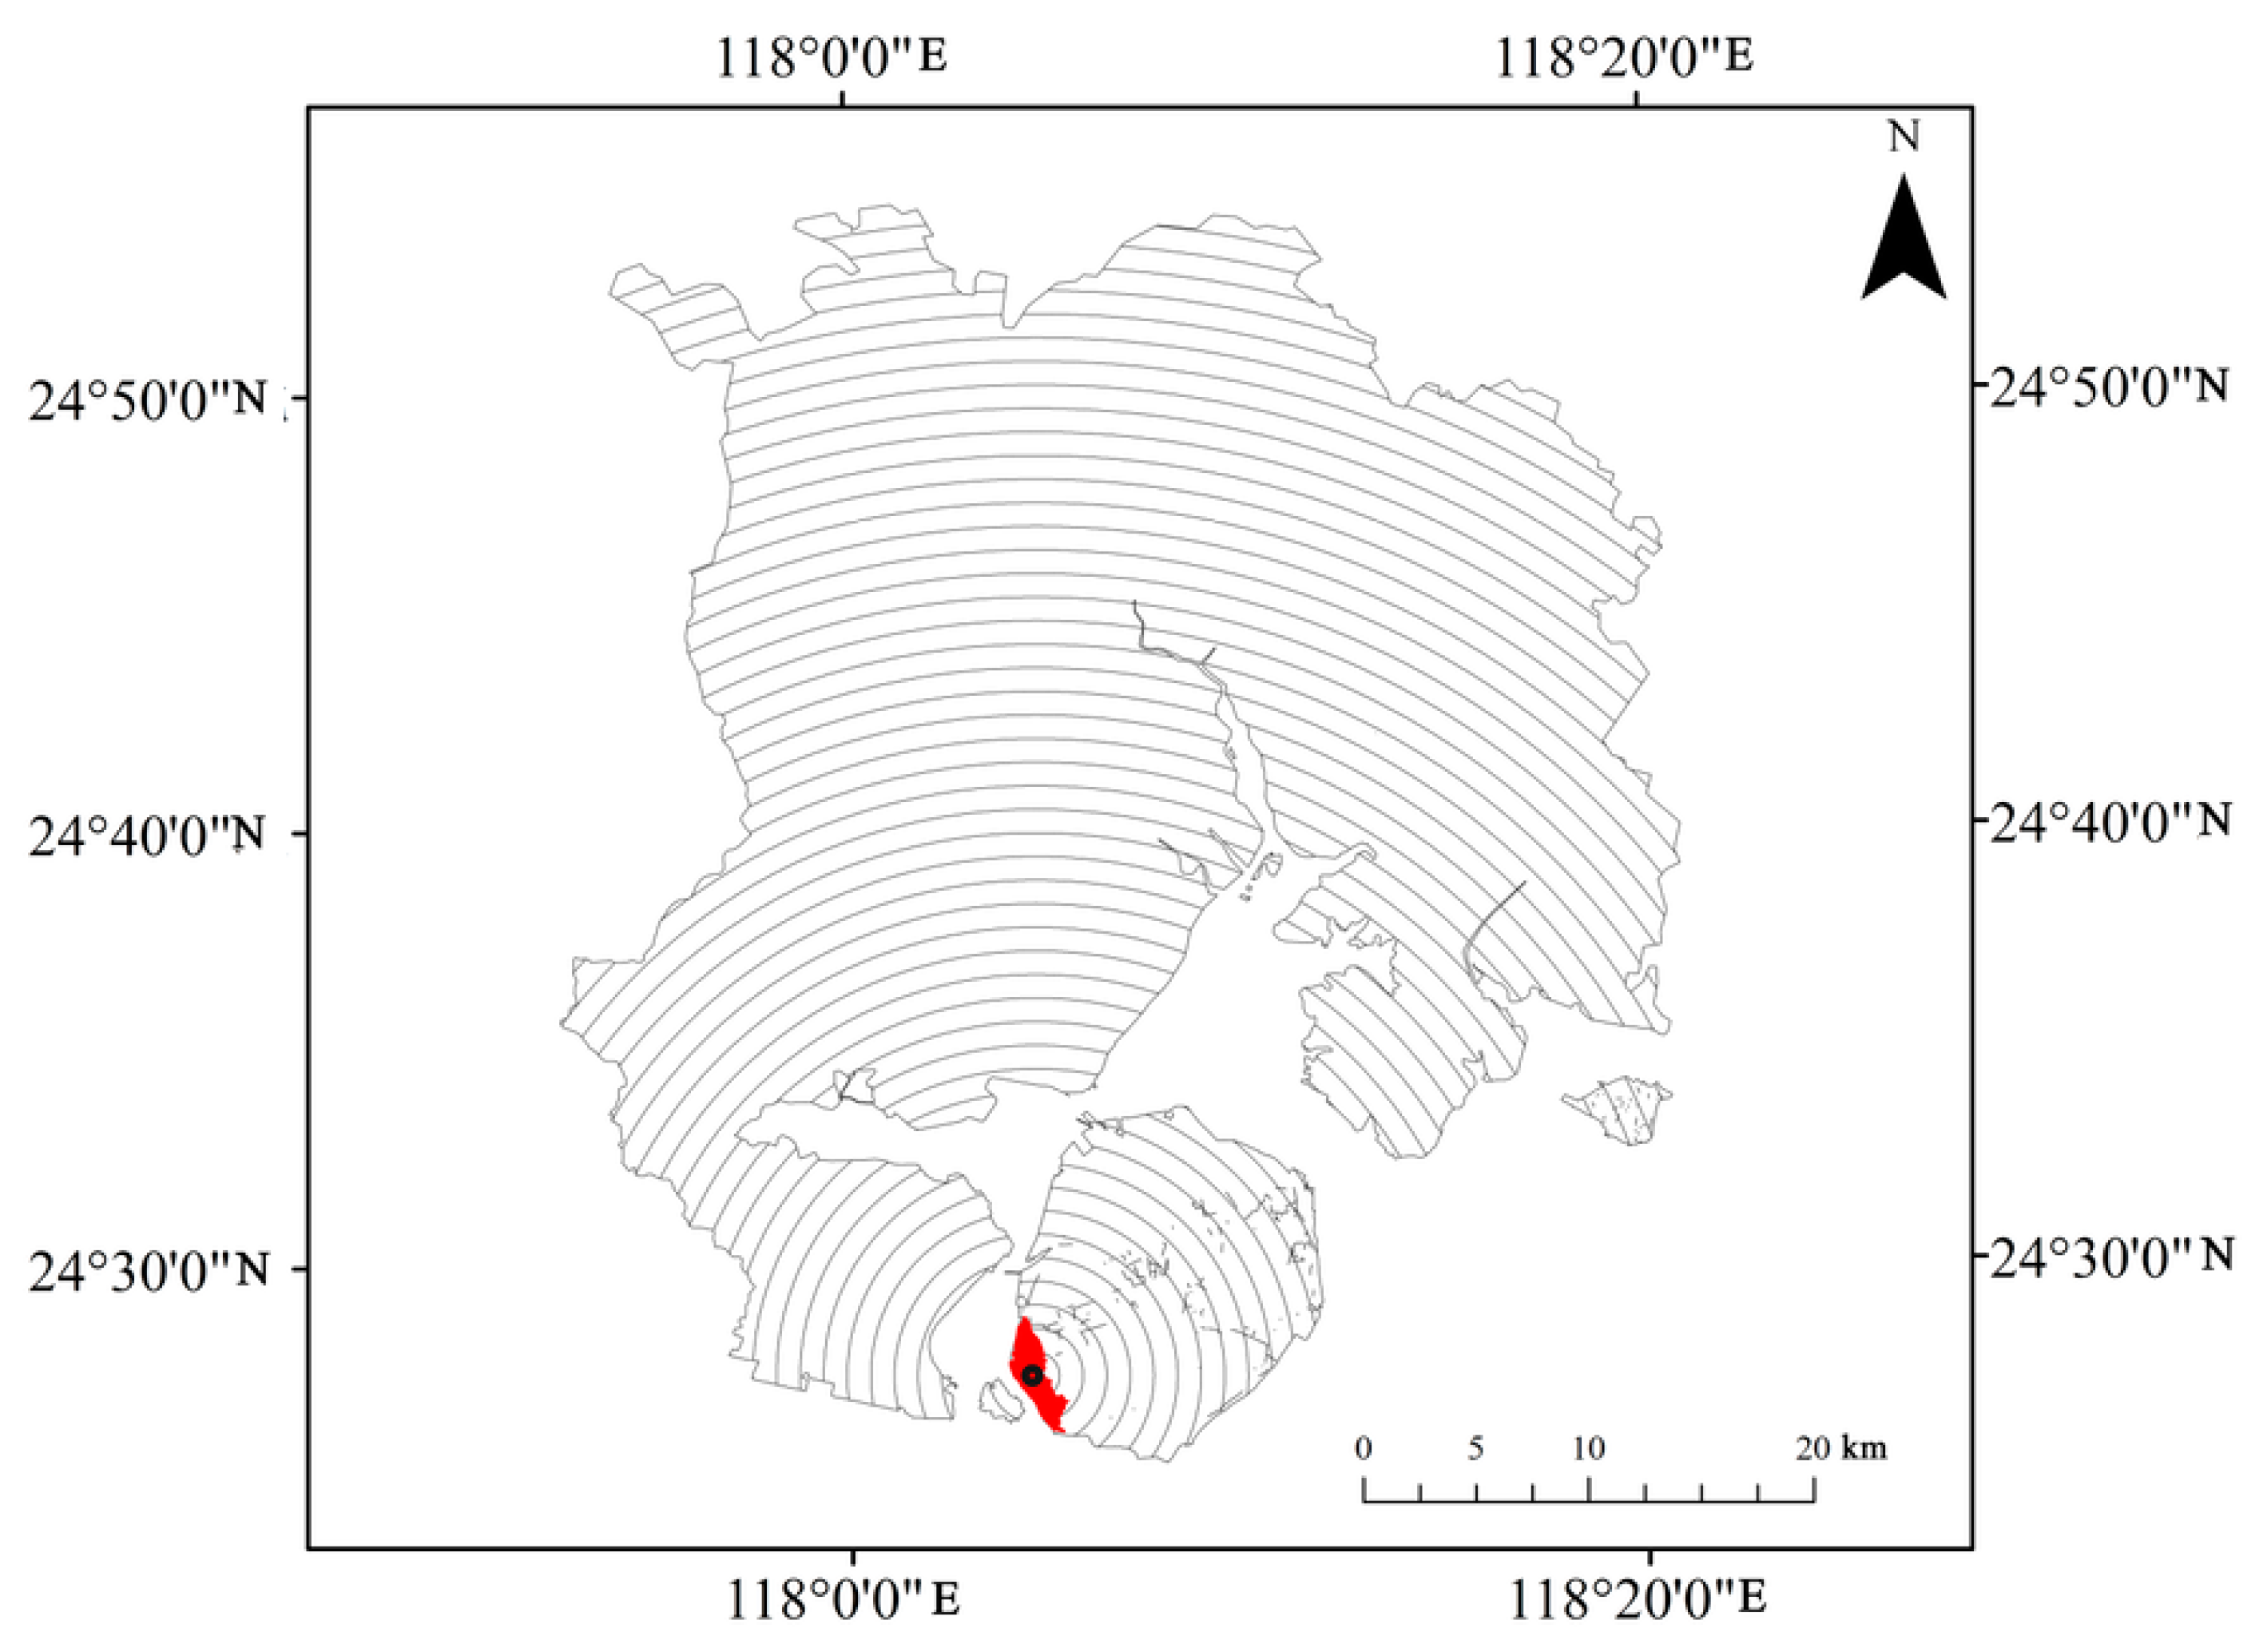
2.1. Study Area
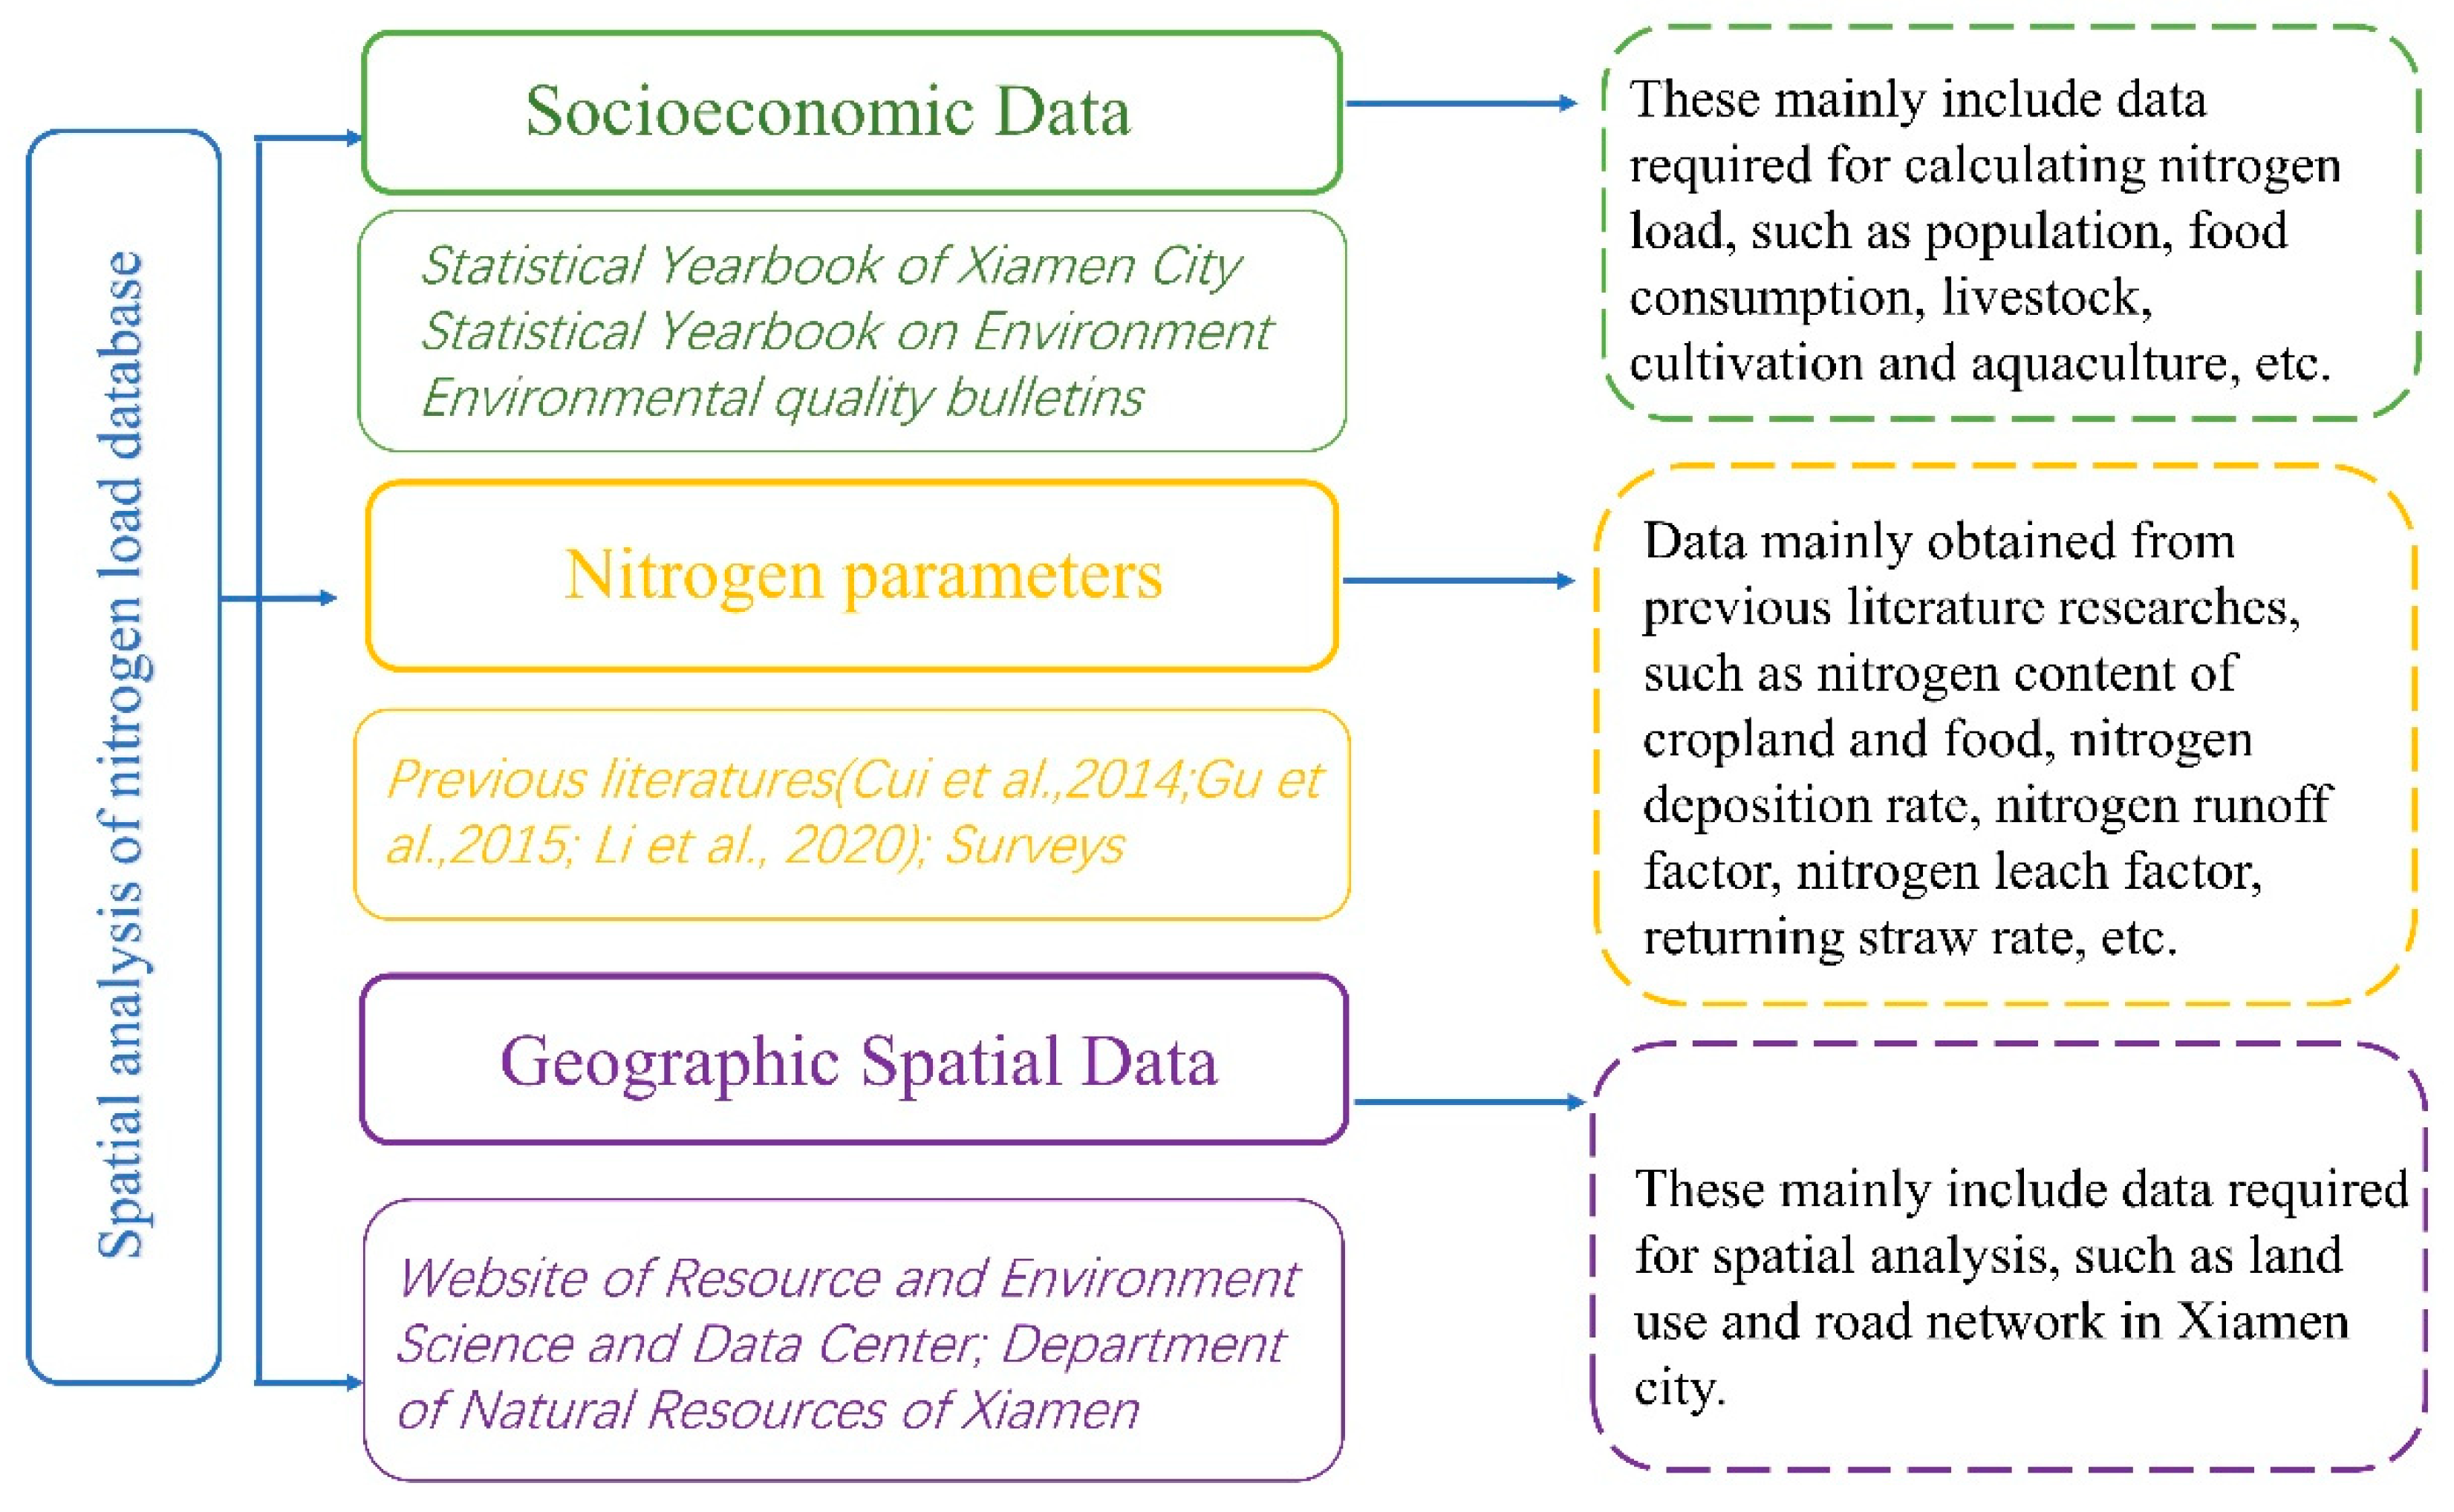
2.2. Data Sources
3. Methodology
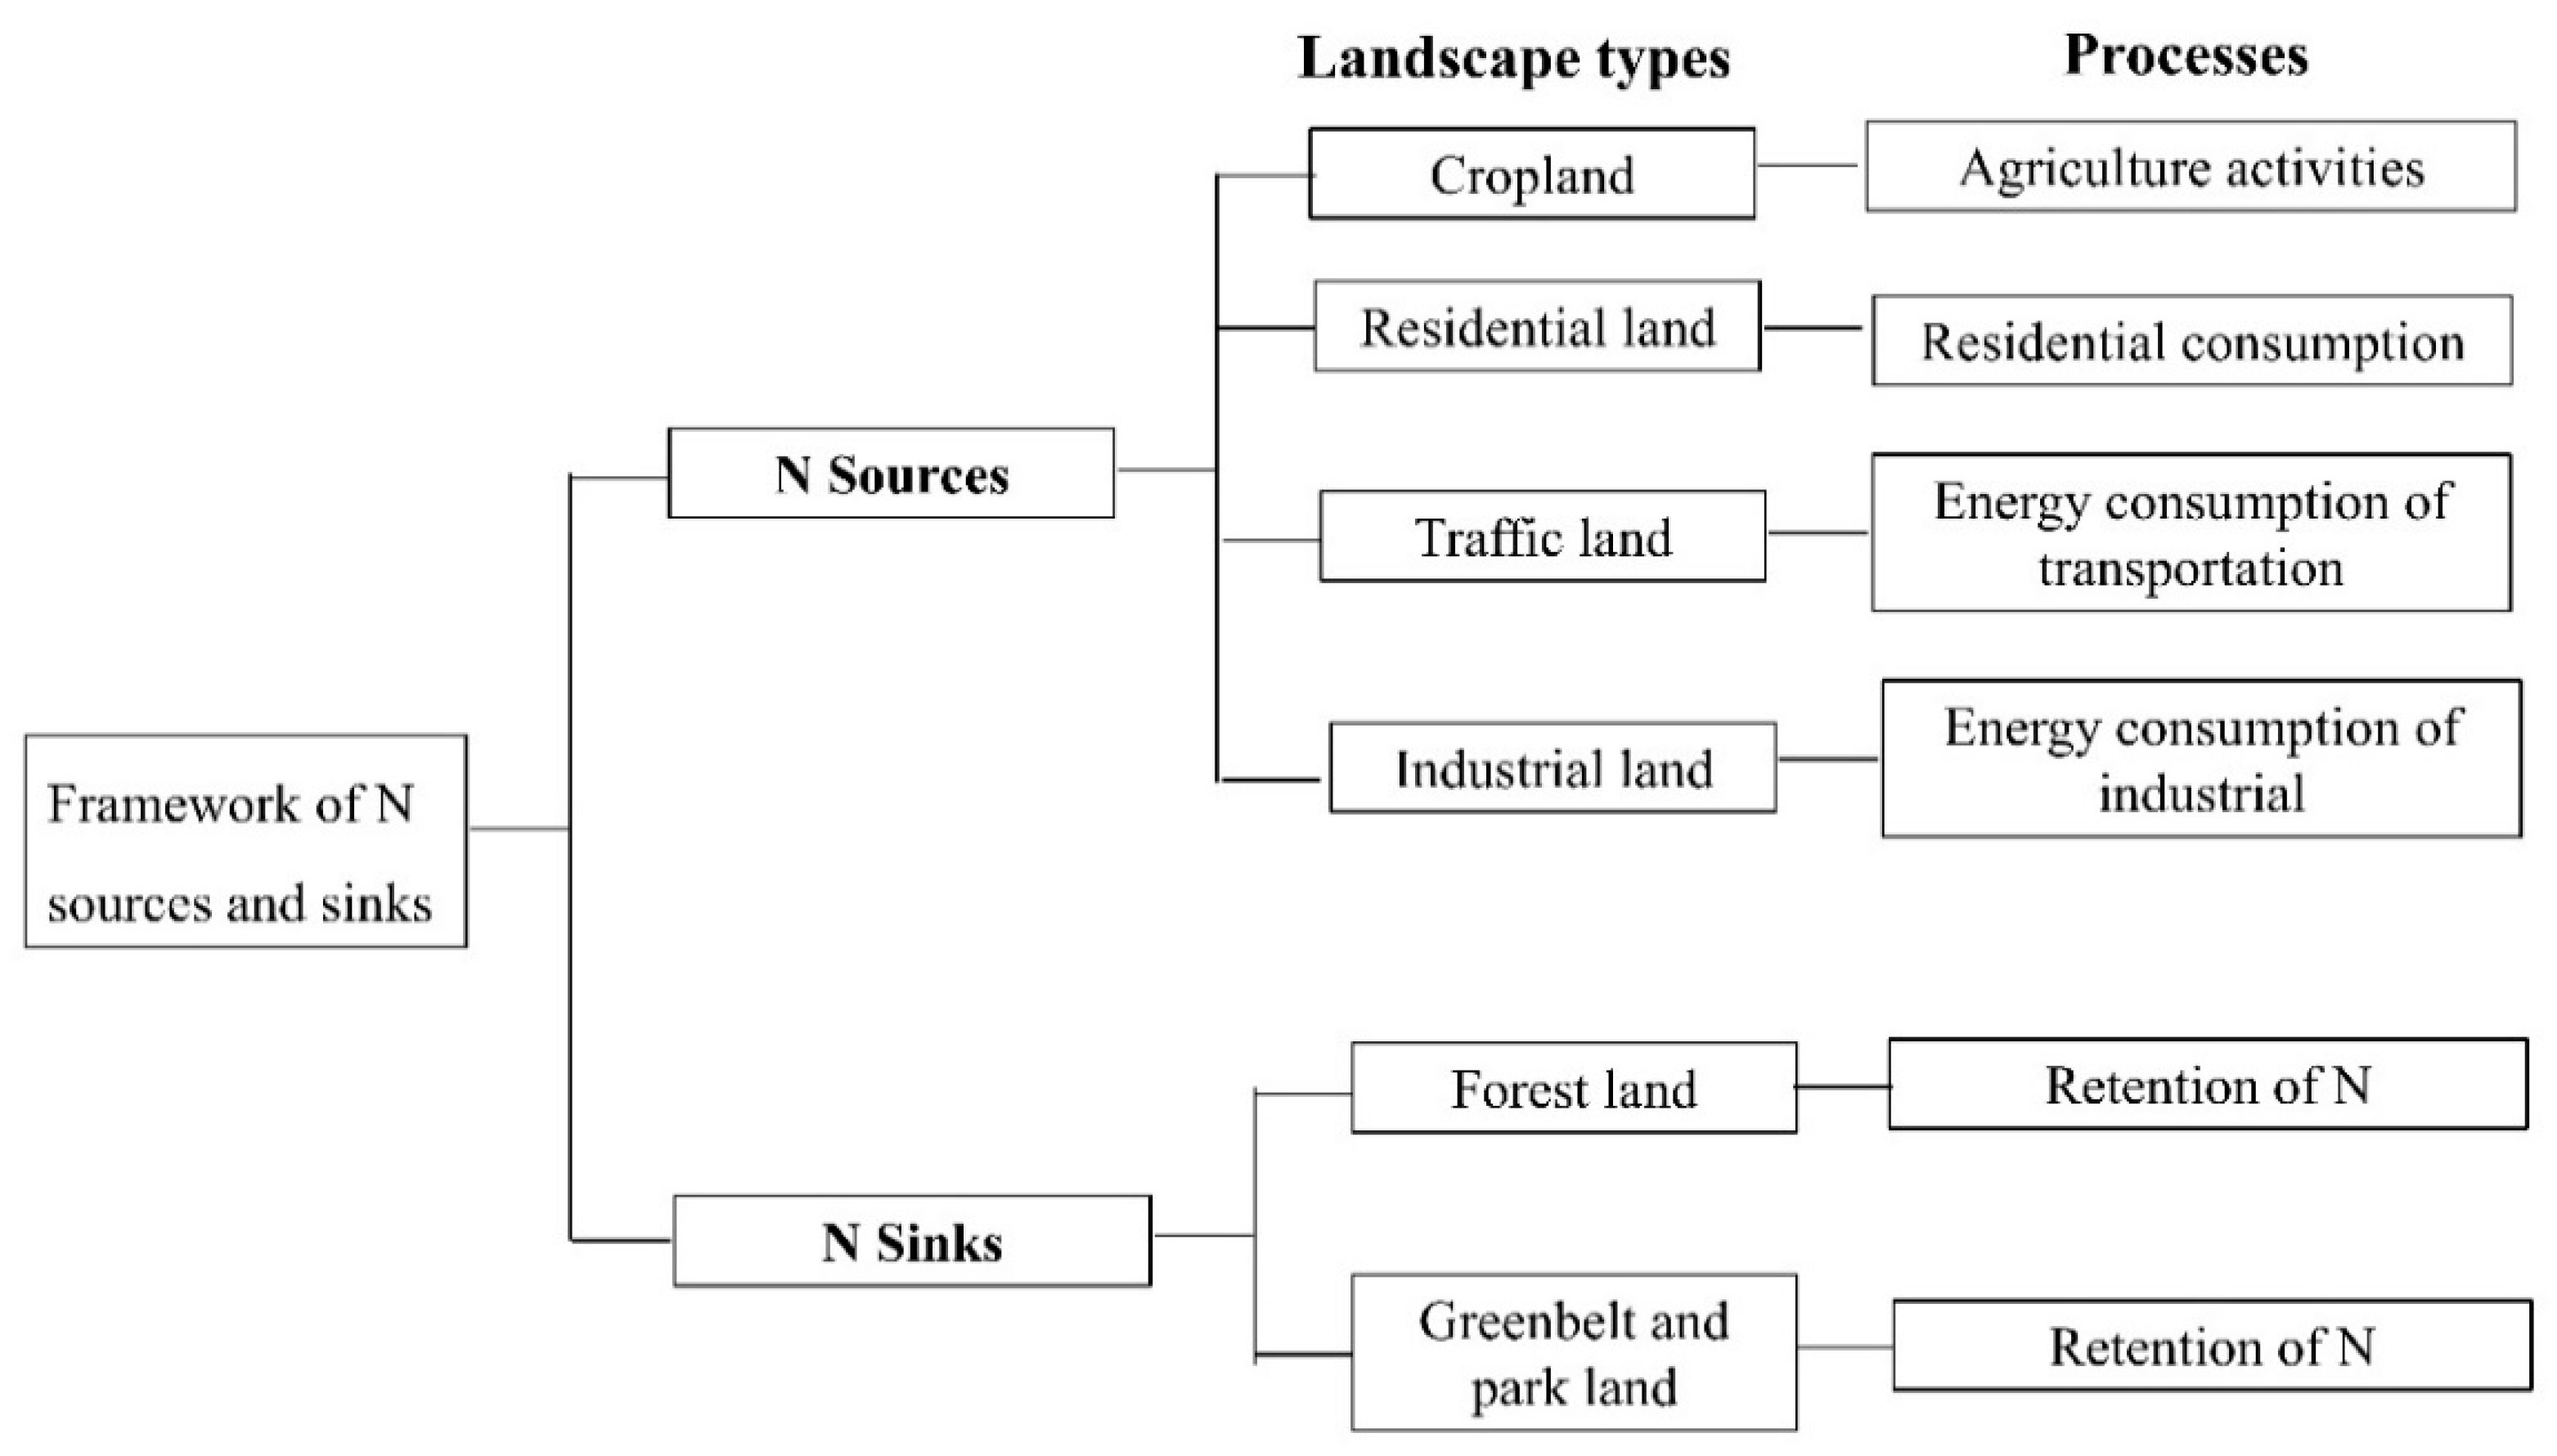
3.1. Source–Sink Landscape Identification in the N Flowing Process
3.2. Calculation of N Loads
- (1)
- Cropland
- (2)
- Forest
- (3)
- Greenbelt and park
- (4)
- Residential
- (5)
- Traffic
- (6)
- Industrial
3.3. Spatial Gradient Analysis
4. Results
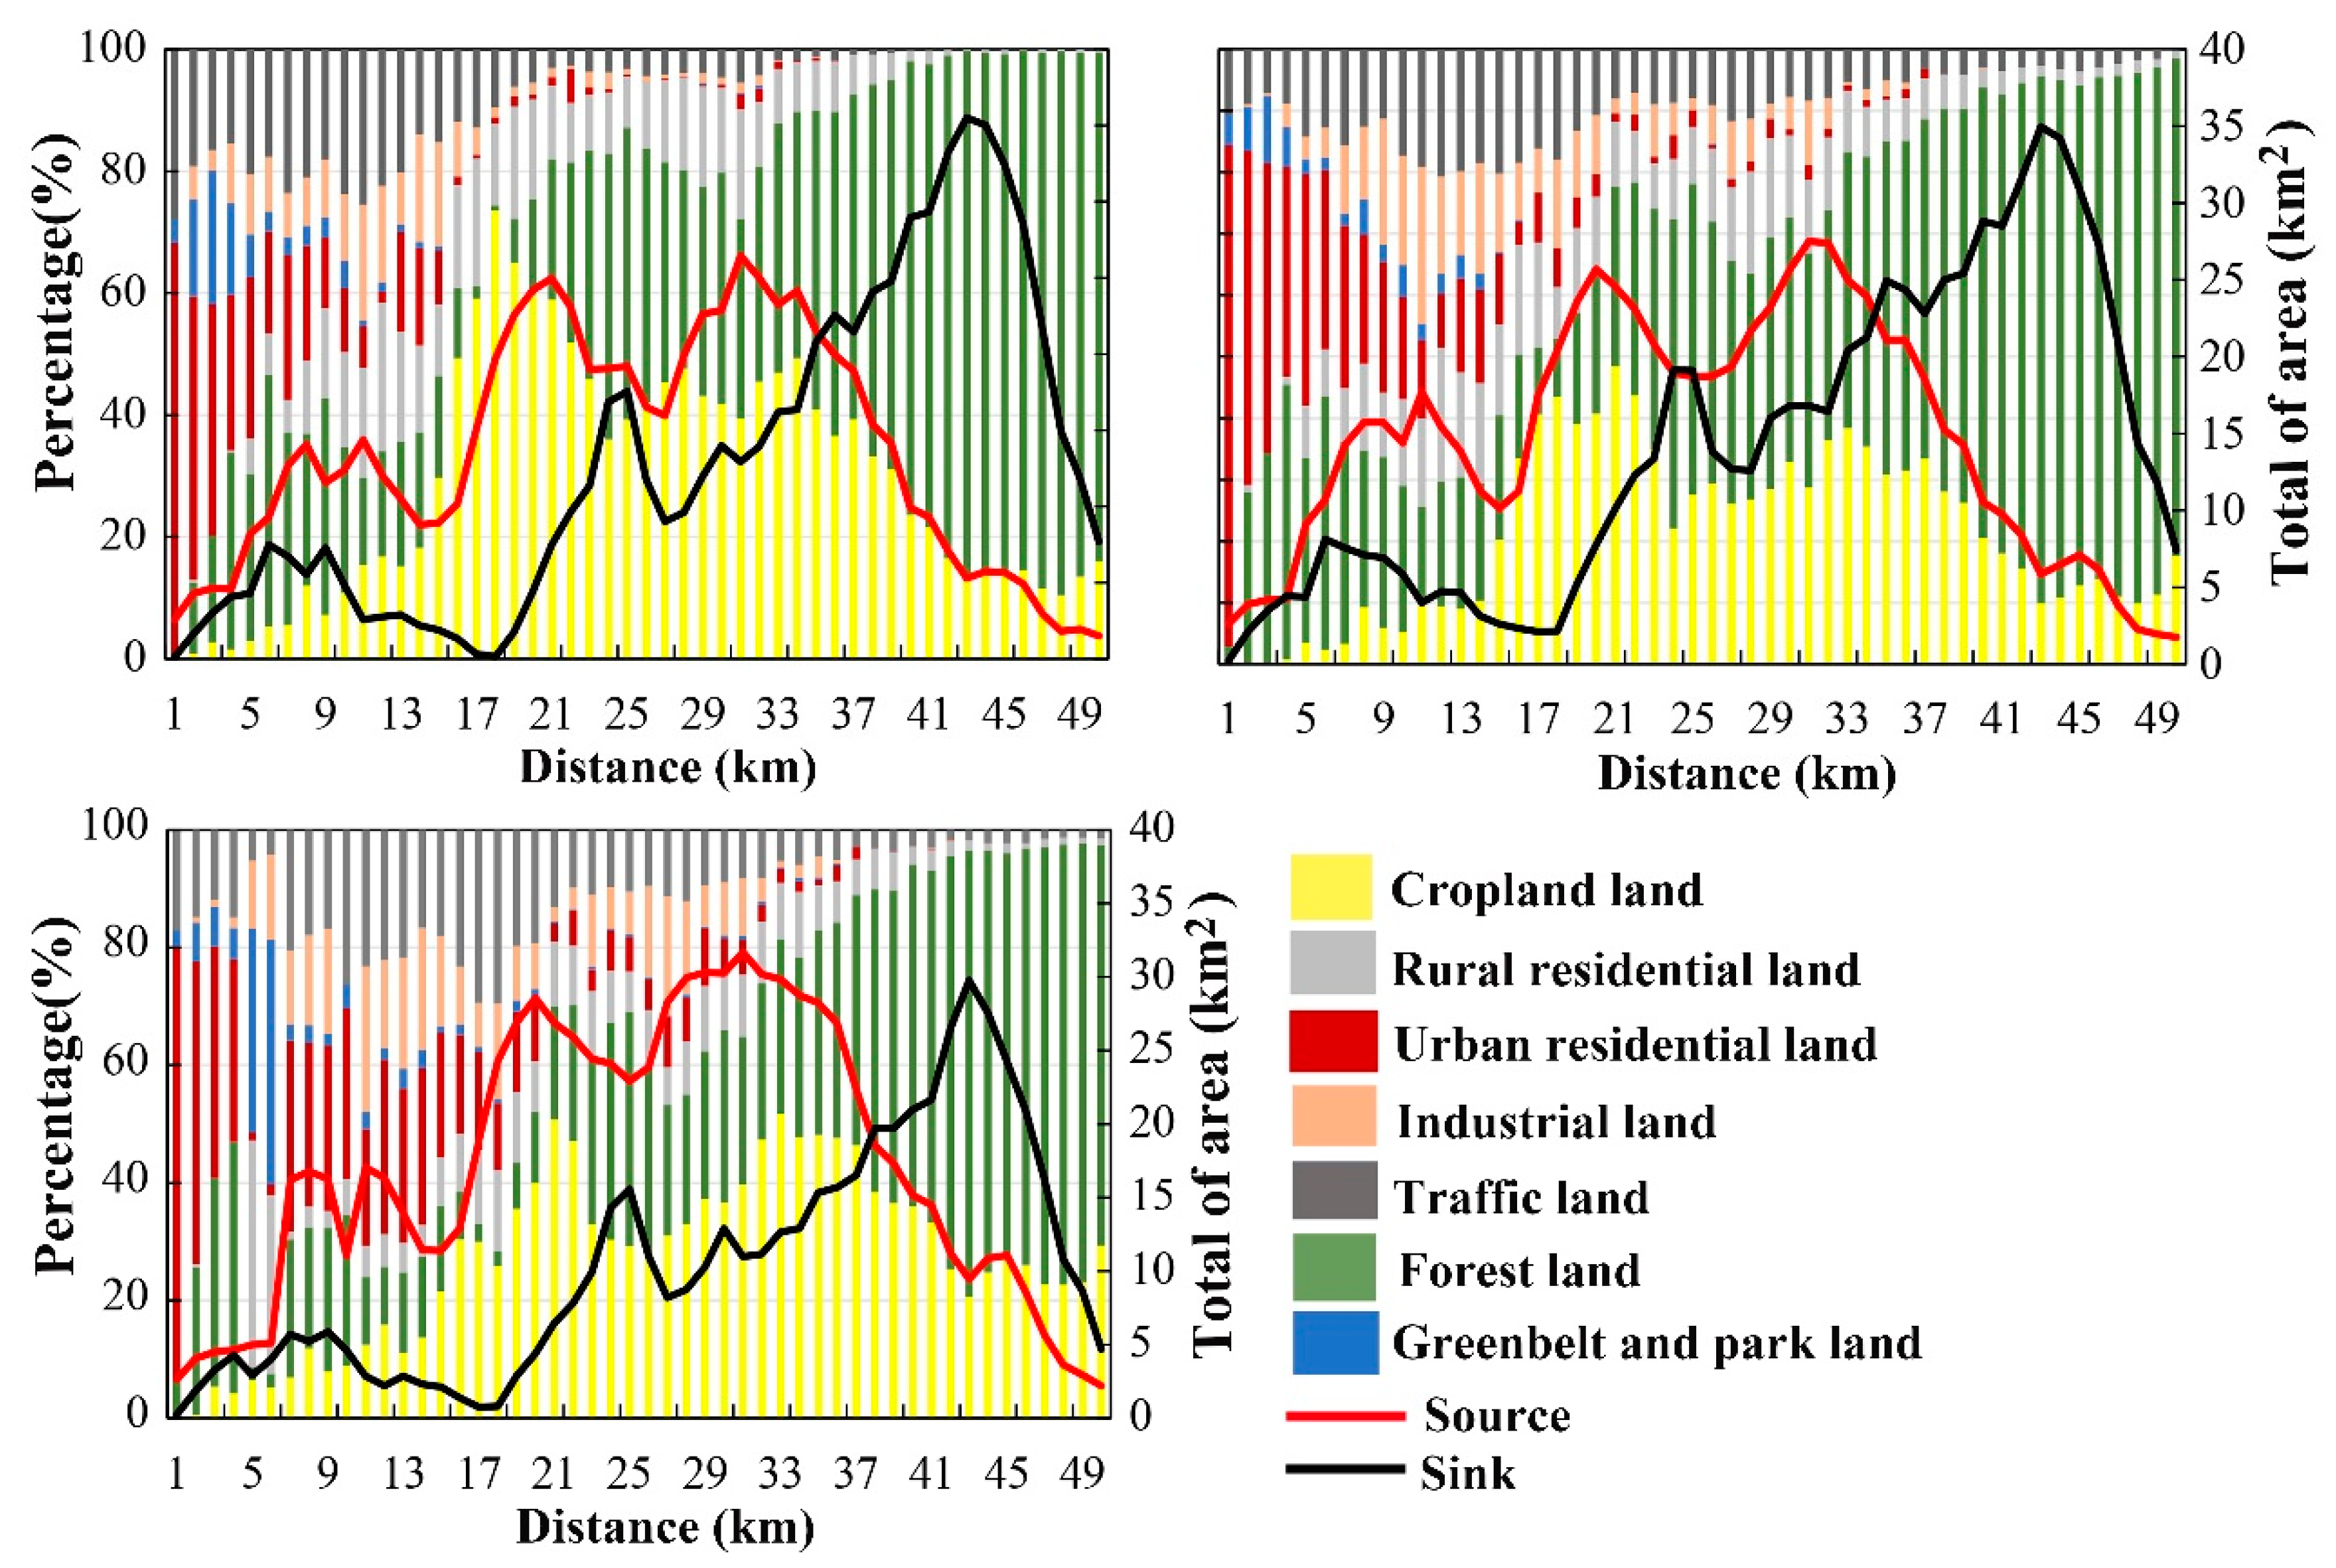
4.1. Changes in Landscape along the Spatial Gradient
4.2. N Source and Sink
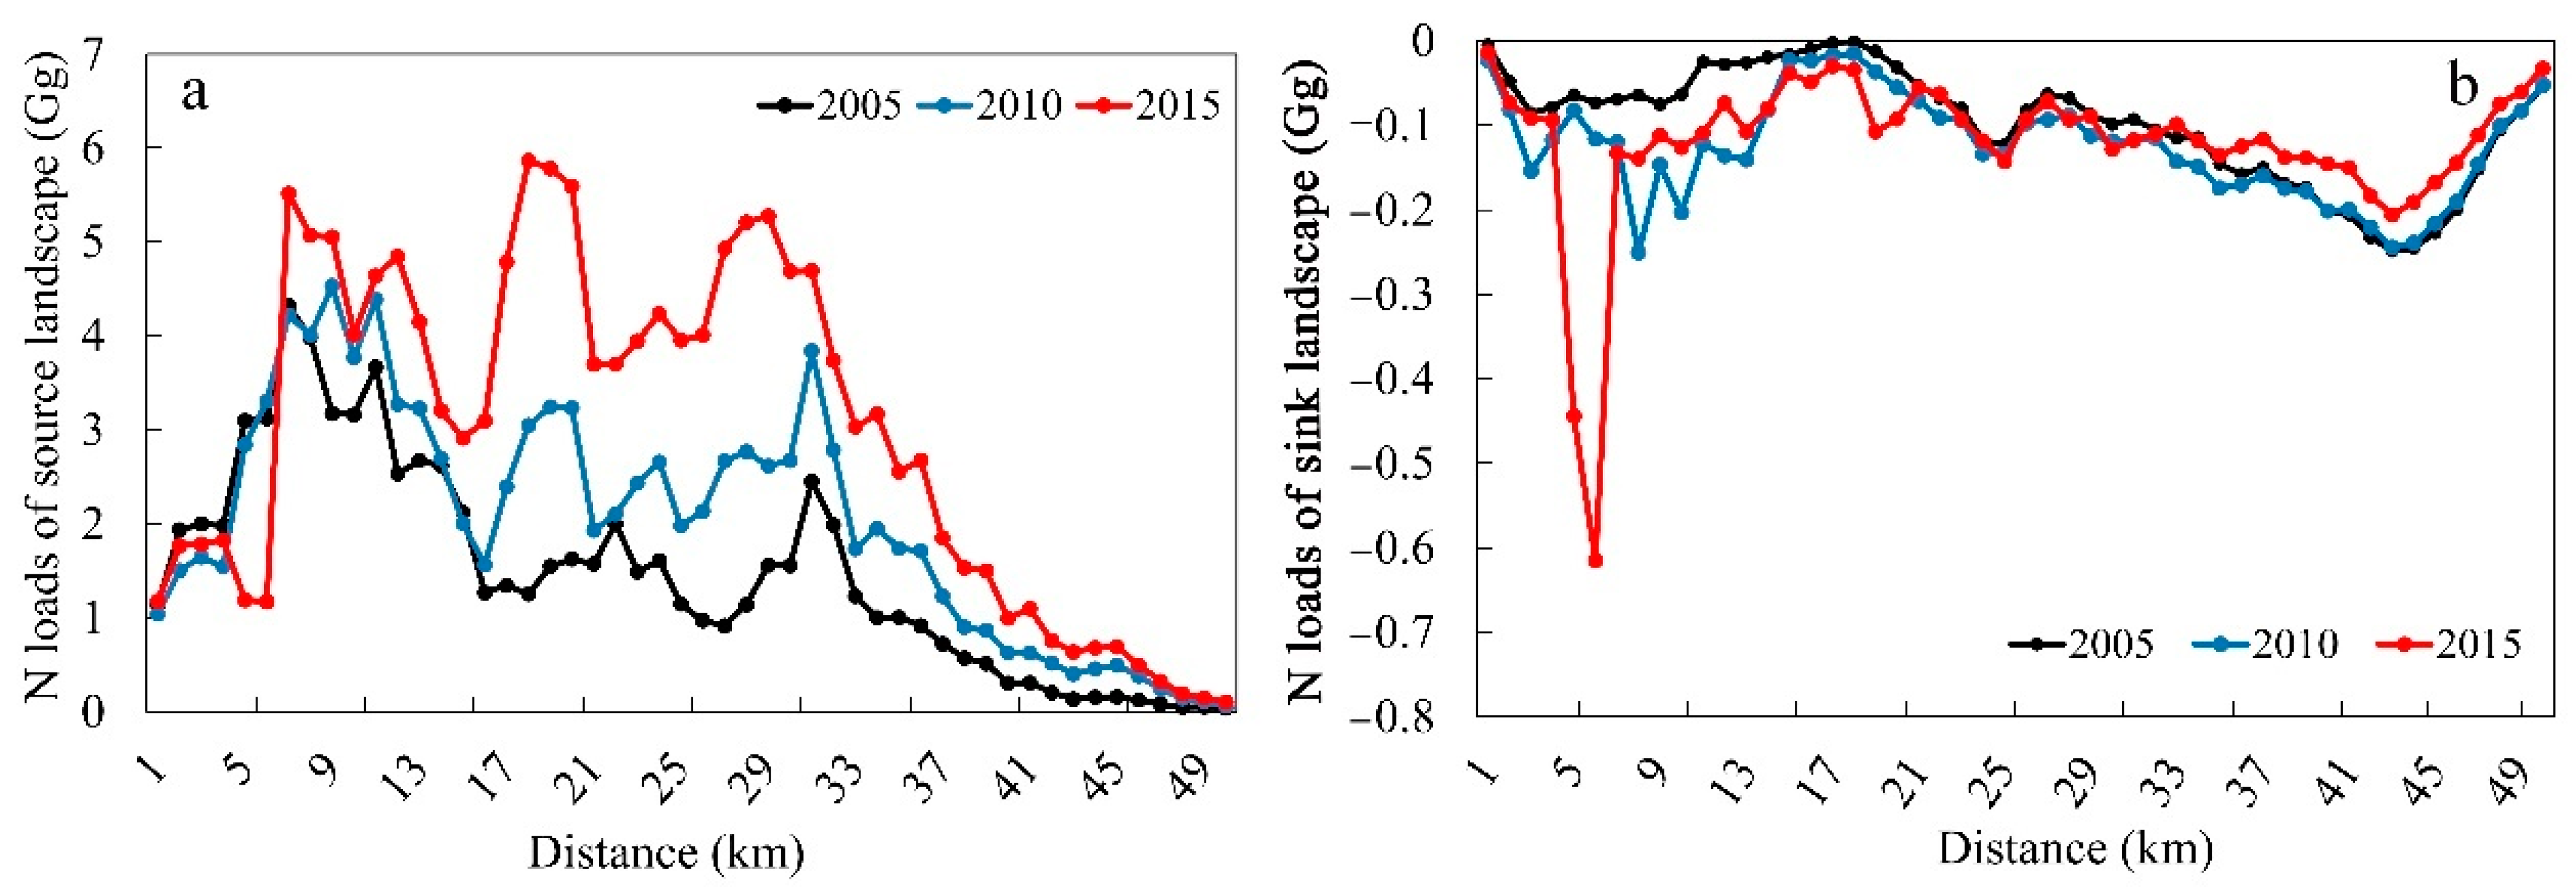
4.2.1. Change in N Intensity
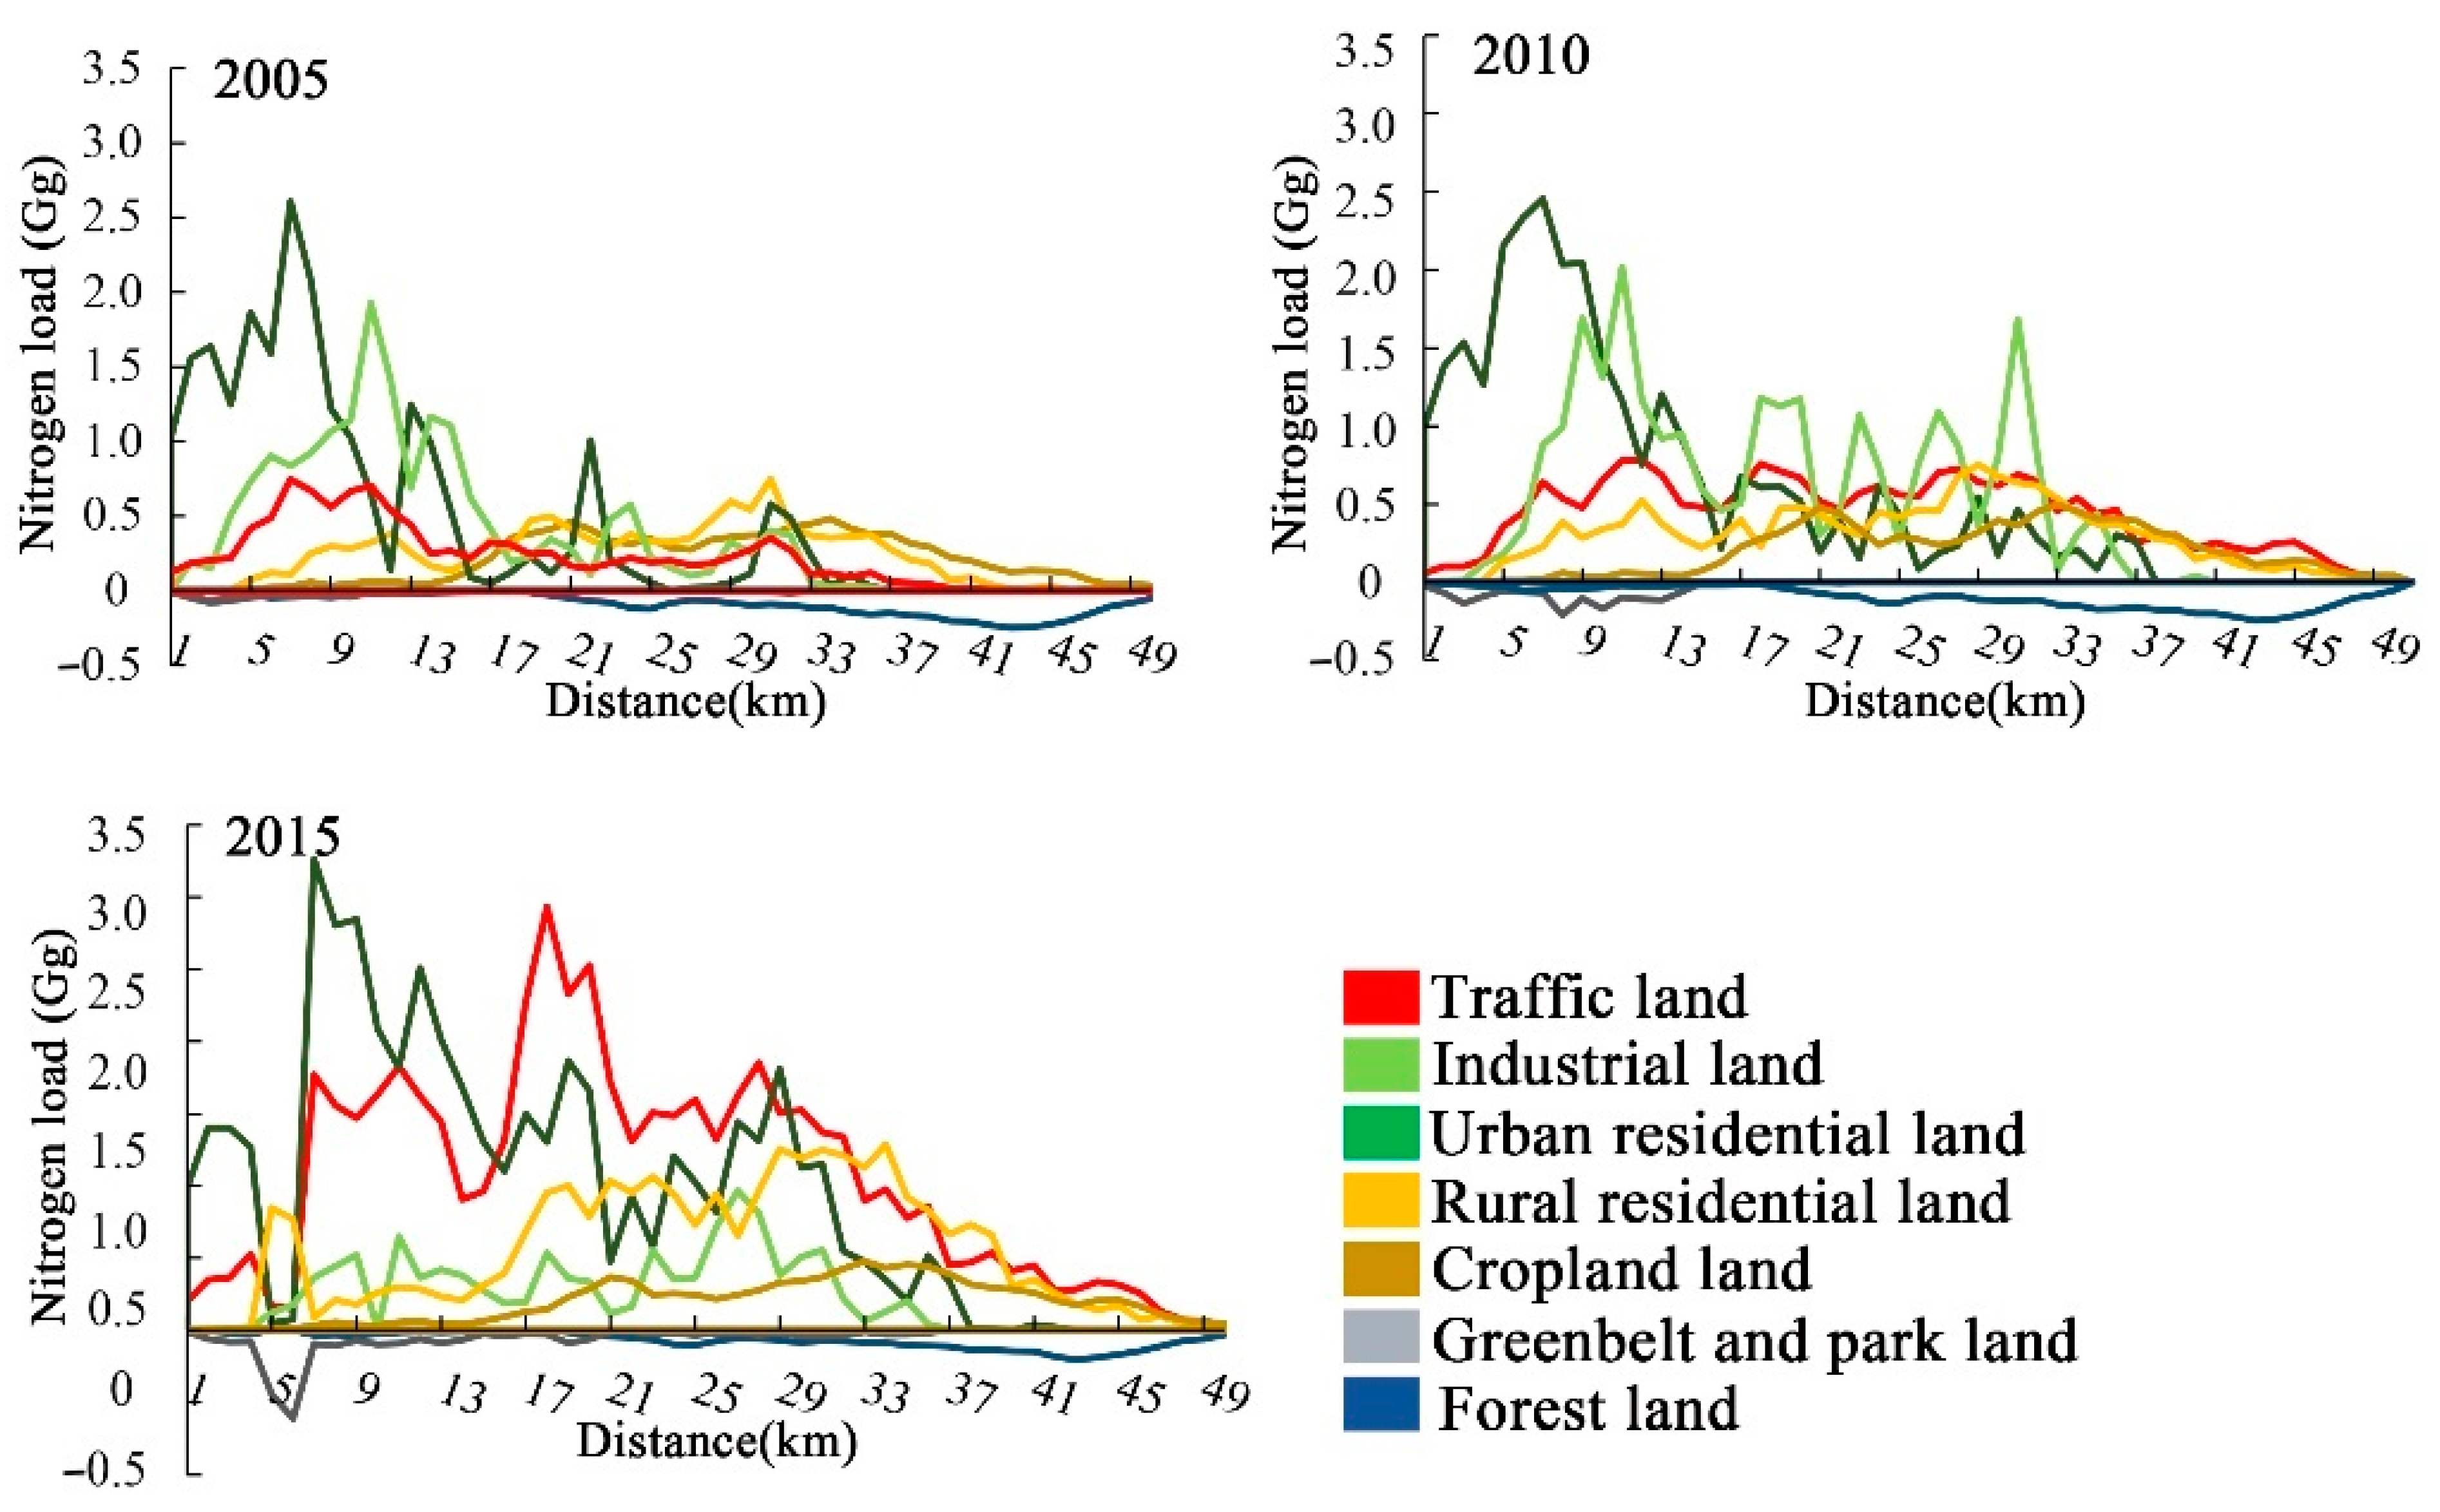
4.2.2. Spatio-Temporal Characteristics of N Loads
5. Discussion
5.1. A Novel Approach to Identifying N Source–Sink Landscapes
5.2. Spatial Gradient Characteristics of Source–Sink Landscapes and N Loads
5.3. Implications
6. Conclusions
7. Limitation
Supplementary Materials
Author Contributions
Funding
Institutional Review Board Statement
Informed Consent Statement
Acknowledgments
Conflicts of Interest
References
- Liu, X.L.; Wang, Y.; Li, Y. Riverine nitrogen export and its natural and anthropogenic determinants in a subtropical agricultural catchment. Agric Ecosyst. Environ. 2020, 301, 107021. [Google Scholar] [CrossRef]
- Li, X.; Nian, P.H.; Gui, R.Y. Nitrogen storage in China’s terrestrial ecosystems. Sci. Total Environ. 2020, 709, 136201. [Google Scholar]
- Grimm, N.B.; Faeth, S.H.; Golubiewski, N.E.; Redman, C.L.; Wu, J.; Bai, X.; Briggs, J.M. Global change and the ecology of cities. Science 2008, 319, 756–760. [Google Scholar] [CrossRef] [PubMed] [Green Version]
- Han, J.; Meng, X.; Zhou, X. A long-term analysis of urbanization process, landscape change, and carbon sources and sinks: A case study in China’s Yangtze River Delta region. J. Clean. Prod. 2017, 141, 1040–1050. [Google Scholar] [CrossRef]
- Seddon, J.; Smit, W.; Kheirbek, I. The urban nitrogen challenge. One Earth 2021, 4, 8–9. [Google Scholar] [CrossRef]
- Galloway, J.N.; Cowling, E.B. Reflections on 200 years of nitrogen, 20 years later. Ambio 2021, 50, 745–749. [Google Scholar] [CrossRef]
- Cui, S.; Shi, Y.; Groffman, P.M.; Schlesinger, W.H.; Zhu, Y.G. Centennial-scale analysis of the creation and fate of reactive nitrogen in China (1910–2010). Proc. Natl. Acad. Sci. USA 2013, 110, 2052–2057. [Google Scholar] [CrossRef] [Green Version]
- Bai, Z.; Zhao, H.; Velthof, G.L.; Oenema, O.; Chadwick, D.; Williams, J.R. Designing vulnerable zones of nitrogen and phosphorus transfers to control water pollution in China. Eniron. Sci. Technol. 2018, 52, 8987–8988. [Google Scholar] [CrossRef] [Green Version]
- Erisman, J.W.; Galloway, J.N.; Seitzinger, S.; Bleeker, A.; Dise, N.B.; Petrescu, A.R.; Leach, A.M.; de Vries, W. Consequences of human modification of the global nitrogen cycle. Philos. Trans. R. Soc. Lond. B Biol. Sci. 2013, 368, 0116. [Google Scholar] [CrossRef] [Green Version]
- Ahlstrom, H.; Cornell, S.E. Governance, polycentricity and the global nitrogen and phosphorus cycles. Environ. Sci. Policy 2018, 79, 54–65. [Google Scholar] [CrossRef] [Green Version]
- Chen, L.D.; Fu, B.J.; Zhao, W.W. Source-sink landscape theory and its ecological significance. Acta Ecol. Sin. 2016, 26, 1444–1449. (In Chinese) [Google Scholar] [CrossRef]
- Chen, L.; Tian, H.; Fu, B.; Zhao, X. Development of a new index for integrating landscape patterns with ecological processes at watershed scale. Chin. Geogr. Sci. 2009, 19, 37–45. [Google Scholar] [CrossRef] [Green Version]
- Wang, J.L.; Ni, J.P.; Chen, C.L.; Xie, D.T.; Shao, J.A.; Chen, F.X.; Lei, P. Source-sink landscape spatial characteristics and effect on non-point source pollution in a small catchment of the Three Gorge Reservoir Region. J. Mt. Sci. 2008, 15, 327–339. [Google Scholar] [CrossRef]
- Wang, R.; Wang, Y.; Sun, S. Discussing on “source-sink” landscape theory and phytoremediation for non-point source pollution control in China. Environ. Sci. Pollut. Res. 2020, 27, 44797–44806. [Google Scholar] [CrossRef]
- Li, D.; Tian, P.; Luo, H.; Luo, Y. Impacts of land use and land cover changes on regional climate in the Lhasa River basin, Tibetan Plateau. Sci. Total Environ. 2020, 742, 140570. [Google Scholar] [CrossRef]
- Chen, L.D.; Jie, F.B.; Ying, X.J.; Gong, J. Location-weighted landscape contrast index: A scale independent approach for landscape pattern evaluation based on “source-sink” ecological processes. Acta Ecol. Sin. 2003, 23, 2406–2413. (In Chinese) [Google Scholar]
- Canadell, J.G.; Quere, C.L.; Raupach, M.R.; Field, C.B.; Buitenhuis, E.T.; Ciais, P. Contributions to accelerating atmospheric CO2 growth from economic activity, carbon intensity, and efficiency of natural sinks. Proc. Natl. Acad. Sci. USA 2007, 104, 18866–18870. [Google Scholar] [CrossRef] [Green Version]
- Li, W.; Cao, Q.; Lang, K.; Wu, J. Linking potential heat source and sink to urban heat island: Heterogeneous effects of landscape pattern on land surface temperature. Sci. Total Environ. 2017, 586, 457–465. [Google Scholar] [CrossRef]
- Lal, K.; Kumar, D.; Kumar, A. Spatio-temporal landscape modeling of urban growth patterns in Dhanbad Urban Agglomeration, India using geoinformatics techniques. Egypt. J. Rem. Sens. Space Sci. 2017, 20, 91–102. [Google Scholar] [CrossRef]
- Zhao, W.W.; Jia, L.Z.; Stefani, D.; Chen, L.D.; Liu, Y. Source–Sink Landscape. Encyclopedia of Ecology; Elsevier: Amsterdam, The Netherlands, 2019; pp. 467–473. [Google Scholar]
- Zhang, X.; Zhang, Y.; Fath, B.D. Analysis of anthropogenic nitrogen and its influencing factors in Beijing. J. Clean. Prod. 2019, 244, 118780. [Google Scholar] [CrossRef]
- Gu, B.; Chang, J.; Ge, Y.; Ge, H.; Yuan, C.; Peng, C.; Jiang, H. Anthropogenic modification of the nitrogen cycling within the Greater Hangzhou Area system, China. Ecol. Appl. 2009, 19, 974–988. [Google Scholar] [CrossRef] [PubMed]
- Li, Y.M.; Cui, S.H.; Gao, B.; Tang, J.X. Modeling nitrogen flow in a coastal city—A case study of Xiamen in 2015. Sci. Total Environ. 2020, 735, 139294. [Google Scholar] [CrossRef] [PubMed]
- Pang, A.P.; Jiang, S.Y.; Yuan, Z.W. An approach to identify the spatiotemporal patterns of nitrogen flows in food production and consumption systems within watersheds. Sci. Total Environ. 2018, 624, 1004–1012. [Google Scholar] [CrossRef] [PubMed]
- Fan, X.W.; Worrall, F.; Baldini, M.L.; Burt, T.P. A spatial total nitrogen budget for Great Britain. Sci. Total Environ. 2020, 728, 138864. [Google Scholar] [CrossRef]
- Sobota, D.J.; Compton, J.E.; Mccrackin, M.L.; Singh, S. Cost of reactive nitrogen release from human activities to the environment in the United States. Environ. Res. Lett. 2015, 10, 025006. [Google Scholar] [CrossRef]
- Lin, T.; Gibson, V.; Cui, S.; Yu, C.P.; Zhu, Y.G. Managing urban nutrient biogeochemistry for sustainable urbanization. Environ. Pollut. 2014, 192, 244–250. [Google Scholar] [CrossRef]
- Shen, Z.; Hou, X.; Li, W.; Aini, G.; Chen, L.; Gong, Y. Impact of landscape pattern at multiple spatial scales on water quality: A case study in a typical urbanized watershed in China. Ecol. Indic. 2015, 48, 417–427. [Google Scholar] [CrossRef]
- Beck, S.M.; McHale, M.R. Beyond impervious: Urban landcover pattern various and implications for watershed management. Environ. Manag. 2016, 58, 15–30. [Google Scholar] [CrossRef]
- Sutton, M.A.; Howard, C.M.; Erisman, J.W. The European Union Nitrogen Assessment: Sources, Effects and Policy Perspectives; Cambridge University Press: Cambridge, UK, 2011; pp. 249–270. [Google Scholar]
- Chen, X.; Wang, Y.; Cai, Z. Effects of Land-Use and Land-Cover Change on Nitrogen Transport in Northern Taihu Basin, China during 1990–2017. Sustainability 2020, 12, 3895. [Google Scholar] [CrossRef]
- XSB (Xiamen Statistics Bureau); NBSC (National Bureau of Statistics of China). Xiamen Statistics Yearbook; China Statistics Press: Beijing, China, 2016.
- Liu, Y.S.; Wang, J.Y.; Long, H.L. Analysis of arable land loss and its impact on rural sustainability in Southern Jiangsu Province of China. J. Environ. Manag. 2010, 91, 646–653. [Google Scholar] [CrossRef]
- Fazal, S. Urban expansion and loss of agricultural land—A GIS based study of Saharanpur City, India. Environ. Urban 2016, 12, 133–149. [Google Scholar] [CrossRef]
- Hou, L.; Wu, F.Q.; Xie, X.L. The spatial characteristics and relationships between landscape pattern and ecosystem service value along an urban-rural gradient in Xi’an city, China. Ecol. Indic. 2020, 108, 105720. [Google Scholar] [CrossRef]
- Tegeder, M. Transporters involved in source to sink partitioning of amino acids and ureides: Opportunities for crop improvement. J. Exp. Bot. 2014, 65, 1865–1878. [Google Scholar] [CrossRef] [PubMed]
- Tegeder, M.; Masclaux, D.C. Source and sink mechanisms of nitrogen transport and use. New Phytol. 2018, 217, 35–53. [Google Scholar] [CrossRef] [Green Version]
- Fan, X.; Naz, M.; Fan, X.; Xuan, W.; Miller, A.J.; Xu, X. Plant nitrate transporters: From gene function to application. J. Exp. Bot. 2017, 68, 2463–2475. [Google Scholar] [CrossRef]
- Li, Y.M.; Gao, B.; Tang, J.X.; Huang, W.; Cui, S.H.; Huang, Y.F. The evolution characteristics of nitrogen flow and water environment load in Xiamen. Acta Sci. Circumstantiae 2019, 39, 335–348. (In Chinese) [Google Scholar]
- Gu, B.J.; Ju, X.T.; Chang, J.; Ge, Y.; Vitousek, P.M. Integrated reactive nitrogen budgets and future trends in China. Proc. Natl. Acad. Sci. USA 2015, 112, 8792–8797. [Google Scholar] [CrossRef] [Green Version]
- Luck, M.; Wu, J. A gradient analysis of urban landscape pattern: A case study from the Phoenix metropolitan region, Arizona, USA. Landsc. Ecol. 2002, 17, 327–339. [Google Scholar] [CrossRef]
- Jim, C.Y.; Chen, S. Comprehensive greenspace planning based on landscape ecology principles in compact Nanjing city, China. Landsc. Urban Plan 2003, 65, 95–116. [Google Scholar] [CrossRef]
- Tian, G.; Wu, J.; Yang, Z. Spatial pattern of urban functions in the Beijing metropolitan region. Habitat Int. 2010, 34, 249–255. [Google Scholar] [CrossRef]
- Sun, R.; Wei, X.; Chen, L. A landscape connectivity model to quantify contributions of heat sources and sinks in urban regions. Landsc. Urban Plan. 2018, 178, 43–50. [Google Scholar] [CrossRef]
- Wz, A.; Bo, H.A.; Dong, L.B. Effects of land use and transportation on carbon sources and carbon sinks: A case study in Shenzhen, China. Landsc. Urban Plan. 2014, 122, 175–185. [Google Scholar]
- Sun, R.H.; Cheng, X.; Chen, L.D. A precipitation-weighted landscape structure model to predict potential pollution contributions at watershed scales. Landsc. Ecol. 2018, 33, 1603–1616. [Google Scholar] [CrossRef]
- Pu, J.W.; Zhao, X.Q.; Gu, Z.X.; Lu, F.F.; Zheng, T.T.; Gao, X.Y.; Chen, J.X.; Yi, Q. Relationship between landscape pattern changes and water quality in the Qilu Lake Basin of Yunnan Plateau. J. Hydroecol. 2018, 39, 13–21. [Google Scholar]
- Cheng, X.; Chen, L.D.; Sun, R.H. Modeling the non-point source pollution risks by combing pollutant sources, precipitation, and landscape structure. Environ. Sci. Pollut. Res. 2019, 26, 11856–11863. [Google Scholar] [CrossRef] [PubMed]
- Li, Y.M.; Cui, S.H.; Tang, J.X. Changes in land use and nitrogen load in Xiamen city. Acta Sci. Cirumstantiae 2020, 40, 353–360. (In Chinese) [Google Scholar]
- Gu, B.; Dong, X.; Peng, C.H.; Luo, W.D. The long-term impact of urbanization on nitrogen patterns and dynamics in Shanghai, China. Environ. Pollut. 2012, 171, 30–37. [Google Scholar] [CrossRef] [Green Version]
- Chen, N.M.; Dong, H.J.; Lu, T. Tracking nitrogen pollutants in Xiamen coastal river via multiple techniques and strategy of water quality management. Acta Sci. Circumstantiae 2017, 37, 2031–2039. (In Chinese) [Google Scholar]
- Huang, W.; Gao, B.; Huang, Y.F.; Zhang, Z.L.; Xu, S.; Xu, L.L. Transforming nitrogen management of urban food system in a food-sink city. J. Environ. Manag. 2019, 249, 109180. [Google Scholar] [CrossRef]
- Ma, L.; Guo, J.; Velthof, G.L.; Li, Y.; Chen, Q.; Ma, W. Impacts of urban expansion on nitrogen and phosphorus flows in the food system of Beijing from 1978 to 2008. Glob. Environ. Chang. 2014, 28, 192–204. [Google Scholar] [CrossRef]
- Bereitschaft, B.; Debbage, K. Urban form, air pollution, and CO2 emissions in large US metropolitan areas. Prof. Geogr. 2013, 65, 612–635. [Google Scholar] [CrossRef]
- Xu, K.; Mo, L.C.; Zhang, Z.M.; Zhang, M.X. Water quantity and quality changes from forested riparian buffer in Beijing. Environ. Sci. Pollut Res. 2019, 26, 29041–29051. [Google Scholar] [CrossRef] [PubMed]
- Salon, D.; Boarnet, M.C.; Handy, S.; Spears, S.; Tal, G. How do local actions affect VMT? A critical review of the empirical evidence. Transp. Environ. 2012, 17, 495–508. [Google Scholar] [CrossRef]
- Mao, Y.; Zhang, H.; Tang, W. Net anthropogenic nitrogen and phosphorus inputs in Pearl River Delta region (2008–2016). J. Environ. Manag. 2021, 282, 111952. [Google Scholar] [CrossRef]
- Kändler, M.; Blechinger, K.; Seidler, C.; Pavlů, V.; Šanda, M.; Dostál, T.; Krása, J.; Vitvar, T.; Štich, M. Impact of land use on the water quality in the upper Nisa catchment in the Czech Republic and in Germany. Sci. Total Environ. 2017, 586, 1316–1325. [Google Scholar] [CrossRef]
- Lin, T.; Sun, C.G.; Li, X.H.; Zhao, Q.J. Spatial pattern of urban functional landscapes along an urban–rural gradient: A case study in Xiamen City, China. Int. J. Appl. Earth Obs. Geoinf. 2016, 46, 22–30. [Google Scholar] [CrossRef]
- Ai, B.; Ma, C.; Zhao, J.; Zhang, R. The impact of rapid urban expansion on coastal mangroves: A case study in Guangdong Province, China. Front. Earth Sci. 2019, 14, 1–13. [Google Scholar] [CrossRef]
- Cai, E.; Liu, Y.; Li, J.; Chen, W. Spatiotemporal characteristics of urban-rural construction land transition and rural-urban migrants in rapid-urbanization areas of central China. J. Urban Plan Dev. 2020, 146, 05019023.1–05019023.10. [Google Scholar] [CrossRef]
- Zhang, W.; Li, H.; Li, Y. Spatio-temporal dynamics of nitrogen and phosphorus input budgets in a global hotspot of anthropogenic inputs. Sci. Total Environ. 2018, 656, 1108–1120. [Google Scholar] [CrossRef]
- Zhang, Z.; Deng, C.; Dong, L. Nitrogen flow in the food production and consumption system within the Yangtze River Delta city cluster: Influences of cropland and urbanization. Sci. Total Environ. 2022, 824, 153861. [Google Scholar] [CrossRef]
- XSB (Xiamen Statistics Bureau); NBSC (National Bureau of Statistics of China). Xiamen Statistics Yearbook; China Statistics Press: Beijing, China, 2006.
- XSB (Xiamen Statistics Bureau); NBSC (National Bureau of Statistics of China). Xiamen Statistics Yearbook; China Statistics Press: Beijing, China, 2011.
- Ti, C.; Pan, J.; Xia, Y.; Yan, X. A nitrogen budget of mainland China with spatial and temporal variation. Biogeochemistry 2012, 108, 381–394. [Google Scholar] [CrossRef]
- Yan, W.; Yin, C.; Zhang, S. Nutrient budgets and biogeochemistry in an experimental agricultural watershed in Southeastern China. Biogeochemistry 1999, 45, 1–19. [Google Scholar] [CrossRef] [Green Version]
- Chen, N.; Hong, H.; Huang, Q.; Wu, J. Atmospheric nitrogen deposition and its long-term dynamics in a southeast China coastal area. J. Environ. Manag. 2011, 92, 1663–1667. [Google Scholar] [CrossRef] [PubMed]
- Zhou, T.; Wang, Y.; Wang, F.; Feng, Y. Analysis of the nitrogen footprint of agriculture in Guangdong. China Environ. Sci. 2014, 34, 2430–2438. [Google Scholar]
- Gao, L.W. Study on Evaluation of Nitrogen Nutrient Flow in Food Chain—A Case Study of Huang Hai Region; Hebei Agriculture University: Baoding, China, 2009. (In Chinese) [Google Scholar]
- Ma, L.; Velthof, G.L.; Wang, F.H.; Qin, W.; Zhang, W.F.; Zhang, F.S.; Oenema, C. Nitrogen and phosphorus use efficiencies and losses in the food chain in China at reginal scales in 1980 and 2005. Sci. Total Environ. 2012, 434, 51–61. [Google Scholar] [CrossRef]
- Zheng, X.; Han, S.; Huang, Y.; Wang, Y.; Wang, M. Re-quantifying the emission factors based on field measurements and estimating the direct N2O emission from Chinese croplands. Glob. Biogeochem. Cycle 2014, 18, GB2018. [Google Scholar] [CrossRef]
- Intergovernmental Panel on Climate Change. IPCC Fourth Assessment Report: Climate Change 2007(AR4). 2007. Available online: https://www.ipcc.ch/report/ar4/syr/ (accessed on 6 August 2022).
- Schlesinger, W.H. On the fate of anthropogenic nitrogen. Proc. Natl. Acad. Sci. USA 2008, 106, 203–208. [Google Scholar] [CrossRef] [Green Version]
- Moller, D.; Schieferdecker, H. Ammonia emission and deposition of NH4 in the G.D.R. Atmos. Environ. 1989, 23, 1187–1193. [Google Scholar] [CrossRef]
- Cai, B.F. City’s Greenhouse Gas (GHG) Emission Inventory Research; Chemical Industry Press: Beijing, China, 2009. (In Chinese) [Google Scholar]
- Ma, L.; Ma, W.Q.; Velthof, G.L.; Wang, F.H.; Qin, W.; Zhang, F.S.; Oenema, O. Modeling nutrient flows in the food chain of China. J. Environ. Qual. 2010, 39, 1279–1289. [Google Scholar] [CrossRef]
- Min, J.; Shi, W.M. Nitrogen discharge pathways in vegetable production as non-point sources of pollution and measures to control it. Sci. Total Environ. 2018, 613, 123–130. [Google Scholar] [CrossRef]
- Liu, Y.M. Terrestrial nitrogen cycles. Land Ecol. Transl. 1984, 4, 32–41. [Google Scholar]
- Xin, J.B.; Zhang, F.S.; You, X.L. Nitrogen balance of natural forest ecosystem in China. Acta Ecol. Sin. 2007, 27, 3257–3267. (In Chinese) [Google Scholar]
- Townsend-Small, A.; Pataki, D.E.; Czimczik, C.I.; Tyler, S.C. Nitrous oxide emissions and isotopic composition in urban and agricultural systems in southern California. J. Geophys. Res. 2011, 116, G01013. [Google Scholar] [CrossRef]
- Zhang, R.L. Research advances on fertilizer application to lawn. Chin. J. Trop. Agric. 2002, 22, 77–81. [Google Scholar]
- Research Report on Market Investigation and Development Prospect of Chinese Pet Industry. 2014–2019. Available online: http://www.cninfo360.com/ (accessed on 6 August 2022).
- Xing, G.X.; Zhu, Z.L. An assessment of N loss from agricultural fields to the environment in China. Nutr. Cycl. Agroecosyst. 2000, 57, 67–73. [Google Scholar] [CrossRef]
- Ren, Y. Study on Comprehensive Evaluation and Dynamic Optimization of Wastewater Treatment System in Xiamen; Xiamen University: Xiamen, China, 2015. (In Chinese) [Google Scholar]
- Xian, C.; Ouyang, Z.; Lu, F.; Xiao, Y.; Li, Y. Quantitative evaluation of reactive nitrogen emissions with urbanization: A case study in Beijing megacity, China. Environ. Sci. Pollut. Res. 2016, 23, 17689–17701. [Google Scholar] [CrossRef]
- Shi, Y.L.; Cui, S.H.; Xu, S.; Lin, J.Y.; Huang, W. Nitrogen oxide emission in energy consumption in China from a consumption-based perspective. Acta Sci. Circumstantiae 2014, 34, 2684–2692. (In Chinese) [Google Scholar]
- CESB. China Energy Statistics Yearbook; China Energy Statistics Bureau: Beijing, China, 2021.
- Zhang, Q.H.; Gao, B.; Huang, W.; Yan, X.M.; Cui, S.H. Analysis of Anthropogenic Reactive Nitrogen Emissions and Its Features on Prefecture-level City in Fujian Province. Environ. Sci. 2017, 38, 3610–3619. (In Chinese) [Google Scholar]


| Year | Forest | Cropland | Urban Residential Land | Rural Residential Land | Industrial Land | Greenbelts and Parks | Traffic Land |
|---|---|---|---|---|---|---|---|
| 2005 | −70.0 | 241.04 | 5656.8 | 1050.87 | 5985.19 | −455.94 | 1627.92 |
| 2010 | −69.9 | 284.51 | 4258.22 | 1189.95 | 3654.65 | −1608.35 | 1865.26 |
| 2015 | −69.2 | 216.28 | 4583.51 | 2769.79 | 1313.98 | −1612.14 | 3960.05 |
Publisher’s Note: MDPI stays neutral with regard to jurisdictional claims in published maps and institutional affiliations. |
© 2022 by the authors. Licensee MDPI, Basel, Switzerland. This article is an open access article distributed under the terms and conditions of the Creative Commons Attribution (CC BY) license (https://creativecommons.org/licenses/by/4.0/).
Share and Cite
Li, Y.; Tang, J.; Cui, S. Dynamic Changes of Nitrogen Loads in Source–Sink Landscapes under Urbanization. Land 2022, 11, 1371. https://doi.org/10.3390/land11081371
Li Y, Tang J, Cui S. Dynamic Changes of Nitrogen Loads in Source–Sink Landscapes under Urbanization. Land. 2022; 11(8):1371. https://doi.org/10.3390/land11081371
Chicago/Turabian StyleLi, Yanmin, Jianxiong Tang, and Shenghui Cui. 2022. "Dynamic Changes of Nitrogen Loads in Source–Sink Landscapes under Urbanization" Land 11, no. 8: 1371. https://doi.org/10.3390/land11081371