Article

Spatial-Temporal Effect of Sea–Land Gradient on Land Use Change in Coastal Zone: A Case Study of Dalian City

School of Geography, Liaoning Normal University, Dalian 116029, China
*
Author to whom correspondence should be addressed.
Land 2022, 11(8), 1302; https://doi.org/10.3390/land11081302
Submission received: 2 July 2022 / Revised: 10 August 2022 / Accepted: 10 August 2022 / Published: 12 August 2022
(This article belongs to the Special Issue Where Land Meets Sea: Terrestrial Influences on Coastal Environments)

Abstract

:
Geographically, the coastal zone is a unit where the marine system and the terrestrial system intersect and have the closest relationship with human survival and development. The study of coastal-zone land use change is therefore of great significance in promoting the sustainable development of coastal areas in terms of resources and environment. However, the relationship between urban land use change and distance from the coastline is indeterminate in current research. This paper aims to assess the spatial and temporal characteristics of coastal land use change with the sea–land gradient, as well as to reveal the role of coastal ecosystems. The indices of the dynamic index, net transfer matrix, and aggregation index were measured in different coastal buffer zones quantitatively. A case study of Dalian between 2000 and 2015 indicates that Dalian’s urban construction land is distributed among the coastal zones with a high total and fast growth rate. The land use conversion direction varies significantly between different buffer zones, with [0, 2.5] km tilted mainly towards urban types and [10, Max] km tilted mainly towards rural areas. The aggregation of land use structure in Dalian fluctuated and increased year by year. As the distance from the coastline gets closer, land use is going to get more diverse.

1. Introduction

Land use and land cover change (LULCC) refers to changes in land use on the Earth’s surface caused by human activities [1,2]. The LULCC driving forces exist mainly in natural and social systems. The natural systems driving factors are relatively stable over the long term, whereas the human driving factors of social systems are relatively dynamic [3]. It is important to maintain and improve the regional ecological balance and to achieve sustainable development and use of land resources [4]. Land use and land cover change has become an active field of research at home and abroad in recent years, and has become the key to many different application fields, such as ecosystem services, soil erosion, urban expansion, and water quality changes [5,6,7,8,9,10,11,12,13,14,15,16,17].
The coastal zone is a zone where the Earth’s lithosphere, hydrosphere, atmosphere, and biosphere intermingle; where the effects of various factors are frequent; where material and energy exchange are active; and where changes are extremely sensitive [18]. Due to the combined effects of climate change and human activities, the coastal zone ecosystems and natural environment are extremely fragile, showing that the region is highly dynamic, complex, and diverse [19]. China has a coastline as long as 18,000 km. The coastal areas are extremely sensitive to change. It is characterized by high productivity, high economic value, and relatively good resource advantages, which have an important impact on the development of coastal cities. Therefore, the study of land use changes in the coastal zone is of great significance for understanding human activities and sea–land relations, coordinating land use in coastal zones, and sustainable development.
In addition, the coastal zone, as a border zone between land and sea, is rich in productive resources. Due to the high intensity of human activity and modification of the coastal zone, the coastal-zone land use type and the geology and conditions (topography, geomorphology, soils, policies, population, economy, etc.) in which it is located are constantly changing [20]. Specific knowledge about the characteristics of coastal land use along the sea–land direction helps to better understand the spatial heterogeneity of coastal land use, which could offer scientific support for rational land management and the sustainable development of the coastal zone [21]. At present, the research on the coastal zone is relatively extensive, but it mainly focuses on the evaluation of the regional ecological service value using the coastal zone and LULCC [22,23,24,25], and the analysis of the land use change in the coastal area [26,27,28,29,30]. It is worth noting that current studies on land use and land cover change in coastal zones usually focus on large-scale areas, and there are some shortcomings in the discussion of the scale effects of land use and land cover change under different distance conditions from the coastline. To address this issue, this paper introduces the concept of the sea–land gradient. The sea–land gradient refers to an independent environmental system characterized by sea–land transition [31]; furthermore, the study of sea–land gradient changes are of great importance to coastal areas. Sea–land gradients are generally used to analyze patterns of ecological conditions in coastal areas [31], land use change [32,33,34,35], and the value of ecosystem services [22]. It is also used to analyze patterns of ecological status, land use change, and the value of ecosystem services in coastal areas.
As the largest port city in Northeast China, Dalian has convenient access to land and sea, and has the geographical advantage of being near the sea. With the strategic deployment of the “One Belt, One Road” [3,36] and the revitalization of the old industrial bases in Northeast China [37], there has been a significant impact on the land use and land cover change in Dalian. Based on Landsat images from 2000, 2005, 2010, and 2015, this research uses Dalian as the study region and extracts land use data for four years. At the same time, the sea–land gradient is built by establishing buffer zones at various distances inland from the coastline to investigate the spatial and temporal changes in the amount, distribution, and degree of convergence of land use and land cover with time and distance. The spatial distribution pattern of land use was analyzed based on the county-level administrative units in Dalian, which provides a scientific basis for sustainable land use in the coastal zone of Dalian, and also provides a reference for regional land use planning and urban development planning decision-making.

2. Materials and Methods
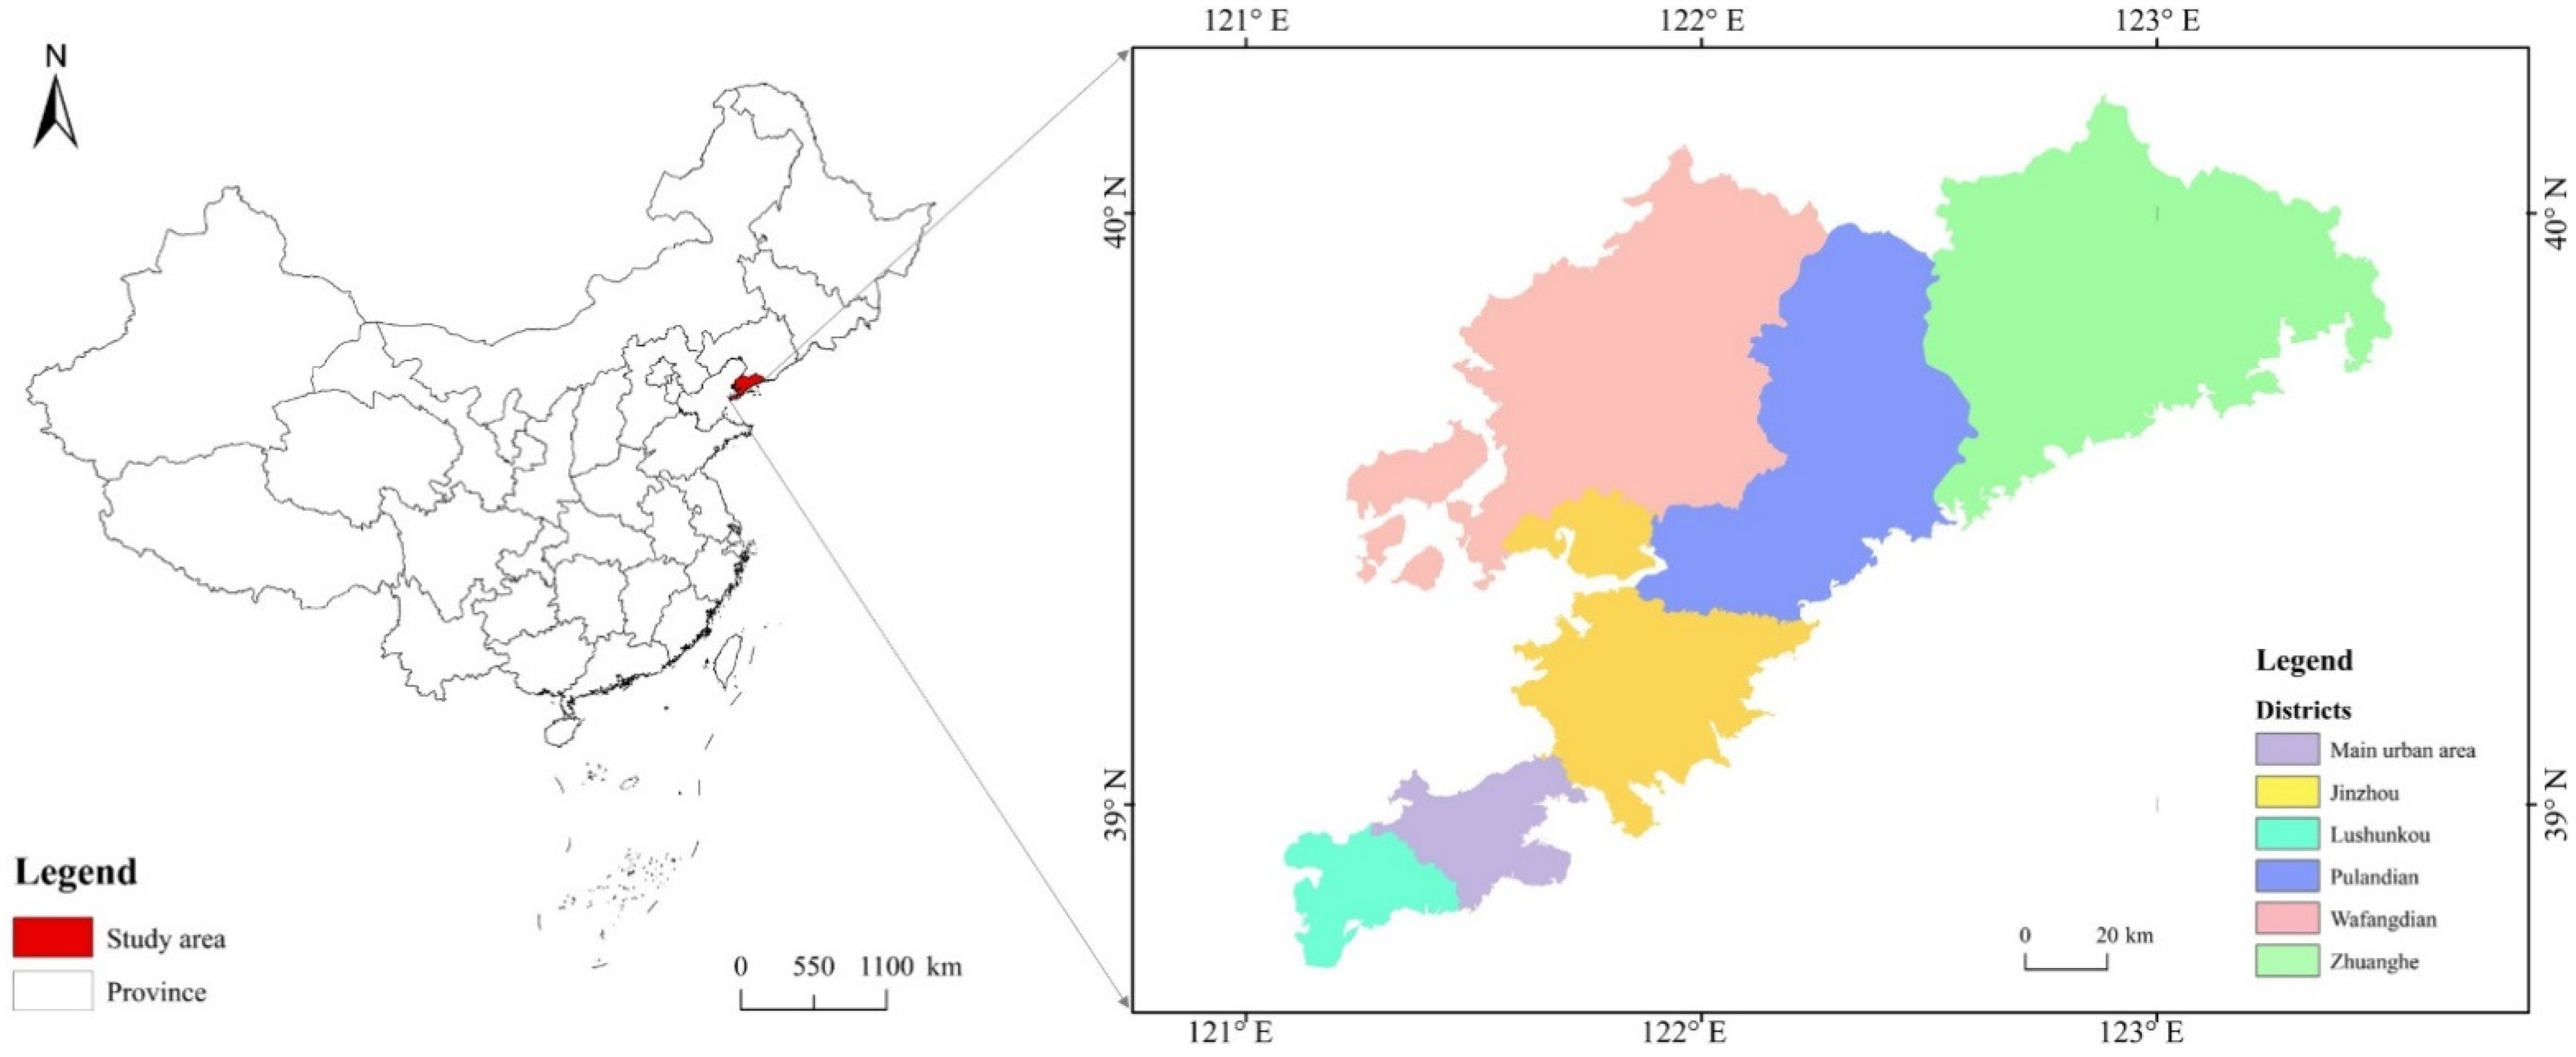
2.1. Study Area

Dalian is located on the southernmost tip of the Liaodong Peninsula (120°58′–123°31′ E, 38°43′–40°10′ N), on the shores of the Yellow Sea in Northeast China (Figure 1). The topography is high in the north and low in the south and wide in the north and narrow in the south, with many hills and mountains and few plains and lowlands. Furthermore, the altitude of the Dalian Plain is 20–60 m above sea level. The highest mountain is located in Zhuanghe City, with an altitude of 1130.7 m. The total area of Dalian is approximately 12,574 km2. The total area of the city is approximately 550.27 km2. Dalian had a total registered population of 5,936,000 people by the end of 2015, with an urban population of 3,049,000 people and a built-up area of 396 km2 [38]. This paper divides the land area of Dalian into the main urban area (including Zhongshan District, Xigang District, Shahekou District, and Ganjingzi District), Jinzhou District, Lushunkou District, Pulandian District, Wafangdian City, and Zhuanghe City, and presents the statistics separately to analyze the spatial and temporal effects of the sea–land gradient on coastal land use changes.

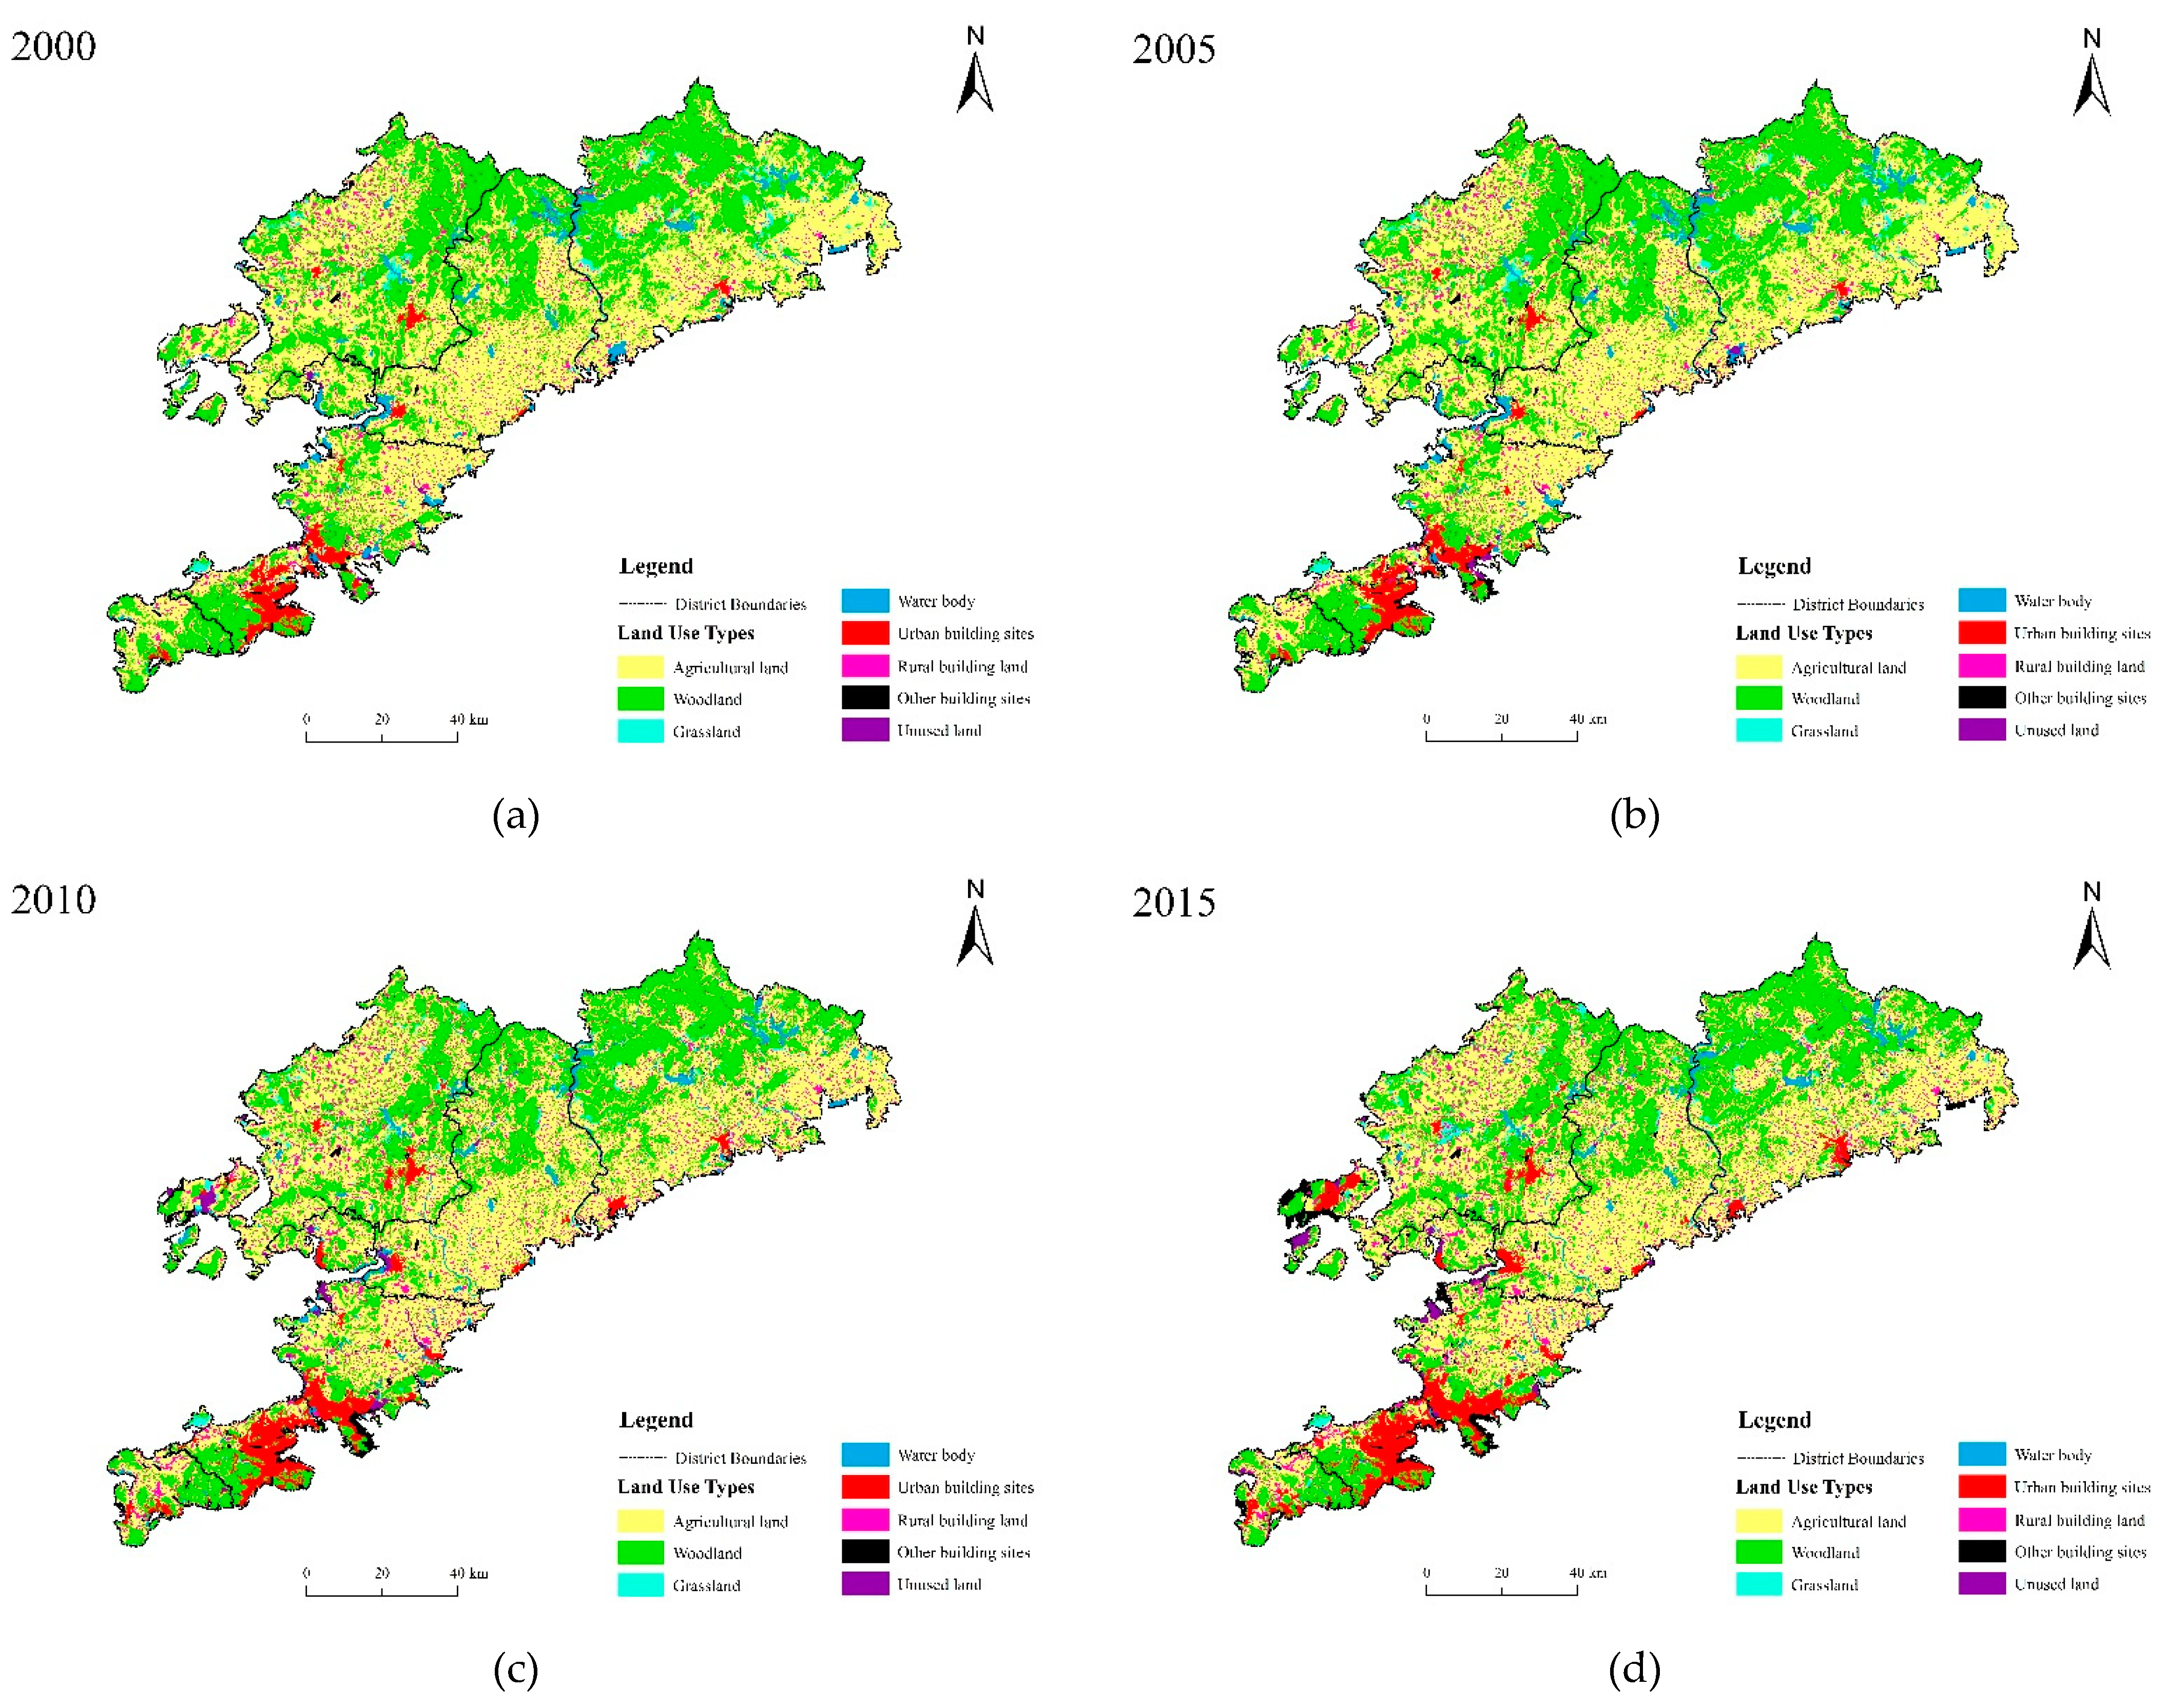
2.2. Selection of Data Period

National policies play a special role in influencing land use and land cover changes. At the beginning of the 21st century, China proposed the “Northeast Revitalization” [37] and issued the “Opinions on the Implementation and Management of Land Use Planning” [39]. Then, in 2013, China proposed the “One Belt, One Road” initiative [3,36]. Dalian is located in Northeast China and has the longest coastline in China. Policies have an impact on local land use change and are one of the main drivers of land use change, directly or indirectly influencing the land type and land use pattern change from top to bottom. The implementation of national policies and strategies between 2000 and 2015 has had a significant impact on land use in Dalian. In addition, since the land use changes in Dalian from 2015 to 2020 are not more obvious than those from 2010 to 2015, the data period of this paper is focused on 2000 to 2015.

2.3. Data Sources

To study the land use and land cover changes in the coastal zone of Dalian City over different periods, Landsat remote sensing images of four periods—namely 2000, 2005, 2010, and 2015—were selected in this paper (Table 1). After geometric correction, radiometric calibration, atmospheric correction, and image enhancement (standard false-color synthesis using near-infrared, red, and green light bands) and reclassification, the remote sensing images of the above four periods were finally classified using the supervised classification method. According to the national standard of Land Use Status Classification (GB/T21010-2017) [40] and concerning existing relevant studies, the land use types were classified into agricultural land, woodland, grassland, water bodies, construction land, and unused land, among which construction land includes urban construction land, villages, and other construction lands (Table 2).
To ensure the accuracy of the land use classification in the remote sensing image interpretation, the data after supervised classification was checked and corrected by Google Earth and then corrected again with reference to the data from the Second China Land Use Survey [41] combined with experiential knowledge [42,43,44]. The final land use and land cover type classification results for Dalian from 2000 to 2015 are shown in Figure 2.

2.4. Methods

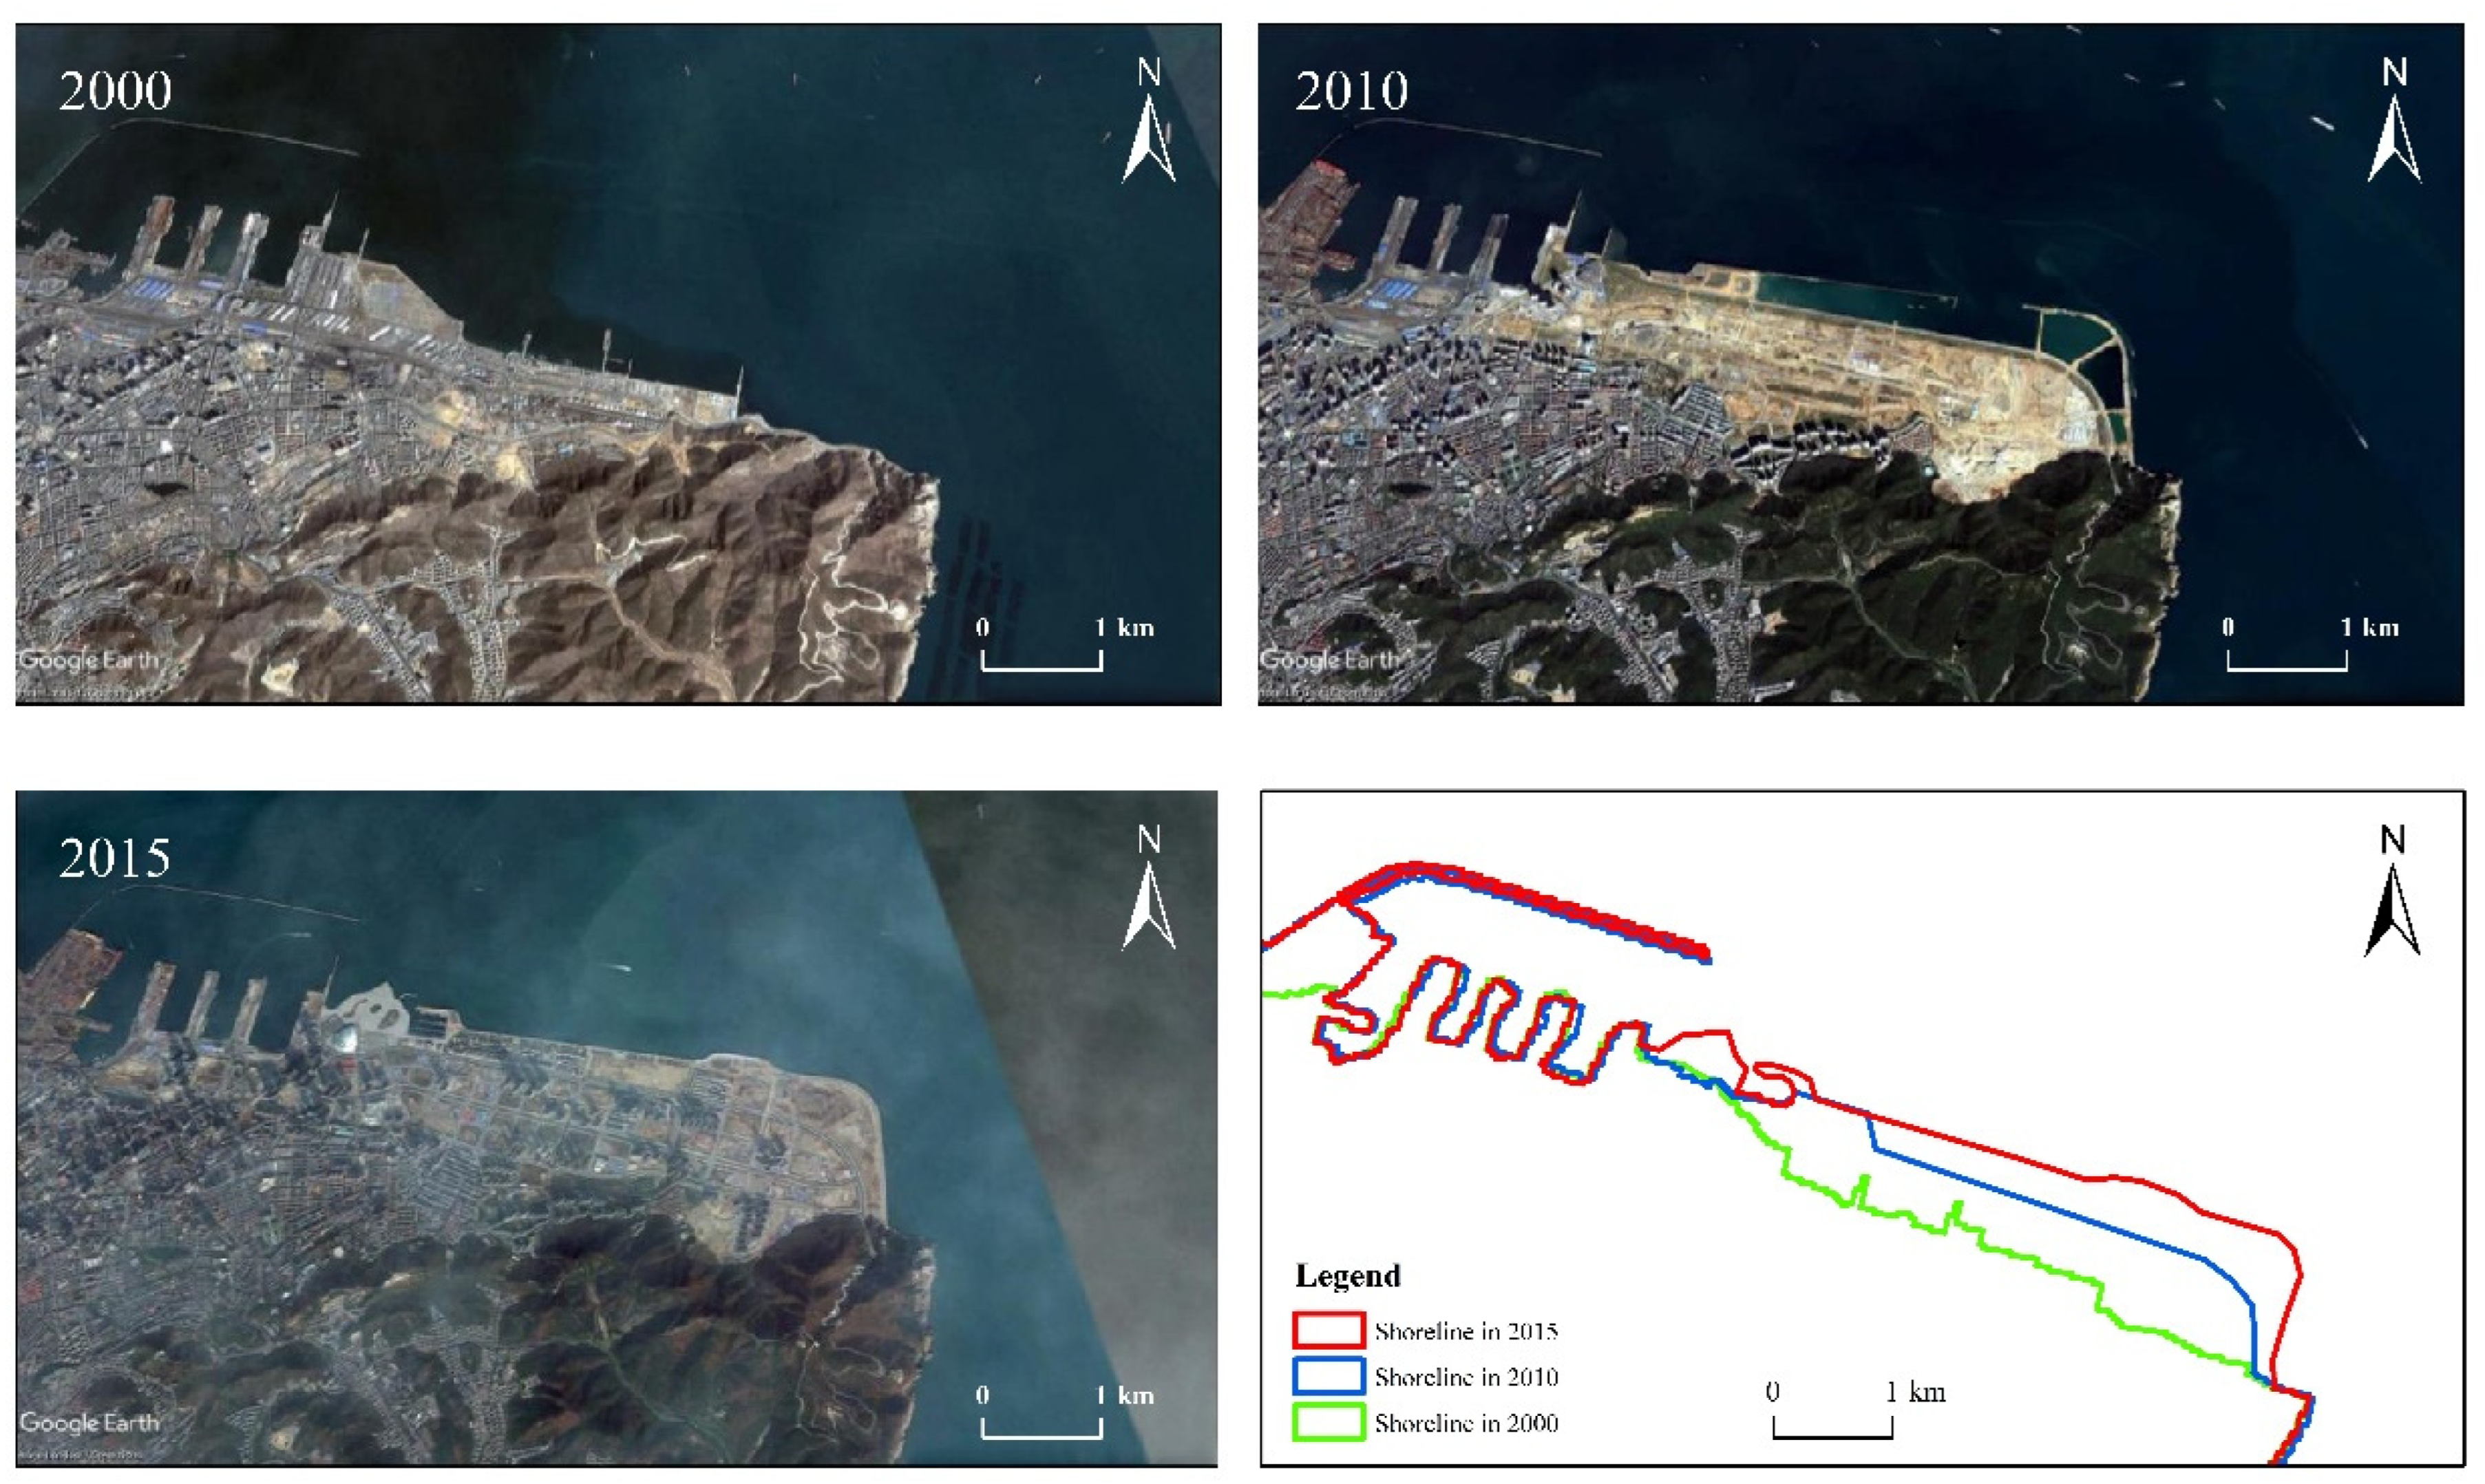
2.4.1. Extracting Coastline

The current coastline is used as the boundary of the study area and the coastlines for the years 2000, 2010, and 2015 were extracted from the land use classification (Figure 3). Since 2000, the coastlines have varied and expanded toward the sea due to natural factors and human activities, and some of the sea areas have been converted into land use. The baseline points of the coastline in this paper are selected from the survey results of the Dalian coastline in 2015 [45] and used as the reference coastline to reflect the changes in land use.

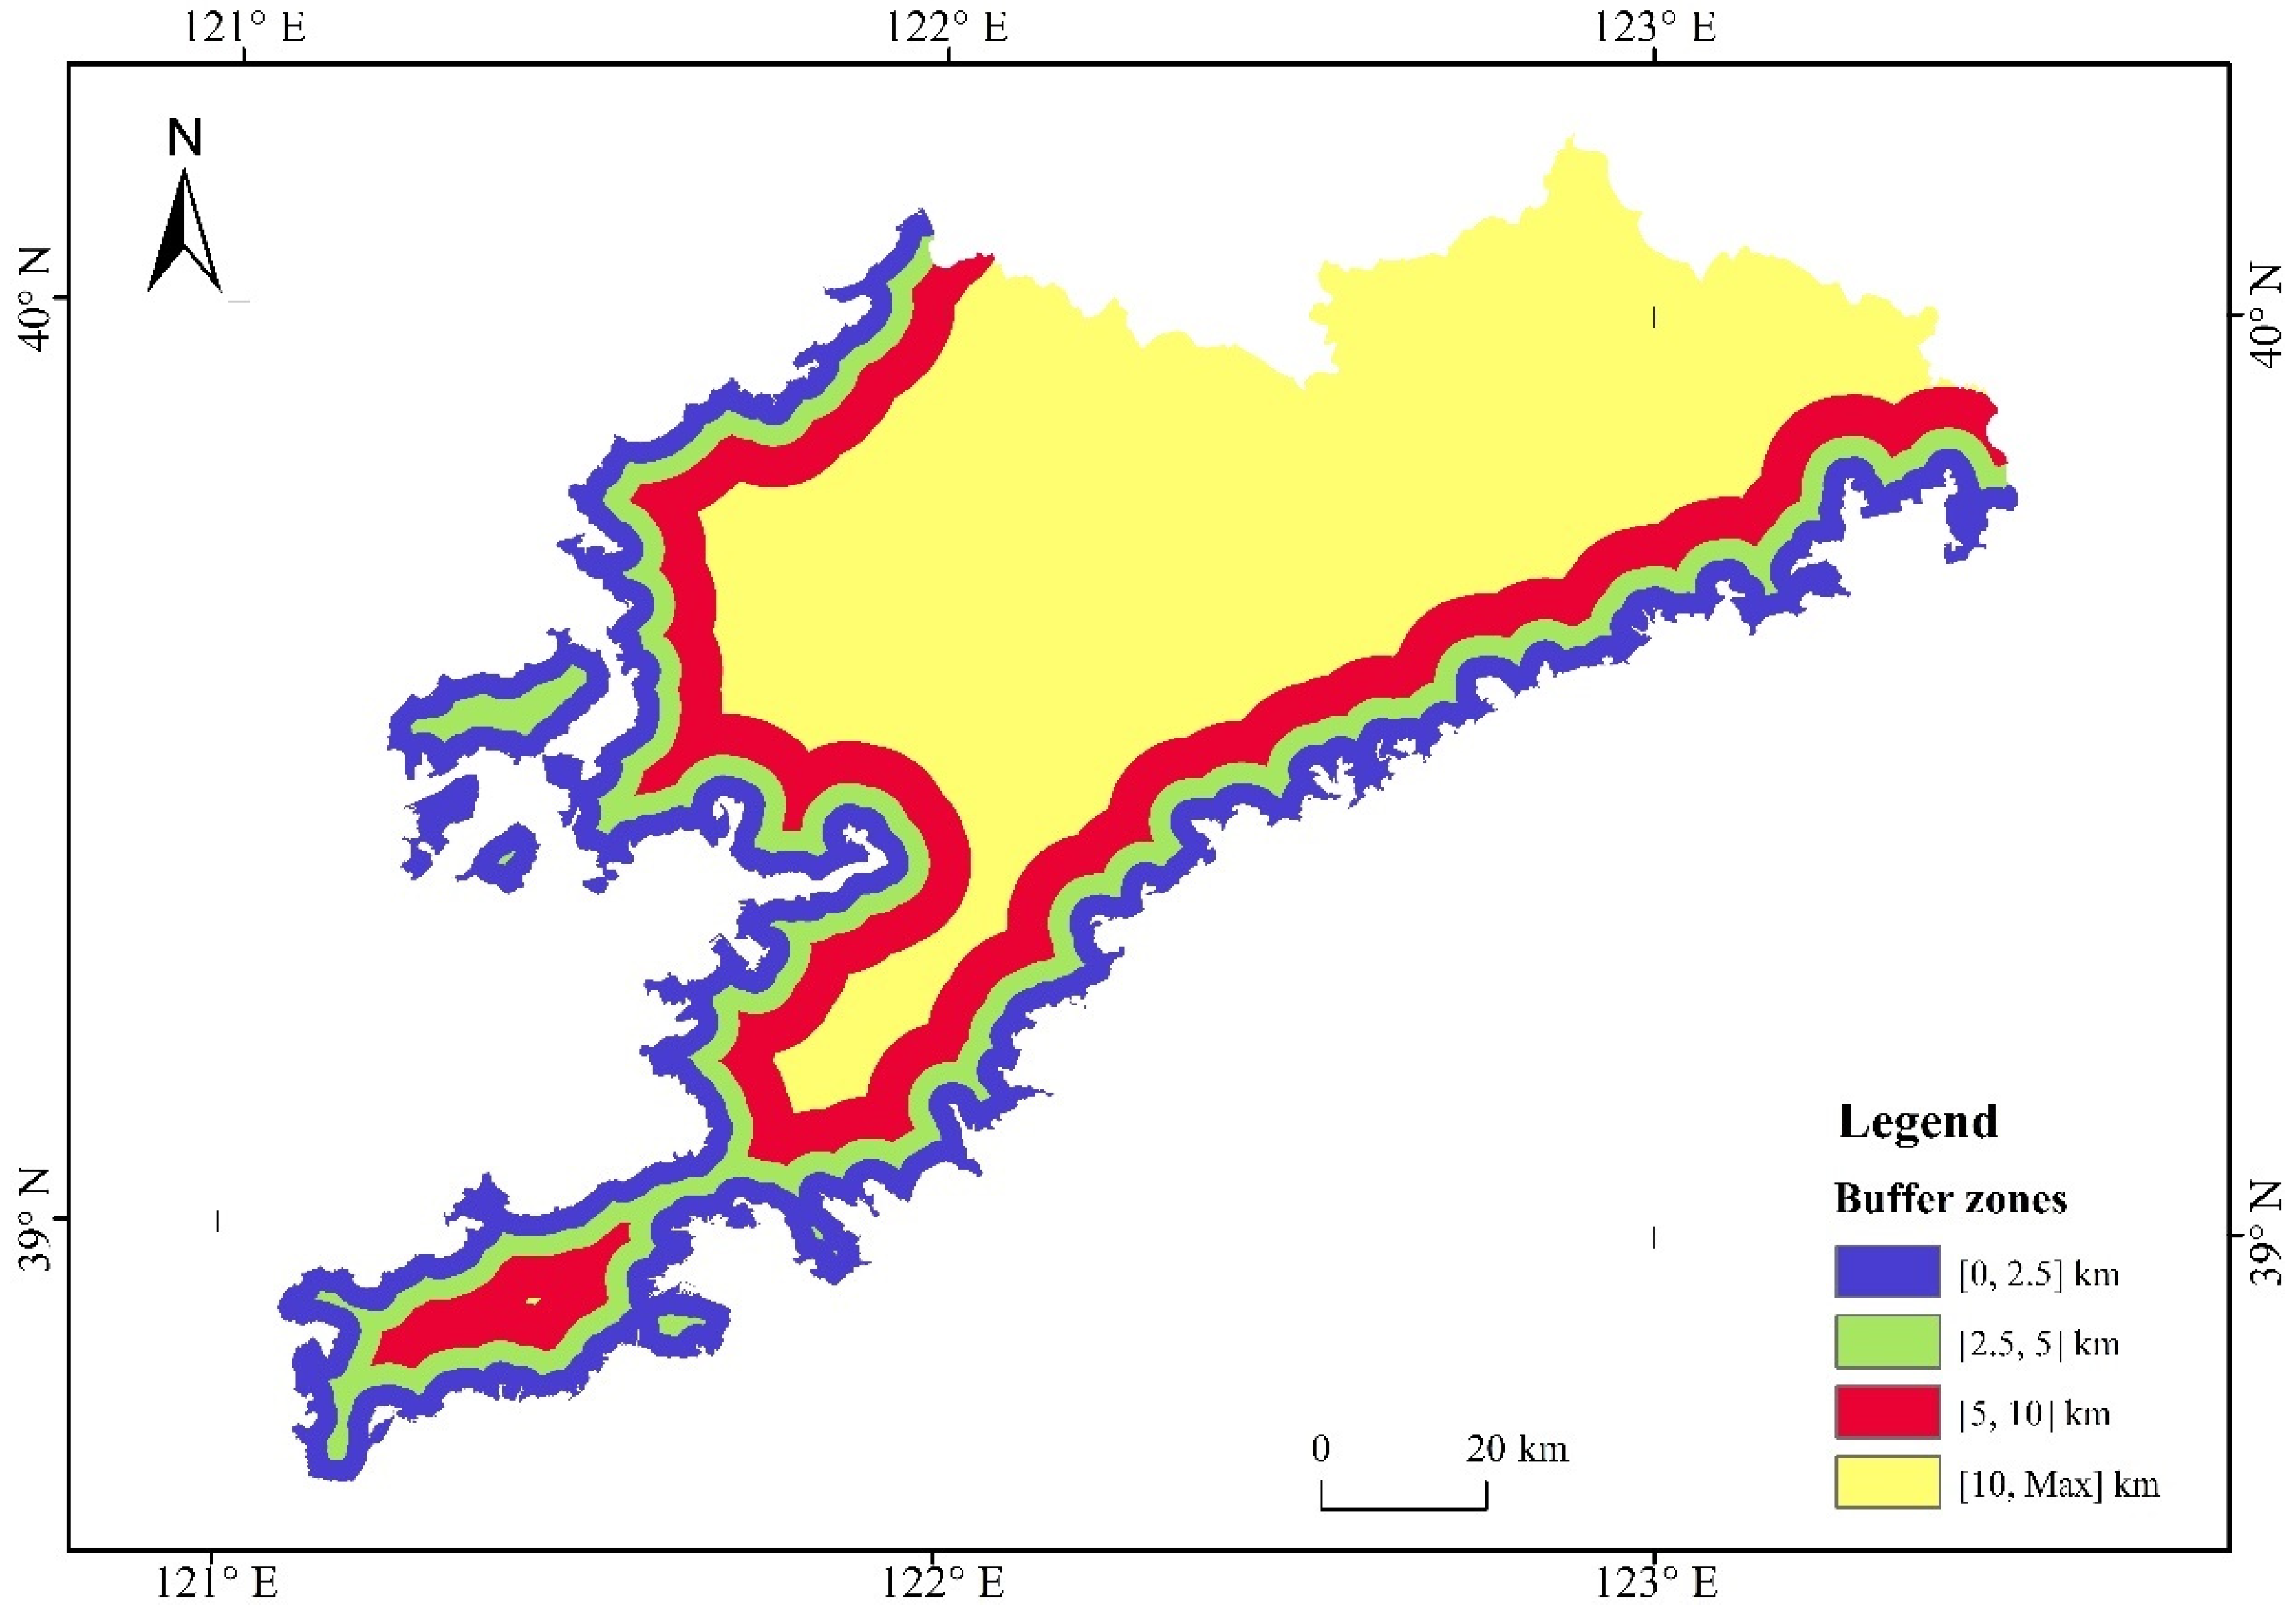
2.4.2. Extracting the Sea–Land Gradient

The notion of the sea–land gradient is presented in this study to assess the spatial and temporal change of coastal land use with the Euclidean distance from the coastline [46,47,48]. The method of gradient analysis is widely used in the field of landscape ecology, such as the urban–rural gradient [49]. The sea–land gradient depicts the many transitions from the water to the land area. Using the above coastline as a benchmark, four buffer zones were set to inland areas using the buffer zone analysis function, [0, 2.5] km, [2.5, 5] km, [5, 10] km, and [10, Max] km, respectively (Figure 4). The different coastal buffer zones were overlaid with the land use classifications for different periods to perform a sea–land gradient analysis of coastal land use changes.

2.4.3. Dynamic Index of the Coastal Land Use

The land use dynamic index refers to the change in the quantity of a land use type over a certain time frame in a study area and can reflect the intensity of change in land use type in regional land use and land cover [50]. This paper constructs a quantitative description of the rate of land use change in the coastal land use dynamic index in Equation (1). By comparing the land use dynamics in different buffer zones, the influence of the sea–land gradient on the change in land use quantity can be analyzed.
R i j = U B i j U A i j U A i j × 1 T × 100 %
where R i j is the dynamic attitude of land type i in the jth buffer zone during the study period, T is the period of change, and UA and UB are the areas of that land use type at the beginning and end of the study, respectively.

2.4.4. Net Transfer Matrix for Coastal Land Use

The land use transfer matrix is the main method for the quantitative study of the quantity and direction of interconversion between land use types, which can specifically reflect the structural characteristics of land use change and the direction of transfer between types [51], which was calculated as:
S = [ S 11 S 12 S 21 S 22 S 1 n S 2 n S n 1 S n 2 S n n ]
where S is the area of land converted from type i to type j in the study period, i represents the land use type in the previous period, j represents the land use type in the latter period, and n is the number of land use types.
This paper uses the land use transfer matrix to analyze the land use transfer directions in different zones in Dalian City from 2000 to 2015. However, in the transfer matrix S, S i j and S j i could be similar and did not help determine the direction of land use transfer. To offset these similar S i j and S j i values S i j  was calculated as:
S i j = { 0 S i j S j i ( i j ) ( i < j )
According to Equation (3), when S i j > 0, it means that more land in category i is converted to land in category j; when S i j < 0, it indicates more conversion of land type j to land type i; and when S i j = 0, it means that there is no interconversion between category i and category j land or the number of interconversions is equal. Therefore, Equation (2) can be translated into a net transfer matrix as:
S = [ 0 S 12 S 21 S 1 n S n 1 0 0 S 2 n S n 2 0 0 0 ]

2.4.5. Aggregation Index of Coastal Land Use

The aggregation index is used to reflect the structural characteristics of the distribution of land use quantities between different zones in different periods [52]. This parameter is defined as shown in Equation (5):
J = 1 log N i N P i log P i
where P i is the percentage of the land area of land use type i; N is the number of land use types; and log N denotes when the area of each land use type in the study area is equal, namely P 1 = P 2 = ... = P N = 1/N, and the entropy value reaches the maximum and the distribution of land use data reaches an equilibrium state. The greater the aggregation index, the greater the homogeneity of land use, and the more balanced the distribution of quantity.

3. Results

3.1. Gradient Analysis of Area Change

The change in the area of different land use types in different buffer zones in Dalian between 2000 and 2015 (Table 3) could be summarized in the following:
(1)
Both agricultural land and woodland have the highest share in each buffer zone, at over 40% and 20%, respectively, with a slight decrease in each buffer zone since 2000;
(2)
The proportion of water bodies area are highest in the range less than 2.5 km from the coastline but has decreased significantly with time. A slight increase in the proportion of water is noted in the buffer zones [5, 10] and [10, Max] between 2000 and 2015;
(3)
Between 2010 and 2015, the changes in the area of cities and villages have shown some reciprocity with increasing distance: when the distance from the coastline is less than 5 km, the proportion of urban building sites is significantly higher than that of villages; when the distance from the coastline is greater than 5 km, the proportion of urban building sites is significantly smaller than that of villages;
(4)
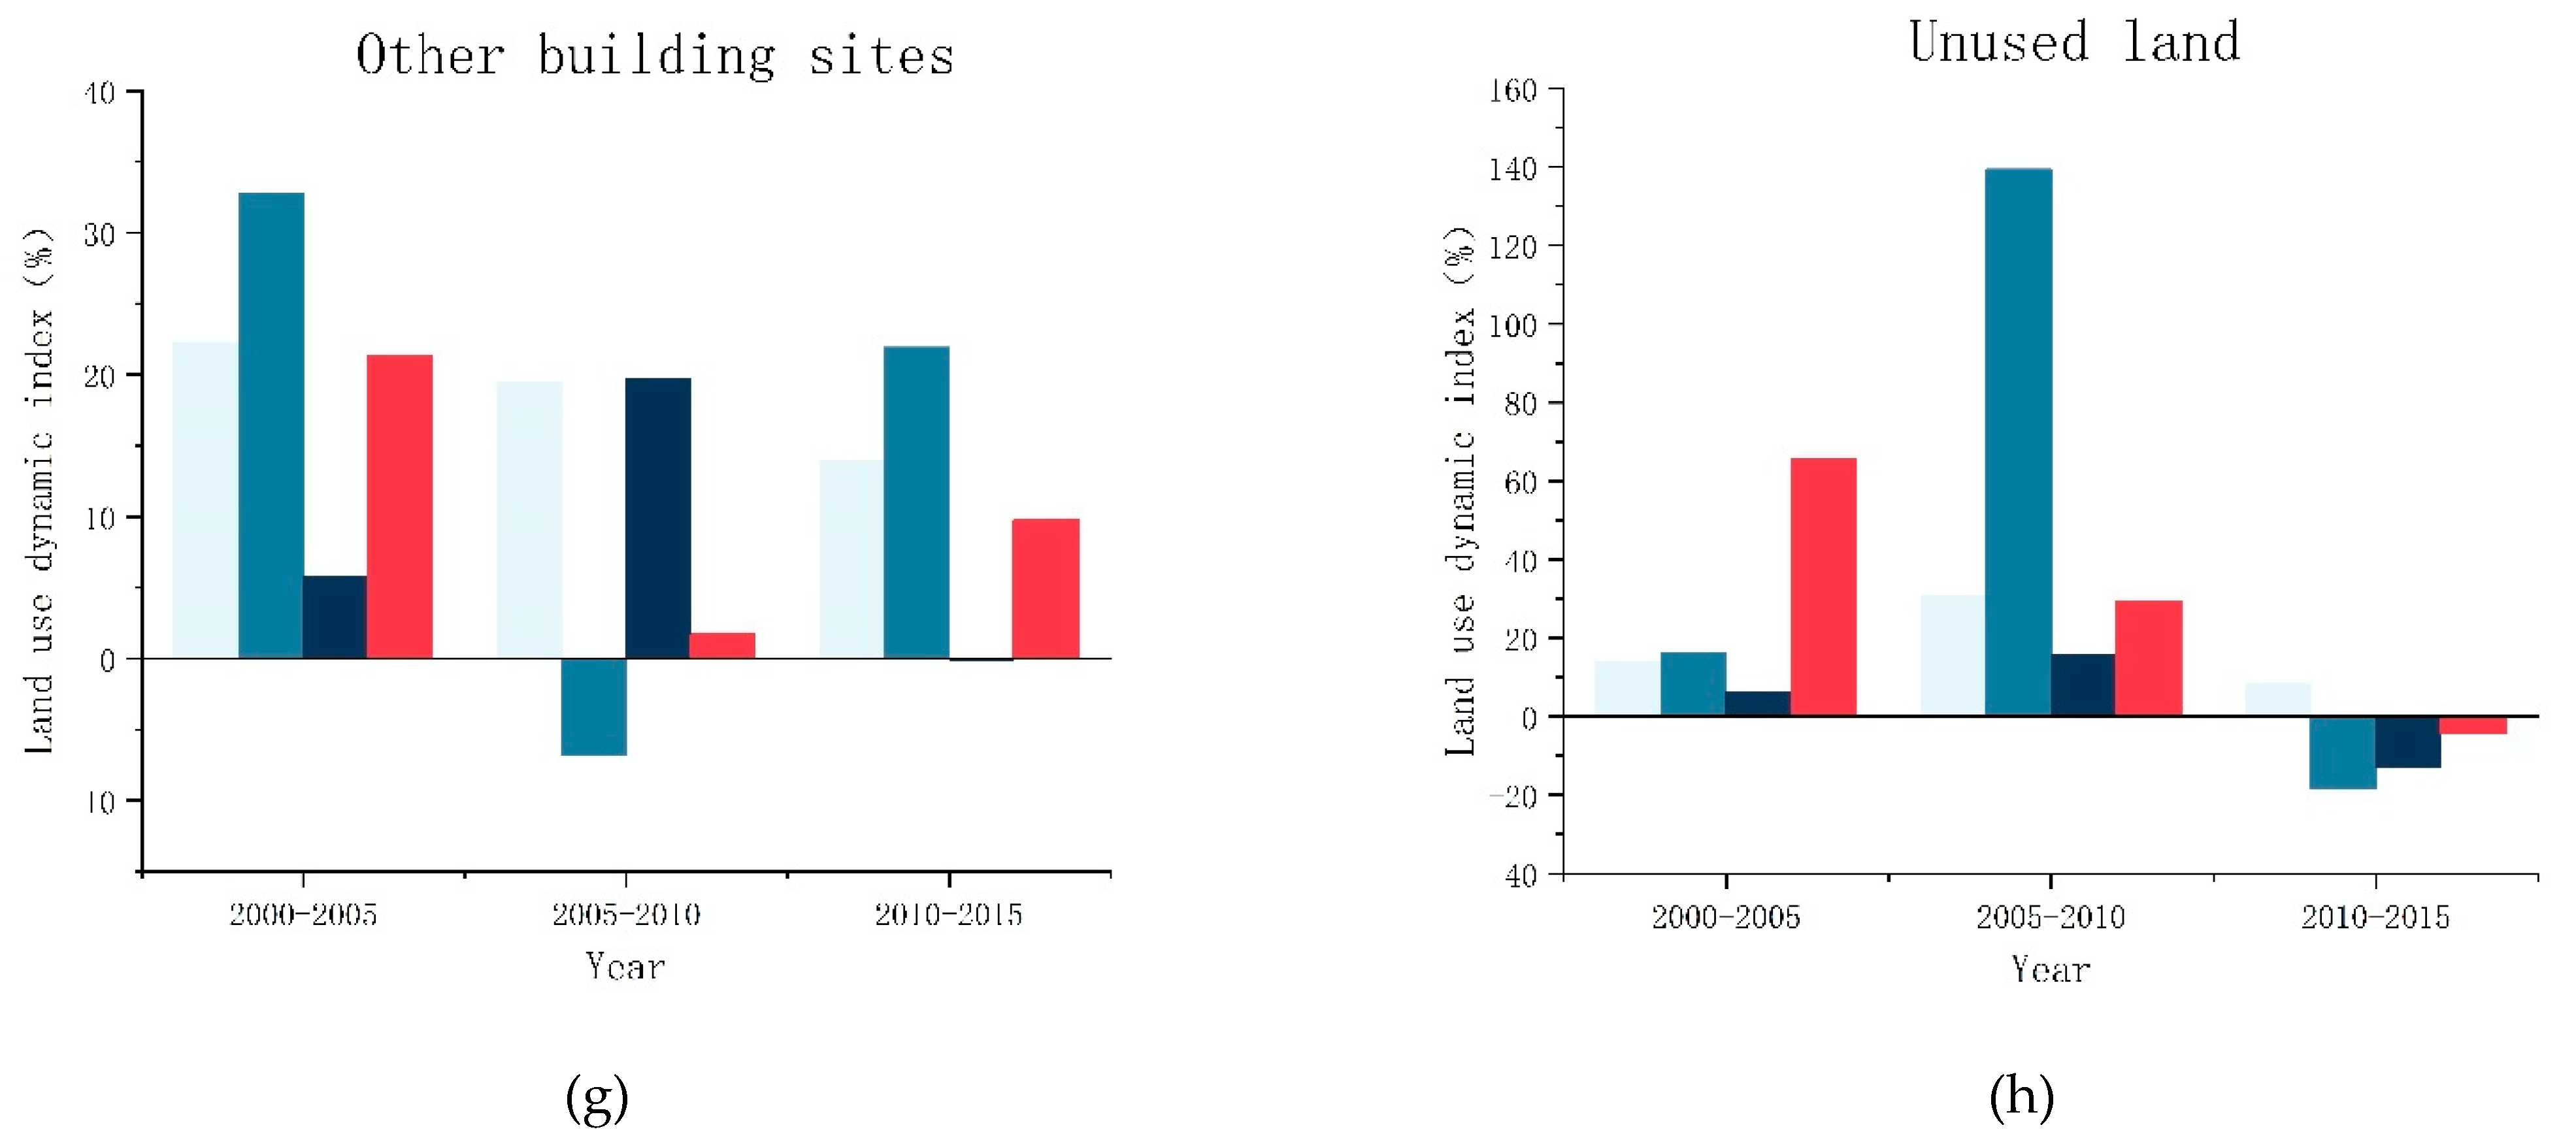
From 2000 to 2015, other building sites and unused land both had significant increases at [0, 2.5] km, with increases of 5.2% and 2.96%.

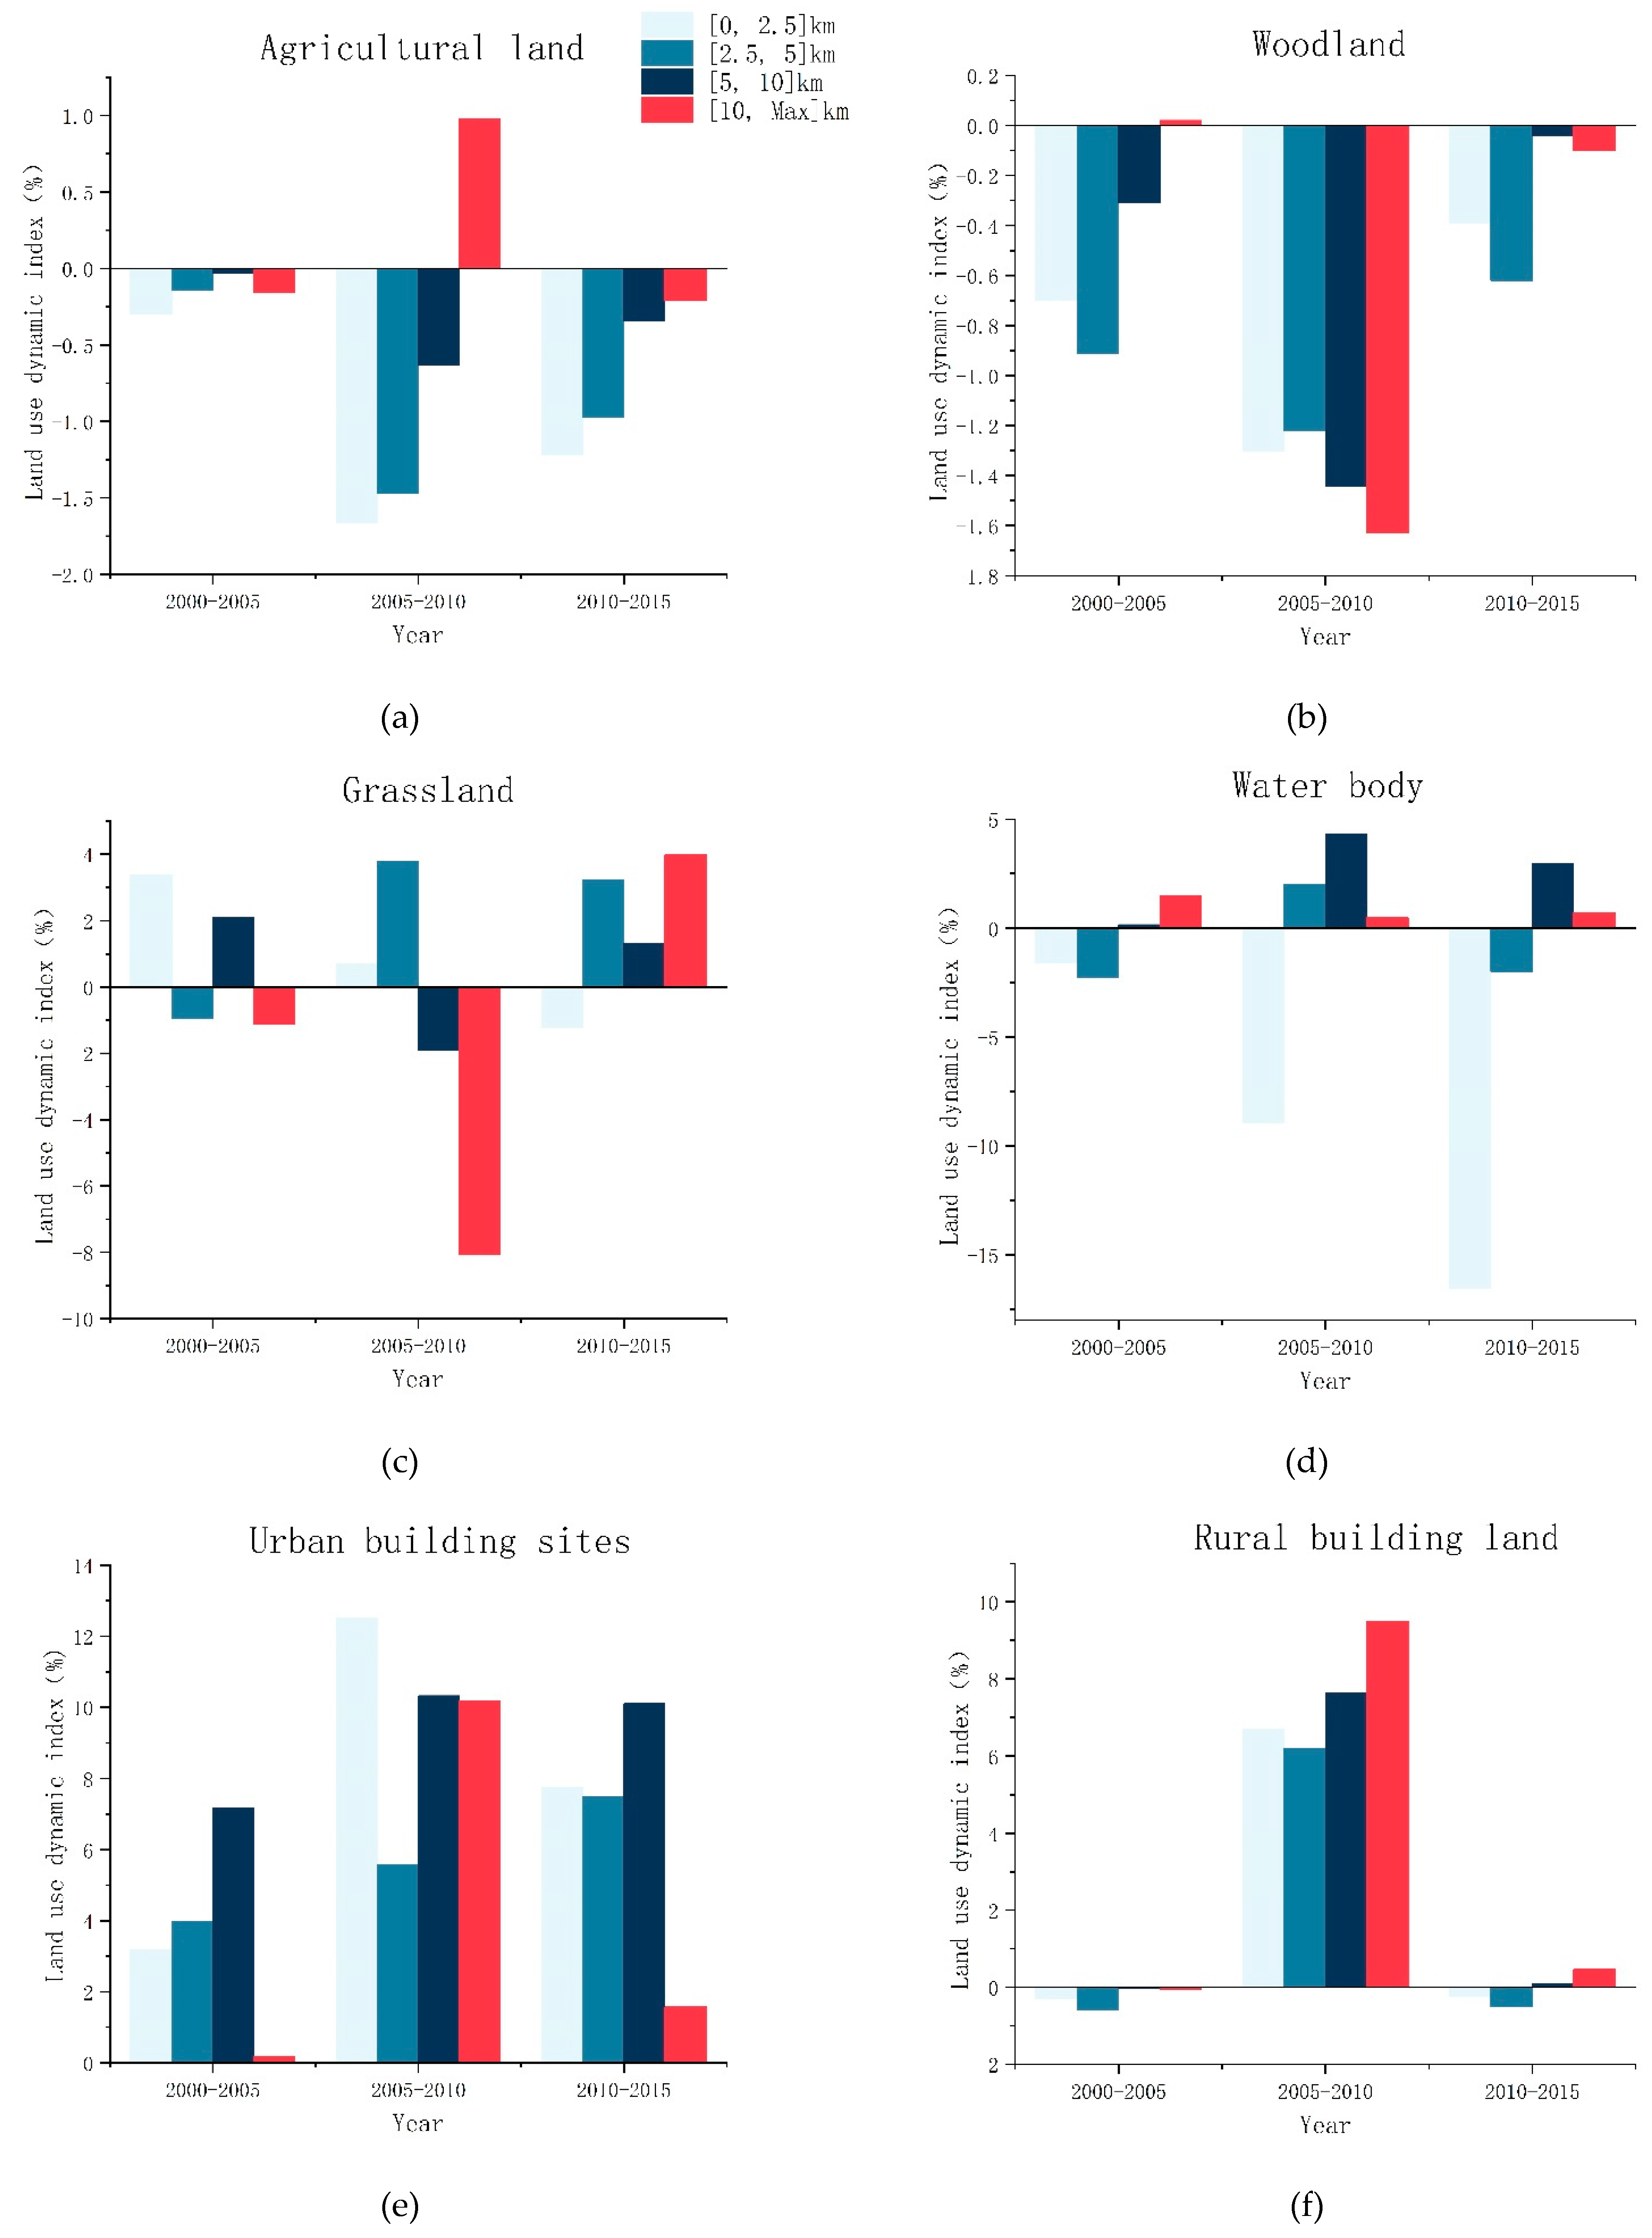
3.2. Gradient Analysis of Change Rate

The analysis of the changes of the dynamic land use attitude gradient in the buffer zones during the period 2000–2015 (Figure 5) could be summarized in the following points:
(1)
The dynamic degree of agricultural land and woodland is not considerably different between buffer zones. The decline rate of agricultural land in the [0, 2.5] km zone is slightly faster than that of other zones, and woodland has a drastic change in the [10, Max] km zone;
(2)
The area of water bodies has gradually decreased in the range of [0, 2.5] km, with a significant rate of decrease, especially since 2005;
(3)
Urban construction land in all coastal zones shows positive dynamics; according to the above, urban construction land is primarily distributed in the [0, 2.5] and [2.5, 5] km zones. When comparing the two dynamics, the growth rate of urban construction land in the [0, 2.5] km zone has been more obvious since 2005, while the proportion of urban land in the [5, Max] km zone is smaller but also has a faster growth;
(4)
Villages are close to each other in terms of change in attitude, mainly in the period of 2005–2010, with a higher growth rate and a slightly higher absolute value of attitude in the [10, Max] km zone;
(5)
Other built-up land and unused land have more drastic changes in dynamic attitude, mainly concentrated in the [0, 2.5] and [2.5, 5] km zones.
Table 4 reports the dynamic land use attitudes of different administrative units within the Dalian municipality from 2000 to 2015. There are significant regional differences in the level of urbanization in different administrative regions. The main observations may be summarized as follows:
(1)
In terms of urban construction land, Dalian’s main urban area has the highest dynamic attitude in the [5, 10] km zone, Jinzhou District and Zhuanghe City have a higher dynamic attitude in the [0, 2.5] and [5, 10] km zones, Lushunkou District has the highest dynamic attitude in the [2.5, 5] km zone, and Pulandian District has the highest dynamic attitude in the [0, 2.5] km zone;
(2)
There is a significant increase in the attitude of unused land in Wafangdian City, Jinzhou District, Pulandian District, and Zhuanghe City;
(3)
Only the Lushunkou District has the largest positive dynamic attitude in the coastal villages;
(4)
As the sea–land gradient increases, the dynamic attitude of agricultural land in each administrative region also gradually increases, and the maximum dynamic attitude of agricultural land is located in Zhuanghe City at the [10, Max] km zone.

3.3. Gradient Analysis of Land Use Transfer

The net land use transfer matrix within each buffer zone in Dalian allows for the detection of the spatial interconversion between land use types (Table 5, Table 6, Table 7 and Table 8). This test revealed that in the [0, 2.5] km, zone the main land use transfer direction is the transformation of water bodies into construction lands, such as cities and ports, and the transformation of agricultural land into cities and villages. In the [2.5, 5] and [5, 10] km zones, the prevailing trend of land use transfer is the transformation of agricultural land and woodland into cities and villages, with a gradual shift towards villages as the distance increases. The predominant direction of land use transfer at [2.5, 5] and [5, 10] km is the transformation of agricultural and woodland into cities and villages, with a steady shift towards villages as the distance from the coastline rises.
Table 9 reports the maximum direction of net land use transfer for each administrative unit in Dalian. In addition to Dalian city, Jinzhou District, Lushunkou District, Pulandian District, and Wafangdian City are the main bearers of land use urbanization, and it mainly occurs in the zone within 5 km of the coastline. Within [5, 10] km, the shift to building land occurs in all administrative districts, and most of them are rural building land. When located at [10, Max] km, the greatest direction of transfer is woodland to agricultural land in Jinzhou District, Pulandian District, Wafangdian City, and Zhuanghe City.

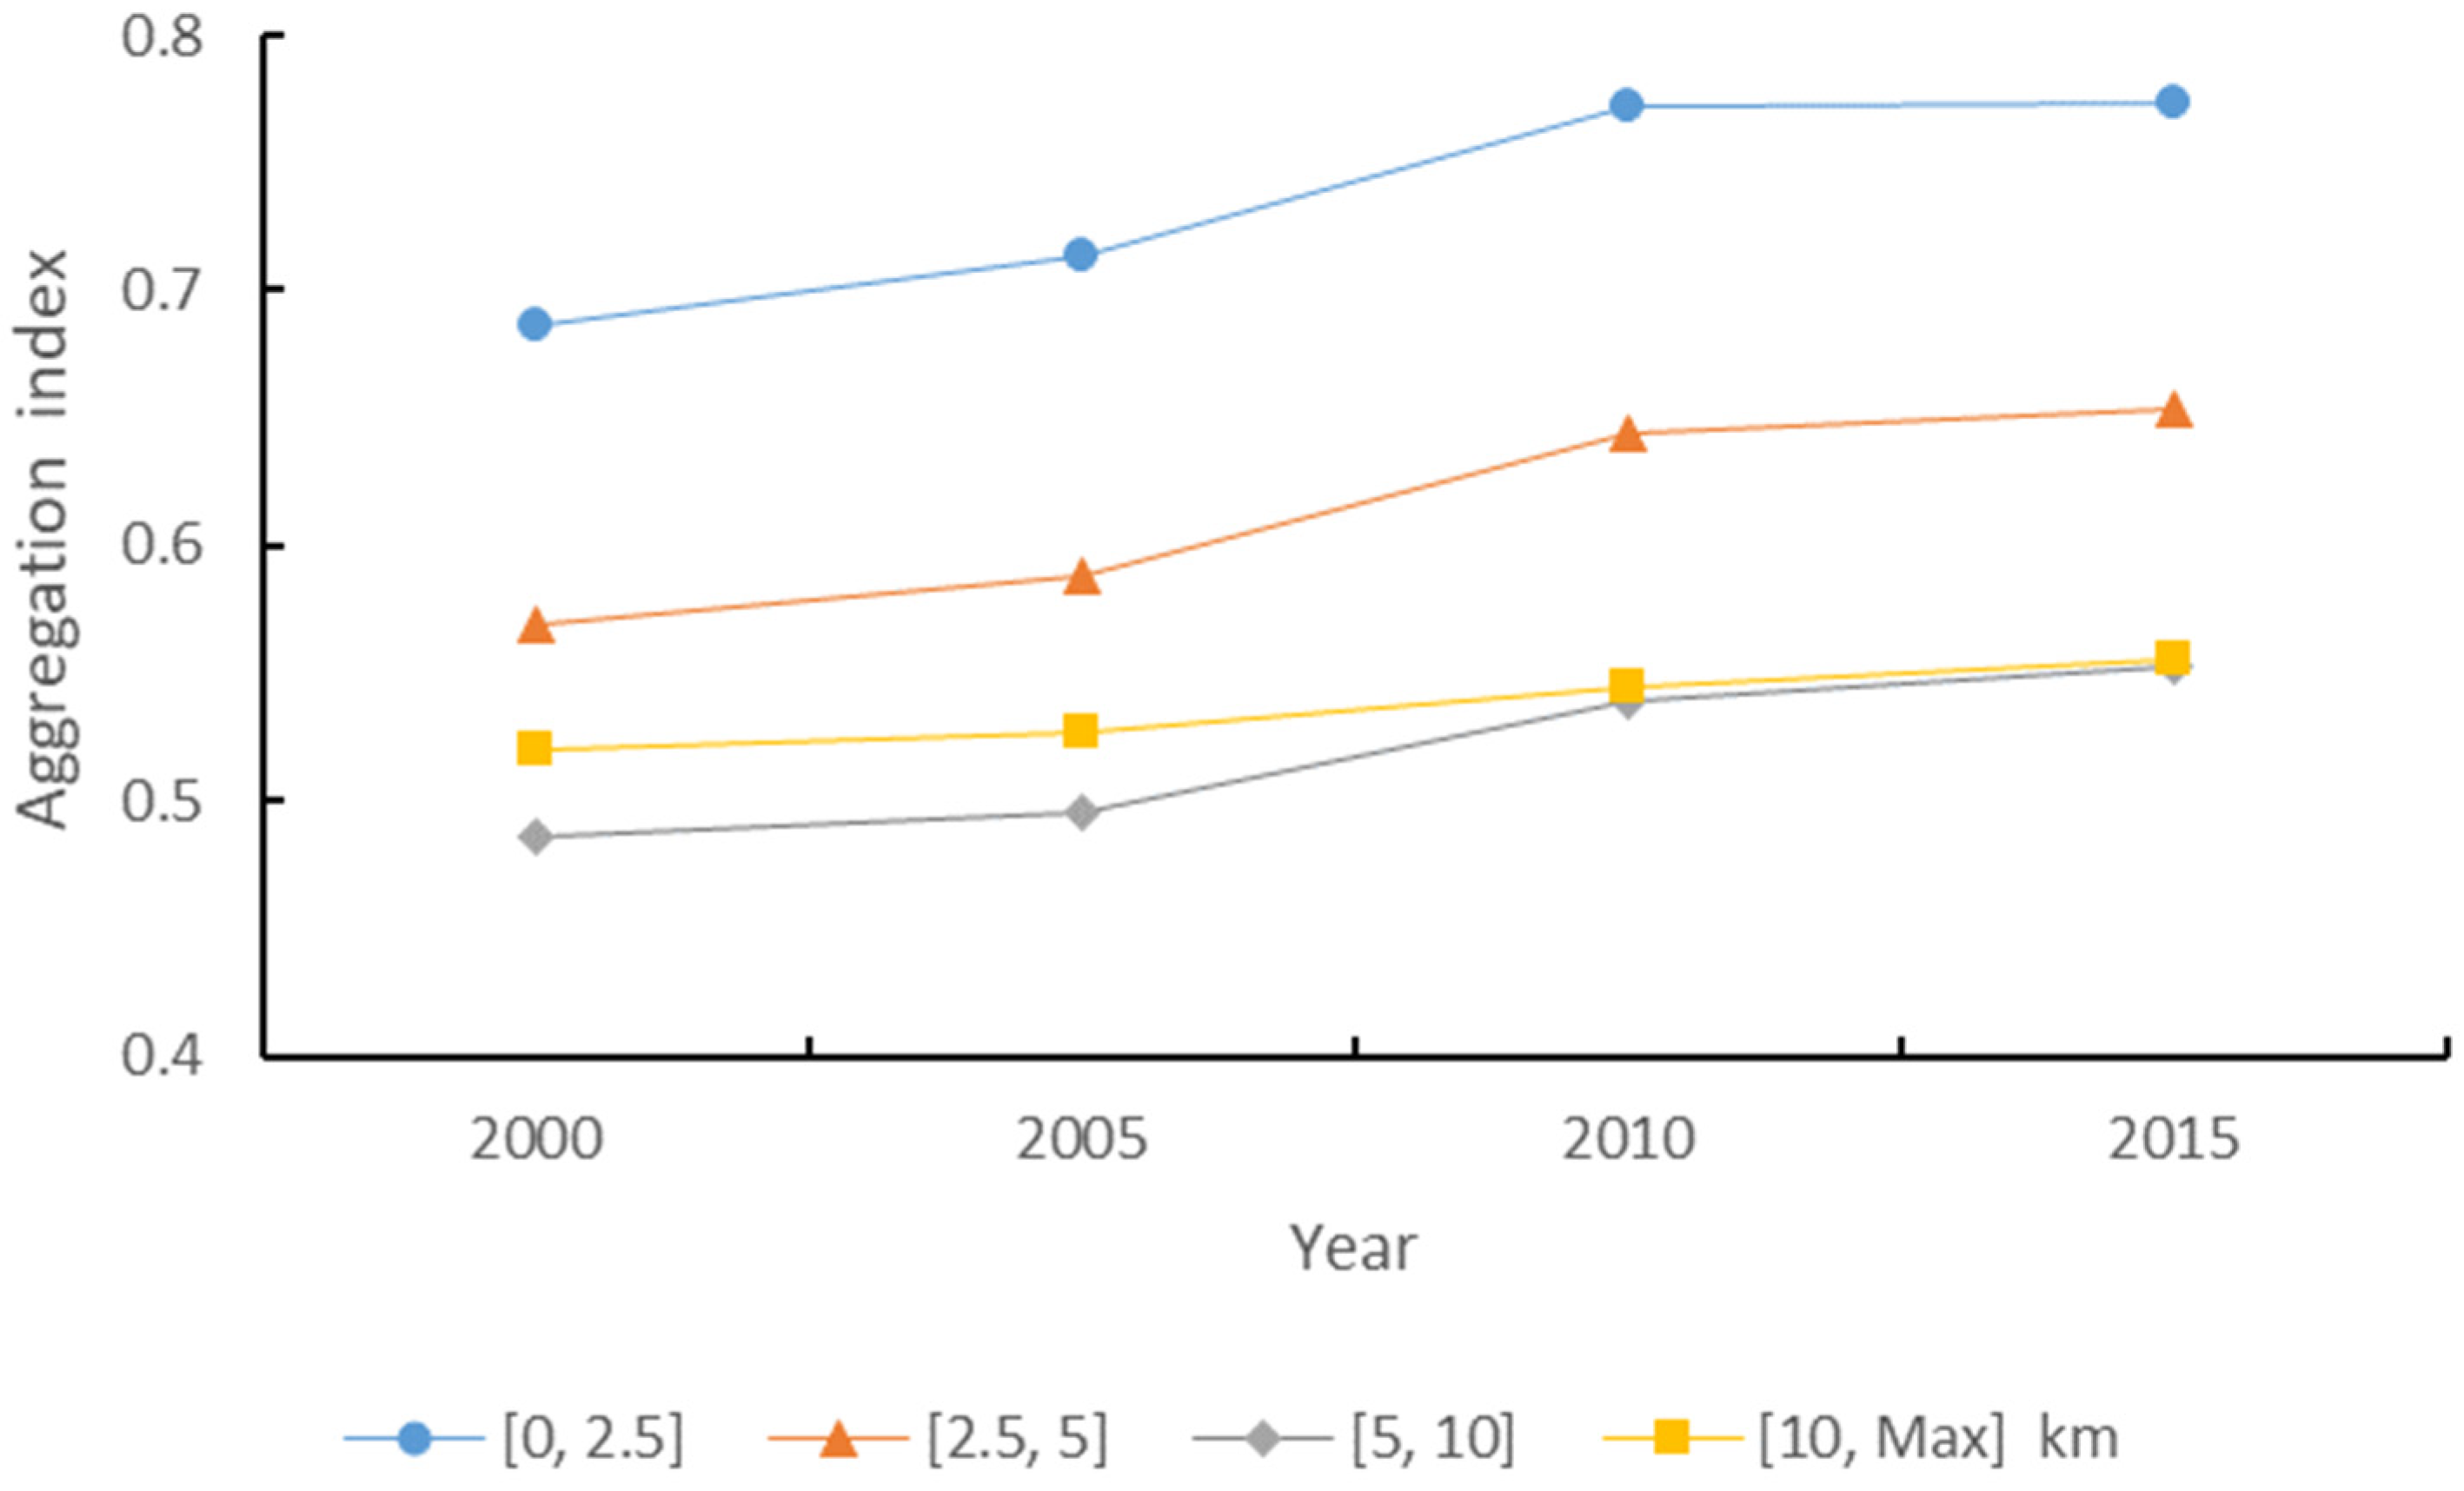
3.4. Gradient Analysis of Aggregation

Figure 6 shows the obtained results of the calculation aggregation index of the land use structure of Dalian City from 2000 to 2015 at different distances. The results of this index demonstrate two things. First, from the time scale, the equilibrium degree of land use structure in Dalian City from 2000 to 2015 shows a fluctuating upward trend. Second, from the distance scale, the closer the distance to the coast, the more functional and the higher homogeneity coastal land use is.
Table 10 reports the changes in the balance of the land use structure of each administrative unit in Dalian. In the [0, 2.5] and [2.5, 5] km zones, the balance of land use in Dalian City decreases slightly, while the balance in Jinzhou, Lushunkou, and Wafangdian increase, and that in Pulandian and Zhuanghe remains unchanged. In the buffer zone greater than 5 km, the balance of land use in each unit fluctuates slightly and remains unchanged.

4. Discussion

4.1. Changes in Coastal Land Use Types

Land use change represents the result of the interaction between human and land during this period, and is the main manifestation of the interaction between human activities and the natural environment. On the other hand, the land surface under the influence of human activities, such as deforestation and urban expansion, has been transformed from a state of natural coverage to a state of artificial coverage [53]. The sea–land gradient of the land use pattern reflects the distribution and changing characteristics of land use structures in different coastal buffer zones, which can more clearly reflect the spatial and temporal changes of land use types in different buffer zones.
Between 2000 and 2015, the area of agricultural land showed a trend of increasing and then decreasing with the increase of the sea–land gradient, reaching a peak between [5, 10] km. The dynamic attitude is the same in all zones, with a slightly faster decline in [0, 2.5] km than in the other zones. The largest net shift in land use of agricultural land is in the direction of building land. The main reason for this change is that coastal cities are at the forefront of economic development. As urbanization has accelerated in recent years, the traditional farming way of life has been affected and changed, the population has continued to gather in economically developed areas and the expansion of land for construction has led to a significant decline in agricultural land, especially in areas close to the coastline.
The woodland area increases with the sea–land gradient to [10, Max] km, where it increases abruptly. The dynamic attitude of woodland decreases slightly faster at [10, Max] km than in the other zones. Compared with other administrative districts, woodland has the largest dynamic attitude in Zhuanghe. Between 2000–2015, the overall land cover status of Dalian is dominated by agricultural land and woodland. As the gradient between land and sea increases, woodland is being transformed into agricultural land, with the largest area transferred at [10, Max] km. Given this, it is important to increase protection and reduce deforestation in the development process. The concept of “green water and green mountains are the silver mountain of gold” should be fully implemented.
The proportion of water bodies decreases year by year within the [0, 2.5] km zone, reaching 0.88% in 2015. Water bodies are mainly converted to urban construction land and other construction lands. Dalian should improve water conservation and wetland protection to protect water resources and reduce water pollution during the rapid urbanization process.
The share of urban building land and villages has increased year by year. Urban construction land is mainly concentrated in area close to the coast, while the opposite is true for rural construction land. Within [0, 5] km, the conversion is mainly to urban building land, and within [5, Max] km, the area converted to rural building land is much larger than urban building land. The maximum direction of transfer within [0, 10] km in all administrative districts of Dalian is the conversion to construction land, while when the distance is greater than 10 km, the conversion direction changes to agricultural land. The geographical expansion of urban and rural areas is significant, and the continuous expansion of construction land has caused a contraction in the area of arable land, water, and woodland. The development of construction land has been increasing over time, and the closer to the coastline, the more pronounced the development. This indicates that with the accelerated urbanization in recent years, Dalian has made full use of its coastal advantages. It is important to strengthen the protection of water bodies and natural vegetation, to enhance the planning and management of land resources in the development of urbanization, and to reduce the impact of rapid urbanization on agricultural production land, such as arable land and garden land.

4.2. Land Use Change in Coastal Administrative Areas

The changing characteristics of land use types over time, and the changes in the equilibrium degree of the land use structure on the sea–land gradient, reflect to some extent the influence of natural conditions on the land use structure and the adjustment of socioeconomic development and policy factors in recent years [44]. Due to the rapid socioeconomic development of the country, land use changes in Dalian show a dynamic process of high intensity and rapid change. The spatial pattern is characterized by a clear regional divergence according to the different coastal buffer zones. The urban development of the main urban area of Dalian is tilted inland; the urban development of Jinzhou District and Zhuanghe City is expanding both to the sea and inland; Lushunkou District is at the primary stage of inland expansion, and Pulandian District is still developing the coastal area. The main reasons for the above phenomenon are the different geographical locations of the administrative regions, the differences in the level of economic development and the different rates of urban development.
As time increases, the equilibrium of land use in Dalian increases. There are differences in the hierarchy of the sea–land gradient in the distribution of land use advantages across the administrative regions and in the equilibrium of the performance of each buffer zone. This indicates that there are differences in land use patterns, natural environment, related policies, and regional development orientation among administrative regions. Dalian City is surrounded by the sea on three sides. In comparison, Pulandian City is located inland. In contrast, Dalian City, Jinzhou District, and Lushunkou District are strategically located and have a relatively high degree of land use. The equilibrium degree is all over 0.4, and the construction land coverage is relatively obvious, with relatively rapid urban development. In the process of development, attention should be paid to land use planning in order to adapt to local conditions and improve the efficiency of land use by combining regional characteristics, development trends, and relevant ecological and environmental protection. Dalian should make full use of the coastal advantage to achieve the overall optimization and rapid development of the land use pattern.

5. Conclusions

In the context of global sustainable development, exploring the impact of sea–land gradients on land use change in coastal cities can help to better understand coastal urban development, which is important for adapting to environmental and natural challenges. This paper takes the coastline of Dalian in 2015 as the baseline point, and divides four different distance buffer zones towards the land. A fixed baseline point helps to explore changes in each land use type within the coastal area. The study shows that the dynamic index of the coastal land use, the net transfer matrix for coastal land use, and the aggregation index of coastal land use can well reflect the changes in the area and transfer the direction and structural distribution of coastal land use between 2000 and 2015. They can reflect the spatial and temporal effects of the sea–land gradient on coastal land use. The main conclusions of this paper are as follows. During the urban development process, Dalian has fully utilized the benefits of coastal resources, and the entire quantity of land for the urban and port building has been spread near the coastline area with a quick growth rate. The main source of land for building in the coastal zone is the conversion of agricultural land by human activity. The major zone of urban construction land has expanded from the shore to the inland in the southern part of Dalian; in the center and northern portions, urban construction land has developed inland on the one hand, and to the sea on the other. From a spatial perspective, the homogeneity of land use gradually decreases from the coast to the interior. From a temporal perspective, the homogeneity of administrative units gradually increases, except for the Dalian City area. During development, the homogeneity of land use in Dalian increases with time and subsequently diminishes when it reaches a particular level. Overall, the coastal areas are the first to suffer. This paper does not include socioeconomic factors in the analysis of land use change, and further research is needed. In addition, further studies on coastline encroachment changes and marine ecosystem assessment toward the ocean can be conducted in the future.

Author Contributions

Formal analysis, J.Z. and D.W.; project administration and funding acquisition, J.Z.; writing—review and editing, J.Z. and F.W.; writing—original draft and methodology, Y.H.; investigation, J.Z., Y.H. and D.W. All authors have read and agreed to the published version of the manuscript.

Funding

This research has been supported by the National Natural Science Foundation of China, grant number 42101257, Department of Education of Liaoning Province, grant number LJKZ0972, Department of Science and Technology of Liaoning Province, grant number 2021JH4/10100060.

Institutional Review Board Statement

Not applicable.

Informed Consent Statement

Not applicable.

Data Availability Statement

Not applicable.

Acknowledgments

Thanks to the anonymous reviewers and editors for their valuable comments and suggestions.

Conflicts of Interest

The authors declare no conflict of interest.

References

  1. Hailemariam, S.N.; Soromessa, T.; Teketay, D. Land Use and Land Cover Change in the Bale Mountain Eco-Region of Ethiopia during 1985 to 2015. Land 2016, 5, 41. [Google Scholar] [CrossRef]
  2. Qian, S.T.; Song, Y.; Yang, J.; Wang, S.J. Land Use Change Analysis of Coastal City: A Case Study of Yancheng. Resour. Dev. Mark. 2021, 37, 393–398+504. [Google Scholar]
  3. Zhang, X.; Yao, L.; Luo, J.; Liang, W. Exploring Changes in Land Use and Landscape Ecological Risk in Key Regions of the Belt and Road Initiative Countries. Land 2022, 11, 940. [Google Scholar] [CrossRef]
  4. Liu, J.; Xu, X.; Zhuang, D.; Gao, Z. Impacts of LUCC processes on potential land productivity in China in the 1990s. Sci. China Ser. D Earth Sci. 2005, 48, 1259–1269. [Google Scholar] [CrossRef]
  5. Agaton, M.; Setiawan, Y.; Effendi, H. Land use/land cover change detection in an urban watershed: A case study of upper Citarum Watershed, West Java Province, Indonesia. Procedia Environ. Sci. 2016, 33, 654–660. [Google Scholar] [CrossRef]
  6. Lei, C.; Zhu, L. Spatio-temporal variability of land use/land cover change (LULCC) within the Huron River: Effects on stream flows. Clim. Risk Manag. 2018, 19, 35–47. [Google Scholar] [CrossRef]
  7. Mamat, A.; Halik, Ü.; Rouzi, A. Variations of ecosystem service value in response to land-use change in the Kashgar Region, Northwest China. Sustainability 2018, 10, 200. [Google Scholar] [CrossRef]
  8. Ozsahin, E.; Duru, U.; Eroglu, I. Land Use and Land Cover Changes (LULCC), a Key to Understand Soil Erosion Intensities in the Maritsa Basin. Water 2018, 10, 335. [Google Scholar] [CrossRef]
  9. Chen, W.; Chi, G.; Li, J. The spatial association of ecosystem services with land use and land cover change at the county level in China, 1995–2015. Sci. Total Environ. 2019, 669, 459–470. [Google Scholar] [CrossRef]
  10. Dinka, M.O.; Klik, A. Effect of land use–land cover change on the regimes of surface runoff—the case of Lake Basaka catchment (Ethiopia). Environ. Monit. Assess. 2019, 191, 278. [Google Scholar] [CrossRef]
  11. Näschen, K.; Diekkrüger, B.; Evers, M.; Höllermann, B.; Steinbach, S.; Thonfeld, F. The Impact of Land Use/Land Cover Change (LULCC) on Water Resources in a Tropical Catchment in Tanzania under Different Climate Change Scenarios. Sustainability 2019, 11, 7083. [Google Scholar] [CrossRef]
  12. Bogale, A. Review, impact of land use/cover change on soil erosion in the Lake Tana Basin, Upper Blue Nile, Ethiopia. Appl. Water Sci. 2020, 10, 235. [Google Scholar] [CrossRef]
  13. Das, S.; Angadi, D.P. Land use land cover change detection and monitoring of urban growth using remote sensing and GIS techniques: A micro-level study. GeoJournal 2021, 87, 2101–2123. [Google Scholar] [CrossRef]
  14. Mostafa, E.; Li, X.; Sadek, M.; Dossou, J.F. Monitoring and Forecasting of Urban Expansion Using Machine Learning-Based Techniques and Remotely Sensed Data: A Case Study of Gharbia Governorate, Egypt. Remote Sens. 2021, 13, 4498. [Google Scholar] [CrossRef]
  15. Yu, S.; Wang, F.; Qu, M.; Yu, B.; Zhao, Z. The effect of land use/cover change on soil erosion change by spatial regression in Changwu County on the Loess Plateau in China. Forests 2021, 12, 1209. [Google Scholar] [CrossRef]
  16. Wang, H.; Wang, W.J.; Liu, Z.; Wang, L.; Zhang, W.; Zou, Y.; Jiang, M. Combined effects of multi-land use decisions and climate change on water-related ecosystem services in Northeast China. J. Environ. Manag. 2022, 315, 115131. [Google Scholar] [CrossRef]
  17. Wang, Y.H.; Ding, J.L.; Li, X.H.; Zhang, J.Y.; Ma, G.L. Impact of LUCC on ecosystem services values in the Yili River Basin based on an intensity analysis model. Acta Ecol. Sin. 2022, 42, 3183. [Google Scholar]
  18. Zhang, Y.Z.; Wang, Y. Coastal ocean sciences facing the 21century. J. Nanjing Univ. 2000, 36, 702–711. [Google Scholar]
  19. Di, X.H.; Hou, X.Y.; Wu, L. Land Use Classification System for China’s Coastal Zone Based on Remote Sensing. Resour. Sci. 2014, 36, 463–472. [Google Scholar]
  20. Li, W.F.; Yu, T.; Li, J.L.; Chen, P.C.; Chen, Y. Suitability evaluation of land use in coastal zones:A case study in southern Hangzhou Bay. Geogr. Res. 2015, 34, 701–710. [Google Scholar]
  21. Ding, Z.; Su, F.; Zhang, J.; Zhang, Y.; Tang, X. Clustering Coastal Land Use Sequence Patterns along the Sea–Land Direction: A Case Study in the Coastal Zone of Bohai Bay and the Yellow River Delta, China. Remote Sens. 2019, 11, 2024. [Google Scholar] [CrossRef]
  22. Liu, Y.; Hou, X.; Li, X.; Song, B.; Wang, C. Assessing and predicting changes in ecosystem service values based on land use/cover change in the Bohai Rim coastal zone. Ecol. Indic. 2020, 111, 106004. [Google Scholar] [CrossRef]
  23. Liu, C.; Yang, M.; Hou, Y.; Xue, X. Ecosystem service multifunctionality assessment and coupling coordination analysis with land use and land cover change in China’s coastal zones. Sci. Total Environ. 2021, 797, 149033. [Google Scholar] [CrossRef] [PubMed]
  24. Wang, Y.X.; Wang, Y.F.; Zhang, J.W.; Wang, Q. Land use transition in coastal area and its associated eco-environmental effect: Acase study of coastal area in Fujian Province. Acta Sci. Circumstantiae 2021, 41, 3927–3937. [Google Scholar] [CrossRef]
  25. Li, M.N.; Yin, P.; Duan, X.Y.; Chou, J.D.; Cao, K.; Yang, L.; Chen, X.B. Land use change and ecosystem effect of typical coastal zone in the Yangtze River delta in the last 20 years. Geol. China 2022, 1–21. [Google Scholar]
  26. Wu, Q.Y.; Hou, Z.H.; Yu, Z.Z.; Jiang, C.L.; Zou, M.; Yang, S.J.; Li, Y.P.; Han, C.C. Analysis of the dynamic change of land use in Longkou city’s coastal zone based on remote sensing technology. Geogr. Res. 2006, 25, 921–929+951. [Google Scholar]
  27. Wu, L.; Hou, X.Y. Analysis of land use change in the coastal zone of Circum the Bohai Sea Region during 2000 to 2010. Mar. Sci. 2015, 39, 101–110. [Google Scholar]
  28. Huang, F.; Huang, B.; Huang, J.; Li, S. Measuring land change in coastal zone around a rapidly urbanized bay. Int. J. Environ. Res. Public Health 2018, 15, 1059. [Google Scholar] [CrossRef]
  29. Wu, C.L.; Wang, Q.; Dong, Z.; Chen, W.H. Land Use/Cover Change and Its Driving Forces in Coastal Zone of Fujian Provinc. Bull. Soiland Water Conserv. 2018, 38, 318–323. [Google Scholar] [CrossRef]
  30. Zhang, J.; Su, F. Land use change in the major bays along the coast of the South China Sea in Southeast Asia from 1988 to 2018. Land 2020, 9, 30. [Google Scholar] [CrossRef]
  31. Meng, Z.Q.; Long, L.B.; She, Q.N.; Cheng, D.Y.; Liu, M. Assessment of ecological conditions over China’s coastal areas based on land use /cover change. Chin. J. Appl. Ecol. 2018, 29, 3337–3346. [Google Scholar] [CrossRef]
  32. Lu, X.; Wu, L.; Ying, L.L.; Hou, X.Y. Spatial Patterns of Land-Use Change in Coastal Zone of Shandong Peninsula. Territ. Nat. Resour. Study 2011, 33, 23–26. [Google Scholar] [CrossRef]
  33. Qian, J.P.; Jia, J.Y.; He, P.; Hou, L.P. Spatial Patterns of Land Use in Coastal Zones of Hebei Provinc. Res. Soil Water Conserv. 2013, 20, 261–265. [Google Scholar]
  34. Zou, M.; Zhang, W.W. Fractal Analysis of Spatial Structure of Land Use in the Sea Coastal Zone of Yantai City. Res. Soil Water Conserv. 2016, 23, 92–96. [Google Scholar] [CrossRef]
  35. Wang, M.M.; Zhang, H.Y.; Zhang, Y.G.; Lin, M.S.; Gong, P. Evolution analysis of land use pattern in the Changjiang River Delta coastal zone in recent 39 years. Haiyang Xuebao 2020, 42, 142–154. [Google Scholar]
  36. Hai, K.; Wang, S.Y.; Tu, P.; Yang, R.X.; Ma, Y.X.; Liang, J.Z.; Liu, W.H.; Wu, L.L. Spatio-temporal patterns and driving forces of recent (1992–2015) land cover change in countries along the Belt and Road Initiative. Natl. Remote Sens. Bull. 2022, 26, 1220–1235. [Google Scholar]
  37. State Council. Reply of the State Council on Revitalizing the Northeast Region; The State Council The Peoples Republic of China: Beijing, China, 2007; pp. 19–20. [Google Scholar]
  38. National Bureau of Statistics of China. 2015 Dalian National Economic and Social Development Statistical Bulletin; National Bureau of Statistics of China: Beijing, China, 2016; pp. 1–13.
  39. State Council. Notice on Printing and Distributing Several Opinions on the Implementation and Management of Land Use Planning; The State Council The Peoples Republic of China: Beijing, China, 2000; pp. 27–29. [Google Scholar]
  40. GB/T21010-2017; Current Land Use Classification. China National Standardization Administration: Beijing, China, 2017.
  41. State Council. Notice of the State Council on Launching the Second National Land Survey—000014349/2006-00214; The State Council of The Peoples Republic of China: Beijing, China, 2008. [Google Scholar]
  42. Ma, Q.; Li, D.; Liao, J.; Han, J. Analysis of Land Use Change and Its Driving Forces in the Oasis of Shule River Middle and Lower Reaches. Econ. Geogr. 2014, 34, 148–155. [Google Scholar] [CrossRef]
  43. Bao, Q.Y.; Gu, Z.N.; Zhang, Z. Analysis on temporal and spatial change of land use in Tongling City in recent 30 year. Mine Surv. 2021, 49, 78–83. [Google Scholar]
  44. Zhai, X.; Jun, L.A.; Liao, Y.M.; Mao, C.Y.; Zhong, J.S. The Influence of Terrain Gradient on The Spatio-temporal Characteristic of Land Use Pattern. J. Nat. Sci. Hunan Norm. Univ. 2022, 45, 1–12. [Google Scholar]
  45. Wang, X.G.; Li, X.Y.; Jia, M.M.; Wang, Z.M.; Ren, C.Y.; Mao, D.H. Analysis on changes in coastline and reclamation in Dalian from 1975 to 2015. Mar. Environ. Sci. 2017, 36, 87–93. [Google Scholar] [CrossRef]
  46. Zhang, L.L.; Zhao, Y.H.; Yin, S.; Fang, S.; Liu, X.J.; Pu, M.M. Gradient analysis of dry valley of Minjiang River landscape pattern, based on moving window method. Acta Ecol. Sin. 2014, 34, 3276–3284. [Google Scholar]
  47. Li, M.Z.; Li, Y.B.; Ran, C.H. Evolution of rural landscape pattern under the background of land use transformation: Based on the transect analysis of Caotangxi watershed. J. Nat. Resour. 2020, 35, 2283–2298. [Google Scholar] [CrossRef]
  48. Wu, Z.J.; Li, Z.J.; Zeng, H. A gradient analysis of urban landscape pattern in Huizhou. Chin. J. Ecol. 2021, 40, 490–500. [Google Scholar] [CrossRef]
  49. Cai, Z.R.; Fang, Z.Y.; He, Q.H.; Yan, J.L.; Gao, D.; Liu, Z.Y. Urban-Rural Gradient Identification and Ecosystem Service Response in Main Urban Area of Nanchang Based on Landscape Clustering. Res. Environ. Sci. 2022, 35, 806–817. [Google Scholar] [CrossRef]
  50. Wang, X.L.; Bao, Y.H. Study on the methods of land use dynamic change research. Prog. Geogr. 1999, 18, 83–89. [Google Scholar]
  51. Ren, F.P.; Jiang, Y.; Xiong, X.; Dong, M.Y.; Wang, B. Characteristics of the Spatial-Temporal Differences of Land Use Changes in the Dongjiang River Basin from 1990 to 2009. Resour. Sci. 2011, 33, 143–152. [Google Scholar]
  52. Chen, Y.G.; Liu, J.S. An index of equilibrium of urban land-use structure and information dimension of urban form. Geogr. Res. 2001, 20, 146–152. [Google Scholar]
  53. Liu, J.Y.; Zhang, Z.X.; Xu, X.L.; Kuang, W.H.; Zhou, W.C.; Zhang, S.W.; Li, R.D.; Yan, C.Z.; Yu, D.S.; Wu, S.X.; et al. Spatial patterns and driving forces of land use change in China during the early 21st century. Acta Geogr. 2009, 64, 1411–1420. [Google Scholar] [CrossRef]
Figure 1. Location and administrative divisions of Dalian.
Land 11 01302 g001
Figure 2. Land use classification map of Dalian City (a) In 2000, (b) In 2005, (c) In 2010 and (d) In 2015.
Land 11 01302 g002
Figure 3. Comparison of coastline changes in Dalian between 2000 and 2015.
Land 11 01302 g003
Figure 4. Distribution of sea–land gradient in Dalian.
Land 11 01302 g004
Figure 5. Changes in the dynamic land use attitude gradient in the buffer zones of Dalian. (a) Agricultural land, (b) Woodland, (c) Grassland, (d) Water bodies, (e) Urban building sites, (f) Rural building land, (g) Other building sites, (h) Unused land.
Land 11 01302 g005aLand 11 01302 g005b
Figure 6. Changes in the balance of land use structure between buffer zones in Dalian.
Land 11 01302 g006
Table 1. Parameters of Landsat TM images.
YearSensorSpatial ResolutionDate
2000TM30 m4 May 2000
2005TM30 m6 July 2005
2010TM30 m27 July 2010
2015TM30 m24 June 2015
Table 2. Land use classification and description.
CategoryDescription
Agricultural landRefers to land used directly for agricultural production, including arable, watered, dryland, and other agricultural lands.
WoodlandRefers to land on which trees and shrubs grow.
GrasslandRefers to land on which herbaceous plants grow predominantly.
Water bodiesRefers to river and lake waters and mudflat marshes.
Building sitesThis refers to land on which buildings and structures are constructed. Includes land for settlement, independent industrial and mining land, special land, scenic tourism land, transport land, water facilities land, etc.
Urban building sitesRefers to land on which buildings and structures are constructed, including urban settlements.
Rural building landRefers to land on which buildings and structures are constructed, including rural settlements.
Other building sitesIt mainly includes land for construction away from cities and villages such as ports, airports, and industrial mines.
Unused landThis refers to unused land within the boundaries of towns, villages, and industrial mines, including land whose use has not yet been determined.
Table 3. Changes in coastal land use gradients in Dalian.
Land Use CategoryYearChange in Percentage of Land Use within Each Coastal Buffer Zones Space (%)
[0, 2.5][2.5, 5][5, 10][10, Max]
Agricultural land200047.7954.7060.3842.00
200547.0754.3460.2941.67
201043.1650.3458.3943.71
201540.5347.9157.3943.27
Woodland200026.0428.5029.3347.59
200525.1327.2028.8847.65
201023.5025.5426.8043.76
201523.0424.7526.7543.54
Grassland20001.610.800.742.27
20051.880.760.822.13
20101.950.900.741.27
20151.831.050.791.53
Water bodies200010.441.181.262.80
20059.611.051.273.01
20105.331.161.553.09
20150.881.041.783.20
Urban building sites20005.826.920.920.48
20056.758.301.260.56
201010.9710.631.900.85
201515.2114.602.860.92
Villages20006.867.436.964.76
20056.767.216.954.75
20109.019.439.607.00
20158.919.209.637.16
Other building sites20000.860.370.270.09
20051.810.970.340.18
20103.570.640.680.20
20156.061.340.680.29
Unused land20000.580.090.140.01
20050.990.170.190.05
20102.501.360.330.12
20153.540.120.120.09
Table 4. Change in dynamic land use attitude gradient by district in Dalian from 2000 to 2015.
Administrative UnitsBuffer Distance (km)Land Use Dynamics 2000–2015 (%)
Agricultural LandWoodlandGrasslandWater BodiesUnused LandUrban Building SitesVillagesOther Building Sites
Dalian City District[0, 2.5]−1.74−1.86−1.01−6.060.553.60.758.19
[2.5, 5]−1.16−2.22−3.034.103.81−2.98−3.16
[5, 10]−0.43−1.2104.9107.72−1.94−2.59
[10, Max]0−0.83000000
Jinzhou District[0, 2.5]−1.35−0.7641.86−6.3123.5720.750.5222.26
[2.5, 5]−1.03−1.020−3.86−2.857.651.036.67
[5, 10]−0.38−0.7504.8−5.8347.232.5713.33
[10, Max]0.07−1.88010.66000.6433.33
Lushunkou District[0, 2.5]−2.1−0.850−5.44015.2310.0524.11
[2.5, 5]−1.26−0.84014.80146.657.294.31
[5, 10]−0.28−0.710−3.33003.70
[10, Max]00000000
Pulandian District[0, 2.5]−0.28−0.992.22−5.75166.6719.990.460
[2.5, 5]−0.36−0.530−0.8304.310.40
[5, 10]−0.36−0.19−3.993.1419.996.673.111.99
[10, Max]0.17−0.49−2.41−0.98002.6643.33
Wafangdian City[0, 2.5]−0.87−0.57−0.68−6.41453.3300.87596.67
[2.5, 5]−1.1−0.793.670.61−6.6701.03213.33
[5, 10]−0.07−0.419.170.83000.820
[10, Max]0.21−14.61.39−3.334.943.596.67
Zhuanghe City[0, 2.5]−0.480.48−4.17−5.5920.0065.834.880
[2.5, 5]−0.580.67−3.7004.444.180
[5, 10]−0.490−3.011.61086.675.240
[10, Max]0.25−0.29−4.051.99004.670
Table 5. Net land use transfer matrix between [0, 2.5] km buffer zone in Dalian.
Agricultural LandWoodlandGrasslandWater BodiesUrban Building SitesUnused LandVillagesOther Building Sites
Agricultural land0−0.602.21−10.9981.2910.4567.4728.04
Woodland002.96−2.1831.745.6410.6224.54
Grassland000−3.132.030.98−0.180.17
Water bodies000077.1258.673.8176.74
Urban building sites00000−5.04−24.15−8.32
Unused land000000−1.750.20
Villages00000005.76
Other building sites00000000
Table 6. Net land use transfer matrix between [2.5, 5] km buffer zone in Dalian.
Agricultural LandWoodlandGrasslandWater BodiesUrban Building SitesUnused LandVillagesOther Building Sites
Agricultural land0−13.490.823.6661.690.4637.229.88
Woodland003.651.6225.410.235.065.69
Grassland000−0.360.960.000.20−0.01
Water bodies00006.520.280.140.00
Urban building sites00000−0.50−15.87−2.18
Unused land0000000.010.16
Villages00000000.75
Other building sites00000000
Table 7. Net land use transfer matrix between [5, 10] km buffer zone in Dalian.
Agricultural LandWoodlandGrasslandWater BodiesUrban Building SitesUnused LandVillagesOther Building Sites
Agricultural land0−21.57−0.697.3819.371.5749.786.16
Woodland002.522.7111.90−1.1013.232.62
Grassland000−0.07−0.030.000.930.00
Water bodies00000.08−0.790.040.01
Urban building sites00000−0.25−7.19−1.39
Unused land000000−0.050.00
Villages00000001.22
Other building sites00000000
Table 8. Net land use transfer matrix between [10, Max] km buffer zone in Dalian.
Agricultural LandWoodlandGrasslandWater BodiesUrban Building SitesUnused LandVillagesOther Building Sites
Agricultural land0−188.08−23.1019.1613.932.1088.478.65
Woodland00−12.757.256.311.6158.283.29
Grassland0001.79−0.090.028.57−0.14
Water bodies00000.001.341.700.54
Urban building sites000000.00−7.180.01
Unused land000000−0.110.00
Villages00000000.48
Other building sites00000000
Table 9. Maximum direction of net land use transfer by administrative districts in Dalian.
[0, 2.5] km[2.5, 5] km[5, 10] km[10, Max] km
Dalian City DistrictAgricultural land → UrbanAgricultural land → UrbanAgricultural land → Urban
Jinzhou DistrictWater bodies → Urban
Water bodies → Port
Agricultural land → UrbanAgricultural land → VillageWoodland → Agricultural land
Lushunkou DistrictAgricultural land → Urban
Agricultural land → Village
Agricultural land → Urban
Agricultural land → Village
Woodland → Agricultural land
Pulandian DistrictWater bodies →UrbanAgricultural land → VillageAgricultural land → VillageWoodland → Agricultural land
Wafangdian CityWater bodies → PortAgricultural land → UrbanWoodland → VillageWoodland → Agricultural land
Zhuanghe CityAgricultural land → VillageAgricultural land → VillageAgricultural land → VillageWoodland → Agricultural land
Table 10. Changes in the balance of the land use structure of the administrative units in Dalian.
Administrative Units20002015
[0, 2.5][2.5, 5][5, 10][10, Max][0, 2.5][2.5, 5][5, 10][10, Max]
Dalian City District0.580.330.260.000.530.320.280.01
Jinzhou District0.440.290.310.180.470.310.340.19
Lushunkou District0.450.300.230.000.550.350.250.00
Pulandian District0.140.130.200.470.140.130.210.47
Wafangdian City0.270.170.210.450.300.180.210.48
Zhuanghe City0.180.130.180.470.180.130.190.48
Publisher’s Note: MDPI stays neutral with regard to jurisdictional claims in published maps and institutional affiliations.

