
Past and Future Land Use/Land Cover Changes in the Ethiopian Fincha Sub-Basin


Abstract
:1. Introduction
2. Materials and Methods
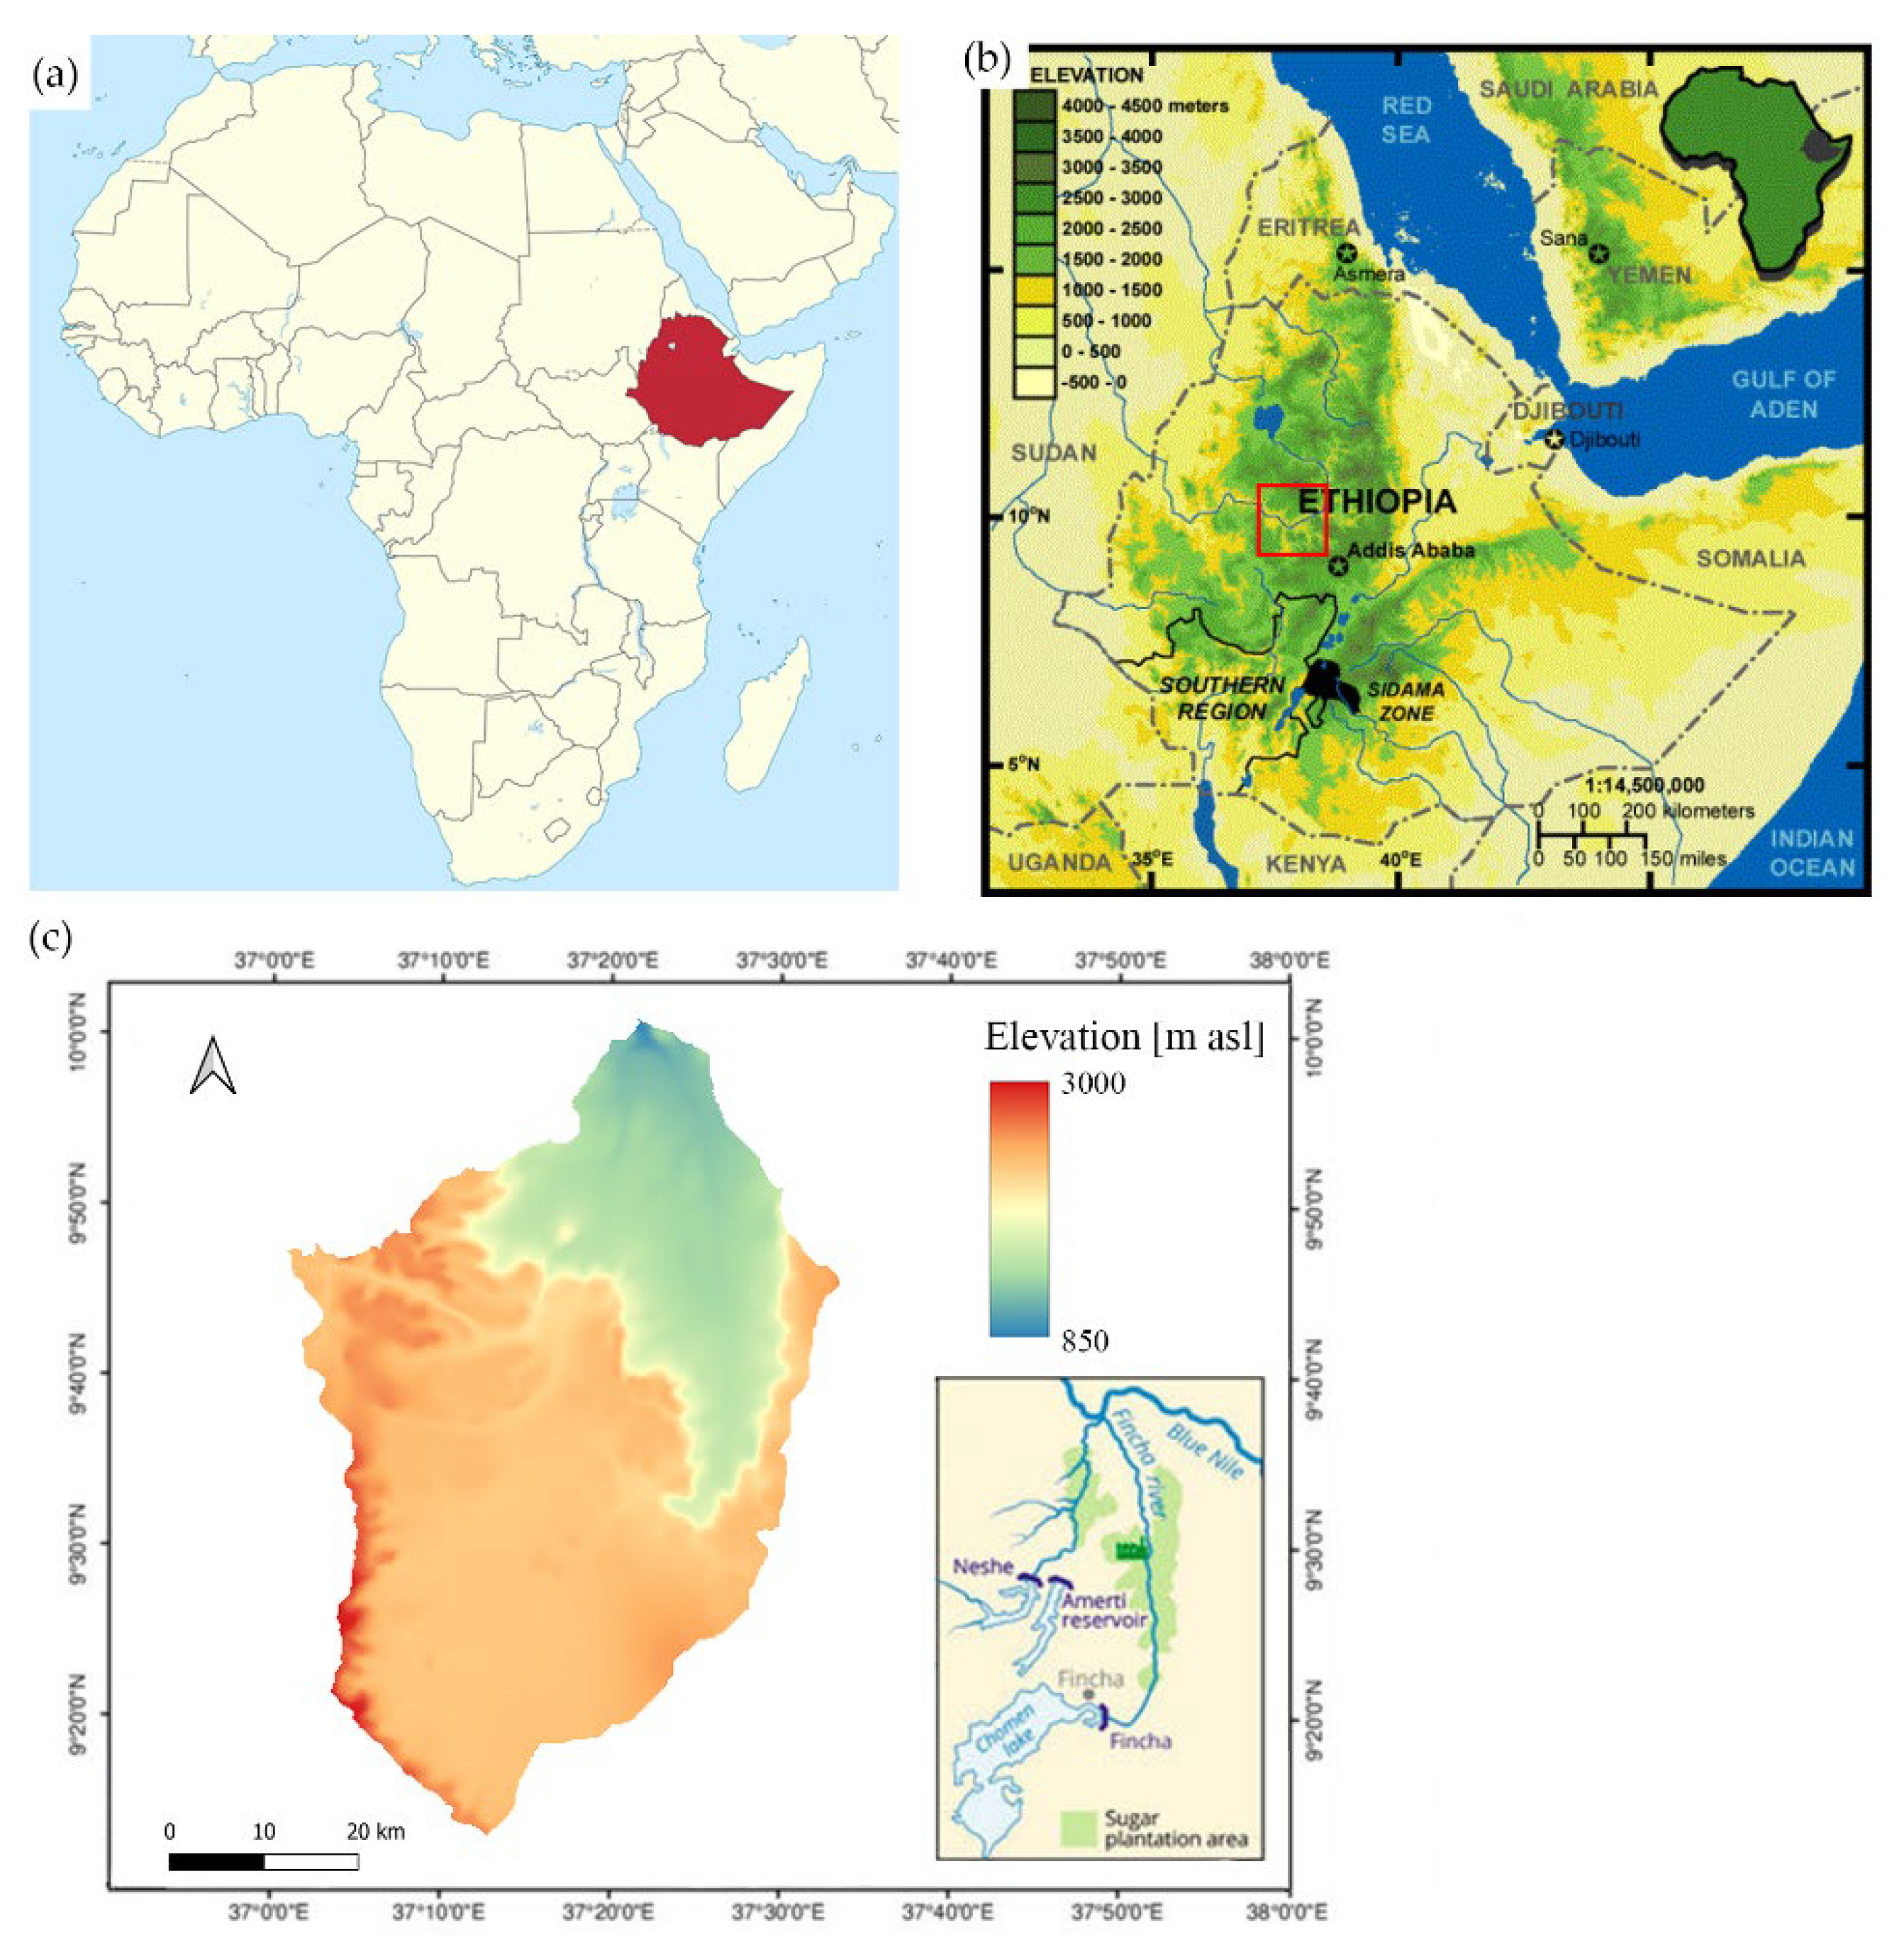
2.1. Study Area
2.2. Dataset
2.3. Land Use Land Cover Classification of Historical Data
2.4. Prediction of Future LULC and Associated Driving Forces
2.5. LULC Detection
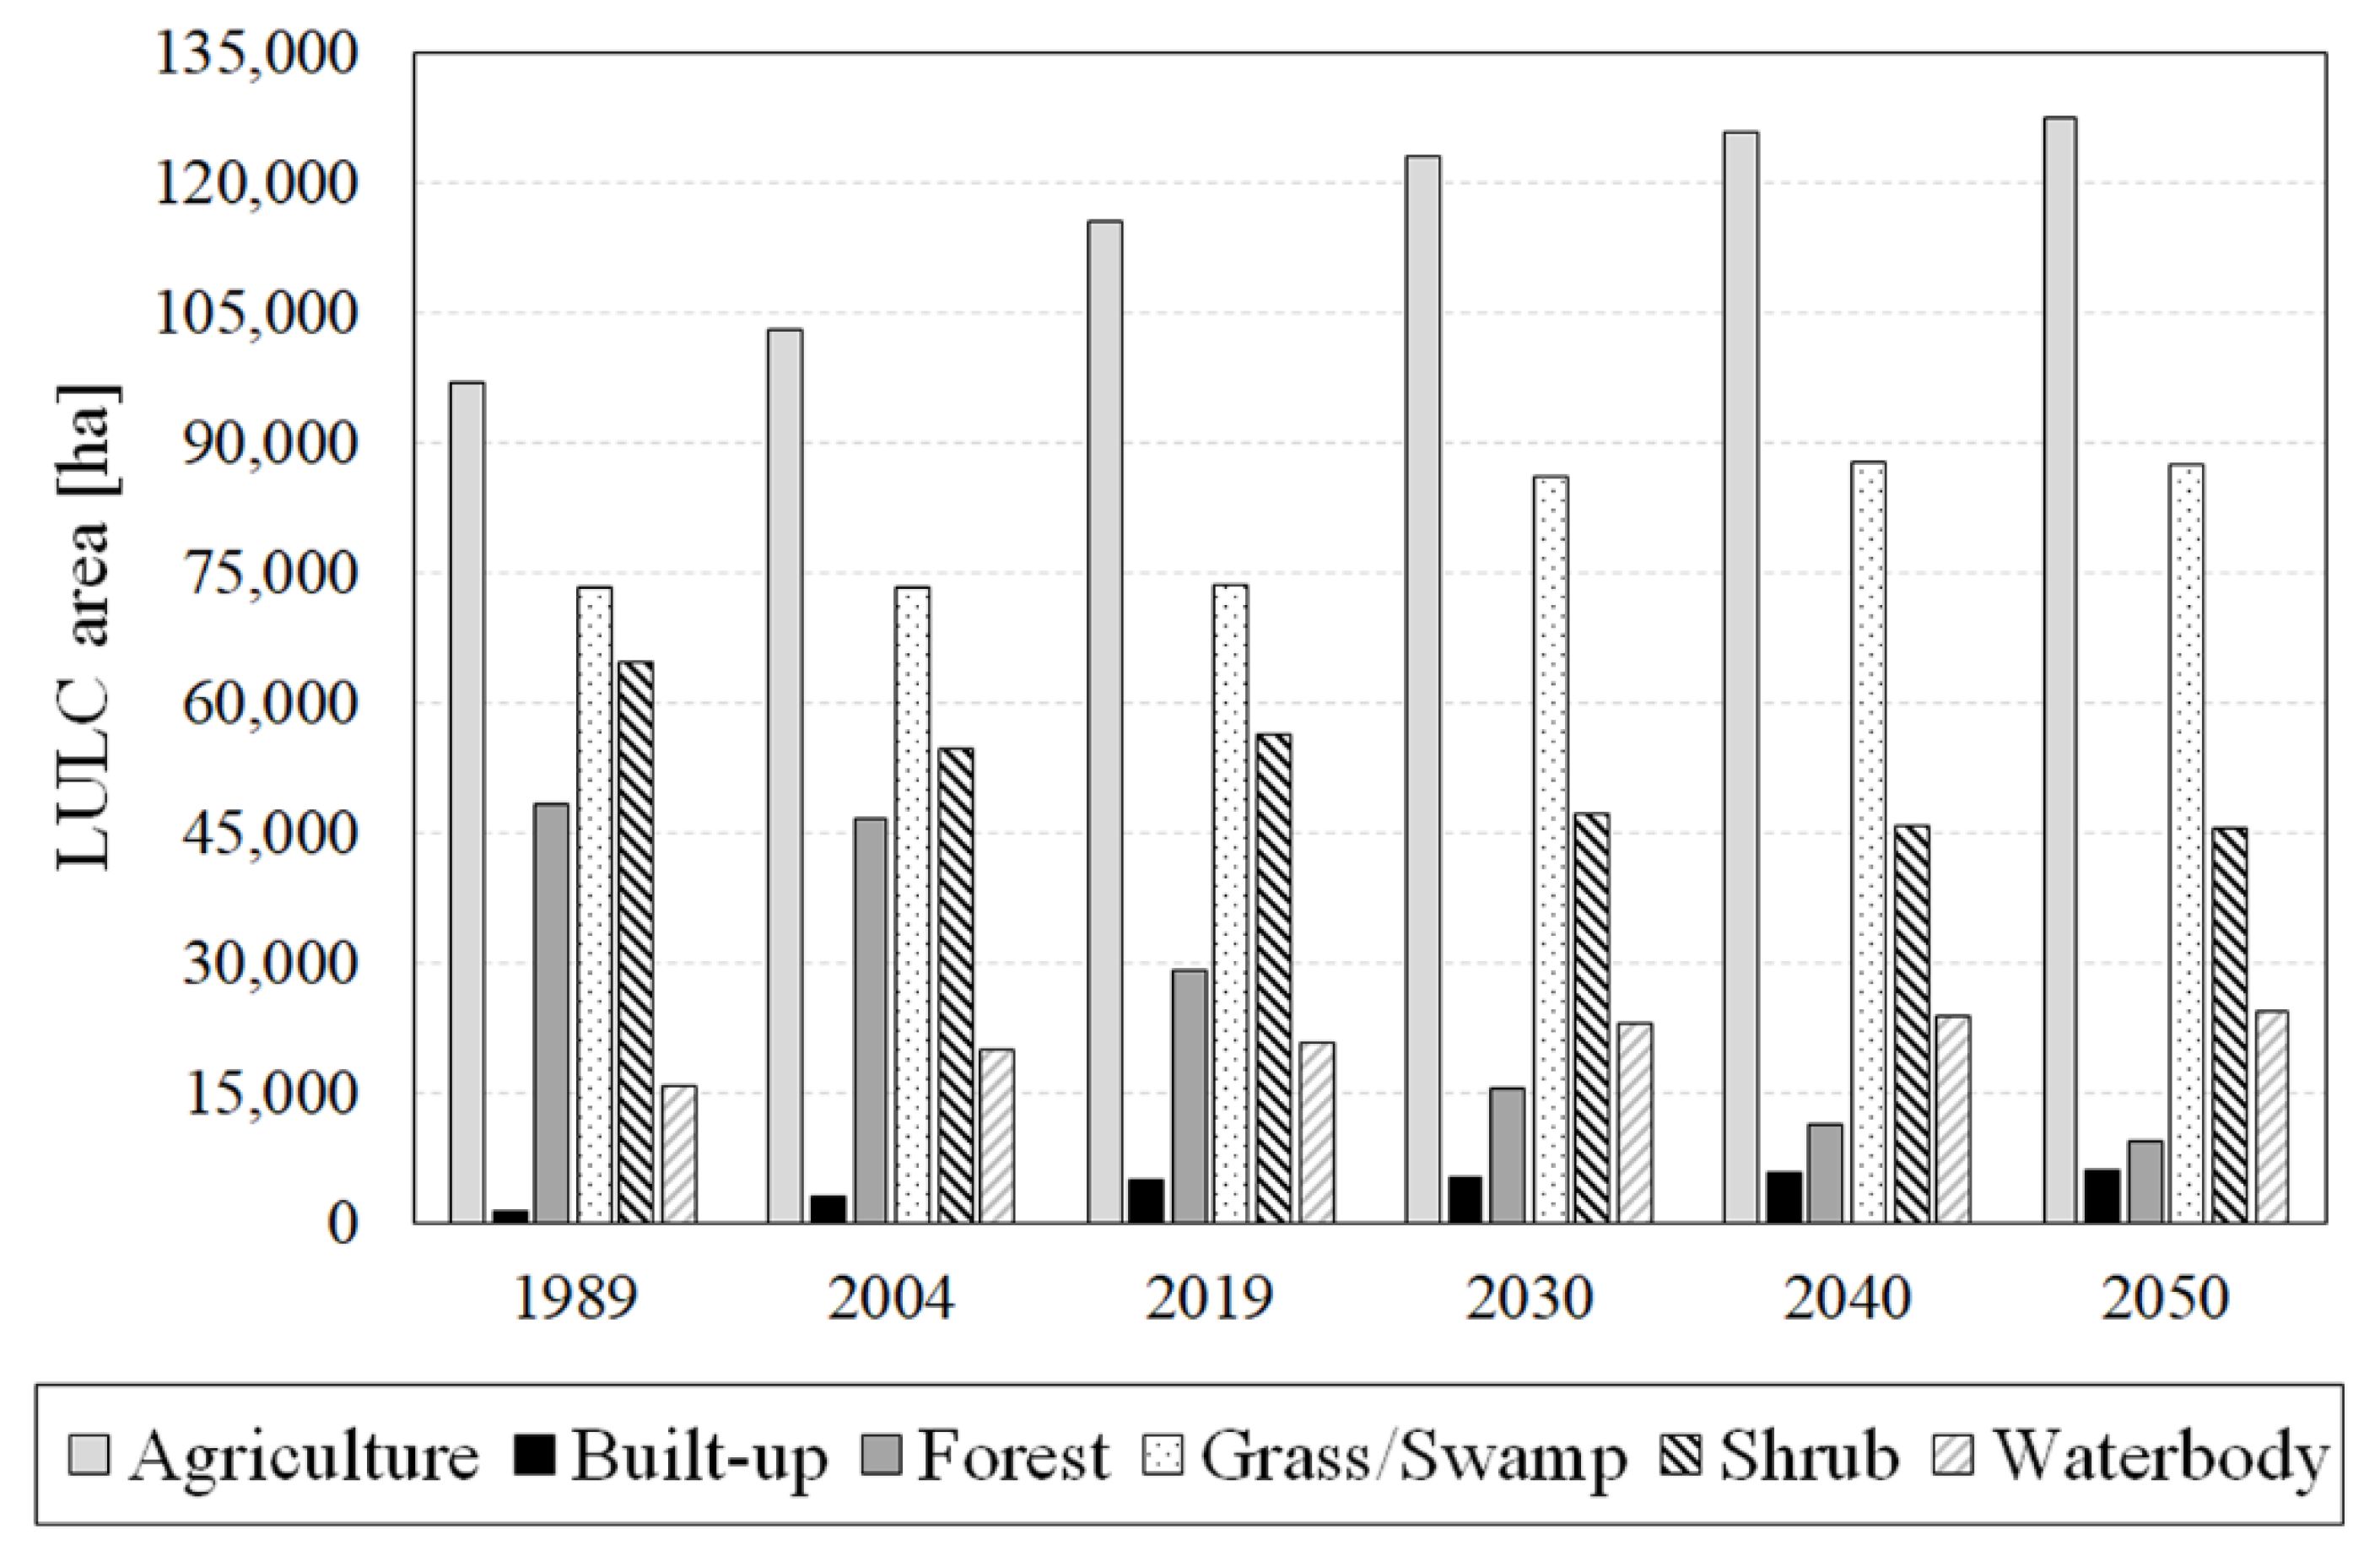
3. Results
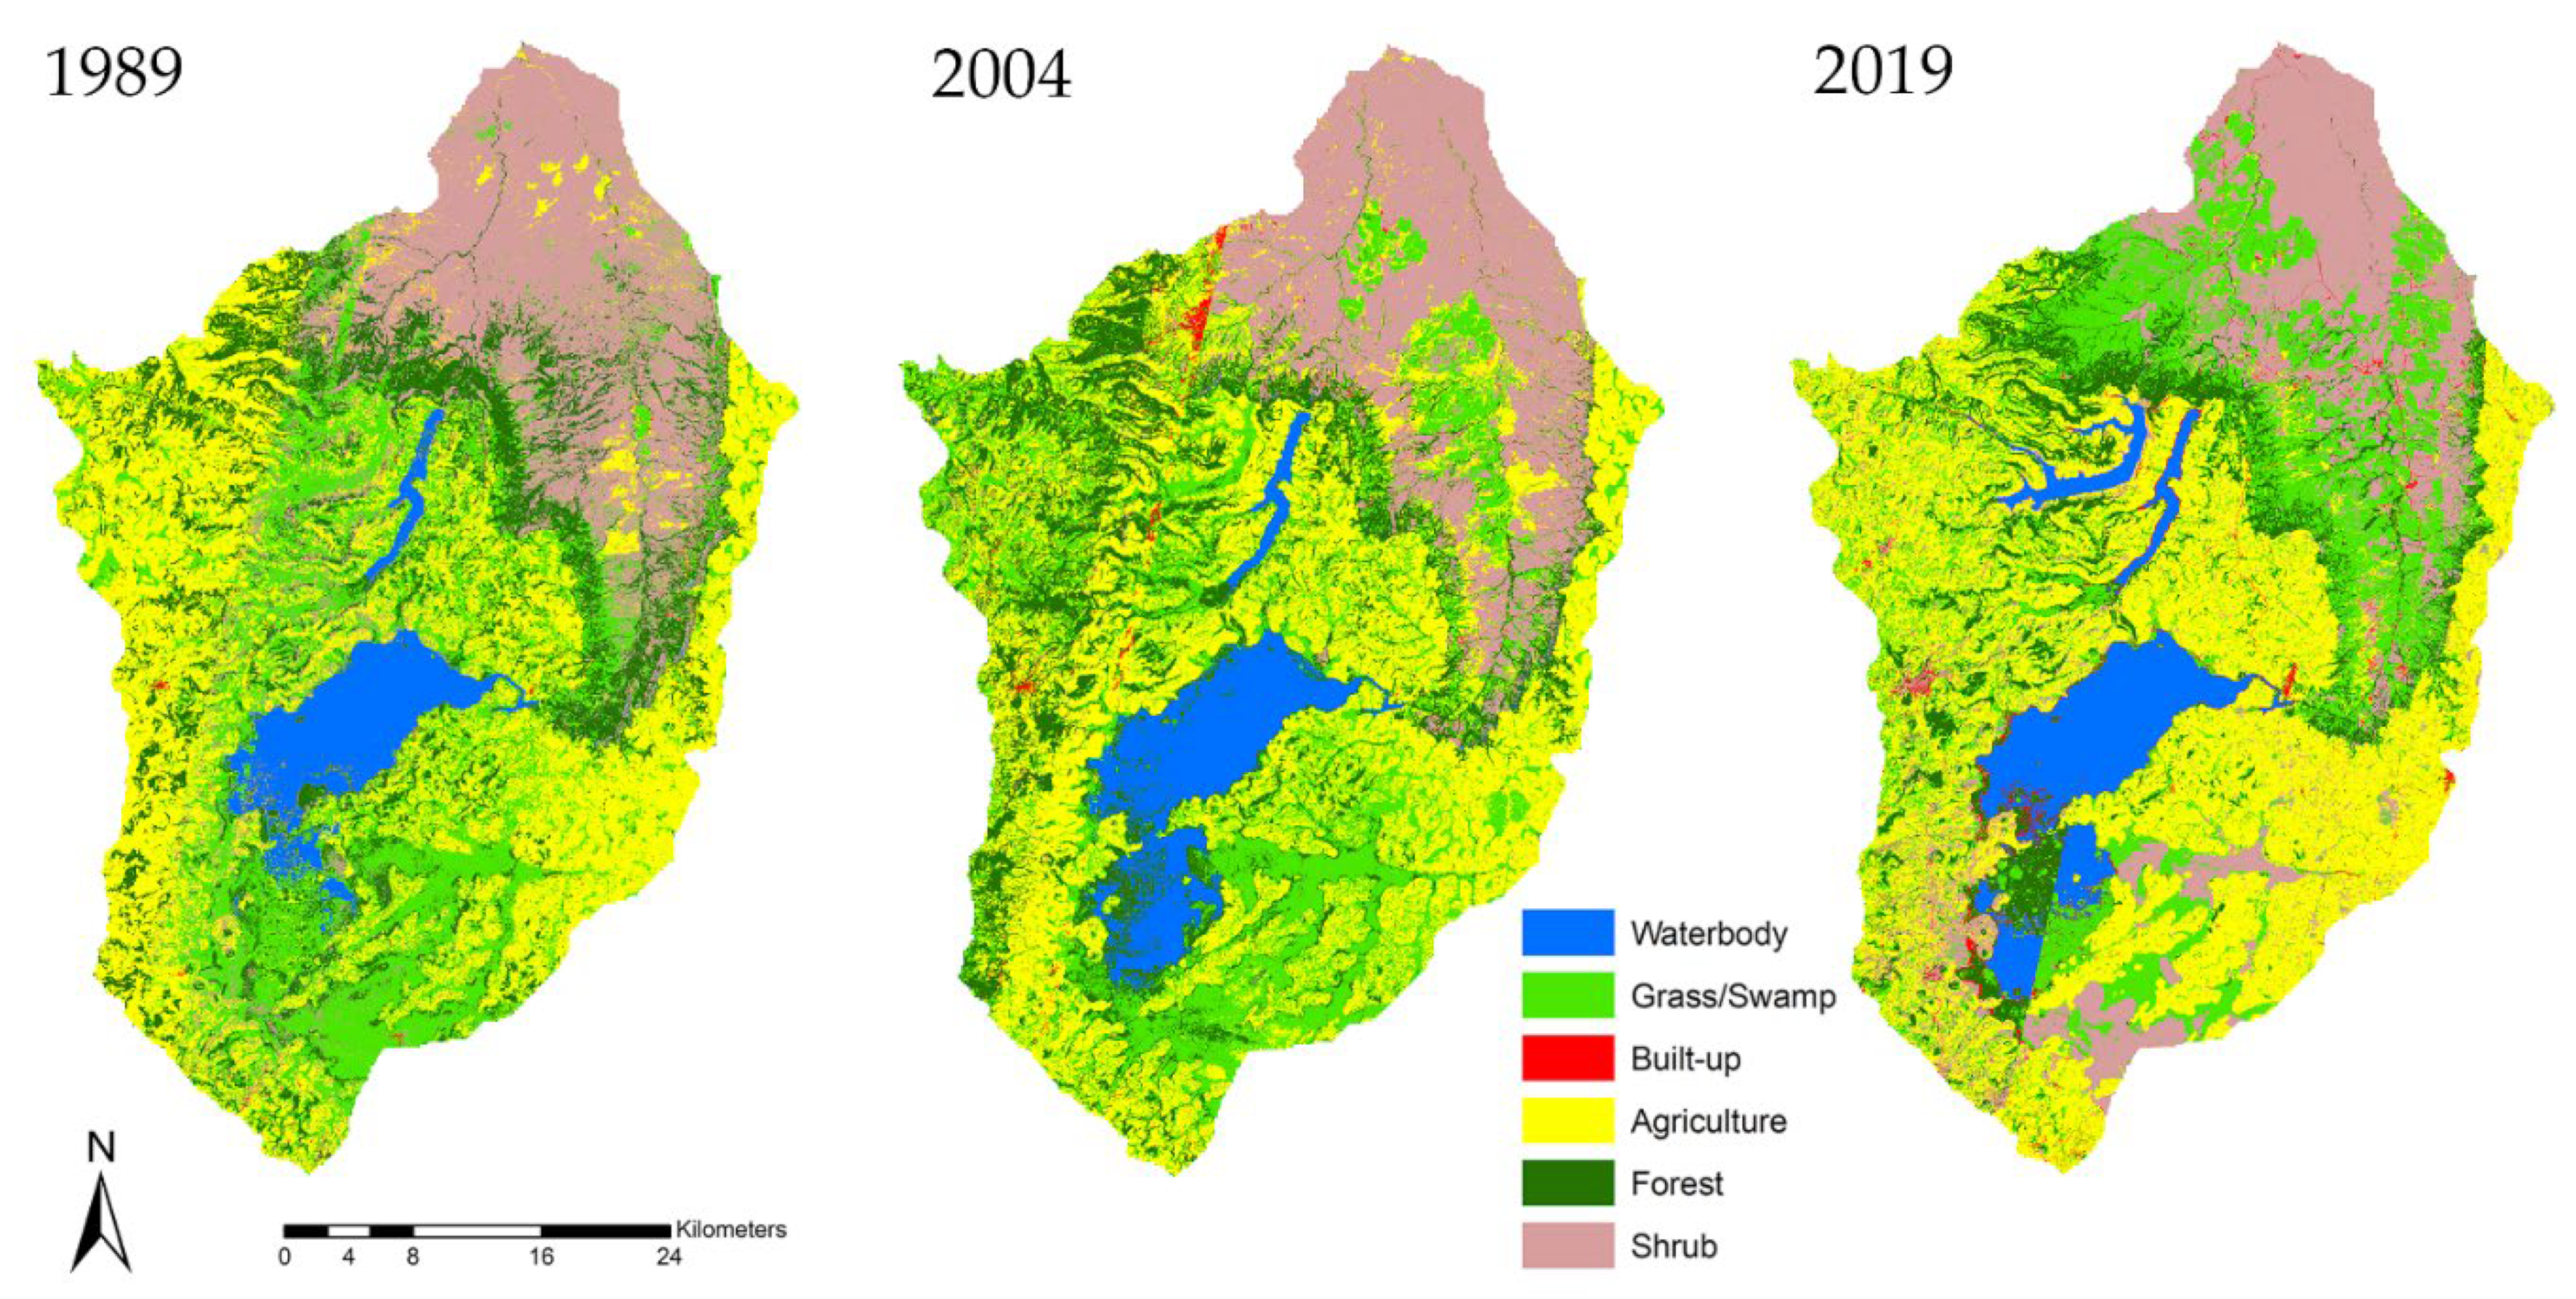
3.1. Historical LULC Maps
3.2. Accuracy Assessment for Historical LULC
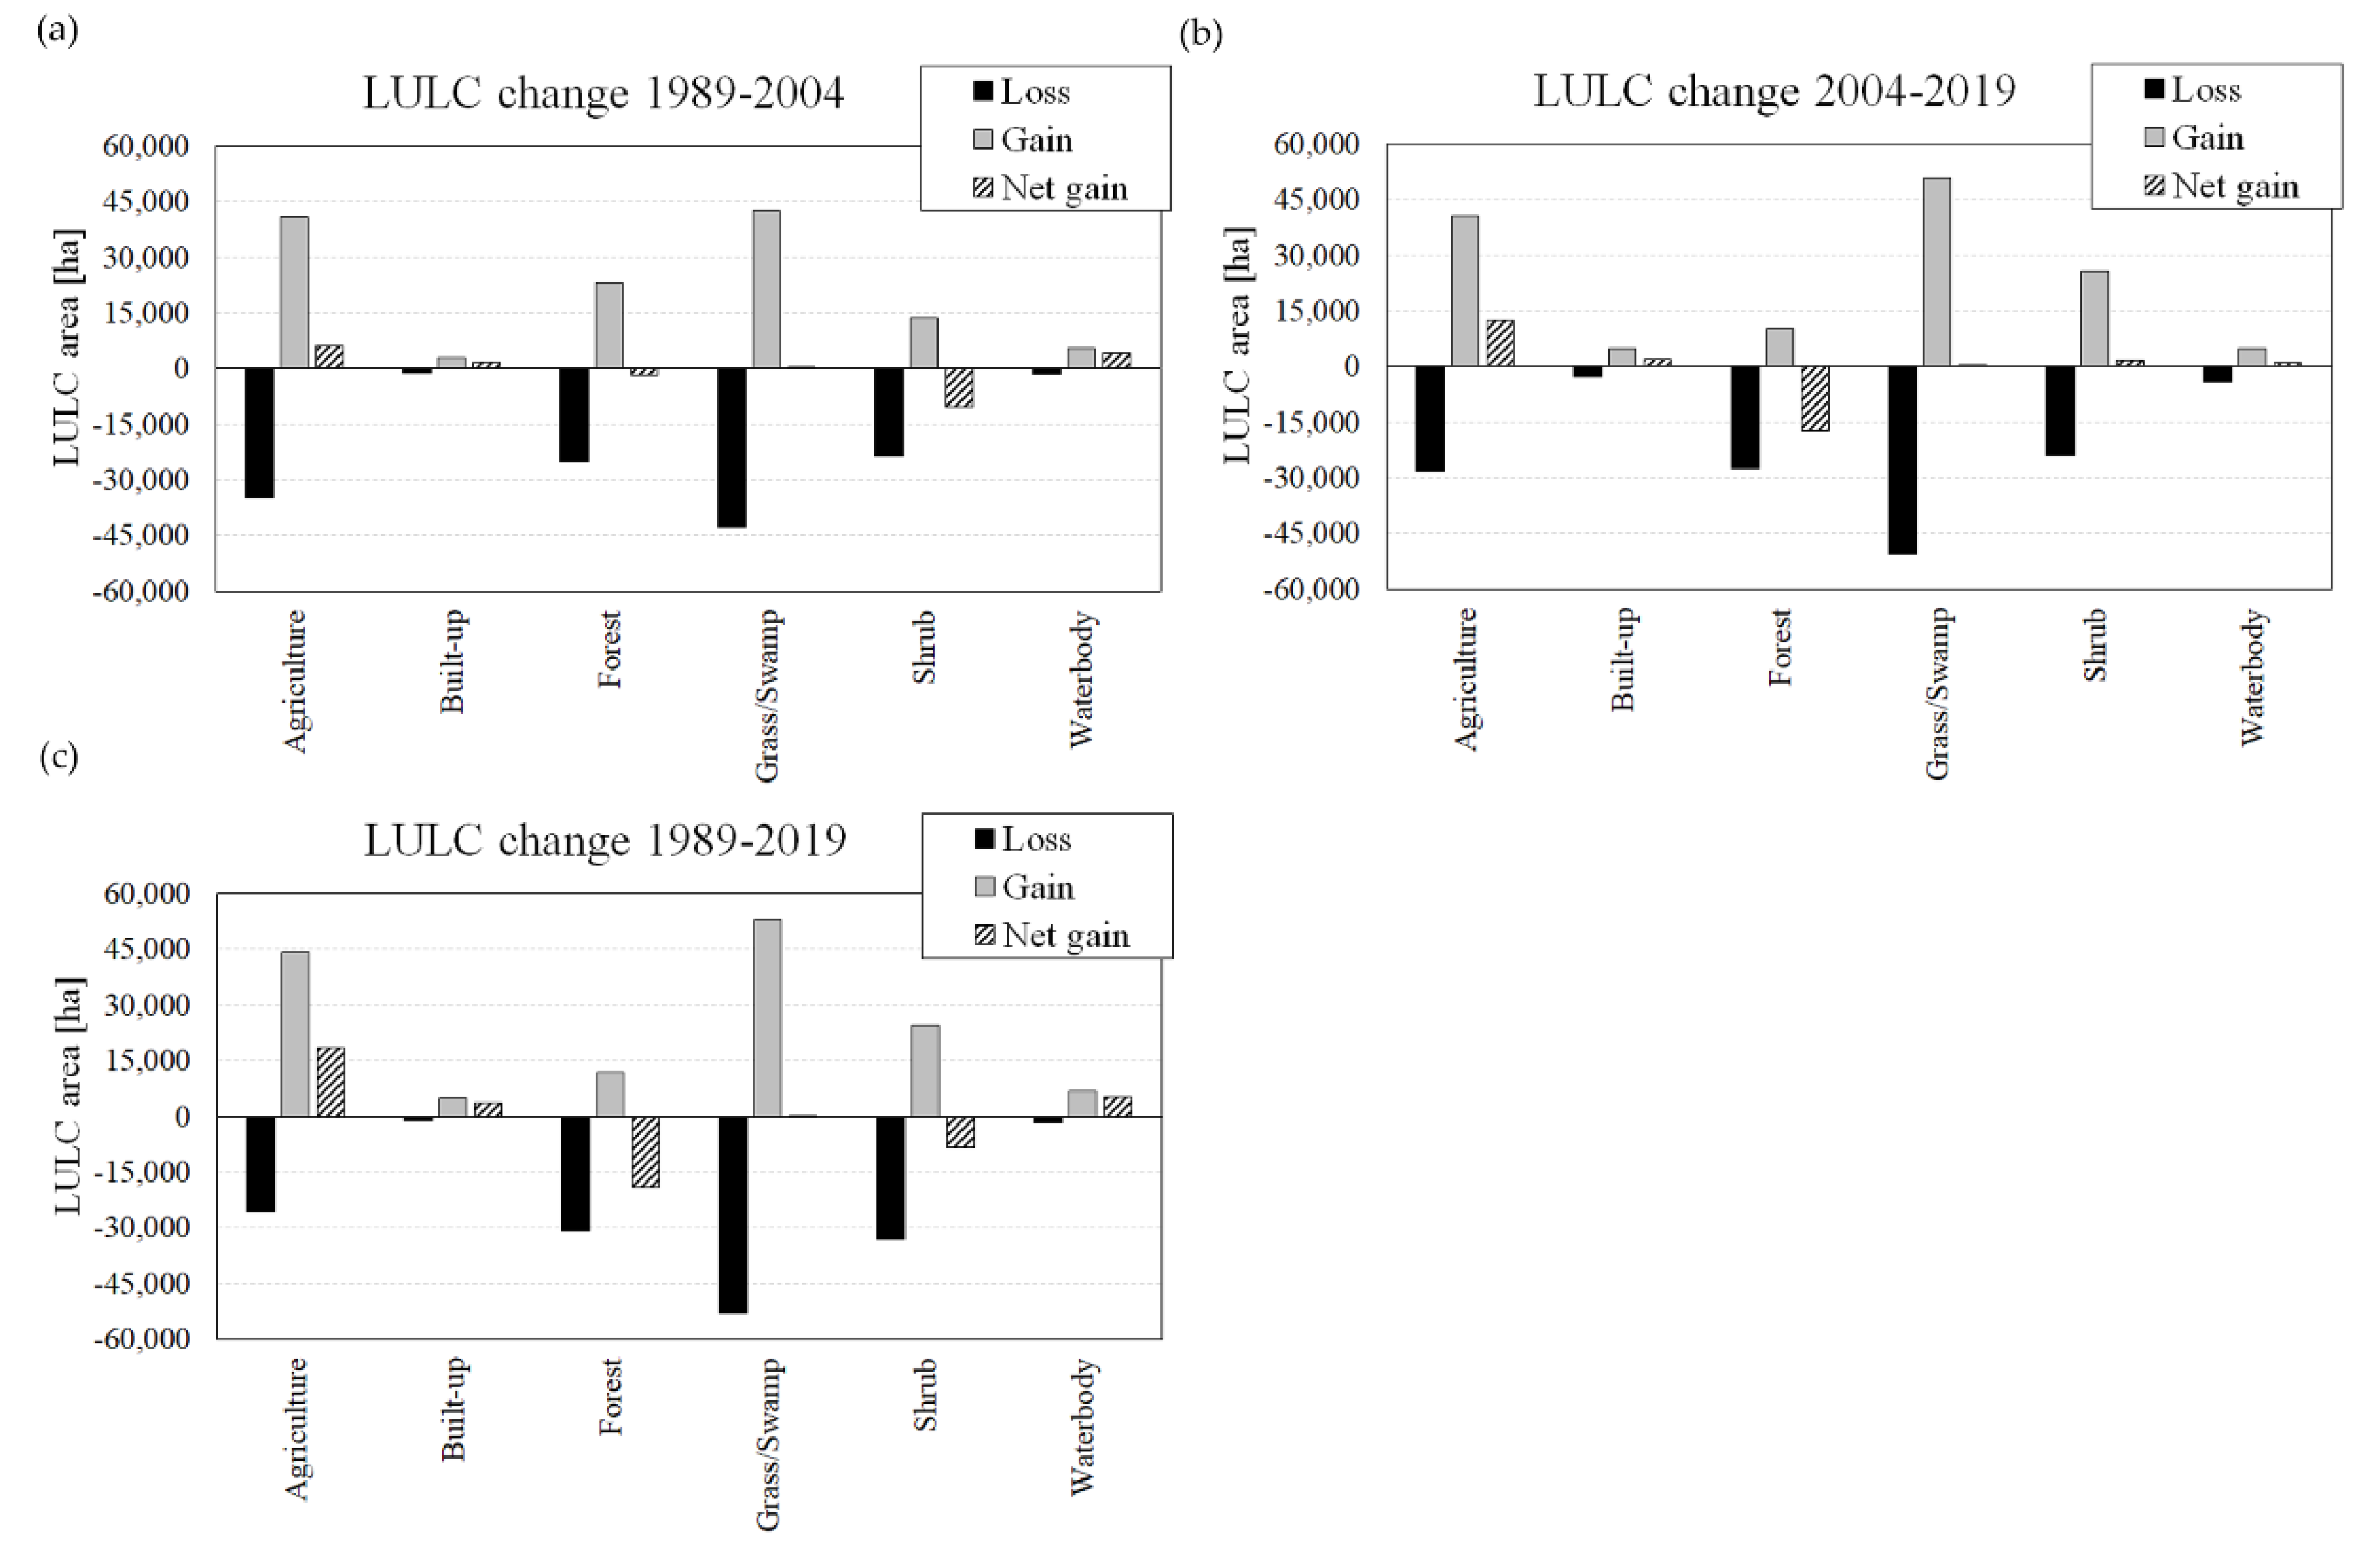
3.3. Historical LULC Changes and Transition Probability Matrix
3.4. Model Validation
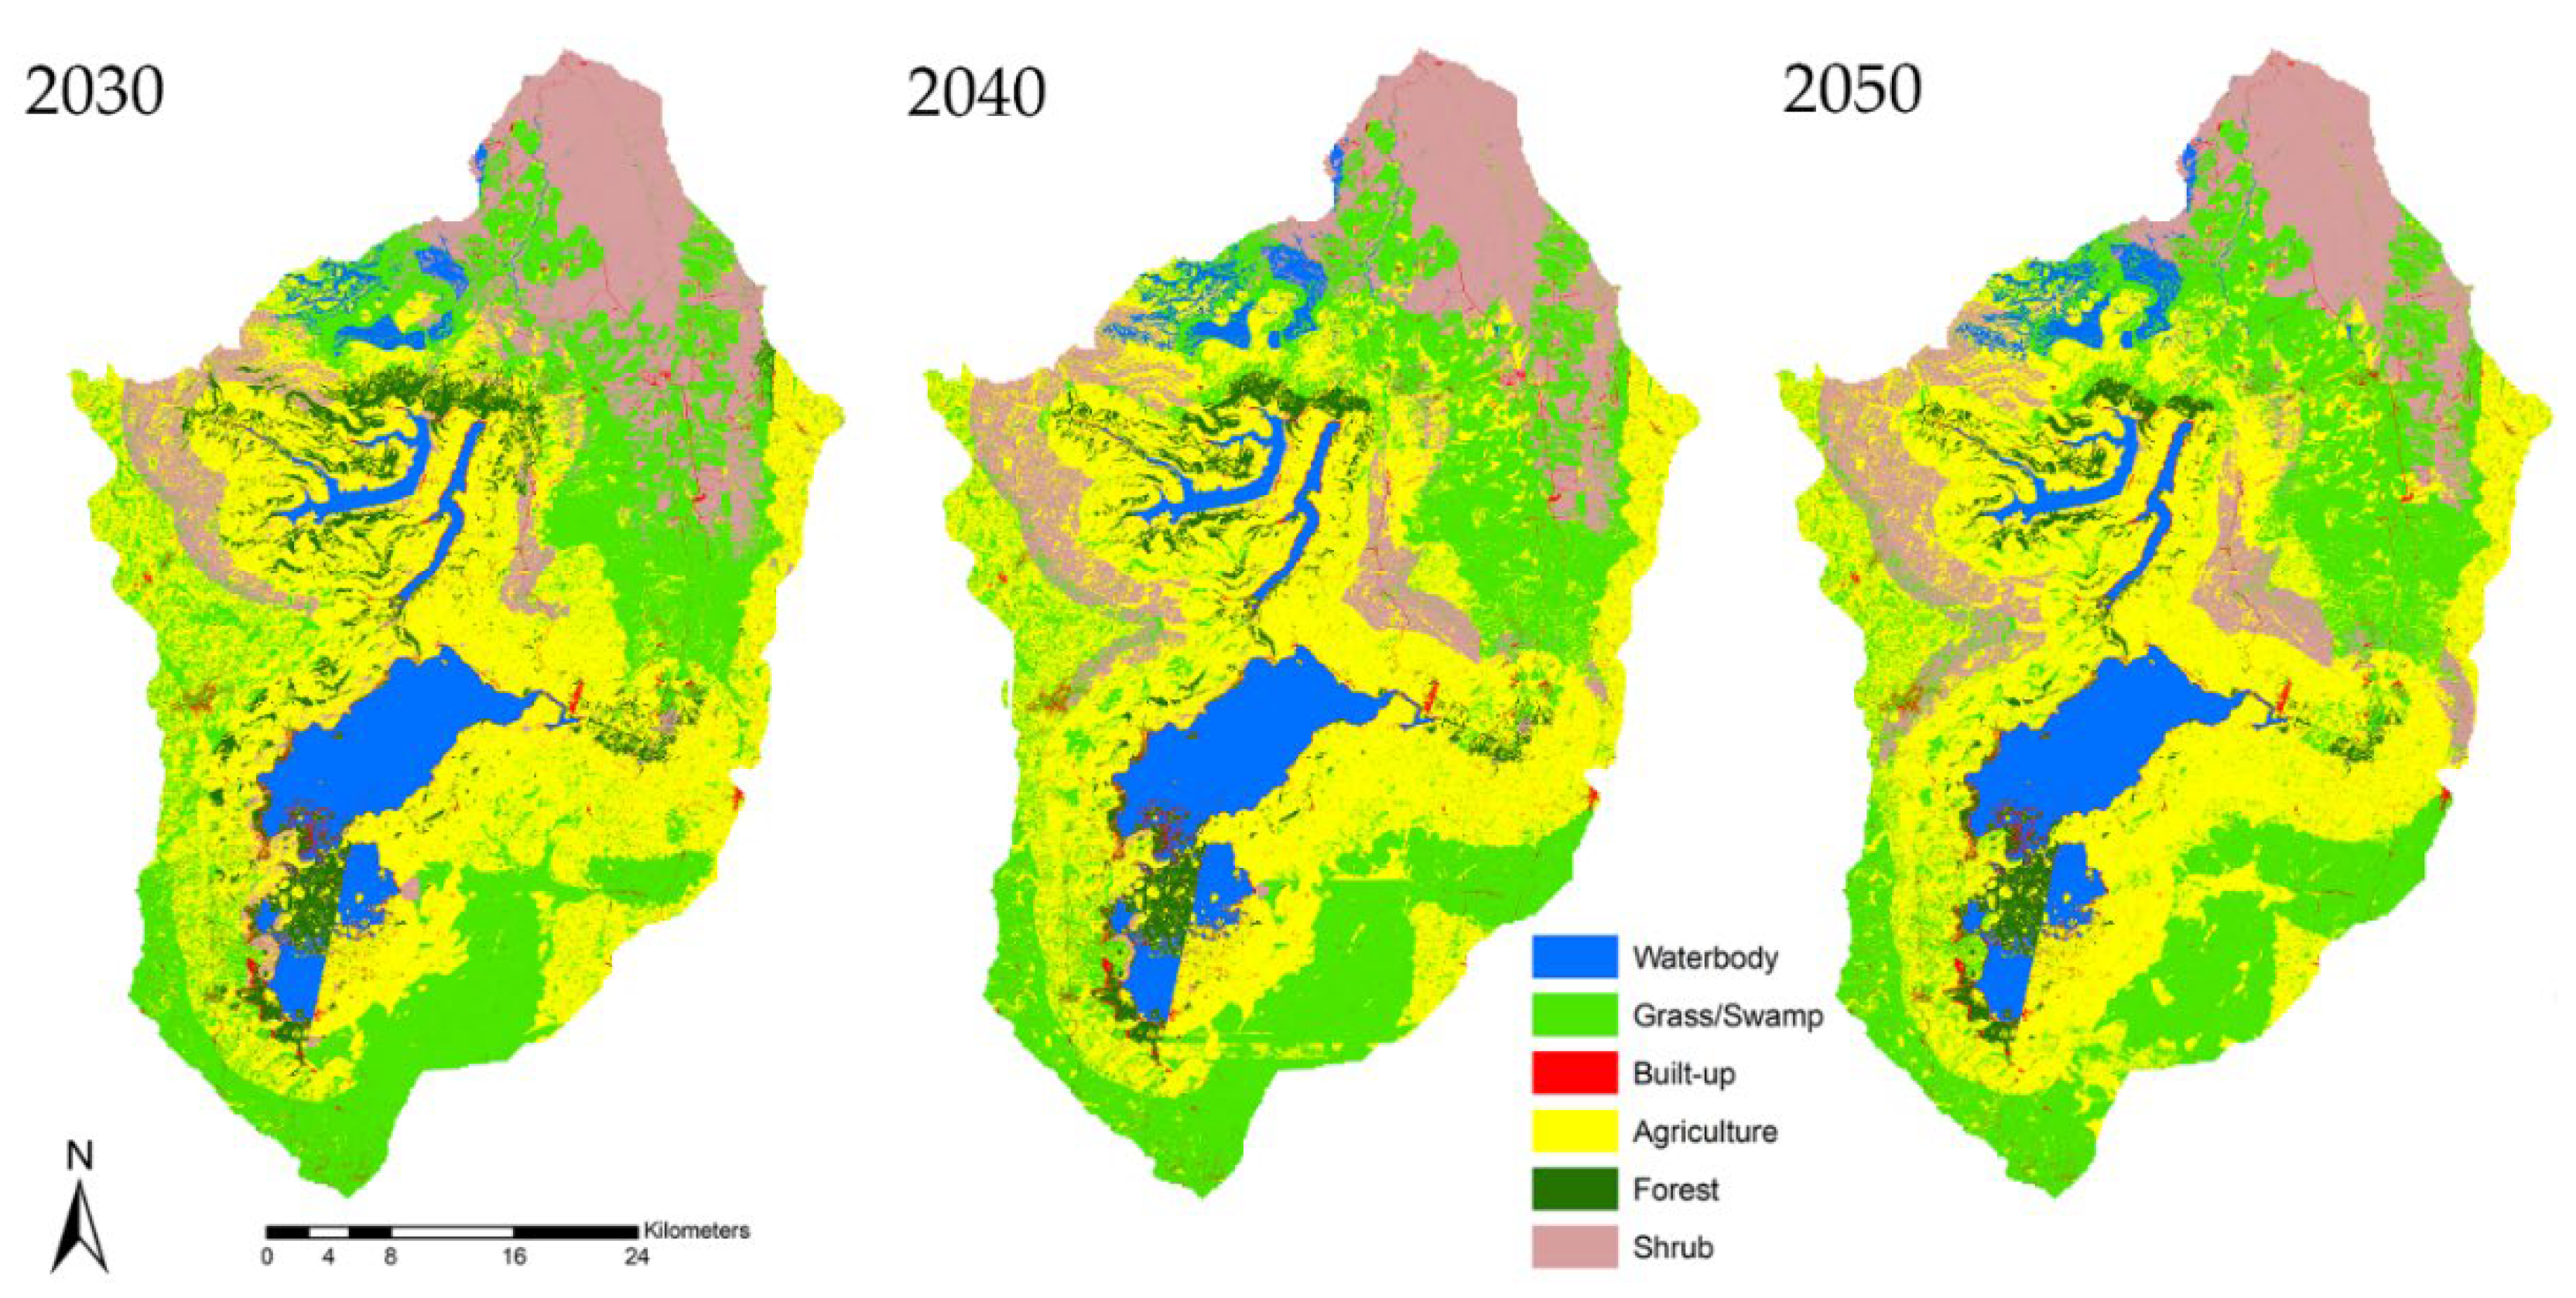
3.5. Future LULC
4. Discussion and Policy Implications
5. Conclusions
Author Contributions
Funding
Institutional Review Board Statement
Informed Consent Statement
Data Availability Statement
Acknowledgments
Conflicts of Interest
Appendix A. Accuracy Assessment of Historical LULC

| LULC Class | Waterbody | Grass/Swamp | Built-Up | Agriculture | Forest | Shrub | Total | Users Accuracy [%] |
|---|---|---|---|---|---|---|---|---|
| Waterbody | 26 | 3 | 0 | 0 | 0 | 0 | 29 | 89.66 |
| Grass/swamp | 1 | 43 | 1 | 3 | 2 | 50 | 86.00 | |
| Built-up | 0 | 1 | 22 | 2 | 1 | 0 | 26 | 84.62 |
| Agriculture | 0 | 7 | 3 | 43 | 2 | 3 | 58 | 74.14 |
| Forest | 0 | 0 | 0 | 1 | 36 | 4 | 41 | 87.80 |
| Shrub | 1 | 2 | 0 | 3 | 3 | 37 | 46 | 80.43 |
| Total | 28 | 56 | 26 | 52 | 42 | 46 | 250 | |
| Producer’s accuracy | 92.86 | 76.78 | 84.61 | 82.69 | 85.71 | 80.43 | 82.80 |
| LULC Class | Waterbody | Grass/Swamp | Built-Up | Agriculture | Forest | Shrub | Total | Users Accuracy [%] |
|---|---|---|---|---|---|---|---|---|
| Waterbody | 33 | 3 | 0 | 0 | 0 | 0 | 36 | 91.67 |
| Grass/swamp | 0 | 53 | 1 | 6 | 0 | 3 | 63 | 84.13 |
| Built-up | 0 | 2 | 26 | 1 | 1 | 0 | 30 | 86.67 |
| Agriculture | 0 | 7 | 3 | 61 | 1 | 3 | 75 | 81.33 |
| Forest | 0 | 1 | 0 | 0 | 44 | 2 | 47 | 93.62 |
| Shrub | 1 | 4 | 1 | 1 | 3 | 44 | 54 | 81.48 |
| Total | 34 | 70 | 31 | 69 | 49 | 52 | 305 | |
| Producer’s accuracy | 97.06 | 75.14 | 83.87 | 88.41 | 89.80 | 84.62 | 85.57 |
| LULC Class | Waterbody | Grass/Swamp | Built-Up | Agriculture | Forest | Shrub | Total | Users Accuracy [%] |
|---|---|---|---|---|---|---|---|---|
| Waterbody | 34 | 3 | 0 | 0 | 3 | 0 | 40 | 85 |
| Grass/swamp | 2 | 63 | 0 | 4 | 0 | 3 | 72 | 87.5 |
| Built-up | 0 | 0 | 34 | 1 | 1 | 1 | 37 | 91.89 |
| Agriculture | 0 | 2 | 1 | 76 | 0 | 1 | 80 | 95 |
| Forest | 0 | 1 | 0 | 0 | 50 | 3 | 54 | 92.59 |
| Shrub | 0 | 4 | 0 | 3 | 2 | 52 | 61 | 85.25 |
| Total | 36 | 73 | 35 | 84 | 56 | 60 | 344 | |
| Producer’s accuracy | 94.44 | 86.30 | 97.14 | 90.45 | 89.29 | 86.67 | 89.82 |
Appendix B. Transition Matrixes Historical LULC
| Land Class | 2004 | Total | Percentage of Stability (%) | ||||||
|---|---|---|---|---|---|---|---|---|---|
| Agriculture | Built-Up | Forest | Grass/Swamp | Shrub | Waterbody | ||||
| 1989 | Agriculture | 62,112.6 | 607.9 | 9025.1 | 21,434.4 | 3434.4 | 352.4 | 96,966.7 | 64.5 |
| Built-up | 514.5 | 704.0 | 184.2 | 258.0 | 220.0 | 5.0 | 1252.0 | 56.0 | |
| Forest | 6325.0 | 875.4 | 23,355.9 | 11,338.0 | 4857.3 | 1621.6 | 48,373.2 | 48.3 | |
| Grass/Swamp | 24,120.9 | 412.2 | 10,034.8 | 30,765.4 | 5016.3 | 3021.9 | 73,371.3 | 41.9 | |
| Shrub | 9956.4 | 972.9 | 2872.0 | 9370.6 | 41,011.7 | 606.6 | 64,790.1 | 63.3 | |
| Waterbody | 3.8 | 6.7 | 1097.3 | 257.3 | 58.2 | 14,320.8 | 15,744.1 | 91.0 | |
| Total | 103,033.1 | 2945.4 | 46,569.3 | 73,423.6 | 54,597.8 | 19,928.2 | 300,497.3 | ||
| Land Class | 2019 | Total | Percentage of Stability (%) | ||||||
|---|---|---|---|---|---|---|---|---|---|
| Agriculture | Built-Up | Forest | Grass/Swamp | Shrub | Waterbody | ||||
| 2004 | Agriculture | 74,841.6 | 1627.9 | 1405.5 | 14511.7 | 10,274.4 | 373.1 | 103,034.3 | 72.6 |
| Built-up | 350.0 | 1024.0 | 720.3 | 1208.1 | 554.4 | 10.2 | 2945.4 | 34.8 | |
| Forest | 7476.7 | 1034.5 | 19,066.9 | 14,450.5 | 2202.5 | 2338.2 | 46,569.2 | 40.9 | |
| Grass/Swamp | 30,227.2 | 979.7 | 4619.3 | 22,820.6 | 12,648.9 | 2128.0 | 73,423.5 | 31.1 | |
| Shrub | 2540.9 | 645.2 | 1776.3 | 19,004.0 | 30,591.5 | 39.82 | 54,597.7 | 56.0 | |
| Waterbody | 10.6 | 618.0 | 1625.6 | 1575.7 | 126.0 | 15,972.2 | 19,928.2 | 80.1 | |
| Total | 115,447.0 | 5007.8 | 29,213.9 | 73,570.5 | 56,397.6 | 20,861.5 | 300,498.3 | ||
| Land Class | 2019 | Total | Percentage of Stability (%) | ||||||
|---|---|---|---|---|---|---|---|---|---|
| Agriculture | Built-Up | Forest | Grass/Swamp | Shrub | Waterbody | ||||
| 1989 | Agriculture | 71,320.09 | 1517.76 | 1965.61 | 13,597.53 | 8041.16 | 528.00 | 78.2 | |
| Built-up | 422.17 | 77.11 | 108.22 | 314.58 | 322.98 | 6.92 | 1251.98 | 95.7 | |
| Forest | 7954.91 | 801.46 | 17,400.68 | 16,309.28 | 4393.61 | 1513.61 | 48,373.55 | 52.6 | |
| Grass/Swamp | 30,733.54 | 1185.15 | 5318.34 | 20,417.33 | 11,716.12 | 4002.57 | 73,373.05 | 57.9 | |
| Shrub | 4998.46 | 954.23 | 3678.88 | 22,463.67 | 31,882.18 | 816.55 | 64,793.97 | 65.8 | |
| Waterbody | 21.35 | 472.00 | 742.95 | 470.60 | 43.29 | 13993.88 | 15744.07 | 100.0 | |
| Total | 115,450.52 | 5007.71 | 29,214.66 | 73,572.99 | 56,399.35 | 20,861.54 | 300,506.76 | ||
Appendix C. Transition Matrices for Future LULC
| Land Class | 2030 | Total | Percentage of Stability (%) | ||||||
|---|---|---|---|---|---|---|---|---|---|
| Agriculture | Built-Up | Forest | Grass/Swamp | Shrub | Waterbody | ||||
| 2019 | Agriculture | 90,279.1 | 52.3 | 35.3 | 15,280.6 | 9798.9 | 0.0 | 115,446.2 | 78.2 |
| Built-up | 95.3 | 4789.8 | 0.00 | 120.9 | 1.7 | 0.0 | 5007.8 | 95.7 | |
| Forest | 3154.1 | 3.26 | 15,357.8 | 9425.6 | 44.7 | 1228.6 | 29,214.1 | 52.6 | |
| Grass/Swamp | 29,051.8 | 508.2 | 233.7 | 42,631.3 | 171.8 | 972.6 | 73,569.3 | 57.9 | |
| Shrub | 588.9 | 13.1 | 2.0 | 18,701.0 | 37,093.0 | 3.3 | 56,401.1 | 65.8 | |
| Waterbody | 0.00 | 0.00 | 0.00 | 0.00 | 0.00 | 20,861.5 | 20,861.5 | 100.0 | |
| Total | 123,169.2 | 5366.6 | 15,628.8 | 86,159.5 | 47,110.0 | 23,066.0 | 300,499.9 | ||
| Land Class | 2040 | Total | Percentage of Stability (%) | ||||||
|---|---|---|---|---|---|---|---|---|---|
| Agriculture | Built-Up | Forest | Grass/Swamp | Shrub | Waterbody | ||||
| 2030 | Agriculture | 110,334.9 | 22.5 | 19.2 | 6339.8 | 6268.9 | 183.9 | 123,169.2 | 89.6 |
| Built-up | 47.8 | 5268.5 | 0.0 | 39.6 | 10.6 | 0.2 | 5366.6 | 98.2 | |
| Forest | 830.1 | 0.6 | 11,219.3 | 3565.6 | 8.6 | 4.6 | 15,628.8 | 71.8 | |
| Grass/Swamp | 10986.0 | 467.1 | 3.6 | 73,678.3 | 186.5 | 838.0 | 86,159.5 | 85.5 | |
| Shrub | 3530.6 | 28.5 | 11.8 | 4195.6 | 39,320.3 | 23.2 | 47,110.0 | 83.5 | |
| Waterbody | 234.9 | 0.0 | 0.0 | 13.1 | 5.5 | 22,812.5 | 23,066.0 | 98.9 | |
| Total | 125,964.28 | 5787.3 | 11,253.9 | 87,832.0 | 45,800.2 | 23,862.3 | 300,499.9 | ||
| Land Class | 2050 | Total | Percentage of Stability (%) | ||||||
|---|---|---|---|---|---|---|---|---|---|
| Agriculture | Built-Up | Forest | Grass/Swamp | Shrub | Waterbody | ||||
| 2040 | Agriculture | 118,408.7 | 17.5 | 10.8 | 3481.5 | 3838.9 | 207.0 | 125,964.3 | 94.0 |
| Built-up | 28.2 | 5722.2 | 0.0 | 33.8 | 2.8 | 0.3 | 5787.3 | 98.9 | |
| Forest | 42.8 | 0.2 | 9430.3 | 1780.3 | 0.4 | 0.0 | 11,253.9 | 83.8 | |
| Grass/Swamp | 8347.1 | 242.7 | 2.4 | 78,766.4 | 53.6 | 419.7 | 87,832.0 | 89.7 | |
| Shrub | 746.2 | 9.2 | 2.1 | 3521.6 | 41,509.3 | 11.9 | 45,800.2 | 90.6 | |
| Waterbody | 10.3 | 0.0 | 0.0 | 12.9 | 2.4 | 23,836.6 | 23,862.3 | 99.9 | |
| Total | 127,583.3 | 5991.8 | 9445.5 | 87,596.5 | 45,407.4 | 24,475.4 | 300,499.9 | ||
References
- Alam, A.; Bhat, M.S.; Maheen, M. Using Landsat satellite data for assessing the land use and land cover change in Kashmir valley. GeoJournal 2020, 85, 1529–1543. [Google Scholar] [CrossRef] [Green Version]
- Leta, M.K.; Demissie, T.A.; Tränckner, J. Hydrological Responses of Watershed to Historical and Future Land Use Land Cover Change Dynamics of Nashe Watershed, Ethiopia. Water 2021, 13, 2372. [Google Scholar] [CrossRef]
- Regasa, M.S.; Nones, M.; Adeba, D. A Review on Land Use and Land Cover Change in Ethiopian Basins. Land 2021, 10, 585. [Google Scholar] [CrossRef]
- Tadese, S.; Soromessa, T.; Bekele, T. Analysis of the current and future prediction of land use/land cover Change using remote sensing and the CA-markov model in majang forest biosphere reserves of Gambella, southwestern Ethiopia. Sci. World J. 2021, 2021, 6685045. [Google Scholar] [CrossRef]
- Dwivedi, R.S.; Sreenivas, K.; Ramana, K.V. Cover: Land-use/land-cover change analysis in part of Ethiopia using Landsat Thematic Mapper data. Int. J. Remote Sens. 2005, 26, 1285–1287. [Google Scholar] [CrossRef]
- Demissie, T.A. Land use and land cover change dynamics and its impact on watershed hydrological parameters: The case of Awetu watershed, Ethiopia. J. Sediment. Environ. 2022, 7, 79–94. [Google Scholar] [CrossRef]
- Kenea, U.; Adeba, D.; Regasa, M.S.; Nones, M. Hydrological Responses to Land Use Land Cover Changes in the Fincha’a Watershed, Ethiopia. Land 2021, 10, 916. [Google Scholar] [CrossRef]
- Khan, T.U.; Mannan, A.; Hacker, C.E.; Ahmad, S.; Amir Siddique, M.; Khan, B.U.; Luan, X. Use of GIS and Remote Sensing Data to Understand the Impacts of Land Use/Land Cover Changes (LULCC) on Snow Leopard (Panthera uncia) Habitat in Pakistan. Sustainability 2021, 13, 3590. [Google Scholar] [CrossRef]
- Lambin, E.F.; Rounsevell, M.D.; Geist, H.J. Are agricultural land-use models able to predict changes in land-use intensity? Agric. Ecosyst. Environ. 2000, 82, 321–331. [Google Scholar] [CrossRef]
- Han, H.; Yang, C.; Song, J. Scenario simulation and the prediction of land use and land cover change in Beijing, China. Sustainability 2015, 7, 4260–4279. [Google Scholar] [CrossRef] [Green Version]
- Rahman, M.T.U.; Tabassum, F.; Rasheduzzaman, M.; Saba, H.; Sarkar, L.; Ferdous, J.; Islam, A.Z. Temporal dynamics of land use/land cover change and its prediction using CA-ANN model for southwestern coastal Bangladesh. Environ. Monit. Assess. 2017, 189, 565. [Google Scholar] [CrossRef]
- Fan, F.; Wang, Y.; Wang, Z. Temporal and spatial change detecting (1998–2003) and predicting of land use and land cover in Core corridor of Pearl River Delta (China) by using TM and ETM+ images. Environ. Monit. Assess. 2008, 137, 127–147. [Google Scholar] [CrossRef]
- Girma, R.; Fürst, C.; Moges, A. Land use land cover change modeling by integrating artificial neural network with cellular Automata-Markov chain model in Gidabo river basin, main Ethiopian rift. Environ. Chall. 2022, 6, 100419. [Google Scholar] [CrossRef]
- Gupta, R.; Sharma, L.K. Efficacy of Spatial Land Change Modeler as a forecasting indicator for anthropogenic change dynamics over five decades: A case study of Shoolpaneshwar Wildlife Sanctuary, Gujarat, India. Ecol. Indic. 2020, 112, 106171. [Google Scholar] [CrossRef]
- Getachew, D.; Kaur, R. Modeling Land-Use/Land-Cover Change, Using Multi-Layer Perceptron and Markov Chain Analysis: A Study on Bahir Dar City, Ethiopia. In Re-Envisioning Remote Sensing Applications; CRC Press: Boca Raton, FL, USA, 2021; pp. 241–260. [Google Scholar]
- Etemadi, H.; Smoak, J.M.; Karami, J. Land use change assessment in coastal mangrove forests of Iran utilizing satellite imagery and CA–Markov algorithms to monitor and predict future change. Environ. Earth Sci. 2018, 77, 208. [Google Scholar] [CrossRef]
- Leta, M.K.; Demissie, T.A.; Tränckner, J. Modeling and Prediction of Land Use Land Cover Change Dynamics Based on Land Change Modeler (LCM) in Nashe Watershed, Upper Blue Nile Basin, Ethiopia. Sustainability 2021, 13, 3740. [Google Scholar] [CrossRef]
- Al-sharif, A.A.; Pradhan, B. Monitoring and predicting land use change in Tripoli Metropolitan City using an integrated Markov chain and cellular automata models in GIS. Arab. J. Geosci. 2014, 7, 4291–4301. [Google Scholar] [CrossRef]
- Subedi, P.; Subedi, K.; Thapa, B. Application of a hybrid cellular automaton–Markov (CA-Markov) model in land-use change prediction: A case study of Saddle Creek Drainage Basin, Florida. Appl. Ecol. Environ. Sci. 2013, 1, 126–132. [Google Scholar] [CrossRef] [Green Version]
- Mondal, M.S.; Sharma, N.; Garg, P.K.; Kappas, M. Statistical independence test and validation of CA Markov land use land cover (LULC) prediction results. Egypt. J. Remote Sens. Space Sci. 2016, 19, 259–272. [Google Scholar] [CrossRef] [Green Version]
- Baig, M.F.; Mustafa, M.R.; Baig, I.; Takaijudin, H.B.; Zeshan, M.T. Assessment of land use land cover changes and future predictions using CA-ANN simulation for Selangor, Malaysia. Water 2022, 14, 402. [Google Scholar] [CrossRef]
- Daba, M.H.; You, S. Quantitatively assessing the future land-use/land-cover changes and their driving factors in the upper stream of the Awash River based on the CA–Markov model and their implications for water resources management. Sustainability 2022, 14, 1538. [Google Scholar] [CrossRef]
- Wu, F.; Mo, C.; Dai, X. Analysis of the Driving Force of Land Use Change Based on Geographic Detection and Simulation of Future Land Use Scenarios. Sustainability 2022, 14, 5254. [Google Scholar] [CrossRef]
- Naikoo, M.W.; Rihan, M.; Peer, A.H.; Talukdar, S.; Mallick, J.; Ishtiaq, M.; Rahman, A. Analysis of peri-urban land use/land cover change and its drivers using geospatial techniques and geographically weighted regression. Environ. Sci. Pollut. Res. 2022, 1–9. [Google Scholar] [CrossRef]
- Kafy, A.A.; Naim, N.H.; Khan, M.H.H.; Islam, M.A.; Al Rakib, A.; Al-Faisal, A.; Sarker, M.H.S. Prediction of urban expansion and identifying its impacts on the degradation of agricultural land: A machine learning-based remote-sensing approach in Rajshahi, Bangladesh. In Re-Envisioning Remote Sensing Applications; CRC Press: Boca Raton, FL, USA, 2021; pp. 85–106. [Google Scholar] [CrossRef]
- Hoque, M.Z.; Islam, I.; Ahmed, M.; Hasan, S.S.; Prodhan, F.A. Spatio-temporal changes of land use land cover and ecosystem service values in coastal Bangladesh. Egypt. J. Remote Sens. Space Sci. 2022, 25, 173–180. [Google Scholar]
- Roy, A.; Inamdar, A.B. Multi-temporal Land Use Land Cover (LULC) change analysis of a dry semi-arid river basin in western India following a robust multi-sensor satellite image calibration strategy. Heliyon 2019, 5, e01478. [Google Scholar] [CrossRef] [Green Version]
- Reid, R.S.; Kruska, R.L.; Muthui, N.; Taye, A.; Wotton, S.; Wilson, C.J.; Mulatu, W. Land-use and land-cover dynamics in response to changes in climatic, biological and socio-political forces: The case of southwestern Ethiopia. Landsc. Ecol. 2000, 15, 339–355. [Google Scholar] [CrossRef]
- Govender, T.; Dube, T.; Shoko, C. Remote sensing of land use-land cover change and climate variability on hydrological processes in Sub-Saharan Africa: Key scientific strides and challenges. Geocarto Int. 2022, 1–25. [Google Scholar] [CrossRef]
- Mussa, M.; Teka, H.; Mesfin, Y. Land use/cover change analysis and local community perception towards land cover change in the lowland of Bale rangelands, Southeast Ethiopia. Int. J. Biodivers. Conserv. 2017, 9, 363–372. [Google Scholar]
- Näschen, K.; Diekkrüger, B.; Evers, M.; Höllermann, B.; Steinbach, S.; Thonfeld, F. The impact of land use/land cover change (LULCC) on water resources in a tropical catchment in Tanzania under different climate change scenarios. Sustainability 2019, 11, 7083. [Google Scholar] [CrossRef] [Green Version]
- Kuma, H.G.; Feyessa, F.F.; Demissie, T.A. Land-use/land-cover changes and implications in Southern Ethiopia: Evidence from remote sensing and informants. Heliyon 2022, 8, e09071. [Google Scholar] [CrossRef]
- Tolessa, T.; Senbeta, F.; Kidane, M. The impact of land use/land cover change on ecosystem services in the central highlands of Ethiopia. Ecosyst. Serv. 2017, 23, 47–54. [Google Scholar] [CrossRef]
- Shiferaw, H.; Bewket, W.; Alamirew, T.; Zeleke, G.; Teketay, D.; Bekele, K.; Eckert, S. Implications of land use/land cover dynamics and Prosopis invasion on ecosystem service values in Afar Region, Ethiopia. Sci. Total Environ. 2019, 675, 354–366. [Google Scholar] [CrossRef] [PubMed]
- Biratu, A.A.; Bedadi, B.; Gebrehiwot, S.G.; Melesse, A.M.; Nebi, T.H.; Abera, W.; Egeru, A. Ecosystem Service Valuation along Landscape Transformation in Central Ethiopia. Land 2022, 11, 500. [Google Scholar] [CrossRef]
- Sahle, M.; Saito, O.; Fürst, C.; Demissew, S.; Yeshitela, K. Future land use management effects on ecosystem services under different scenarios in the Wabe River catchment of Gurage Mountain chain landscape, Ethiopia. Sustain. Sci. 2019, 14, 175–190. [Google Scholar] [CrossRef]
- Nasir, N.; Selvakumar, R. Influence of land use changes on spatial erosion pattern, a time series analysis using RUSLE and GIS: The cases of Ambuliyar sub-basin, India. Acta Geophys. 2018, 66, 1121–1130. [Google Scholar] [CrossRef]
- Alemu, B.; Garedew, E.; Eshetu, Z.; Kassa, H. Land use and land cover changes and associated driving forces in north western lowlands of Ethiopia. Int. Res. J. Agric. Sci. Soil Sci. 2015, 5, 28–44. [Google Scholar]
- Dibaba, W.T.; Demissie, T.A.; Miegel, K. Drivers and implications of land use/land cover dynamics in Finchaa catchment, northwestern Ethiopia. Land 2020, 9, 113. [Google Scholar] [CrossRef] [Green Version]
- Hailu, A.; Mammo, S.; Kidane, M. Dynamics of land use, land cover change trend and its drivers in Jimma Geneti District, Western Ethiopia. Land Use Policy 2020, 99, 105011. [Google Scholar] [CrossRef]
- Shawul, A.A.; Chakma, S. Spatiotemporal detection of land use/land cover change in the large basin using integrated approaches of remote sensing and GIS in the Upper Awash basin, Ethiopia. Environ. Earth Sci. 2019, 78, 141. [Google Scholar] [CrossRef]
- Ministry of Water, Irrigation and Energy of Ethiopia (MoWIE). Available online: www.mowe.gov.et (accessed on 15 January 2021).
- Betru, T.; Tolera, M.; Sahle, K.; Kassa, H. Trends and drivers of land use/land cover change in Western Ethiopia. Appl. Geogr. 2019, 104, 83–93. [Google Scholar] [CrossRef]
- Jemberie, M.; Gebrie, T.; Gebremariam, B. Evaluation of land use land cover change on stream flow: A case study of Dedissa Sub Basin, Abay Basin, South Western Ethiopia. Int. J. Innov. Eng. Res. Technol. 2016, 3, 2394–3696. [Google Scholar]
- Fasika, A.; Motuma, T.; Gizaw, T. Land use land cover change trend and its drivers in Somodo watershed, south-western Ethiopia. Afr. J. Agric. Res. 2019, 14, 102–117. [Google Scholar] [CrossRef] [Green Version]
- Kindu, M.; Schneider, T.; Teketay, D.; Knoke, T. Land use/land cover change analysis using object-based classification approach in Munessa-Shashemene landscape of the Ethiopian highlands. Remote Sens. 2013, 5, 2411–2435. [Google Scholar] [CrossRef] [Green Version]
- Abijith, D.; Saravanan, S. Assessment of land use and land cover change detection and prediction using remote sensing and CA Markov in the northern coastal districts of Tamil Nadu, India. Environ. Sci. Pollut. Res. 2021, 1–13. [Google Scholar] [CrossRef]
- Patil, M.B.; Desai, C.G.; Umrikar, B.N. Image classification tool for land use/land cover analysis: A comparative study of maximum likelihood and minimum distance method. Int. J. Geol. Earth Environ. Sci. 2012, 2, 189–196. [Google Scholar]
- Soomro, A.G.; Babar, M.M.; Arshad, M.; Memon, A.; Naeem, B.; Ashraf, A. Spatiotemporal variability in spate irrigation systems in Khirthar National Range, Sindh, Pakistan (case study). Acta Geophys. 2020, 68, 219–228. [Google Scholar] [CrossRef]
- Balha, A.; Mallick, J.; Pandey, S.; Gupta, S.; Singh, C.K. A comparative analysis of different pixel and object-based classification algorithms using multi-source high spatial resolution satellite data for LULC mapping. Earth Sci. Inform. 2021, 14, 2231–2247. [Google Scholar] [CrossRef]
- Rwanga, S.S.; Ndambuki, J.M. Accuracy assessment of land use/land cover classification using remote sensing and GIS. Int. J. Geosci. 2017, 8, 611. [Google Scholar] [CrossRef] [Green Version]
- Aliani, H.; Malmir, M.; Sourodi, M.; Kafaky, S.B. Change detection and prediction of urban land use changes by CA–Markov model (case study: Talesh County). Environ. Earth Sci. 2019, 78, 546. [Google Scholar] [CrossRef]
- Gidey, E.; Dikinya, O.; Sebego, R.; Segosebe, E.; Zenebe, A. Modeling the Spatio-temporal dynamics and evolution of land use and land cover (1984–2015) using remote sensing and GIS in Raya, Northern Ethiopia. Modeling Earth Syst. Environ. 2017, 3, 1285–1301. [Google Scholar] [CrossRef]
- Kumar, K.S.; Bhaskar, P.U.; Padmakumari, K. Application of land change modeler for prediction of future land use land cover: A case study of Vijayawada City. Int. J. Adv. Technol. Eng. Sci. 2015, 3, 773–783. [Google Scholar]
- Aryaguna, P.A.; Saputra, A.N. Land change modeler for predicting land cover change in Banjarmasin City, South Borneo (2014–2022). IOP Conf. Ser. Earth Environ. Sci. 2020, 500, 012002. [Google Scholar] [CrossRef]
- Mishra, V.N.; Rai, P.K.; Prasad, R.; Punia, M.; Nistor, M.M. Prediction of spatio-temporal land use/land cover dynamics in rapidly developing Varanasi district of Uttar Pradesh, India, using geospatial approach: A comparison of hybrid models. Appl. Geomat. 2018, 10, 257–276. [Google Scholar] [CrossRef]
- Hasan, S.; Shi, W.; Zhu, X.; Abbas, S.; Khan, H.U.A. Future simulation of land use changes in rapidly urbanizing South China based on land change modeler and remote sensing data. Sustainability 2020, 12, 4350. [Google Scholar] [CrossRef]
- Khoshnood Motlagh, S.; Sadoddin, A.; Haghnegahdar, A.; Razavi, S.; Salmanmahiny, A.; Ghorbani, K. Analysis and prediction of land cover changes using the land change modeler (LCM) in a semiarid river basin, Iran. Land Degrad. Dev. 2021, 32, 3092–3105. [Google Scholar] [CrossRef]
- Rumelhart, D.E.; Hinton, G.E.; Williams, R.J. Learning internal representations by error propagation. In Parallel Distributed Processing; Rumelhart, D.E., McClelland, J.L., Eds.; MIT Press: Cambridge, MA, USA, 1986; pp. 318–362. [Google Scholar]
- Mishra, V.N.; Rai, P.K.; Mohan, K. Prediction of land use changes based on land change modeler (LCM) using remote sensing: A case study of Muzaffarpur (Bihar), India. J. Geogr. Inst. “Jovan Cvijic” SASA 2014, 64, 111–127. [Google Scholar] [CrossRef]
- Clark Labs. TerrSet (18.3) [Software]; Clark University: Worcester, MA, USA, 2017. [Google Scholar]
- Shade, C.; Kremer, P. Predicting land use changes in Philadelphia following green infrastructure policies. Land 2019, 8, 28. [Google Scholar] [CrossRef] [Green Version]
- Ibrahim, M.M.; Duker, A.; Conrad, C.; Thiel, M.; Shaba Ahmad, H. Analysis of settlement expansion and urban growth modelling using geoinformation for assessing potential impacts of urbanization on climate in Abuja City, Nigeria. Remote Sens. 2016, 8, 220. [Google Scholar] [CrossRef] [Green Version]
- Wang, J.; Maduako, I.N. Spatio-temporal urban growth dynamics of Lagos Metropolitan Region of Nigeria based on Hybrid methods for LULC modeling and prediction. Eur. J. Remote Sens. 2018, 51, 251–265. [Google Scholar] [CrossRef] [Green Version]
- Wang, W.; Zhang, C.; Allen, J.M.; Li, W.; Boyer, M.A.; Segerson, K.; Silander, J.A. Analysis and prediction of land use changes related to invasive species and major driving forces in the state of Connecticut. Land 2016, 5, 25. [Google Scholar] [CrossRef] [Green Version]
- Cramer, H. Mathematical Methods of Statistics (PMS-9); Princeton University Press: Princeton, NJ, USA, 2016; Volume 9. [Google Scholar]
- Beh, E.J. Theory & Methods: Partitioning Pearson’s Chi-squared Statistic for Singly Ordered Two-way Contingency Tables. Aust. New Zealand J. Stat. 2001, 43, 327–333. [Google Scholar]
- Eastman, J.R. IDRISI Taiga Guide to GIS and Image Processing; Clark Labs Clark University: Worcester, MA, USA, 2009. [Google Scholar]
- Gaur, S.; Mittal, A.; Bandyopadhyay, A.; Holman, I.; Singh, R. Spatio-temporal analysis of land use and land cover change: A systematic model inter-comparison driven by integrated modelling techniques. Int. J. Remote Sens. 2020, 41, 9229–9255. [Google Scholar] [CrossRef]
- Benavidez-Silva, C.; Jensen, M.; Pliscoff, P. Future Scenarios for Land Use in Chile: Identifying Drivers of Change and Impacts over Protected Area System. Land 2021, 10, 408. [Google Scholar] [CrossRef]
- Vu, T.T.; Shen, Y. Land-Use and Land-Cover Changes in Dong Trieu District, Vietnam, during Past Two Decades and Their Driving Forces. Land 2021, 10, 798. [Google Scholar] [CrossRef]
- Kafi, K.M.; Shafri, H.Z.M.; Shariff, A.B.M. An analysis of LULC change detection using remotely sensed data; A Case study of Bauchi City. IOP Conf. Ser. Earth Environ. Sci. 2014, 20, 012056. [Google Scholar] [CrossRef]
- Vivekananda, G.N.; Swathi, R.; Sujith, A.V.L.N. Multi-temporal image analysis for LULC classification and change detection. Eur. J. Remote Sens. 2021, 54, 189–199. [Google Scholar] [CrossRef]
- Hishe, S.; Bewket, W.; Nyssen, J.; Lyimo, J. Analysing past land use land cover change and CA-Markov-based future modelling in the Middle Suluh Valley, Northern Ethiopia. Geocarto Int. 2020, 35, 225–255. [Google Scholar] [CrossRef]
- Tsegaye, D.; Moe, S.R.; Vedeld, P.; Aynekulu, E. Land-use/cover dynamics in Northern Afar rangelands, Ethiopia. Agric. Ecosyst. Environ. 2010, 139, 174–180. [Google Scholar] [CrossRef]
- Minale, A.S.; Rao, K.K. Impacts of land cover/use dynamics of Gilgel Abbay catchment of Lake Tana on climate variability, Northwestern Ethiopia. Appl. Geomat. 2012, 4, 155–162. [Google Scholar] [CrossRef]
- Müller-Mahn, D.; Gebreyes, M. Controversial connections: The water-energy-food nexus in the Blue Nile basin of Ethiopia. Land 2019, 8, 135. [Google Scholar] [CrossRef] [Green Version]
- Gebrehiwot, S.G.; Bewket, W.; Gardenas, A.I.; Bishop, K. Forest cover change over four decades in the Blue Nile Basin, Ethiopia: Comparison of three watersheds. Reg. Environ. Change 2014, 14, 253–266. [Google Scholar] [CrossRef]
- Meshesha, D.T.; Tsunekawa, A.; Tsubo, M.; Ali, S.A.; Haregeweyn, N. Land-use change and its socio-environmental impact in Eastern Ethiopia’s highland. Reg. Environ. Change 2014, 14, 757–768. [Google Scholar] [CrossRef]
- Regasa, M.; Nones, M. Land Use Land Cover Changes in the Fincha Basin, Ethiopia. In Proceedings of the 39th IAHR World Congress, Granada, Spain, 19–24 June 2022; Volume 19, p. 24. [Google Scholar]
- Berisso, T. Deforestation and environmental degradation in Ethiopia: The case of Jam Jam Province. Northeast Afr. Stud. 1995, 2, 139–155. [Google Scholar] [CrossRef]
- Dessie, G.; Kleman, J. Pattern and magnitude of deforestation in the south central rift valley region of Ethiopia. Mt. Res. Dev. 2007, 27, 162–168. [Google Scholar] [CrossRef] [Green Version]
- Federal Democratic Republic of Ethiopia-FDRE. Constitution of the Federal Democratic Republic of Ethiopia; National Legislative Bodies/National Authorities: Addis Ababa, Ethiopia, 1994; p. 50. [Google Scholar]
- Watson, C. Direct Consumptive Use Valuation of the Ecosystem Goods and Services in the Bale Mountains Eco-Region, Ethiopia. Doctoral Dissertation, Centre of Environmental Policy, Faculty of Natural Sciences, Imperial College London, London, UK, 2007. [Google Scholar]
- Dejene, T.; Lemenih, M.; Bongers, F. Manage or convert Boswellia woodlands? Can frankincense production payoff? J. Arid Environ. 2013, 89, 77–83. [Google Scholar] [CrossRef]
- Tolessa, T.; Kidane, M.; Bezie, A. Assessment of the linkages between ecosystem service provision and land use/land cover change in Fincha watershed, North-Western Ethiopia. Heliyon 2021, 7, e07673. [Google Scholar] [CrossRef] [PubMed]
- Tessema, I.; Simane, B. Vulnerability analysis of smallholder farmers to climate variability and change: An agro-ecological system-based approach in the Fincha’a sub-basin of the upper Blue Nile Basin of Ethiopia. Ecol. Processes 2019, 8, 5. [Google Scholar] [CrossRef] [Green Version]
- Tefera, B.; Sterk, G. Hydropower-induced land use change in Fincha’a watershed, western Ethiopia: Analysis and impacts. Mt. Res. Dev. 2008, 28, 72–80. [Google Scholar] [CrossRef] [Green Version]
- Mariye, M.; Maryo, M.; Li, J. The study of land use and land cover (LULC) dynamics and the perception of local people in Aykoleba, northern Ethiopia. J. Indian Soc. Remote Sens. 2022, 50, 775–789. [Google Scholar] [CrossRef]
- Senbeta, F. Community perception of land use/land cover change and its impacts on biodiversity and ecosystem services in northwestern Ethiopia. J. Sustain. Dev. Afr. 2018, 20, 108–126. [Google Scholar]


| Satellite | Year | Acquisition Date | Path/Row | Spatial Resolution |
|---|---|---|---|---|
| Landsat 5 TM | 1989 | January 4 | 169/53, 169/54 | 30 m |
| January 11 | 170/53 | 30 m | ||
| Landsat 5 TM | 2004 | January 11 | 170/53 | 30 m |
| January 15 | 169/53, 169/54 | 30 m | ||
| Landsat 8 OIL | 2019 | January 14 | 170/53 | 30 m |
| January 23 | 169/53, 169/54 | 30 m |
| LULC Classes | Description |
|---|---|
| Waterbody | area completely covered by waters such as lakes, rivers, and ponds |
| Built-up | area covered by urban and rural settlements, roads, industries, infrastructures |
| Agriculture | area covered by annual and perennial crops |
| Forest | area covered by evergreen forest |
| Shrub | area with trees that are not evergreen during the dry season |
| Grass/Swamp | area covered with grasses used for grazing, and sugarcane plantations |
| Driving Force | Type |
|---|---|
| Distance from disturbance | Dynamic |
| Distance from stream | Dynamic |
| Distance from urban | Dynamic |
| Distance from road | Dynamic |
| Evidence likelihood | Dynamic |
| Elevation | Static |
| Slope | Static |
| LULC Type | 1989 | 2004 | 2019 | |||
|---|---|---|---|---|---|---|
| [ha] | [%] | [ha] | [%] | [ha] | [%] | |
| Waterbody | 15,744.08 | 5.24 | 19,928.15 | 6.63 | 20,860.55 | 6.94 |
| Grass/Swamp | 73,371.25 | 24.42 | 73,423.56 | 24.43 | 73,570.49 | 24.48 |
| Built-up | 1252.00 | 0.42 | 2945.40 | 0.98 | 5007.75 | 1.67 |
| Agriculture | 96,966.71 | 32.27 | 103,033.14 | 34.29 | 115,446.96 | 38.42 |
| Forest | 48,373.16 | 16.10 | 46,569.29 | 15.50 | 29,213.93 | 9.72 |
| Shrub | 64,790.11 | 21.56 | 54,597.77 | 18.17 | 56,397.63 | 18.77 |
| Total | 30,0497.31 | 100.00 | 30,0497.31 | 100.00 | 300,497.31 | 100.00 |
| Year | LULC Class | Producer Accuracy | User Accuracy | OA [%] | K [%] |
|---|---|---|---|---|---|
| 1989 | Waterbody | 92.86 | 89.66 | 82.80 | 80.51 |
| Grass/Swamp | 76.78 | 86.00 | |||
| Built-up | 84.61 | 84.62 | |||
| Agriculture | 82.69 | 74.14 | |||
| Forest | 85.71 | 87.80 | |||
| Shrub | 80.43 | 80.43 | |||
| 2004 | Waterbody | 97.06 | 91.67 | 85.57 | 82.54 |
| Grass/Swamp | 75.14 | 84.13 | |||
| Built-up | 83.87 | 86.67 | |||
| Agriculture | 88.41 | 81.33 | |||
| Forest | 89.80 | 93.62 | |||
| Shrub | 84.62 | 81.48 | |||
| 2019 | Waterbody | 94.44 | 85.00 | 89.82 | 87.84 |
| Grass/Swamp | 86.30 | 87.50 | |||
| Built-up | 97.14 | 91.89 | |||
| Agriculture | 90.45 | 95.00 | |||
| Forest | 89.29 | 92.59 | |||
| Shrub | 86.67 | 85.25 |
| 1989–2004 | 2004–2019 | 1989–2019 | |||||||
|---|---|---|---|---|---|---|---|---|---|
| LULC Class | Area [ha] | Area [%] | Change [ha/Year] | Area [ha] | Area [%] | Change [ha/Year] | Area [ha] | Area [%] | Change [ha/Year] |
| Agriculture | 6067.5 | 6.3 | 404.5 | 12,412.7 | 12.1 | 827.5 | 18,480.3 | 19.06 | 616.0 |
| Built-up | 1693.4 | 135.3 | 112.9 | 2062.3 | 70.0 | 137.5 | 3755.8 | 300.0 | 125.2 |
| Forest | −1803.9 | −3.7 | −120.3 | −17,355.4 | −37.3 | −1157.0 | −19,159.2 | −39.6 | −638.6 |
| Grass/Swamps | 52.3 | 0.1 | 3.5 | 146.9 | 0.2 | 9.8 | 199.2 | 0.3 | 6.6 |
| Shrub | −10,192.3 | −15.7 | −679.5 | 1799.9 | 3.3 | 120.0 | −8392.5 | −13.0 | −279.8 |
| Waterbody | 4183.0 | 26.6 | 278.9 | 933.4 | 4.7 | 62.2 | 5116.3 | 32.5 | 170.5 |
| LCM Projected LULC | Classified LULC | |||
|---|---|---|---|---|
| LULC Class | Area [ha] | Percentage [%] | Area [ha] | Percentage [%] |
| Waterbody | 19,942.55 | 6.64 | 20,861.54 | 6.94 |
| Grass/swamp | 76,883.19 | 25.58 | 73,570.84 | 24.48 |
| Built-up | 3007.232 | 1.00 | 5007.76 | 1.67 |
| Agriculture | 108,578.3 | 36.13 | 115,449.74 | 38.42 |
| Forest | 48,717.03 | 16.21 | 29,214.18 | 9.72 |
| Shrub | 43,377.06 | 14.43 | 56,401.33 | 18.77 |
| Total | 300,505.4 | 100.00 | 300,505.40 | 100.00 |
| Statistics | Value |
|---|---|
| Kno | 0.8743 |
| Klocation | 0.8864 |
| Kstandards | 0.8285 |
| Agreement Chance | 0.1667 |
| Agreement Quantity | 0.3252 |
| Agreement Gridcell | 0.4071 |
| Disagreement Gridcell | 0.0268 |
| Disagreement Quantity | 0.0742 |
| Driving Force | Cramer’s V Value |
|---|---|
| Distance from disturbance | 0.2782 |
| Distance from stream | 0.3240 |
| Distance from urban | 0.1548 |
| Distance from road | 0.2736 |
| Evidence likelihood | 0.4212 |
| Elevation | 0.2949 |
| Slope | 0.0101 |
| 2019–2030 | 2030–2040 | 2040–2050 | 2019–2050 | |||||
|---|---|---|---|---|---|---|---|---|
| LULCC Class | [ha] | [%] | [ha] | [%] | [ha] | [%] | [ha] | [%] |
| Agriculture | 7722.2 | 6.7 | 2795.1 | 2.3 | 1619 | 1.3 | 12,136.3 | 10.5 |
| Built-up | 358.8 | 7.2 | 420.7 | 7.8 | 204.5 | 3.5 | 984 | 19.6 |
| Forest | −13,585.1 | −46.5 | −4374.9 | −28.0 | −1808.4 | −16.1 | −19,768.4 | −67.7 |
| Grass/swamp | 12,589 | 17.1 | 1672.5 | 1.9 | −235.5 | −0.3 | 14,026 | 19.1 |
| Shrub | −9287.6 | −16.5 | −1309.8 | −2.8 | −392.8 | −0.9 | −10,990.2 | −19.5 |
| Waterbody | 2204.5 | 10.6 | 796.3 | 3.5 | 613.1 | 2.6 | 3613.9 | 17.3 |
Publisher’s Note: MDPI stays neutral with regard to jurisdictional claims in published maps and institutional affiliations. |
© 2022 by the authors. Licensee MDPI, Basel, Switzerland. This article is an open access article distributed under the terms and conditions of the Creative Commons Attribution (CC BY) license (https://creativecommons.org/licenses/by/4.0/).
Share and Cite
Regasa, M.S.; Nones, M. Past and Future Land Use/Land Cover Changes in the Ethiopian Fincha Sub-Basin. Land 2022, 11, 1239. https://doi.org/10.3390/land11081239
Regasa MS, Nones M. Past and Future Land Use/Land Cover Changes in the Ethiopian Fincha Sub-Basin. Land. 2022; 11(8):1239. https://doi.org/10.3390/land11081239
Chicago/Turabian StyleRegasa, Motuma Shiferaw, and Michael Nones. 2022. "Past and Future Land Use/Land Cover Changes in the Ethiopian Fincha Sub-Basin" Land 11, no. 8: 1239. https://doi.org/10.3390/land11081239