Article

Fluvisols Contribution to Water Retention Hydrological Ecosystem Services in Different Floodplain Ecosystems

1
Faculty of Natural Sciences, Matej Bel University in Banska Bystrica, Tajovského 40, 974 01 Banska Bystrica, Slovakia
2
National Agricultural and Food Centre, Grassland and Mountain Agriculture Research Institute, Mládežnícka 36, 974 21 Banska Bystrica, Slovakia
3
College of Information and Electrical Engineering, China Agricultural University, Beijing 100083, China
*
Author to whom correspondence should be addressed.
Land 2022, 11(9), 1510; https://doi.org/10.3390/land11091510
Submission received: 15 July 2022 / Revised: 3 September 2022 / Accepted: 5 September 2022 / Published: 8 September 2022

Abstract

:
Water retention is an important hydrological ecosystem service of active floodplain soils. The aim of the study was to evaluate the soil chemical, physical, and hydrological properties in Fluvisols in three different ecosystems that have an impact on water retention hydrological ecosystem services (WRHESs). We selected 16 localities along the Štiavnica River in Central Slovakia, 8 located in riparian zones (RZ), 5 in arable lands (AL), and 3 in grasslands (GL). Soil samples were collected from two layers (0–10 and 20–30 cm). In the laboratory, the soil physical (soil texture) and soil chemical properties (pH, soil organic carbon content, humic and fulvic acid ratio) were determined. Using undisturbed soil samples, the soil physical characteristics (particle density, bulk density, porosity, and actual soil moisture–SMa) were measured. With the help of pedotransfer functions, hydrological soil properties (field water capacity–FWC, wilting point–WP, available water capacity–AWC) were estimated. The recorded properties differed between the localities, ecosystems, and two layers. The SMa values showed a higher soil water retention potential of extensively used ecosystems, such as GL and RZ. However, the hydrological properties estimated by pedotransfer functions (FWC, WP, AWC) showed a higher soil water retention potential in AL localities. This indicated that for calculations, selected pedotransfer functions (particle size fractions, organic matter, and bulk density) and other soil or ecosystem properties (e.g., vegetation cover, meteorological conditions) have an impact on WRHESs. One such soil factor can be the quality of organic matter. On the basis of the results of the ANOVA, significant differences emerged between the different ecosystems for selected basic chemical, physical, and hydrological properties. The effect of the soil layer on the soil properties was revealed only in the case of SOC. The results indicated the effect of different ecosystems on soil WRHES and the importance of extensively managed ecosystems, such as RZ and GL. From this point of view, the reduction in the RZ and GL areas during a period of the last 70 years is negative. The findings should be taken into account in future sustainable floodplain management and landscape architecture.

1. Introduction

Ecosystems are being studied more in light of the concept of ecosystem services (ESs). ESs are defined as the contributions of ecosystems to human well-being [1]. ESs underpin all aspects of human wellbeing—from basic livelihood to moderate prosperity and sustainable development [2], directly or indirectly contributing to the achievement of sustainable development goals (SDGs) [3]. The 2030 Agenda, adopted by all UN member states in 2015, provides a shared blueprint for sustainability. Its 17 SDGs highlight the pathways to achieve the social, economic, and environmental dimensions of prosperity and sustainability [4]. Embedded in the SDGs are targets to protect, restore, and promote the sustainable use of ecosystems and their services [5]. The achievement of many SDGs is dependent on well-functioning ecosystems. The SDGs relating to social and economic concerns are as dependent on the well-functioning of our nature as the targets directly related to the conservation of our environment and ecosystem services [6].
The ESs are divided into four categories: supporting, provisioning, regulating, and cultural services. Regulating ESs provide a number of benefits to human beings, including air quality and gas regulation, water purification and treatment, climate regulation, water regulation, erosion regulation, pest and disease regulation, pollination, nutrient cycling, and natural hazard regulation [7]. Some ESs are closely related to hydrological processes, and soil water retention is an important regulating service [8]. These so-called water-related or hydrological ecosystem services (HESs) have not been uniformly defined so far, but the main assumption is the importance of water for these ESs [9]. Ecosystem services related to water include HESs and aquatic and marine services. HESs describe the water terrestrial ecosystems that affect freshwater resources. They organize the hydrological functions of terrestrial landscapes, including processes, such as water storage, retention, transpiration, filtration, and fog interception, by their impacts on water quantity, quality, location, and timing and thus their effects on water available for human use. HESs cover the following four categories: water supply, water damage reduction, hydrological and cultural services, and support services related to water [10]. Thus, HESs contribute to at least four SDGs. Among all relevant SDGs, the goals that are most based on HESs are SDG2 (Zero Hunger), SDG6 (Clean water and sanitation), SDG13 (Climate action), and SDG15 (Life on land).
Today, many regions in the world are under stress due to water availability and suffer from severe problems determined by water shortages. Therefore, river alluvia as part of watercourses are of high importance because of their hydrological functions and services. Soil plays a crucial role in HESs with its “sponge” effect, when it soaks up water during wet periods, retains it, and releases it slowly during the dry season to maintain soil water supplies. This soil water retention hydrological ecosystem service (WRHES) contributes directly or indirectly to a wide range of all ecosystem services: provides food, stores water, and secures natural flood protection, and thus indirectly also helps to sustain biological diversity [11,12]. The soil cover in the river alluvia is usually formed by Fluvisols. Fluvisols occupy approximately 350 million hectares of the land surface of the world. They are found in all climates except permafrost [13], but estimates suggest that 70–90% of Europe’s floodplain area, including Fluvisols, is ecologically degraded due to human activities, including intensive agriculture. In Europe and North America, up to 90% of floodplains are cultivated [14] often to the detriment of riparian ecosystems; and riparian zones (RZs) are transitional areas that occur along land and freshwater ecosystems, characterized by unique soil, hydrology, and biotic conditions strongly influenced by stream water. Due to the key ecological role of RZs and their fragility, the need for an extensive assessment of riparian coverage in floodplains, its ecological functions and services at different spatial levels is motivated. Land use and cover changes are the main causes of natural ecosystem degradation. They can lead to a reduction in RZ areas due to the expansion of the arable land areas and can cause a decrease in the provision of ESs. Agriculture has negative effects on ESs due to landscape homogenization, habitat fragmentation and loss, microclimatic changes, and development of population imbalance, reducing services [15]. The protection of HESs of different ecosystems is inevitably based on research output.
Soil plays a crucial role in ecosystem functioning and an important role in achieving HESs. Despite its importance, most studies have described ecosystem focusing on the services only with little emphasis on soil [16]. Most studies on the valuation of ESs lack a soil component. However, there are studies that emphasize the need to assess soil ecosystem services and promote soil-ecosystem linkage in the development of land management [17,18]. A broad range of biophysical, social, and economic methods has been developed to estimate ESs [19,20,21]. Spatial aspects have been studied through mapping or scenario modeling of future changes. Instead of directly using soil information, some of the mapping and modeling studies used environmental variables as a proxy for soil information [22,23,24]. The most commonly used proxy is land use and land cover data [25]. Biophysical methods can be classified as direct, indirect, and modeling methods. Direct measurement methods include measurements of a state from ecosystem observations and surveys. Direct measurements deliver a biophysical value of ESs in physical units, which correspond to the units of the indicator, and quantify or measure a stock or a flow value. Direct measurements can be used as primary data input to other methods or directly as ES indicators [26]. The availability of accurate soil information for managers or data analysis for modeling is a crucial factor [27]. The use of indices that represent soil quality and their potential to provide ecological functions and ESs is desirable [28].
Soil ecosystem services and their assessment depend on the properties of the soil and their interaction. An assessment of soil HESs focused on soil water retention service can be based on direct measurements of soil hydrological properties, their estimation, or a combination of these two approaches. Although soil properties have been recognized for their importance, a long duration of field work is required to obtain relevant data [29]. Therefore, they are usually estimated through different models or with the help of pedotransfer functions. For WRHESs, assessment can be used as measured or estimated hydrological properties, such as actual soil moisture (SMa), field water capacity (FWC), wilting point (WP), available water capacity (AWC), and soil water deficit index (SWDI). These hydrological properties are mainly related to the soil water retention ecosystem service. Soil moisture forms and the capacity for water in the soil is an important factor for plant growth and against flooding. The projections of climate change indicate greater droughts, which can lead to reductions in soil moisture. Higher values of SMa, FWC, WP and AWC, in terms of volumetric soil water content, indicate a higher soil WRHES capacity. In addition, SWDI positive values mean an excess of water in the soil. The hydrological properties of the soil give a good indication of the potential to provide WRHESs. However, these hydrological properties are dynamic and depend on other soil physical, chemical and biological properties, on land use and management. Therefore, it is crucial to also know the basic soil properties that impact the hydrological properties and their interactions. Knowing these relationships can help with land use and ecosystem management practices.
We evaluated soil WRHES by hydrological soil properties in the floodplain along the Štiavnica River in central Slovakia. The floodplain is relatively small, but, with respect to geographical origin, local measurement of hydrological properties can offer better results than in a large territory [30]. Additionally, the character of the watercourse and its surrounding is diverse due to the great difference in altitude from spring to inflow, different geological and climate conditions, and land cover. The objectives of the study are: (a) to evaluate soil WRHESs with the help of hydrological soil properties measurement and estimation in Fluvisols in three different ecosystems along the Štiavnica River in central Slovakia (b) to measure basic soil chemical and physical properties, and to evaluate mutual interactions between them and the hydrological properties influencing WRHESs, (c) to analyze the effect of ecosystems, land uses, and soil layers on the soil hydrological properties that have impact on soil WRHESs, and (d) to assess changes in land use and land cover in the floodplain with the impact on WRHESs.

2. Materials and Methods
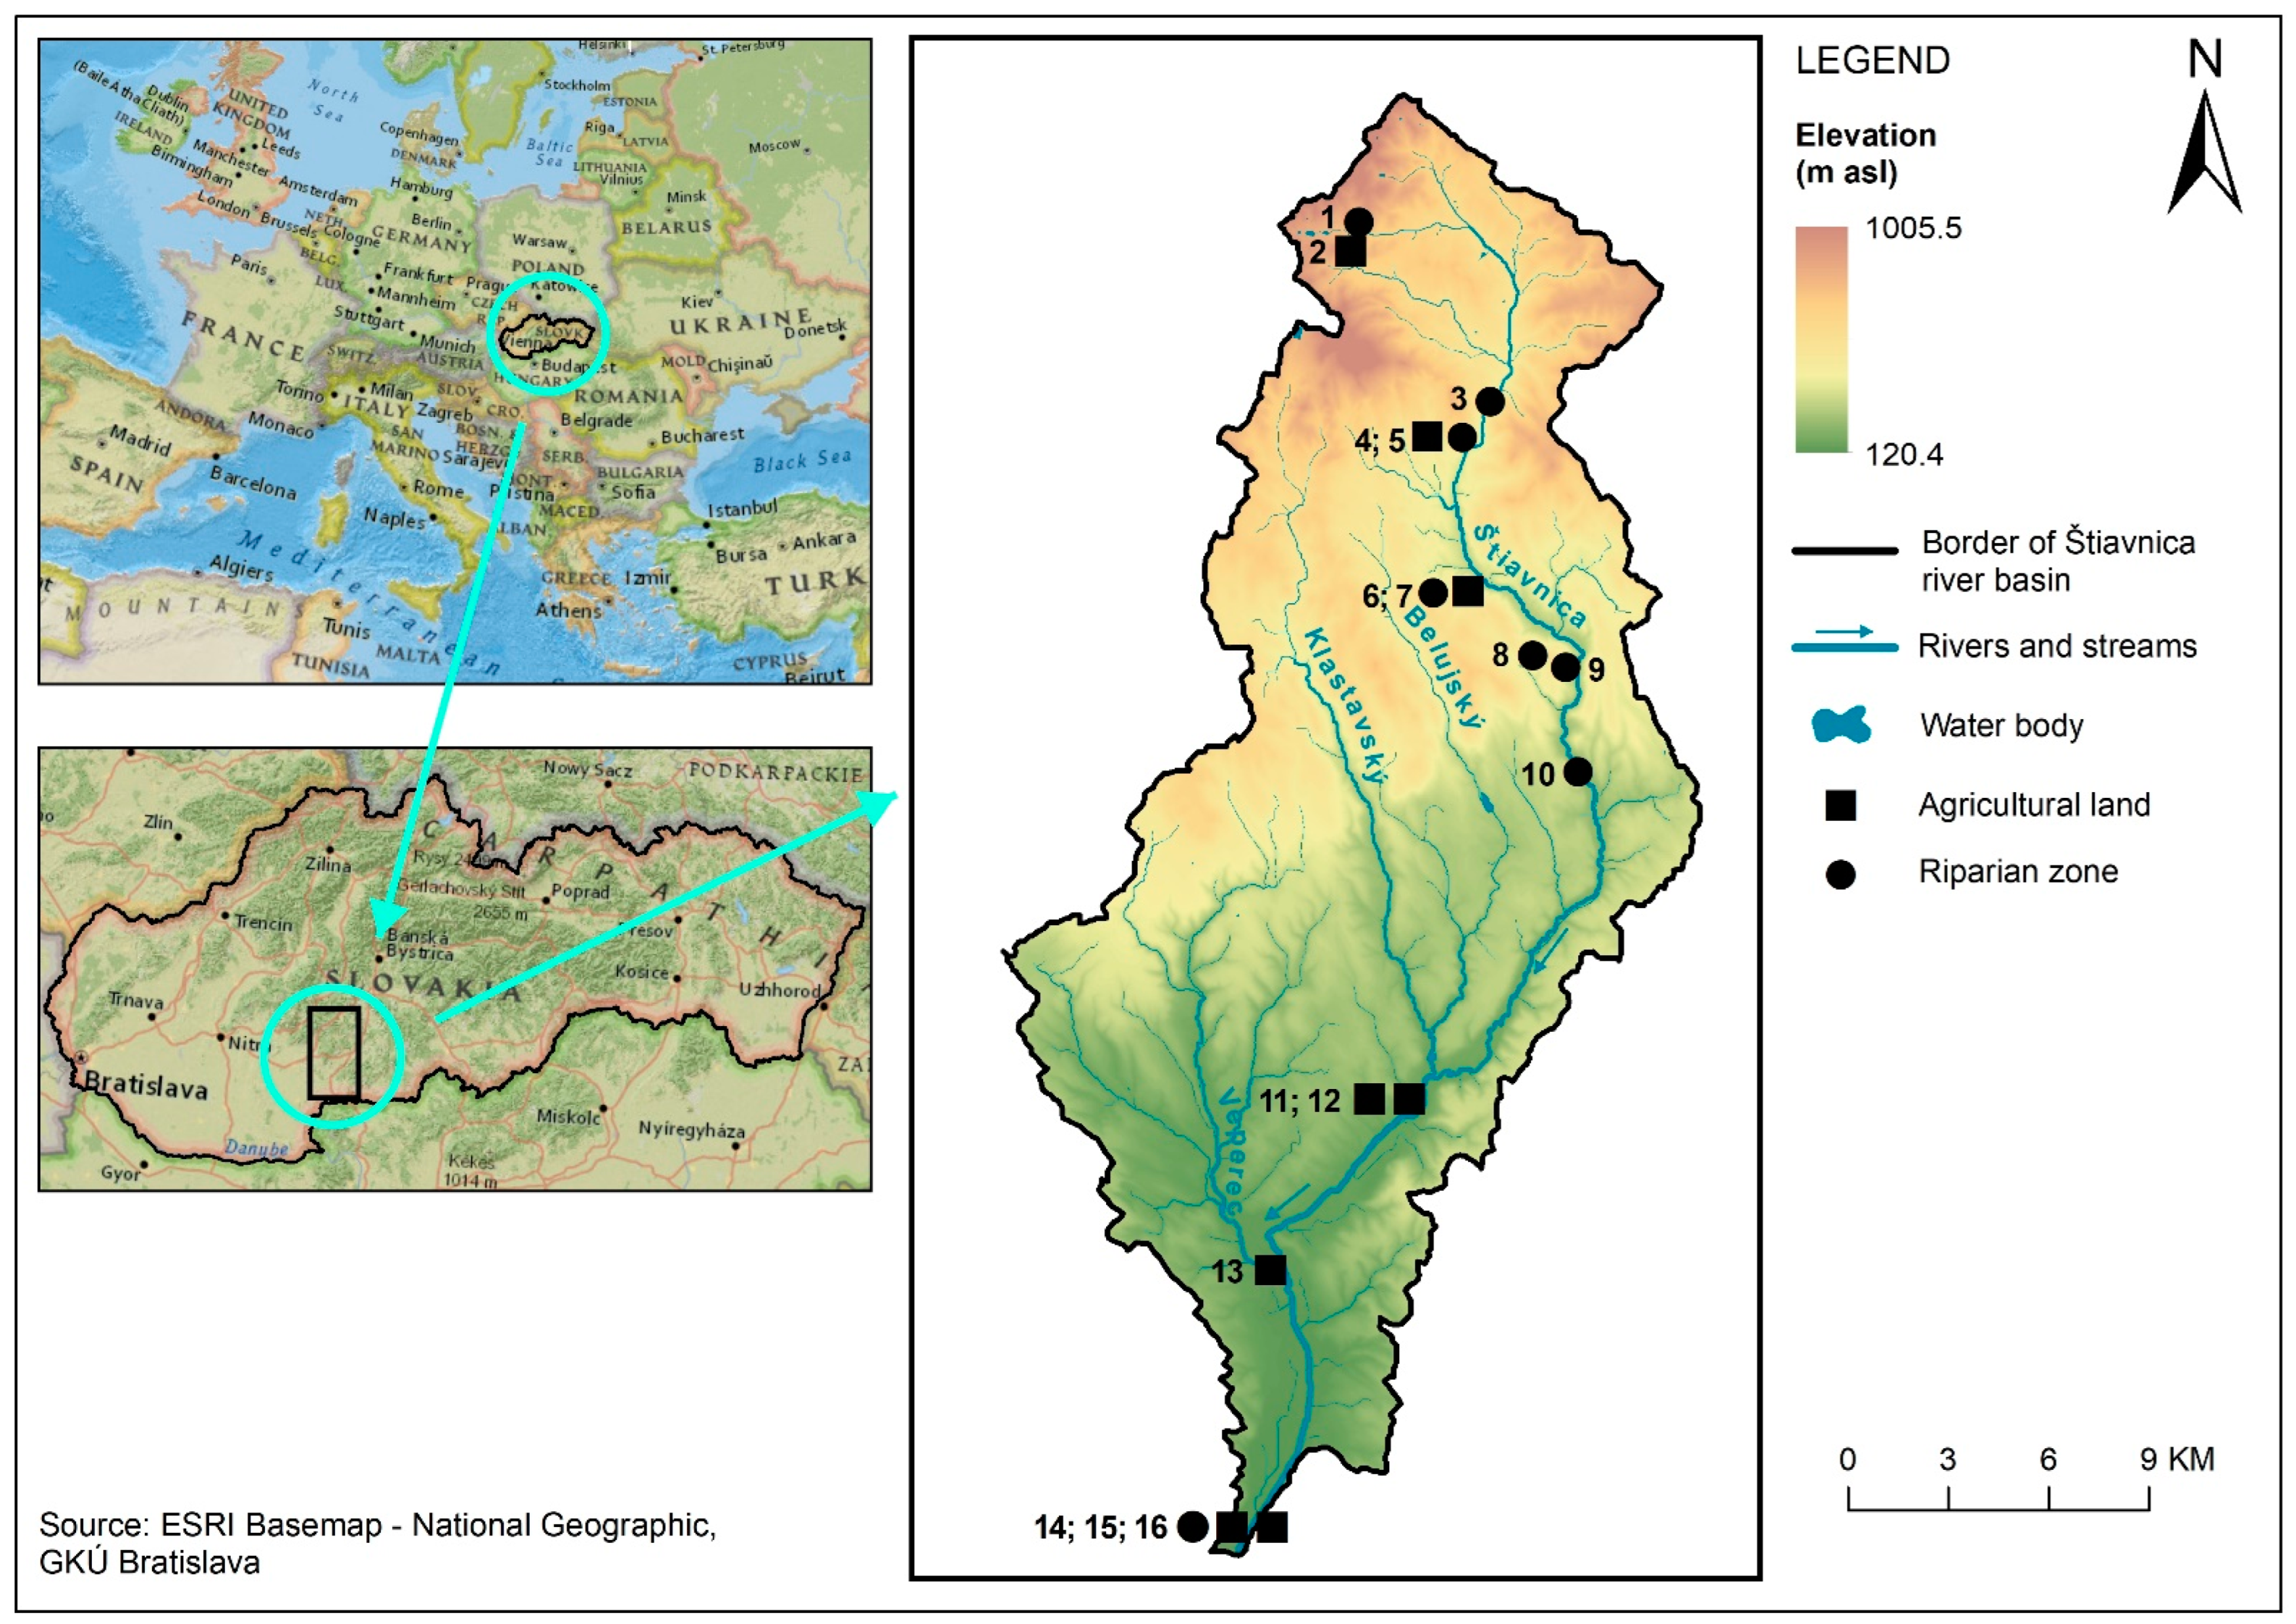
2.1. Study Area

The study was carried out in Slovakia on the 55 km long Štiavnica River floodplain. We selected 16 localities of which 8 localities were agricultural land (3 of them used as grasslands and 5 used as arable land), and 8 localities were part of riparian zones (Figure 1). The river flows through the Štiavnické vrchy Mountains of volcanic origin and the Podunajská pahorkatina Hills. The Štiavnické vrchy Mountains are managed as protected areas, the Podunajská pahorkatina Hills are used intensively for agriculture. The lowest locality is located at 123 m above sea level and the highest locality is 648 m above sea level. Due to such a difference in altitude, the watercourse is on the boundary of the Cfb/Dfb regions [31] (using the Köppen climate classification) characterized by a temperate/continental climate. The warm temperate and humid zone Cfb occurred in the Southwestern part of Slovakia with the lowest altitudes. The temperate and humid zone Dfb is located further north at higher altitudes. An average annual precipitation ranges from 584 (the lower part of the river) to 794 (the upper part of the river) mm. An average annual temperature ranges from 7 °C (the upper part of the river) to 10.2 °C (the lower part of the river). Soils are classified as Fluvisol according to the World Reference Base for Soil Resources. Fluvisols developed on fluvial deposits have weak horizon differentiation but distinct 10–25 cm thick topsoil horizons (A horizon) followed by the A/C and C horizon as parent material.

2.2. Physical Methods and Hydrological Properties Calculations

Physical soil properties were determined using undisturbed soil samples of 100 cm3 in volume that were collected in September 2018 from a depth of 0–10 and 20–30 cm using core extracting tubes (Eijkelkamp Equipment for Soil Research, The Netherlands). Undisturbed soil samples were hermetically sealed and taken to the laboratory for analyses using the gravimetric method according to Novák [32] of bulk density (BD), particle density (PD), actual soil moisture (SMa), and porosity (as total—Pt, capillary—Pc, noncapillary—Pn, semicapillary—Ps). Raw samples were weighed on laboratory scales. The samples were then saturated with water through filter paper for 24 h. The samples were then placed on dry filter paper and reweighed at certain intervals to determine other characteristics. After half an hour of water desaturation, we determined the moisture for 30 min (SM30m). After 2 h of water desaturation, we determined by weighing and recalculating the 2 h of moisture (SM2h). After the next 22 h of further desaturation (after a total of 24 h of desaturation), by weighing and recalculating, we determined the 24 h of moisture (SM24h). The samples were dried and again weighed. PD as the mass per unit volume of solids in a soil was determined by the pycnometer method according to Blake and Hartage [33].
The following formulas were used for calculations of physical and hydrophysical properties:
Bulk density (BD) (Equation (1)):
BD = m d V   ( g   cm 3 )
where md is the mass of dry soil in g, V is the sample volume in core-extracting tube in cm3.
Particle density (PD) (Equation (2)):
PD = m d m w   ( g   cm 3 )
where md is the mass of dry soil in g, mw is the mass of water expelled by soil in cm3.
Actual soil moisture (SMa) (Equation (3)):
SMa   = ( m a   m d m d     100 )     BD   ( % )
where ma is the mass of the soil with actual soil moisture, md is the mass of the dry soil, BD is bulk density of soil in g cm−3.
Total volume of pores (Pt) (Equation (4)):
P t = ( ( PD s   BD ) PD   100 )     ( % )
where PD is the particle density of soil in g cm−3, BD is bulk density of soil in g cm−3.
Non-capillary pores (Pn) (Equation (5)):
P n = P t   SM 30 m     ( % )
where Pt is the total volume of pores in %, SM30 is the moisture at 30 min in %.
Capillary pores (Pc) (Equation (6)):
P c = SM 24 h     ( % )
where SM24h is the 24 h moisture in %.
Semi-capillary pores (Ps) (Equation (7)):
P s = SM 30 m   SM 24 h     ( % )
where SM30m is 30 min moisture in %, SM24h is 24 h moisture in %.
The pedotransfer functions are used to estimate the hydrological properties of the soil as an important water determinant. They are simple to complex knowledge rules that relate available soil information to soil properties and variables that are needed to parameterize soil processes [34]. Many authors have used a fine particle size fraction of less than 0.01 mm to calculate hydrological properties [35,36,37]. Gupta and Larson [38] added in the equation, in addition to particle size fractions, also soil organic matter content and bulk density. By this method, we estimated FWC, WP, and AWC. All these hydrological parameters are crucial for the evaluation of WRHESs focused on water retention. However, it is important to stress that we used a combined approach for hydrological parameter estimation. We used both so-called static (fine particles content and organic matter content) and dynamic (bulk density, actual soil moisture) soil properties. The FWC was introduced to express soil–plant–water relationships as found in field conditions. It is the capacity of the soil to retain water against the downward pull of the force of gravity. It is the point where the soil water holding capacity has reached its maximum for the entire field. At this stage, only micropores or capillary pores are filled with water, and plants absorb water for their use. Part of the water at the field capacity is readily available to plants and microorganisms. The WP is the minimum water content in the soil that the plant needs to not wilt. If the soil water content decreases to this or any lower point, a plant wilts and cannot longer recover its turgidity. The AWC is defined as the difference between the water content in the FWC and the WP. We used the following formulas for the calculations introduced by Gupta and Larson for temperate pedotransfer functions [39]:
Field water capacity (FWC) (Equation (8)):
FWC = 0.003075 Sa + 0.005886 Si + 0.008039 Cl + 0.002208 SOM 0.01434 BD
Wilting point (WP) (Equation (9)):
WP = 0.000059 Sa + 0.001142 Si + 0.0005766 Cl + 0.002228 SOM + 0.002671 BD
where Sa is the percentages of sand, Si is the percentage of silt particles, Cl is the percentage of clay particles, SOM is the percentage of soil organic matter, and BD is bulk density.
Available water capacity (AWC) (Equation (10)):
AWC = FWC   WP     ( % )
where FWC is field water capacity in %, WP is the wilting point in %.
The SWDI characterizes drought based on soil moisture and calculated hydrological soil properties. This index is capable of adequately identifying the main attributes that define a drought event. For the calculation, the following formula was used:
Soil Water Deficit Index (SWDI) (Equation (11)):
SWDI   = ( SMa     FWC AWC   )   10
where SMa is actual soil moisture in %, FWC is field water capacity in %, AWC is available water capacity in %. The SWDI was proposed by Martinez-Fernandez et al. [40]. In the study, we used the SWDI as proxy indicator. Data used for the calculation does not fulfil standard requirements (e.g., SMa estimation for one day only). Thus, we used this proxy indicator mainly to see differences between ecosystems.
Higher values of SMa, FWC, WP, and AWC, in terms of volumetric soil water content, indicate higher soil WRHES capacity. In addition, SWDI positive values mean an excess of water in the soil. When SWDI is positive, soils have excess water; when it equals zero, soil is in the field capacity of the water content (that is, without water deficit). Negative values indicate soil drought, and the water deficit is absolute (wilting point) when the SWDI reaches ≤ −10. At this point, the soil water content is below the lower limit of available water for the plant [41]. The SWDI in the range 0–−2 means that mind, −2–−5 moderate, −5–−10 severe, and ≤−10 extreme drought level.

2.3. Chemical Methods

Soil samples were collected in September 2018 from a depth of 0–10 and 20–30 cm to observe differences in soil properties and hydraulic parameters between the upper and lower layers of the soil. Disturbed soil samples were collected for soil analysis. The soil samples were air dried, homogenized, sieved in 2 mm sieves, and the soil texture was analyzed using the pipette method according to Novák [32]. The particle size fractions (sand, silt, clay) were classified according to the United States Department of Agriculture (USDA) system. Sand has a particle size ranging from 0.05 to 2.0 mm, silt from 0.002 to 0.05 mm, and clay less than 0.002 mm. As chemical soil properties, pH was determined in H2O in a 1:2.5 ratio and in 1 M KCl solution in a 1:2.5 ratio by the potentiometric method, total soil organic carbon (SOC) using the oxdimetric method according to Tyurin (a modification of Nikitin) [42] which is similar to the Walkley–Black oxidation method. The SOC was oxidized by 0.2 M K2Cr2O7 with H2SO4. After oxidation, excess dichromate was determined by titration with a Mohr salt solution. The content of humic and fulvic acids was determined using the short fractionation method according to Kononova and Belchikova [43] using extraction with 0.1 M Na4P2O7.10H2O. Soil organic matter quality we evaluated by the ratio of humic to fulvic acids (HA/FA). Humic acids are more stable organic matter compounds. The ratio of humic and fulvic acids as indicator of soil quality has been suggested [44]. It is generally accepted that higher values of the HA/FA ratio are typical for more fertile soils with higher stability of organic matter.

2.4. Statistical Analysis

To identify the relationships between soil parameters, correlation analyses were performed using Pearson´s correlation coefficients and principal component analysis (PCA). Soil parameters were analyzed using analysis of variance (ANOVA). All statistical tests were performed in the SPSS Statistics software (version 19.0).

2.5. Remote Sensing Data

To describe land use and land cover changes (LULC) in this study area, two dates with their respective LULC maps were combined: 1950 and 2019. The LULC map for 1950 is a product of the Czechoslovakian military topography mapping. The 2019 map was generated from satellite images. The following categories were analyzed: (1) forest areas, (2) riparian vegetation, (3) other nonforest woody vegetation, (4) mosaic structures, (5) permanent grasslands, (6) arable land, (7) permanent crops, (8) industrial units and industrial parks, (9) mineral extraction sites, (10) other artificial surfaces, and (11) water bodies and areas.

3. Results

3.1. Soil Chemical and Physical Properties

The basic statistical characteristics of the chemical and physical properties of soils at the RZ, GL, and AL localities in two depths are reported in Table 1, Table 2 and Table 3. The measured properties showed their heterogeneity.
In general, soil pH/H2O ranged from 5.04 to 7.65, and pH/KCl from 4.13 to 7.20. Mean pH values were higher in the AL localities in both layers compared to the RZ and GL localities. Overall, the SOC ranged from 9.00 to 30.60 g kg−1 with higher content in the upper soil layers and at the RZ localities followed by the GL and AL localities. However, the quality of the organic matter expressed by the HA/FA ratio was better in the AL localities (expressed by higher values of the HA/FA ratio). In AL localities, the mean HA/FA ratio was higher in the upper soil layer, while in the RZ and GL localities it was the opposite (Table 1).
In general, the average clay content ranged from 4.25 to 42.28%. The lowest clay content was observed in the GL localities in both layers (range of 4.25 to 7.76%), followed by the RZ (range of 4.35 to 15.22%) and AL (range of 8.50 to 42.28%) localities (Table 2).
In general, PD ranged from 2.04 to 2.67 g cm−3 and BD from 0.64 to 1.54 g cm−3. Mean BD values were higher at AL localities at both depths compared to RZ and GL localities. The mean Pt value was highest at the RZ localities in both soil layers followed by the GL and AL localities. The mean Pt value was higher in the upper layer at RZ and GL localities, and, conversely, the mean Pn value was lower in the upper layer at both ecosystem types. The mean value of Pc was higher in the upper layer in all ecosystems. The mean Ps value was lowest in the AL localities compared to the RZ and GL localities. (Table 3).

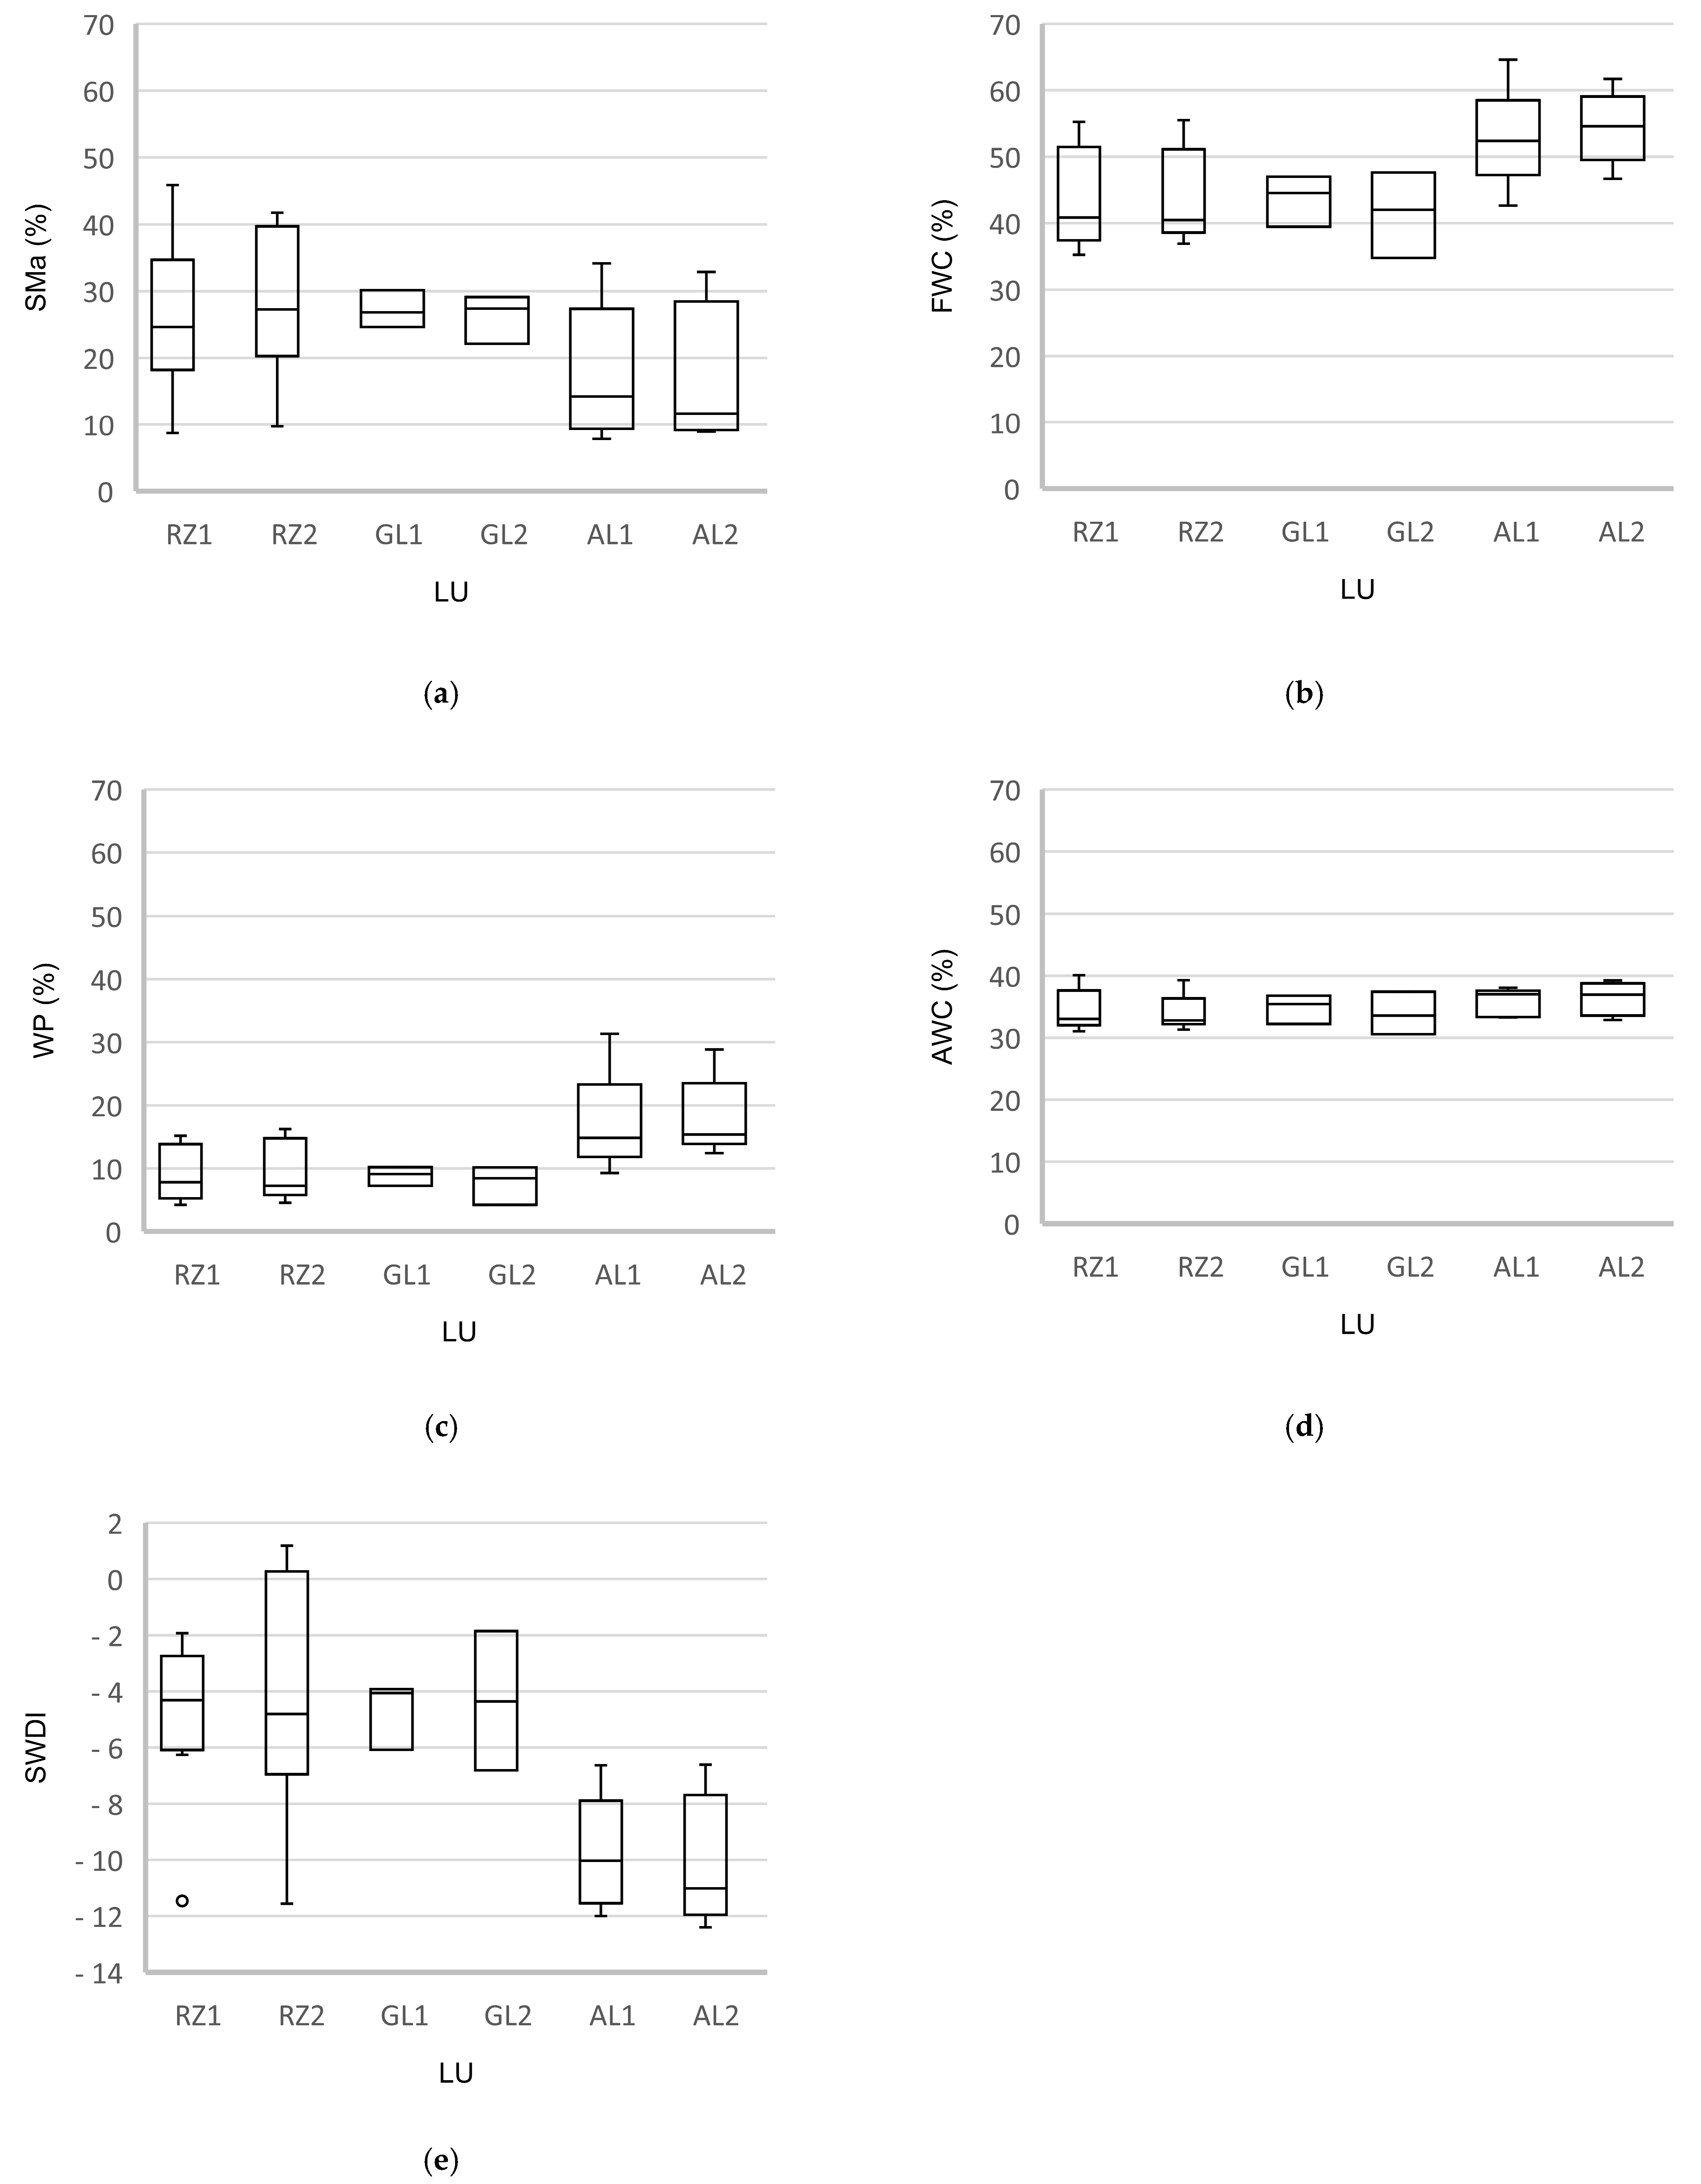
3.2. Soil Hydrological Properties Evaluation in Relation to Soil Water Retention Hydrological Ecosystem Services

The soil hydrological properties were estimated along the Štiavnica River for three different ecosystems (RZ, GL, AL) in both soil layers. The median values of the estimated FWC (Figure 2b), WP (Figure 2c), and AWC (Figure 2d) were lowest in the RZ localities followed by the GL and AL localities. The median SMa (Figure 2a) was highest in the RZ localities in the second soil layer with very similar values in the RZ localities followed by the AL localities. Similarly, AL localities reached the lowest values for SWDI (Figure 2e).
The differences in soil hydrological properties between two soil layers within one ecosystem type were not very distinctive.
The hydrological properties estimated with the help of pedotransfer functions (FWC, WP, AWC) showed a higher soil water retention potential at AL localities. On the contrary, the SMa and SWDI values showed a higher soil water retention potential in extensively used ecosystems, such as GL and RZ. This finding indicates that in addition to the soil, other factors are involved in the fulfillment of WRHESs.

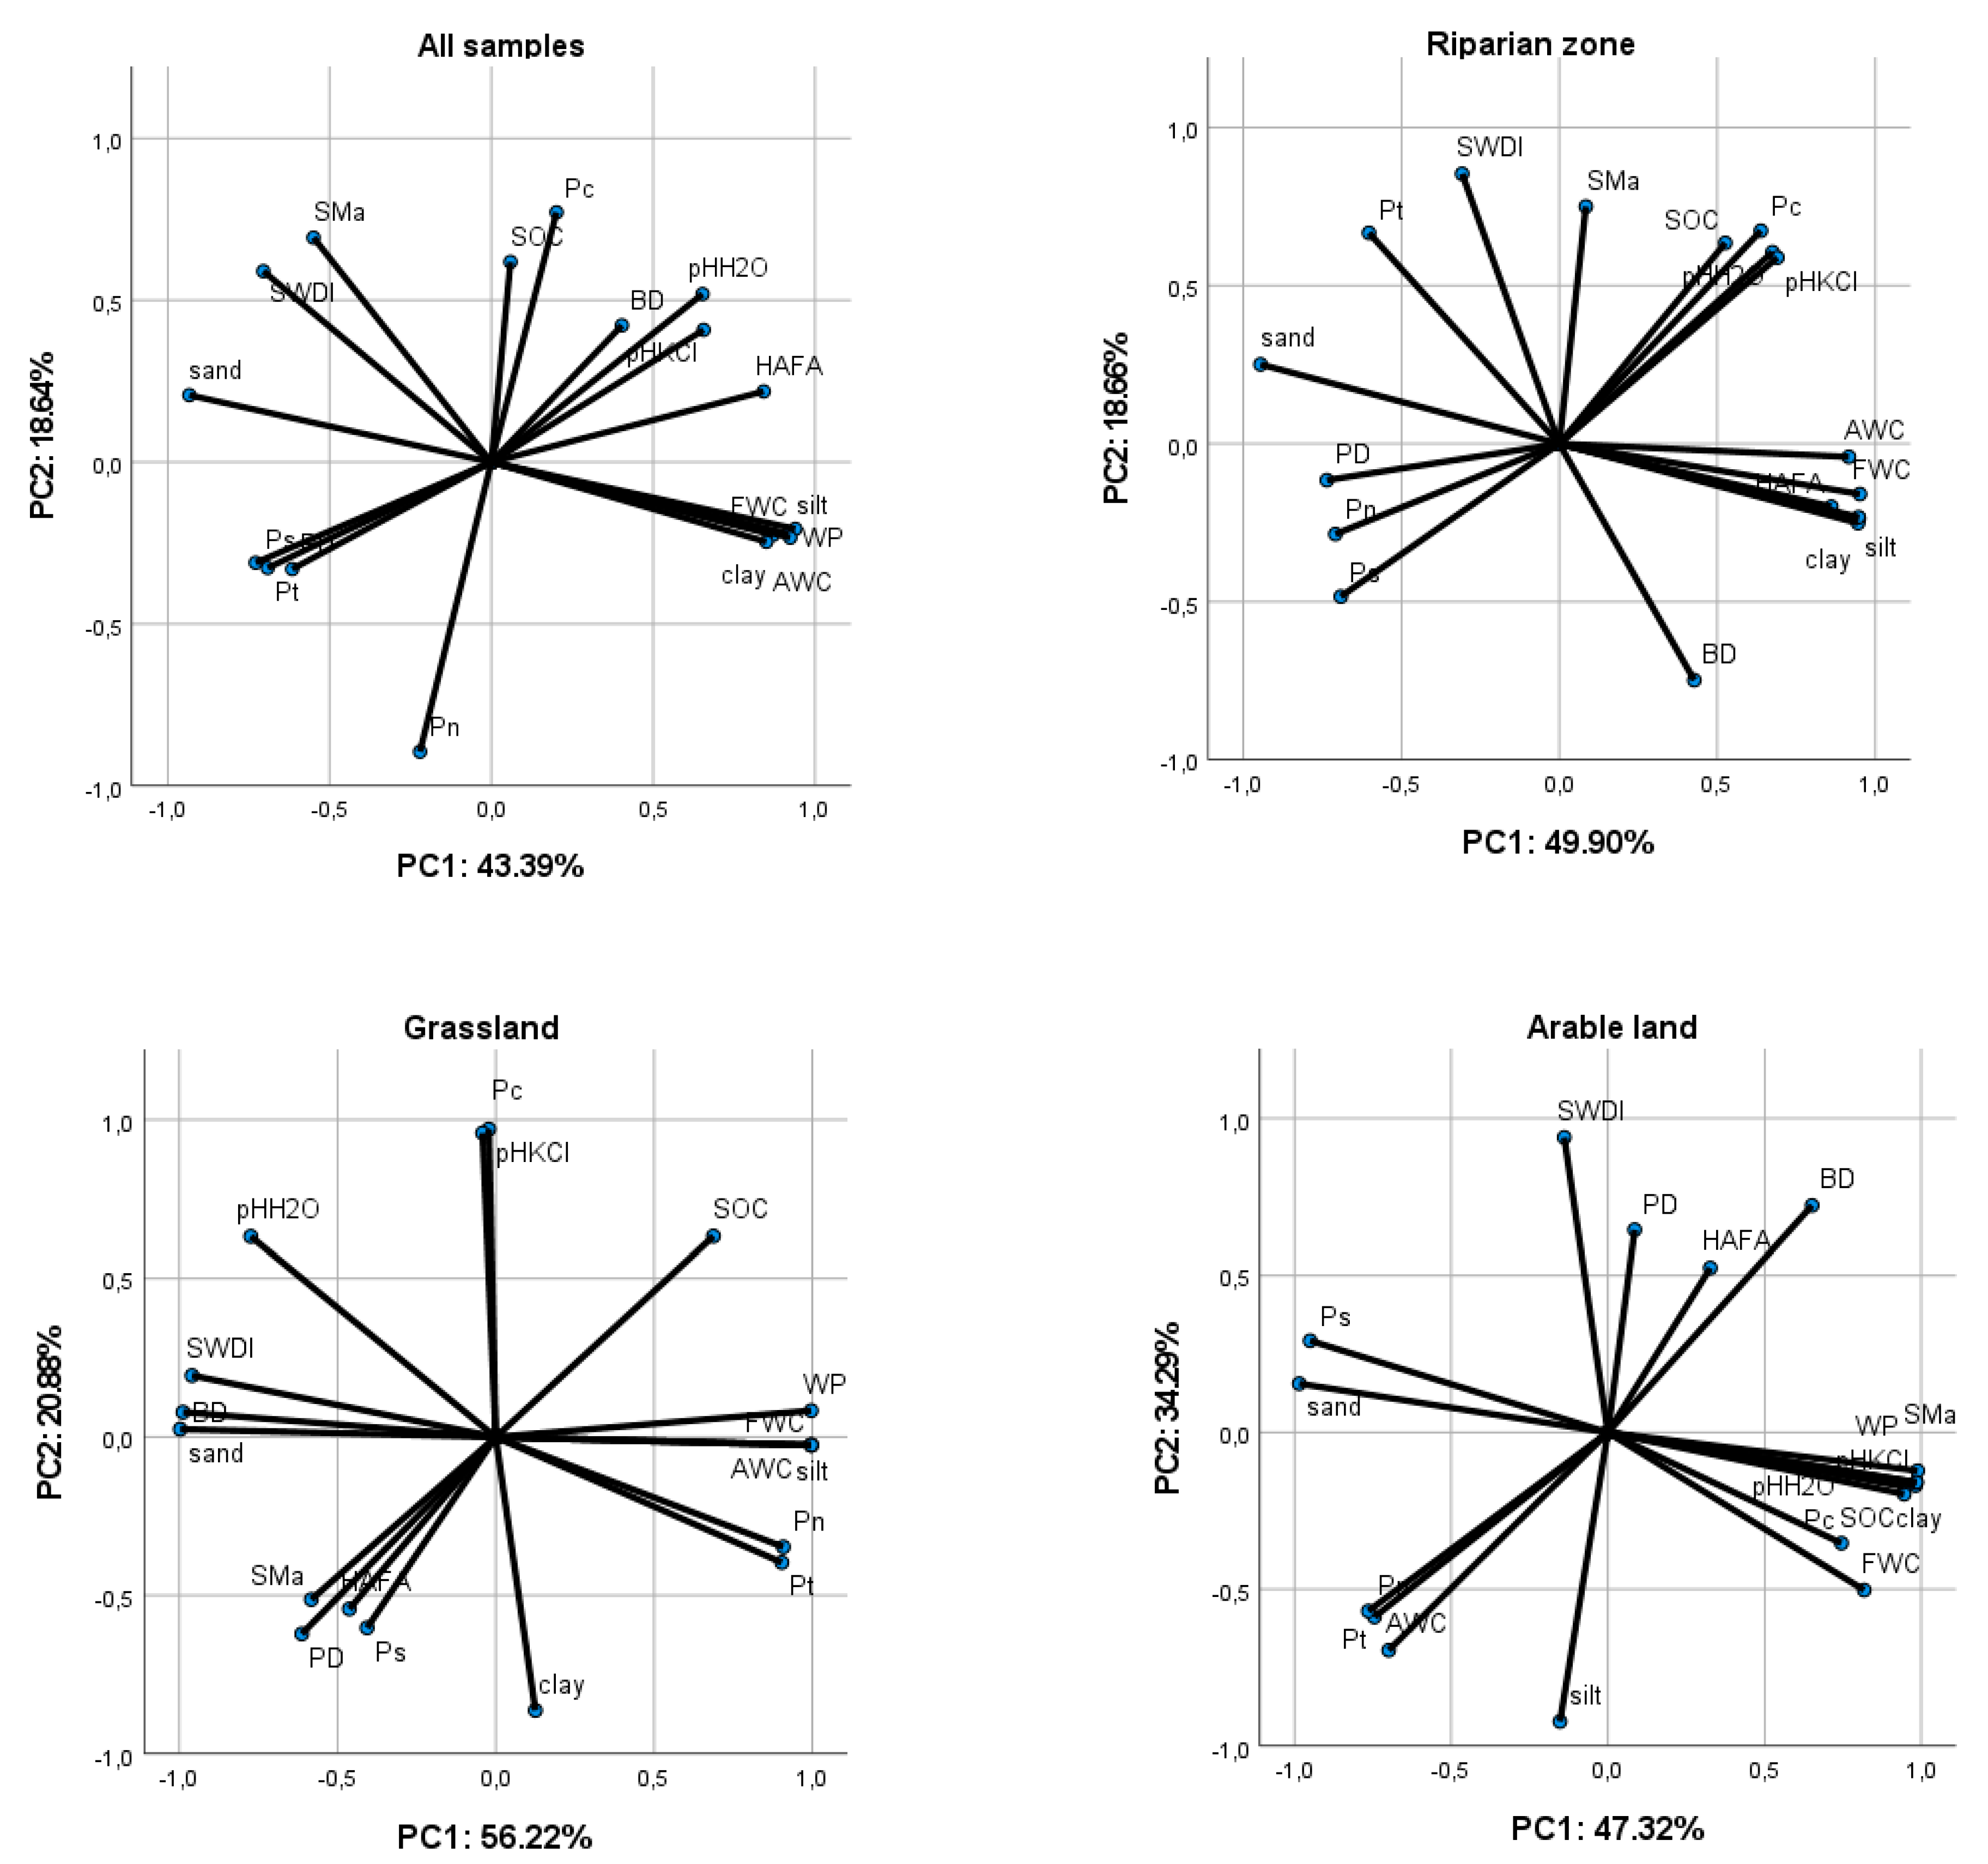
3.3. Relationships between Soil Properties, Ecosystems, Land Uuse, and Soil Layers

Many significant correlations between soil properties were established (Table 4). Estimated hydrological properties were significantly correlated mainly with particle size fractions, the HA/FA ratio as an indicator of soil organic matter quality, and semi-capillary porosity. Correlations with pH, BD, total porosity, and capillary porosity were also recorded. We recorded no correlations between hydrological properties and SOC or non-capillary porosity.
Principal component analysis (PCA) was used to observe relationships between variables (Table 5, Figure 3). The first two factors can explain more than 60% of the total variance in the all and RZ localities, more than 70% in the GL localities, and more than 80% in the AL localities. The FWC, WP, and AWC, clearly strongly positively correlated with factor no. 1 at all, RZ, GL localities (more than 0.9), and AL localities (besides AWC). In contrast, at AL localities, FWC and WP clearly strongly negatively correlated with factor no. 1. SMa was strongly positively correlated with factor no. 1 at the AL localities (0.989). At the RZ and all localities, SMa was positively correlated with factor no. 2.
Based on the results of the ANOVA, significant differences emerged between the different ecosystems for pH/H2O, clay, silt, sand, BD, Pt, Ps, FWC, WP, and SWDI (Table 6). The effect of the soil layer on the soil properties was revealed only in the case of SOC.

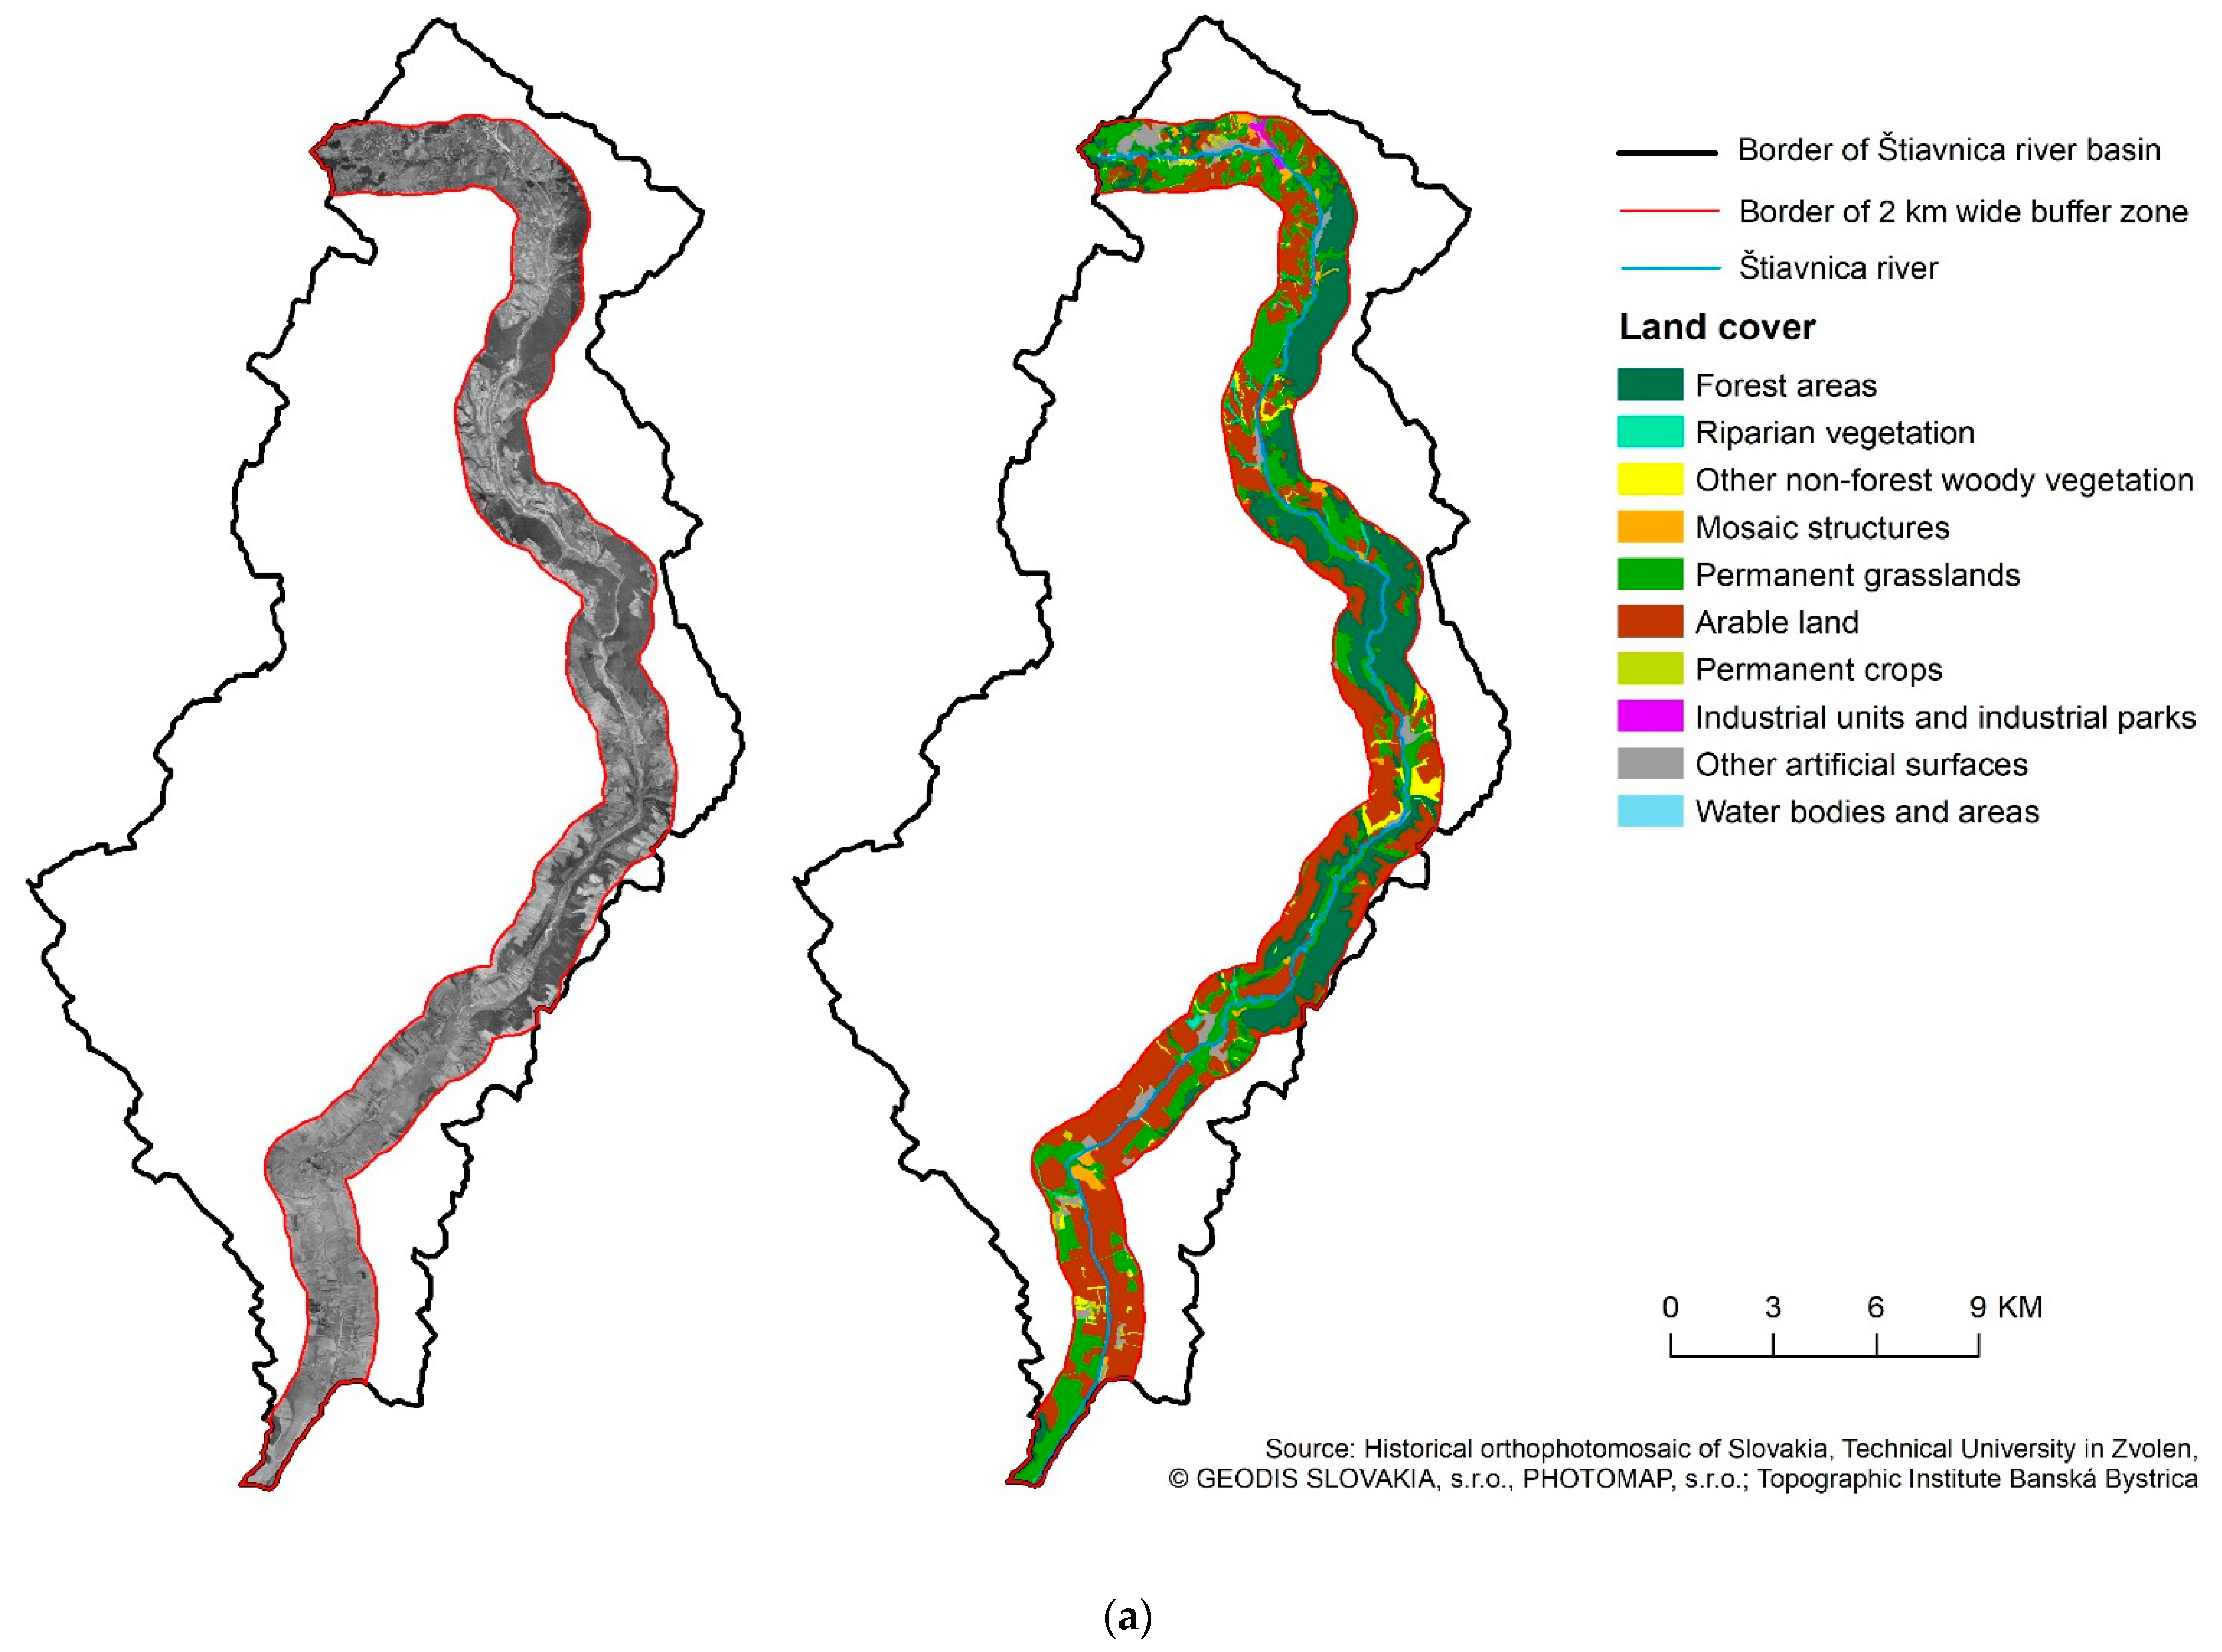
3.4. Land Use and Land Cover Changes in Floodplain and Their Impact on Hydrological Ecosystem Services

The LULC composition of the floodplain suffered changes during a period of 70 years (Figure 4, Table 7). In 1950, the landscape was predominantly devoted to agricultural activities. Arable land accounted for 37.2% and permanent grasslands for 26.3% of the study area. The forest areas covered 25.6% and riparian vegetation only 1.4% of the study area. In 2019, due to the management decision, forest areas increased to a cover of 32.5%. The increase was recorded for other non-forest woody vegetation, permanent crops, industrial, and artificial surfaces. Arable land and permanent grasslands decreased to 31.4% and 16.9%, respectively. Riparian vegetation decreased to cover 1.1%.

4. Discussion

4.1. Soil Hydrological Properties and Their Relationships with Soil Properties

Fluvisols located on the Štiavnica River floodplain showed heterogeneity in soil properties, including hydrological properties, which is in line with many studies [45,46]. Soil hydrological characteristics belong to the most important factors for plant growth, microbial activity, and nutrient cycling [47]. The estimated hydrological properties are important parameters used to characterize the capacity of soil to provide water for plant growth. They are useful for many ecosystem and agronomic purposes and for measuring relative differences among soils. They represent a practical and easily understandable coefficient for measuring the ability of a soil to store and retain water, and thus contribute to HESs. Higher values of hydrological property mean higher soil contribution to water retention HESs.
The texture of the soil and the content of organic matter play an important role in the physical and hydrological properties of the soil [48]. We found correlations between hydrological parameters and selected soil characteristics. The proportion of sand, silt, and clay and the amount of organic matter present in the soil is important [49,50]. The textural composition differed strongly between the localities, and the clay content varied between 4.25 and 42.28%. The SOC content was generally higher for topsoil (from 10.65 to 30.60 g kg−1) than for subsoil (from 9.00 to 22.95 g kg−1). The combination of soil organic matter amount with soil texture affects the bound water held in soil matrix either via electrostatic forces at adsorption sites and/or surface tension (capillary forces) in soil pores.
Water storage and retention are directly related to pore volume and its categories [51]. In the study, expressed as mean values, the RZ localities showed a higher total porosity in both soil layers and capillary porosity in the second soil layer. In the case of AL localities, the average Pc value was higher in the first soil layer, indicating the positive impact of proper agricultural soil management on hydrophysical soil properties in the surface soil layer. The semi-capillary porosity expressed by the average value was significantly higher at the RZ localities compared to AL in both soil layers. The proportion of pores is also reflected in the actual soil moisture content. Higher values were observed at the RZ localities in both soil layers. The forms of extensive land use, such as forests, show higher capillary porosity compared to agricultural land [52], which has a positive impact on the soil water regime. Porosity and other soil properties reflected in the values of hydrological parameters.
In the study, FWC, WP, and AWC were significantly correlated with particle size fractions, which is a logical consequence of using the soil texture in the calculation. However, we did not find a correlation between hydrological properties and the amount of organic carbon in the soil. Soil organic carbon can improve soil quality by improving soil structure and improving soil moisture regime. Therefore, SOC is also suggested as a means of drought management. Yet, there is still no clear consequence on its quantitative effect [53]. Libohova et al. [54] stated that there have been overestimates of the amount of water that soil organic matter increase can contribute to the available water holding capacity. However, we found a correlation between hydrological properties and organic matter quality expressed by the HA/FA ratio. Humic acids are typically comprised of aliphatic and aromatic moieties with multiple functional groups (e.g., -OH, -COOH), which enables their adsorption onto solids [55]. They are able to withstand degradation for long periods. Humic acids play several important roles, such as an increase in soil physical and biochemical activities by improving soil texture and water holding capacity [56,57,58].
The results also indicated that physical properties and hydrological parameters are controlled not only by the soil constituents, such as mineral and organic particles but also by other factors. The pH values of soil in the natural environment have an enormous influence on the biogeochemical processes of the soil [59]. Therefore, soil pH is described as the master soil variable that influences many biological, chemical, and physical properties and processes of the soil that can affect the availability of water for plant growth and biomass yield [60].

4.2. Hydrological Properties and Water Retention Hydrological Ecosystem Services

Hydrological properties are the most important in monitoring the water cycle and drought [35]. Higher values of hydrological properties mean higher soil capacity for water storage and retention HESs. Using pedotransfer functions as soil texture, SOC, and BD we estimated higher average values of FWC, WP, and AWC at AL localities compared to RZ and GL localities. On the contrary, taking into account also the actual soil moisture content for the SWDI calculation, we found higher values for SWDI at GL and RZ localities. This indicates the importance of other factors, including organic matter quality or vegetation cover, having an impact on water retention in soil.
The average proxy SWDI values were negative in all three ecosystems which should indicate soil drought. The SWDI is considered a promising approach to use soil physical characteristics to measure available soil moisture in the root zone [61,62]. It has a greater biophysical meaning than other vegetation indices or climatic variables, and even some methods based on soil moisture [63].
In this regard, the study results can indicate further possibilities on how to improve the WRHESs capacity. The addition of inorganic or organic additives in different forms to the soil can improve WRHESs. Traditional materials (farmyard manure) have long been used in agriculture, having a positive effect on water holding and retention capacity [64]. In recent years, numerous approaches have been proposed to alleviate soil water holding capacity, including biochar application [65] and superabsorbent polymers [66]. Mi et al. [67] proved that bentonite application would have beneficial effects on the soil water holding properties. However, these practices can not only have a positive effect on hydrophysical properties, as in the case of biochar addition [68], but also a negative effect, as in the case of pig slurry use, which supports soil hydrophobicity [69]. Therefore, for optimal land management in relation to WRHESs, various aspects should be considered and taken into account based on the knowledge and evaluation of basic physical and hydrological properties. In particular, sustainable management based on nature-based solutions can simultaneously provide environmental, social, and economic benefit [70] and provide diverse ecosystem services.

4.3. Impact of Ecosystems and Land Use on Soil Hydrological Properties and Services

The ANOVA revealed an effect of different ecosystems on some physical and hydrological properties. There are studies that confirmed the effect of ecosystems and land use and cover on the textural composition of Fluvisols, the bulk density, porosity, and the quality of the humus and thus the effect on the fulfillment of WRHESs [71,72,73,74].
These results emphasized the importance of riparian ecosystems and grasslands in floodplains. Mostly RZ provide high values of evapotranspiration and contribute to the fulfillment of HESs [75]. In addition, Felipe-Lucia and Comin [76] stressed the importance of the mosaic character of the landscape, which can support HESs. The character of the mosaic and its heterogeneity are guarantees of stability and sustainability. Maintenance of agricultural land in floodplains, together with riparian and grasslands ecosystems, extensive or proper intensive management of agricultural land, could be an ecological solution to maintain a balanced water budget and HESs. Understanding the relationships between soil parameters that affect WRHESs is of importance for sustainable floodplain management [77]. Furthermore, WRHESs can be considered as suitable indicators for assessing ecological stability and resilience [78]. Therefore, management and regulation strategies regarding these ecosystems are fundamental to the provision of WRHESs on a regional scale [79]. However, these facts are often ignored [80], and severe WRHESs losses in floodplains were observed when provisioning services were strengthened [81], often at the expense of RZ localities. In our study we also confirmed the decrease of areas of riparian vegetation and grasslands. In this case, the extension of riparian zones and grasslands in the future would be desirable. The increase in forest area was positive because afforestation can have many positive impacts, including carbon sequestration, increasing soil organic carbon, improving soil structure, improving the landscape and biodiversity. Compared to an extensive form of management, intensive arable cropping has a large impact on soil properties and their dynamic due to frequent soil disturbance. Although the arable land area decreased during 70 years in the observed territory, its homogenous character is not suitable for sustainable management. In addition, land management practices must be adopted in agriculture to ensure both provisioning and hydrological ecosystem services.

5. Conclusions

We found heterogeneity in the chemical and physical soil properties of the soil in the floodplain of the Štiavnica River reflected in the hydrological properties. Higher values of hydrological properties meant higher soil capacity for WRHESs. Using pedotransfer functions (soil texture, SOC, and BD), we estimated higher average values of FWC, WP, and AWC at AL localities compared to RZ and GL localities. On the contrary, also taking into account the actual soil moisture content, we found higher values for proxy SWDI at GL and RZ localities. This indicates the importance of other soil and ecosystem factors, including organic matter quality or vegetation cover, that impact WRHESs. In addition, the ANOVA results confirmed an effect of different ecosystems on most observed soil chemical, physical, and hydrological properties. The results indicated the effect of different ecosystems on soil WRHES and the importance of extensively managed ecosystems, such as RZ and GL. Their areas in the floodplain of the Štiavnica River were reduced during a period of the last 70 years. The extensively used ecosystems are irreplaceable in providing WRHESs in floodplains, and their areas should be extended in the future. Such results should be taken into account in land use management and landscape architecture. Floodplains provide multiple ecosystem services, and WRHES should not be underestimated because of many indirect effects on all other services.

Author Contributions

Conceptualization: R.K.; methodology: R.K.; soil analysis: N.B., J.Š., M.K. and Ľ.J.; spatial and land use analysis and outputs: M.M.; investigation: R.K., N.B., J.Š., M.M., M.K. and Ľ.J.; resources: R.K.; data processing: R.K. and J.F.; writing—original draft preparation: R.K.; writing—review and editing: N.B., J.Š., M.M.; M.K., Ľ.J. and J.F.; project administration: R.K.; funding acquisition: R.K. All authors have read and agreed to the published version of the manuscript.

Funding

This work was supported by the Scientific Grant Agency of the Ministry of Education, Science, Research, and Sport of the Slovak Republic under contract no. VEGA 1/0184/21.

Institutional Review Board Statement

Not applicable.

Informed Consent Statement

Not applicable.

Data Availability Statement

Not applicable.

Acknowledgments

This work was supported by the Scientific Grant Agency of the Ministry of Education, Science, Research and Sport of the Slovak Republic under contract no. VEGA 1/0184/21. The research of soil parameters was done using equipment supported by Operational Programme Research and Development under contract no. ITMS-26210120024.

Conflicts of Interest

The authors declare no conflict of interest.

References

  1. Burkhard, B.; de Groot, R.; Costanza, R.; Seppelt, R.; Jorgensen, S.E.; Potschin, M. Solutions for sustaining natural capital and ecosystem services. Ecol. Indic 2012, 21, 1–32. [Google Scholar] [CrossRef]
  2. Millennium Ecosystem Assessment. Ecosystems and Human Well-Being: Current State and Trends; Island Press: Washington, DC, USA, 2005. [Google Scholar]
  3. Yin, C.; Zhao, W.; Cherubini, F.; Pereira, P. Integrate ecosystem services into socio-economic development to enhance achievement of sustainable development goals in the post-pandemic era. Geogr. Sustain. 2021, 2, 68–73. [Google Scholar] [CrossRef]
  4. United Nations. Transforming Our World: The 2030 Agenda for Sustainable Development; General Assembly 70 Session; United Nations: New York, NY, USA, 2015. [Google Scholar]
  5. Wood, S.L.R.; Jones, S.K.; Johnson, J.A.; Brauman, K.A.; Chaplin-Kramer, R.; Fremier, A.; Givetz, E.; Gordon, L.J.; Kappel, C.V.; Mandle, L.; et al. Distilling the role of ecosystem services in the sustainable development goals. Ecosyst. Serv. 2018, 29, 70–82. [Google Scholar] [CrossRef]
  6. Palacios, E.; van Beukering, P.P.J.H.; van Zanten, B.; Lacle, F.; Schep, S.; Soellner, I. Linking ecosystem services and the sustainable development goals in small island developing states: The cas of Aruba. One Ecosyst. 2021, 6, e71033. [Google Scholar] [CrossRef]
  7. CICES. Common International Classification of Ecosystem Services (CICES); Update European Environment Agency: Nottingham, UK, 2011. [Google Scholar]
  8. Zhen, H.; Gao, W.; Yuan, K.; Ju, X.; Qiao, Y. Internalizing externalities through net ecosystem service analysis—A case study of greenhouse vegetable farms in Beijing. Ecosyst. Serv. 2021, 50, 101323. [Google Scholar] [CrossRef]
  9. Schmalz, B.; Kruse, M.; Kiesel, J.; Müller, F.; Fohrer, N. Water-related ecosystem services in Western Siberian lowland basins –Analysing and pamming spatial and seasonal effect on regulating services based on ecohydrological modelling results. Ecol. Indic. 2016, 71, 55–65. [Google Scholar] [CrossRef]
  10. Brauman, K.A.; Daily, G.C.; Duarte, T.K.; Mooney, H.A. The nature and value of ecosystem services: An overview highlighting hydrologic services. Annu. Rev. Environ. Resour. 2007, 32, 67–98. [Google Scholar] [CrossRef]
  11. Liquete, C.; Piroddi, C.; Drakou, E.G.; Gurney, L.; Katsanevakis, S.; Charef, A.; Egoh, B. Current status and future prospects for the assessment of marine and coastal ecosystem services: A systematic review. PLoS ONE 2013, 8, e67737. [Google Scholar] [CrossRef]
  12. Cerbari, V.; Stegarescu, G. Quality assessment of an irrigated Fluvisol. Sci. Papers. Ser. A Agron. 2016, LIX, 33–38. Available online: http://agronomyjournal.usamv.ro/pdf/2016/Art4.pdf (accessed on 24 April 2022).
  13. FAO. Status of the World´s Soil Resources–Main Report; FAO: Rome, Italy, 2015; 75p, ISBN 978-92-5-109004-6. [Google Scholar]
  14. Tockner, K.; Standford, J.A. Riverine flood plains. Present state and future trends. Environ. Conserv. 2002, 29, 308–330. [Google Scholar] [CrossRef]
  15. Gutierrez-Arellano, C.; Mulligan, M. A review of regulation ecosystem services and disservices from faunal populations and potential impacts of agriculturalisation on their provision, globally. Nat. Conserv. 2018, 30, 1–39. [Google Scholar] [CrossRef] [Green Version]
  16. Adhikari, K.; Hartemink, A.E. Linking soils to ecosystem services—A global review. Geoderma 2016, 262, 101–111. [Google Scholar] [CrossRef]
  17. McBratney, A.B.; Field, D.J.; Koch, A. The dimensions of soil security. Geoderma 2014, 213, 203–213. [Google Scholar] [CrossRef]
  18. Bouma, J.; Kwakernaak, C.; Bonfante, A.; Stoorvogel, J.J.; Dekker, L.W. Soil science input in transdisciplinary projects in the Netherlands and Italy. Geod. Reg. 2015, 5, 96–105. [Google Scholar] [CrossRef]
  19. Costanza, R.; d´Arge, R.; de Groot, R.; Farber, S.; Grasso, M.; Hannon, B.; Limburg, K.; Naeem, S.; O´Neil, R.; Paruelo, J.; et al. The value of the world´s ecosystem services and natural capital. Nature 1997, 387, 253–260. [Google Scholar] [CrossRef]
  20. Maes, J.; Egoh, B.; Willemen, L.; Liquete, C.; Vihervaara, P.; Schägner, J.P.; Grizzetti, B.; Drakou, E.G.; LaNotte, A.; Zullian, G.; et al. Mapping ecosystem services for policy support and decision making in the European Union. Ecosyst. Serv. 2012, 1, 31–39. [Google Scholar] [CrossRef]
  21. Burkhard, B.; Santos-Martin, F.; Nedkov, S.; Maes, J. An operational framework for integrated mapping and assessment of ecosytems and their services (MAES). One Ecosyst. 2018, 3, e22831. [Google Scholar] [CrossRef]
  22. Guerra, C.A.; Pinto-Correia, T.; Metzger, M.J. Mapping soil erosion prevention using an ecosystem service modeling framework for integrated land management and policy. Ecosystems 2014, 17, 878–889. [Google Scholar] [CrossRef]
  23. Sumarga, E.; Hein, L. Mapping ecosystem services for land use planning, the case of Central Kalimantan. Environ. Manag. 2014, 54, 84–97. [Google Scholar] [CrossRef]
  24. Bartkowski, B.; Hansjürgens, B.; Möckel, S.; Bartke, S. Institutional economics of agricultural soil ecosystem services. Sustainability 2018, 10, 2447. [Google Scholar] [CrossRef]
  25. Lagrosa, J.J.; Zipperer, W.C.; Andreu, M.G. An ecosystem services-centric land use and land cover classification for a subbasin of the Tampa Bay Watershed. Forests 2022, 13, 745. [Google Scholar] [CrossRef]
  26. Vihaervaara, P.; Viinikka, A.; Brandr, L.; Santos-Martín, F.; Poikolainen, L.; Nedkov, S. Methodological interlinkages for mapping ecosystem services—from data to analysis and decision-support. One Ecosyst. 2019, 4, e26368. [Google Scholar] [CrossRef]
  27. Cresswell, H.P.; Coquet, Y.; Bruand, A.; McKenzie, N.J. The transferability of Australian pedotransfer functions for predicting water retention characteristics of French soils. Soil Use Manag. 2006, 22, 62–70. [Google Scholar] [CrossRef]
  28. Souza, R.; Souza, E.; Netto, A.M.; De Almeida, A.Q.; Barros Júnior, G.; Silva, J.R.I.; De Sousa Lima, J.R.; Antonino, A.C.D. Assessment of the physical quality of a Fluvisol in the Brazilian semiarid region. Geoderma Reg. 2017, 10, 175–182. [Google Scholar] [CrossRef]
  29. Piedallu, C.; Gégout, J.C.; Bruand, A.; Seynave, I. Mapping soil water holding capacity over large areas to predict potential production of forest stands. Geoderma 2011, 160, 355–366. [Google Scholar] [CrossRef]
  30. Nemes, A.; Wosten, J.H.M.; Bouma, J.; Várallyay, G. Soil water balance scenario studies using predicted soil hydraulic parameters. Hydrol. Processes 2006, 20, 1075–1094. [Google Scholar] [CrossRef]
  31. Klinda, L. Landscape Atlas of the Slovak Republic; IAEA: Vienna, Austria, 2003; 344p, ISBN 80-88833-27-2. [Google Scholar]
  32. Klika, J.; Novák, A.; Gregor, A. Practical Lessons in Phytocenology, Ecology, Climatology and Soil Science; NCSAV: Praha, Czech Republic, 1954. (In Czech) [Google Scholar]
  33. Blake, G.R.; Hartage, K.H. Particle density. In Methods of Soil Analysis, Part 1, Physical and Mineralogical Methods—Agronomy Monograph No.9; American Society of Agronomy—Soil Science Society of America: Madison, WI, USA, 1986; pp. 377–382. [Google Scholar]
  34. Van Looy, K.; Bouma, J.; Herbst, M.; Koestel, J.; Minasny, B.; Mishra, U.; Montzka, C.; Nemes, A.; Pachepsky, Y.A.; Padarian, J.; et al. Pedostransfer functions in earth system science: Challenges and perspectives. Rev. Geophys. 2017, 55, 1199–1256. [Google Scholar] [CrossRef]
  35. Wu, X.; Lu, G.; Wu, Z.; He, H.; Zhou, J.; Liu, Z. An integration approach for mapping field capacity of China based on multi-source soil datasets. Water 2018, 10, 728. [Google Scholar] [CrossRef]
  36. Haberle, J.; Duffková, R.; Raimanová, I.; Fučík, P.; Svoboda, P.; Lukas, V.; Kurešová, G. The 13C discrimination of crops identifies soil spatial variability related to water shortage vulnerability. Agronomy 2020, 10, 1691. [Google Scholar] [CrossRef]
  37. Vopravil, J.; Formánek, P.; Janku, J.; Khel, T. Soil water dynamics in drained and undrained meadows. Soil Water Res. 2021, 16, 256–267. [Google Scholar] [CrossRef]
  38. Gupta, S.C.; Larson, W.E. Estimating soil water retention characteristics from particle size distribution, organic matter percent, and bulk density. Water Resour. Res. 1979, 15, 1633–1635. [Google Scholar] [CrossRef]
  39. Botula, Y.D.; Cornelis, W.M.; Baert, G.; Van Ranst, E. Evaluation of pedotransfer functions for predicting water retention of soils in Lower Congo (D.R.Congo). Agric. Water Manag. 2012, 111, 1–10. [Google Scholar] [CrossRef]
  40. Martínez-Fernández, J.; González-Zamora, A.; Sánchez, N.; Gumuzzio, A. A soil water based index as a suitable agricultural drought indicator. J. Hydrol. 2015, 522, 265–273. [Google Scholar] [CrossRef]
  41. Sevage, M.J.; Ritchie, J.T.; Bland, W.L.; Dugas, W.A. Lower limit of soil water availability. Agron. J. 1996, 88, 644–651. [Google Scholar] [CrossRef]
  42. Nikitin, V.; Fishman, V. On the improvement of methods for determination of soil carbon. Chem. Agric. 1969, 3, 76–77. [Google Scholar]
  43. Kononova, M.M. Soil Organic Matter. Its Nature, Its Role in Soil Formation and in Soil Fertility; Pergamon Press: London, UK, 1966. [Google Scholar]
  44. Schmidt, M.W.I.; Torn, M.S.; Abiven, S.; Dittmar, T.; Guggenberger, G.; Janssesn, I.A.; Kleber, M.; Kögel-Knabner, I.; Lehmann, J.; Manning, D.A.C.; et al. Persistence of soil organic matter as an ecosystem property. Nature 2011, 478, 49–56. [Google Scholar] [CrossRef]
  45. Zglobicki, W.; Telecka, M.; Pasierbinska, A. Impact of physicochemical characteristics of colluvial and alluvial soils on Cd, Cu, Pb, and Zn content (East Poland). Pol. J. Soil Sci. 2015, 48, 213–228. [Google Scholar] [CrossRef]
  46. Kercheva, M.; Sokolowska, Z.; Hajnos, M.; Skic, K.; Shishkov, T. Physical parameters of Fluvisols on flooded and non-flooded terraces. Int. Agrophys. 2017, 31, 73–82. [Google Scholar] [CrossRef]
  47. Breda, N.; Hur, R.; Granier, A.; Dreyer, E. Temperate forest trees and stands under severe drought: A review of ecophysiological responses, adaptation processes and long-term consequences. Ann. For. Sci. 2006, 63, 625–644. [Google Scholar] [CrossRef]
  48. Smolczynski, S.; Orzechowski, M.; Kalisz, B.; Sowinski, P.; Urbanowicz, P. Soil Air-Water Properties in Catena of Sepopol Lowland. Pol. J. Soil Sci. 2016, 49, 91–99. [Google Scholar] [CrossRef]
  49. Rawls, W.J.; Pachepsky, Y.A.; Ritchie, J.C.; Sobecki, T.M.; Bloodworth, H. Effect of soil organic carbon on soil water retention. Geoderma 2003, 116, 61–76. [Google Scholar] [CrossRef]
  50. Ciarkowska, K. Organic matter transformation and porosity development in non-reclaimed mining soils of different ages and vegetation covers: A field study of soils of the zinc and lead ore area in SE Poland. J. Soils Sediments 2017, 17, 2066–2079. [Google Scholar] [CrossRef]
  51. Vogel, H.J.; Eberhardt, E.; Franko, U.; Lang, B.; Lies, M.; Weller, U.; Wiesmeier, M.; Wollchläger, U. Quantitative evaluation of soil functions: Potential and state. Front. Environ. Sci. 2019, 7, 164. [Google Scholar] [CrossRef]
  52. Marfo, T.D.; Datta, R.; Vranová, V.; Ekielski, A. Ecotone dynamics and stability form soil perspective: Forest-Agriculture land transition. Agriculture 2019, 9, 228. [Google Scholar] [CrossRef]
  53. Minasny, B.; McBratney, A.B. Limited effect of organic matter on soil available water capacity. Eur. J. Soil Sci. 2018, 69, 39–47. [Google Scholar] [CrossRef]
  54. Libohova, Z.; Seybold, C.; Wysocki, D.; Wills, S.; Schoeneberger, P.; Williams, C.; Lindbo, D.; Scott, D.; Owens, P.R. Reevaluating the effects of soil organic matter and other properties on available water-holding capacity using the National Cooperative Soil Survey Characterization Database. J. Soil Water Conserv. 2018, 73, 411–421. [Google Scholar] [CrossRef]
  55. Sutton, R.; Sposito, G. Molecular structure in soil humic substances: The new view. Environ. Sci. Technol. 2005, 39, 9009–9015. [Google Scholar] [CrossRef]
  56. Nardi, S.; Ertani, A.; Francioso, O. Soil-root cross-talking: The role of humic substances. J. Plant Nutr. Soil Sci. 2017, 180, 5–13. [Google Scholar] [CrossRef]
  57. Fuentes, M.; Baigorri, R.; González-Gaitano, G.; Garcia-Mina, J.M. New methodology to assess the quantity and quality of humic substances in organic materials and commercial products for agriculture. J. Soils Sediments 2018, 18, 1389–1399. [Google Scholar] [CrossRef]
  58. Shah, Z.H.; Rehman, H.M.; Akhtar, t.; Alsamadany, H.; Hamooh, B.T.; Mujtaba, T.; Daur, I.; Al Zahrani, Y.; Alzahrani, H.A.S.; Ali, S.; et al. Humic substances: Determining potential molecular regulatory processes in plants. Front. Plant. Sci. 2018, 9, 263. [Google Scholar] [CrossRef]
  59. Neina, D. The role of soil pH in plant nutrition and soil remediation. Appl. Environ. Soil Sci. 2019, 2019, 5794869. [Google Scholar] [CrossRef]
  60. Minasny, B.; Hong, S.Y.; Hartemink, A.E.; Kim, Y.H.; Kang, S.S. Soil pH increase under paddy in South Korea between 2000 and 2012. Agric. Ecosyst. Environ. 2016, 221, 205–213. [Google Scholar] [CrossRef]
  61. Paredes-Trejo, F.; Barbosa, H. Evaluation of the SMOS-Derived Soil Water Deficit Index as Agricultural Drought Index in Northeast of Brazil. Water 2017, 9, 377. [Google Scholar] [CrossRef]
  62. Bai, J.; Cui, Q.; Chen, D.; Yu, H.; Mao, X.; Meng, L.; Cai, Y. Assessment of the SMAP-Derived Soil Water Deficit Index (SWDI-SMAP) as an Agricultural Drought Index in China. Remote Sens. 2018, 10, 1302. [Google Scholar] [CrossRef]
  63. Martínez-Fernández, J.; González-Zamora, A.; Sánchez, N.; Gumuzzio, A.; Herrero-Jiménez, C.M. Satellite soil moisture for agricultural drought monitoring: Assessment of the SMOS derived Soil Water Deficit Index. Remote Sens. Environ. 2016, 177, 277–286. [Google Scholar] [CrossRef]
  64. Ejaz, M.K.; Aurangzaib, M.; Iqbal, R.; Shahzman, M.; Habib-ur-Rahman, M.; El-Sharnouby, M.; Datta, R.; Alzuaibr, F.M.; Sakran, M.I.; El Sabagh, A. The use of soil conditioners to ensure a sustainable wheat yield under water deficit conditions by enhancing the physiological and antioxidant potentials. Land 2022, 11, 368. [Google Scholar] [CrossRef]
  65. El-Naggar, A.; Lee, S.S.; Rinklebe, J.; Farooq, M.; Song, H.; Sarmah, A.K.; Zimmerman, A.R.; Ahmad, M.; Shaheen, S.M.; Ok, Y.S. Biochar application to low fertility soils: A review of current status, and future prospects. Geoderma 2019, 337, 536–554. [Google Scholar] [CrossRef]
  66. Chang, L.; Xu, L.; Liu, Y.; Qiu, D. Superabsorbent polymers used for agricultural water retention. Polym. Test. 2021, 94, 107021. [Google Scholar] [CrossRef]
  67. Mi, J.; Gregorich, E.G.; Xu, S.; McLaughlin, N.B.; Liu, J. Effect of bentonite as a soil amendment on field water-holding capacity, and millet photosynthesis and grain quality. Sci. Rep. 2020, 10, 18282. Available online: https://www.nature.com/articles/s41598-020-75350-9 (accessed on 24 April 2022). [CrossRef]
  68. Rodrigues, M.A.; Garmus, T.; Arrobas, M.; Goncalves, A.; Silva, E.; Rocha, L.; Pinto, L.; Brito, C.; Martins, S.; Vargas, T.; et al. Combined biochar and organic waste have little effect on chemical soil properties and plant growth. Span. J. Soil Sci. 2019, 9, 12–23. [Google Scholar] [CrossRef]
  69. Jiménez de Santiato, D.E.; Yagüe, M.R.; Antúnez, M.; Bosch Serra, A.D. Diagnosis of soil hydrophobicity linked to pig slurry use in a calcareous soil. Span. J. Soil Sci. 2019, 9, 169–179. [Google Scholar] [CrossRef]
  70. Morri, E.; Santolini, R. Ecosystem services valuation for the sustainable land use management by nature-based solutions (NbS) in the Common Agricultural Policy actions: A case study on the Foglia river basin (Marche region, Italy. Land 2022, 11, 57. [Google Scholar] [CrossRef]
  71. De Oliveira Júnior, A.I.; Mendonca, L.A.R.; De Brito Fontenele, S.; Oliveira Araújo, A.; De Sousa Lima Brito, M.G. Statistical multivariate analysis applied to environmental characterization of soil in semiarid region. Rev. Caatinga 2019, 32, 200–210. [Google Scholar] [CrossRef]
  72. Guo, L.; Sun, Z.; Ouyang, Z.; Han, D.; Li, F. A comparison of soil quality evaluation methods for Fluvisol along the lower Yellow River. Catena 2017, 152, 135–143. [Google Scholar] [CrossRef]
  73. Guzmán, G.; Cabezas, J.M.; Sánchez-Custa, R.; Lora, Á.; Bauer, T.; Strauss, P.; Winter, S.; Zaller, J.G.; Gómez, J.A. A field evaluation of the impact of temporary cover crops on soil properties and vegetation communities in southern Spain vineyards. Agric. Ecosyst. Environ. 2019, 272, 135–145. [Google Scholar] [CrossRef]
  74. Kowalska, A.; Affek, A.; Wolski, J.; Regulska, E.; Kruczkowska, B.; Zawiska, I.; Kolaczkowska, E.; Baranowski, J. Assessment of regulating ES potential of lowland riparian hardwood forests in Poland. Ecol. Indic. 2021, 120, 106834. [Google Scholar] [CrossRef]
  75. Dindaroglu, T.; Reis, M.; Akay, A.E.; Tonguc, F. Hydroecological approach for determining the width of riparian buffer zones for providing soil conservation and water quality. Int. J. Environ. Sci. Technol. 2015, 12, 275–284. [Google Scholar] [CrossRef]
  76. Felipe-Lucia, M.R.; Comin, F.A. Ecosystem services—biodiversity relationships depend on land use type in floodplain agroecosystems. Land Use Policy 2015, 16, 201–210. [Google Scholar] [CrossRef]
  77. Gaglio, M.; Aschonitis, V.; Pieretti, L.; Santos, L.; Gissi, E.; Castaldelli, G.; Fano, E.A. Modelling past, present and future Ecosystem Services supply in a protected floodplain under land use and climate changes. Ecol. Model. 2019, 403, 23–34. [Google Scholar] [CrossRef]
  78. Bennett, E.M.; Peterson, G.D.; Gordon, L.J. Understanding relationships among multiple ecosystem services. Ecol. Lett. 2009, 12, 1394–1404. [Google Scholar] [CrossRef]
  79. Vidal-Abraca, M.R.; Santos-Martín, F.; Martín-López, B.; Sánchez-Montoya, M.M.; Suárez Alonso, M.L. Exploring the capacity of water framework directive indices to assess ecosystem services in fluvial and riparian systems: Towards a second implementation phase. Environ. Manag. 2016, 57, 1139–1152. [Google Scholar] [CrossRef] [PubMed]
  80. Turner, R.K.; Daily, G.C. The ecosystem services framework and natural capital conservation. Environ. Resour. Econ. 2008, 39, 25–35. [Google Scholar] [CrossRef]
  81. Jia, X.; Fu, B.; Feng, X.; Hou, G.; Liu, Y.; Wang, X. The tradeoff and synergy between ecosystem services in the grain-for-Green areas in Northern Shaanxi, China. Ecol. Indic. 2014, 43, 103–111. [Google Scholar] [CrossRef]
Figure 1. Map of the 16 localities in the floodplain of the Štiavnica River.
Land 11 01510 g001
Figure 2. (a) Actual soil moisture on September 10, 2018 (SMa); (b) Field water capacity (FWC); (c) Wilting point (WP); (d) Available water capacity (AWC); (e) Soil water deficit index (SWDI). RZ—Riparian zone, GL—Grassland, AL—Arable land, 1—Depth 0–10 cm, 2—Depth 20–30 cm.
Land 11 01510 g002
Figure 3. Results of PCA relationships between hydrological and soil properties.
Land 11 01510 g003
Figure 4. LULC maps for 1950 (a) and 2019 (b) of the Štiavnica River floodplain.
Land 11 01510 g004aLand 11 01510 g004b
Table 1. Soil chemical properties.
Depth
(cm)
EcosystemStatistical
Characteristics
pH/H2OpH/KClSOC
(g kg−1)
HA/FA
0–10RZx¯ ± SD6.07 ± 0.715.25 ± 0.8722.51 ± 6.880.40 ± 0.08
Min5.354.3711.300.31
Max7.657.2030.600.59
x¯ ± SD5.96 ± 0.425.47 ± 0.1221.00 ± 1.700.42 ± 0.03
GLMin5.365.3019.800.39
Max6.275.5623.400.46
ALx¯ ± SD6.53 ± 0.505.62 ± 0.3915.09 ± 3.760.55 ± 0.14
Min6.105.2110.650.41
Max7.366.3521.500.82
20–30RZx¯ ± SD5.92 ± 0.735.07 ± 0.8615.69 ± 4.210.44 ± 0.12
Min5.044.139.800.32
Max7.597.0922.950.68
x¯ ± SD5.93 ± 0.474.96 ± 0.4512.70 ± 2.450.44 ± 0.04
GLMin5.304.329.300.40
Max6.415.2815.000.50
ALx¯ ± SD6.76 ± 0.415.73 ± 0.3711.69 ± 3.550.49 ± 0.07
Min6.285.279.000.38
Max7.526.4118.500.58
RZ—Riparian zone, GL—Grassland, AL—Arable land.
Table 2. Particle size distribution.
Depth
(cm)
EcosystemStatistical
Characteristics
Clay
(%)
Silt
(%)
Sand
(%)
0–10RZx¯ ± SD7.62 ± 2.6134.03 ± 20.8158.37 ± 23.11
Min4.4512.2418.75
Max11.3071.4983.43
x¯ ± SD6.66 ± 0.2537.05 ± 10.9356.28 ± 10.72
GLMin6.3122.7444.43
Max6.8749.2670.39
ALx¯ ± SD19.09 ± 13.5350.38 ± 10.3030.28 ± 17.65
Min8.5033.637.21
Max42.2860.3556.87
20–30RZx¯ ± SD8.90 ± 3.6332.69 ± 18.9958.42 ± 22.28
Min4.3515.5517.01
Max15.2270.3380.10
x¯ ± SD6.15 ± 1.4531.74 ± 15.7162.13 ± 16.60
GLMin4.2513.1342.02
Max7.7651.5582.67
ALx¯ ± SD19.28 ± 10.2554.83 ± 10.5225.89 ± 11.38
Min12.3241.1015.63
Max39.4367.4946.40
RZ—Riparian zone, GL—Grassland, AL—Arable land.
Table 3. Soil physical properties.
Depth
(cm)
Eco
System
Statistical
Characteristics
PD
(g cm−3)
BD
(g cm−3)
Pt
(%)
Pc
(%)
Pn
(%)
Ps
(%)
0–10RZx¯ ± SD2.26 ± 0.171.05 ± 0.1153.11 ± 6.2933.97 ± 8.8410.76 ± 8.368.49 ± 4.06
Min2.120.8446.7722.240.02.21
Max2.591.1664.4047.5323.5714.15
GLx¯ ± SD2.22 ± 0.061.12 ± 0.1449.77 ± 4.9238.60 ± 3.377.14 ± 6.814.03 ± 2.20
Min2.160.9544.1234.020.01.59
Max2.301.2856.1142.0215.176.92
ALx¯ ± SD2.31 ± 0.041.32 ± 0.1143.11 ± 4.3532.07 ± 3.419.11 ± 6.241.93 ± 1.17
Min2.251.1735.5926.600.00.12
Max2.351.5048.1136.7715.063.73
20–30RZx¯ ± SD2.31 ± 0.181.05 ± 0.2553.22 ± 12.5232.41 ± 9.9613.88 ± 8.527.48 ± 4.86
Min2.040.6430.9518.670.01.26
Max2.671.4373.6047.1424.8817.28
GLx¯ ± SD2.30 ± 0.111.22 ± 0.2247.37 ± 7.5936.06 ± 1.739.23 ± 7.252.08 ± 0.27
Min2.140.9736.9833.860.01.78
Max2.381.4954.9238.1014.382.44
ALx¯ ± SD2.26 ± 0.041.28 ± 0.1543.14 ± 6.7727.46 ± 3.9814.38 ± 10.211.31 ± 0.86
Min2.201.1233.1324.481.810.23
Max2.311.5451.1534.8525.472.85
RZ—Riparian zone, GL—Grassland, AL—Arable land.
Table 4. Pearson´s correlation coefficient matrix of soil properties.
pH/H2OpH/KClSOCHA/FAClaySiltSandPDBDPtPcPnPsSMaFWCWPAWCSWDI
pH/H2O10.939 **n.c.0.480 **0.603 **n.c.−0.491 **−0.354 *0.413 *−0.520 **n.c.−0.408 *−0.422 *n.c.0.541 **0.610 **n.c.−0.403 *
pH/KCl 1n.c.0.530 **0.507 **n.c.−0.442 *−0.475 **n.c.−0.452 **n.c.−0.390 *−0.354 *n.c.0.485 **0.530 **n.c.−0.360 *
SOC 1n.c.n.c.n.c.n.c.n.c.n.c.n.c.0.603 **−0.564 **n.c.0.514 **n.c.n.c.n.c.n.c.
HA/FA 1n.c.0.495 **−0.510 **n.c.0.514 **−0.585 **n.c.n.c.−0.354 *n.c.0.480 **0.437 *0.388 **−0439 *
Clay 10.434 *−0.701 **n.c.0.462 **−0.500 **n.c.n.c.0.477 **n.c.0,802 **0.946 **n.c.−0.489 **
Silt 1−0.946 **−0.444 *n.c.−0.366 *n.c.n.c.−0.629 **−0.353 *0.884 **0.701 **0.950 **−0.695 **
Sand 10.407 *−0.372 *0.470 **n.c.n.c.0.670 **n.c.−0.987 **−0.893 **−0.806 **0.726 **
PD 1n.c.n.c.n.c.n.c.n.c.n.c.−0.385 *n.c.−0.441 *n.c.
BD 1−0.957 **n.c.−0.563 **−0.362 *n.c.0.374 *0.458 **n.c.−0.364 **
Pt 1n.c.0.617 **0.425 *n.c.−0.471 **−0.531 **n.c.0.398 **
Pc 1−0.500 **n.c.0.655 **n.c.n.c.n.c.0.530 **
Pn 1n.c.−0.536 **n.c.n.c.n.c.n.c.
Ps 1n.c.−0.652 **−0.598 **−0.517 **0.482 **
SMa 1n.c.n.c.−0.364 *0.844 **
FWC 10.952 **0,711 **−0.697 **
WP 10.461 **−0.623 **
AWC 1−0.586 **
SWDI 1
* r values are significant at p ˂ 0.05; ** r values are significant at p ˂ 0.01; n.c. no correlation.
Table 5. Component matrix for variables.
VariablesAll SamplesRiparian ZonesGrasslandsArable Lands
PC 1PC 2PC 1PC 2PC 1PC 2PC 1PC 2
pH/H2O0.6530.5190.6750.606−0.7740.6320.947−0.173
pH/KCl0.6560.4090.6900.589−0.0220.9700.982−0.169
SOC0.0590.6190.5250.6350.6880.6330.946−0.197
HA/FA0.8420.2190.861−0.199−0.462−0.5430.3270.525
Clay0.870−0.2250.948−0.2360.125−0.8630.985−0.159
Silt0.917−0.2210.945−0.2510.997−0.025−0.153−0.922
Sand−0.9330.207−0.9450.251−0.9970.025−0.9850.156
PD−0.615−0.330−0.736−0.115−0.613−0.6210.0860.645
BD0.4040.4230.427−0.748−0.9880.5790.6520.723
Pt−0.691−0.327−0.6020.6670.904−0.396−0.745−0.588
Pc0.2020.7720.6380.674−0.0420.9580.746−0.353
Pn−0.22−0.894−0.708−0.2860.908−0.347−0.765−0.569
Ps−0.728−0.311−0.691−0.483−0.407−0.602−0.9500.293
SMa−0.5490.6940.0840.750−0.583−0.5130.989−0.122
FWC0.939−0.2060.951−0.1590.997−0.0250.818−0.503
WP0.924−0.2330.947−0.2320.9970.0830.985−0.159
AWC0.850−0.2460.916−0.0420.997−0.025−0.699−0.694
SWDI−0.7040.590−0.3070.854−0.9590.194−0.1390.940
% of the total variance43.3918.6449.9018.6656.2220.8847.3234.29
Table 6. Effect of ecosystems and soil layer on soil properties.
VariablesEcosystemSoil Layer
F-Valuep-ValueF-Valuep-Value
pH/H2O3.7450.03600.984
pH/KCl1.6990.2010.3380.565
SOC2.9120.0709.6060.004
HA/FA3.2710.0520.0240.877
Clay8.2620.0010.0930.762
Silt4.4600.0200.0080.928
Sand8.1400.0020.0010.976
PD0.1000.9050.2130.648
BD5.0380.0130.0450.834
Pt4.2010.0250.0130.911
Pc1.8870.1700.9540.337
Pn0.4150.6641.3550.254
Ps11.3670.0000.4330.515
SMa3.3040.0510.0510.823
FWC8.5290.0010.0000.983
WP9.7770.0000.0120.915
AWC1.5280.2340.0350.853
SWDI11.1490.0000.0630.803
The p-values shown in bold are statistically significant at p ˂ 0.05.
Table 7. LULC patterns for 1950 and 2019 of the Štiavnica River floodplain.
LULC Category19502019Variations
ha%ha%%
Forest area2715.425.63449.532.56.9
Riparian vegetation151.21.4113.51.1−0.4
Other non-forest woody vegetation269.22.5753.67.14.6
Mosaic structures171.71.676.90.7−0.9
Permanent grasslands2796.726.31797.116.9−9.4
Arable land3952.137.23331.031.4−5.8
Permanent crops61.10.6125.01.20.6
Industrial units and parks33.50.3100.70.90.6
Mineral extraction sites0.00.024.10.20.2
Other artificial surfaces465.34.4844.67.93.6
Water bodies and areas8.20.18.20.10.0
Publisher’s Note: MDPI stays neutral with regard to jurisdictional claims in published maps and institutional affiliations.

