
Temporal and Spatial Evolution Characteristics and Its Driving Mechanism of Land Use/Land Cover Change in Laos from 2000 to 2020


Abstract
:1. Introduction
- What are the distribution patterns and temporal changes in LUC in Laos from 2000 to 2020?
- What are the key drivers of LUCC in Laos from 2000 to 2020?
- What are the uncertainties that exist in the analysis of LUCC in Laos?
2. Data and Methods
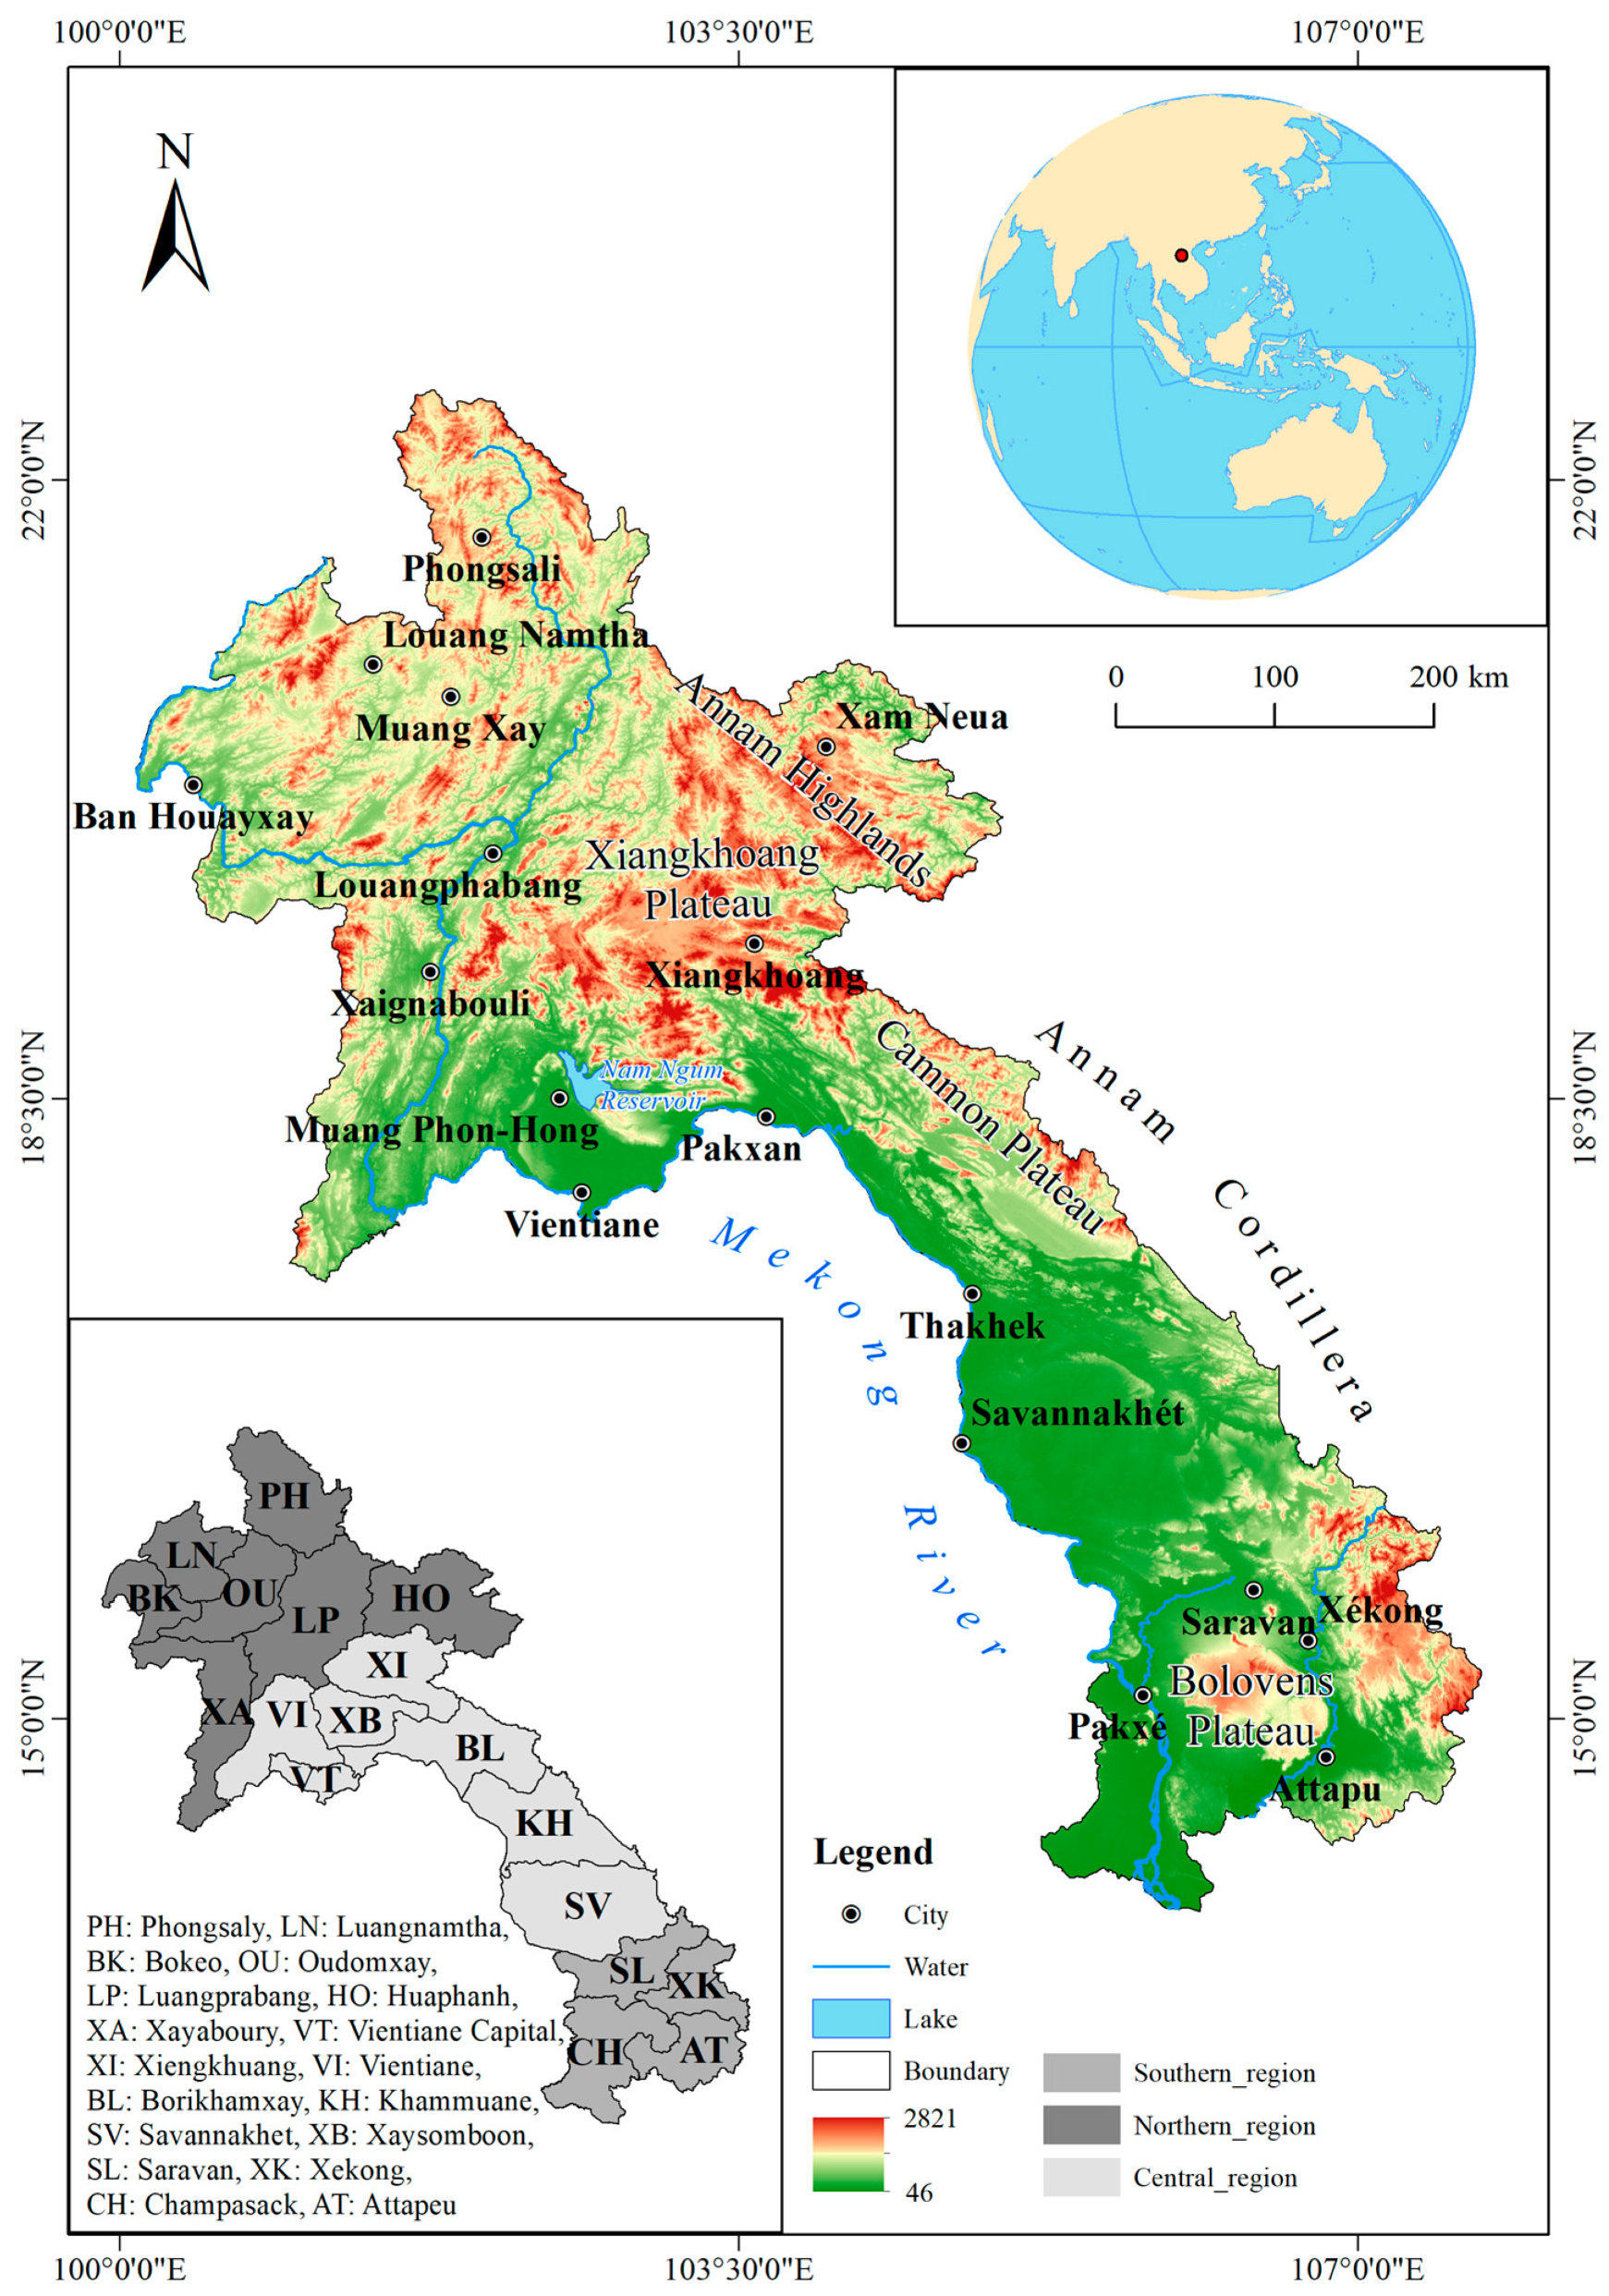
2.1. Study Area
2.2. Data Sources
2.3. LUCC Analysis Method
2.4. Analysis of Driving Mechanism
3. Results
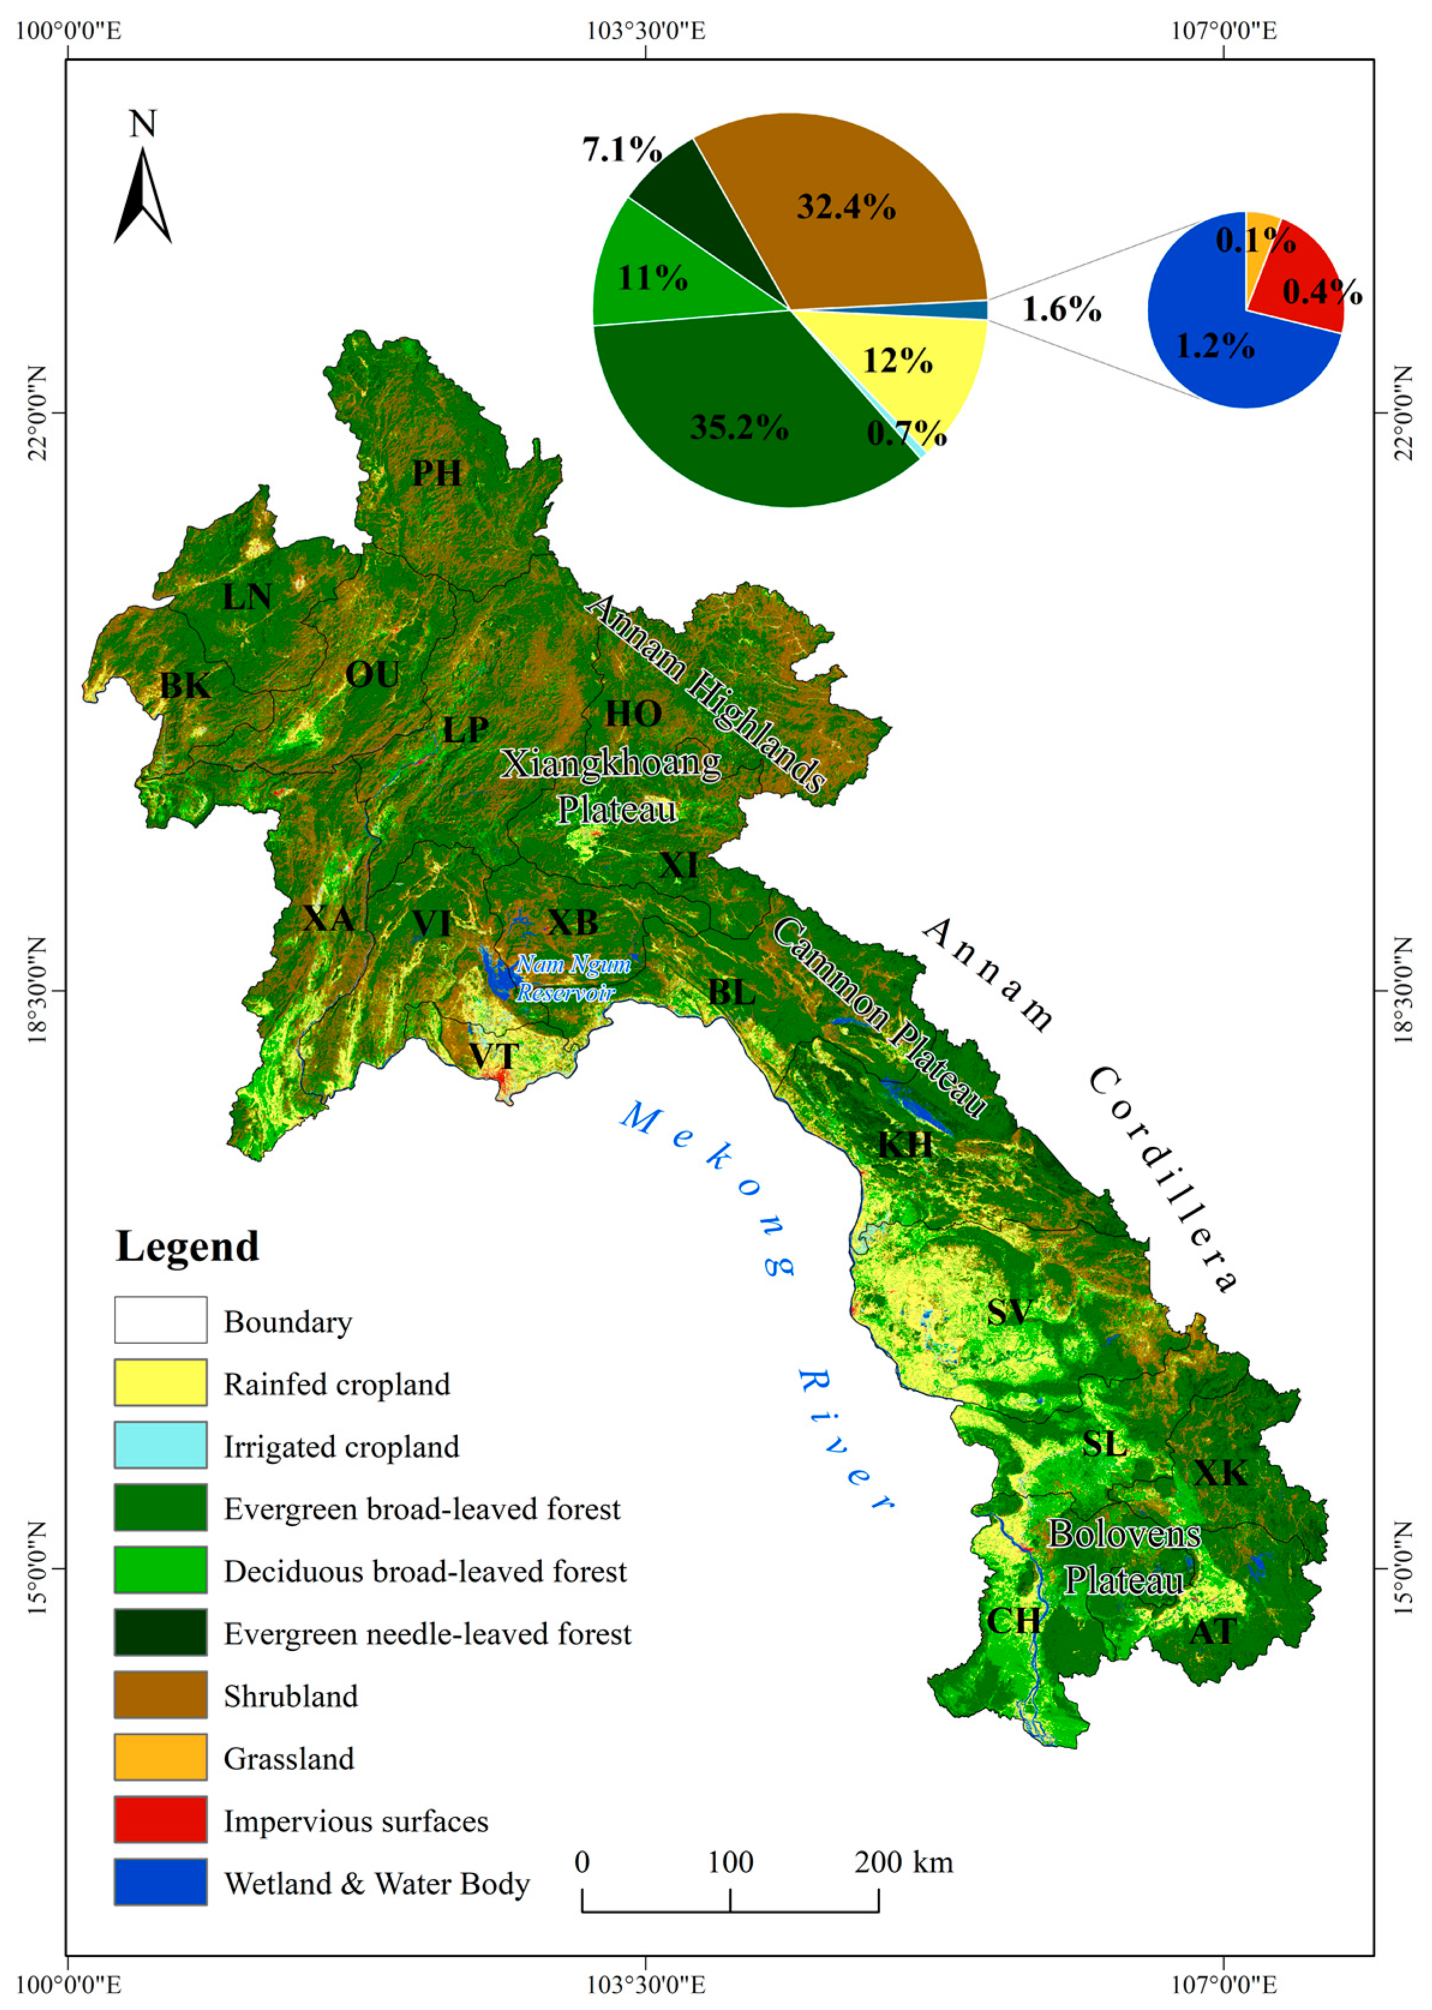
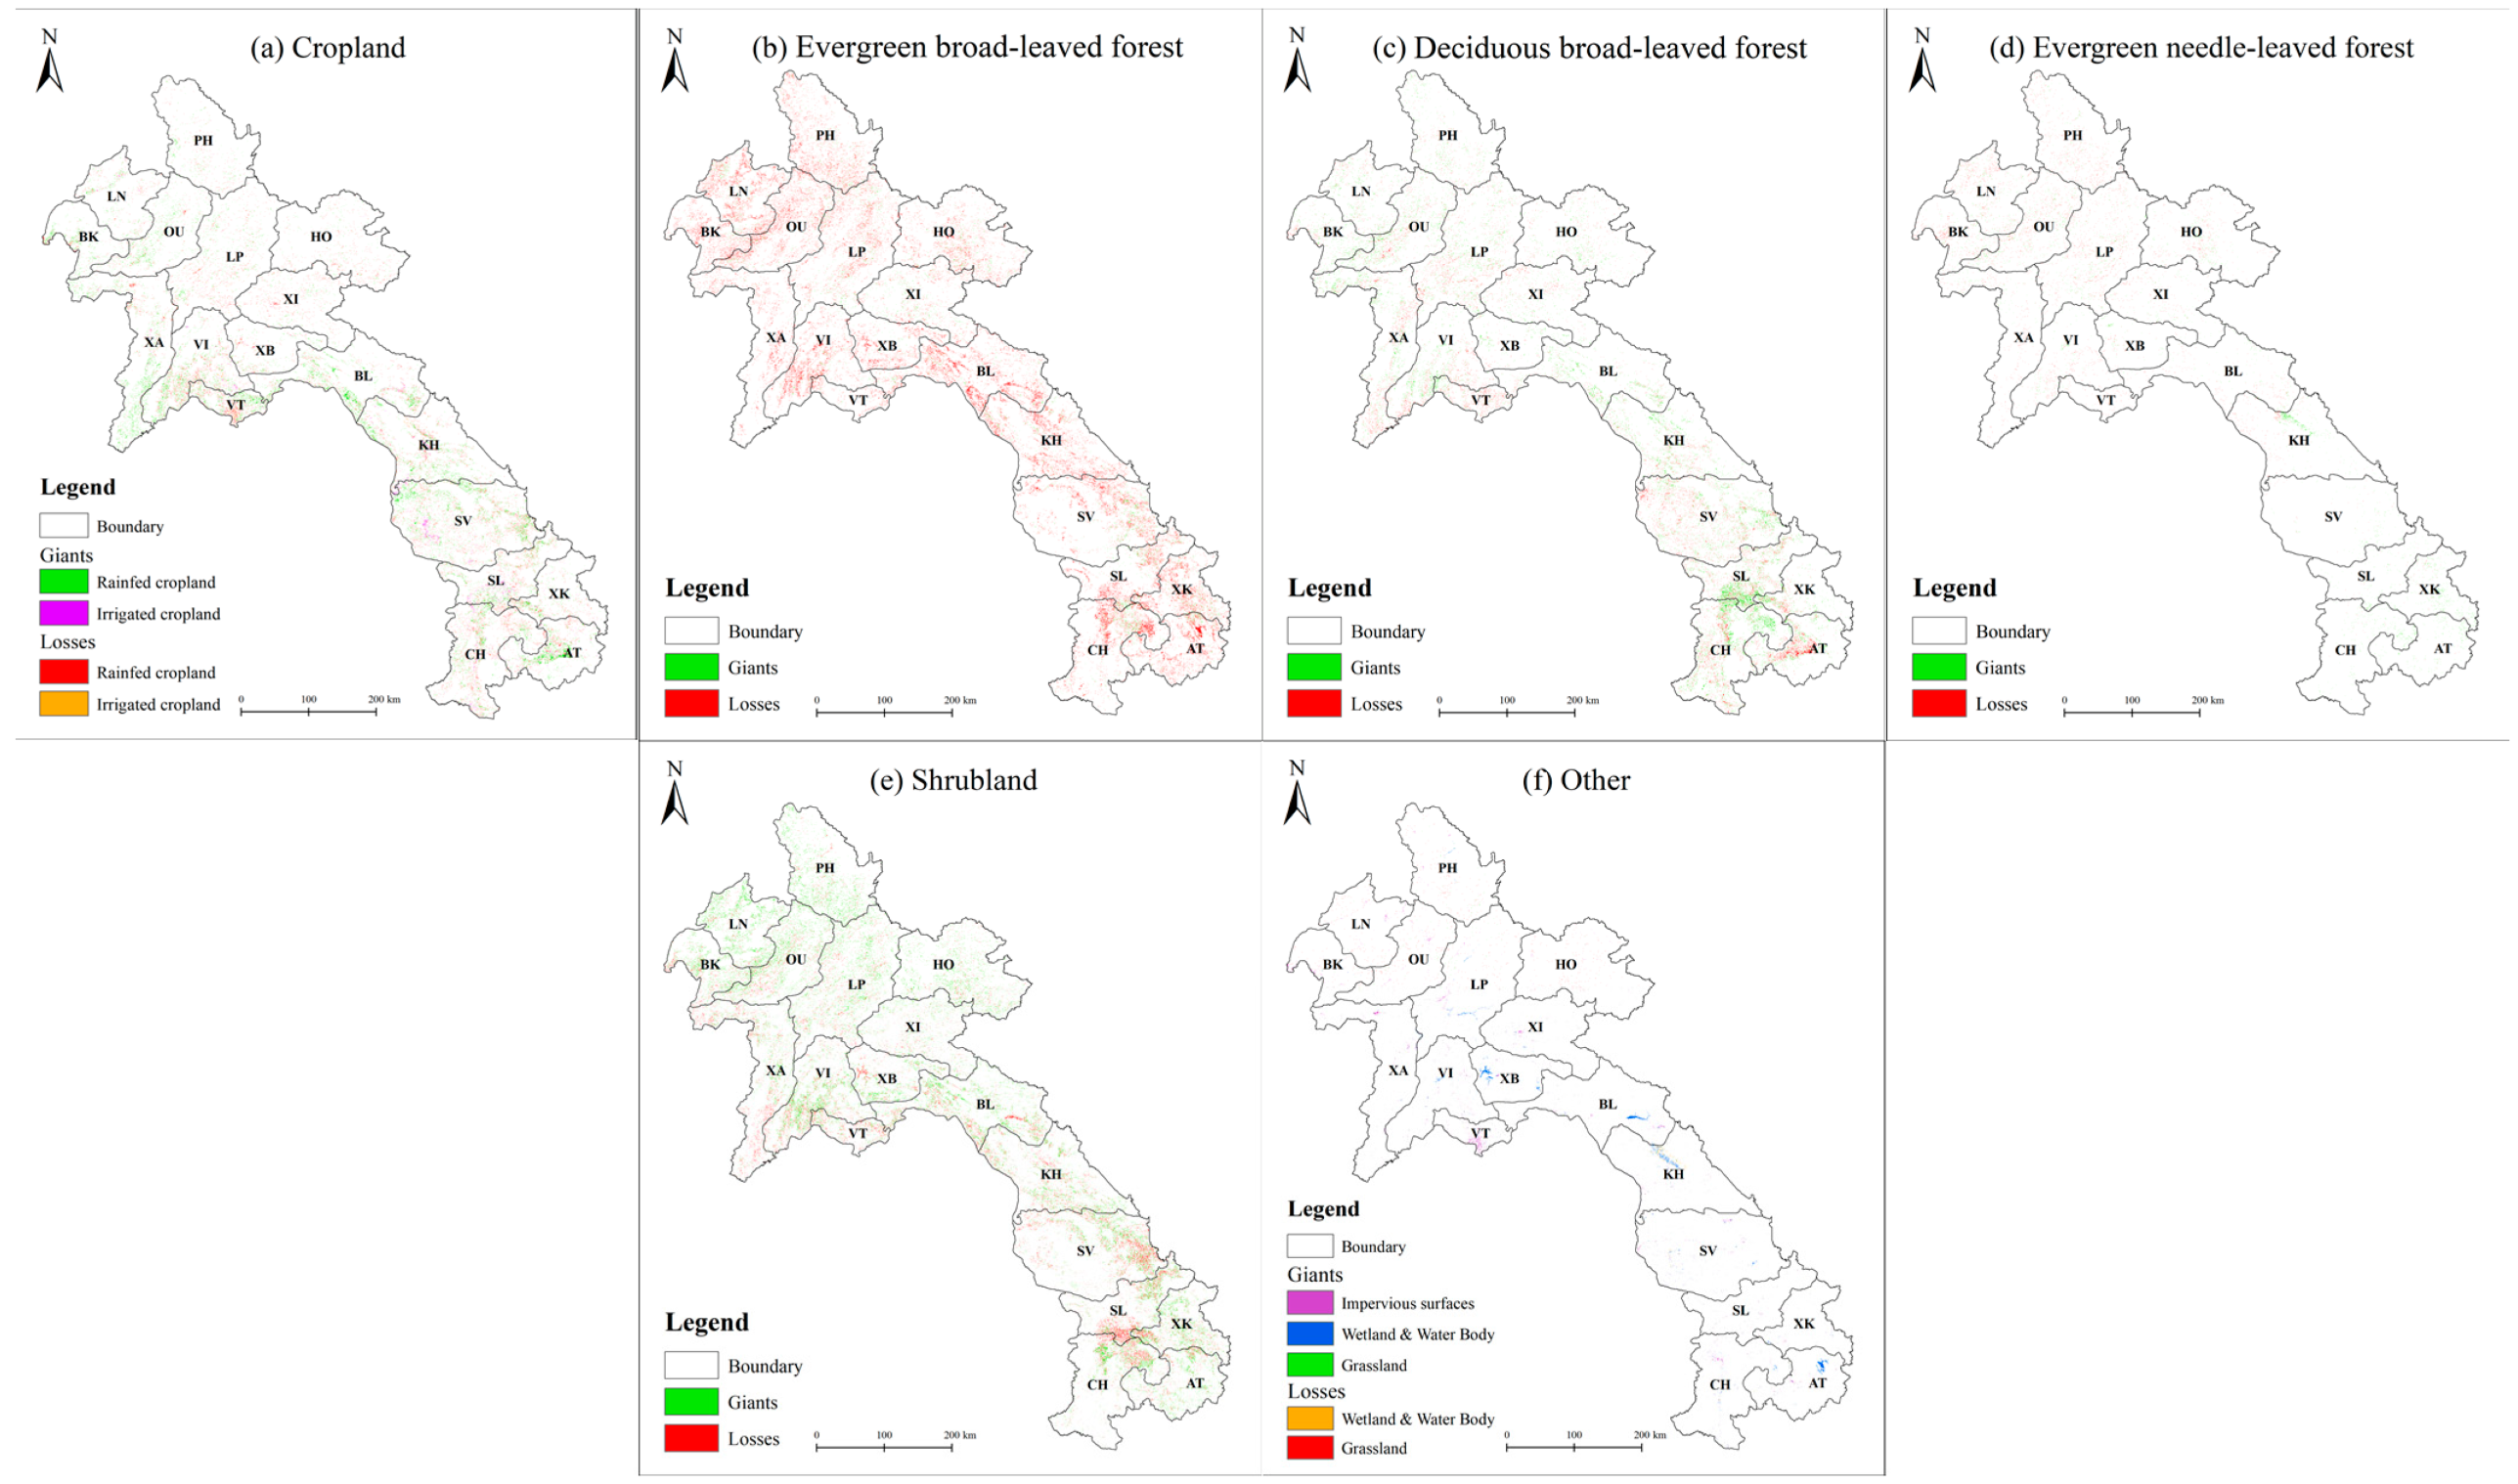
3.1. Spatial Distribution
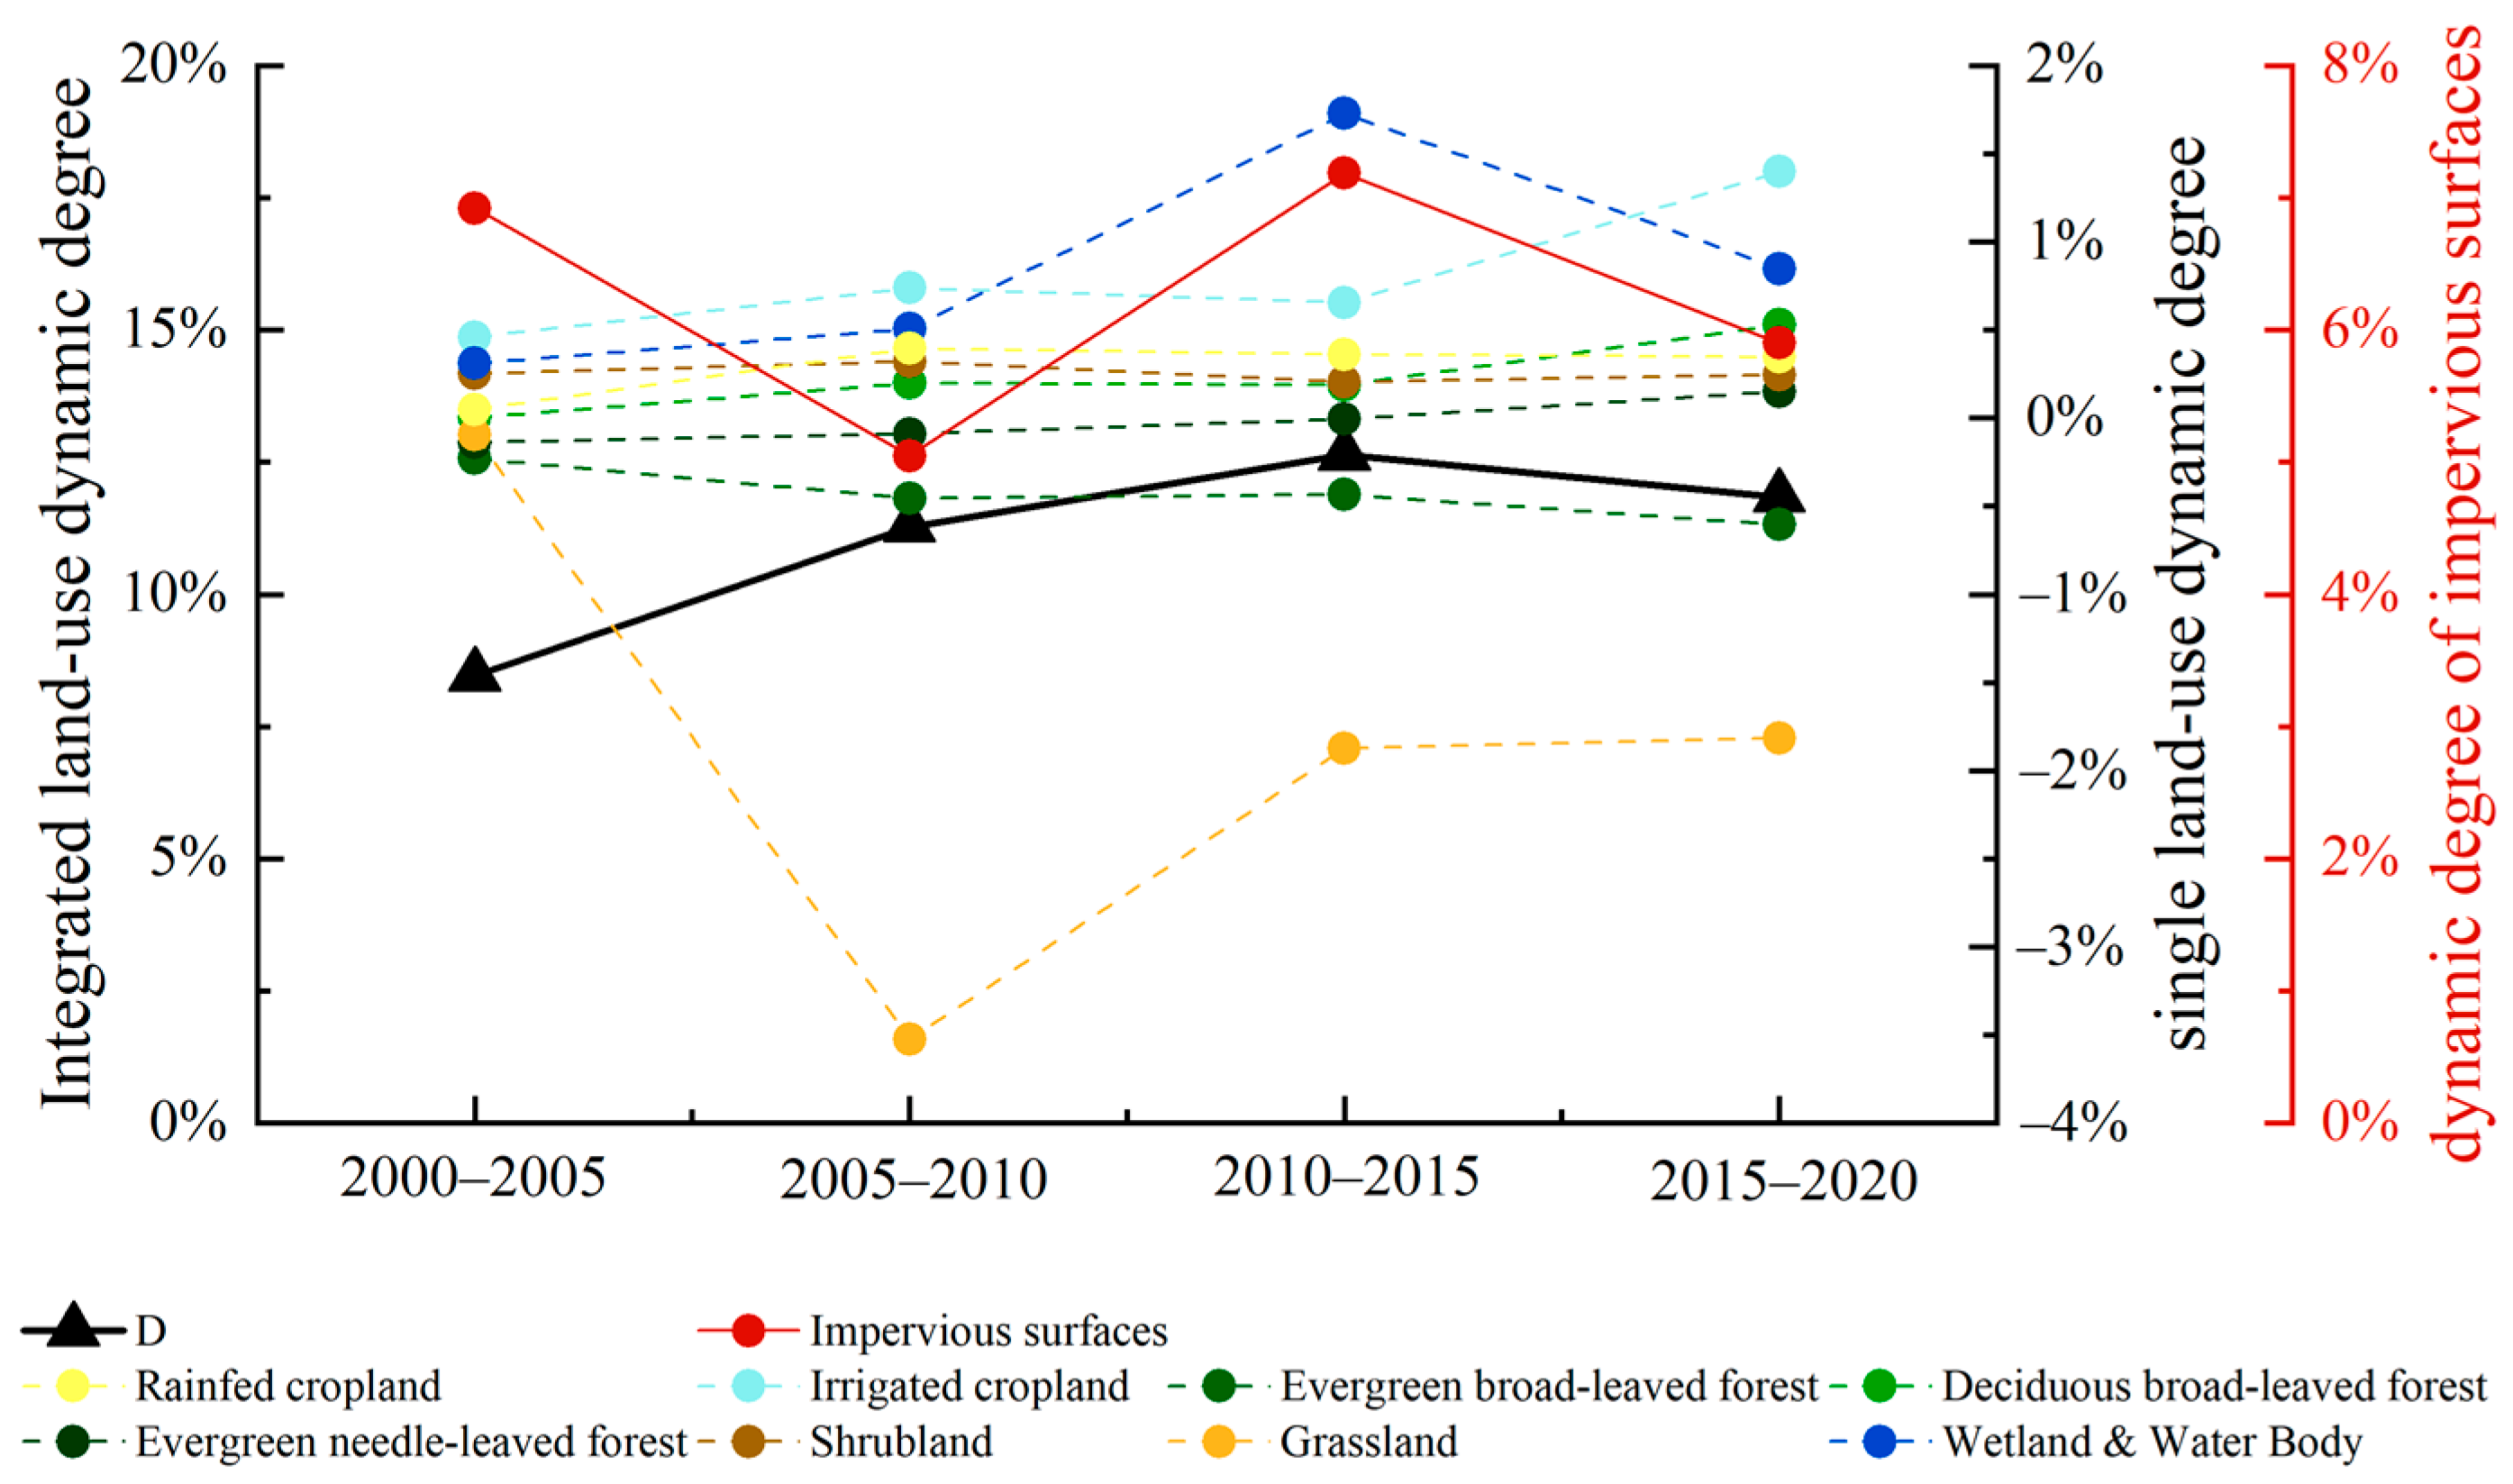
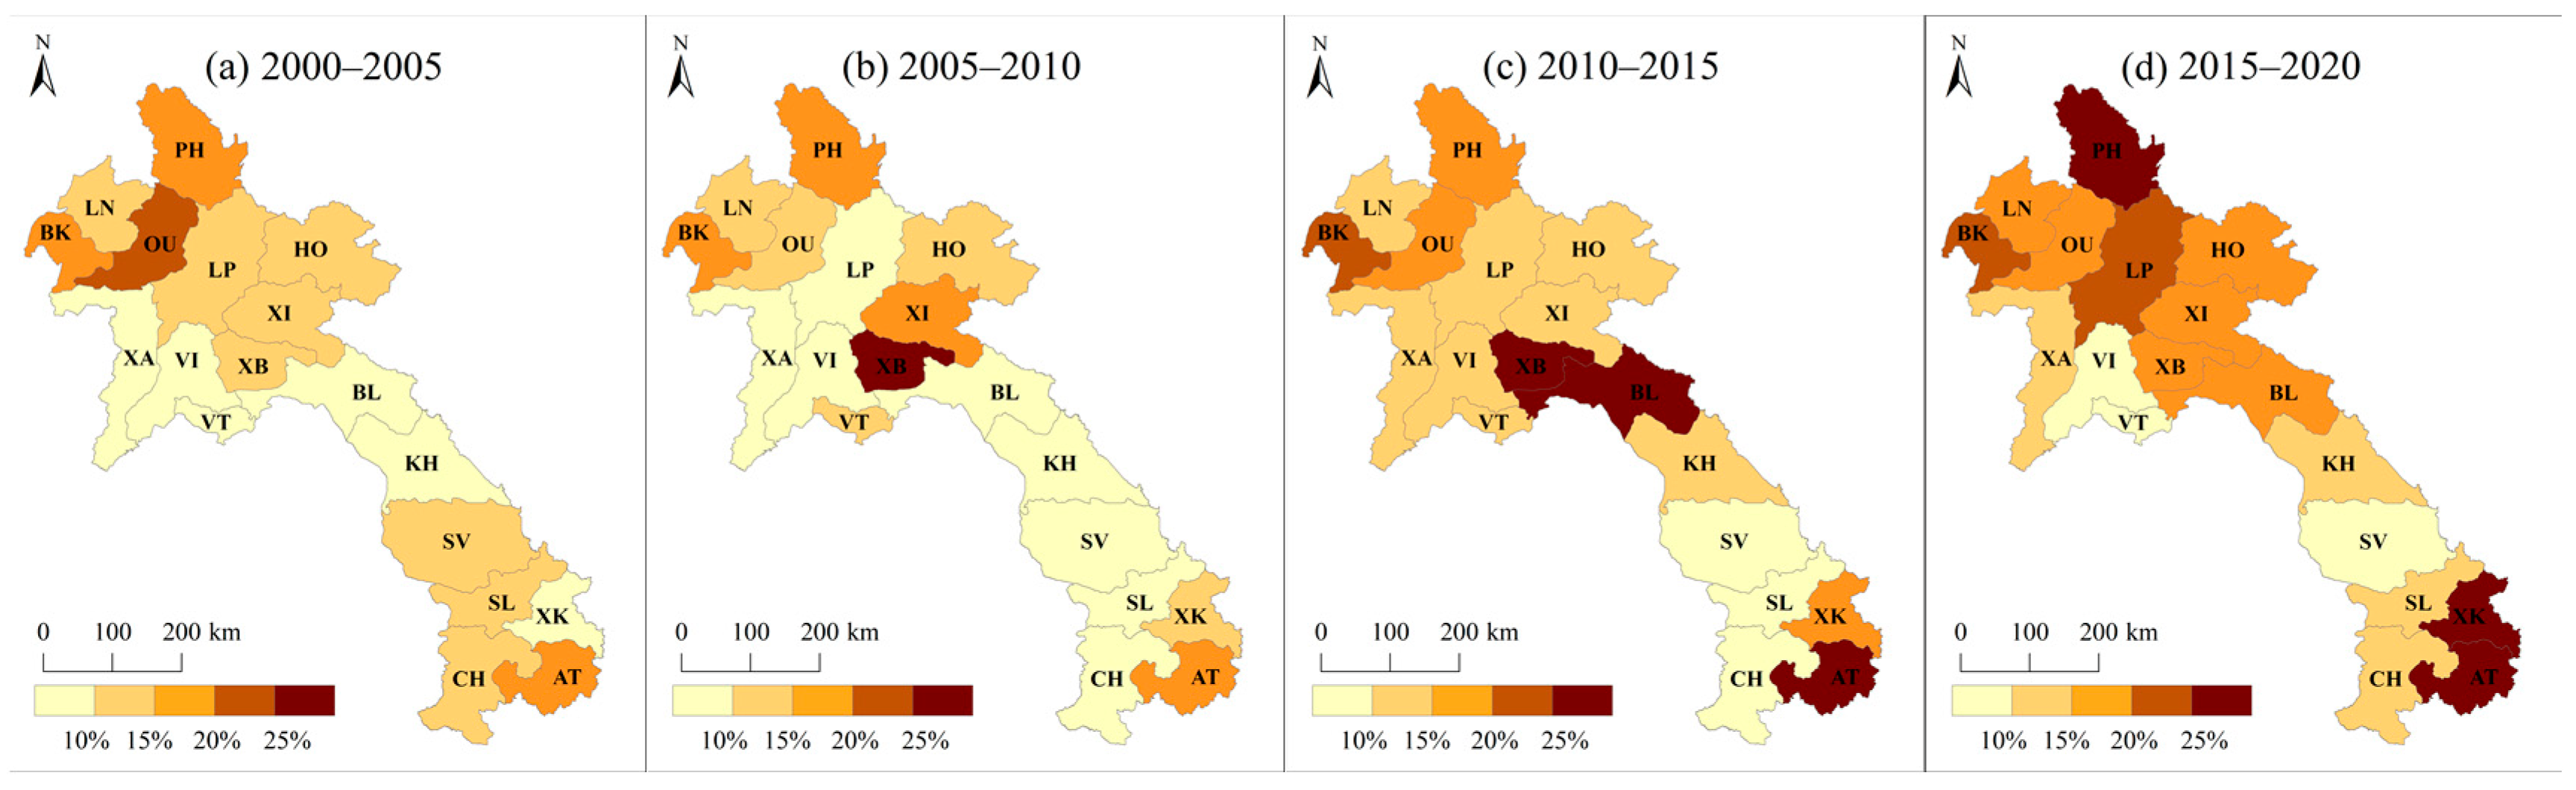
3.2. Spatio-Temporal Dynamic Changes
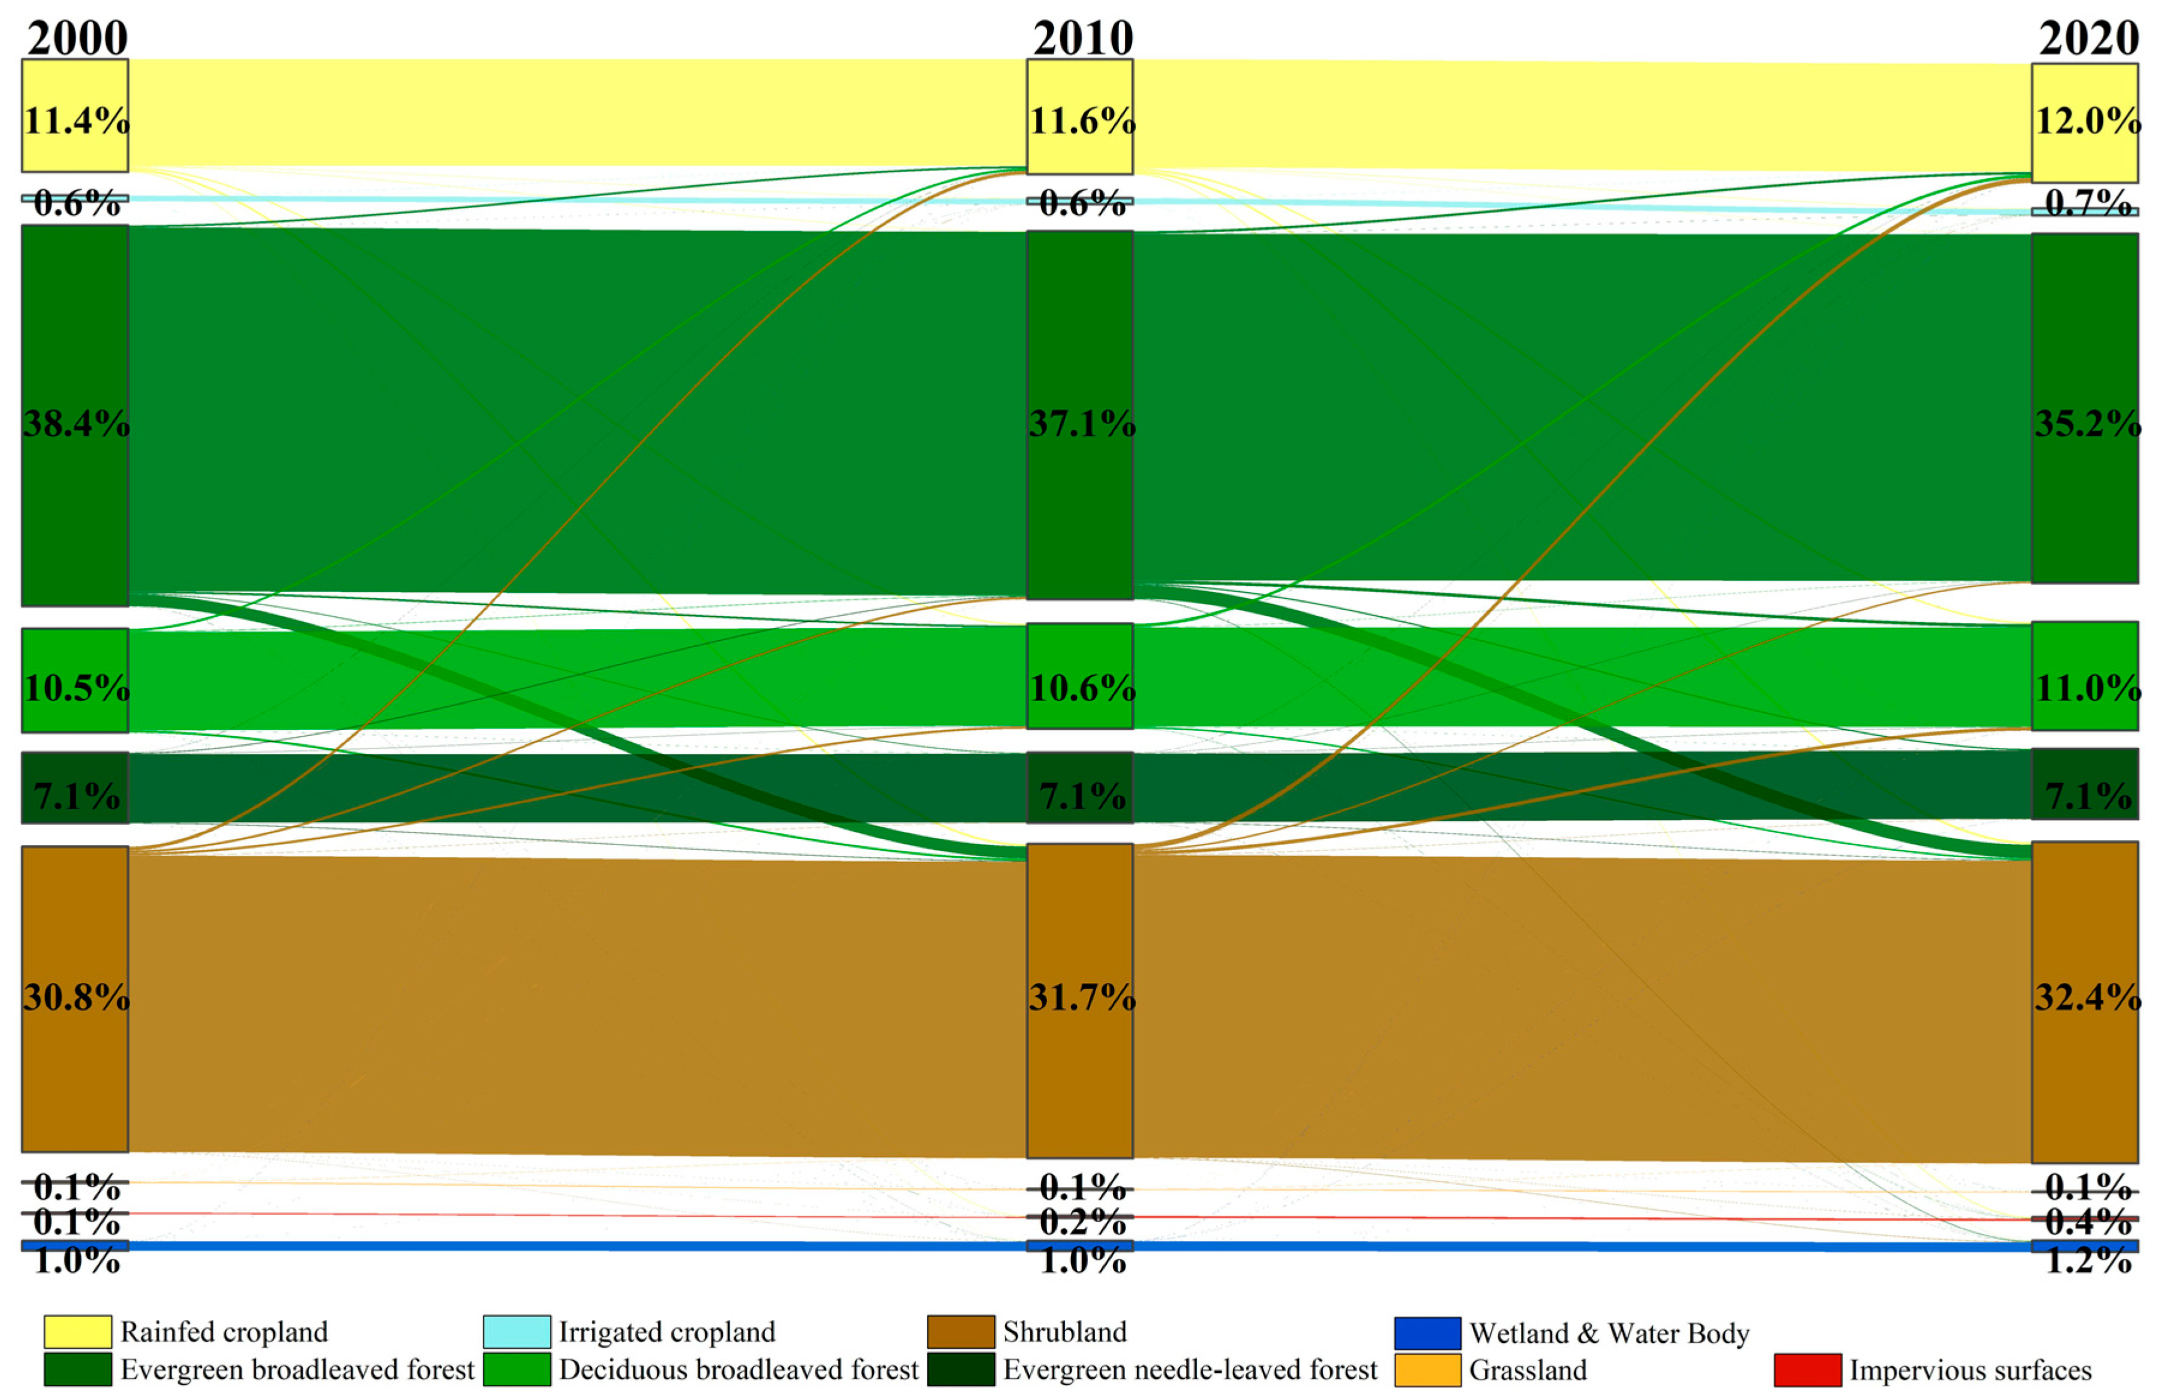
3.3. Source and Destination
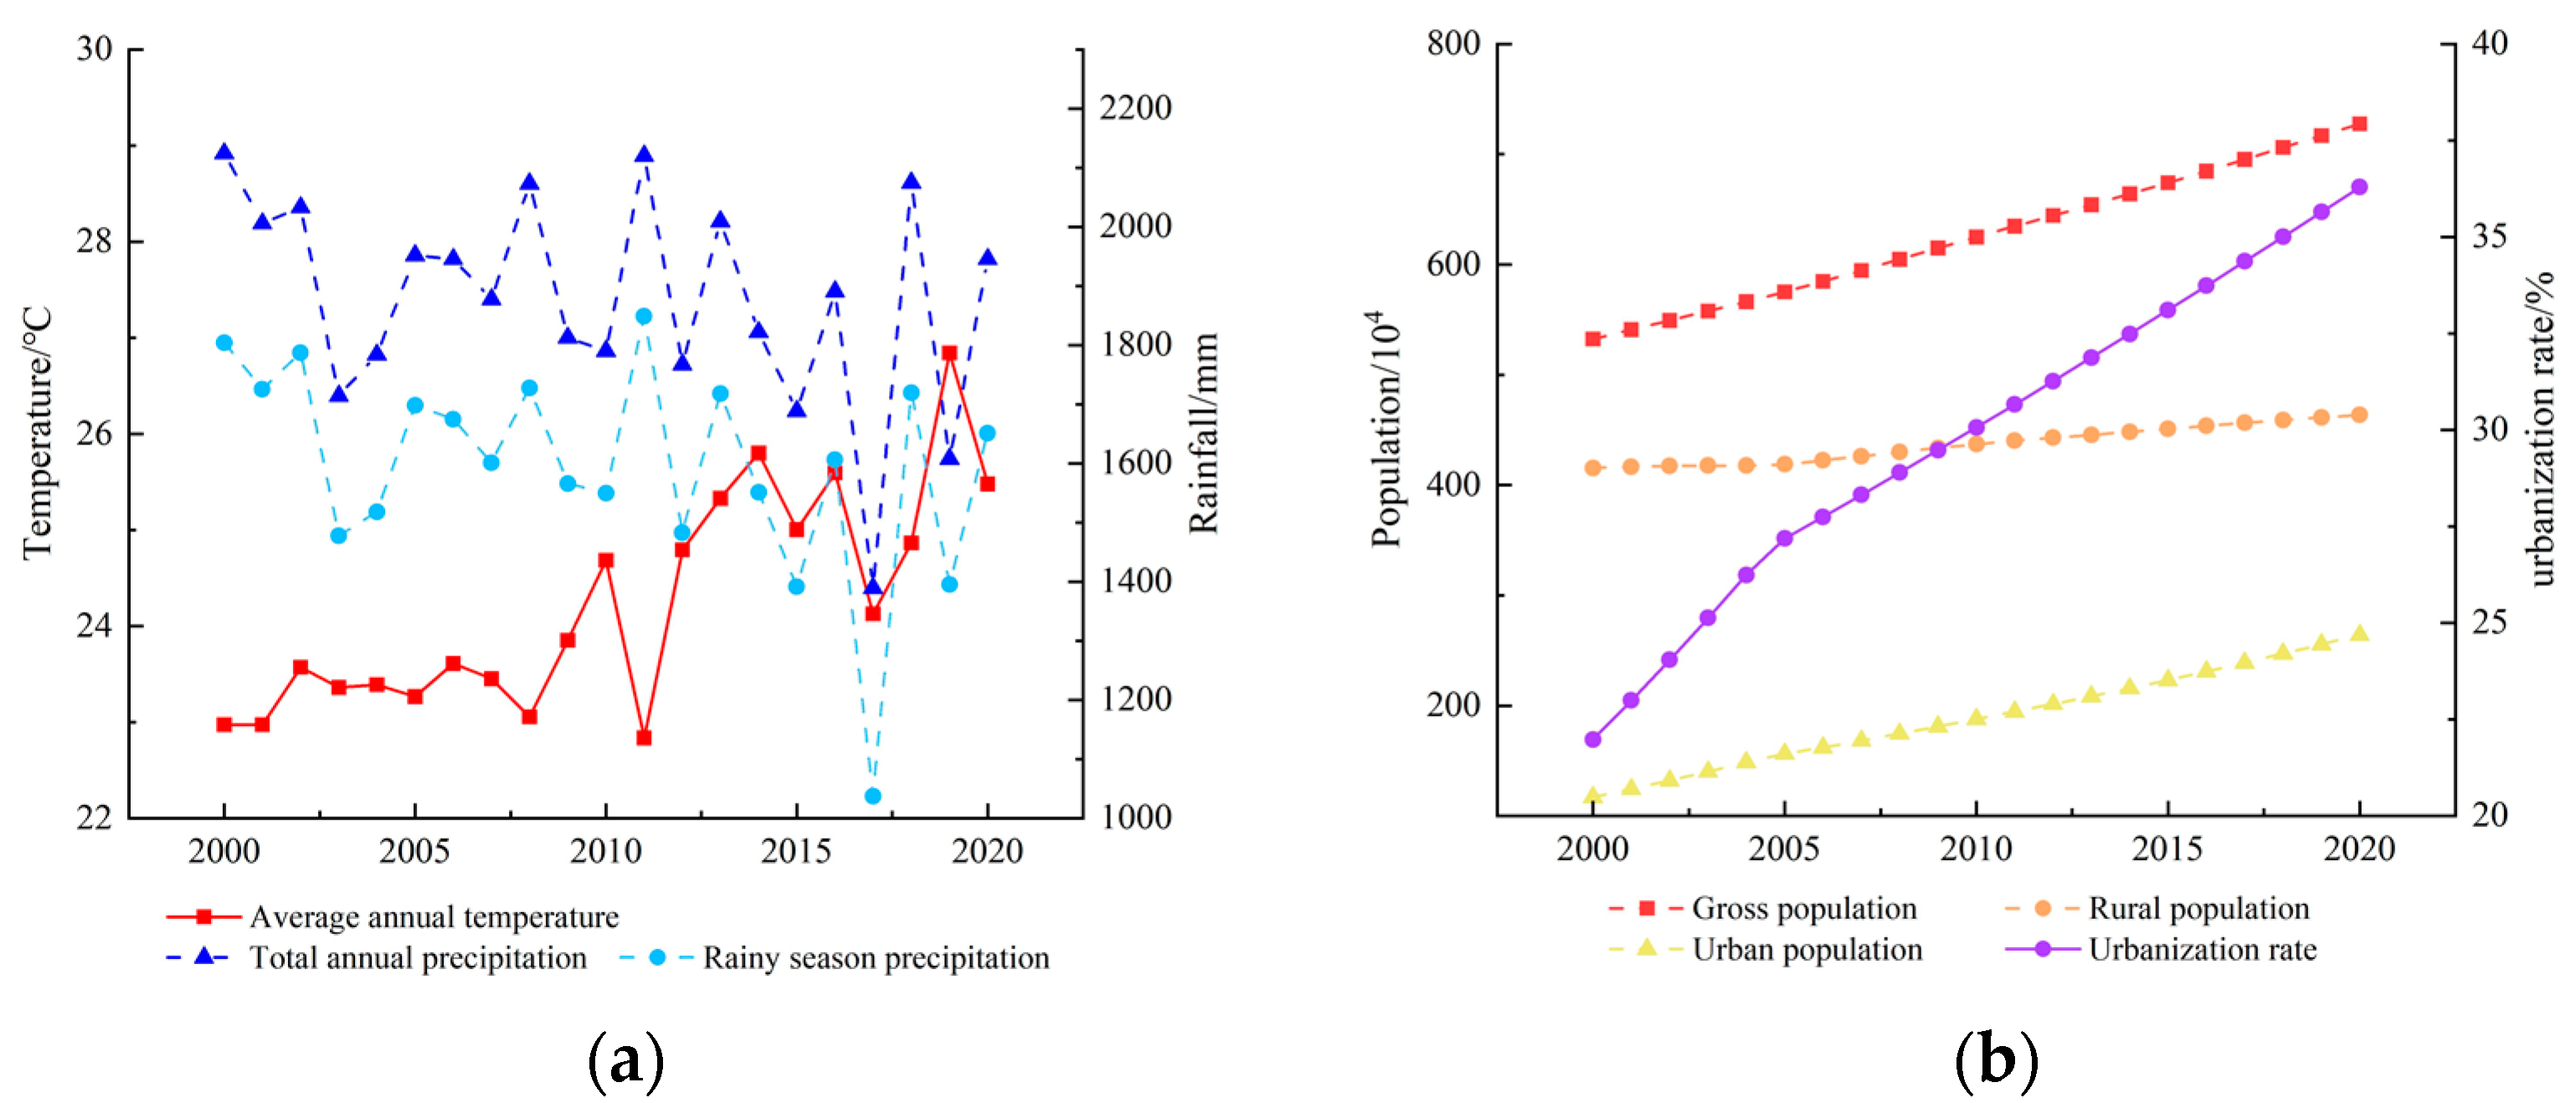
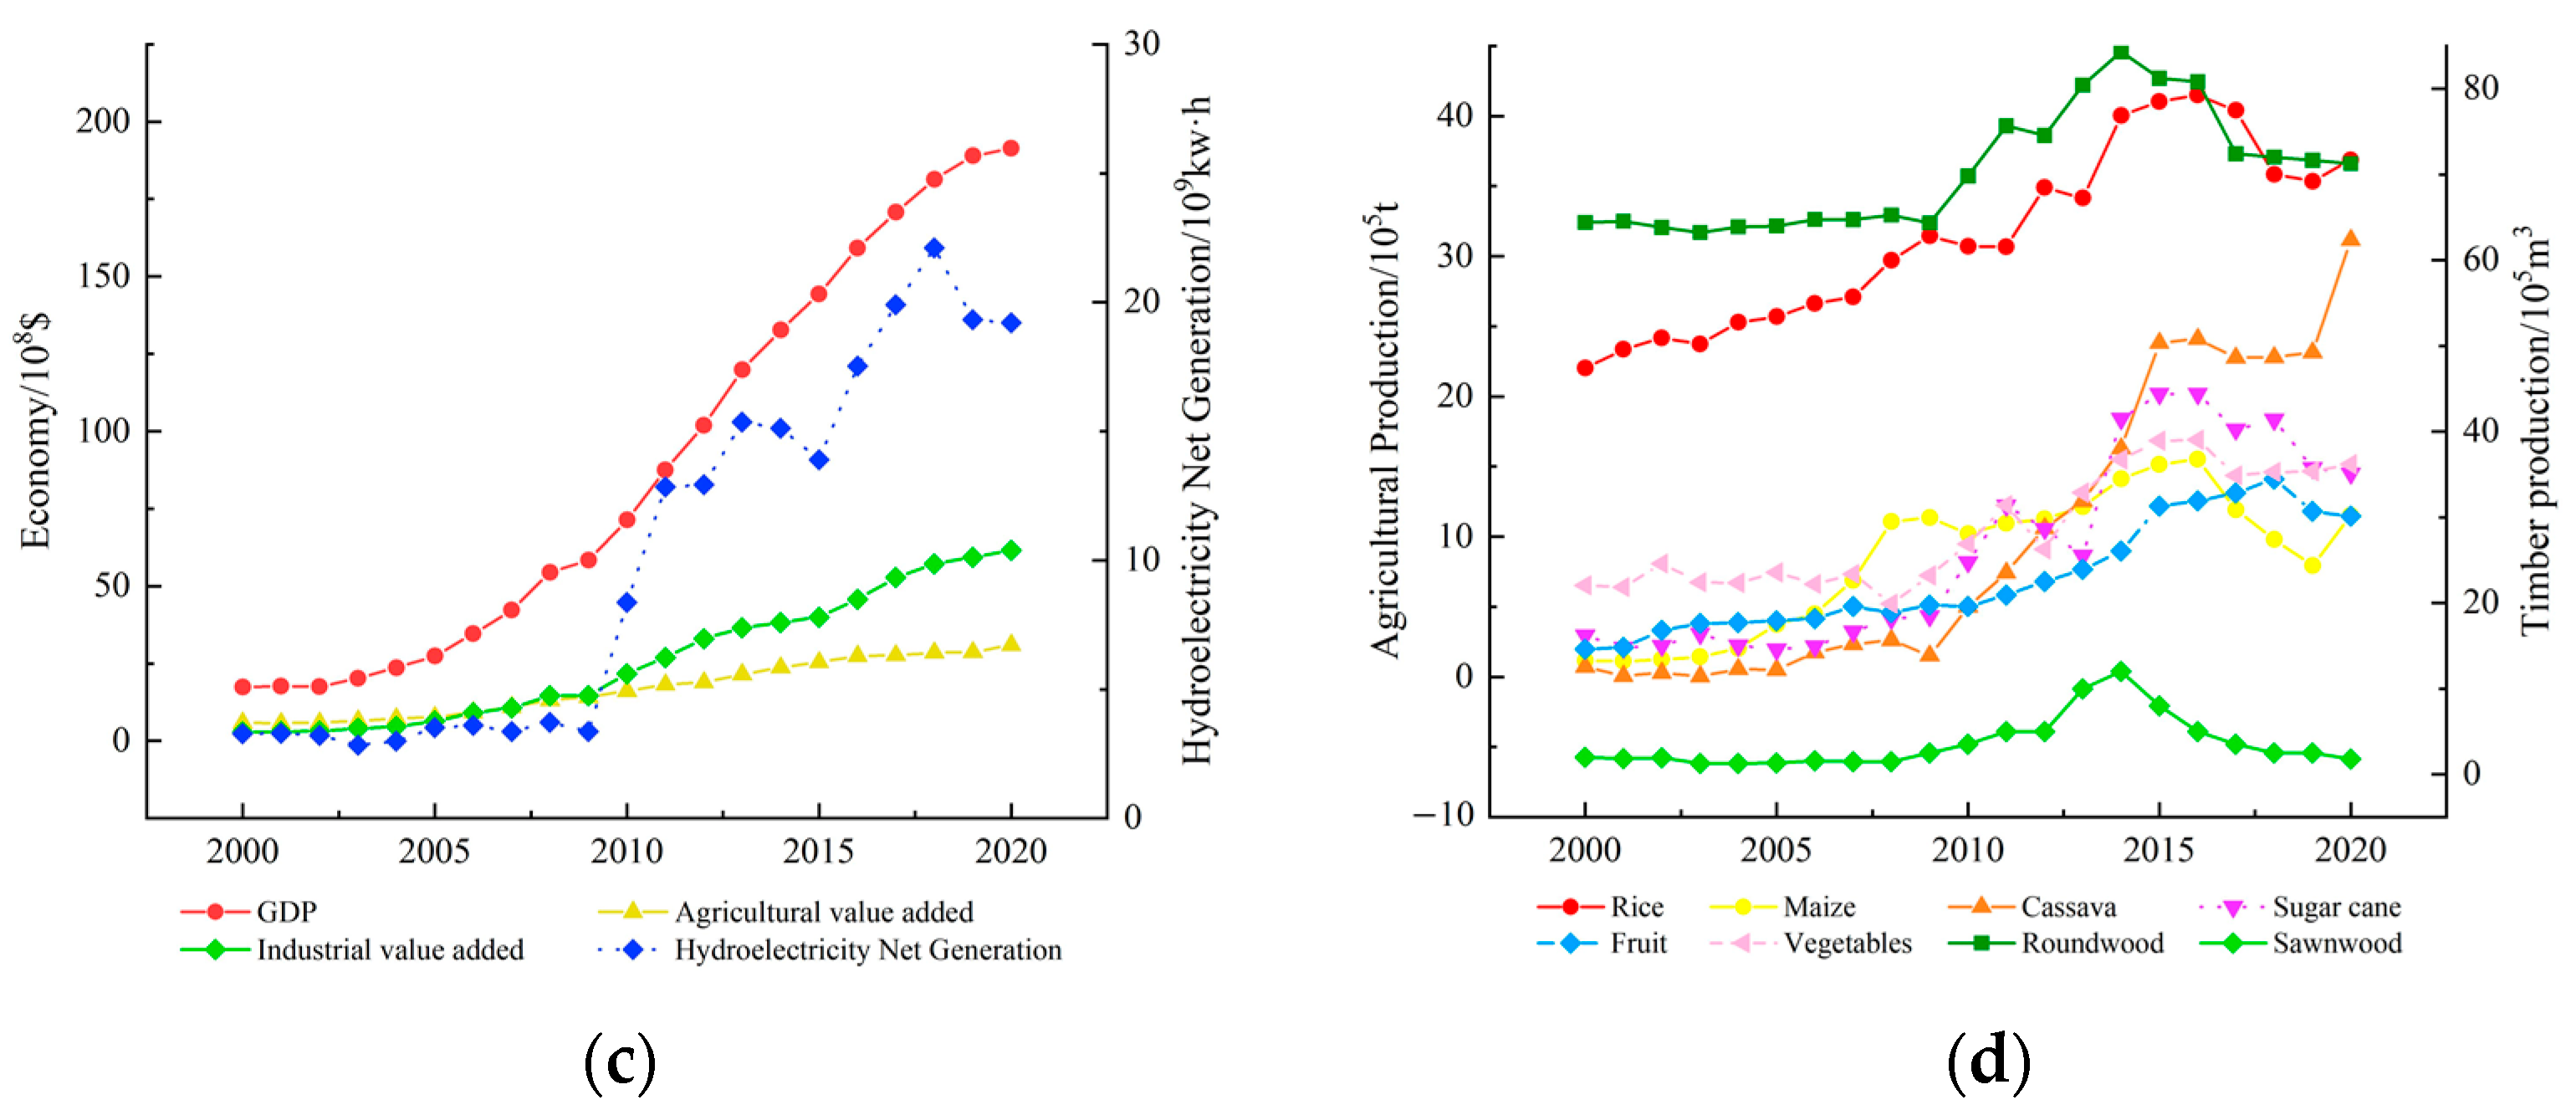
3.4. Economic, Social, Production and Climate Change Impacts
4. Discussion
4.1. LUCC and Its Impacts and Recommendations
4.2. Driving Mechanisms and Future Research Priorities
4.3. Uncertainty of the Study
5. Conclusions
Author Contributions
Funding
Institutional Review Board Statement
Informed Consent Statement
Data Availability Statement
Acknowledgments
Conflicts of Interest
Abbreviations
| LUCC | Land use/land cover change |
| LUC | Land use/land cover |
| GLC_FCS30 | Global Land-Cover product with Fine Classification System at 30 m |
| NRC | National Research Council |
| IGBP | International Geosphere-Biosphere Program |
| IHDP | International Human Dimensions Programme on Global Environmental Change |
| GLP | Global Land Programme |
| ICSU | International Council of Scientific Unions |
| ISSC | International Social Science Council |
| UNEP | United Nations Environment Programme |
| CCDC | Continuous Change Detection and Classification |
| PCA | Principal components analysis |
| FAO | Food and Agriculture Organization |
| PH | Phongsaly |
| LN | Luangnamtha |
| BK | Bokeo |
| OU | Oudomxay |
| LP | Luangprabang |
| HO | Huaphanh |
| XA | Xayaboury |
| VT | Vientiane Capital |
| XI | Xiengkhuang |
| VI | Vientiane |
| BL | Borikhamxay |
| KH | Khammuane |
| SV | Savannakhet |
| XB | Xaysomboon |
| SL | Saravan |
| XK | Xekong |
| CH | Champasack |
| AT | Attapeu |
References
- Güneralp, B.; Seto, K.C.; Ramachandran, M. Evidence of urban land teleconnections and impacts on hinterlands. Curr. Opin. Environ. Sustain. 2013, 5, 445–451. [Google Scholar] [CrossRef]
- Perring, M.P.; De Frenne, P.; Baeten, L.; Maes, S.L.; Depauw, L.; Blondeel, H.; Caron, M.M.; Verheyen, K. Global environmental change effects on ecosystems: The importance of land-use legacies. Glob. Chang Biol. 2016, 22, 1361–1371. [Google Scholar] [CrossRef] [PubMed]
- Boysen, L.R.; Brovkin, V.; Arora, V.K.; Cadule, P.; de Noblet-Ducoudré, N.; Kato, E.; Pongratz, J.; Gayler, V. Global and regional effects of land-use change on climate in 21st century simulations with interactive carbon cycle. Earth Syst. Dyn. 2014, 5, 309–319. [Google Scholar] [CrossRef] [Green Version]
- Liu, J.Y.; Deng, X.Z.; Liu, M.L.; Zhang, S.W. Study on the spatial patterns of land-use change and analyses of driving forces in northeastern china during 1990–2000. Chin. Geogr. Sci. 2002, 12, 299–308. [Google Scholar] [CrossRef]
- Sterling, S.M.; Ducharne, A.; Polcher, J. The impact of global land-cover change on the terrestrial water cycle. Nat. Clim. Change 2012, 3, 385–390. [Google Scholar] [CrossRef]
- Turner, B.L., II; Skole, D.L.; Sanderson, S.; Fischer, G.; Fresco, L.; Leemans, R. Land-use and land-cover change: Science/research plan. Glob. Chang. Rep. 1995. Available online: https://asu.pure.elsevier.com/en/publications/land-use-and-land-cover-change-scienceresearch-plan-2 (accessed on 5 May 2022).
- Moran, E.; Ojima, D.S.; Buchmann, B.; Canadell, J.G.; Coomes, O.; Graumlich, L.; Jackson, R.; Jaramillo, V.; Lavorel, S.; Leadley, P. Global Land Project: Science Plan and Implementation Strategy. IGBP Report No. 53/IHDP Report No. 19. 2005. Available online: https://publications.csiro.au/rpr/pub?list=BRO&pid=procite:b734a29e-14aa-4a06-8527-beef55ff7a39 (accessed on 5 May 2022).
- Armin, G. Future Earth: Neue Dynamik in der globalen NachhaltigkeitsforschungFuture Earth: New Dynamics in Global Sustainability Science. Gaia Oekologische Perspekt. Fuer Wiss. Und Ges. 2013, 22, 145. [Google Scholar]
- Zhu, Z.; Woodcock, C.E. Continuous change detection and classification of land cover using all available Landsat data. Remote Sens. Environ. 2014, 144, 152–171. [Google Scholar] [CrossRef] [Green Version]
- Nasiri, V.; Deljouei, A.; Moradi, F.; Sadeghi, S.M.M.; Borz, S.A. Land Use and Land Cover Mapping Using Sentinel-2, Landsat-8 Satellite Images, and Google Earth Engine: A Comparison of Two Composition Methods. Remote Sens. 2022, 14, 1977. [Google Scholar] [CrossRef]
- Hussain, S.; Mubeen, M.; Karuppannan, S. Land use and land cover (LULC) change analysis using TM, ETM+ and OLI Landsat images in district of Okara, Punjab, Pakistan. Phys. Chem. Earth Parts A/B/C 2022, 126, 103117. [Google Scholar] [CrossRef]
- Gibbs, H.K.; Ruesch, A.S.; Achard, F.; Clayton, M.K.; Holmgren, P.; Ramankutty, N.; Foley, J.A. Tropical forests were the primary sources of new agricultural land in the 1980s and 1990s. Proc. Natl. Acad. Sci. USA 2010, 107, 16732–16737. [Google Scholar] [CrossRef] [Green Version]
- Lambin, E.F.; Geist, H.J.; Lepers, E. Dynamics of land-use and land-cover change in tropical regions. Annu. Rev. Environ. Resour. 2003, 28, 205–241. [Google Scholar] [CrossRef] [Green Version]
- Lambin, E.F.; Turner, B.L.; Geist, H.J.; Agbola, S.B.; Angelsen, A.; Bruce, J.W.; Coomes, O.T.; Dirzo, R.; Fischer, G.; Folke, C.; et al. The causes of land-use and land-cover change: Moving beyond the myths. Glob. Environ. Change-Hum. Policy Dimens. 2001, 11, 261–269. [Google Scholar] [CrossRef]
- Friedl, M.A.; Sulla-Menashe, D.; Tan, B.; Schneider, A.; Ramankutty, N.; Sibley, A.M.; Huang, X. MODIS Collection 5 global land cover: Algorithm refinements and characterization of new datasets. Remote Sens. Environ. 2010, 114, 168–182. [Google Scholar] [CrossRef]
- Hua, T.; Zhao, W.; Liu, Y.; Wang, S.; Yang, S. Spatial Consistency Assessments for Global Land-Cover Datasets: A Comparison among GLC2000, CCI LC, MCD12, GLOBCOVER and GLCNMO. Remote Sens. 2018, 10, 1846. [Google Scholar] [CrossRef] [Green Version]
- Pan, H.; Tong, X.; Xu, X.; Luo, X.; Li, B. Updating of Land Cover Maps and Change Analysis Using GlobeLand30 Product: A Case Study in Shanghai Metropolitan Area, China. Remote Sens. 2020, 12, 3147. [Google Scholar] [CrossRef]
- Zhang, X.; Liu, L.; Wu, C.; Chen, X.; Zhang, B. Development of a global 30-m impervious surface map using multi-source and multi-temporal remote sensing datasets with the Google Earth Engine platform. Earth Syst. Sci. Data 2020, 12, 1625–1648. [Google Scholar] [CrossRef]
- Boundeth, S.; Nanseki, T.; Takeuchi, S.; Satho, T. Land Use Change and Its Determinant Factors in Northern Laos: Spatial and Socio-economic Analysis. J. Agric. Sci. 2012, 4, 190–204. [Google Scholar] [CrossRef] [Green Version]
- Liu, X.N.; Jiang, L.G.; Feng, Z.M. Rubber Plantation Expansion Related Land Use Change along the Laos-China Border Region. Sustainability 2016, 2016, 1011. [Google Scholar] [CrossRef] [Green Version]
- Faichia, C.; Tong, Z.; Zhang, J.; Liu, X.; Kazuva, E.; Ullah, K.; Al-Shaibah, B. Using RS Data-Based CA–Markov Model for Dynamic Simulation of Historical and Future LUCC in Vientiane, Laos. Sustainability 2020, 12, 8410. [Google Scholar] [CrossRef]
- Inoue, Y.; Kiyono, Y.; Asai, H.; Ochiai, Y.; Dounagsavanh, L. Assessing land-use and carbon stock in slash-and-burn ecosystems in tropical mountain of Laos based on time-series satellite images. Int. J. Appl. Earth Obs. Geoinf. 2010, 12, 287–297. [Google Scholar] [CrossRef]
- Data Sharing and Service Portal. Available online: https://data.casearth.cn/ (accessed on 5 May 2022).
- Zhang, X.; Liu, L.; Chen, X.; Gao, Y.; Xie, S.; Mi, J. GLC_FCS30: Global land-cover product with fine classification system at 30 m using time-series Landsat imagery. Earth Syst. Sci. Data 2021, 13, 2753–2776. [Google Scholar] [CrossRef]
- Rodell, M.; Kato, H.; Zaitchik, B.F. Ongoing Development of NASA’s Global Land Data Assimilation System. Bull. Am. Meteorol. Soc. 2008, 2008, H43E-05. [Google Scholar]
- Ashouri, H.; Hsu, K.L.; Sorooshian, S.; Braithwaite, D.K.; Knapp, K.R.; Cecil, L.D.; Nelson, B.R.; Prat, O.P. Persiann-Cdr: Daily Precipitation Climate Data Record from Multisatellite Observations for Hydrological and Climate Studies. Bull. Am. Meteorol. Soc. 2014, 96, 197–210. [Google Scholar] [CrossRef] [Green Version]
- The World Bank. Available online: https://www.shihang.org/zh/home (accessed on 10 May 2022).
- Knoema. Available online: https://knoema.com (accessed on 9 June 2022).
- Food and Agriculture Organization of the United Nations. Available online: http://www.fao.org/ (accessed on 9 June 2022).
- Wang, X.; Bao, Y. Discussion on Research Methods of Land Use Dynamic Change. Adv. Geogr. Sci. 1999, 18, 81–87. [Google Scholar]
- Niu, X.; Hu, Y.; Lei, Z.; Yan, H.; Ye, J.; Wang, H. Temporal and Spatial Evolution Characteristics and Its Driving Mechanism of Land Use/Cover in Vietnam from 2000 to 2020. Land 2022, 11, 920. [Google Scholar] [CrossRef]
- Lu, P. Analysis of Urban Land Use Change Based on Transition Matrix. Beijing Surv. Mapp. 2017, 1, 13–16. [Google Scholar]
- Xu, L.; Zhao, Y. Using Markov Process to Predict the Change of Land Use Pattern in Dongling District. J. Appl. Ecol. 1993, 3, 272–277. [Google Scholar]
- Jin, G.; Chen, K.; Wang, P.; Guo, B.; Dong, Y.; Yang, J. Trade-offs in land-use competition and sustainable land development in the North China Plain. Technol. Forecast. Soc. Chang. 2019, 141, 36–46. [Google Scholar] [CrossRef]
- Rutten, M.; van Dijk, M.; van Rooij, W.; Hilderink, H. Land Use Dynamics, Climate Change, and Food Security in Vietnam: A Global-to-local Modeling Approach. World Dev. 2014, 59, 29–46. [Google Scholar] [CrossRef]
- Hue, S.W.; Korom, A.; Seng, Y.W.; Sihapanya, V.; Phimmavong, S.; Phua, M.H. Land Use and Land Cover Change in Vientiane Area, Lao PDR Using Object-Oriented Classification on Multi-Temporal Landsat Data. In Proceedings of the International Conference on Information in Business and Technology Management (12BM), Penang, Malaysia, 28 February 2017; pp. 11340–11344. [Google Scholar]
- Wang, J.; Sui, L.; Yang, X.; Wang, Z.; Ge, D.; Kang, J.; Yang, F.; Liu, Y.; Liu, B. Economic Globalization Impacts on the Ecological Environment of Inland Developing Countries: A Case Study of Laos from the Perspective of the Land Use/Cover Change. Sustainability 2019, 11, 3940. [Google Scholar] [CrossRef] [Green Version]
- Pongkhao, S. Illegal Logging Remains an Issue Despite PM’s Order. Available online: https://vientianetimes.org.la/freeContent/FreeConten_Illegal_26.php?fbclid=IwAR2tLW15kfOW8Z0V0pjepQp_ueJRcjR2BE2B161N6p2E-2aVVmhiiQVAVE4 (accessed on 10 June 2022).
- Curtis, P.G.; Slay, C.M.; Harris, N.L.; Tyukavina, A.; Hansen, M.C. Classifying drivers of global forest loss. Science 2018, 361, 1108–1111. [Google Scholar] [CrossRef] [PubMed]
- Song, X.P.; Hansen, M.C.; Stehman, S.V.; Potapov, P.V.; Tyukavina, A.; Vermote, E.F.; Townshend, J.R. Global land change from 1982 to 2016. Nature 2018, 560, 639. [Google Scholar] [CrossRef] [PubMed]
- Prabhakar, S. A succinct review and analysis of drivers and impacts of agricultural land transformations in Asia. Land Use Policy 2021, 102, 105238. [Google Scholar] [CrossRef]
- Hosonuma, N.; Herold, M.; De Sy, V.; De Fries, R.S.; Brockhaus, M.; Verchot, L.; Angelsen, A.; Romijn, E. An assessment of deforestation and forest degradation drivers in developing countries. Environ. Res. Lett. 2012, 7, 044009. [Google Scholar] [CrossRef]
- Paudel, B.; Zhang, Y.; Yan, J.; Rai, R.; Li, L. Farmers’ perceptions of agricultural land use changes in Nepal and their major drivers. J. Environ. Manag. 2019, 235, 432–441. [Google Scholar] [CrossRef] [PubMed]
- Chen, Y.; Shao, H.; Li, Y. Consistency analysis and accuracy assessment of multi-source land cover products in the Yangtze River Delta. Trans. Chin. Soc. Agric. Eng. 2021, 37, 142–150. [Google Scholar]
- Kang, J.M.; Sui, L.C.; Yang, X.M.; Wang, Z.H.; Huang, C.; Wang, J. Spatial Pattern Consistency among Different Remote-Sensing Land Cover Datasets: A Case Study in Northern Laos. Isprs Int. J. Geo-Inf. 2019, 8, 201. [Google Scholar] [CrossRef] [Green Version]


| Code | Level 1 Classes | LUC ID | Level 2 Classes |
|---|---|---|---|
| 1 | Rainfed cropland | 10 | Rainfed cropland |
| 11 | Herbaceous cover | ||
| 12 | Tree or shrub cover (orchard) | ||
| 2 | Irrigated cropland | 20 | Irrigated cropland |
| 3 | Evergreen broad-leaved forest | 51 | Open evergreen broad-leaved forest |
| 52 | Closed evergreen broad-leaved forest | ||
| 4 | Deciduous broad-leaved forest | 61 | Open deciduous broad-leaved forest (0.15 < fc < 0.4) |
| 62 | Closed deciduous broad-leaved forest (fc > 0.4) | ||
| 5 | Evergreen needle-leaved forest | 71 | Open evergreen needle-leaved forest (0.15 < fc < 0.4) |
| 72 | Closed evergreen needle-leaved forest (fc > 0.4) | ||
| 6 | Shrubland | 120 | Shrubland |
| 121 | Evergreen shrubland | ||
| 7 | Grassland | 130 | Grassland |
| 200 | Bare areas | ||
| 8 | Impervious surfaces | 190 | Impervious surfaces |
| 9 | Wetland and water body | 210 | Water body |
| 220 | Permanent ice and snow | ||
| 180 | Wetland |
| Category | Index | Unit |
|---|---|---|
| Climate | X1 Average annual temperature | °C |
| X2 Total annual precipitation | mm | |
| X3 Rainy season precipitation | mm | |
| Social development | X4 Gross population | 10,000 people |
| X5 Rural population | 10,000 people | |
| X6 Urban population | 10,000 people | |
| X7 Urbanization rate | % | |
| Economic development | X8 Gross Domestic Product (GDP) | 100 million (current USD) |
| X9 Agricultural value added | 100 million (current USD) | |
| X10 Industrial value added | 100 million (current USD) | |
| X11 Hydroelectricity Net Generation | Billion Kilowatthours | |
| Production | X12 Rice | t |
| X13 Maize | t | |
| X14 Cassava | t | |
| X15 Sugar cane | t | |
| X16 Fruit | t | |
| X17 Vegetables | t | |
| X18 Roundwood | m3 | |
| X19 Sawnwood | m3 |
| Variables | Description | Component | ||
|---|---|---|---|---|
| F1 | F2 | F3 | ||
| X1 | Average annual temperature | 0.957 | 0.117 | −0.197 |
| X2 | Total annual precipitation | −0.705 | 0.616 | 0.349 |
| X3 | Rainy season precipitation | −0.767 | 0.619 | 0.167 |
| X4 | Gross population | 0.959 | 0.256 | −0.118 |
| X5 | Rural population | 0.968 | 0.233 | −0.034 |
| X6 | Urban population | 0.951 | 0.263 | −0.148 |
| X7 | Urbanization rate | 0.945 | 0.199 | −0.234 |
| X8 | Gross Domestic Product (GDP) | 0.959 | 0.272 | 0.075 |
| X9 | Agricultural value added | 0.976 | 0.213 | 0.012 |
| X10 | Industrial value added | 0.935 | 0.351 | 0.028 |
| X11 | Hydroelectricity Net Generation | 0.945 | 0.314 | 0.058 |
| X12 | Rice | 0.986 | −0.154 | 0.016 |
| X13 | Maize | 0.958 | −0.244 | −0.135 |
| X14 | Cassava | 0.936 | 0.271 | 0.222 |
| X15 | Sugar cane | 0.956 | −0.199 | 0.208 |
| X16 | Fruit | 0.977 | 0.023 | 0.137 |
| X17 | Vegetables | 0.979 | −0.053 | 0.178 |
| X18 | Roundwood | 0.869 | −0.457 | 0.187 |
| X19 | Sawnwood | 0.599 | −0.763 | 0.236 |
| Variance | 84.22% | 12.30% | 2.86% | |
| Eigenvalues | 16 | 2.34 | 0.54 | |
| Classes | Formula | R2 |
|---|---|---|
| Rainfed cropland | 0.98 | |
| Irrigated cropland | 1.00 | |
| Forest | 1.00 | |
| Shrubland | 1.00 | |
| Impervious surfaces | 0.99 |
| Classes | Formula | R2 |
|---|---|---|
| Rainfed cropland | 0.99 | |
| Irrigated cropland | 1.00 | |
| Forest | 1.00 | |
| Shrubland | 0.99 | |
| Impervious surfaces | 0.98 |
Publisher’s Note: MDPI stays neutral with regard to jurisdictional claims in published maps and institutional affiliations. |
© 2022 by the authors. Licensee MDPI, Basel, Switzerland. This article is an open access article distributed under the terms and conditions of the Creative Commons Attribution (CC BY) license (https://creativecommons.org/licenses/by/4.0/).
Share and Cite
Zhang, Y.; Niu, X.; Hu, Y.; Yan, H.; Zhen, L. Temporal and Spatial Evolution Characteristics and Its Driving Mechanism of Land Use/Land Cover Change in Laos from 2000 to 2020. Land 2022, 11, 1188. https://doi.org/10.3390/land11081188
Zhang Y, Niu X, Hu Y, Yan H, Zhen L. Temporal and Spatial Evolution Characteristics and Its Driving Mechanism of Land Use/Land Cover Change in Laos from 2000 to 2020. Land. 2022; 11(8):1188. https://doi.org/10.3390/land11081188
Chicago/Turabian StyleZhang, Yu, Xiaoyu Niu, Yunfeng Hu, Huimin Yan, and Lin Zhen. 2022. "Temporal and Spatial Evolution Characteristics and Its Driving Mechanism of Land Use/Land Cover Change in Laos from 2000 to 2020" Land 11, no. 8: 1188. https://doi.org/10.3390/land11081188