
Remote Sensing-Based Prediction of Temporal Changes in Land Surface Temperature and Land Use-Land Cover (LULC) in Urban Environments
 ,
,  , , ,
, , ,  and
and
Abstract
:1. Introduction
2. Materials and Methods
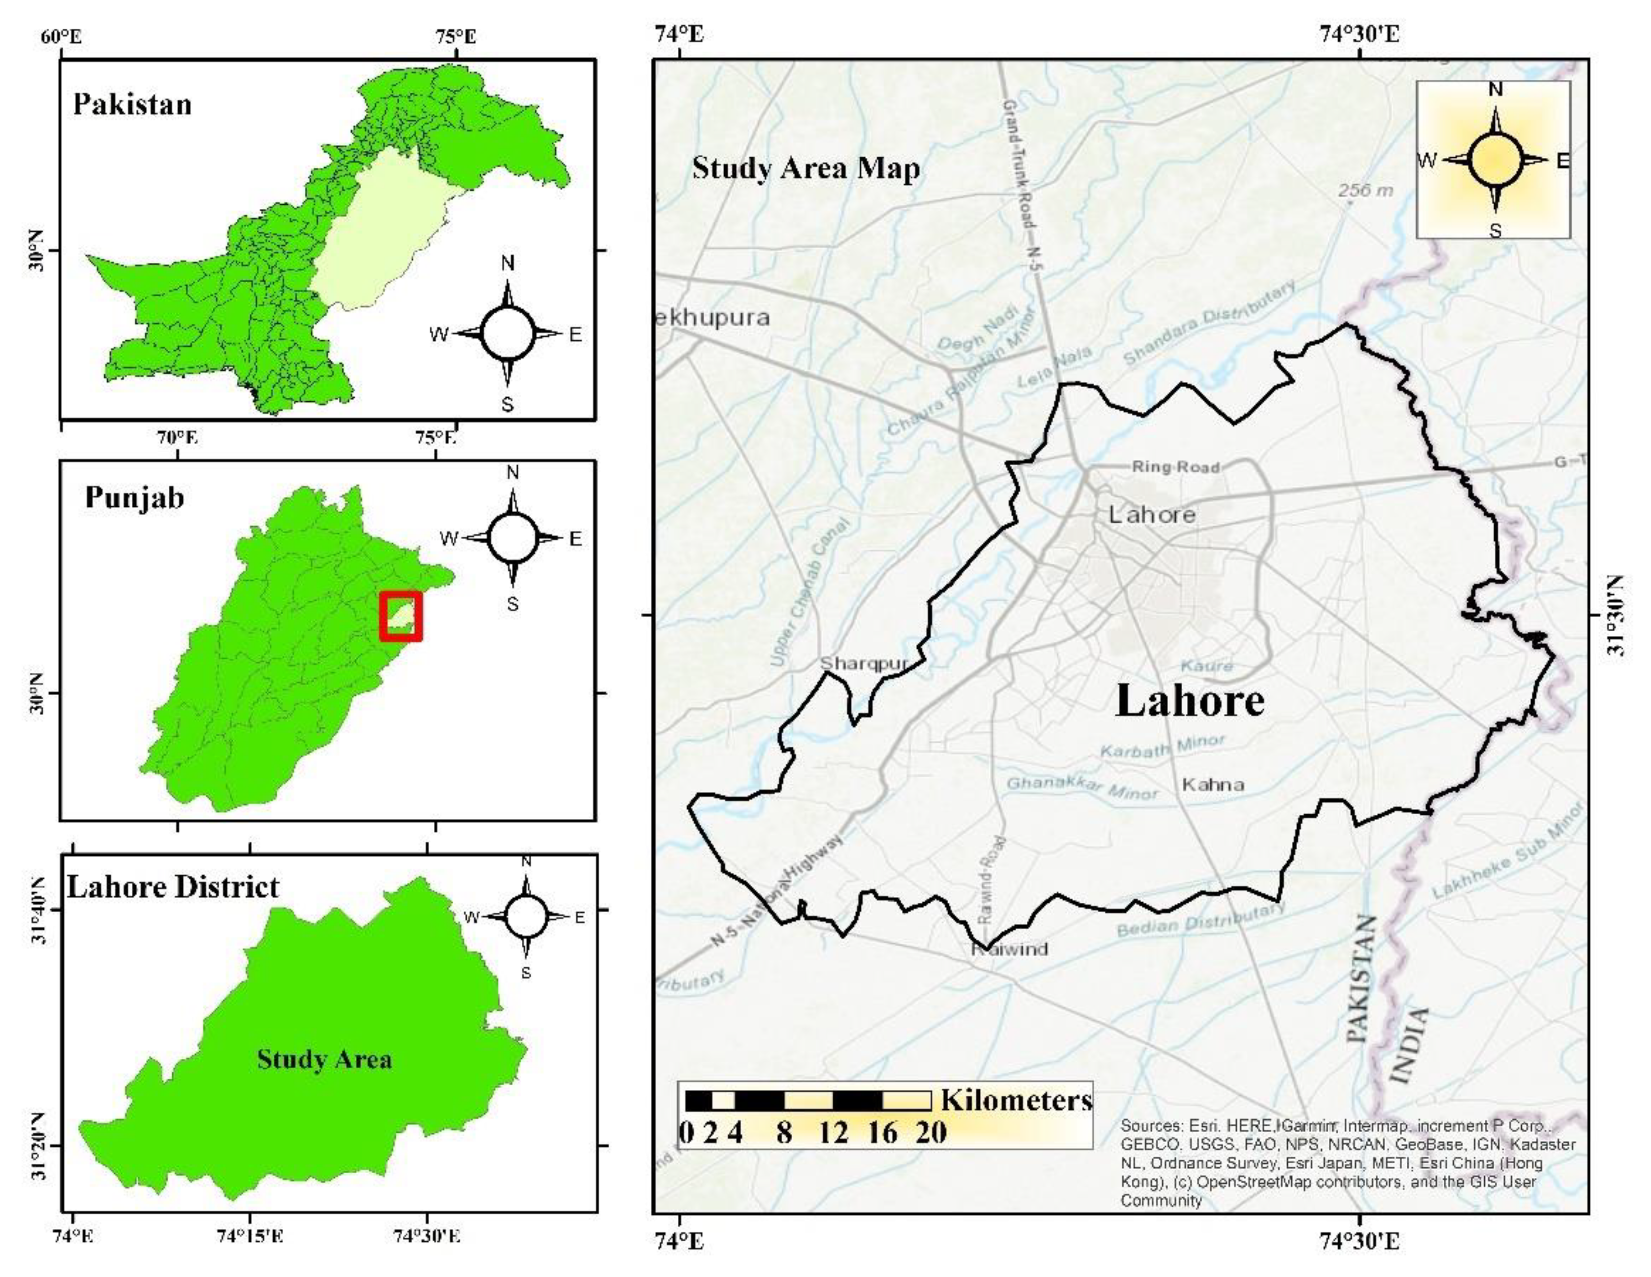
2.1. Study Area
2.2. Data Acquisition and Processing
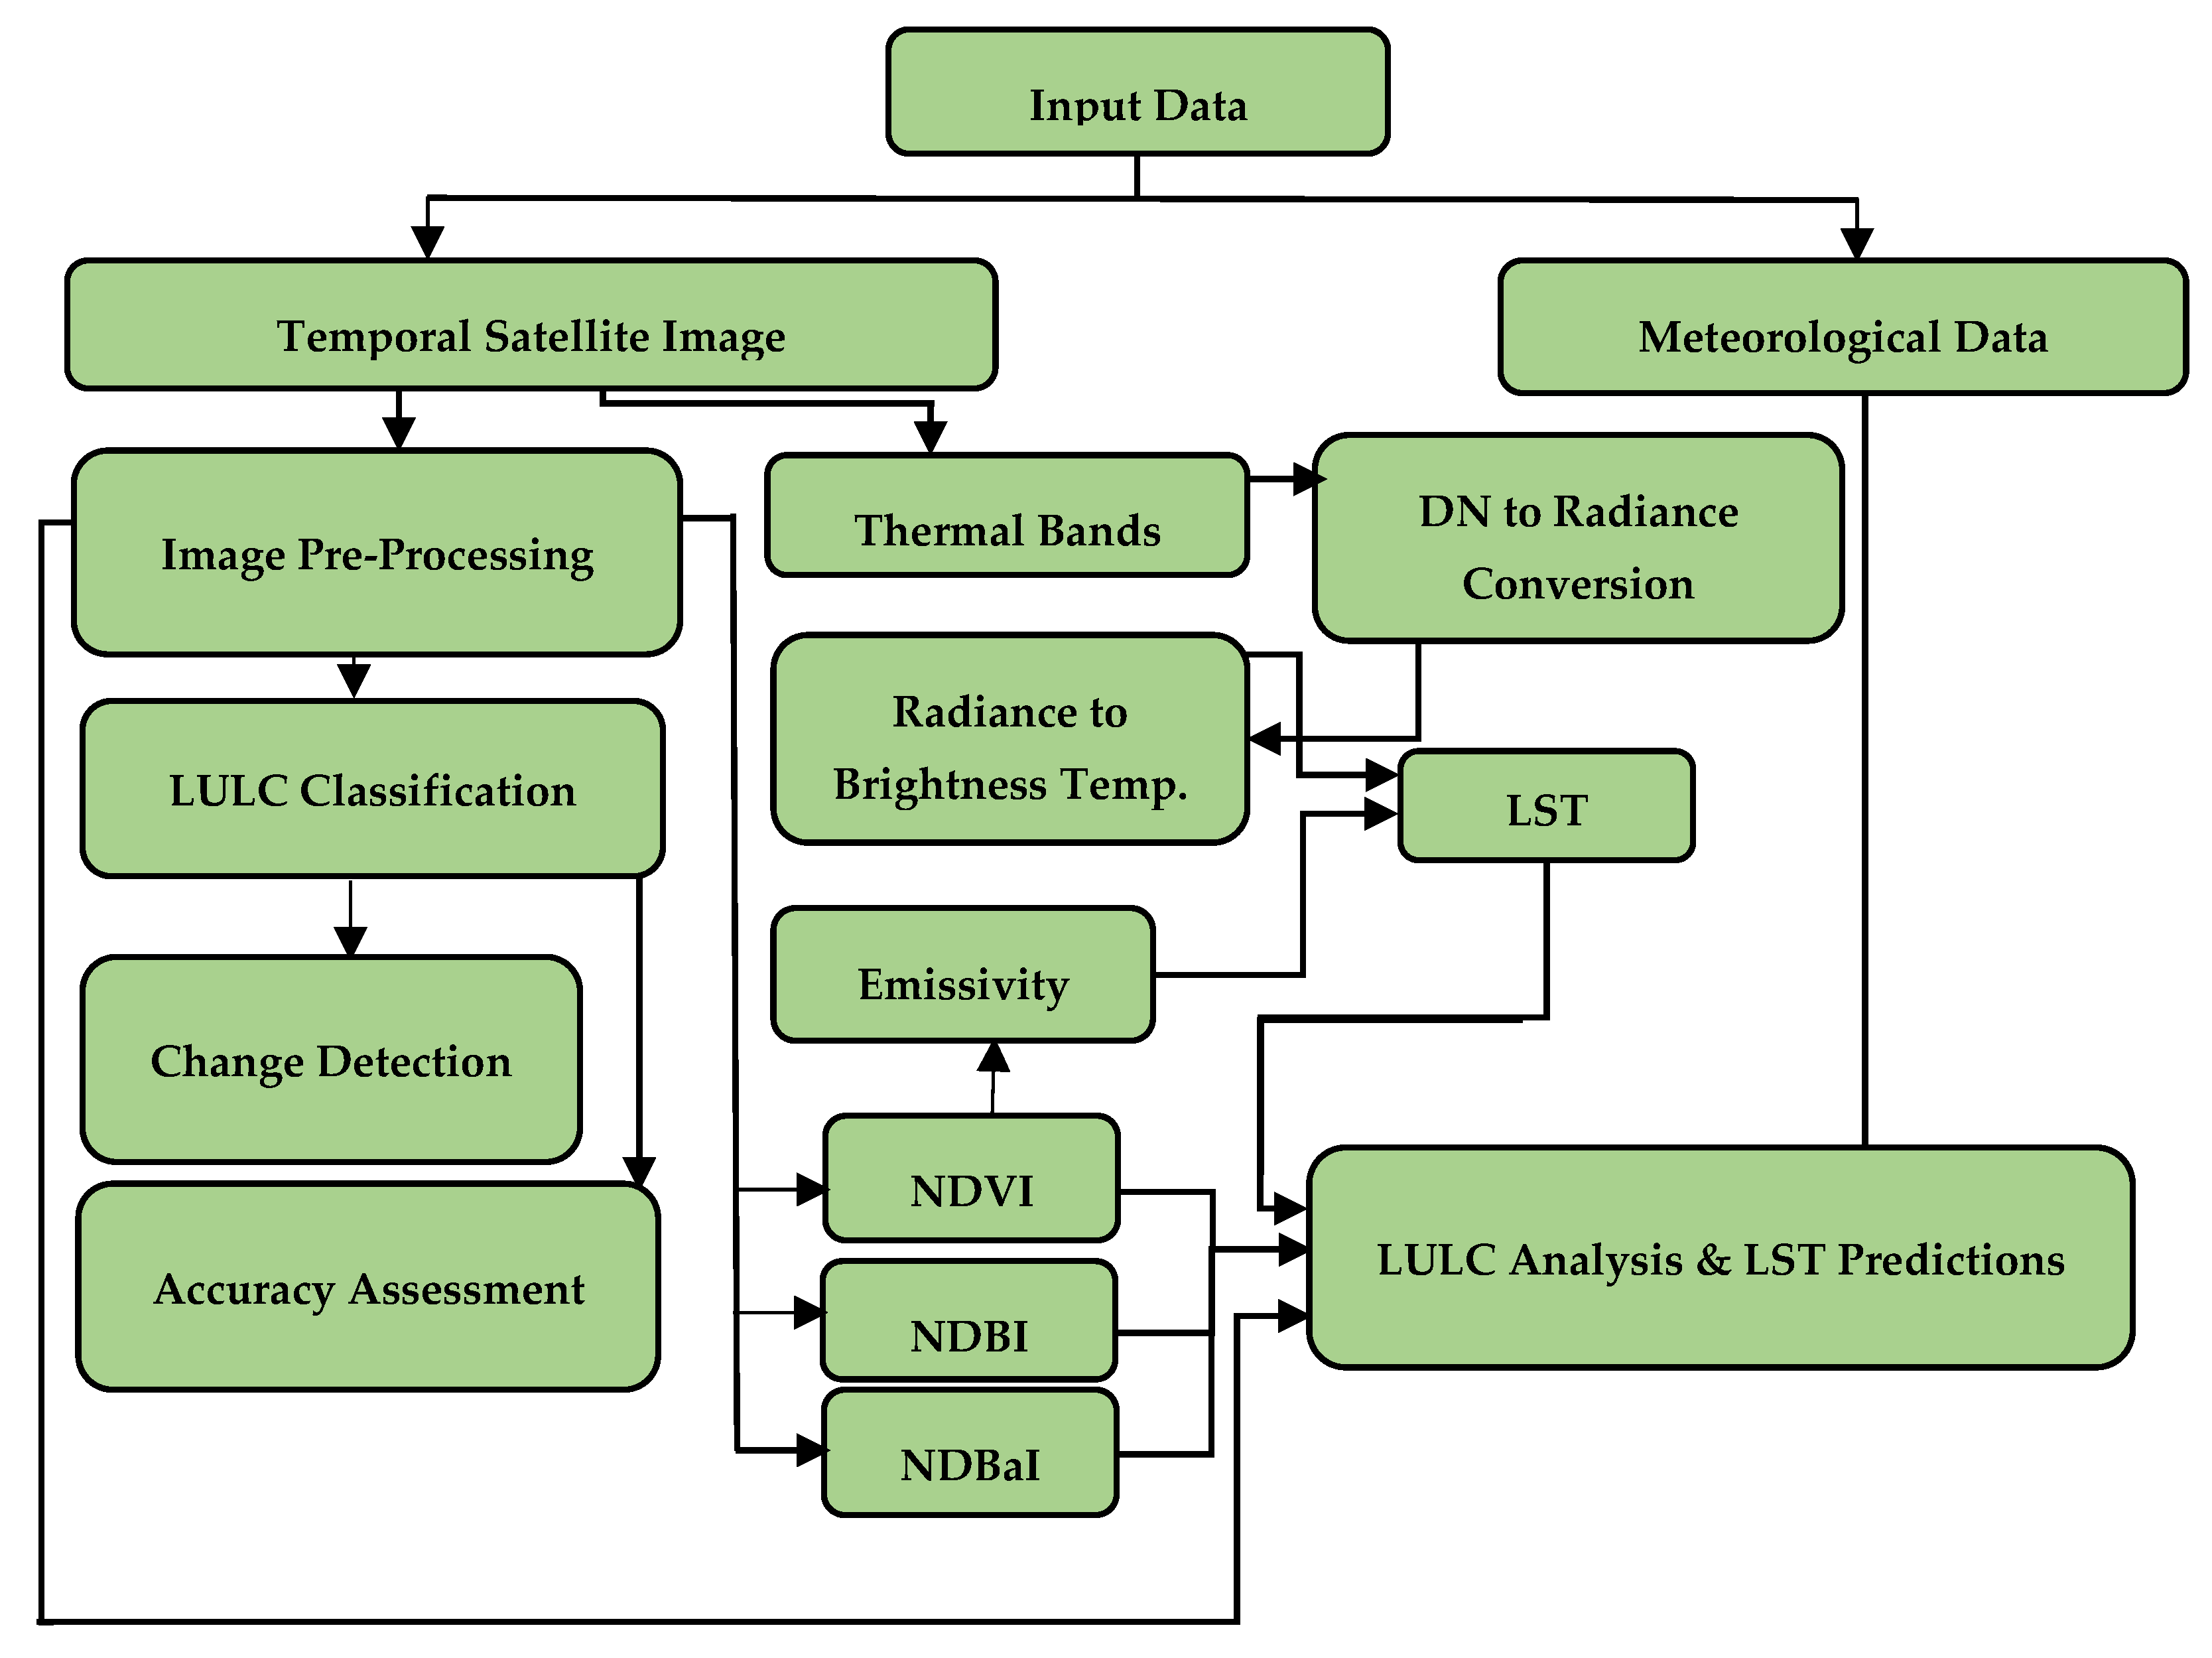
2.3. Methodological Formwork
2.4. Retrieving LST from Satellite Remote Sensing Data
- W = wavelength emitted radiance, h = Plank’s constant (6:626 × 10−34 J/s)
- C = light velocity (2:998 × 108 m/s), σ = Boltzmann constant (1:38 × 10−23 m2 kg s−2 K)
3. Results
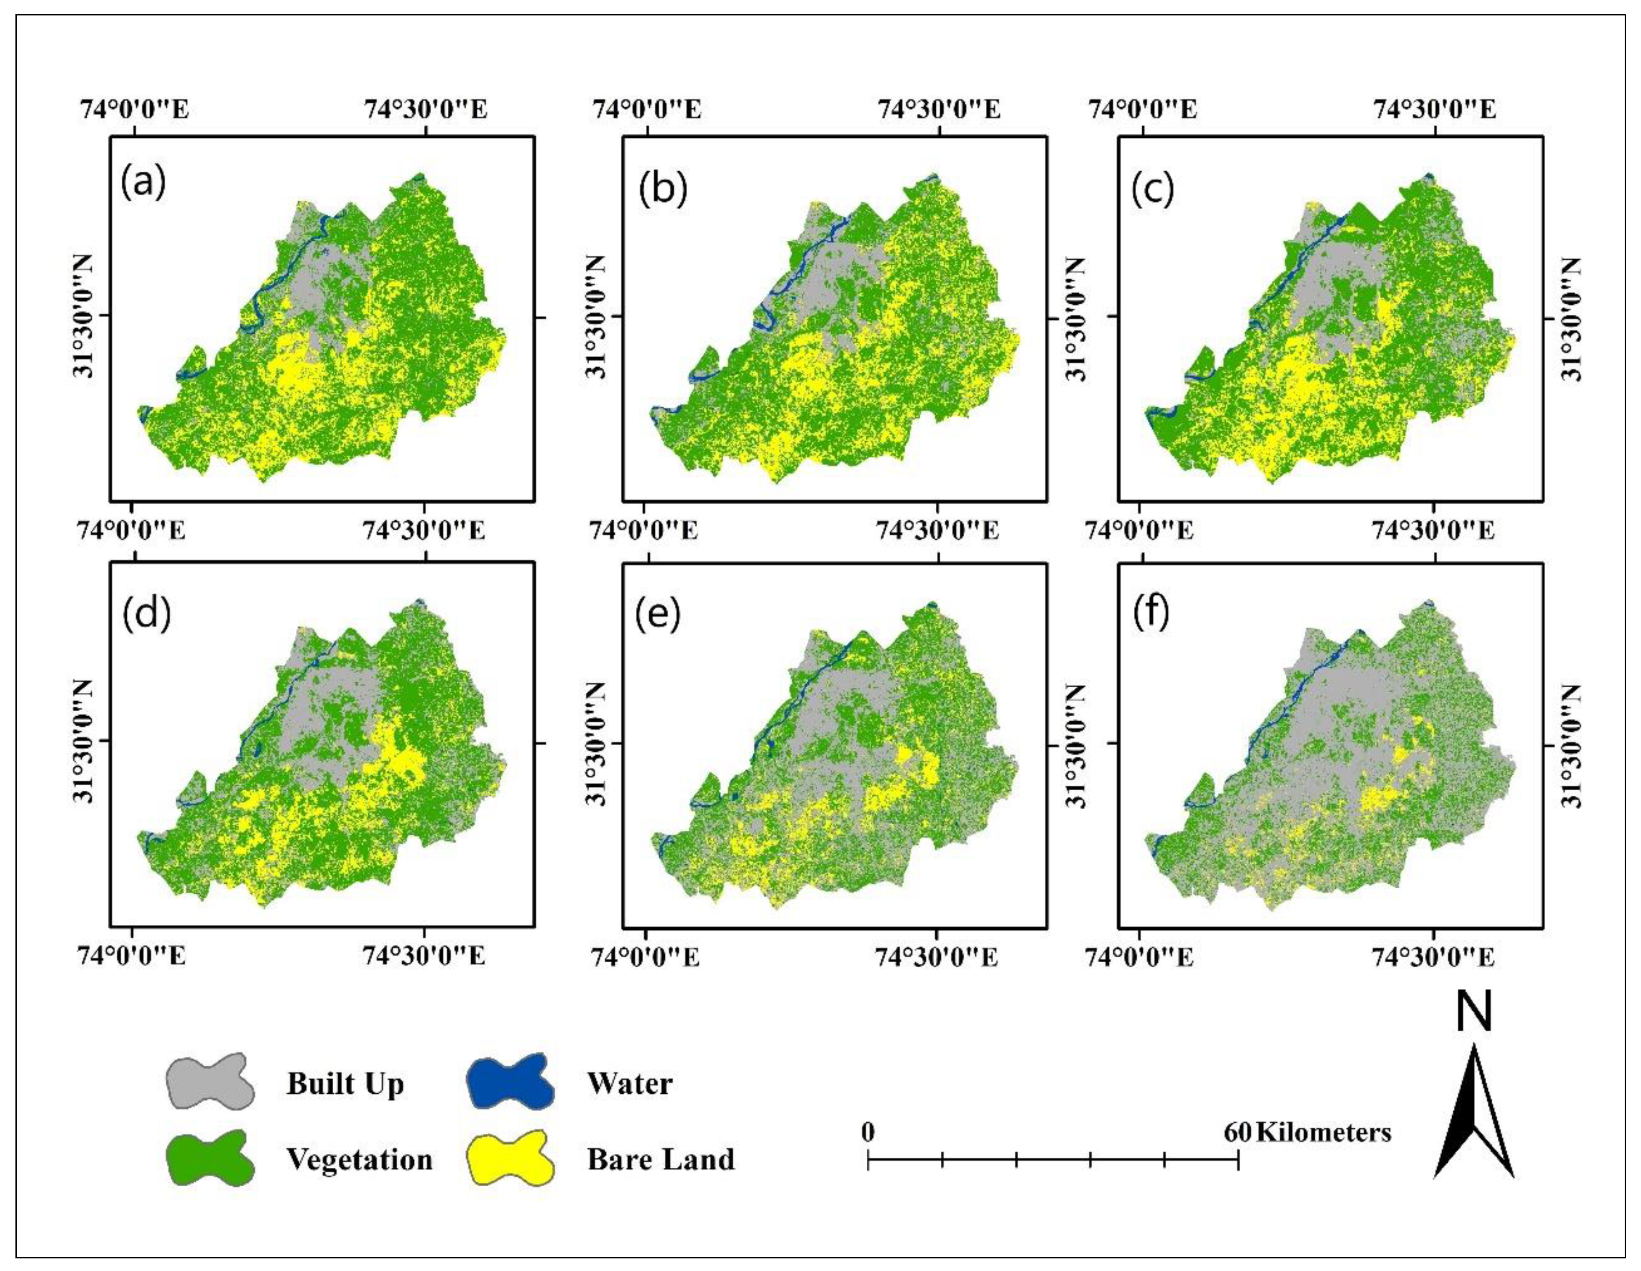
3.1. LULC Classification and Spectral Indices
3.2. Spectral Indices
3.3. Land Surface Temperature (LST)
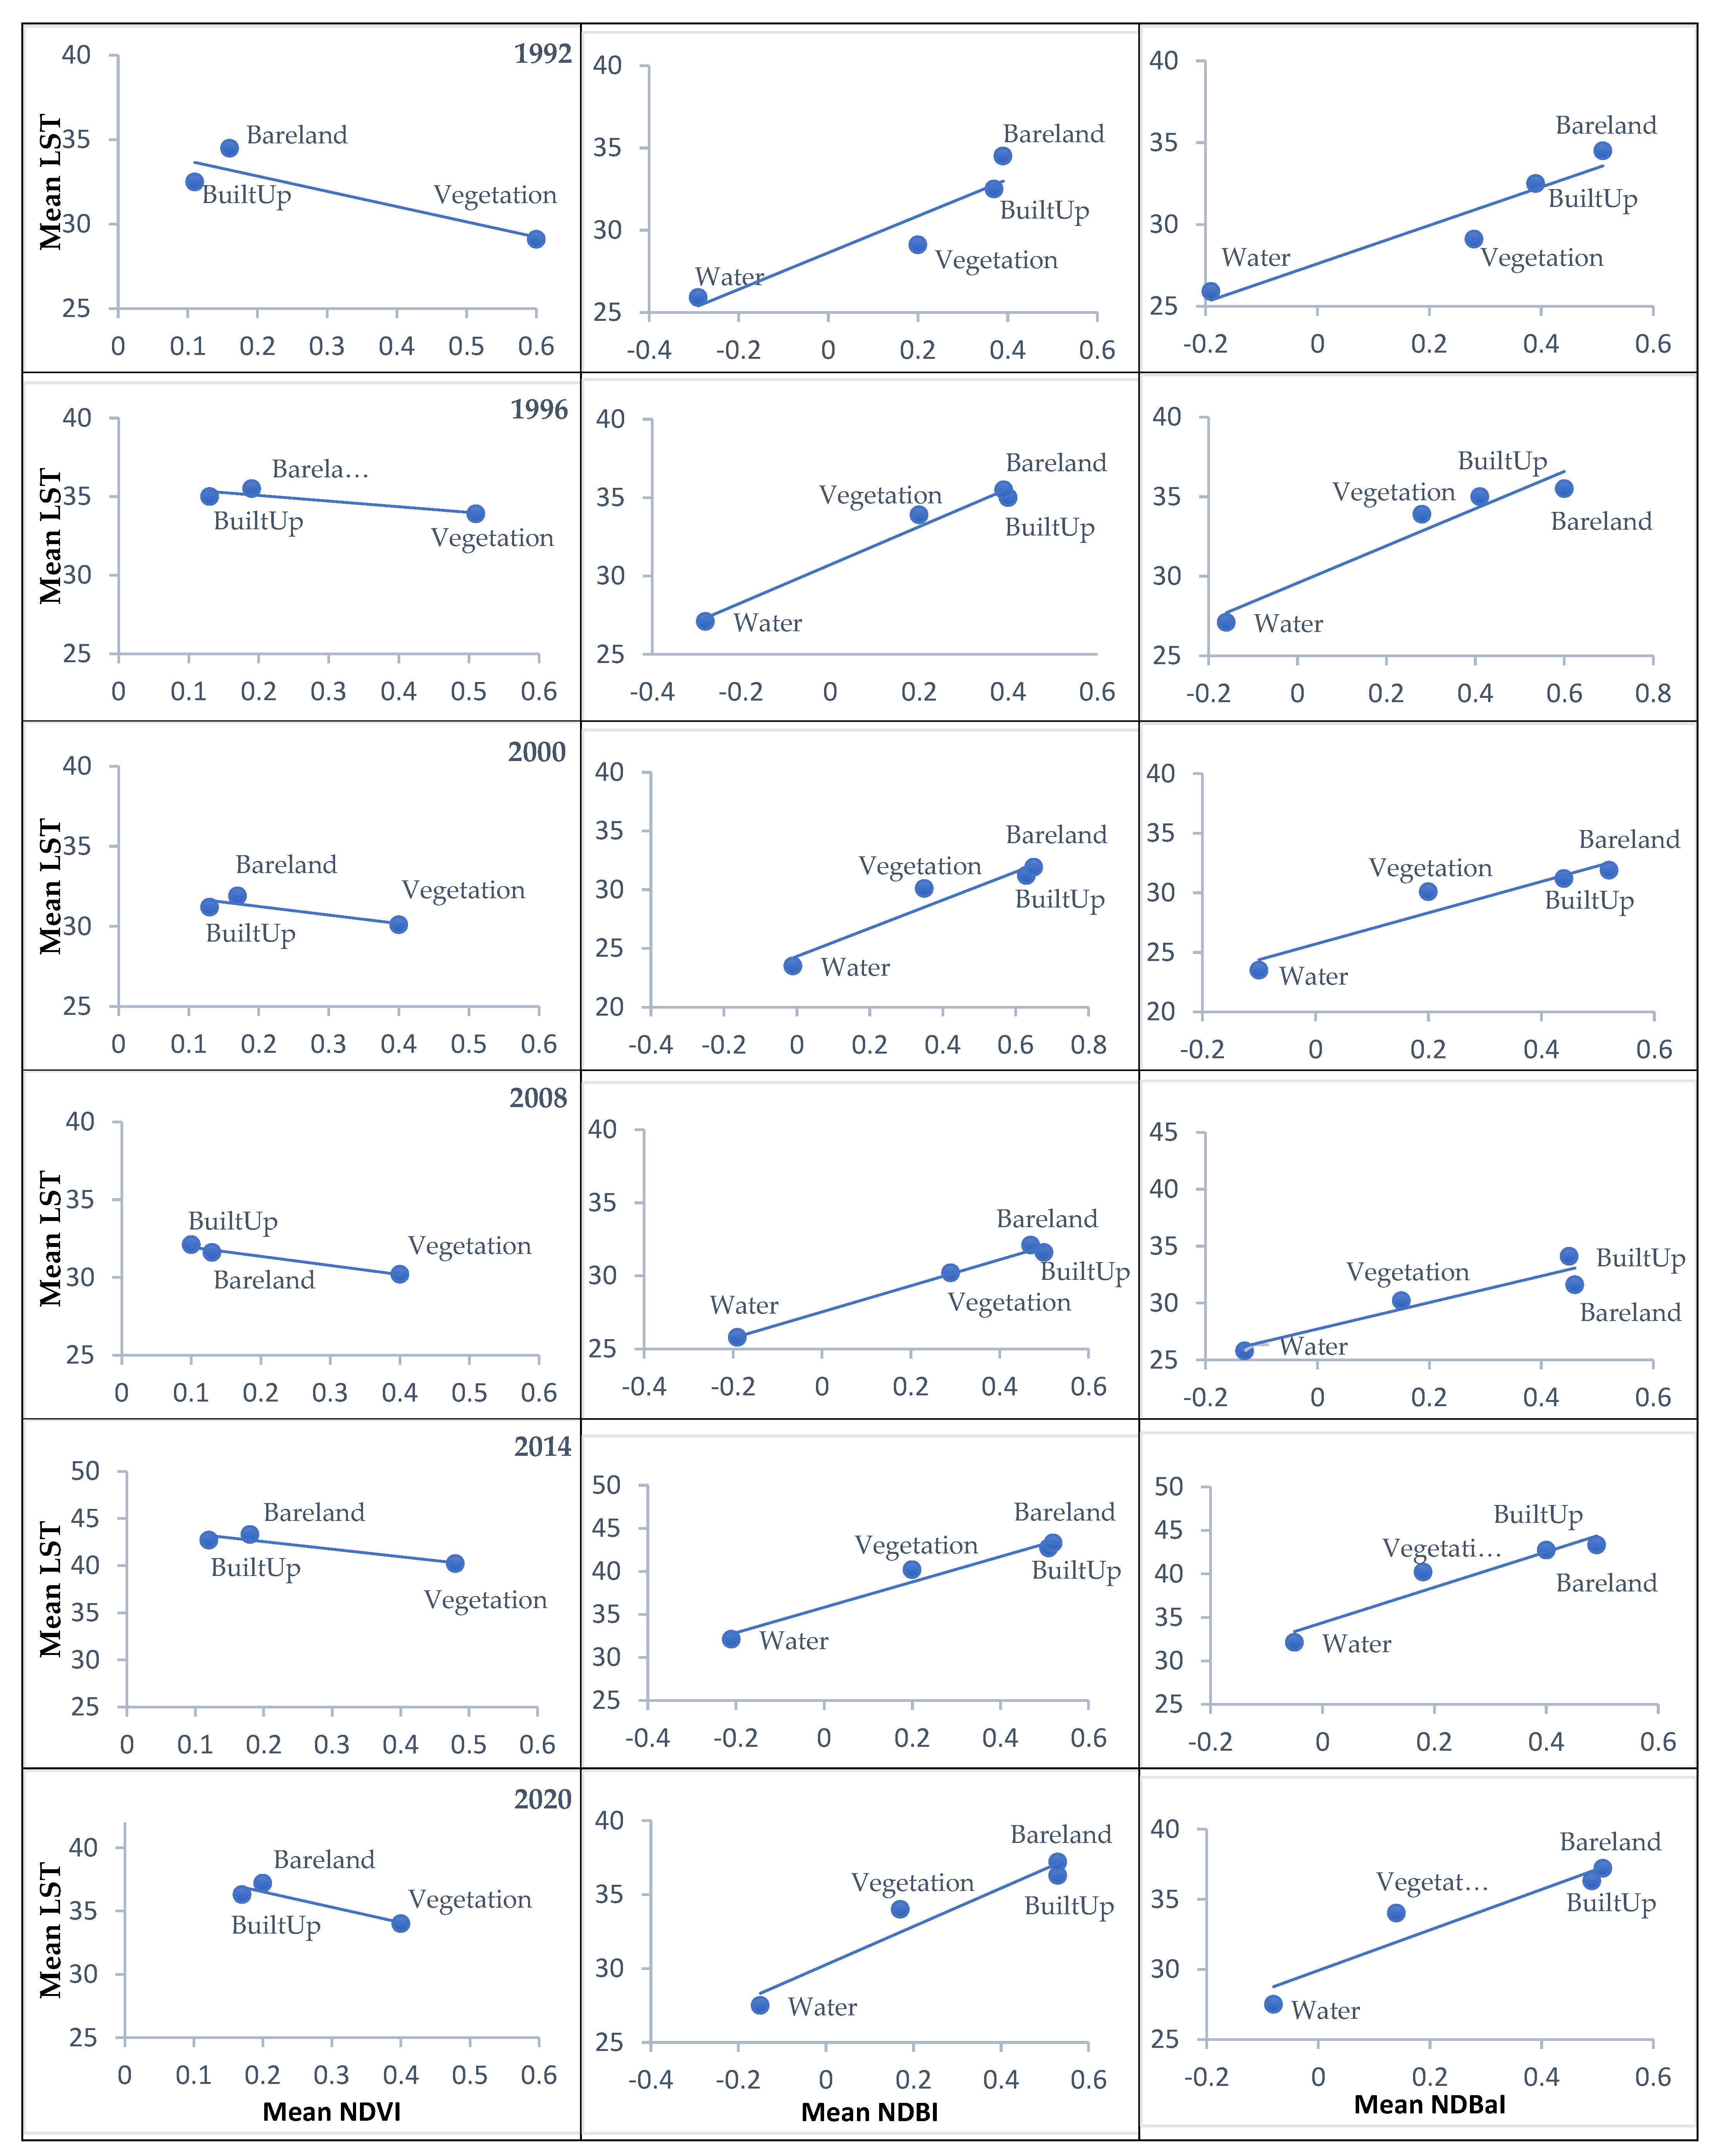
3.4. LST vs. Spectral Indices
3.5. Relationship between LST and LULC Pattern
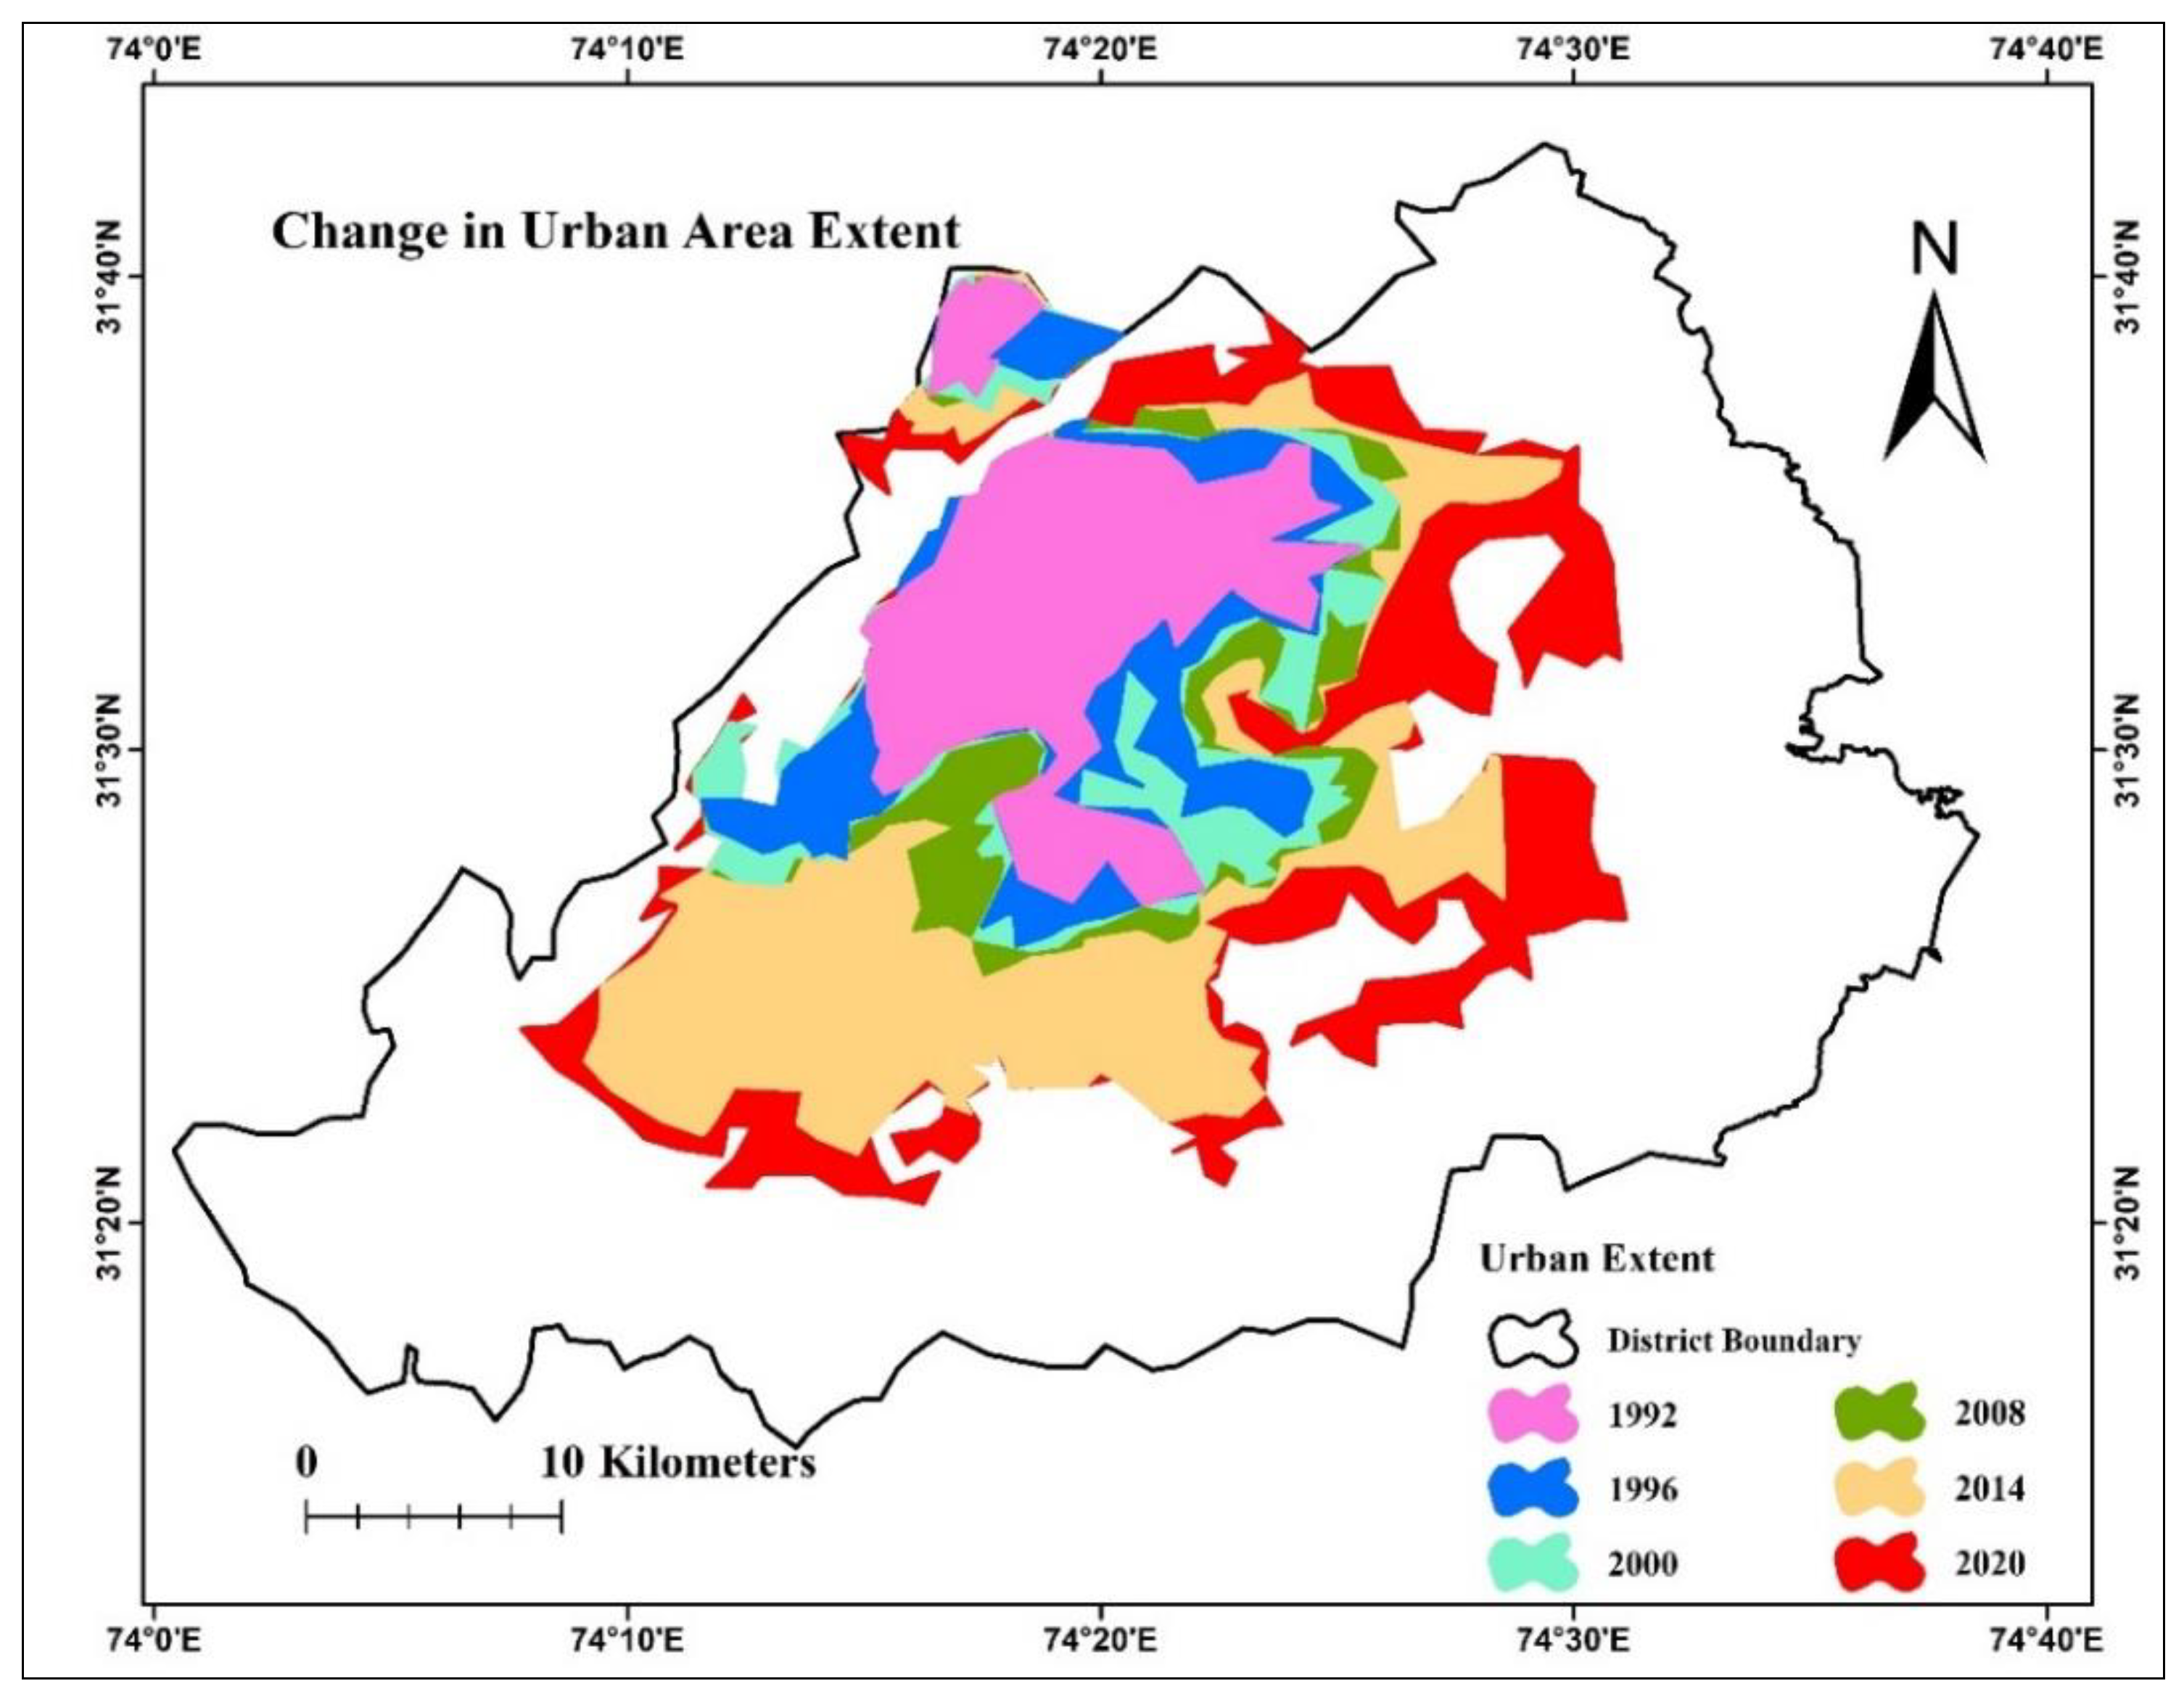
3.6. Validation of LULC and LST and Future Trends
4. Discussion
5. Conclusions
Supplementary Materials
Author Contributions
Funding
Institutional Review Board Statement
Informed Consent Statement
Data Availability Statement
Acknowledgments
Conflicts of Interest
References
- Nguyen, T.M.; Lin, T.-H.; Chan, H.-P. The Environmental Effects of Urban Development in Hanoi, Vietnam from Satellite and Meteorological Observations from 1999–2016. Sustainability 2019, 11, 1768. [Google Scholar] [CrossRef]
- Ziter, C.D.; Pedersen, E.J.; Kucharik, C.J.; Turner, M.G. Scale-Dependent Interactions between Tree Canopy Cover and Impervious Surfaces Reduce Daytime Urban Heat during Summer. Proc. Natl. Acad. Sci. USA 2019, 116, 7575–7580. [Google Scholar] [CrossRef] [PubMed]
- Alexander, C. Influence of the Proportion, Height and Proximity of Vegetation and Buildings on Urban Land Surface Temperature. Int. J. Appl. Earth Obs. Geoinf. 2021, 95, 102265. [Google Scholar] [CrossRef]
- Srivastava, P.K.; Majumdar, T.J.; Bhattacharya, A.K. Surface Temperature Estimation in Singhbhum Shear Zone of India Using Landsat-7 ETM+ Thermal Infrared Data. Adv. Sp. Res. 2009, 43, 1563–1574. [Google Scholar] [CrossRef]
- Zhang, H.; Zhao, X.; Kang, M.Y.; Han, J.J. Contrasting Changes in Fine-Scale Land Use Structure and Summertime Thermal Environment in Downtown Shanghai. Sustain. Cities Soc. 2022, 83, 103965. [Google Scholar] [CrossRef]
- Yang, J.; Zhan, Y.; Xiao, X.; Xia, J.C.; Sun, W.; Li, X. Investigating the Diversity of Land Surface Temperature Characteristics in Different Scale Cities Based on Local Climate Zones. Urban Clim. 2020, 34, 100700. [Google Scholar] [CrossRef]
- Ayanlade, A.; Aigbiremolen, M.I.; Oladosu, O.R. Variations in Urban Land Surface Temperature Intensity over Four Cities in Different Ecological Zones. Sci. Rep. 2021, 11, 20537. [Google Scholar] [CrossRef]
- Al Kafy, A.; Al Faisal, A.; Rahman, M.S.; Islam, M.; Al Rakib, A.; Islam, M.A.; Khan, M.H.H.; Sikdar, M.S.; Sarker, M.H.S.; Mawa, J.; et al. Prediction of Seasonal Urban Thermal Field Variance Index Using Machine Learning Algorithms in Cumilla, Bangladesh. Sustain. Cities Soc. 2021, 64, 102542. [Google Scholar] [CrossRef]
- Khan, S.; Gul, S.; Li, W. Remote Sensing Evaluation of Land Surface Temperature and Urban Area Expansion in Zhengzhou City during 2013–2015. Nat. Appl. Sci. Int. J. 2021, 2, 39–55. [Google Scholar] [CrossRef]
- Saleem, M.S.; Ahmad, S.R.; Shafiq-Ur-Rehman; Javed, M.A. Impact Assessment of Urban Development Patterns on Land Surface Temperature by Using Remote Sensing Techniques: A Case Study of Lahore, Faisalabad and Multan District. Environ. Sci. Pollut. Res. 2020, 27, 39865–39878. [Google Scholar] [CrossRef]
- Swamy, G.S.; Nagendra, S.M.; Schlink, U. Impact of Urban Heat Island on Meteorology and Air Quality at Microenvironments. J. Air Waste Manag. Assoc. 2020, 70, 876–891. [Google Scholar] [CrossRef] [PubMed]
- Fu, P.; Weng, Q. A Time Series Analysis of Urbanization Induced Land Use and Land Cover Change and Its Impact on Land Surface Temperature with Landsat Imagery. Remote Sens. Environ. 2016, 175, 205–214. [Google Scholar] [CrossRef]
- Abir, F.A.; Ahmmed, S.; Sarker, S.H.; Fahim, A.U. Thermal and Ecological Assessment Based on Land Surface Temperature and Quantifying Multivariate Controlling Factors in Bogura, Bangladesh. Heliyon 2021, 7, e08012. [Google Scholar] [CrossRef] [PubMed]
- Zhang, Y.; Sun, L. Spatial-Temporal Impacts of Urban Land Use Land Cover on Land Surface Temperature: Case Studies of Two Canadian Urban Areas. Int. J. Appl. Earth Obs. Geoinf. 2019, 75, 171–181. [Google Scholar] [CrossRef]
- Aksu, O.; Iban, M.C. Considerations on the Land Management System Approach in Turkey by the Experiences of a Case Study. Surv. Rev. 2019, 51, 87–96. [Google Scholar] [CrossRef]
- Wemegah, C.S.; Yamba, E.I.; Aryee, J.N.A.; Sam, F.; Amekudzi, L.K. Assessment of Urban Heat Island Warming in the Greater Accra Region. Sci. Afr. 2020, 8, e00426. [Google Scholar] [CrossRef]
- Kafy, A.-A.; Naim, N.H.; Khan, M.H.H.; Islam, M.A.; Al Rakib, A.; Al-Faisal, A.; Sarker, M.H.S. Prediction of Urban Expansion and Identifying Its Impacts on the Degradation of Agricultural Land. In Re-envisioning Remote Sensing Applications; CRC Press: Boca Raton, FL, USA, 2021; pp. 85–106. [Google Scholar] [CrossRef]
- Meng, F.; Liu, M. Remote-Sensing Image-Based Analysis of the Patterns of Urban Heat Islands in Rapidly Urbanizing Jinan, China. Int. J. Remote Sens. 2013, 34, 8838–8853. [Google Scholar] [CrossRef]
- Ahmad, A.; Gilani, H.; Shirazi, S.A.; Pourghasemi, H.R.; Shaukat, I. Spatiotemporal Urban Sprawl and Land Resource Assessment Using Google Earth Engine Platform in Lahore District, Pakistan. In Computers in Earth and Environmental Sciences; Elsevier: Amsterdam, The Netherlands, 2022; pp. 137–150. [Google Scholar]
- Imran, M.; Aqsa, M. Analysis and Mapping of Present and Future Drivers of Local Urban Climate Using Remote Sensing: A Case of Lahore, Pakistan. Arab. J. Geosci. 2020, 13, 278. [Google Scholar] [CrossRef]
- Khalil, U.; Aslam, B.; Azam, U.; Khalid, H.M.D. Time Series Analysis of Land Surface Temperature and Drivers of Urban Heat Island Effect Based on Remotely Sensed Data to Develop a Prediction Model. Appl. Artif. Intell. 2021, 35, 1803–1828. [Google Scholar] [CrossRef]
- Zhang, X.; Zhong, T.; Wang, K.; Cheng, Z. Scaling of Impervious Surface Area and Vegetation as Indicators to Urban Land Surface Temperature Using Satellite Data. Int. J. Remote Sens. 2009, 30, 841–859. [Google Scholar] [CrossRef]
- Haas, J.; Ban, Y. Urban Growth and Environmental Impacts in Jing-Jin-Ji, the Yangtze, River Delta and the Pearl River Delta. Int. J. Appl. Earth Obs. Geoinf. 2014, 30, 42–55. [Google Scholar] [CrossRef]
- Yang, Y.Z.; Cai, W.H.; Yang, J. Evaluation of MODIS Land Surface Temperature Data to Estimate Near-Surface Air Temperature in Northeast China. Remote Sens. 2017, 9, 410. [Google Scholar] [CrossRef]
- Akbar, T.A.; Hassan, Q.K.; Ishaq, S.; Batool, M.; Butt, H.J.; Jabbar, H. Investigative Spatial Distribution and Modelling of Existing and Future Urban Land Changes and Its Impact on Urbanization and Economy. Remote Sens. 2019, 11, 105. [Google Scholar] [CrossRef]
- Kappa Coefficient Confusion Matrices. Available online: https://www.l3harrisgeospatial.com/docs/calculatingconfusionmatrices.html (accessed on 13 August 2021).
- Guha, S.; Govil, H.; Dey, A.; Gill, N. Analytical Study of Land Surface Temperature with NDVI and NDBI Using Landsat 8 OLI and TIRS Data in Florence and Naples City, Italy. Eur. J. Remote Sens. 2018, 51, 667–678. [Google Scholar] [CrossRef]
- Nazir, A.; Ullah, S.; Saqib, Z.A.; Abbas, A.; Ali, A.; Iqbal, M.S.; Hussain, K.; Shakir, M.; Shah, M.; Butt, M.U. Estimation and Forecasting of Rice Yield Using Phenology-Based Algorithm and Linear Regression Model on Sentinel-II Satellite Data. Agriculture 2021, 11, 1026. [Google Scholar] [CrossRef]
- Yuan, F.; Bauer, M.E. Comparison of Impervious Surface Area and Normalized Difference Vegetation Index as Indicators of Surface Urban Heat Island Effects in Landsat Imagery. Remote Sens. Environ. 2007, 106, 375–386. [Google Scholar] [CrossRef]
- Landsat Project Science Office. Landsat 7 Science Data User’s Handbok; NASA’s Goddard Space Flight Center: Greenbelt, MD USA, 2002; 186p. [Google Scholar]
- Bastiaanssen, W.G.M.; Menenti, M.; Feddes, R.A.; Holtslag, A.A.M. A Remote Sensing Surface Energy Balance Algorithm for Land (SEBAL)-1. Formulation. J. Hydrol. 1998, 212, 198–212. [Google Scholar] [CrossRef]
- Sultana, S.; Satyanarayana, A.N.V.; Rinner, C.; Hussain, M. Toronto’s Urban Heat Island—Exploring the Relationship between Land Use and Surface Temperature. Remote Sens. 2011, 3, 1251–1265. [Google Scholar] [CrossRef]
- Xiong, Y.; Chen, F. Correlation Analysis between Temperatures from Landsat Thermal Infrared Retrievals and Synchronous Weather Observations in Shenzhen, China. Remote Sens. Appl. Soc. Environ. 2017, 7, 40–48. [Google Scholar] [CrossRef]
- Qin, Q.; Zhang, N.; Nan, P.; Chai, L. Geothermal Area Detection Using Landsat ETM+ Thermal Infrared Data and Its Mechanistic Analysis—A Case Study in Tengchong, China. Int. J. Appl. Earth Obs. Geoinf. 2011, 13, 552–559. [Google Scholar] [CrossRef]
- Kabano, P.; Lindley, S.; Harris, A. Evidence of Urban Heat Island Impacts on the Vegetation Growing Season Length in a Tropical City. Landsc. Urban Plan. 2021, 206, 103989. [Google Scholar] [CrossRef]
- Mudede, M.F.; Newete, S.W.; Abutaleb, K.; Nkongolo, N. Monitoring the Urban Environment Quality in the City of Johannesburg Using Remote Sensing Data. J. Afr. Earth Sci. 2020, 171, 103969. [Google Scholar] [CrossRef]
- Guha, S.; Govil, H.; Mukherjee, S. Dynamic Analysis and Ecological Evaluation of Urban Heat Islands in Raipur City, India. J. Appl. Remote Sens. 2017, 11, 036020. [Google Scholar] [CrossRef]
- Vancutsem, C.; Ceccato, P.; Dinku, T.; Connor, S.J. Evaluation of MODIS Land Surface Temperature Data to Estimate Air Temperature in Different Ecosystems over Africa. Remote Sens. Environ. 2010, 114, 449–465. [Google Scholar] [CrossRef]
- Naim, M.N.H.; Kafy, A.A. Assessment of Urban Thermal Field Variance Index and Defining the Relationship between Land Cover and Surface Temperature in Chattogram City: A Remote Sensing and Statistical Approach. Environ. Chall. 2021, 4, 100107. [Google Scholar] [CrossRef]
- Goldblatt, R.; Addas, A.; Crull, D.; Maghrabi, A.; Levin, G.G.; Rubinyi, S. Remotely Sensed Derived Land Surface Temperature (LST) as a Proxy for Air Temperature and Thermal Comfort at a Small Geographical Scale. Land 2021, 10, 410. [Google Scholar] [CrossRef]
- Addas, A.; Goldblatt, R.; Rubinyi, S. Utilizing Remotely Sensed Observations to Estimate the Urban Heat Island Effect at a Local Scale: Case Study of a University Campus. Land 2020, 9, 191. [Google Scholar] [CrossRef]
- Weng, Q.; Firozjaei, M.K.; Sedighi, A.; Kiavarz, M.; Alavipanah, S.K. Statistical Analysis of Surface Urban Heat Island Intensity Variations: A Case Study of Babol City, Iran. GIScience Remote Sens. 2019, 56, 576–604. [Google Scholar] [CrossRef]
- Benali, A.; Carvalho, A.C.; Nunes, J.P.; Carvalhais, N.; Santos, A. Estimating Air Surface Temperature in Portugal Using MODIS LST Data. Remote Sens. Environ. 2012, 124, 108–121. [Google Scholar] [CrossRef]
- Faqe Ibrahim, G.R. Urban Land Use Land Cover Changes and Their Effect on Land Surface Temperature: Case Study Using Dohuk City in the Kurdistan Region of Iraq. Climate 2017, 5, 13. [Google Scholar] [CrossRef]
- Chen, X.L.; Zhao, H.M.; Li, P.X.; Yin, Z.Y. Remote Sensing Image-Based Analysis of the Relationship between Urban Heat Island and Land Use/Cover Changes. Remote Sens. Environ. 2006, 104, 133–146. [Google Scholar] [CrossRef]
- Chen, A.; Yao, X.A.; Sun, R.; Chen, L. Effect of Urban Green Patterns on Surface Urban Cool Islands and Its Seasonal Variations. Urban For. Urban Green. 2014, 13, 646–654. [Google Scholar] [CrossRef]
- Al Kafy, A.; Al-Faisal, A.; Mahmudul Hasan, M.; Sikdar, M.S.; Hasan Khan, M.H.; Rahman, M.; Islam, R. Impact of LULC Changes on LST in Rajshahi District of Bangladesh: A Remote Sensing Approach. J. Geogr. Stud. 2020, 3, 11–23. [Google Scholar] [CrossRef]
- Ahmed, B.; Kamruzzaman, M.D.; Zhu, X.; Shahinoor Rahman, M.D.; Choi, K. Simulating Land Cover Changes and Their Impacts on Land Surface Temperature in Dhaka, Bangladesh. Remote Sens. 2013, 5, 5969–5998. [Google Scholar] [CrossRef] [Green Version]


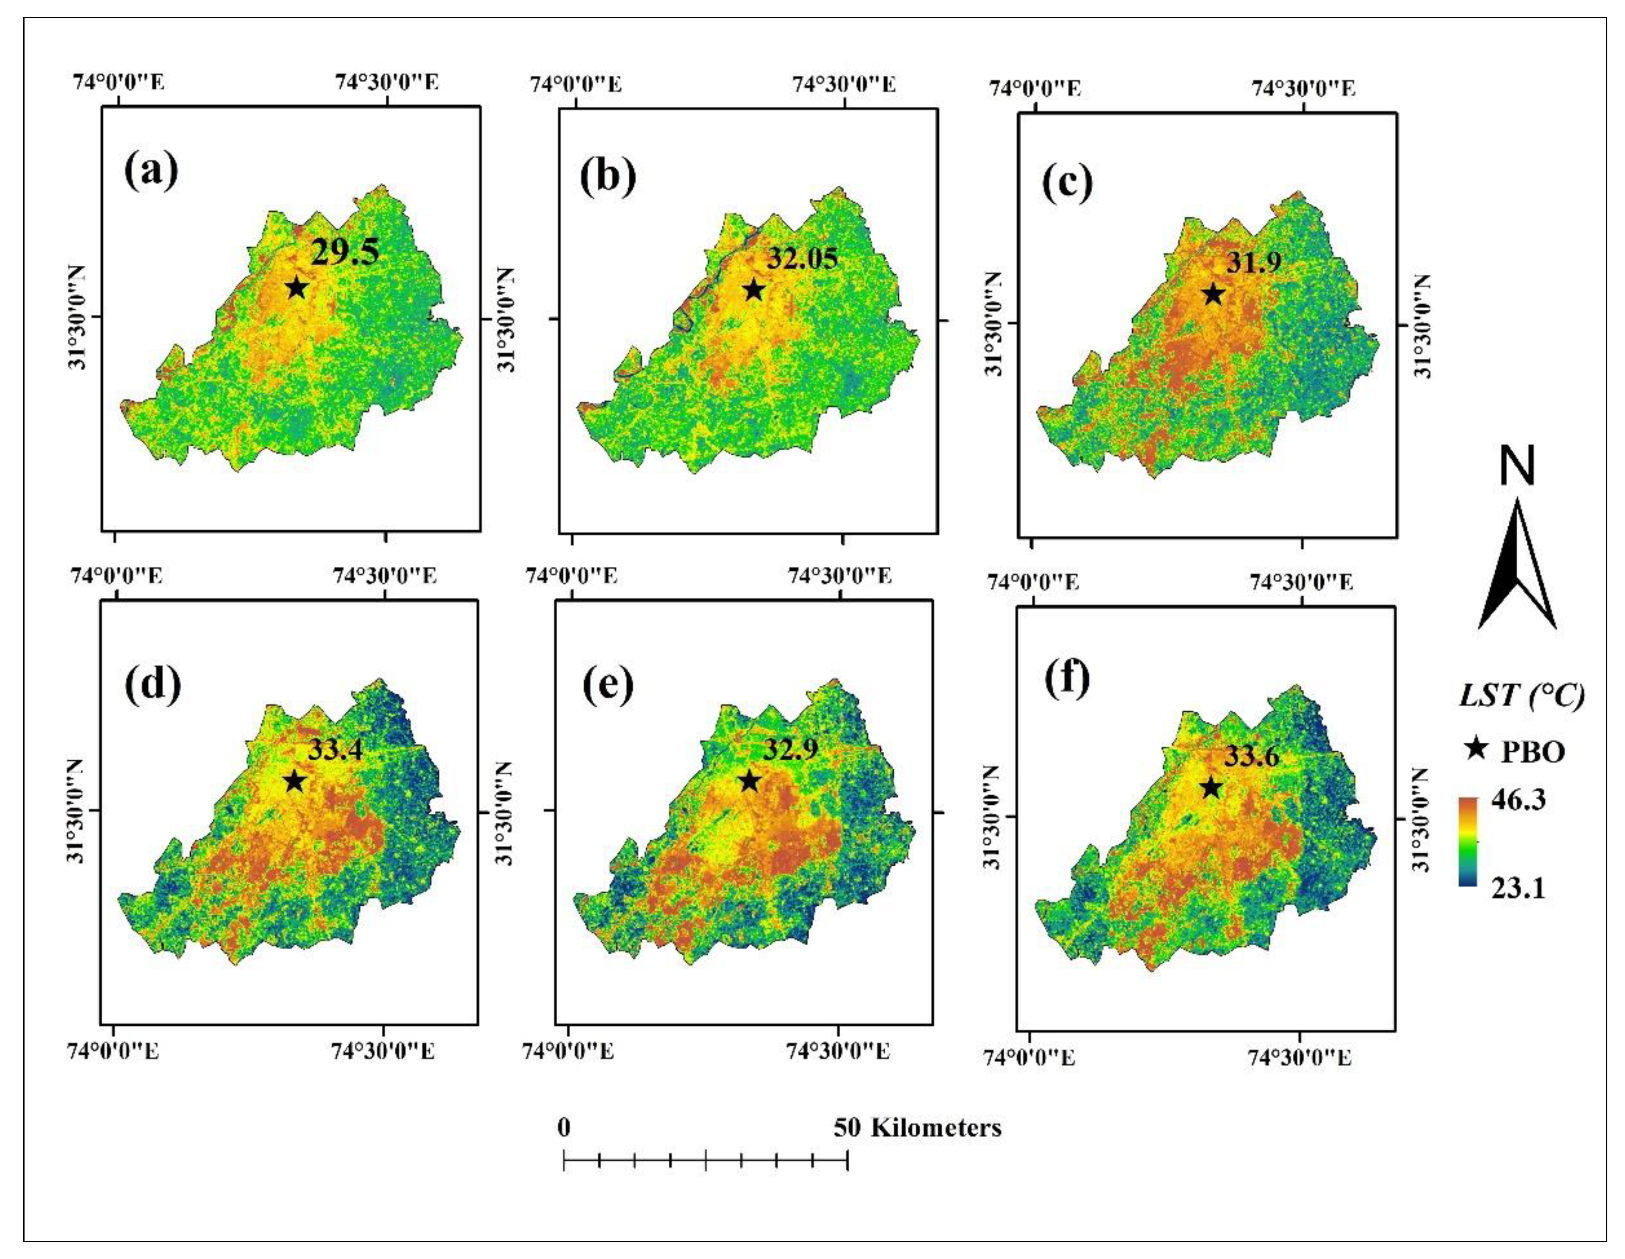
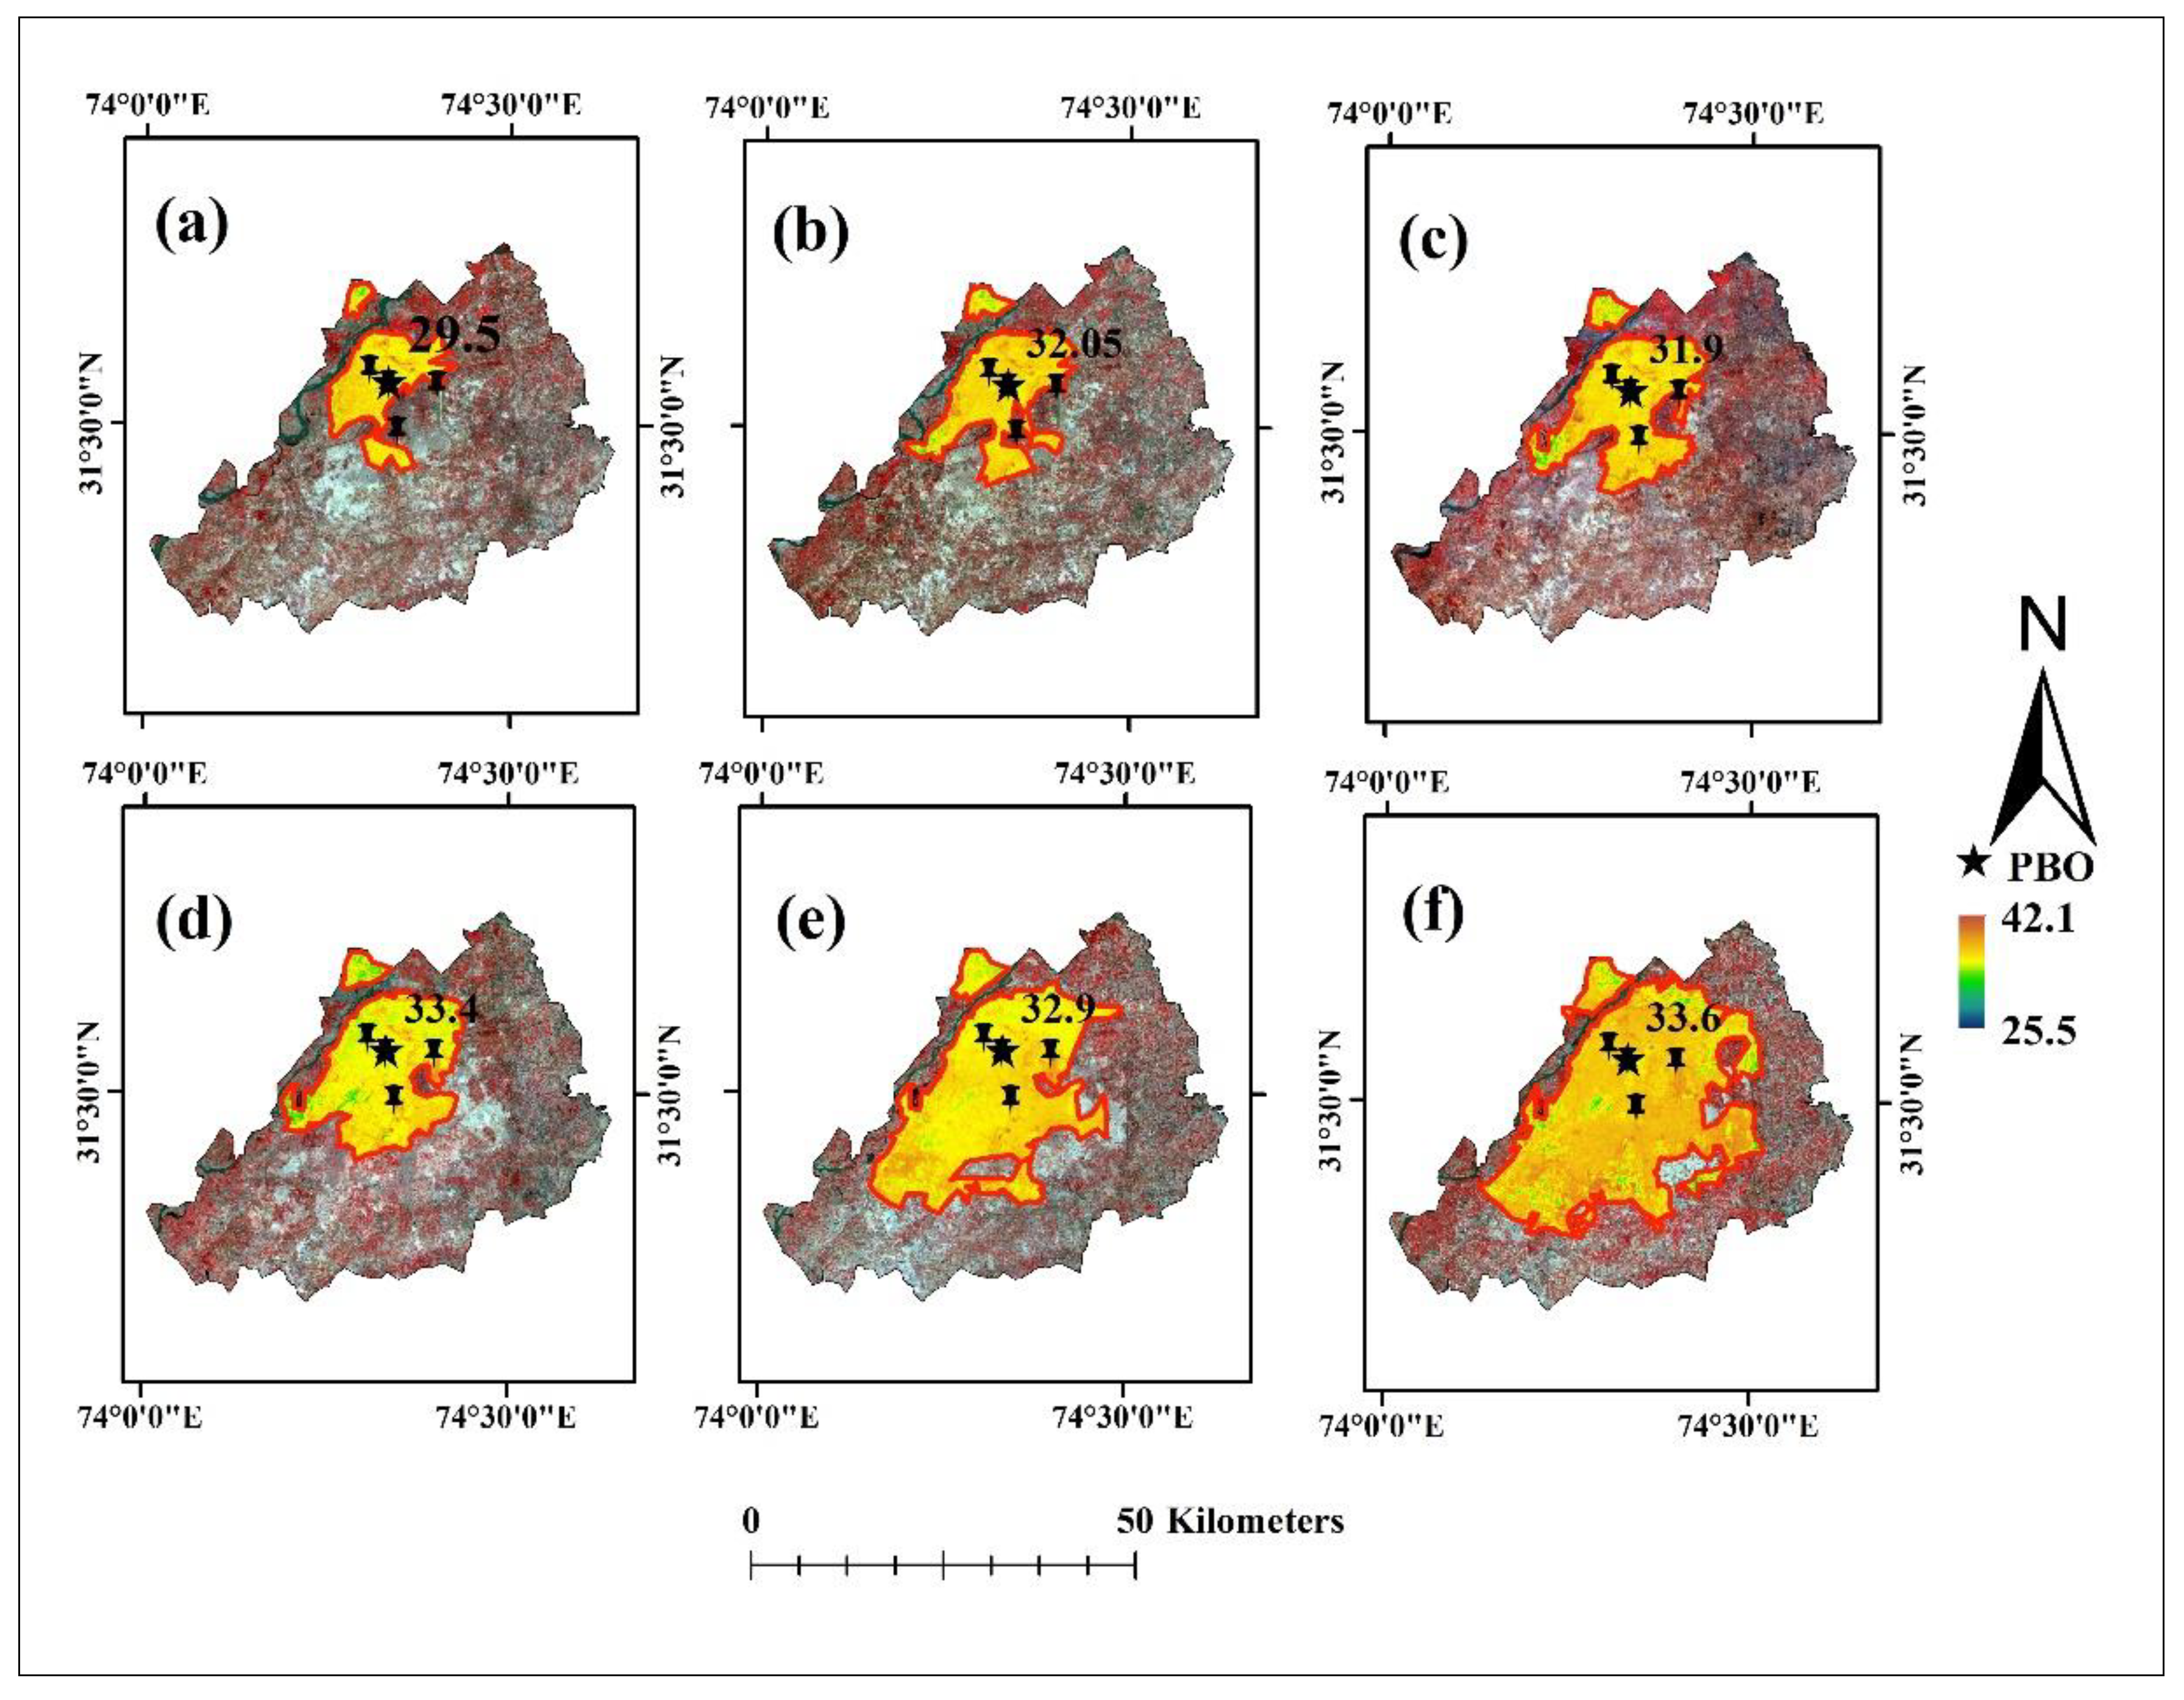
 ) indicates the position of Pilot Balloon Observatory (PBO).
) indicates the position of Pilot Balloon Observatory (PBO).
) indicates the position of Pilot Balloon Observatory (PBO).


| Dates (d/m/y) | Vegetation Cover (km2) | Built-Up (km2) | Bare Land (km2) | Water (km2) | User Accuracy (Built Up %) | Producer Accuracy (Built Up %) | Overall Kappa Statistics | Overall Accuracy |
|---|---|---|---|---|---|---|---|---|
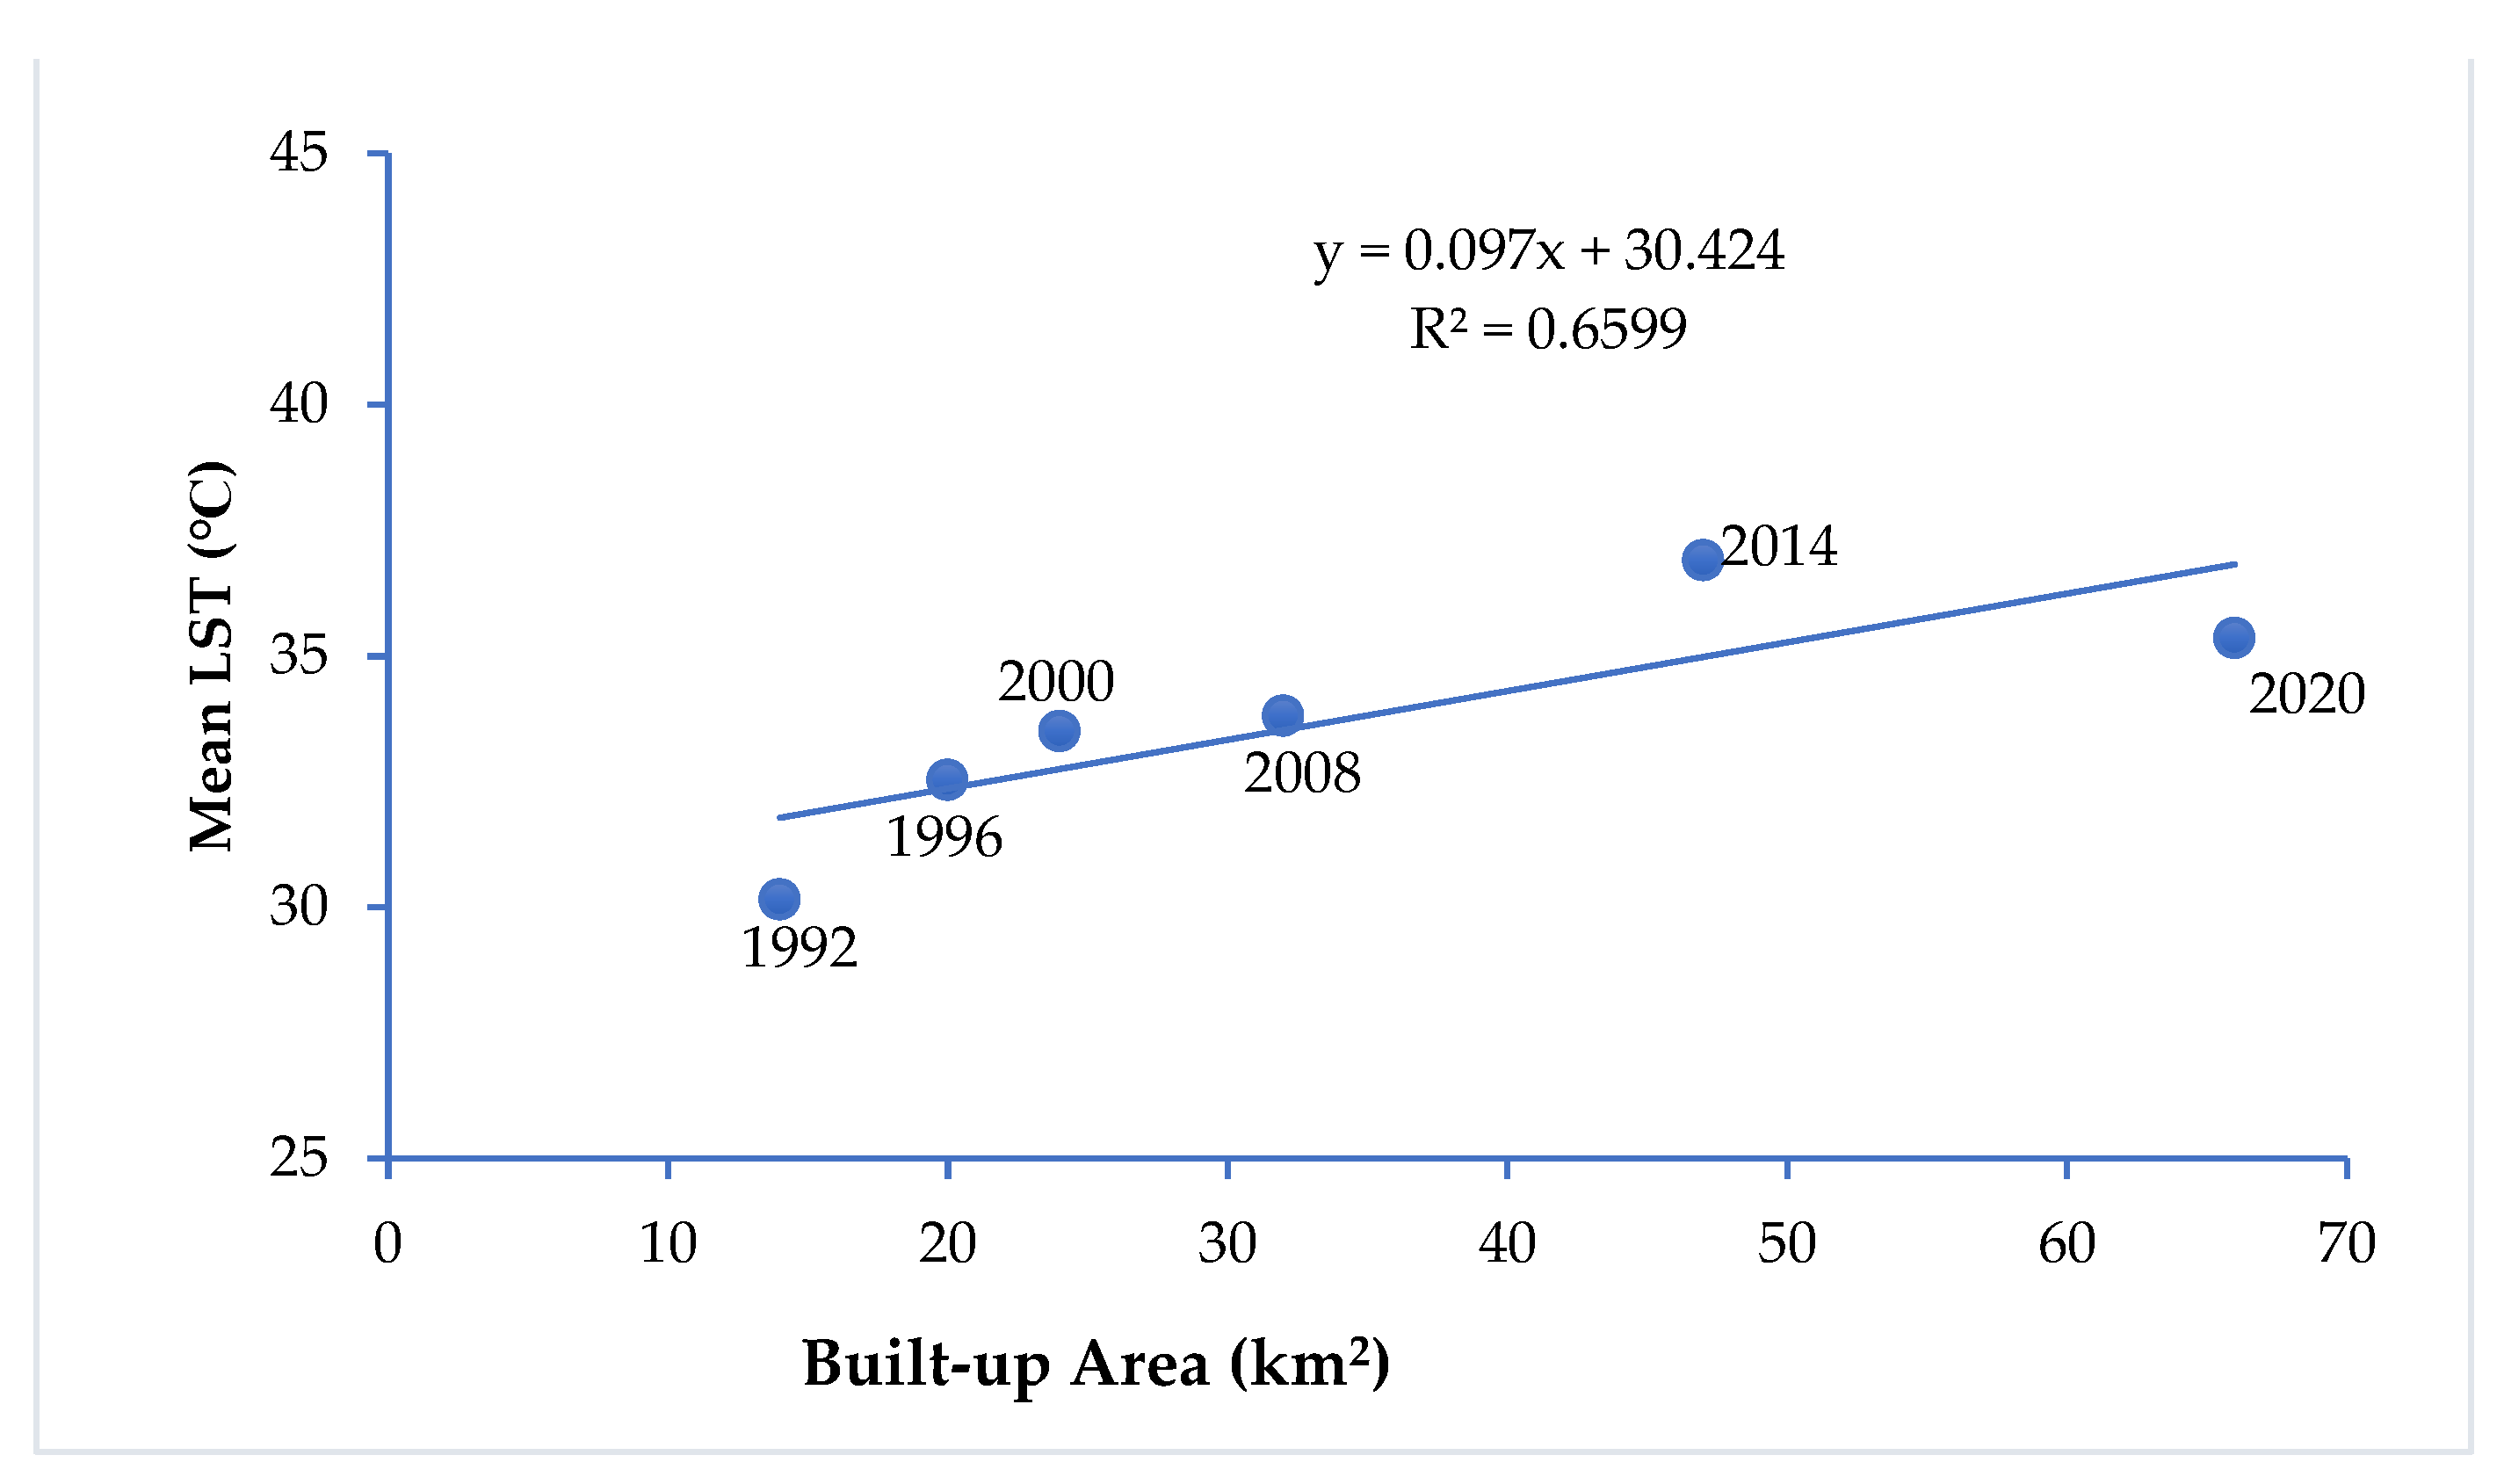
| 9 June 1992 | 1010 | 260.5 | 471.4 | 26.6 | 88.9 | 91.6 | 0.87 | 90.8 |
| 4 June 1996 | 928.5 | 363.26 | 453.6 | 24.8 | 88.2 | 92.3 | 0.89 | 91.2 |
| 30 May 2000 | 903.7 | 428.8 | 414.6 | 21.3 | 88.6 | 91 | 0.83 | 90.7 |
| 5 June 2008 | 894.9 | 581.2 | 278.2 | 28.4 | 91.7 | 92.3 | 0.9 | 90.3 |
| 6 June 2014 | 689.3 | 838.2 | 214.4 | 28.4 | 91.7 | 92.3 | 0.9 | 92.6 |
| 7 June 2020 | 590.07 | 1001.2 | 161.3 | 19.5 | 85.5 | 90.3 | 0.88 | 90.3 |
| LULC Types | Land Cover (km2) | Temporal LULC Change (in Percent) | Overall Change (1992–2020) | |||||
|---|---|---|---|---|---|---|---|---|
| 1992 | 1996 | 2000 | 2008 | 2014 | 2020 | |||
| Water | 26.6 | 1.5 | 1.4 (−0.1) | 1.2 (−0.2) | 0.9 (-1.5) | 1.6 (0.7) | 1.1 (−0.5) | 19.5 km2 (1.1%) |
| Built-Up | 260.5 | 14.7 | 20.5 (5.8) | 24.2 (3.7) | 32.8 (8.6) | 47.3 (14.5) | 56.5 (9.2) | 1001 km2 (56.5%) |
| Vegetation | 1010 | 57 | 52.4 (−4.6) | 51 (−6.0) | 50.5 (−0.5) | 38.9 (−11.6) | 33.3 (−5.6) | 590 km2 (33.3%) |
| Bare land | 471.4 | 26.6 | 25.6 (−1.0) | 23.4 (−2.2) | 15.7 (−7.7) | 12.1 (−3.6) | 9.1 (−3.0) | 161.3 km2 (9.1%) |
| LULC Types | Mean Estimated LST (°C) from Satellite Data * | |||||
|---|---|---|---|---|---|---|
| 1992 | 1996 | 2000 | 2008 | 2014 | 2020 | |
| Built-Up | 28.4 | 30.5 | 33.5 | 31.45 | 34.3 | 35.35 |
| Vegetation | 25.9 | 29.1 | 28.5 | 26.2 | 29.3 | 30.7 |
| Bare Land | 34.5 | 35.7 | 33.1 | 32.6 | 36.8 | 37.2 |
| Water | 24.9 | 25.3 | 26.8 | 23.5 | 27.1 | 27.5 |
| Date | LST (Landsat) °C | Air Temperature (Weather Station) °C | Temp. Difference (Landsat-Weather Station) °C |
|---|---|---|---|
| 9 June 1992 | 28.4 | 29.5 | −1.1 |
| 4 June 1996 | 30.5 | 32.05 | −1.55 |
| 30 May 2000 | 33.5 | 31.9 | 1.6 |
| 5 June 2008 | 31.45 | 33.4 | −1.95 |
| 6 June 2014 | 34.3 | 32.9 | 1.4 |
| 7 June 2020 | 35.35 | 33.6 | 1.75 |
| Years | Built-Up (%) | Vegetation (%) | Bare Land (%) | Water (%) |
|---|---|---|---|---|
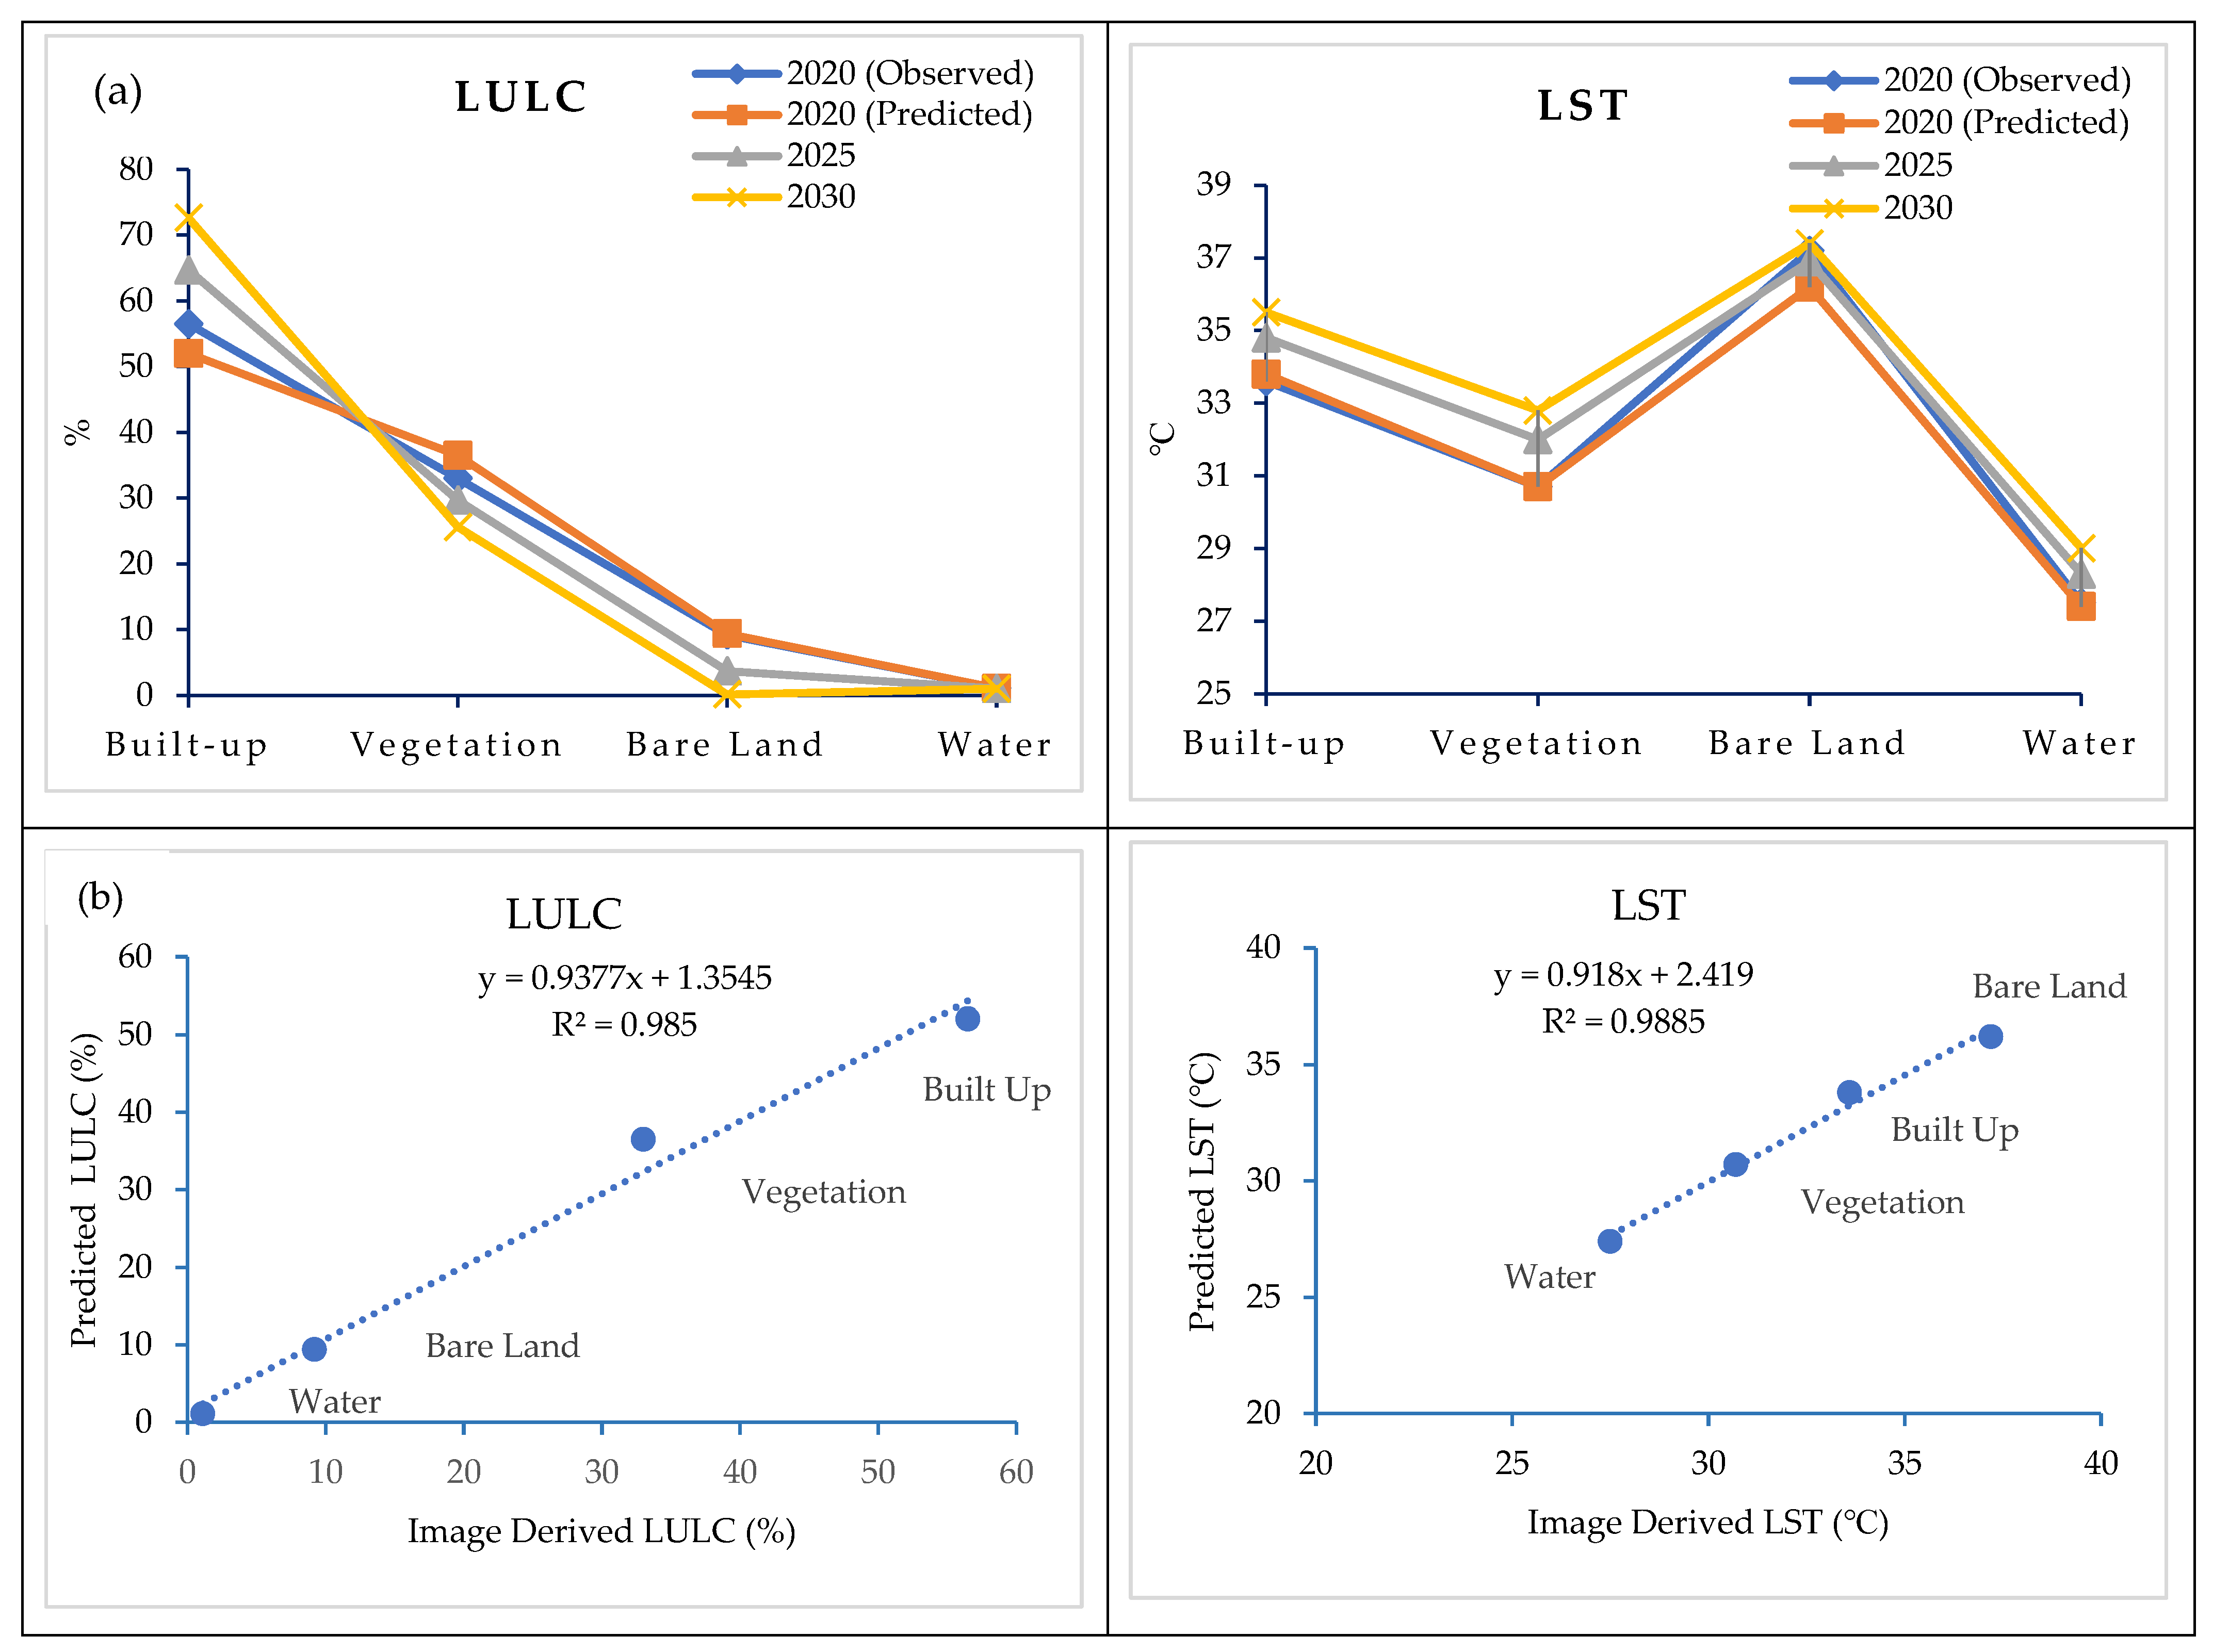
| 2020 (Image derived) | 56.5 | 33 | 9.2 | 1.1 |
| 2020 (Predicted) | 52 | 36.5 | 9.4 | 1.1 |
| 2025 | 64.7 | 29.7 | 3.7 | 1.05 |
| 2030 | 72.6 | 25.6 | 0.14 | 1.01 |
| Year | Built-Up (°C) | Vegetation (°C) | Bare Land (°C) | Water (°C) |
|---|---|---|---|---|
| 2020 (Image Derived) | 33.6 | 30.7 | 37.2 | 27.5 |
| 2020 (Predicted) | 33 | 30.7 | 36.2 | 27.4 |
| 2025 | 34.8 | 32 | 36.9 | 28.3 |
| 2030 | 35.5 | 32.8 | 37.4 | 29.01 |
Publisher’s Note: MDPI stays neutral with regard to jurisdictional claims in published maps and institutional affiliations. |
© 2022 by the authors. Licensee MDPI, Basel, Switzerland. This article is an open access article distributed under the terms and conditions of the Creative Commons Attribution (CC BY) license (https://creativecommons.org/licenses/by/4.0/).
Share and Cite
Ramzan, M.; Saqib, Z.A.; Hussain, E.; Khan, J.A.; Nazir, A.; Dasti, M.Y.S.; Ali, S.; Niazi, N.K. Remote Sensing-Based Prediction of Temporal Changes in Land Surface Temperature and Land Use-Land Cover (LULC) in Urban Environments. Land 2022, 11, 1610. https://doi.org/10.3390/land11091610
Ramzan M, Saqib ZA, Hussain E, Khan JA, Nazir A, Dasti MYS, Ali S, Niazi NK. Remote Sensing-Based Prediction of Temporal Changes in Land Surface Temperature and Land Use-Land Cover (LULC) in Urban Environments. Land. 2022; 11(9):1610. https://doi.org/10.3390/land11091610
Chicago/Turabian StyleRamzan, Mohsin, Zulfiqar Ahmad Saqib, Ejaz Hussain, Junaid Aziz Khan, Abid Nazir, Muhammad Yousif Sardar Dasti, Saqib Ali, and Nabeel Khan Niazi. 2022. "Remote Sensing-Based Prediction of Temporal Changes in Land Surface Temperature and Land Use-Land Cover (LULC) in Urban Environments" Land 11, no. 9: 1610. https://doi.org/10.3390/land11091610