Article

Hydrological Cycle Performance at a Permeable Pavement Site and a Raingarden Site in a Subtropical Region

Department of Civil Engineering, National Taipei University of Technology, Taipei 106344, Taiwan
*
Author to whom correspondence should be addressed.
Land 2022, 11(6), 951; https://doi.org/10.3390/land11060951
Submission received: 18 May 2022 / Revised: 16 June 2022 / Accepted: 17 June 2022 / Published: 20 June 2022
(This article belongs to the Special Issue Hydrological Processes in Urban Environments)

Abstract

:
Low-impact development (LID) structures are widely used to mitigate urbanization impacts on hydrology. The performances of such structures are strongly affected by field conditions, such as the ratio of LID area to drainage area and rainfall properties, such as rainfall intensity. In this study, onsite continuous monitoring was performed at a permeable pavement site and a raingarden site in Taipei, Taiwan, to determine their water retention and groundwater recharge potential under subtropical weather. In addition, the verified Storm Water Management Model (SWMM) was used to illustrate the annual performance on the hydrological cycle. Based on one year of monitoring, data on 41 and 24 rainfall events were obtained at the permeable pavement and raingarden sites, respectively. The ratio of the permeable pavement area to the total drainage area was 36.0%, and this ratio was 15.9% for the raingarden. The results showed that the average runoff reduction rate was 14.7% at the permeable pavement site, and 98.3% of the rainfall was retained in the raingarden and an underground storage tank. The validated model showed that the permeable pavement site experienced 45.3% outflow, 31.6% evaporation, and 23.1% infiltration annually. For the raingarden with an underground storage tank, 91.4% of the annual rainfall infiltrated and was stored, with only 4.1% outflow. According to the observed rainfall event performance and the simulated annual performance, the permeable pavement and raingarden performed well in subtropical regions. Pavement that was approximately 1/3 permeable in a drainage area increased infiltration by approximately 20%, and a raingarden with a sufficient underground storage tank preserved over 90% of the rainfall.

1. Introduction

With increasing amounts of impermeable pavement, such as buildings and roads, the hydrological cycles in urban areas are changing. In these urban areas, hydrological cycles have more runoff, large and quick peak flow, less infiltration and base flow, and little groundwater recharge [1,2], resulting in ponding and flooding being more frequent in low-lying areas. Moreover, urbanization is a dynamic process, and the associated hydrology is changing. When the drainage infrastructure has already been built, the incremental runoff might be greater than the original design capacity and might result in temporal ponding or long-lasting flooding. Therefore, many urban storm management measures have been implemented to mitigate damage from urban floods. In the US, low-impact development (LID) has been used [3]. In the UK, sustainable drainage systems (SuDS) are used in all types of development to provide a natural approach for managing drainage and preventing flooding in urban areas [4]. In Australia, water-sensitive urban design (WSUD) is used to ensure that cities are more resistant to water (water-sensitive cities) [5]. In Japan, to protect against urban inundation, a new act and the Comprehensive Urban River Basin Management were developed [6]. China’s specific urban water management strategy is known as a sponge city [7]. In Taiwan, the terms LID and sponge city are commonly used. Although urban water management has different names in different countries, the core concept is to reduce impermeable pavement and to enhance onsite infiltration and storage capacity.
LID aims to reduce runoff, attenuate peak flow, and remove pollutants [2]. LID facilities are not large structures; rather, they are generally small, local, and diverse. Permeable pavements, raingardens, green roofs, bioretention facilities, grass swales and belts, and infiltration trenches are considered as LID facilities. They can be designed and constructed on buildings, roads, campuses, and parking lots. LID provides multiple environmental benefits and is adopted in many cities to mitigate urban flood risks [1,4]. The successful implementation of LID facilities has been shown. For example, many studies have been conducted on permeable pavements; for example, Tirpak et al. [8] observed a permeable pavement site in Ohio, US that reduced runoff by 43% and peak flow by 75% compared with impermeable pavement. Alyaseri et al. [9] compared different types of permeable pavement in St. Louis, US and its optimal performance was a reduction in runoff of 46%. Liu et al. [10] monitored pilot sites with three types of permeable pavements at Tongji University in China, and these sites reduced runoff by at least 40.2%. Shafique et al. [11] monitored permeable pavement in Seoul, South Korea, and runoff was reduced by 30–65%, while in Taiwan, Cheng et al. [12] studied permeable pavement in front of a senior high school in Taipei city with a runoff reduction between 35% and 41%. Unlike permeable pavement, rain gardens not only mitigate the impacts of urbanization on hydrological systems but also reduce pollution and have high aesthetic value [13,14]. However, the performance of a raingarden is not easy to evaluate. Asleson et al. [13] suggested evaluation methods for a raingarden, including visual inspection, infiltration rate testing, and synthetic drawdown testing. Jennings et al. [15] provided an analytical algorithm that combined precipitation, the properties of a raingarden, infiltration, evaporation, and evapotranspiration to assess the performance of raingardens. Bethke et al. [16] indicated that planting media thickness and soil porosity in a raingarden are significant parameters. Based on 15 years of raingarden observations at Villanova University in the United States, Amur et al. [17] concluded that 16% of all rainfall events resulted in overflow.
In addition to the substantial total runoff reductions, the previous cases show that the reduction rate may decrease with intensive rainfall. Over a short duration and with a high intensity rainfall event, the performance of permeable pavement is poor; however, its performance increases over the long duration and with low rainfall intensities. The cited studies noted that increasing precipitation intensity would increase the probability of raingarden failure [13,14,15]. The performance of the LID facility is based on the high infiltration rate; thus, once the rainfall intensity is larger than the infiltration rate the performance will be lower. Nichols et al. [18] assessed a raingarden at the Philadelphia Zoo in the United States to determine seasonal effects in colder regions, and the results confirmed that the raingarden overperformed. Few practical cases in subtropical regions where rainfall intensity is relatively high have been studied. Additionally, in previous studies the impacts on groundwater have rarely been discussed. Surface runoff is usually monitored to speculate about infiltration, but no real data on groundwater performance are available. Thus, this study observed two LID cases in Taipei, Taiwan, a subtropical city, to determine their performance in runoff reduction and groundwater recharge potential.
Previous studies showed the effectiveness of these facilities in reducing runoff compared with taking no action, proving that the LID practices worked. Now, maximizing their performance is important. The objective of this study was to evaluate the performance of a permeable pavement and a raingarden in a subtropical region based on field observations. Because the onsite observations can only show the performance of each rainfall event, they cannot demonstrate the whole hydrologic cycle. A model tool was then applied to determine the annual hydrologic cycle contributed by the LIDs and without the LIDs.

2. Materials and Methods

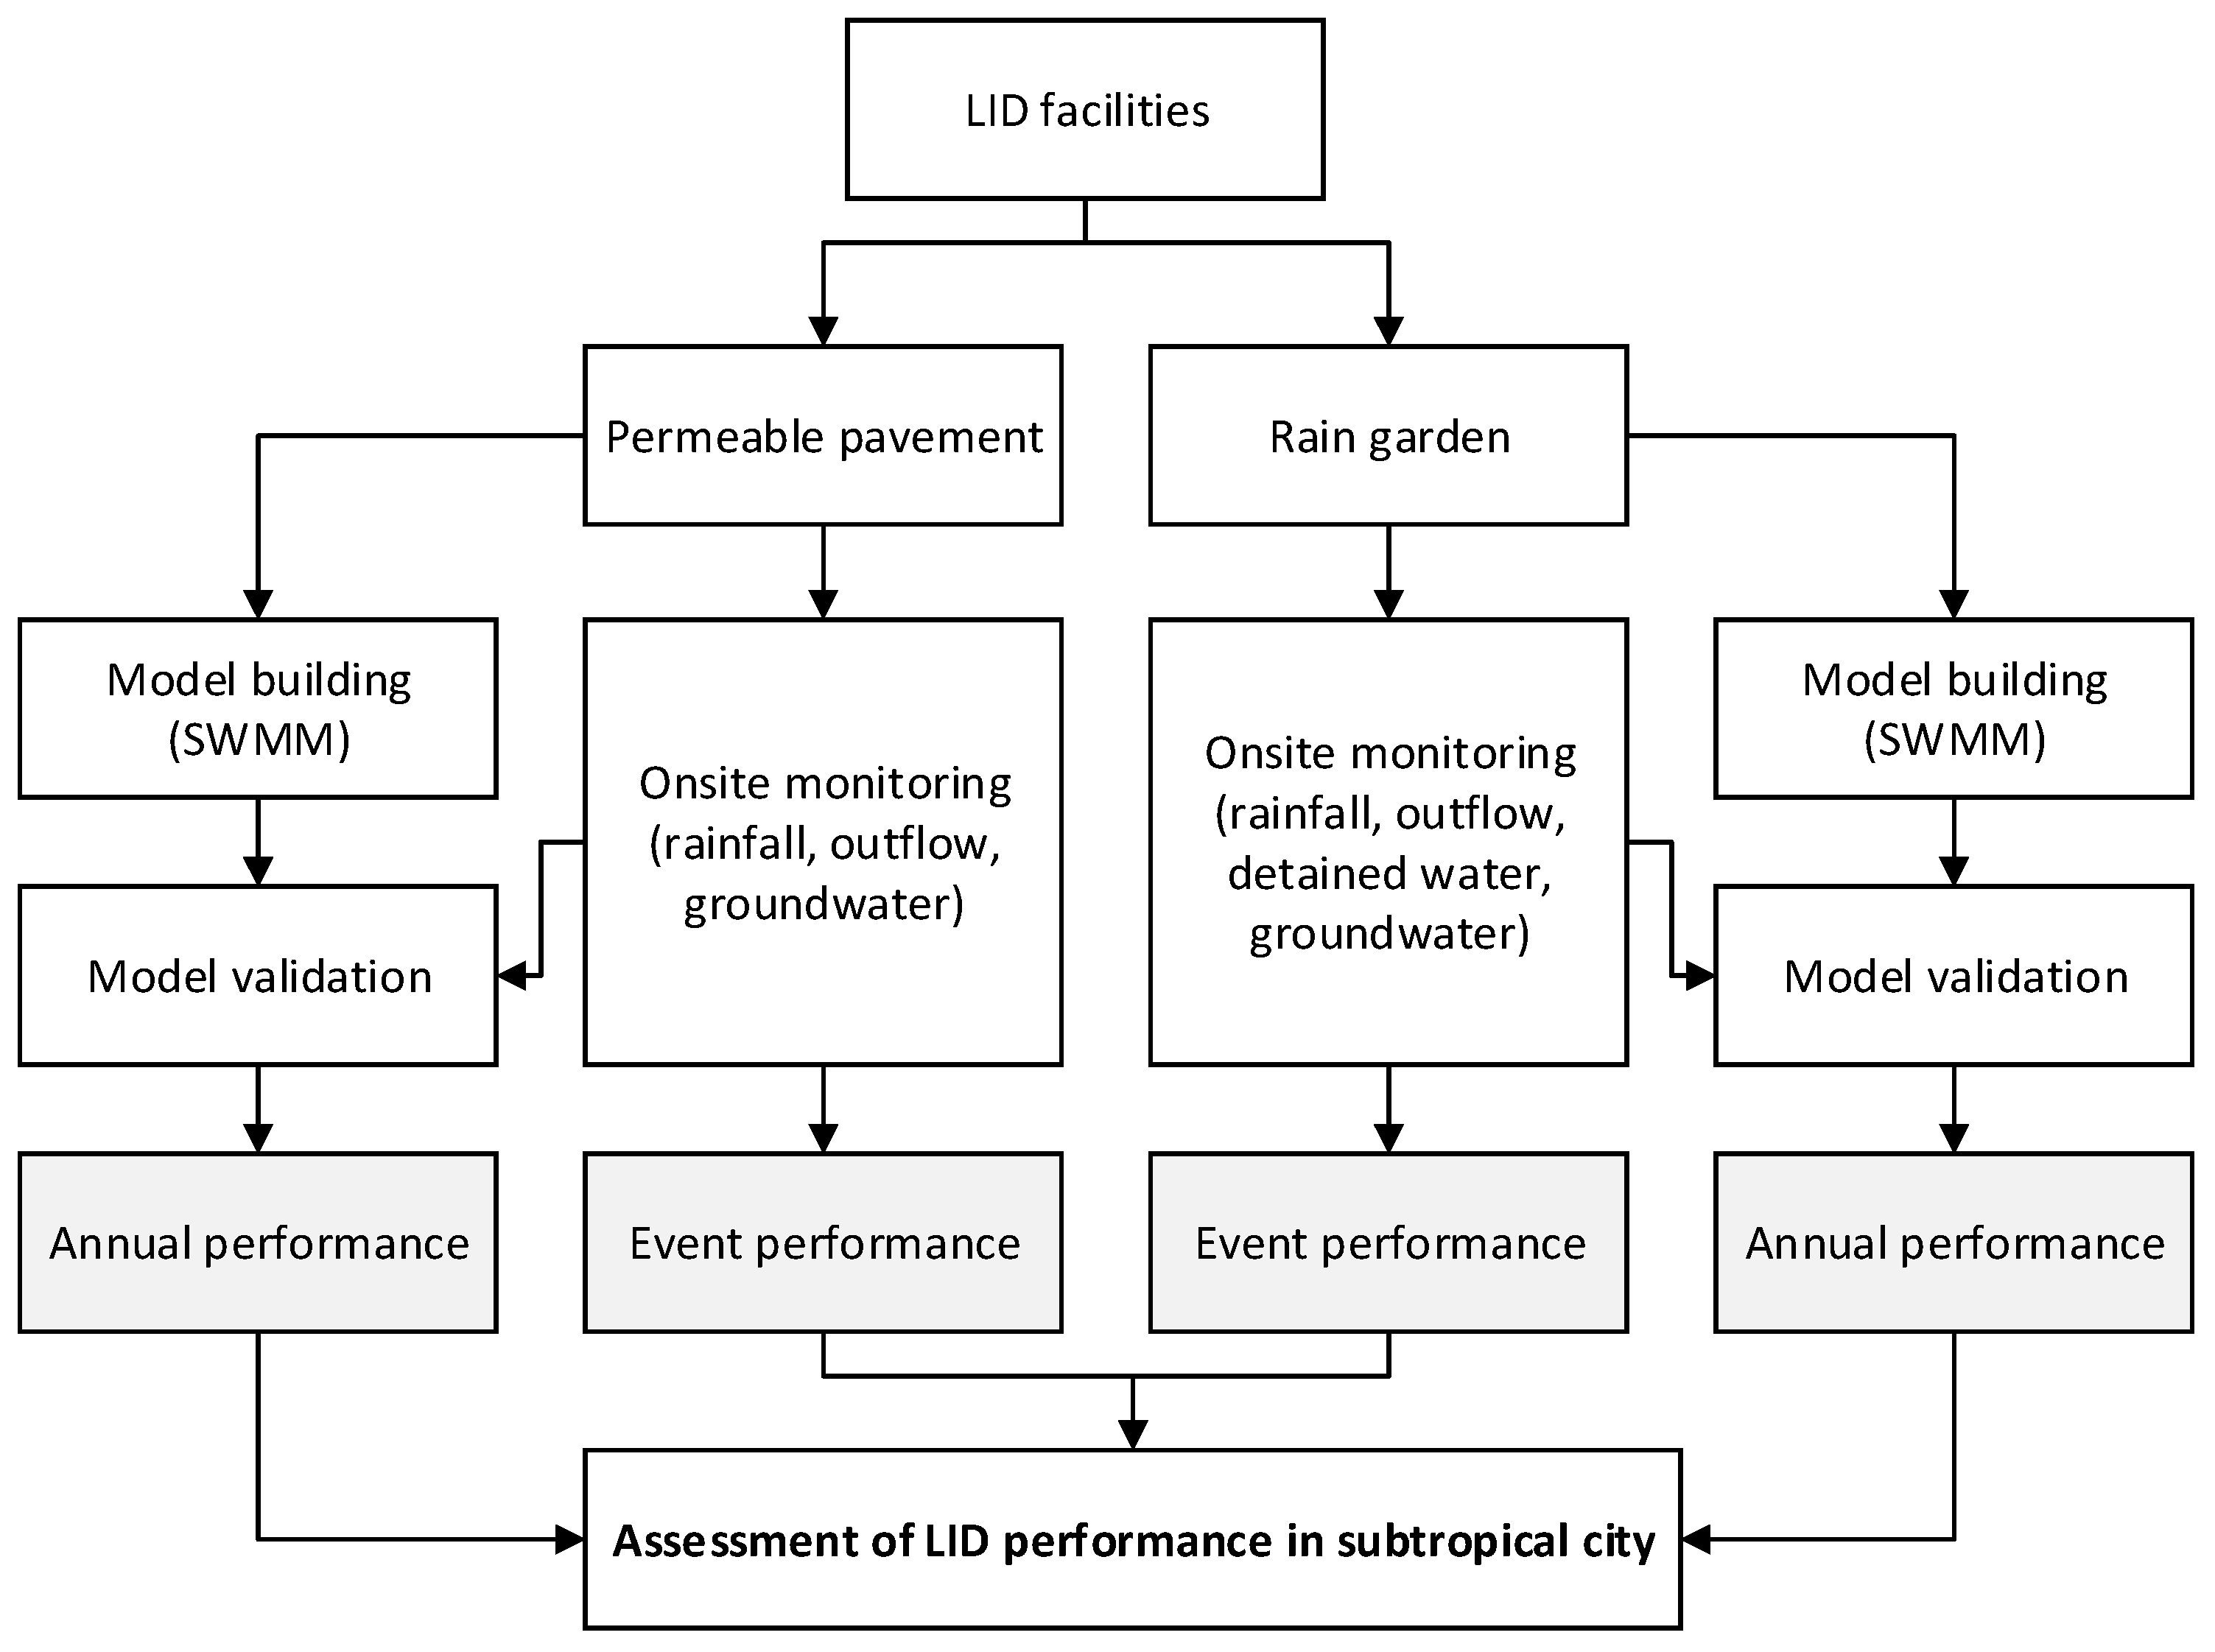
2.1. Flowchart of This Study

This study aimed to demonstrate and analyze the performance of permeable pavements and raingardens in subtropical regions to determine whether such facilities perform as well as those in other weather regions. Groundwater in addition to outflows was monitored. Outflows can show the water retention potential, and groundwater level can reflect the infiltration recharge potential. Onsite monitoring was used to assess the performance during rainfall events. However, the monitoring was not able to illustrate the whole hydrological cycle. Therefore, the model tool was applied. The model can display the annual performance with rainfall, infiltration, and evaporation, and can simulate the performance before these facilities were installed. With the observed event performance and the simulated annual performance, the effectiveness of LID structures in subtropical regions, such as Taipei, Taiwan, can be revealed. The flowchart of this study is shown as Figure 1.
Based on a literature review and experiences in Taiwan, permeable pavements and raingardens are two popular LID facilities and were selected in this study. The onsite monitoring sensors are continuous sensors, and the data were received every 5 min. Rainfall, outflows, and groundwater levels were monitored. The parameters of the sites were used to build the model, and the monitoring data were used to validate the model. After acceptable model calibration and verification, the model was used to assess the annual performance, and to display the hydrological cycle without the LIDs.

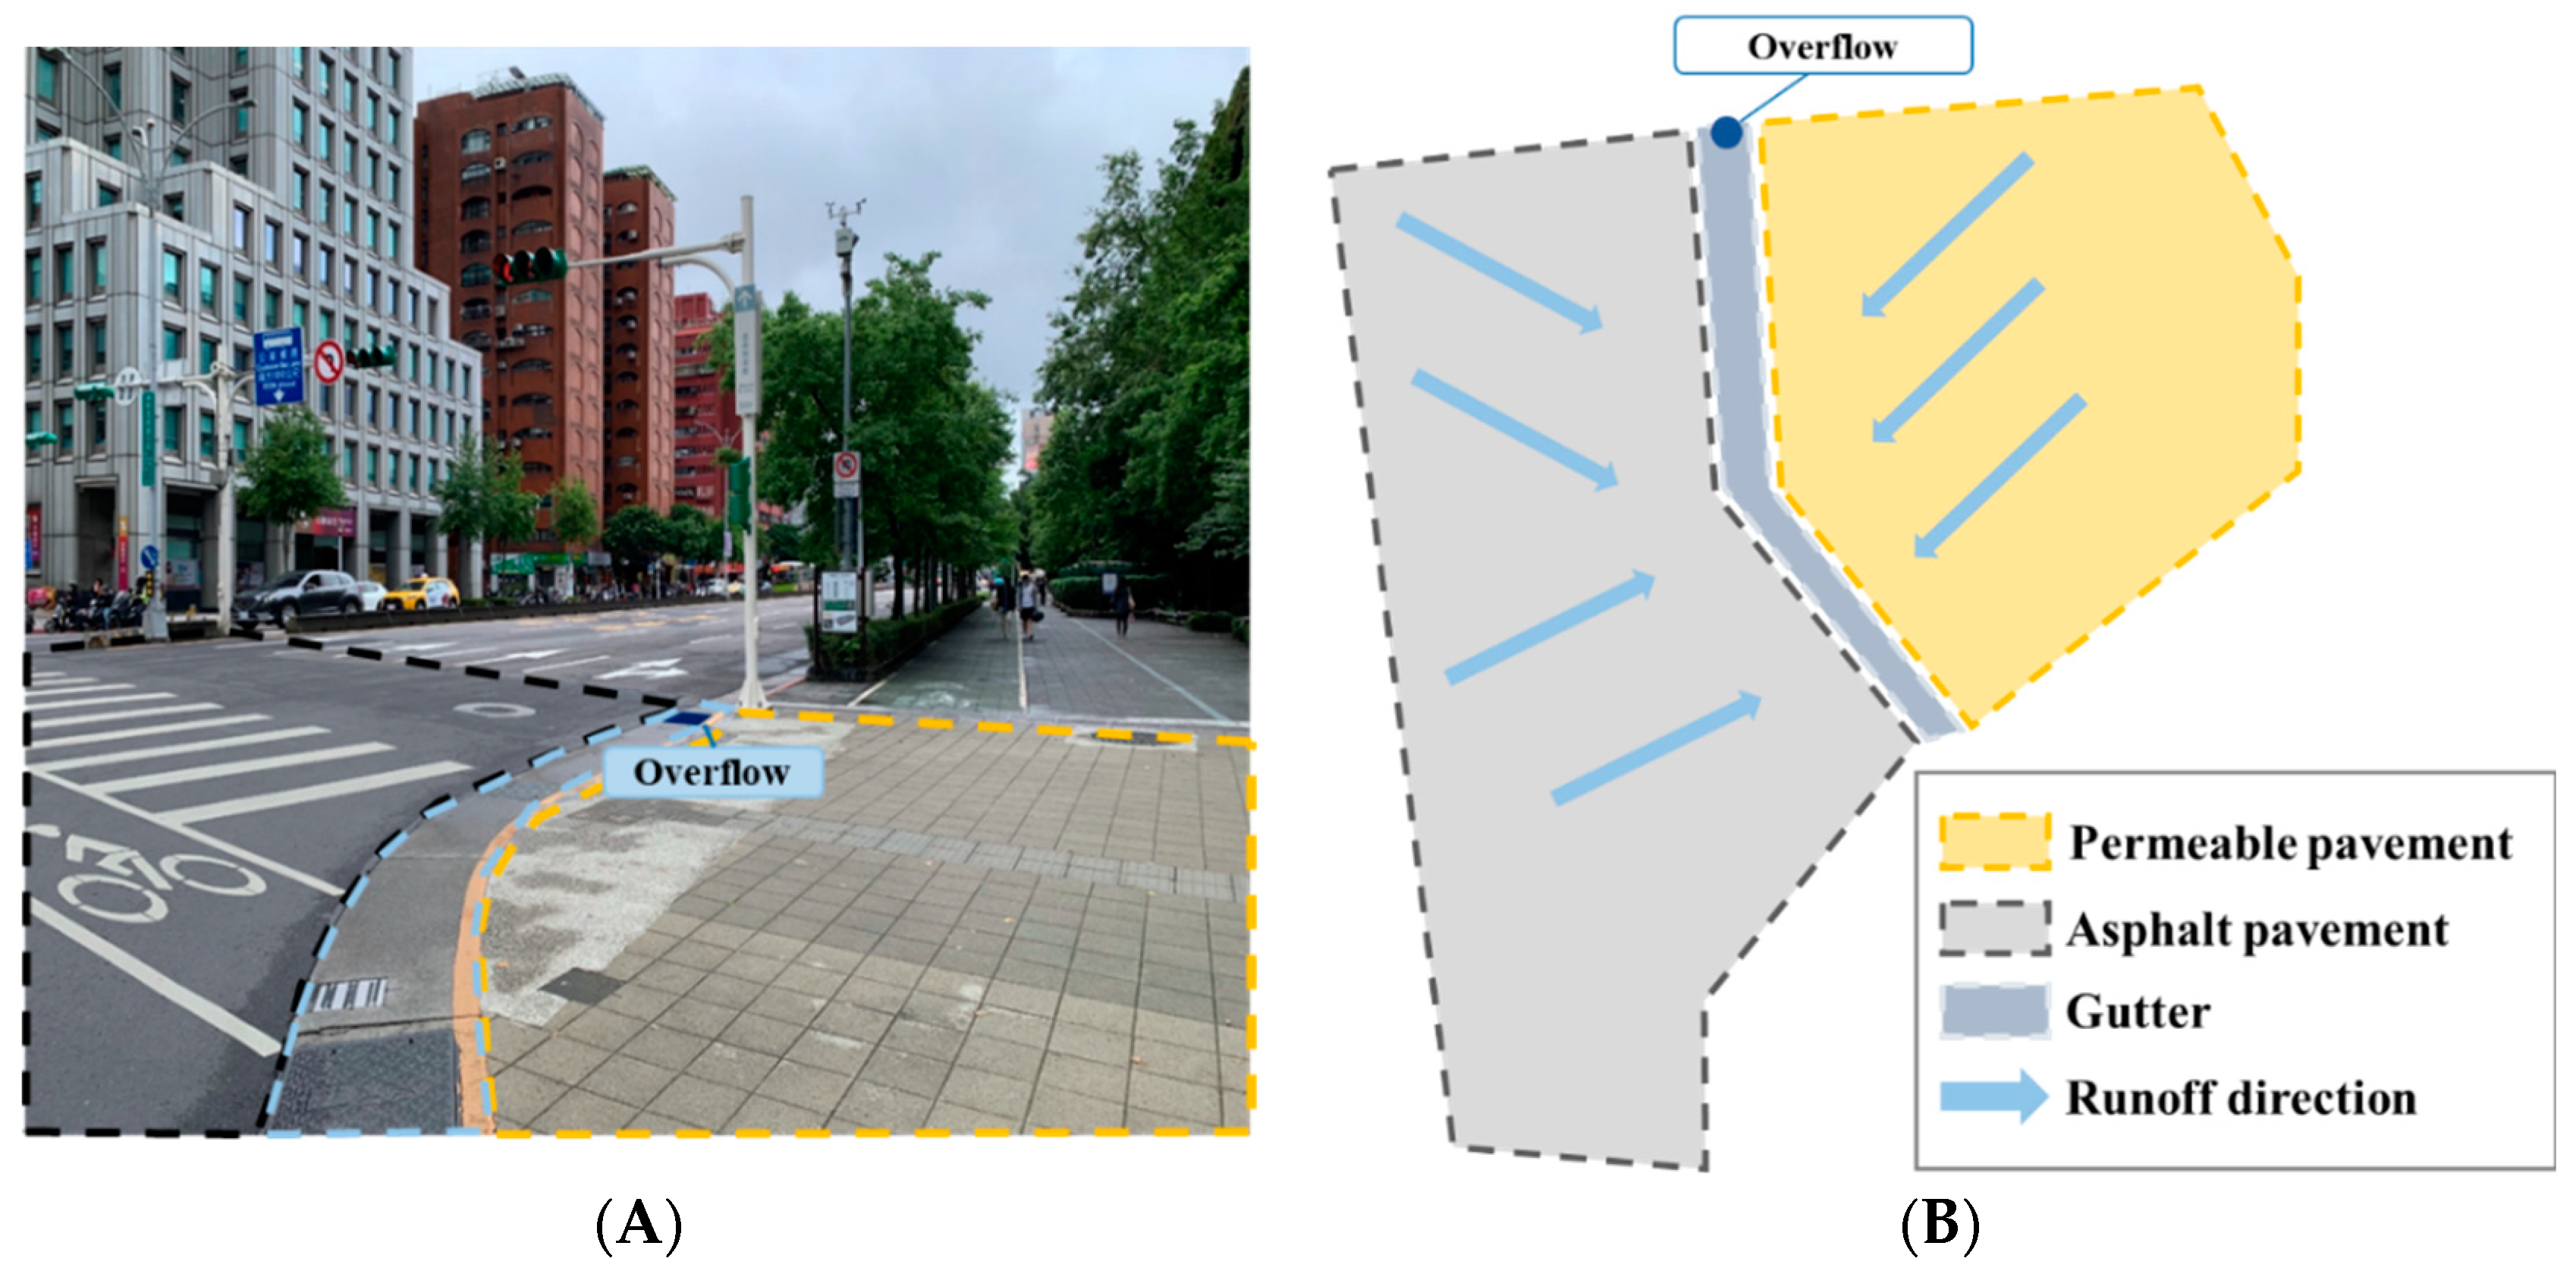
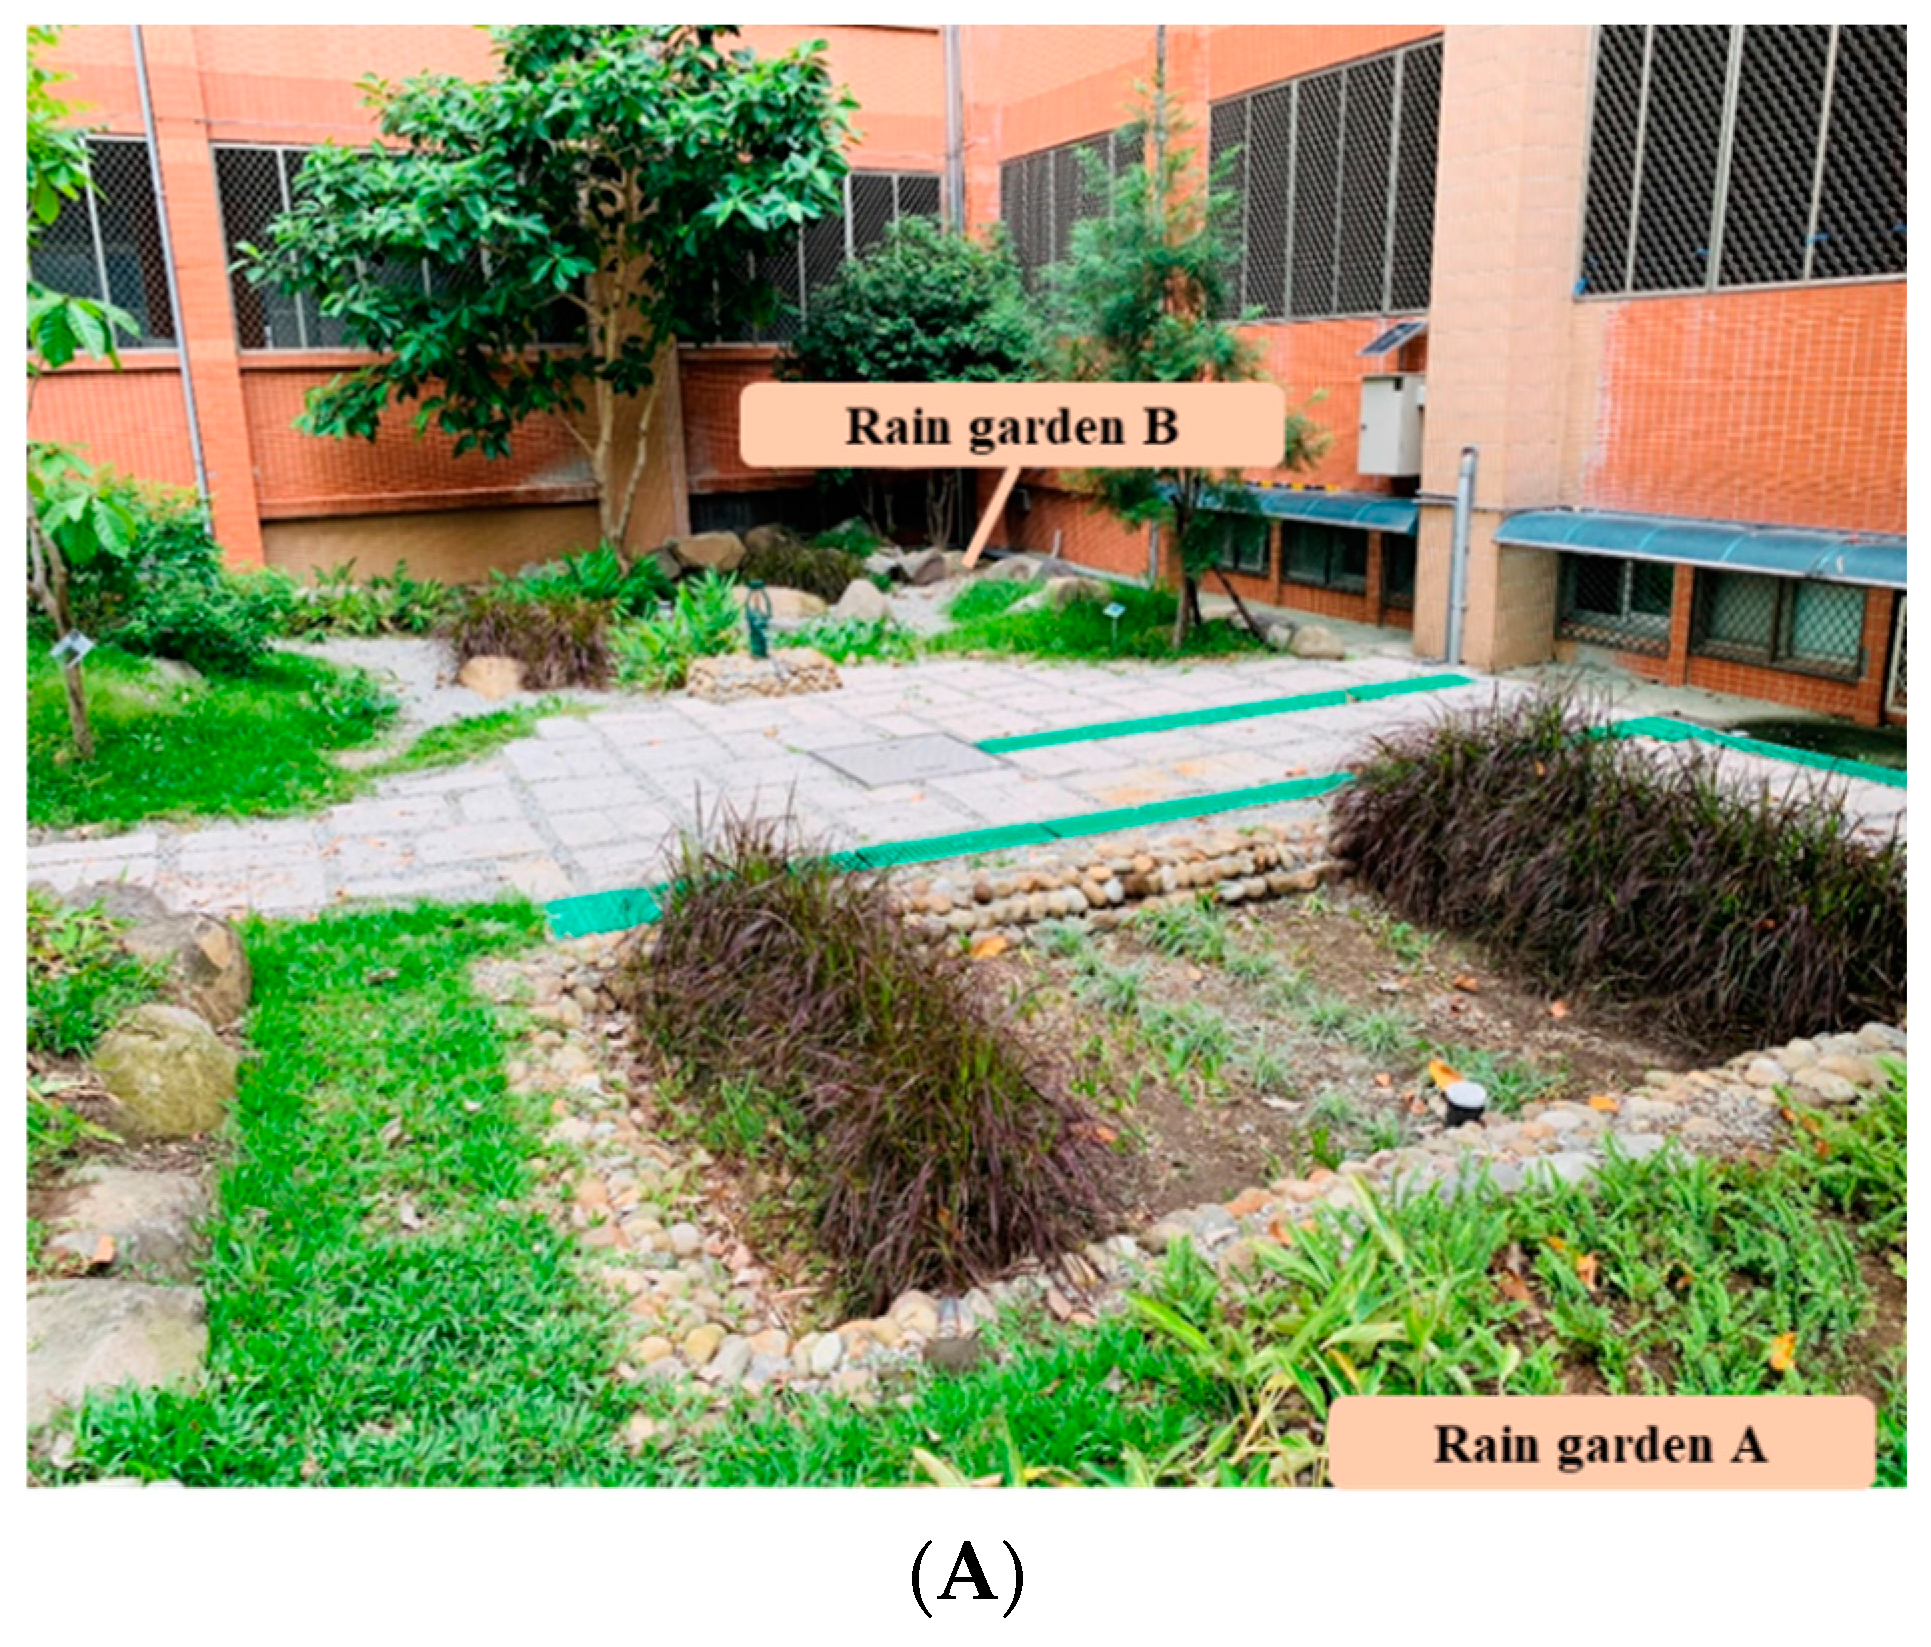
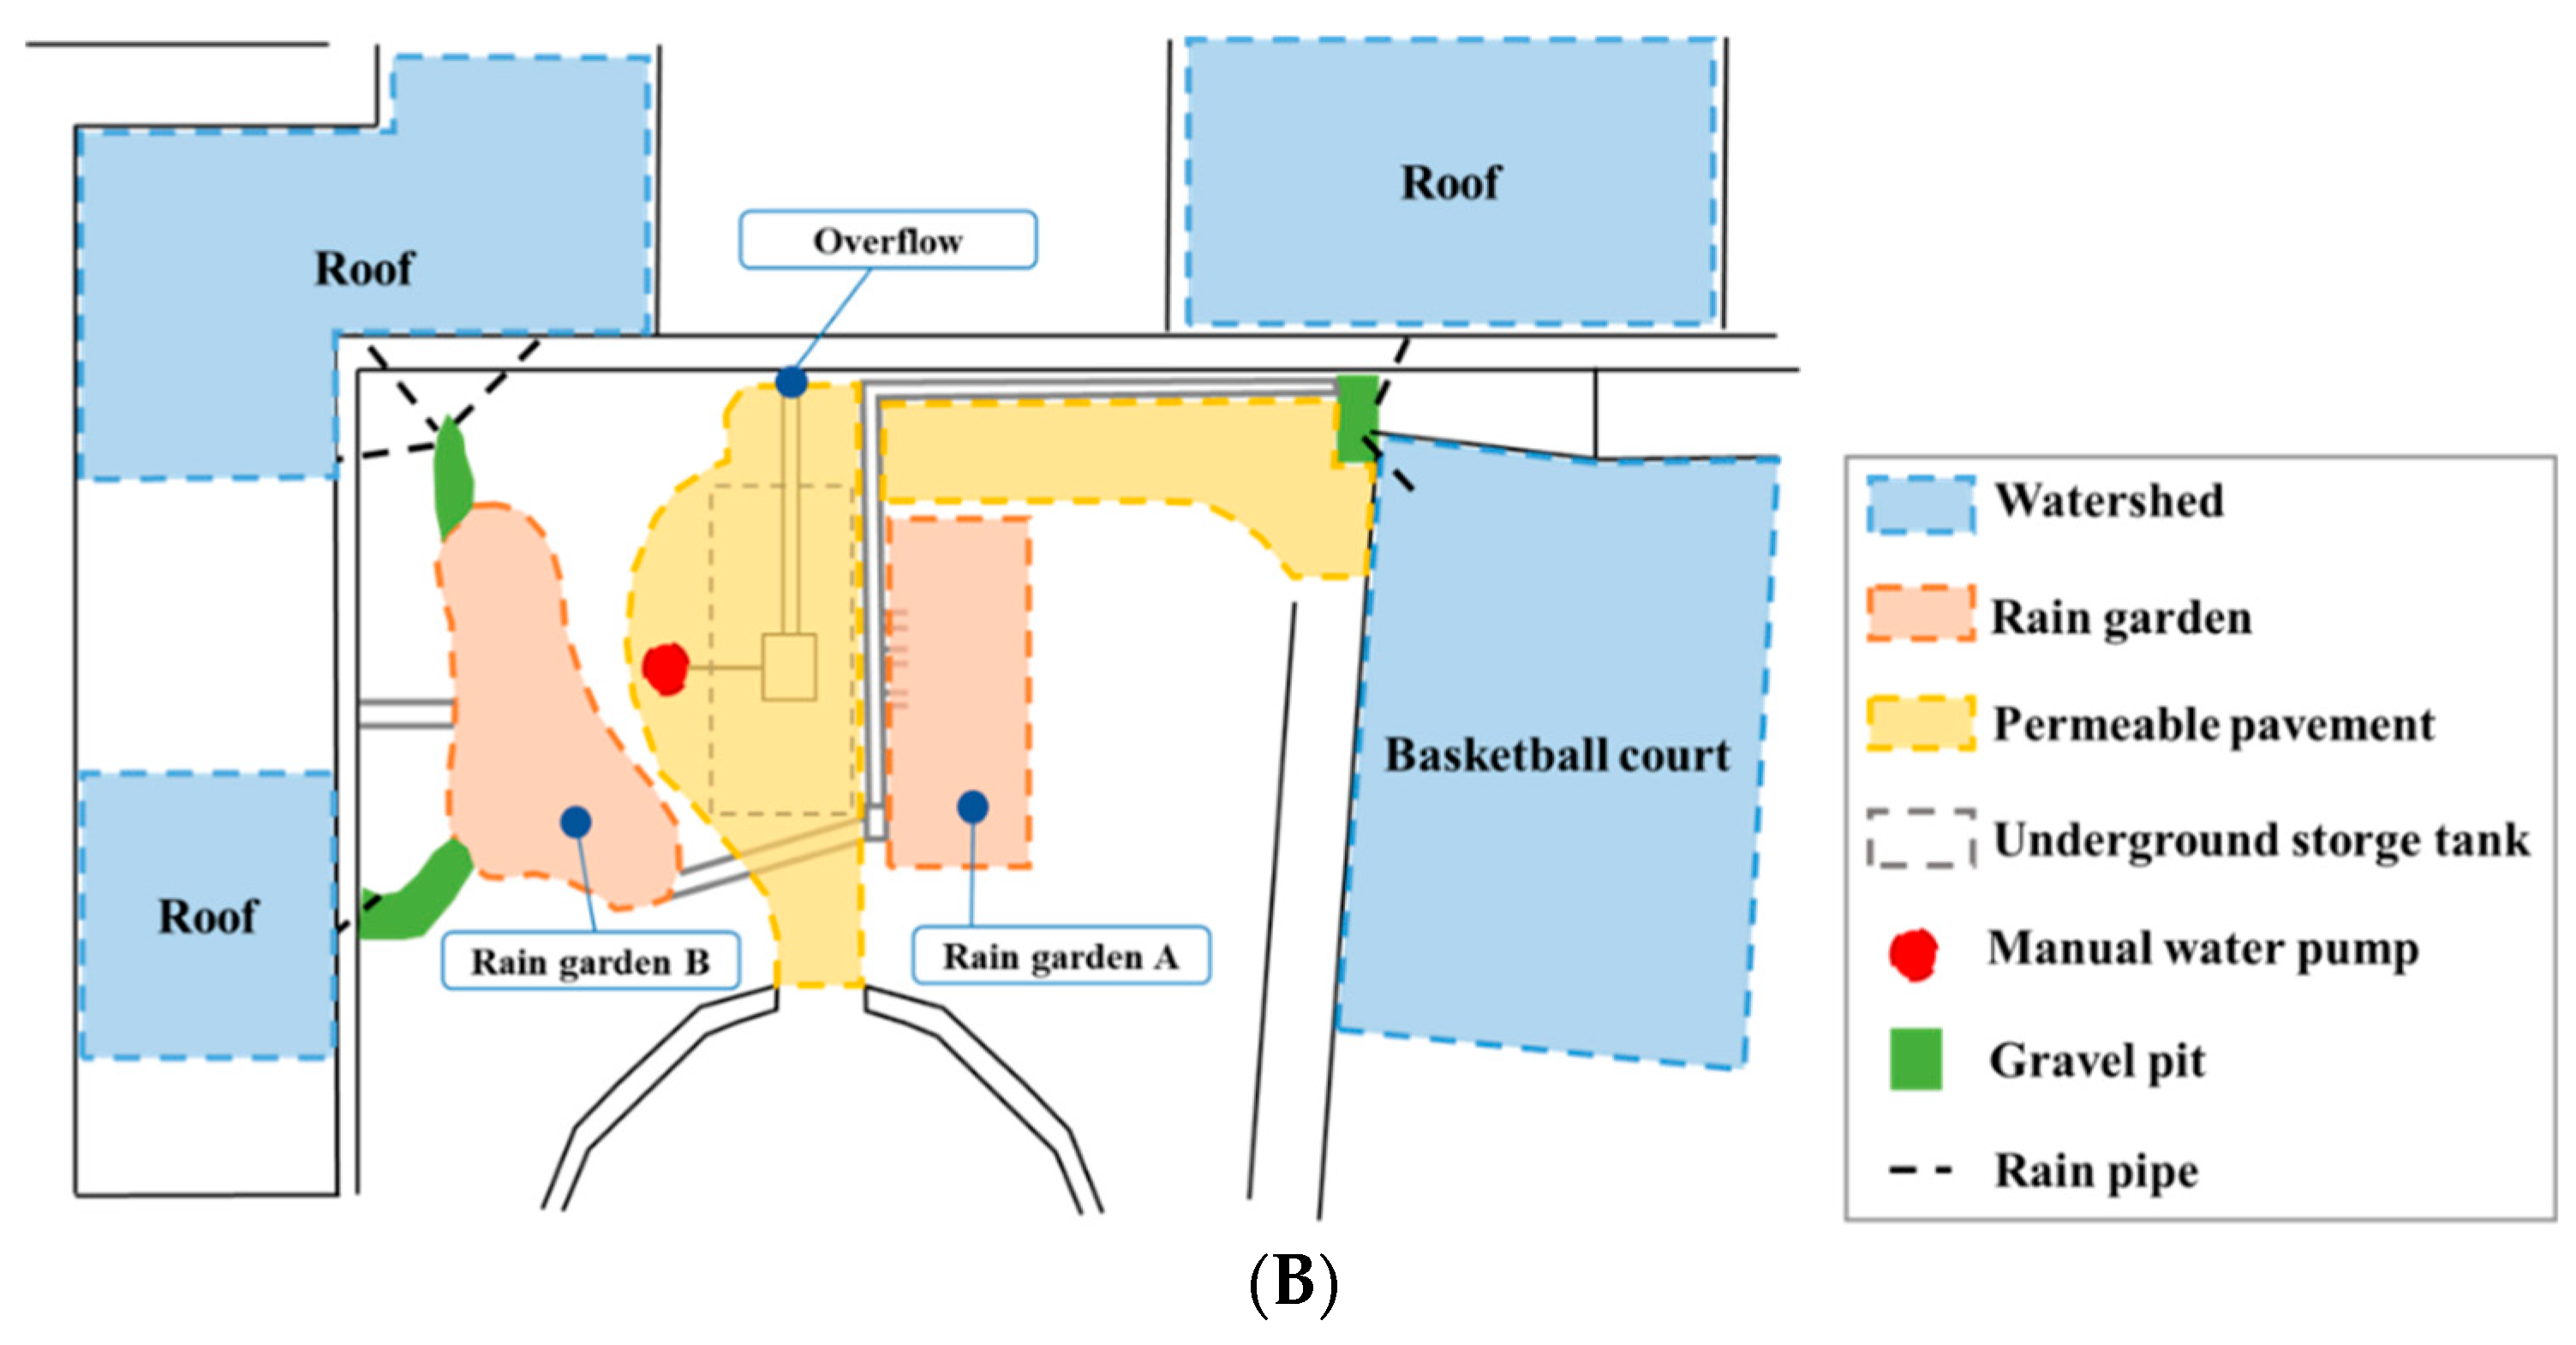
2.2. Two Field Cases

Two LID facilities located in Taipei City, Taiwan, were assessed in this study. One is a permeable pavement set in a sidewalk, and the other is a raingarden placed at an elementary school. The two sites were built at different times. The permeable pavement site was built when the sidewalk was being retread. We separated a corner of the road as a drainage area and set a flow meter in the gutter to measure the runoff. The permeable pavement site is shown in Figure 2. The total drainage area is 615.5 m2, whereas the permeable pavement area is 221.6 m2; the other surface is asphalt pavement. The ratio of permeable pavement area to drainage area is 36%, and the loading ratio, which is the ratio of the drainage area to the permeable area, is 2.78:1.
The raingarden site is shown in Figure 3. The total drainage area of this site is 493.2 m2, including the surface of the nearby basketball court and the roofs of the buildings. At the raingarden site, the total raingarden area is 78.4 m2, including 31.4 m2 of gardens and 47 m2 of retrofitted permeable pavements. The ratio of the raingarden area to the drainage area is 15.9%, and the loading ratio is 6.29:1. In addition, an underground storage tank was installed in the garden. The storage tank collects and stores the infiltrated water, which can then be pumped out as irrigation water. The volume of the underground tank is 15 m3.
At the two sites, the outflow was measured by a water level meter and V-notch weir, but no particular inflow point was monitored because the surface runoff was overland flow into the gutters. Therefore, the inflow was calculated by the measured onsite rainfall, drainage area, and an assumed runoff coefficient. A groundwater observation well was installed at the site to monitor the groundwater recharge.
The monitoring periods for the two sites were different. The permeable pavement site was built in 2021, and the one-year monitoring period was from March 2021 to March 2022. The raingarden site was built in 2019, and the one-year period was from January 2020 to December 2020. In Taipei, given the subtropical climate, the early summer rainy season is from May to June, and July to October is the typhoon season. Most rainfall is concentrated in summer, but rainfall occurs from December to January due to the northeast monsoon season. Therefore, rainfall is abundant in Taipei. The total rainfall was 1308 mm in 2020 and 2095 mm in 2021. In this subtropical area, the temperature is over 30 °C in summer, and in urban areas, the heat island effect in Taipei makes the temperature increase to nearly 40 °C. From June to September, the high temperature increases the amount of evaporation, and over the four months evaporation accounts for over 50% of the annual amount of evaporation. The total amount of evaporation was 720 mm in 2020 and 650 mm in 2021. The rainfall and evaporation data for Taipei are shown in Figure 4.

2.3. Modeling Tool

In addition to onsite monitoring of rainfall impacts on hydrological cycle performance, the annual rainfall impacts on the performance of these cycles were evaluated by modeling tools. Unlike the hydrological impacts when outflow is caused by a random rainfall event, the model helps present the annual hydrological cycle with precipitation, outflow, infiltration, and evaporation. The Storm Water Management Model (SWMM) is a widely used modeling tool for evaluating urban drainage systems and is capable of assessing the performance of LID facilities. Several applications of this model have been used in LID assessments [16,19,20,21,22,23,24,25,26]. The SWMM was developed by the US Environmental Protection Agency (USEPA) and has been widely adopted worldwide. The model has also been applied in Taipei city [27]. Therefore, the SWMM was applied to the two study sites to determine their annual hydrological performance. The details of the model can be obtained from its official website and manual [28].
Before SWMM application, model calibration and verification were implemented. The coefficient of determination (R2) and Nash Sutcliffe Efficiency index (NSE) were used to verify the simulation results. When close to 1, both indicators indicate that the simulations are close to the observations and are regarded as high acceptable levels. According to Moriasi et al. [29], 0.75 < NSE < 1.00 is a very good performance rating, and an R2 greater than 0.5 is considered acceptable.

3. Results and Discussion

3.1. Observed Performance of Permeable Pavement

The permeable pavement site is not 100% permeable, where 36% of the pavement is permeable and the remainder is impermeable pavement. Information on 41 rainfall events was collected from March 2021 to March 2020, as shown in Table 1. The rainfall and outflow were observed. However, no measured inflow data were available because the sites are open and wild space and because rainwater enters the sites by gravity and overflow; thus, no inflow channel could be measured. The inflow was calculated as rainfall multiplied by the total surface area, which assumed that during short-term rainfall events, rainfall losses such as depression and evaporation were not accounted for. Therefore, from the input rainfall amount and the output flow, the reduction rate can be obtained. During the 41 rainfall events, the reduction rate ranged from 5.0% to 30.8%, and the average was 14.7%. Notably, this performance was based on a 36% contribution from the permeable pavement in the drainage area. If the drainage area was replaced with 100% permeable pavement, the reduction rate could increase threefold to 45%.
All 41 events were outflow events. The total rainfall amount of the 41 events was 1821.2 mm, which means that 273.8 mm of the rainfall did not generate any outflow in the monitoring period. Thirty of the 41 events resulted in reduction rates between 11% and 20%, four events resulted in a reduction rate of less than 10%, and seven events resulted in reduction rates greater than 21%. During the four events with reduction rates less than 10%, the total rainfall amount was high except the event on 31 May, when the reduction was 9.7%. In contrast, when the total rainfall was less than 30 mm, a high reduction rate occurred. The data show that the general rainfall amount was between 20 and 100 mm and that approximately 1/3 of the permeable pavement area contributed to runoff reductions of 11–20%.
The permeable pavement helped increase infiltration and decrease surface runoff. From the observed outflow data, a reduction in surface runoff occurred. It was expected that the water that was not runoff would infiltrate and recharge the groundwater. We set a groundwater observation well on the site to observe the change in the groundwater table. The results showed that the groundwater table was highly correlated with the rainfall events. Figure 5a shows the monitored groundwater table. During rain events, the groundwater table rose immediately, and when the rain stopped, the groundwater dropped too. The data provide evidence that permeable pavement is beneficial for groundwater recharge. Without the infiltration provided by the permeable pavement, the groundwater table might not have experienced the sharp changes.

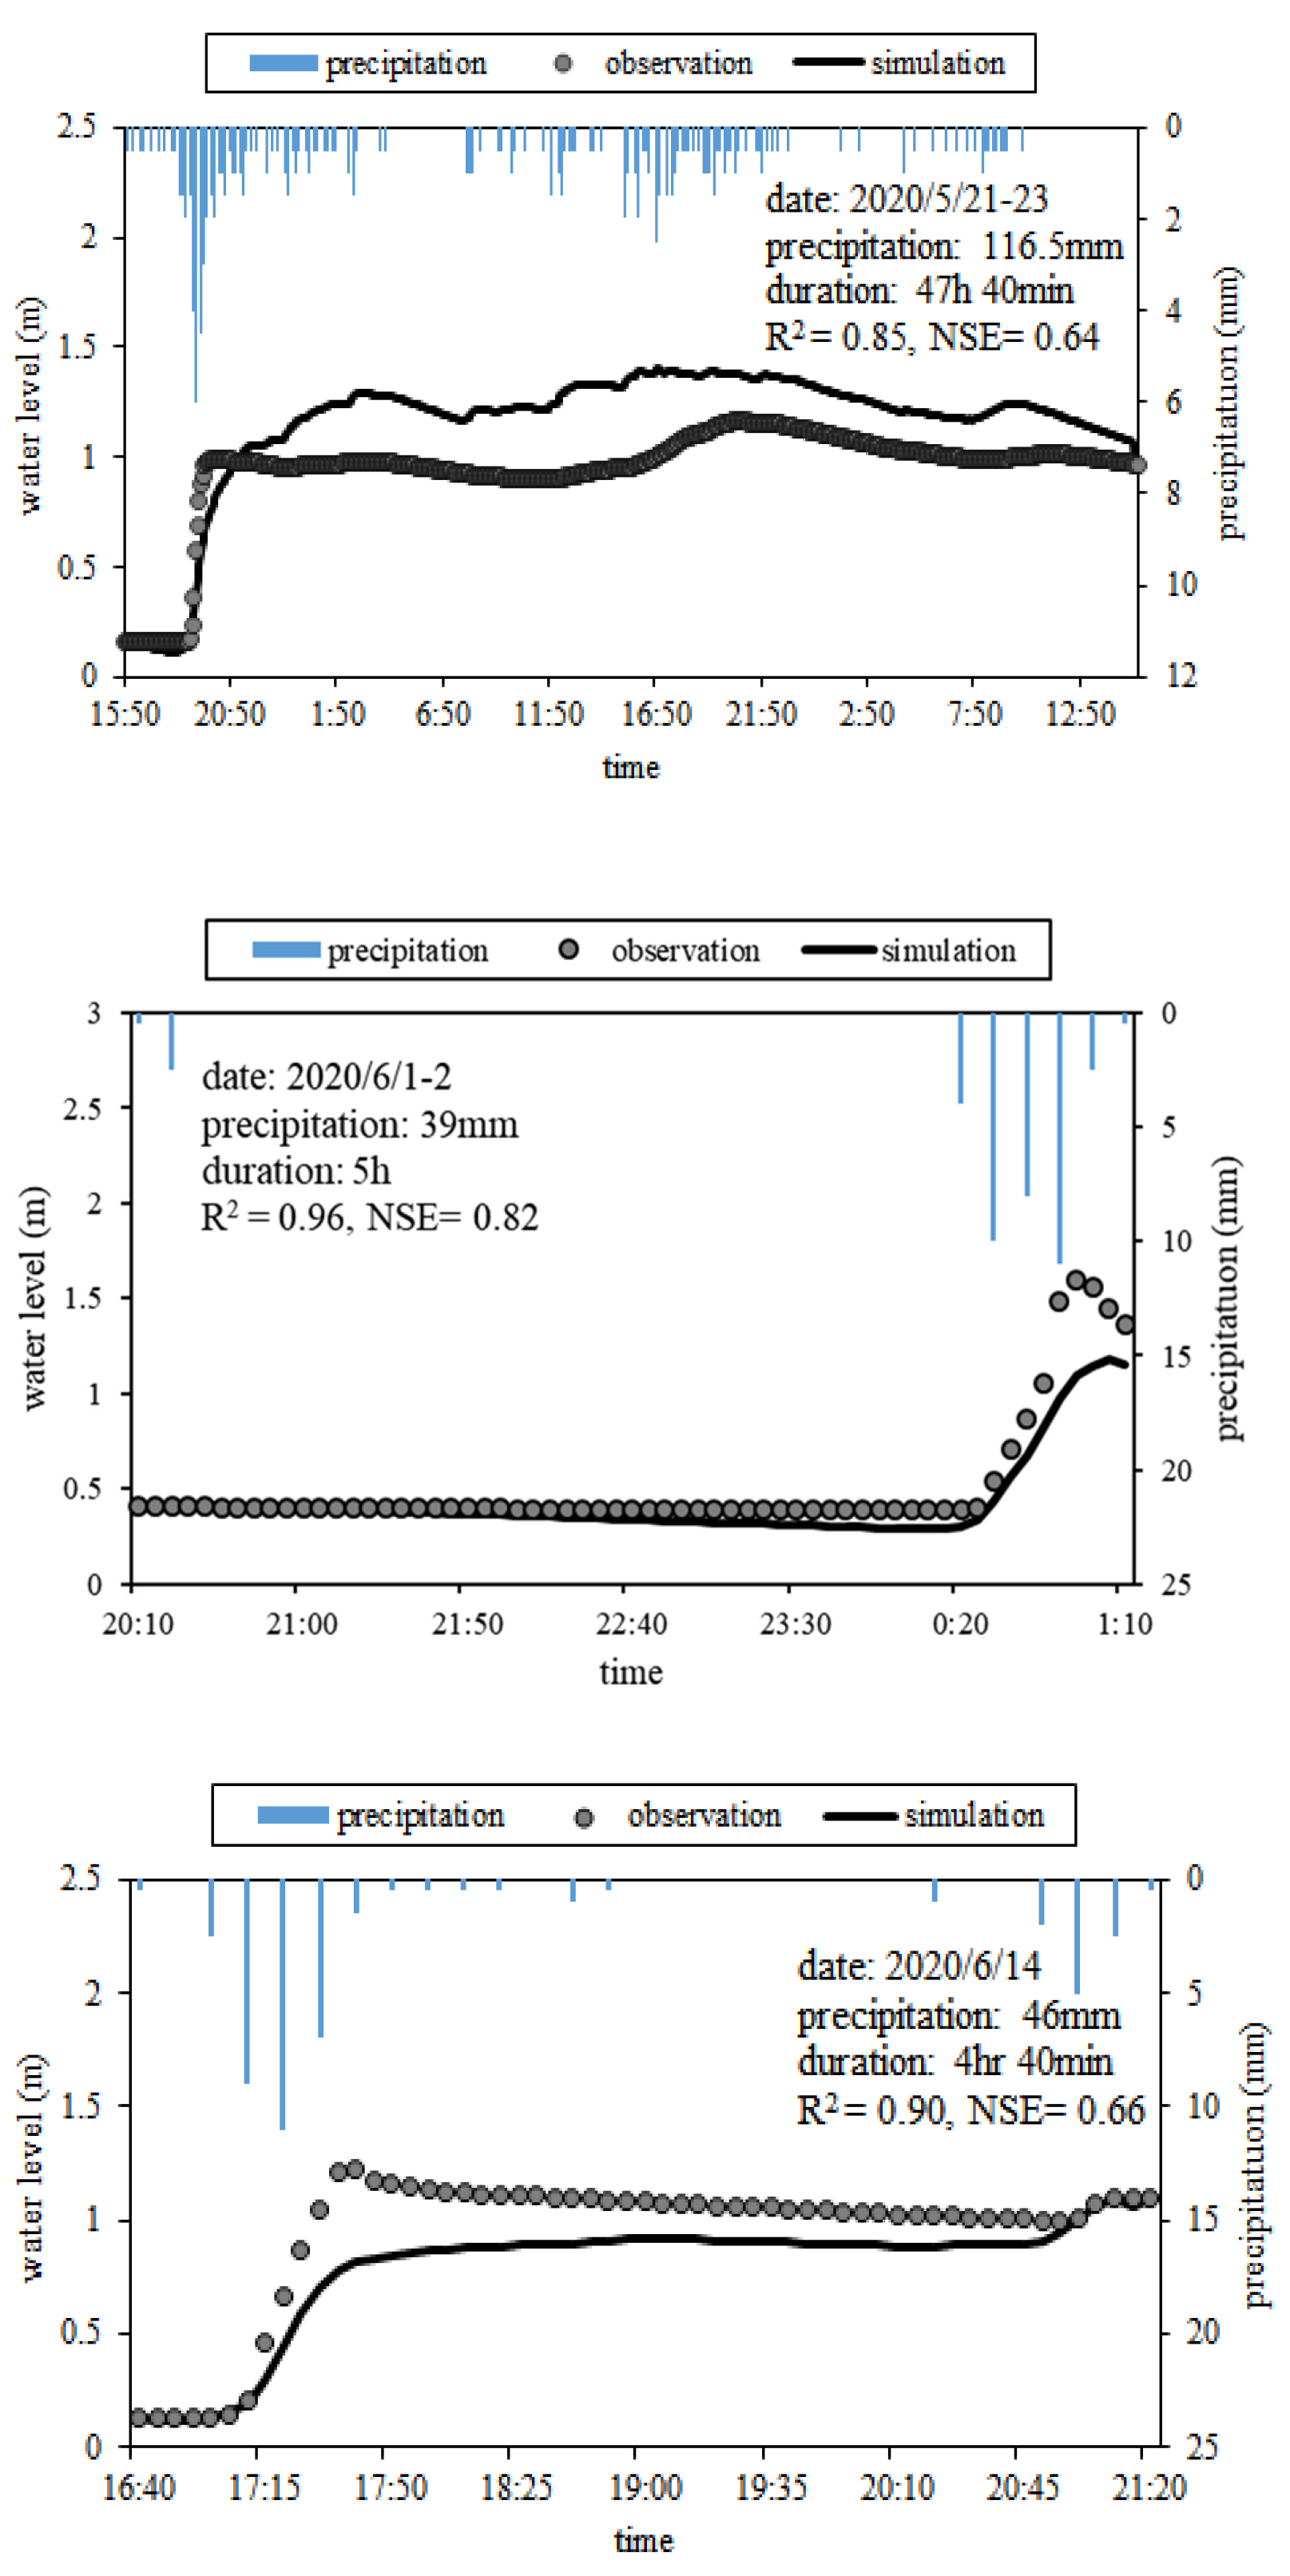
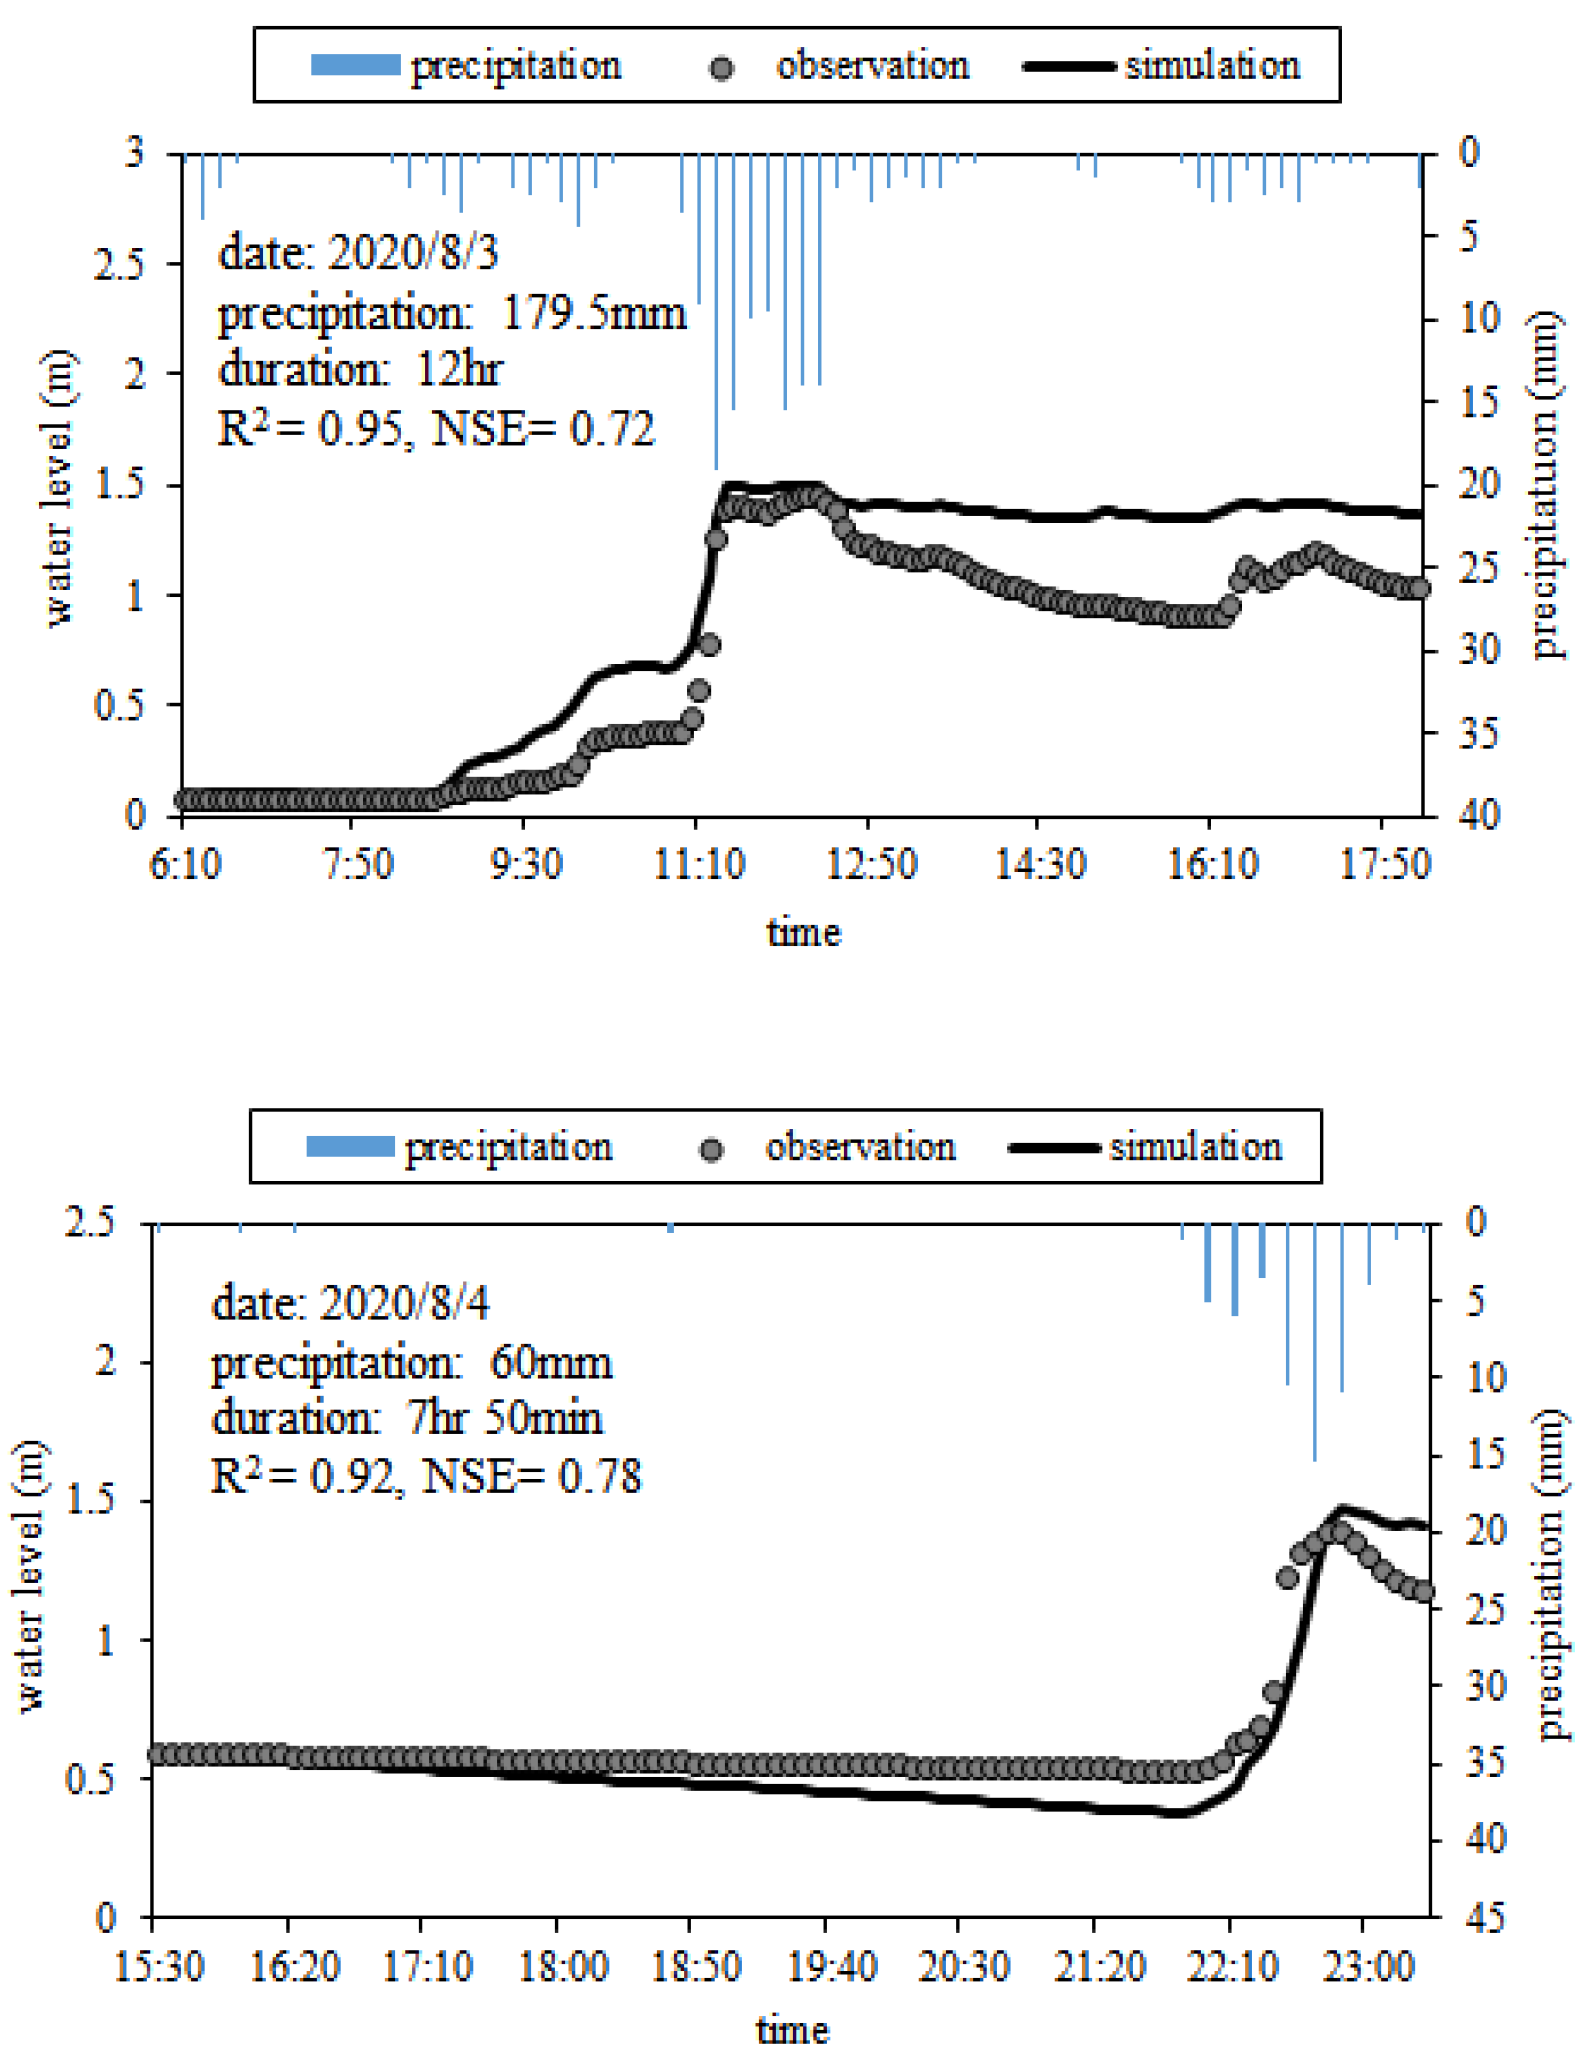
3.2. Observed Performance of the Raingarden

The raingarden site had a drainage area of 493.2 m2, including gardens, retrofitted permeable pavement, basketball courts, roofs, and green space. Unlike the permeable pavement site, where the rainfall at the drainage area accounted for all of the outflows, the rainfall at this site was not all runoff. Several types of land cover at this site had different pervious and impervious properties. We used different runoff coefficients for different land cover types, and took area as a weighing factor to produce the combined runoff coefficient of this site, which was 0.73. Therefore, the input rainfall volume is rainfall multiplied by drainage area multiplied by the runoff coefficient (0.73). A total of 24 rainfall events occurred in 2020 at this site, as shown in Table 2. The outflow was measured by the onsite monitoring sensor.
The observed data showed that the average runoff reduction rate reached 98.4%. Nineteen of the twenty-four events had 100% reduction rates, meaning that they did not flow out from the site. These high reduction rates occurred because the raingarden site had a high infiltration capacity and had an underground storage space. The rainwater was directed to the tank through the garden, and the stored rainwater was then recycled as irrigation water for the garden. The design target for this raingarden site was to retain water onsite and not have it flow out; therefore, a storage tank was constructed. Even if the rainfall amount was greater than 100 mm, most rainfall was retained at the site. The total rainfall amount throughout the 24 events was 1036 mm, which means that 272 mm of rainfall did not enter the tank and might have been stored in the soil.
Although a 15 m3 underground storage tank was installed and was supposed to collect infiltrated water, the runoff through the garden and green space recharged groundwater as well. Some rainfall events had rainfall amounts larger than the tank storage volume of 15 m3, but still no outflow was found. This scenario might have contributed to infiltration. A groundwater observation well was constructed to monitor the change in the groundwater table. The observations are shown in Figure 5b. The results were similar to those at the permeable pavement site, where the groundwater level was highly related to rainfall events. However, the response of the groundwater table at the raingarden site was slower than that at the permeable pavement site. The groundwater table presented a slowly increasing and decreasing curve. This phenomenon might have been caused by the deep soil layer in the rain garden, and the groundwater recharge was from the released soil water. The amount and velocity of soil water control groundwater recharge. However, at permeable pavement sites, the amount of water retained in soils is much less than that in raingardens, so the groundwater table curve changes more dramatically.

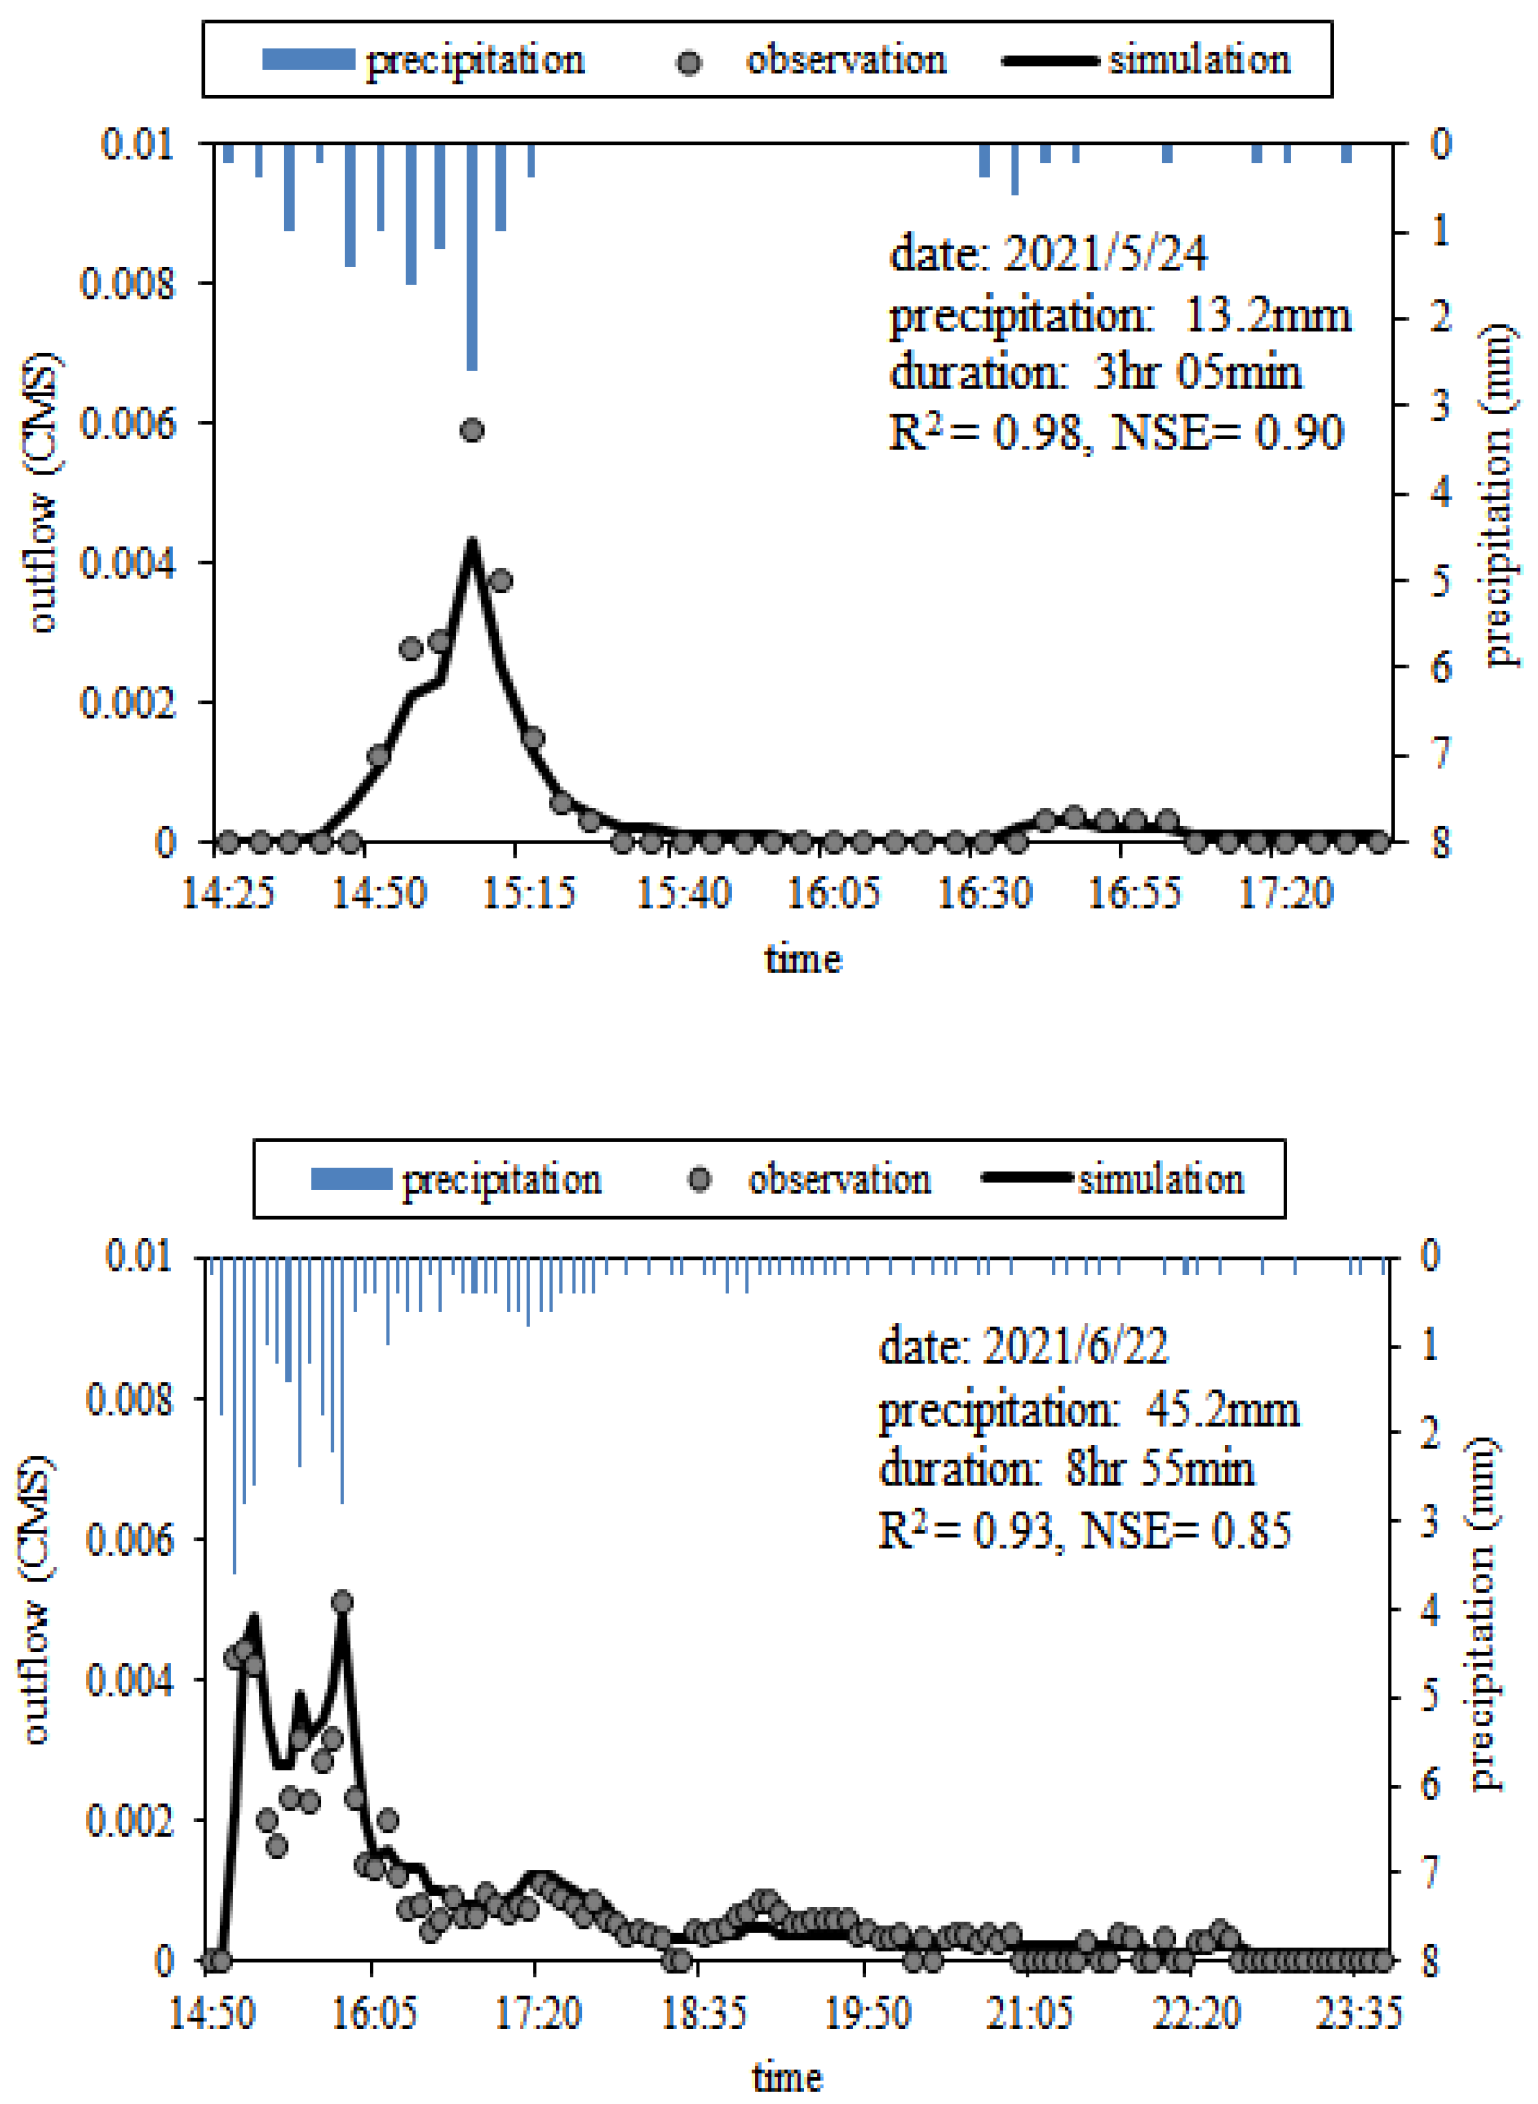
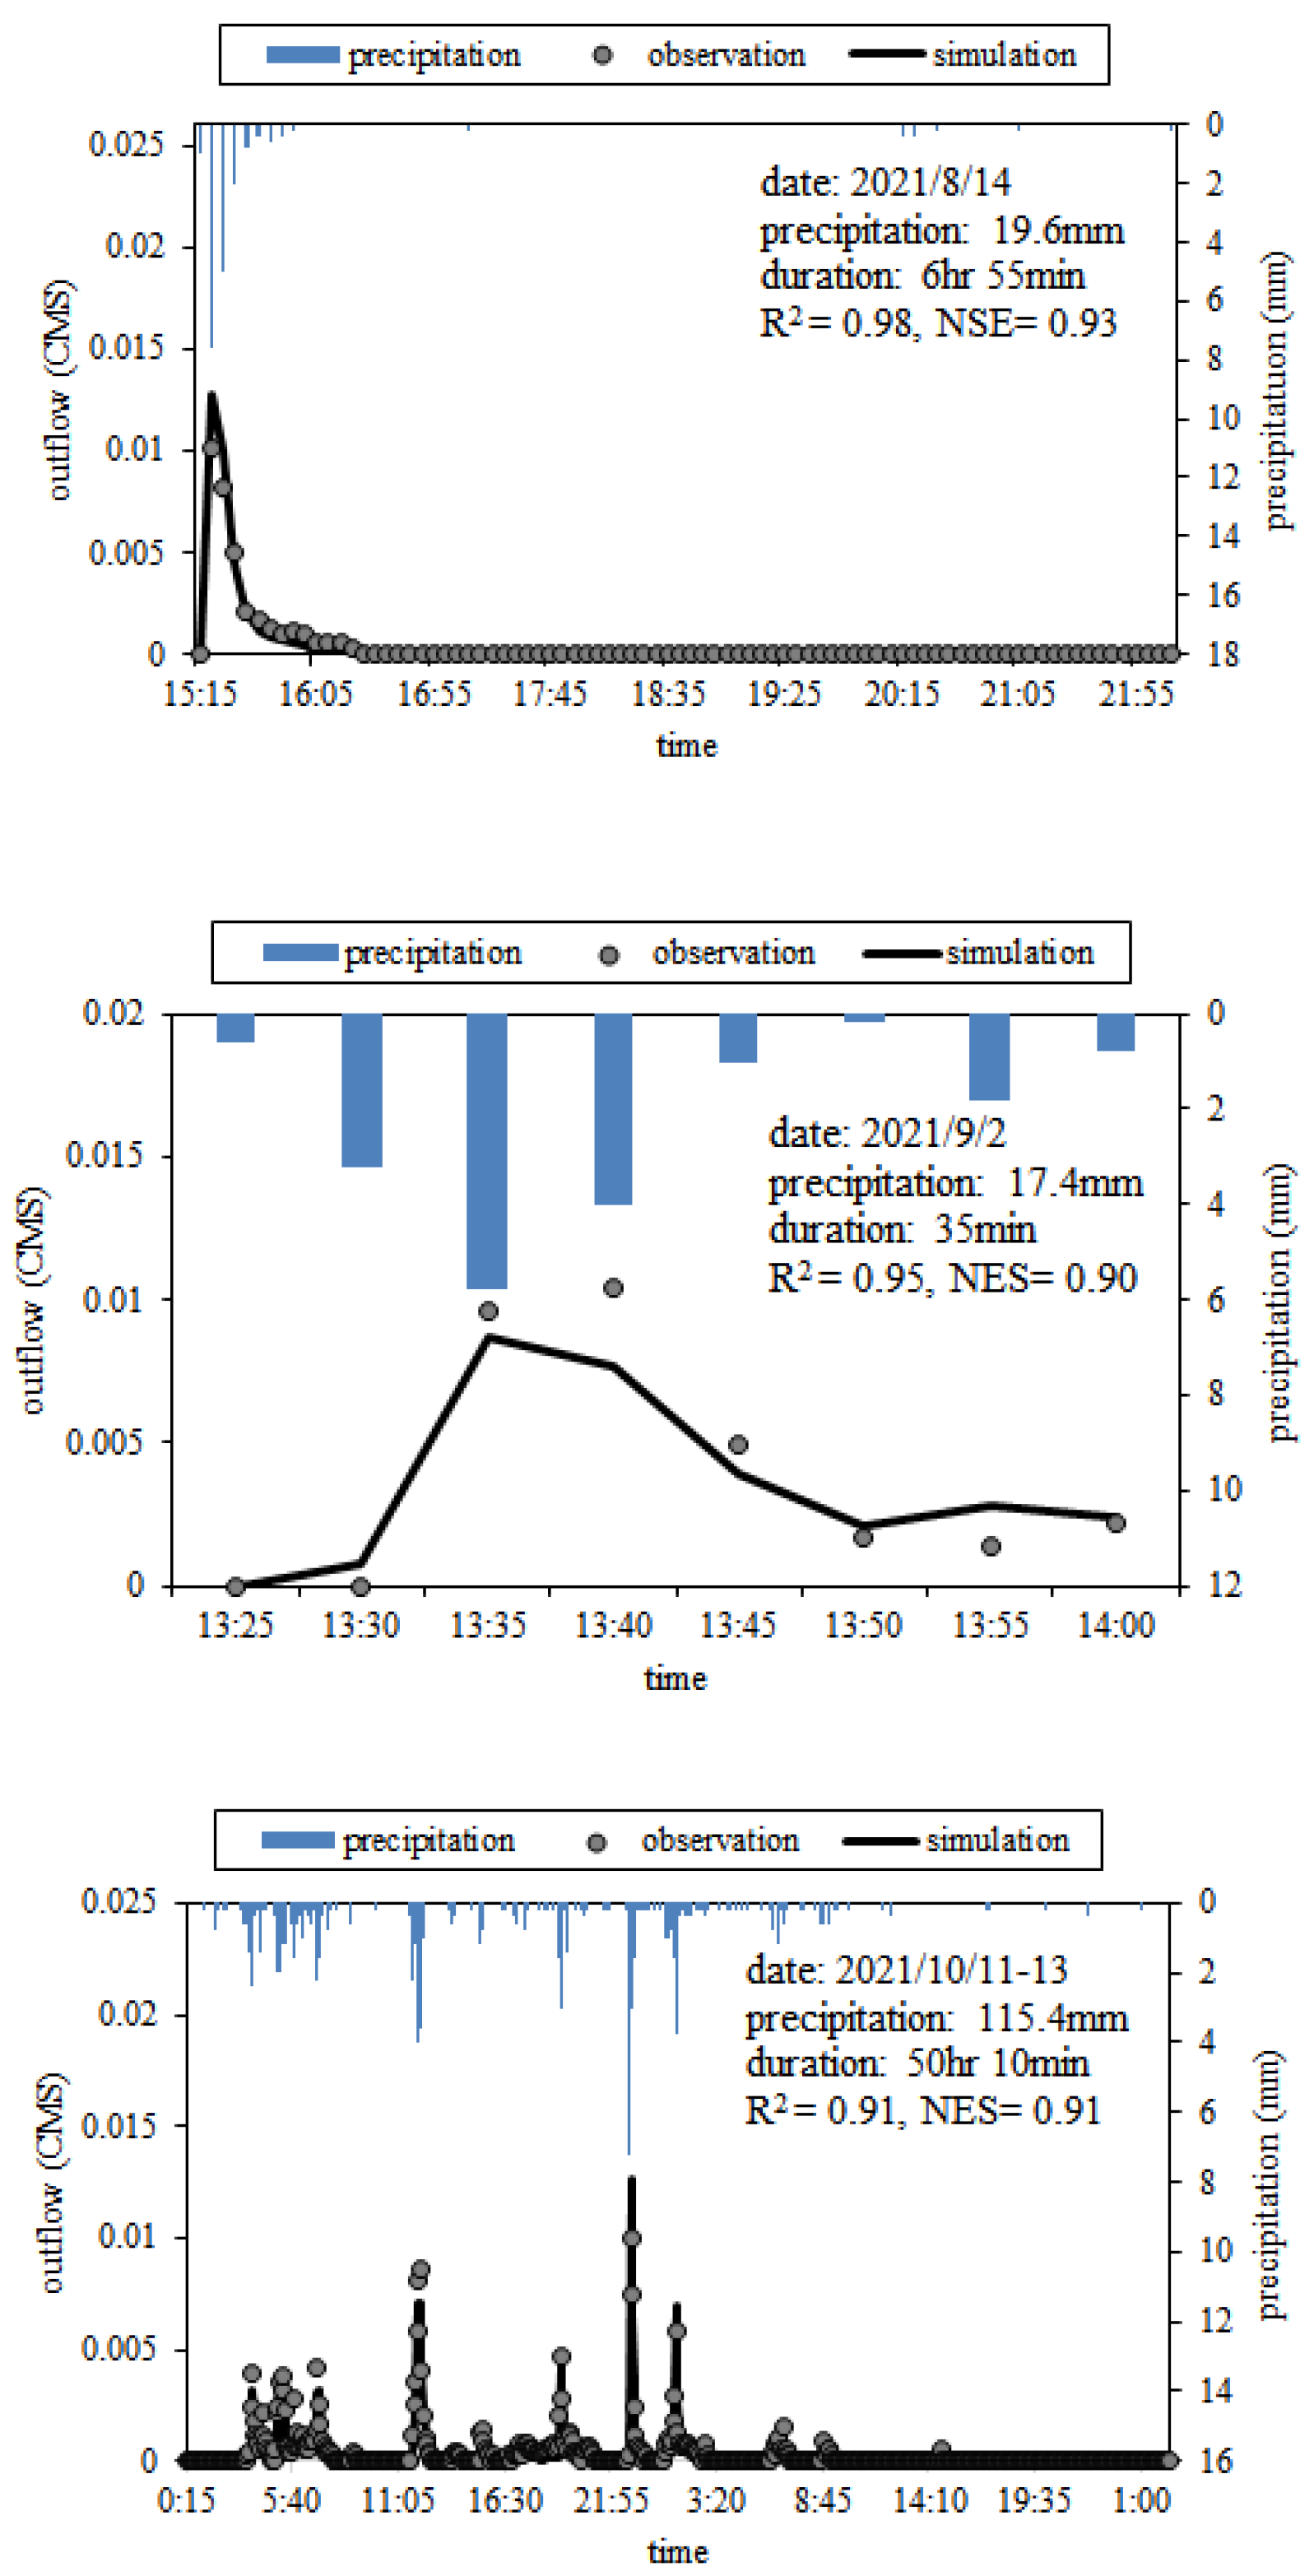
3.3. Model Calibration and Verification

The observed model performance of each rainfall event was influenced by rainfall characteristics and reflected the whole-year results. Here, the SWMM was used to demonstrate the annual water performance. Before SWMM application, model calibration and verification were implemented. Figure 6 and Figure 7 show the simulation results for the permeable pavement site and raingarden site, respectively. Five rainfall events at each site were selected, three for calibration and two for verification. Short (<1 h) and long (>10 h) rainfall events were tested. At the permeable pavement site, the outflow was simulated and compared with the measured flow. At the raingarden site, the measured outflow was almost zero. The model simulation of the raingarden site used the water level in the tank rather than the outflow data to compare the observations.
The simulation results were acceptable, and the R2 and NSE results are shown in Figure 6 and Figure 7. Table 3 shows the model parameters of the site dimensions used in the SWMM. The flow change was significantly correlated with rainfall, and the response was very quick at the permeable pavement site. The water level in the underground tank in the raingarden site increased at a relatively slow and flat rate because the rainfall flowed into the garden and soil first and was then directed to the storage tank. Notably, for the raingarden, the increases in the water level according to the simulations and observations were different, and this difference was likely due to the effect of antecedent soil moisture. If the soil was dry, then the increasing slope of the water level increased faster in the field than in the simulation. In addition to this effect, the simulated water level curve matched the observed curve.

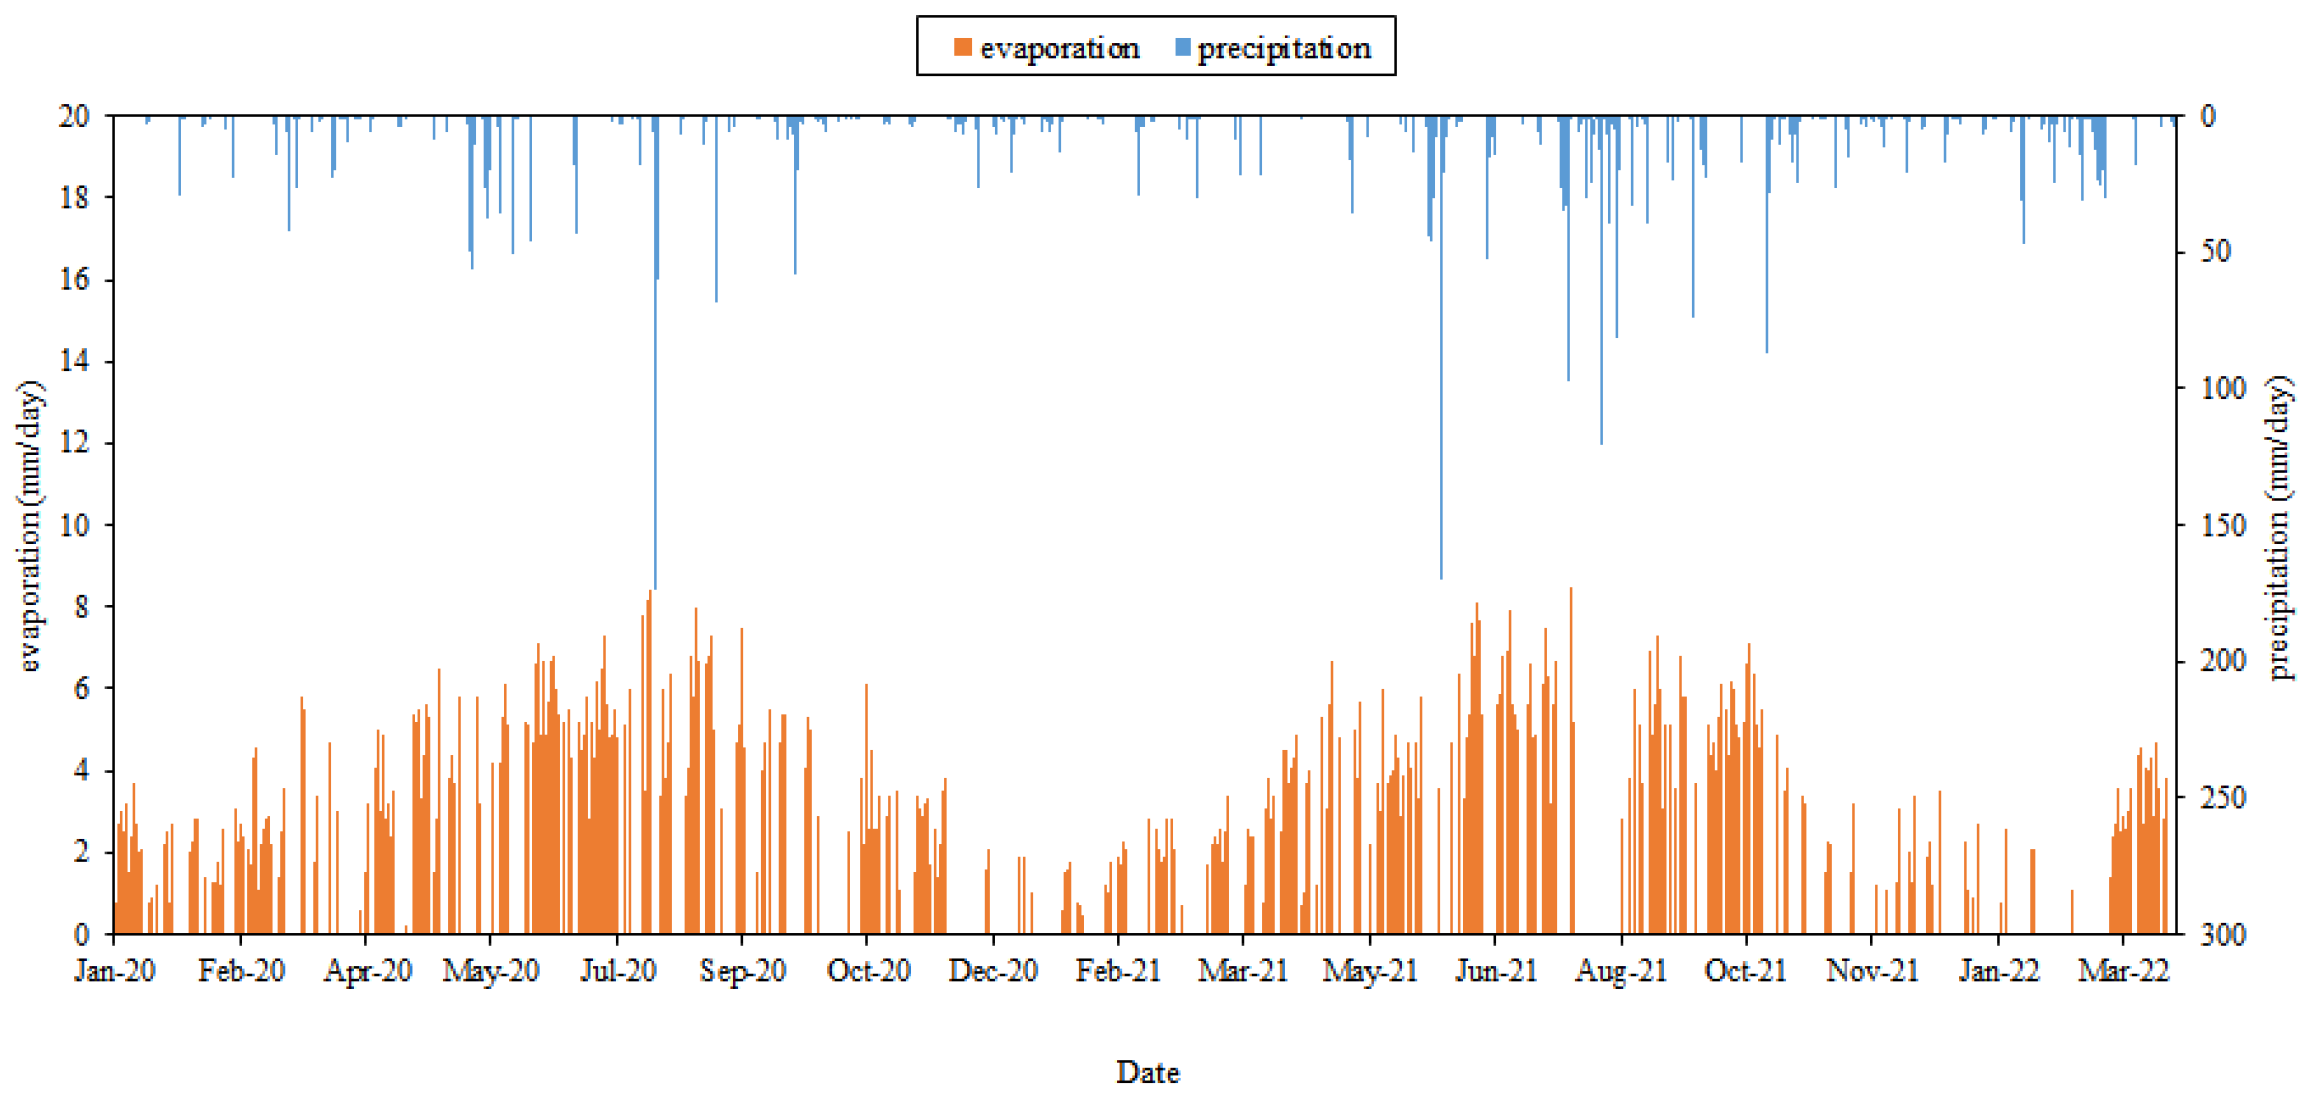
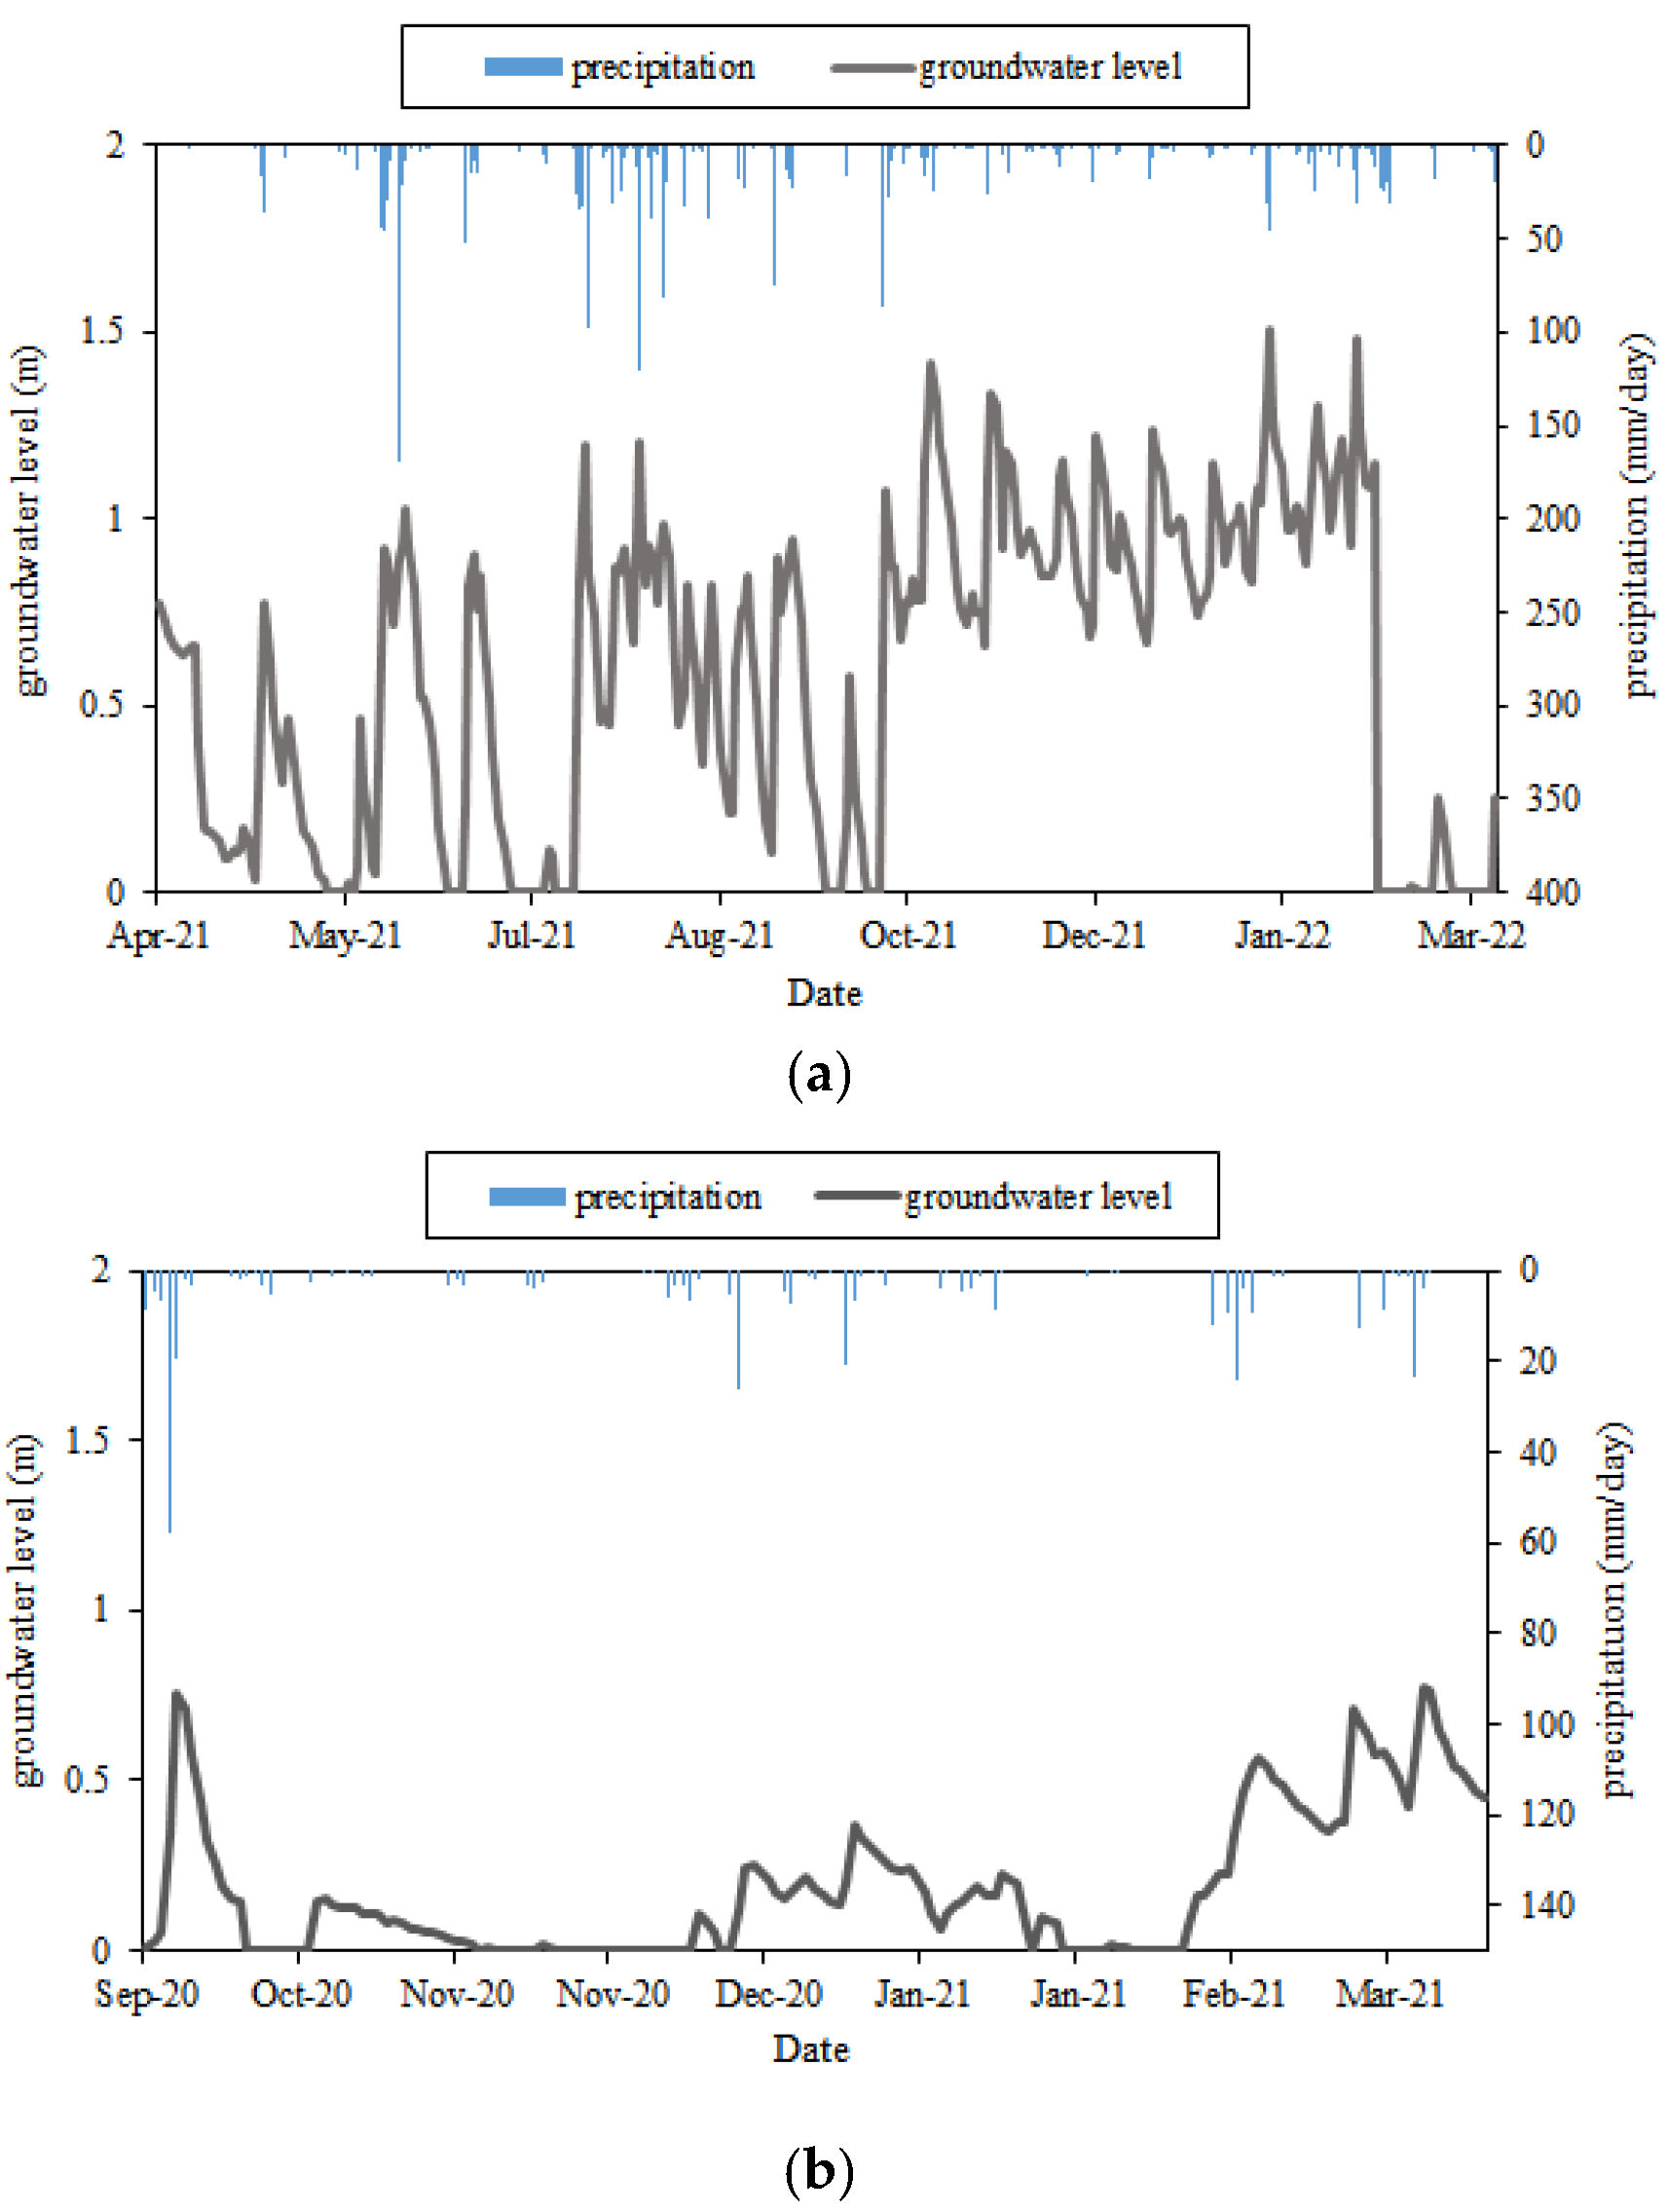
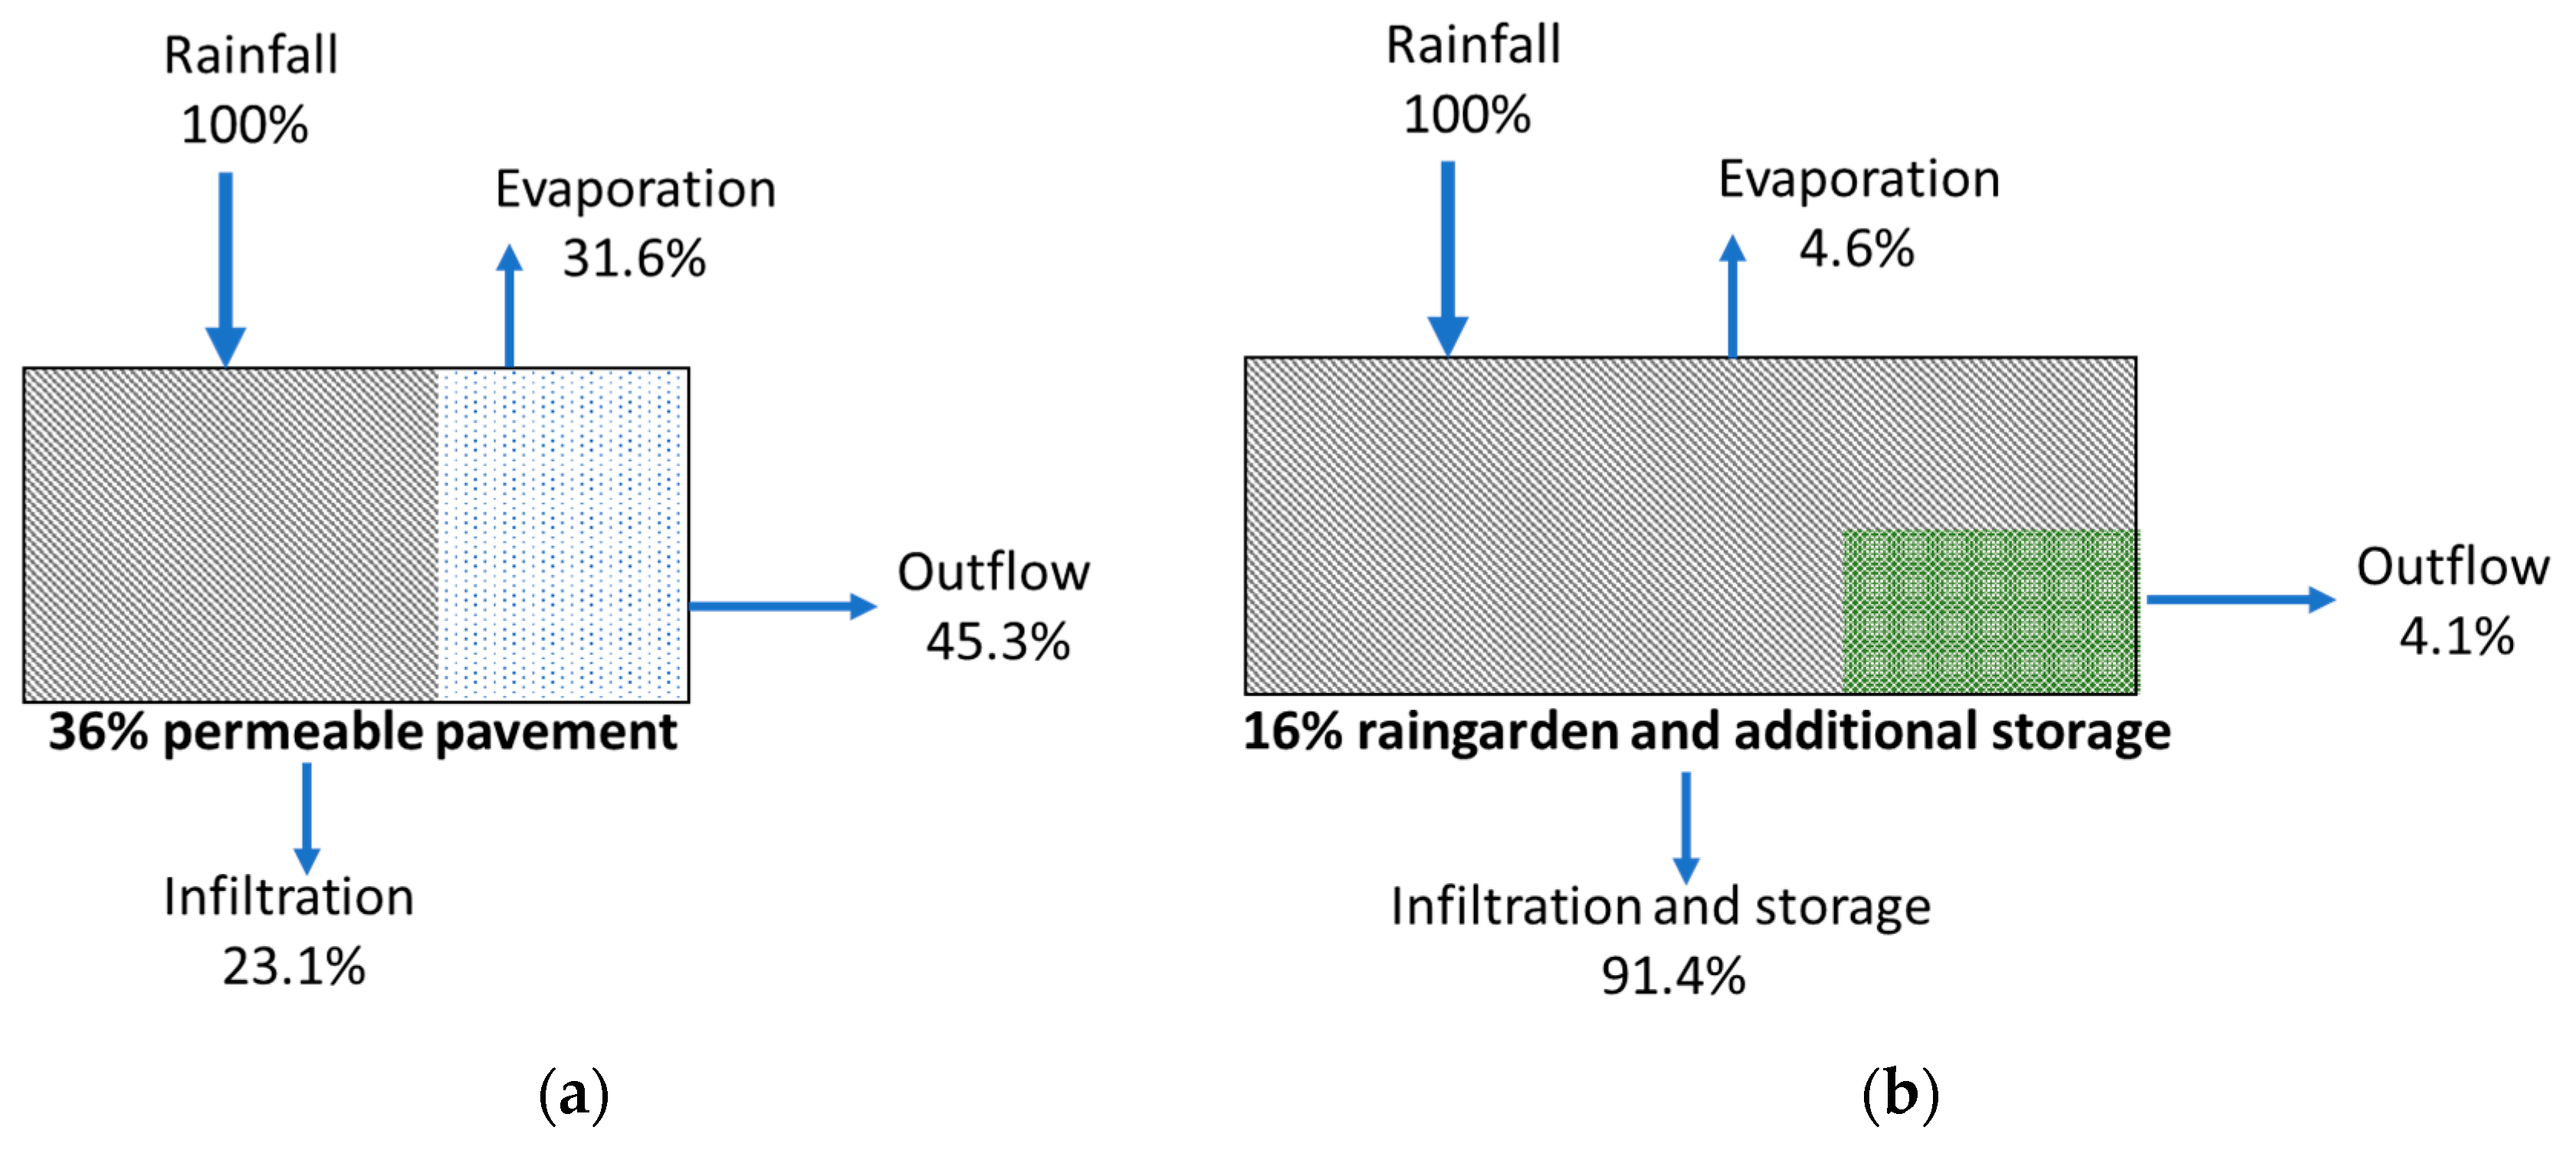
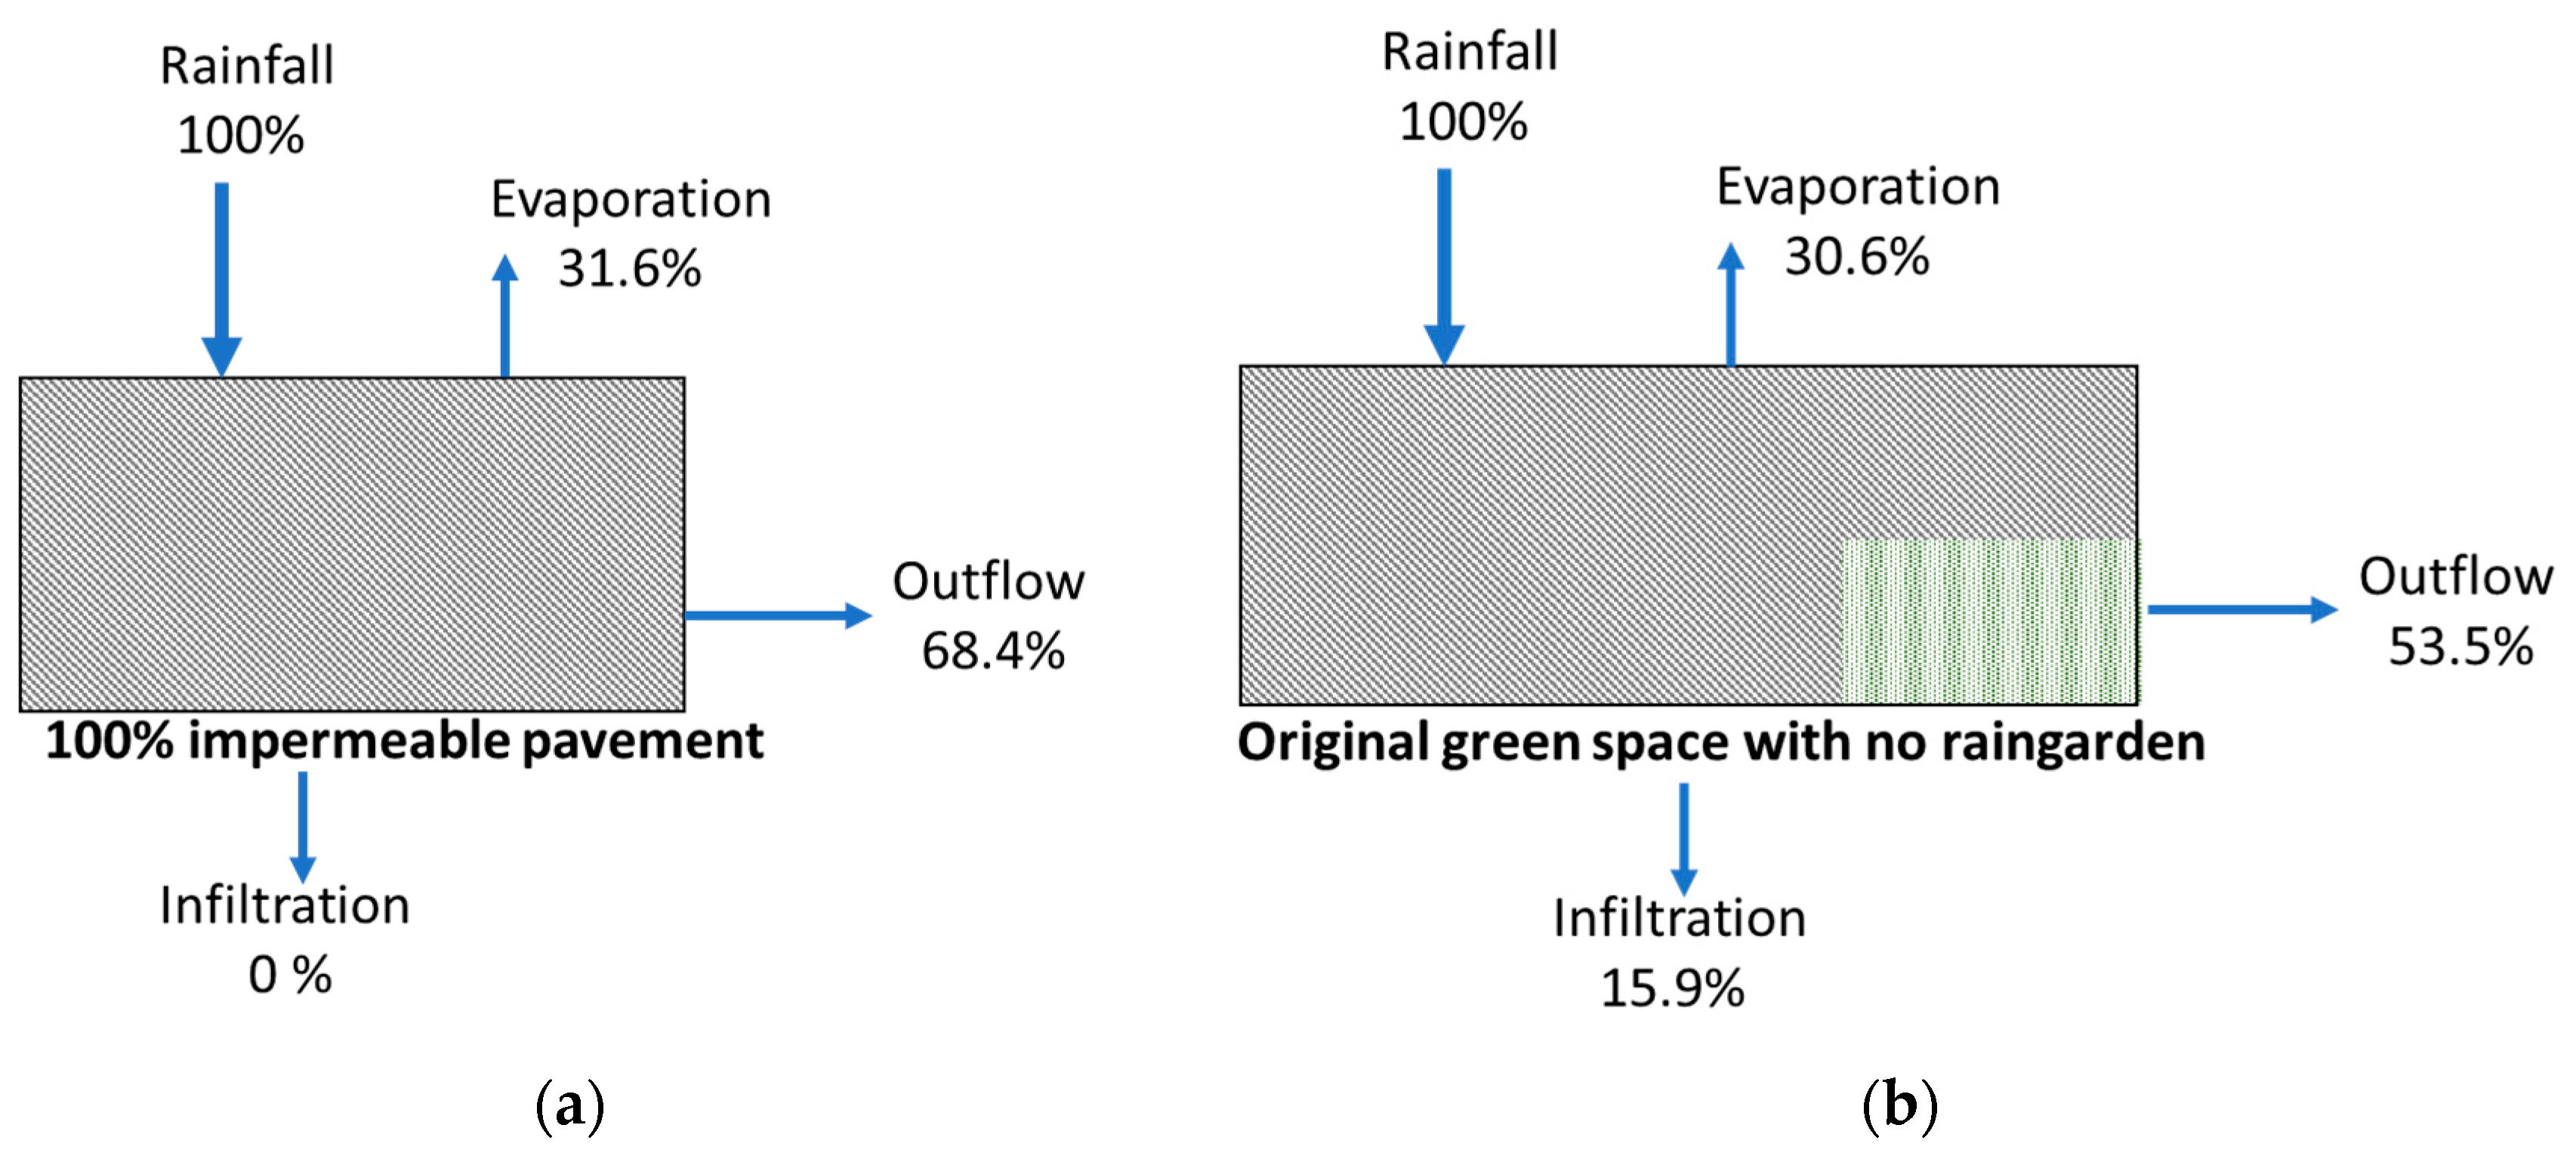
3.4. Annual Hydrological Cycles at the Permeable Pavement and Raingarden Sites in the Verified Model Simulations

The annual rainfall data and evaporation data associated with the monitoring period were input into the verified SWMM of the two sites. The results of the annual simulation are listed in Table 4. The verified SWMM showed that the annual hydrological cycle at the permeable pavement site involved 45.3% outflow, 31.6% evaporation, and 23.1% infiltration. At the raingarden site, which has an underground storage tank, the annual hydrological cycle mostly involved infiltration and storage, at 91.4%; the other parts of the cycle were 4.1% outflow and 4.6% evaporation. The annual hydrologic cycles of the two sites are depicted in Figure 8.
In subtropical regions, rainfall intensity is high, and the annual rainfall amount is substantial. In such abundant rainfall areas, permeable pavement and raingardens still perform well. In particular, permeable pavement is constructed to address infiltration but might not be able to infiltrate rainfall as quickly during large and intense rainfall events. However, in this study, according to the onsite monitoring, the infiltration rate was fast on permeable pavement, and the model simulations proved that approximately 23% of the annual rainfall could be infiltrated and recharge the groundwater. This performance was based on the permeable surface accounting for 36% of the entire drainage area. In this study, the annual evaporation rate was 31.6%, which was larger than the infiltration ratio. In high-temperature urban areas, high amounts of evaporation occur. However, the evaporation ratio might be slower than the current state if the ratio of the permeable surface increases because permeable pavement can store water underground and reduce the pavement temperature. Annual outflow accounted for 45.3% of the hydrological cycle at the permeable pavement site in this study. Without 36% permeable pavement, the model simulated a 100% impermeable pavement scenario that resulted in no infiltration, and the outflow increased to 68.4% (Figure 9a). This result shows that the flooding risk might be increasing.
The results at the raingarden site showed that 91.4% of the rainfall was stored at the site and only 4.1% flowed out. The raingarden included a storage tank, and the rainfall in the drainage area was retained unless heavy rain such as a typhoon occurred or the stored water was not pumped out and the storage volume decreased. If the raingarden and storage tank are removed and the area is returned to its original land cover, then the outflow would increase from 4.1% to 53.5%, and the infiltration would be reduced to 15.9% (Figure 9b). Notably, the evaporation ratio with the raingarden was very low, at only 4.6%. Theoretically, evaporation in the rain garden should account for a high percentage of the annual hydrology. The simulation results showed a low ratio of evaporation but a high ratio of infiltration and storage. The infiltration and storage of the LID module in the SWMM likely played dominant roles, and evaporation likely played a minor role, implying that most rainwater was retained in the soil and storage tank. Jennings et al. [15] also concluded that evaporation and evapotranspiration play minor roles in reducing runoff in raingardens. When the raingarden was removed from the model simulation, the evaporation ratio increased to 30.6%, which is similar to that at the other site (Figure 9b).

4. Conclusions

The observations and simulation results confirmed that permeable pavements and raingardens are beneficial for reducing runoff in a subtropical region. In abundant rainfall, LID can reduce runoff and with adequate storage volume, rainwater can become an irrigation water source. Compared with the cited studies that state that permeable pavement can reduce runoff by 27.7–65%, this study showed that the performance of the 1/3 permeable pavement site reduced runoff by approximately 20%. If the percentage of permeable pavement is increased, the runoff reduction rate is expected to be 60%, which is as good as the cited cases. The raingarden site in this study had a high level of water retention, which was over 90%, much higher than those in the cited cases. The excellent performance is because it had an underground storage tank. This design can increase storage volume and recycled rainwater as an irrigation source for gardens.
In addition to the observed hydrological cycle performances, the verified model provided an understanding of the annual hydrologic cycle. Without these LID facilities, the annual runoff at the permeable pavement site might increase from 45.3% to 68.4%, and that at the garden site might increase from 4.1% to 53.5%. The incremental increase in runoff would strengthen the loading of the drainage system and increase the neighborhood flooding risk. Another interesting finding from the simulations is the performance of evaporation. Evaporation cannot be presented in each rainfall event observation, but the model can show its contribution. The evaporation was 30% in the annual hydrological cycle at the permeable pavement site. However, a relatively low evaporation percentage, less than 5%, was found in the raingarden simulation. This might have been because of model limitations, and infiltration and storage dominated the runoff reductions in the raingarden; thus, the effect of evaporation became minor in the model simulations.
This study proved that with the high rainfall intensity and rainfall amount in subtropical regions, LID facilities can still perform as well as in other regions. The weather factors do not significantly affect the performance of LID practices. Rather, the infiltration rate at the sites plays a crucial role. The permeable pavement site was built in 2021, and the raingarden was built in 2019. The young LID facilities had good infiltration capacities. Once clogging occurs at the sites and the infiltration ability decreases, runoff will increase, and retention and groundwater recharge will decrease. The permeable pavement might experience clogging in the first 2–3 years, which leads to a reduction in permeability [30,31,32]. The sediment loads in locations affect the clogging level [33,34]; therefore, regular maintenance, such as sweeping and cleaning, is suggested [34].

Author Contributions

Conceptualization, C.-F.C. and J.-Y.L.; methodology, C.-F.C.; software, J.-W.L.; validation, C.-F.C. and J.-Y.L.; investigation, J.-W.L.; resources, J.-Y.L.; writing—original draft preparation, C.-F.C.; writing—review and editing, C.-F.C. and J.-Y.L.; visualization, J.-W.L.; supervision, J.-Y.L. All authors have read and agreed to the published version of the manuscript.

Funding

This research was funded by the Environmental Protection Administration, Executive Yuan, R.O.C. (Taiwan) and New Construction Office, Public Works Department, Taipei City government.

Institutional Review Board Statement

Not applicable.

Informed Consent Statement

Not applicable.

Data Availability Statement

Not applicable.

Conflicts of Interest

The authors declare no conflict of interest.

References

  1. Bae, C.; Lee, D.K. Effects of low-impact development practices for flood events at the catchment scale in a highly developed urban area. Int. J. Disaster Risk Reduct. 2020, 44, 101412. [Google Scholar] [CrossRef]
  2. de Macedo, M.B.; Gomes Júnior, M.N.; de Oliveira, T.R.P.; Giacomoni, M.H.; Imani, M.; Zhang, K.; do Lago, C.A.F.; Mendiondo, E.M. Low Impact Development practices in the context of United Nations Sustainable Development Goals: A new concept, lessons learned and challenges, Critical Reviews in Environmental Science and Technology. Crit. Rev. Environ. Sci. Technol. 2020, 52, 2538–2581. [Google Scholar] [CrossRef]
  3. US Environmental Protection Agency. Low Impact Development (LID). A Literature Review; EPA Office of Water: Washington, DC, USA, 2000.
  4. Fletcher, T.D.; Shuster, W.; Hunt, W.F.; Ashley, R.; Butler, D.; Arthur, S.; Trowsdale, S.; Barraud, S.; Semadeni-Davies, A.; Bertrand-Krajewski, J.L.; et al. SUDS, LID, BMPs, WSUD and more—The evolution and application of terminology surrounding urban drainage. Urban Water J. 2015, 12, 525–542. [Google Scholar] [CrossRef]
  5. Wong, T.H.F.; Allen, R.; Brown, R.R.; Deletic, A.; Fletcher, T.D.; Gangadharan, L.; Gernjak, W.; Jakob, C.; O’Loan, T.; Reeder, M.; et al. Stormwater Management in a Water Sensitive City: Blueprint 2012; The Centre for Water Sensitive Cities: Melbourne, Australia, 2012. [Google Scholar]
  6. Kato, H. The Trend in Measures Against Urban Inundation in Japan. J. Disaster Res. 2020, 16, 415–420. [Google Scholar] [CrossRef]
  7. Nguyen, T.T.; Ngo, H.H.; Guo, W.S.; Wang, X.C.C.; Ren, N.Q.; Li, G.B.; Ding, J.; Liang, H. Implementation of a specific urban water management—Sponge City. Sci. Total Environ. 2019, 652, 147–162. [Google Scholar] [CrossRef]
  8. Tirpak, R.A.; Winston, R.J.; Feliciano, M.; Dorsey, J.D.; Epps, T.H. Impacts of permeable interlocking concrete pavement on the runoff hydrograph: Volume reduction, peak flow mitigation, and extension of lag times. Hydrol. Process. 2021, 35, 14167. [Google Scholar] [CrossRef]
  9. Alyaseri, I.; Zhou, J. Stormwater Volume Reduction in Combined Sewer Using Permeable Pavement: City of St. Louis. Int. J. Environ. Eng. 2016, 142, 04016002. [Google Scholar] [CrossRef]
  10. Liu, Y.; Li, T.; Yu, L. Urban heat island mitigation and hydrology performance of innovative permeable pavement: A pilot-scale study. J. Clean. Prod. 2022, 244, 118938. [Google Scholar] [CrossRef]
  11. Shafique, M.; Kim, R.; Kyung-Ho, K. Rainfall Runoff Mitigation by Retrofitted Permeable Pavement in an Urban Area. Sustainability 2019, 10, 1231. [Google Scholar] [CrossRef] [Green Version]
  12. Cheng, Y.Y.; Lo, S.L.; Ho, C.C.; Lin, J.Y.; Yu, S.L. Field Testing of Porous Pavement Performance on Runoff and Temperature Control in Taipei City. Water 2019, 11, 2635. [Google Scholar] [CrossRef] [Green Version]
  13. Asleson, B.C.; Nestingen, R.S.; Gulliver, J.S.; Hozalski, R.M.; Nieber, J.L. Performance Assessment of Rain Gardens. J. Am. Water Resour. Assoc. 2009, 45, 1019–1031. [Google Scholar] [CrossRef]
  14. Sharma, R.; Malaviya, P. Management of stormwater pollution using green infrastructure: The role of rain gardens. Wiley Interdiscip. Rev. Water 2021, 8, e1507. [Google Scholar] [CrossRef]
  15. Jennings, A.A.; Berger, M.A.; Hale, J.D. Hydraulic and Hydrologic Performance of Residential Rain Gardens. J. Environ. Eng. 2015, 141, 04015033. [Google Scholar] [CrossRef]
  16. Bethke, G.M.; William, R.; Stillwell, A.S. Rain Garden Performance as a Function of Native Soil Parameters. J. Sustain. Water Built Environ. 2022, 8, 04021021. [Google Scholar] [CrossRef]
  17. Amur, A.; Wadzuk, B.; Traver, R. Analyzing the Performance of a Rain Garden over 15 Years: How Predictable Is the Rain Garden’s Response? In Proceedings of the International Low Impact Development Conference 2020, Bethesda, MD, USA, 20–24 July 2020. [Google Scholar]
  18. Nichols, W.; Welker, A.; Traber, R.; Tu, M.C. Modeling Seasonal Performance of Operational Urban Rain Garden Using HYDRUS-1D. J. Sustain. Water Built Environ. 2021, 7, 04021005. [Google Scholar] [CrossRef]
  19. Lee, J.M.; Hyun, K.H.; Choi, J.S. Analysis of the impact of low impact development on runoff from a new district in Korea. Water Sci. Technol. 2013, 68, 1315–1321. [Google Scholar] [CrossRef]
  20. Luan, Q.; Fu, X.; Song, C.; Wang, H.; Liu, J.; Wang, Y. Runoff effect evaluation of LID through SWMM in typical mountainous, low-lying urban areas: A case study in China. Water 2017, 9, 439. [Google Scholar] [CrossRef] [Green Version]
  21. Li, Q.; Wang, F.; Yu, Y.; Huang, Z.; Li, M.; Guan, Y. Comprehensive performance evaluation of LID practices for the sponge city construction: A case study in Guangxi, China. J. Environ. Manag. 2019, 231, 10–20. [Google Scholar] [CrossRef]
  22. Zhu, H.; Yu, M.; Zhu, J.; Cao, R. Simulation study on effect of permeable pavement on reducing flood risk of urban runoff. Int. J. Transp. Eng. 2019, 8, 373–382. [Google Scholar] [CrossRef]
  23. Goncalves, M.L.; Zischg, J.; Rau, S.; Sitzmann, M.; Rauch, W.; Kleidorfer, M. Modeling the effects of introducing low impact development in a tropical city: A case study from Joinville. Sustainability 2018, 10, 728. [Google Scholar] [CrossRef] [Green Version]
  24. Turco, M.; Brunetti, G.; Carbone, M.; Piro, P. Modelling the hydraulic behaviour of permeable pavements through a reservoir element model. Hydrol. Water Resour. 2018, 18, 507–514. [Google Scholar]
  25. Carbone, M.; Turco, M.; Nigro, G.; Piro, P. Modeling of hydraulic behaviour of green roof in catchment scale. In Proceedings of the 14th International Multidisciplinary Scientific GeoConference SGEM 2014, Albena, Bulgariab, 17–26 June 2014; pp. 471–478. [Google Scholar]
  26. Baek, S.S.; Ligaray, M.; Pyo, J.; Park, J.P.; Kang, J.H.; Pachepsky, Y.; Chun, J.A.; Cho, K.H. A novel water quality module of the SWMM model for assessing low impact development (LID) in urban watersheds. J. Hydrol. 2020, 586, 1124886. [Google Scholar] [CrossRef]
  27. Lin, J.Y.; Yuan, T.C.; Chen, C.F. Water Retention Performance at Low-Impact Development (LID) Field Sites in Taipei, Taiwan. Sustainability 2021, 13, 759. [Google Scholar] [CrossRef]
  28. Rossman, L.A. Storm Water Management Model User’s Manual Version 5.1; U.S. Environmental Protection Agency: Cincinnati, OH, USA, 2015.
  29. Moriasi, D.N.; Arnold, J.G.; Van Liew, M.W.; Bingner, R.L.; Harmel, R.D.; Veith, T.L. Model evaluation guidelines for systematic quantification of accuracy in watershed simulations. Trans. ASABE 2007, 50, 885–900. [Google Scholar] [CrossRef]
  30. Cui, X.; Zhang, J.; Huang, D.; Tang, W.; Wang, L.; Hou, F. Experimental simulation of rapid clogging process of pervious concrete pavement caused by storm water runoff. Int. J. Pavement Eng. 2019, 20, 24–32. [Google Scholar] [CrossRef]
  31. Ma, Y.; Chen, X.; Geng, Y.; Zhang, X. Effect of clogging on the permeability of porous asphalt pavement. Adv. Mater. Sci. Eng. 2020, 2020, 4851291. [Google Scholar] [CrossRef] [Green Version]
  32. Razzaghmanesh, M.; Beecham, S. A Review of Permeable Pavement Clogging Investigations and Recommended Maintenance Regimes. Water 2018, 10, 337. [Google Scholar] [CrossRef] [Green Version]
  33. Pezzaniti, D.; Beecham, S.; Kandasamy, J. Influence of clogging on the effective life of permeable pavements. In Proceedings of the Institution of Civil Engineers-Water Management; Thomas Telford Ltd.: London, UK, 2009; Volume 162, pp. 211–220. [Google Scholar]
  34. Kia, A.; Wong, H.S.; Cheeseman, C.R. Clogging in permeable concrete: A review. J. Environ. Manag. 2017, 193, 221–233. [Google Scholar] [CrossRef]
Figure 1. Flowchart of this study.
Land 11 00951 g001
Figure 2. The studied permeable pavement site. (A) Site photo and (B) sketch of the site area.
Land 11 00951 g002
Figure 3. The studied raingarden site. (A) Site photo and (B) sketch of the site area.
Land 11 00951 g003aLand 11 00951 g003b
Figure 4. Precipitation and evaporation data from 2020 to 2022 in Taipei.
Land 11 00951 g004
Figure 5. Groundwater level at (a) the permeable pavement site and (b) the raingarden site. The rising groundwater level with rainfall implied the recharge potential of the sites, but the groundwater level was also affected by the area outside the site such that the actual recharge amount could not be obtained by the measurement.
Land 11 00951 g005
Figure 6. Five different rainfall events were used for model calibration and verification at the permeable pavement site.
Land 11 00951 g006aLand 11 00951 g006b
Figure 7. Five different rainfall events used for model calibration and verification at the raingarden site.
Land 11 00951 g007aLand 11 00951 g007b
Figure 8. Annual hydrologic cycle at the two field sites. (a) Permeable pavement site; (b) raingarden site.
Land 11 00951 g008
Figure 9. Annual hydrologic cycles of the two field sites without LID facilities. (a) Site without permeable pavement; (b) site without a raingarden and storage tank.
Land 11 00951 g009
Table 1. Observed rainfall events at the permeable pavement site.
Date (yy/mm/dd)Rainfall (mm)Rainfall (m3)Outflow (m3)Reduction Rate (%)
2021/3/2422.013.510.522.8
2021/4/28–2951.431.62617.7
2021/5/57.44.63.230.8
2021/5/2413.28.16.816.5
2021/05/30–3143.827.024.011.0
2021/5/3146.228.425.79.7
2021/6/13018.516.411.0
2021/6/4–6181111.4105.95.0
2021/6/2245.227.823.415.8
2021/6/23–2422.213.711.217.7
2021/6/2513.88.56.820.2
2021/7/21–24189.6116.7100.014.3
2021/7/3130.618.815.816.0
2021/8/224.415.012.814.8
2021/8/6–7133.482.170.813.8
2021/8/1039.824.521.910.4
2021/8/1381.650.247.65.2
2021/8/1419.612.110.413.9
2021/8/1933.220.418.310.6
2021/8/2539.824.521.711.4
2021/9/217.410.79.115.3
2021/9/423.414.412.314.7
2021/9/11–1274.846.041.010.9
2021/9/16148.67.611.5
2021/9/1722.613.912.510.4
2021/10/11710.59.310.9
2021/10/11–13115.471.061.812.9
2021/10/21–2221.613.310.024.8
2021/10/23–253320.315.523.7
2021/11/824.815.313.412.1
2021/11/12–1319.411.910.016.2
2021/11/25–2715.89.77.820.2
2021/12/6–722.613.911.021.0
2021/12/21–2224.615.112.716.4
2022/1/21–2230.819.016.214.4
2022/1/2246.628.725.012.9
2022/2/327.216.713.718.0
2022/2/13–1445.427.924.512.3
2022/2/19–23117.872.566.97.8
2022/3/6–718.411.39.714.1
2022/3/22–2320.412.611.012.5
Average44.427.324.414.7
Table 2. Observed rainfall events at the raingarden site.
Date (yy/mm/dd)Rainfall (mm)Rainfall (m3)Outflow (m3)Reduction Rate (%)
2020/1/26–2731.011.20.0100.0
2020/2/1616.55.90.0100.0
2020/3/418.06.50.0100.0
2020/3/9–1048.517.50.0100.0
2020/3/1319.06.80.0100.0
2020/3/2722.58.10.0100.0
2020/3/2820.07.20.0100.0
2020/5/21–23116.541.90.299.6
2020/5/27–2864.523.20.0100.0
2020/6/1–239.014.02.482.6
2020/6/751.018.40.0100.0
2020/6/1446.016.60.994.5
2020/7/118.56.70.0100.0
2020/7/243.015.50.0100.0
2020/7/2818.06.50.0100.0
2020/8/3179.564.65.192.2
2020/8/460.021.61.593.1
2020/8/22–2313.54.90.0100.0
2020/8/2768.524.70.0100.0
2020/9/24–2513.54.90.0100.0
2020/9/26–2758.521.10.0100.0
2020/9/2819.57.00.0100.0
2020/12/8–930.511.00.0100.0
2020/12/2320.57.40.0100.0
Average43.215.60.498.4
Table 3. The model parameters of the LID facilities used in the SWMM.
ParametersPermeable Pavement Site Raingarden SiteUnitData Sources
Layer Surface
Berm height0550mmactual value
Surface roughness0.0110.24-calibrated value
Surface slope0.921%actual value
Layer Pavement
Thickness240X *mmactual value
Void ratio0.17X-actual value
Impervious surface fraction0.01X-actual value
Permeability10.9Xmm/hcalibrated value
Layer Soil
Thickness40300mmactual value
Porosity0.40.3volume fractionactual value
Conductivity0.50.4mm/hcalibrated value
Suction head3.53.5mmcalibrated value
Layer Storage
ThicknessX250mmactual value
Void ratioX0.3-actual value
Seepage rateX0.5mm/hcalibrated value
* The raingarden had no pavement layer, and the permeable pavement site had no storage layer.
Table 4. Simulation results of the annual water performance at the two field sites.
Field SitesYearRainfall (mm)Evaporation (mm)Outflow (mm)Infiltration (mm)
Permeable pavement site20212095.2662.06948.49484.48
Raingarden site20201308.559.7253.051195.73
(infiltration and storage)
Publisher’s Note: MDPI stays neutral with regard to jurisdictional claims in published maps and institutional affiliations.

