
Evaluation and Improvement Measures of the Runoff Coefficient of Urban Parks for Sustainable Water Balance


Abstract
:1. Introduction
2. Experimental Materials and Methods
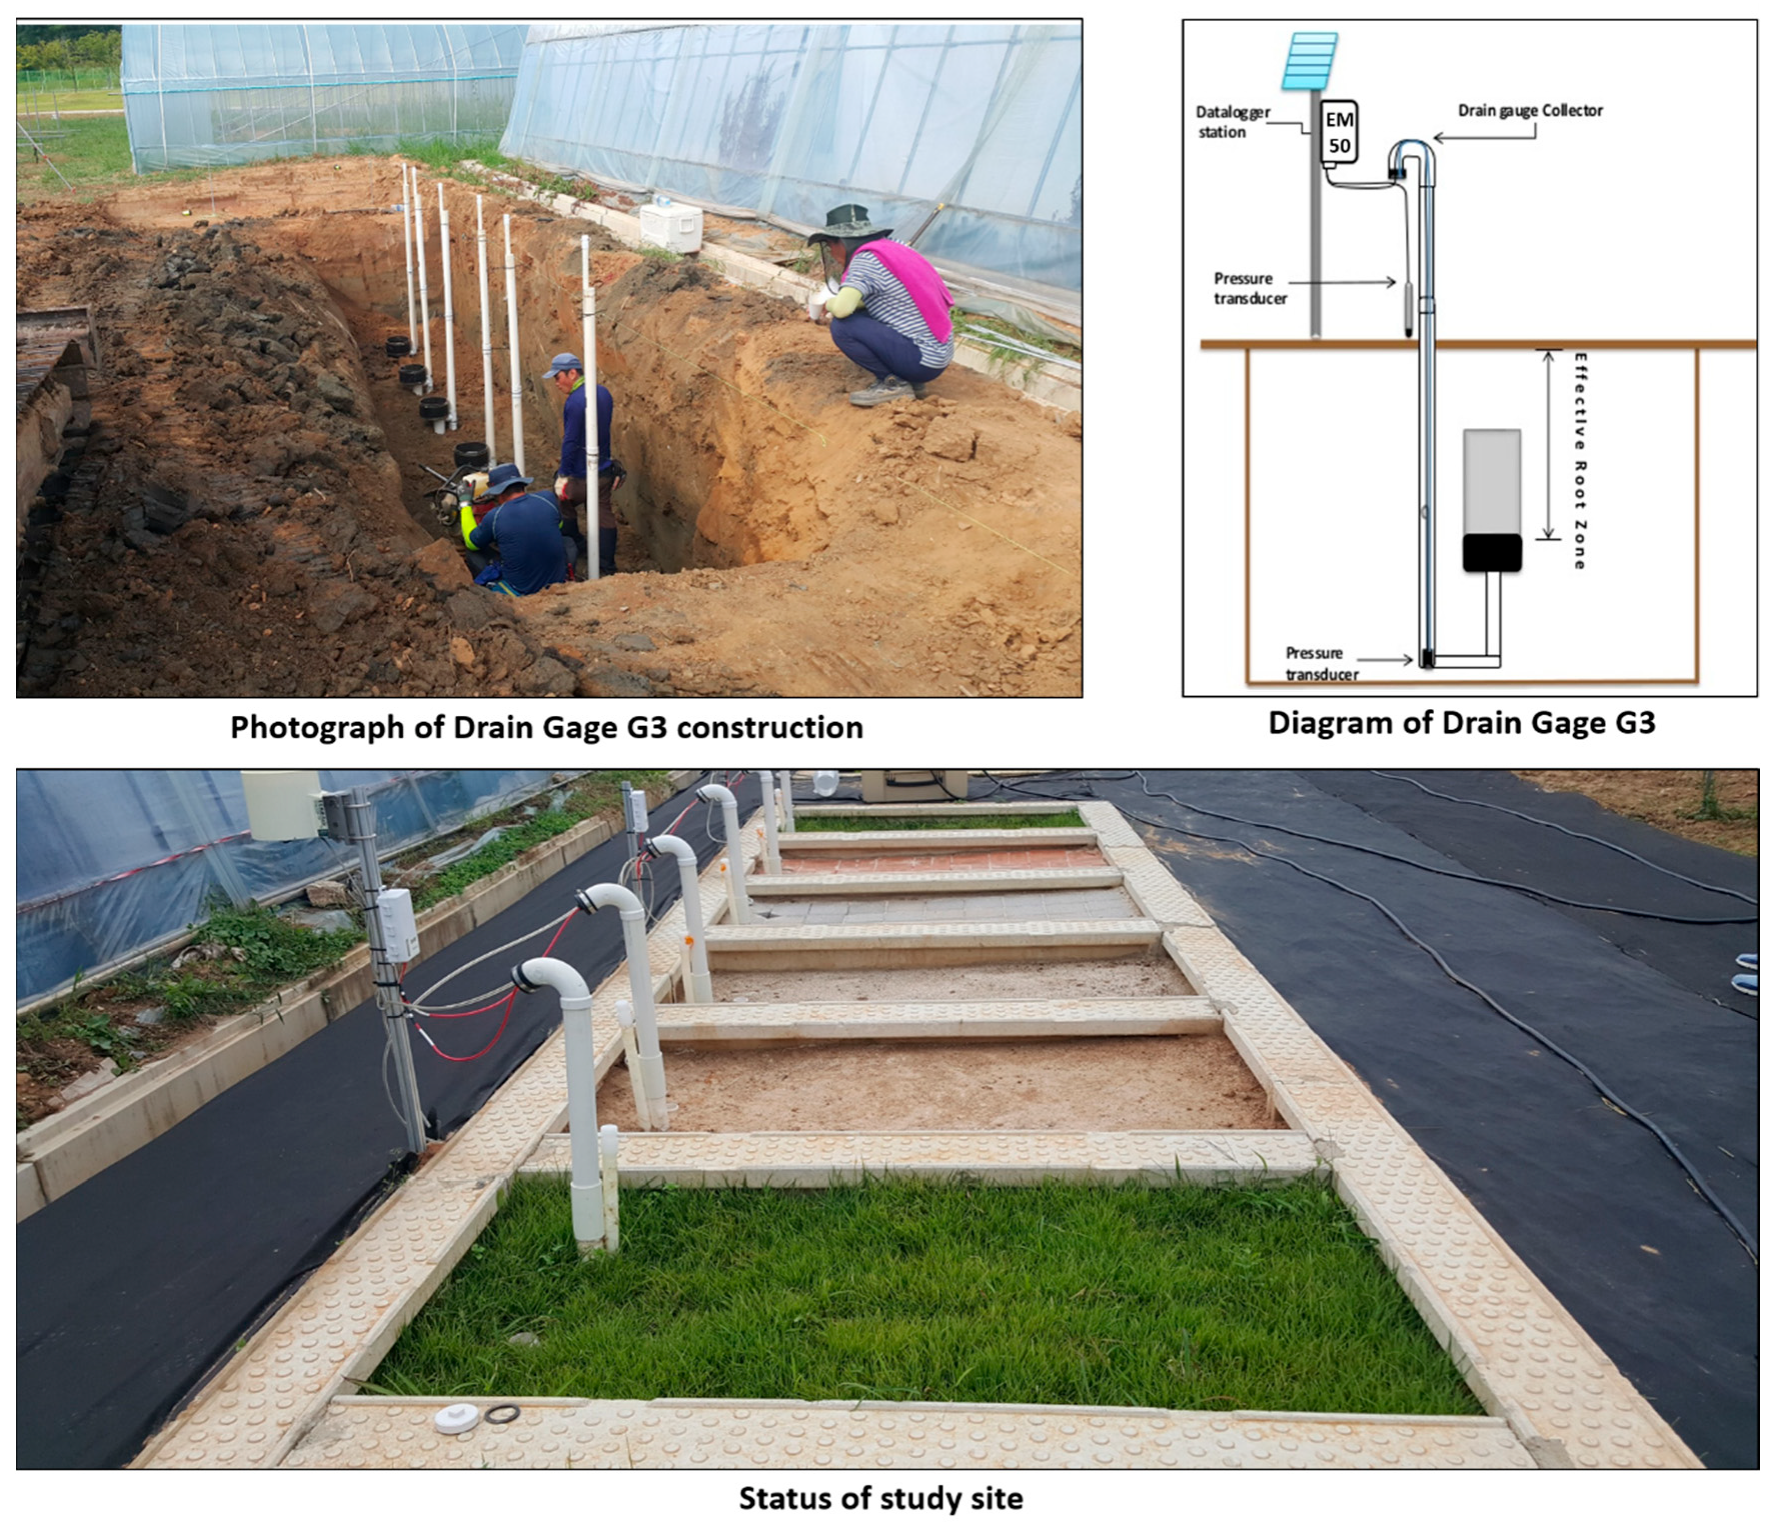
2.1. Test for Measuring the Groundwater Infiltration Rate
2.2. Method for Calculating the Groundwater Infiltration Rate and Runoff Coefficient
2.3. Interpretation of the Water Balance in Urban Parks
3. Results
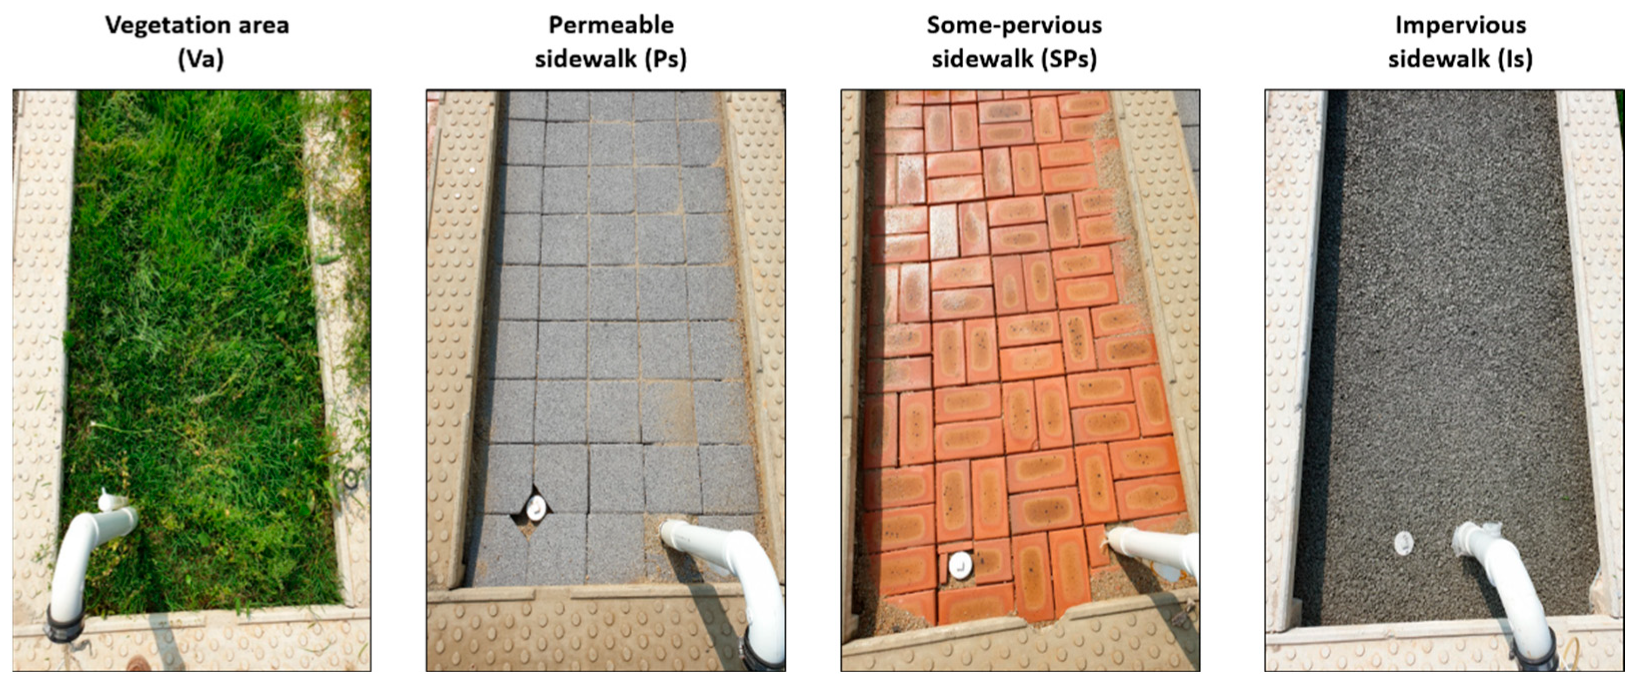
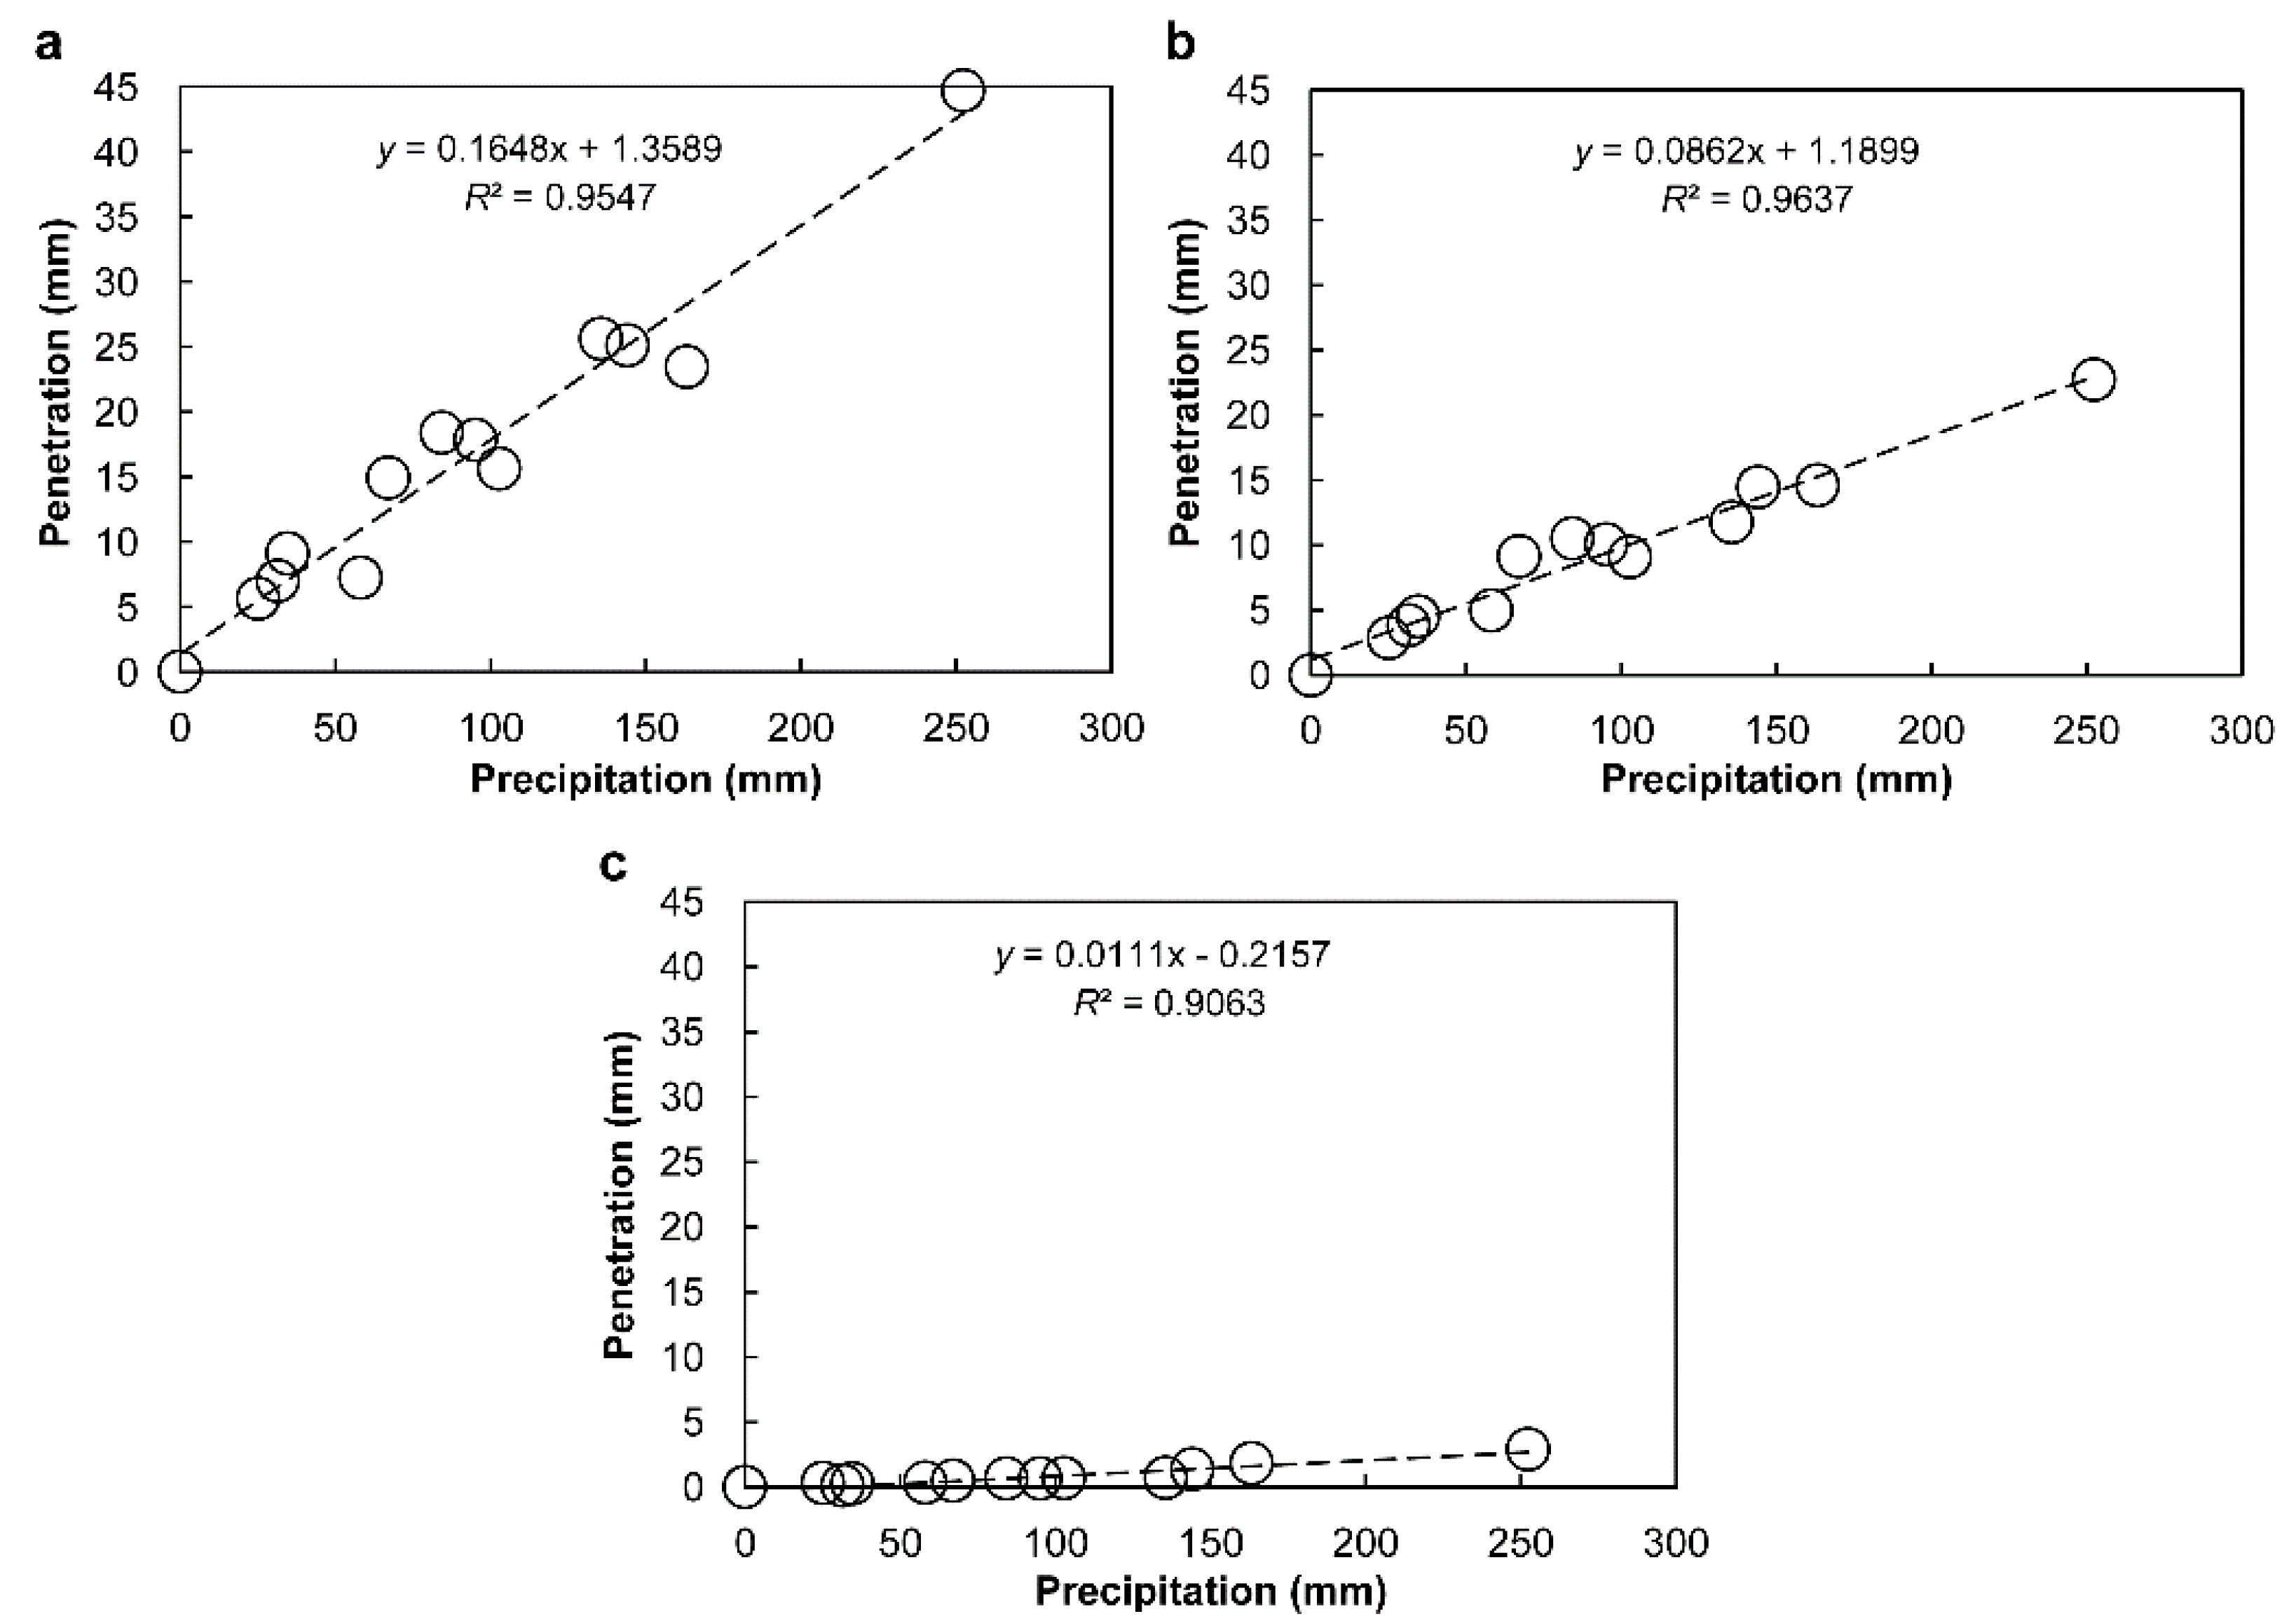
3.1. Analyzing the Groundwater Infiltration Rate per Sidewalk Material
3.2. Calculating the Runoff Coefficient According to the Land Cover Types
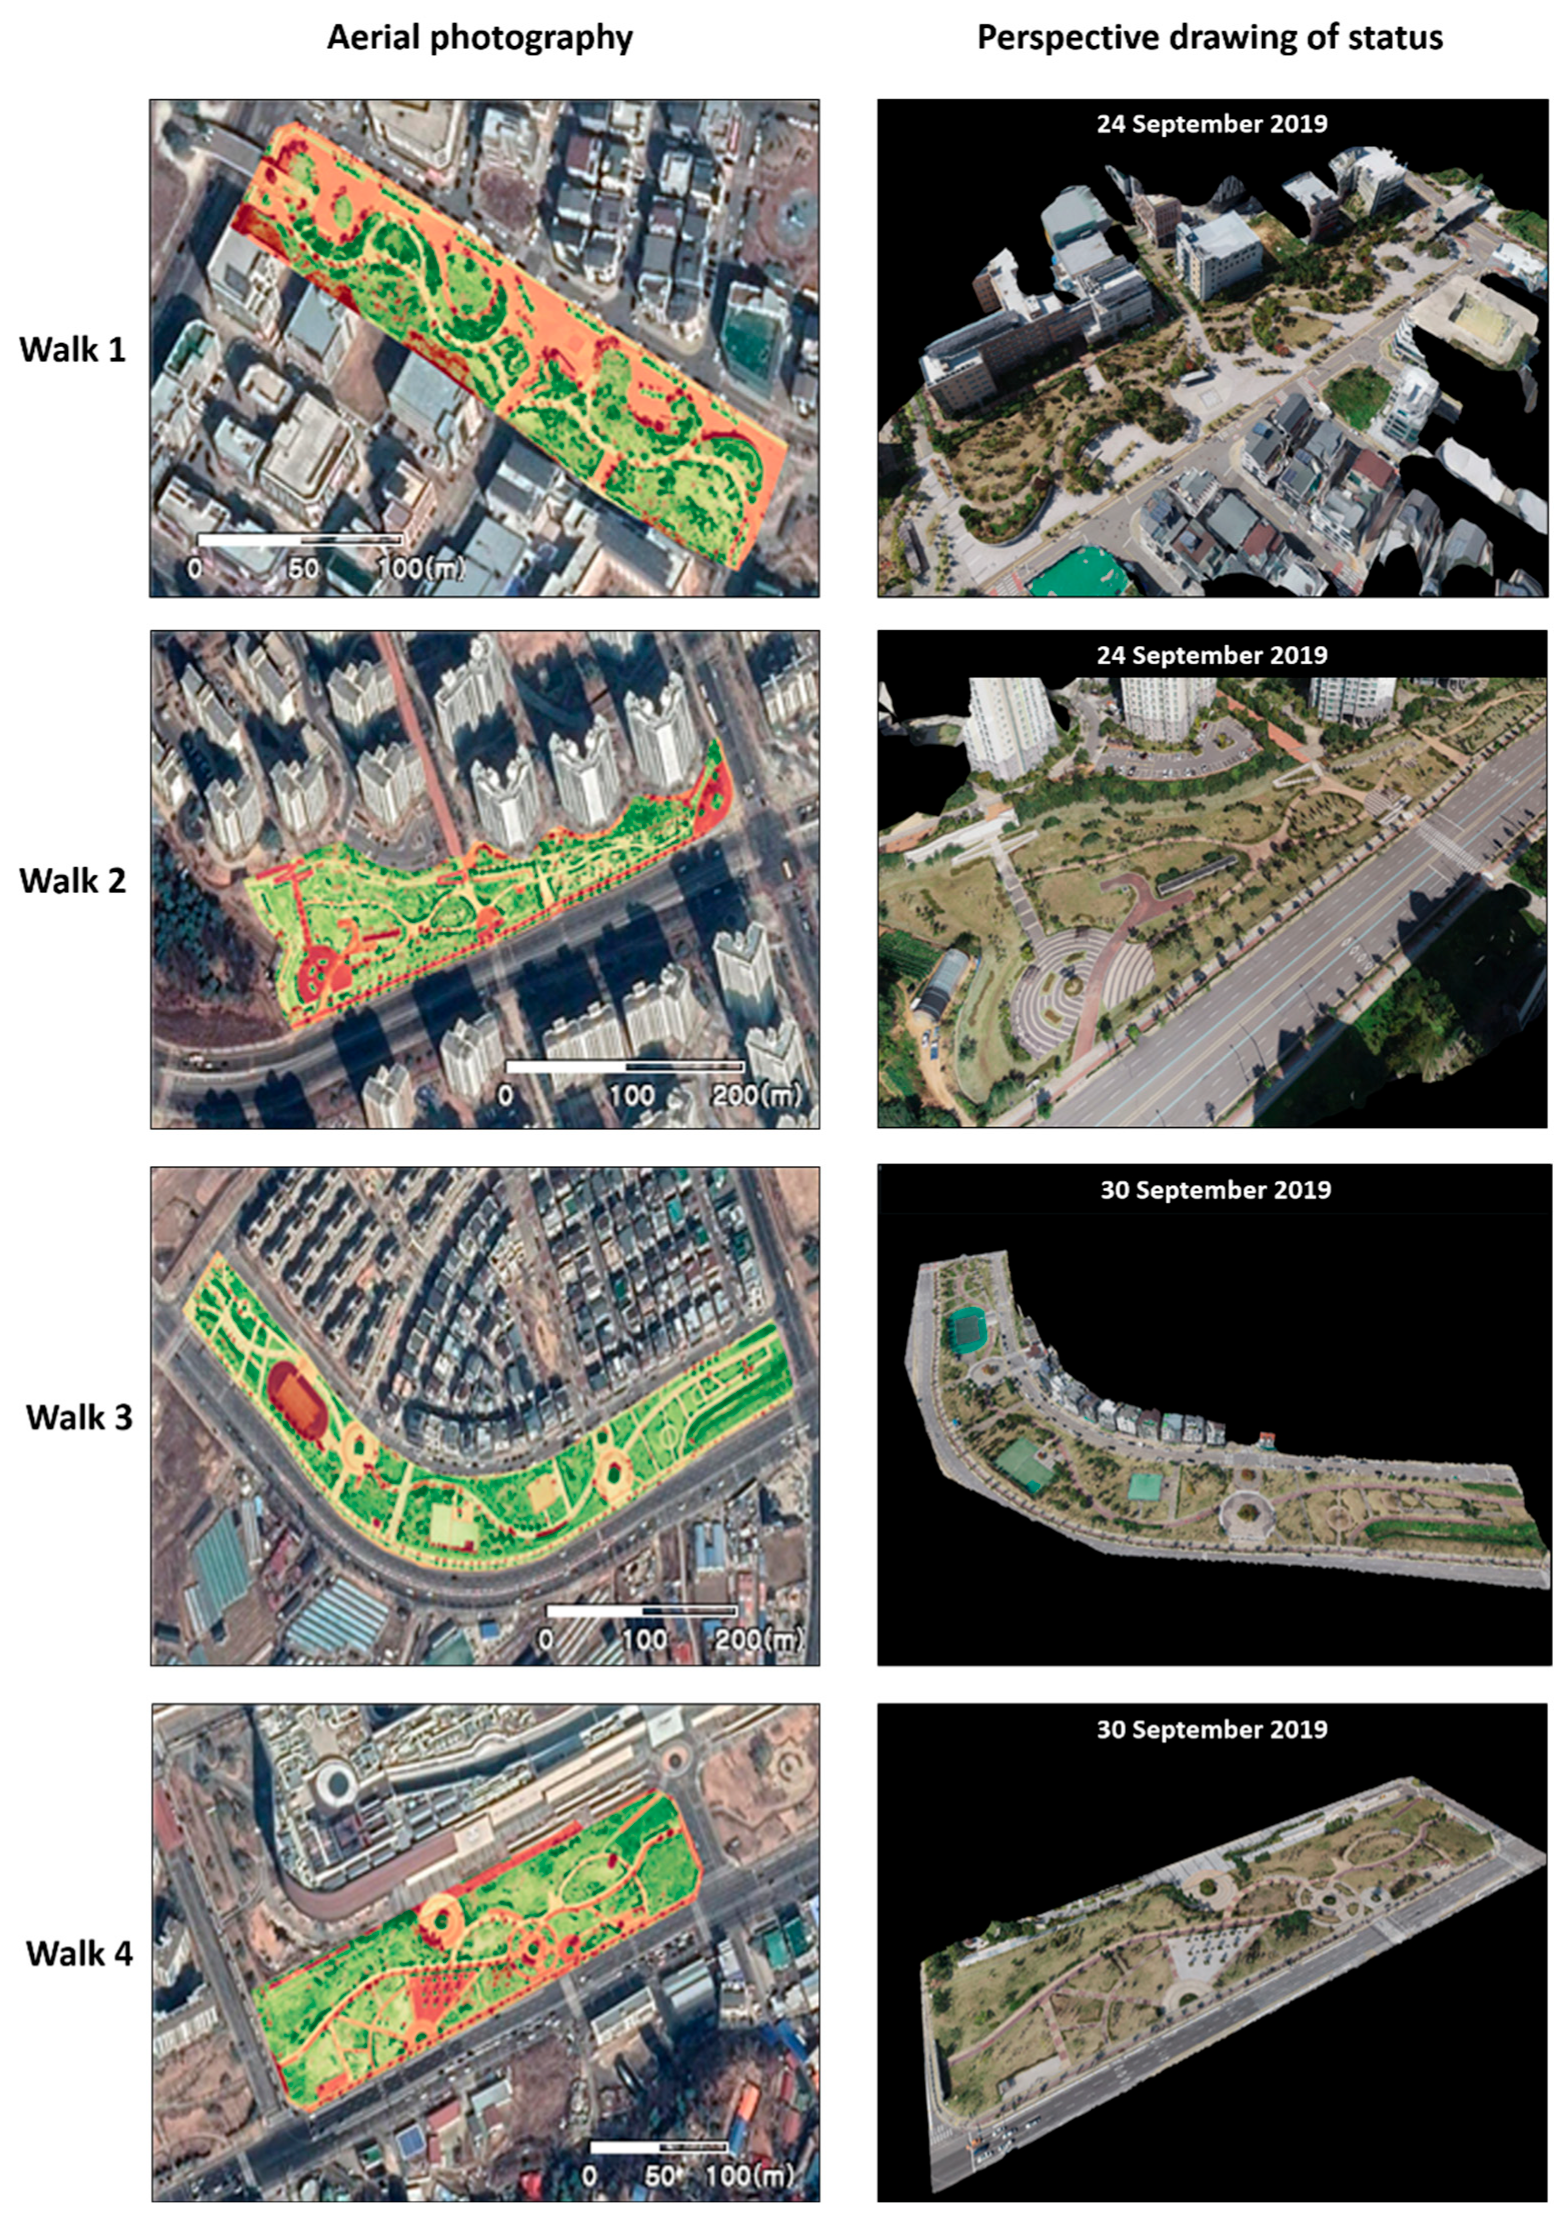
3.3. Analyzing the Land Cover Forms of Urban Parks
3.4. Analyzing the Water Balance by Applying the Runoff Coefficient to Urban Park Land Cover Types
4. Conclusions and Discussion
Author Contributions
Funding
Institutional Review Board Statement
Informed Consent Statement
Data Availability Statement
Acknowledgments
Conflicts of Interest
Appendix A

| Item | Seoul | Paju | Incheon | Average | ||||||
| 2016 | 2017 | 2018 | 2016 | 2017 | 2018 | 2016 | 2017 | 2018 | ||
| January | 1.0 | 14.9 | 8.5 | 1.0 | 12.8 | 6.6 | 2.8 | 20.4 | 4.8 | 8.09 |
| February | 47.6 | 11.1 | 29.6 | 65.9 | 21.4 | 52.1 | 43.1 | 24.7 | 46.3 | 37.98 |
| March | 40.5 | 7.9 | 49.5 | 57.4 | 4.1 | 48.8 | 44.1 | 1.20 | 94.6 | 38.68 |
| April | 76.8 | 61.6 | 130.3 | 89.3 | 65.7 | 131.2 | 80.8 | 57.0 | 101.5 | 88.24 |
| May | 160.5 | 16.1 | 222 | 157.7 | 44.2 | 162.9 | 148.5 | 22.1 | 134 | 118.67 |
| June | 54.2 | 66.6 | 171.5 | 28.3 | 112.1 | 201.5 | 17.7 | 164.7 | 256.1 | 119.19 |
| July | 358.2 | 621 | 185.6 | 378.2 | 294.9 | 123.1 | 302.3 | 363 | 36.7 | 295.89 |
| August | 49.8 | 297 | 202.6 | 24.2 | 318 | 97.9 | 12.2 | 249.9 | 234.8 | 165.16 |
| September | 50.5 | 35 | 68.5 | 34.1 | 23.9 | 78.9 | 48.8 | 26.8 | 93.9 | 51.16 |
| October | 74.3 | 26.5 | 120.5 | 249.2 | 10.2 | 44.8 | 77.8 | 17.1 | 48.5 | 74.32 |
| November | 16.2 | 40.7 | 79.1 | 15.6 | 17 | 50.5 | 18.4 | 47.6 | 79 | 40.46 |
| December | 62.1 | 34.8 | 16.4 | 63.0 | 23.5 | 0 | 67.8 | 34.2 | 4.2 | 34.00 |
| Total | 991.70 | 1233.2 | 1284.1 | 1163.9 | 947.8 | 998.3 | 864.30 | 1028.7 | 1134.4 | 1071.8 |
References
- Kim, K.S. Problems and policy direction in national land development. Archit. Res. 1993, 37, 18–22. [Google Scholar]
- Gholami, V.; Mohseni Saravi, M.; Ahmadi, H. Effects of impervious surfaces and urban development on runoff generation and flood hazard in the Hajighoshan watershed. Casp. J. Environ. Sci. 2010, 8, 1–12. [Google Scholar]
- Lee, H.Y. The construction and application of planning support system for the sustainable urban development. J. Korean Geogr. Soc. 2007, 42, 133–155. [Google Scholar]
- Haase, D.; Nuissl, H. The urban-to-rural gradient of land use change and impervious cover: A long-term trajectory for the city of Leipzig. J. Land Use Sci. 2010, 5, 123–141. [Google Scholar] [CrossRef]
- Lee, H.J. Impact of Urbanization on Environment: Focusing on CO2 Emissions. Master’s Thesis, Graduate School of Urban Engineering University of Seoul, Seoul, Korea, 2013. Available online: http://dcollection.uos.ac.kr/public_resource/pdf/000000019475_20210628155833.pdf (accessed on 3 May 2022).
- Soon, H.J.; Kim, H.J. A research on the application of eco city model for sustainable city development—Focusing on the comparison analysis of cases between domestic and overseas eco cities. Korea Real Estate Acad. 2014, 59, 217–230. Available online: http://www.reacademy.org/rboard/data/krea2_new/59_17.pdf (accessed on 3 May 2022).
- Lee, J.M.; Lee, Y.S.; Choi, J.S. Analysis of water cycle effect according to application of lid techniques. J. Wetl. Res. 2014, 16, 411–421. [Google Scholar] [CrossRef]
- Kauffman, G.J.; Brant, T. The role of impervious cover as a watershed-based zoning tool to protect water quality in the Christina River Basin of Delaware, Pennsylvania, and Maryland. In Proceedings of the Water Environment Federation, Anaheim, CA, USA, 14–18 October 2000; pp. 1656–1667. [Google Scholar] [CrossRef]
- Hedblom, M.; Knez, I.; Ode Sang, Å.; Gunnarsson, B. Evaluation of natural sounds in urban greenery: Potential impact for urban nature preservation. R. Soc. Open Sci. 2017, 4, 170037. [Google Scholar] [CrossRef] [PubMed] [Green Version]
- Kim, H.; Kim, Y.S.; Lee, D.S.; Kim, J.Y. Evaluation of supply adequacy of park service in Suwon-si by urban park catchment area analysis. J. Korean Inst. Landsc. Archit. 2015, 43, 114–124. [Google Scholar] [CrossRef] [Green Version]
- Kim, H.J.; Jang, C.H.; Noh, S.J. Development and application of the catchment hydrologic cycle assessment tool considering urbanization (i)—Model development. J. Korea Water Resour. Assoc. 2012, 45, 203–215. [Google Scholar] [CrossRef] [Green Version]
- Mantas, V.M.; Marques, J.C.; Pereira, A.J.S.C. A geospatial approach to monitoring impervious surfaces in watersheds using landsat data (the Mondego Basin, Portugal as a case study). Ecol. Indic. 2016, 71, 449–466. [Google Scholar] [CrossRef]
- Kim, H.; Kang, E.J.; Cho, J.H. An evaluation on management types by characteristics of urban parks. J. Korean Inst. Landsc. Archit. 2010, 38, 21–30. [Google Scholar]
- Kim, S.H. A Study on the Stormwater Green Infrastructure Strategy for the Sound Hydrological Cycle Management in Urban Areas. Ph.D. Thesis, Seoul National University, Seoul, Korea, 2014. Available online: https://dcollection.snu.ac.kr/public_resource/pdf/000000018392_20210628161647.pdf (accessed on 3 May 2022).
- Schueler, T.R. The importance of imperviousness. Watershed Prot. Tech. 1994, 1, 100–111. [Google Scholar]
- Weng, Q. Remote sensing of impervious surfaces in the urban areas: Requirements, methods, and trends. Remote Sens. Environ. 2012, 117, 34–49. [Google Scholar] [CrossRef]
- Seoul Metropolitan Government. Seoul Report: Environment of Seoul. Available online: http://news.seoul.go.kr/snap/doc.html?fn=5274b11d0b4b13.76553084.pdf&rs=/wp-content/blogs.dir/25/files/2013/11/ (accessed on 1 January 2022).
- Burns, M.J.; Fletcher, T.D.; Walsh, C.J.; Ladson, A.R.; Hatt, B.E. Hydrologic shortcomings of conventional urban stormwater management and opportunities for reform. Landsc. Urban Plan. 2012, 105, 230–240. [Google Scholar] [CrossRef]
- Ma, Q.; He, C.; Wu, J. Behind the rapid expansion of urban impervious surfaces in China: Major influencing factors revealed by a hierarchical multiscale analysis. Land Use Policy 2016, 59, 434–445. [Google Scholar] [CrossRef]
- Jeoung, J.H.; Park, S.K. Calculation of Pumping Rate Considering the Change of Groundwater Level. Korean Natl. Comm. Irrig. Drain. J. 2003, 10, 80–88. Available online: https://koreascience.kr/article/JAKO200373606655493.view (accessed on 3 May 2022).
- Kim, J.S.; Park, S.Y. A prediction and analysis for functional change of ecosystem in South Korea. J. Korean Assoc. Geogr. Inf. Stud. 2013, 16, 114–128. [Google Scholar] [CrossRef] [Green Version]
- Palmer, M.; Bernhardt, E.; Chornesky, E.; Collins, S.; Dobson, A.; Duke, C.; Gold, B.; Jacobson, R.; Kingsland, S.; Kranz, R.; et al. Ecology for a crowded planet. Science 2004, 304, 1251–1252. [Google Scholar] [CrossRef]
- Son, J.K.; Kong, M.J.; Kang, D.H.; Lee, S.Y. A study on the improvement of ecosystem service function for the protected horticulture complex in agricultural landscape. J. Korean Soc. Rural. Plan. 2015, 21, 45–53. [Google Scholar] [CrossRef]
- Son, J.; Kong, M.; Kang, D.; Kang, B.; Yun, S.; Lee, S. The comparative studies on the terrestrial insect diversity in protected horticulture complex and paddy wetland. J. Wetl. Res. 2016, 18, 386–393. [Google Scholar] [CrossRef] [Green Version]
- Millennium Ecosystem Assessment. Ecosystems and Human Well-Being: Synthesis; Island Press: Washington, DC, USA, 2005; Available online: https://www.millenniumassessment.org/documents/document.356.aspx.pdf (accessed on 3 May 2022).
- Kim, E.; Kim, J.; Jung, H.J.; Song, W.K. Development and feasibility of indicators for ecosystem service evaluation of urban park. J. Environ. Impact Assess. 2017, 26, 227–241. [Google Scholar] [CrossRef]
- Ramsar Convention Secretariat. Ramsar Convention Manual. 2014. Available online: https://www.ramsar.org/sites/default/files/documents/library/manual6-2013-e.pdf (accessed on 3 May 2022).
- Kong, M.J.; Lee, B.M.; Kim, N.C.; Son, J.K. The analysis of function and factors for the value assessment of ecosystem service at rice paddy wetland. J. Wetl. Res. 2014, 16, 251–259. [Google Scholar] [CrossRef] [Green Version]
- Son, J.; Choi, D.; Lee, S.; Kang, D.; Park, M.; Yun, S.; Kim, N.; Kong, M. Comparative analysis of groundwater-ecosystem service value of protected horticulture complex and paddy fields. J. Korean Soc. Rural. Plan. 2018, 24, 47–58. [Google Scholar] [CrossRef]
- Chang, S.W.; Chung, I.M. Analysis of groundwater variations using the relationship between groundwater use and daily minimum temperature in a water curtain cultivation site. J. Eng. Geol. 2014, 24, 217–225. [Google Scholar] [CrossRef] [Green Version]
- Kim, N.W.; Lee, J.W.; Chung, I.M.; Kim, C.H. Change of groundwater-streamflow interaction according to groundwater abstraction in a greenhouse land. J. Korea Water Resour. Assoc. 2012, 45, 1051–1067. [Google Scholar] [CrossRef] [Green Version]
- Ko, J.Y.; Lee, J.S.; Kim, M.T.; Kim, C.S.; Kang, U.G.; Kang, H.W. Effects of farming practice and no3-n contents of groundwater with different locations under intensive greenhouse area. J. Environ. Agric. 2005, 24, 261–269. [Google Scholar] [CrossRef] [Green Version]
- Lerner, D.N.; Barrett, M.H. Urban groundwater issues in the UK. Hydrogeol. J. 1996, 4, 80–89. [Google Scholar] [CrossRef]
- Foster, S.S.D.; Lawrence, A.R.; Morris, B.M. Groundwater in Urban Development: Assessing Management Needs & Formulating Policy Strategies; World Bank Technical: Washington, DC, USA, 1998. [Google Scholar]
- Hoque, M.A.; Hoque, M.M.; Ahmed, K.M. Declining groundwater level and aquifer dewatering in Dhaka metropolitan area, Bangladesh: Causes and quantification. Hydrogeol. J. 2007, 15, 1523–1534. [Google Scholar] [CrossRef]
- Mpamba, N.H.; Hussen, A.; Kangomba, S.; Nkhuwa, D.C.W.; Nyambe, I.A.; Mdala, C.; Wohnlich, S.; Shibasaki, N. Evidence and implications of groundwater mining in the Lusaka urban aquifers. Phys. Chem. Earth 2008, 33, 648–654. [Google Scholar] [CrossRef]
- Naik, P.K.; Tambe, J.A.; Dehury, B.N.; Tiwari, A.N. Impact of urbanization on the groundwater regime in a fast-growing city in central India. Environ. Monit. Assess. 2008, 146, 339–373. [Google Scholar] [CrossRef]
- Stiefel, J.M.; Melesse, A.M.; McClain, M.E.; Price, R.M.; Anderson, E.P.; Chauhan, N.K. Effects of rainwater-harvesting-induced artificial recharge on the groundwater of wells in Rajasthan, India. Hydrogeol. J. 2009, 17, 2061. [Google Scholar] [CrossRef]
- Singh, A.; Panda, S.N.; Kumar, K.S.; Sharma, C.S. Artificial groundwater recharge zones mapping using remote sensing and gis: A case study in Indian Punjab. Environ. Manag. 2013, 52, 61–71. [Google Scholar] [CrossRef]
- Terêncio, D.P.S.; Sanches Fernandes, L.F.; Cortes, R.M.V.; Pacheco, F.A.L. Improved framework model to allocate optimal rainwater harvesting sites in small watersheds for agro-forestry uses. J. Hydrol. 2017, 550, 318–330. [Google Scholar] [CrossRef]
- Terêncio, D.P.S.; Sanches Fernandes, L.F.; Cortes, R.M.V.; Moura, J.P.; Pacheco, F.A.L. Rainwater harvesting in catchments for agro-forestry uses: A study focused on the balance between sustainability values and storage capacity. Sci. Total Environ. 2018, 613–614, 1079–1092. [Google Scholar] [CrossRef] [PubMed]
- Batchelor, C.H.; Rama Mohan Rao, M.S.; Manohar Rao, S. Watershed development: A solution to water shortages in semi-arid India or part of the problem? Land Use Water Resour. Res. 2003, 3, 1–10. [Google Scholar] [CrossRef]
- Di Baldassarre, G.; Wanders, N.; AghaKouchak, A.; Kuil, L.; Rangecroft, S.; Veldkamp, T.I.E.; Garcia, M.; van Oel, P.R.; Breinl, K.; Van Loon, A.F. Water shortages worsened by reservoir effects. Nat. Sustain. 2018, 1, 617–622. [Google Scholar] [CrossRef]
- Jeon, J.M.; Jang, J.B.; Kim, T.D.; Choi, D. Long-term estimation and mitigation of urban development impact on watershed hydrology. J. Korean Soc. Urban Environ. 2018, 18, 419–428. [Google Scholar] [CrossRef]
- Tubau, I.; Vázquez-Suñé, E.; Carrera, J.; Valhondo, C.; Criollo, R. Quantification of groundwater recharge in urban environments. Sci. Total Environ. 2017, 592, 391–402. [Google Scholar] [CrossRef]
- Kim, J.; Kim, S.; Lee, Y.; Choi, H.; Park, J. Proposed methodological framework of assessing LID (Low Impact Development) impact on soil-groundwater environmental quality. J. Korean Geoenviron. Soc. 2014, 15, 39–50. [Google Scholar] [CrossRef] [Green Version]
- Bouwer, H. Artificial recharge of groundwater: Hydrogeology and engineering. Hydrogeol. J. 2002, 10, 121–142. [Google Scholar] [CrossRef] [Green Version]
- Seo, M.; Jaber, F.; Srinivasan, R.; Jeong, J. Evaluating the impact of low impact development (LID) practices on water quantity and quality under different development designs using SWAT. Water 2017, 9, 193. [Google Scholar] [CrossRef]
- Department of Environmental Resources; Programs and Planning Division. Low-Impact Development Design Strategies: An Integrated Design Approach; Department of Environmental Resources, Programs and Planning Division: Prince George’s County, MD, USA, 1999. [Google Scholar]
- Kang, J.; Hyun, K.H.; Park, J.B. Assessment of low impact development (LID) integrated in local comprehensive plans for improving urban water cycle. J. Korean Soc. Civ. Eng. 2014, 34, 1625–1638. [Google Scholar] [CrossRef]
- Liu, Y.; Ahiablame, L.M.; Bralts, V.F.; Engel, B.A. Enhancing a rainfall-runoff model to assess the impacts of BMPs and LID practices on storm runoff. J. Environ. Manag. 2015, 147, 12–23. [Google Scholar] [CrossRef]
- Kim, S. The sustainable hydrologic cycle system of large urban park-focused on the international competition for master plan of yongsan park. Diss. Korean Inst. Spat. Des. 2016, 11, 9–19. [Google Scholar] [CrossRef]
- Hartig, T.; Evans, G.W.; Jamner, L.D.; Davis, D.S.; Gärling, T. Tracking restoration in natural and urban field settings. J. Environ. Psychol. 2003, 23, 109–123. [Google Scholar] [CrossRef]
- Kim, S.H.; Kong, H.Y.; Kim, T.K. Development and application of the assessment method of no net loss of greenness for urban ecosystem health improvement. Ecol. Resil. Infrastruct. 2015, 2, 311–316. [Google Scholar] [CrossRef]
- Millennium Ecosystem Assessment. Ecosystems and Human Well-Being; Island Press: Washington, DC, USA, 2005; Volume 5. [Google Scholar]
- Haase, D. Holocene floodplains and their distribution in urban areas—Functionality indicators for their retention potentials. Landsc. Urban. Plan. 2003, 66, 5–18. [Google Scholar] [CrossRef]
- Adams, D.K.; Minjarez, C.; Serra, Y.; Quintanar, A.; Alatorre, L.; Granados, A.; Vázquez, E.; Braun, J. Mexican GPS tracks convection from north american monsoon. Eos Trans. Am. Geophys. Union 2014, 95, 61–62. [Google Scholar] [CrossRef]
- Benedict, M.A.; McMahon, E.T. Green Infrastructure: Linking Landscapes and Communities; Island Press: Washington, DC, USA, 2012. [Google Scholar]
- Yu, C.; Hien, W.N. Thermal benefits of city parks. Energy Build. 2006, 38, 105–120. [Google Scholar] [CrossRef]
- Gill, S.E.; Handley, J.F.; Ennos, A.R.; Pauleit, S. Adapting cities for climate change: The role of the green infrastructure. Built Environ. 2007, 33, 115–133. [Google Scholar] [CrossRef] [Green Version]
- McDonald, R.I. Ecosystem service demand and supply along the urban-to-rural gradient. J. Conserv. Plan. 2009, 5, 1–14. [Google Scholar]
- Uni, D.; Katra, I. Airborne dust absorption by semi-arid forests reduces PM pollution in nearby urban environments. Sci. Total Environ. 2017, 598, 984–992. [Google Scholar] [CrossRef] [PubMed]
- Yli-Pelkonen, V.; Scott, A.A.; Viippola, V.; Setälä, H. Trees in urban parks and forests reduce O3, but not NO2 concentrations in Baltimore, MD, USA. Atmos. Environ. 2017, 167, 73–80. [Google Scholar] [CrossRef] [Green Version]
- Yli-Pelkonen, V.; Setälä, H.; Viippola, V. Urban forests near roads do not reduce gaseous air pollutant concentrations but have an impact on particles levels. Landsc. Urban Plan. 2017, 158, 39–47. [Google Scholar] [CrossRef] [Green Version]
- King, K.L.; Johnson, S.; Kheirbek, I.; Lu, J.W.T.; Matte, T. Differences in magnitude and spatial distribution of urban forest pollution deposition rates, air pollution emissions, and ambient neighborhood air quality in New York City. Landsc. Urban Plan. 2014, 128, 14–22. [Google Scholar] [CrossRef]
- Bullock, C.H. Valuing urban green space: Hypothetical alternatives and the status quo. J. Environ. Plan. Manag. 2008, 51, 15–35. [Google Scholar] [CrossRef] [Green Version]
- Latinopoulos, D.; Mallios, Z.; Latinopoulos, P. Valuing the benefits of an urban park project: A contingent valuation study in Thessaloniki, Greece. Land Use Policy 2016, 55, 130–141. [Google Scholar] [CrossRef]
- Canzonieri, C.; Benedict, M.E.; McMahon, E.T. Green infrastructure: Linking landscapes and communities. Landsc. Ecol. 2007, 22, 797–798. [Google Scholar] [CrossRef]
- Foster, J.; Lowe, A.; Winkelman, S. The value of green infrastructure for urban climate adaptation. Cent. Clean Air Policy 2011, 750, 1–52. [Google Scholar]
- Van Berkel, D.B.; Verburg, P.H. Spatial quantification and valuation of cultural ecosystem services in an agricultural landscape. Ecol. Indic. 2014, 37, 163–174. [Google Scholar] [CrossRef]
- Scholte, S.S.K.; Van Teeffelen, A.J.A.; Verburg, P.H. Integrating socio-cultural perspectives into ecosystem service valuation: A review of concepts and methods. Ecol. Econ. 2015, 114, 67–78. [Google Scholar] [CrossRef]
- Molla, M.B. The value of urban green infrastructure and its environmental response in urban ecosystem: A literature review. Int. J. Environ. Sci. 2015, 4, 89–101. [Google Scholar]
- Brears, R.C. (Ed.) Blue-green infrastructure in managing urban water resources. In Blue and Green Cities: The Role of Blue-Green Infrastructure in Managing Urban Water Resources; Palgrave Macmillan: London, UK, 2018; pp. 43–61. [Google Scholar] [CrossRef]
- Firehock, K.; Andrew Walker, R. Strategic Green Infrastructure Planning: A Multi-Scale Approach; Island Press: Washington, DC, USA, 2015. [Google Scholar]
- Adegun, O.B. Green infrastructure in relation to informal urban settlements. J. Archit. Urban. 2017, 41, 22–33. [Google Scholar] [CrossRef]
- Seiler, K.P.; Gat, J.R. Groundwater Recharge from Run-Off, Infiltration and Percolation; Springer Science & Business Media: Berlin/Heidelberg, Germany, 2007; Volume 55. [Google Scholar]
- Lerner, D.N. Groundwater recharge in urban areas. Atmos. Environ. B 1990, 24, 29–33. [Google Scholar] [CrossRef]
- Newcomer, M.E.; Gurdak, J.J.; Sklar, L.S.; Nanus, L. Urban recharge beneath low impact development and effects of climate variability and change. Water Resour. Res. 2014, 50, 1716–1734. [Google Scholar] [CrossRef]
- Kidmose, J.; Troldborg, L.; Refsgaard, J.C.; Bischoff, N. Coupling of a distributed hydrological model with an urban storm water model for impact analysis of forced infiltration. J. Hydrol. 2015, 525, 506–520. [Google Scholar] [CrossRef]
- Bhaskar, A.S.; Hogan, D.M.; Nimmo, J.R.; Perkins, K.S. Groundwater recharge amidst focused stormwater infiltration. Hydrol. Process. 2018, 32, 2058–2068. [Google Scholar] [CrossRef]
- Mooers, E.W.; Jamieson, R.C.; Hayward, J.L.; Drage, J.; Lake, C.B. Low-impact development effects on aquifer recharge using coupled surface and groundwater models. J. Hydrol. Eng. 2018, 23, 04018040. [Google Scholar] [CrossRef]
- Ahiablame, L.M.; Engel, B.A.; Chaubey, I. Effectiveness of low impact development practices: Literature review and suggestions for future research. Water Air Soil Pollut. 2012, 223, 4253–4273. [Google Scholar] [CrossRef]
- Chang, N.B.; Lu, J.W.; Chui, T.F.M.; Hartshorn, N. Global policy analysis of low impact development for stormwater management in urban regions. Land Use Policy 2018, 70, 368–383. [Google Scholar] [CrossRef]
- Jefferson, A.J.; Bhaskar, A.S.; Hopkins, K.G.; Fanelli, R.; Avellaneda, P.M.; McMillan, S.K. Stormwater management network effectiveness and implications for urban watershed function: A critical review. Hydrol. Process. 2017, 31, 4056–4080. [Google Scholar] [CrossRef]
- Li, C.; Fletcher, T.D.; Duncan, H.P.; Burns, M.J. Can stormwater control measures restore altered urban flow regimes at the catchment scale? J. Hydrol. 2017, 549, 631–653. [Google Scholar] [CrossRef]
- Moskovkin, V.M.; Serkina, O.; Lesovik, R.V.; Mitrokhin, A.A. Trends in studying urban runoff: A retrospective analysis. Amaz. Investig. 2018, 7, 228–239. [Google Scholar]
- Lee, J.G.; Heaney, J.P. Directly connected impervious areas as major sources of urban stormwater quality problems-evidence from south Florida. In Proceedings of the Seventh Biennial Stormwater Research and Watershed Management Conference, Tampa, FL, USA, 22–23 May 2002. [Google Scholar]
- Mulvaney, T.J. On the use of self-registering rain and flood gauges in making observations of rainfall and flood discharges in a given catchment. Proc. Inst. Civ. Eng. Irel. 1851, 4, 18–31. [Google Scholar]
- Thornthwaite, C.W. An approach toward a rational classification of climate. Geogr. Rev. 1948, 38, 55–94. [Google Scholar] [CrossRef]
- Makkink, G.F. Testing the Penman formula by means of lysimeters. J. Inst. Water Eng. 1957, 11, 277–288. [Google Scholar]
- Penman, H.L. Estimating evaporation. Eos Trans. Am. Geophys. Union 1956, 37, 43–50. [Google Scholar] [CrossRef]
- Blume, T.; Zehe, E.; Bronstert, A. Rainfall—Runoff response, event-based runoff coefficients and hydrograph separation. Hydrol. Sci. J. 2007, 52, 843–862. [Google Scholar] [CrossRef]
- Hoeg, S.; Uhlenbrook, S.; Leibundgut, C. Hydrograph separation in a mountainous catchment—Combining hydrochemical and isotopic tracers. Hydrol. Process. 2000, 14, 1199–1216. [Google Scholar] [CrossRef]
- Ladouche, B.; Probst, A.; Viville, D.; Idir, S.; Baqué, D.; Loubet, M.; Probst, J.L.; Bariac, T. Hydrograph separation using isotopic, chemical and hydrological approaches (Strengbach catchment, France). J. Hydrol. 2001, 242, 255–274. [Google Scholar] [CrossRef]
- Ha, K.C.; Kim, Y.C.; Kim, S.Y. Monitoring of soil water content and infiltration rate by rainfall in a water curtain cultivation area. J. Geol. Soc. Korea 2016, 52, 221–236. [Google Scholar] [CrossRef]
- Donahue, W.F. Determining Appropriate Nutrient and Sediment Loading Coefficients for Modeling Effects of Changes in Landuse and Landcover in Alberta Watersheds; Technical Report; Water Matters Society of Alberta: Canmore, AB, Canada, 2013; Available online: http://hdl.handle.net/1880/111976 (accessed on 3 May 2022).
- American Society of Civil Engineers (ASCE). Design and Construction of Sanitary and Storm Sewers. Manuals and Reports on Engineering Practice, No. 37, USA, 1970. Available online: https://cedb.asce.org/CEDBsearch/record.jsp?dockey=0139396 (accessed on 3 May 2022).
- Nicklow, J.W.; Boulos, P.F.; Muleta, M.K. Comprehensive Sewer Collection Systems Analysis Handbook for Engineers and Planners; MWH Soft Pub.: Pasadena, CA, USA, 2004. [Google Scholar]
- Korea Water and Wastewater Works Association (KWWA). Drainage Sewer Design Guideline (DSDG). Available online: https://www.law.go.kr/LSW/lsInfoP.do?lsiSeq=180440&viewCls=lsPtnThdCmp&urlMode=lsEfInfoR&lsId=001815&chrClsCd=010202#0000 (accessed on 9 May 2022).
- Rantz, S.E. Suggested Criteria for Hydrologic Design of Storm-Drainage Facilities in the San Francisco Bay Region California; U.S. Geological Survey (USGS): Menlo Park, CA, USA, 1971. Available online: https://pubs.er.usgs.gov/publication/ofr71341 (accessed on 9 May 2022).
- Solano County Water Agency (SCWA). Hydrology and Drainage Design Procedure Prepared by Water Resources Engineering, USA. Available online: https://www.scwa2.com/ (accessed on 9 May 2022).
- Kim, Y.R.; Hwang, S.H. Estimation of runoff coefficient through impervious covers analysis using long-term outflow simulation. J. Korean Soc. Water Wastewater 2014, 28, 635–645. [Google Scholar] [CrossRef]
- Kim, T.; Kim, T.J.; Lee, B.R. Estimation of runoff coefficient according to revision of design criteria, in case of park. J. Wetl. Res. 2016, 18, 209–217. [Google Scholar] [CrossRef] [Green Version]
- Kim, J.H. A Study on Runoff Coefficient Estimation of Rational Method in Natural Basin. Ph.D. Thesis, Hongik University, Seoul, Korea, 2003. Available online: https://dl.nanet.go.kr/file/fileDownload.do?linkSystemId=NADL&controlNo=KDMT1200353638 (accessed on 3 May 2022).
- Kim, J.H.; Park, Y.J.; Choi, H.H.; Song, J.W. A study on runoff coefficient estimation of rational method in natural basin. In Proceedings of the Korea Water Resources Association Conference, Kwangju, Korea, 1 May 2004; pp. 173–177. Available online: https://www.koreascience.or.kr/article/CFKO200411722769768.pdf (accessed on 3 May 2022).
- Lee, Y.D.; Kim, J.S.; Kim, Y.T. Study on improved method for calculating runoff coefficient of rational method. Korean Soc. Hazard Mitig. 2007, 7, 67–74. [Google Scholar]
- Gong, H.; Pan, Y.; Xu, Y. Spatio-temporal variation of groundwater recharge in response to variability in precipitation, land use and soil in Yanqing Basin, Beijing, China. Hydrogeol. J. 2012, 20, 1331–1340. [Google Scholar] [CrossRef]
- Kwon, I.H.; Jung, K.J.; Yoo, S.Y. A study on the characteristics of urban linear park and the changes of neighboring area-focused on gyeongui-line forest park in seoul. Urban. Des. 2020, 21, 5–23. [Google Scholar] [CrossRef]
- Mathias, S.A.; Sorensen, J.P.R.; Butler, A.P. Soil moisture data as a constraint for groundwater recharge estimation. J. Hydrol. 2017, 552, 258–266. [Google Scholar] [CrossRef] [Green Version]
- Anandan, K.S.; Sahay, S.N.; Karthikeyan, S. Delineation of recharge area and artificial recharge studies in the Neyveli hydrogeological basin. Mine Water Environ. 2010, 29, 14–22. [Google Scholar] [CrossRef]
- Zlotnik, V.A.; Kacimov, A.; Al-Maktoumi, A. Estimating groundwater mounding in sloping aquifers for managed aquifer recharge. Groundwater 2017, 55, 797–810. [Google Scholar] [CrossRef]
- Owor, M.; Taylor, R.G.; Tindimugaya, C.; Mwesigwa, D. Rainfall intensity and groundwater recharge: Empirical evidence from the upper nile basin. Environ. Res. Lett. 2009, 4, 035009. [Google Scholar] [CrossRef]
- Wang, H.; Gao, J.E.; Zhang, M.; Li, X.; Zhang, S.; Jia, L. Effects of rainfall intensity on groundwater recharge based on simulated rainfall experiments and a groundwater flow model. Catena 2015, 127, 80–91. [Google Scholar] [CrossRef]
- Harbor, J.M. A practical method for estimating the impact of land-use change on surface runoff, groundwater recharge and wetland hydrology. J. Am. Plan. Assoc. 1994, 60, 95–108. [Google Scholar] [CrossRef]
- Pappas, E.A.; Smith, D.R.; Huang, C.; Shuster, W.D.; Bonta, J.V. Impervious surface impacts to runoff and sediment discharge under laboratory rainfall simulation. Catena 2008, 72, 146–152. [Google Scholar] [CrossRef]
- Schueler, T.R.; Fraley-McNeal, L.; Cappiella, K. Is impervious cover still important? Review of recent research. J. Hydrol. Eng. 2009, 14, 309–315. [Google Scholar] [CrossRef] [Green Version]
- Chithra, S.V.; Nair, M.V.H.; Amarnath, A.; Anjana, N.S. Impacts of impervious surfaces on the environment. Int. J. Eng. Sci. Invent. 2015, 4, 27–31. [Google Scholar]
- Klein, R.D. Urbanization and stream quality impairment 1. J. Am. Water Resour. Assoc. 1979, 15, 948–963. [Google Scholar] [CrossRef]
- Rozos, E.; Makropoulos, C. Assessing the combined benefits of water recycling technologies by modelling the total urban water cycle. Urban Water J. 2012, 9, 1–10. [Google Scholar] [CrossRef]
- Liu, Z.H.; Wang, Y.L.; Peng, J. Remote sensing of impervious surface and its applications: A review. Prog. Geogr. 2010, 29, 1143–1152. [Google Scholar]
- Kim, Y.R.; Hwang, S.H.; Lee, Y.S. Development of water circulation status estimation model by using multiple linear regression analysis of urban characteristic factors. J. Korean Soc. Water Wastewater 2020, 34, 503–512. [Google Scholar] [CrossRef]
- Matsushita, J.; Ozaki, M.; Nishimura, S.; Ohgaki, S. Rainwater drainage management for urban development based on public-private partnership. Water Sci. Technol. 2001, 44, 295–303. [Google Scholar] [CrossRef]
- Wang, X. An applied research in the rural landscape of rainwater collection system based on the concept of LID. In Proceedings of the International Conference on Intelligent Transportation, Big Data and Smart City, Halong Bay, Vietnam, 19–20 December 2015. [Google Scholar] [CrossRef]
- Wang, Z.; Bell, G.E.; Penn, C.J.; Moss, J.Q.; Payton, M.E. Phosphorus reduction in turfgrass runoff using a steel slag trench filter system. Crop Sci. 2014, 54, 1859–1867. [Google Scholar] [CrossRef]
- Duchene, M.; McBean, E.A. Discharge characteristics of perforated pipe for use in infiltration trenches 1. J. Am. Water Resour. Assoc. 1992, 28, 517–524. [Google Scholar] [CrossRef]
- Seibert, J.; Rodhe, A.; Bishop, K. Simulating interactions between saturated and unsaturated storage in a conceptual runoff model. Hydrol. Process. 2003, 17, 379–390. [Google Scholar] [CrossRef]
- Spence, C. A paradigm shift in hydrology: Storage thresholds across scales influence catchment runoff generation. Geogr. Compass 2010, 4, 819–833. [Google Scholar] [CrossRef]
- Xu, C.Y.; Chen, D. Comparison of seven models for estimation of evapotranspiration and groundwater recharge using lysimeter measurement data in Germany. Hydrol. Process. 2005, 19, 3717–3734. [Google Scholar] [CrossRef]
- Doble, R.C.; Crosbie, R.S. Review: Current and emerging methods for catchment-scale modelling of recharge and evapotranspiration from shallow groundwater. Hydrogeol. J. 2017, 25, 3–23. [Google Scholar] [CrossRef]
- Leavesley, G.H.; Lichty, R.W.; Troutman, B.M.; Saindon, L.G. Precipitation-runoff modeling system: User’s manual. Water-Resour. Investig. Rep. 1983, 83, 4238. [Google Scholar] [CrossRef] [Green Version]
- Milewski, A.; Sultan, M.; Yan, E.; Becker, R.; Abdeldayem, A.; Soliman, F.; Gelil, K.A. A remote sensing solution for estimating runoff and recharge in arid environments. J. Hydrol. 2009, 373, 1–14. [Google Scholar] [CrossRef]
- Bent, G.C. Effects of forest-management activities on runoff components and ground-water recharge to Quabbin Reservoir, central Massachusetts. For. Ecol. Manag. 2001, 143, 115–129. [Google Scholar] [CrossRef]
- Schooling, J.T.; Carlyle-Moses, D.E. The influence of rainfall depth class and deciduous tree traits on stemflow production in an urban park. Urban Ecosyst. 2015, 18, 1261–1284. [Google Scholar] [CrossRef]


| Classification | Location | Area | ||
|---|---|---|---|---|
| Total (ha) | Green Space | |||
| (ha) | (%) | |||
| Urban Park within a Living Zone (Over 10,000 m2) | ||||
| Life 1 | 1326, Wadong-ri-dong, Paju-si, Gyeonggi-do | 2.16 | 1.31 | 60.65 |
| Life 2 | 1101, Donae-dong, Goyang-si, Gyeonggi-do | 2.93 | 1.86 | 63.48 |
| Life 3 | 1078, Donae-dong, Goyang-si, Gyeonggi-do | 1.31 | 0.91 | 65.00 |
| Life 4 | Wonheung-dong, Goyang-si, Gyeonggi-do | 1.65 | 1.31 | 79.39 |
| Neighborhood park within a walking sphere (over 30,000 m2) | ||||
| Walk 1 | 1640-1, Unnam-dong, Jung-gu, Incheon | 4.84 | 3.07 | 63.43 |
| Walk 2 | 363, Dongsan-dong, Deogyang-gu, Goyang-si | 9.03 | 5.93 | 65.67 |
| Walk 3 | 603, Yeonsu-dong, Seongnam-si, Gyeonggi-do | 3.02 | 2.21 | 72.65 |
| Walk 4 | 371, Dongsan-dong, Goyang-si, Gyeonggi-do | 6.04 | 4.54 | 75.17 |
| Item | Weather Status | Va | Ps | SPs | Is | |||||
|---|---|---|---|---|---|---|---|---|---|---|
| Precipitation (mm) | Evapotranspiration (mm) | Penetration (mm) | Ratio (%) | Penetration (mm) | Ratio (%) | Penetration (mm) | Ratio (%) | Penetration (mm) | Ratio (%) | |
| January | 25.2 | 22.74 | 5.63 | 22.33 | 2.85 | 11.33 | 0.34 | 1.34 | 0 | 0 |
| February | 31.5 | 35.51 | 6.99 | 22.20 | 3.83 | 12.16 | 0.12 | 0.39 | 0 | 0 |
| March | 67.1 | 61.66 | 14.90 | 22.21 | 9.12 | 13.59 | 0.50 | 0.74 | 0 | 0 |
| April | 144.2 | 88.55 | 25.09 | 17.40 | 14.45 | 10.02 | 1.38 | 0.95 | 0 | 0 |
| May | 84.3 | 106.1 | 18.38 | 21.81 | 10.53 | 12.49 | 0.67 | 0.79 | 0 | 0 |
| June | 95.2 | 118.1 | 17.83 | 18.73 | 10.05 | 10.56 | 0.67 | 0.70 | 0 | 0 |
| July | 252.4 | 145.5 | 44.69 | 17.71 | 22.70 | 9.00 | 2.91 | 1.15 | 0 | 0 |
| August | 34.6 | 134.7 | 9.11 | 26.32 | 4.50 | 13.02 | 0.28 | 0.82 | 0 | 0 |
| September | 135.6 | 83.59 | 25.60 | 18.88 | 11.76 | 8.68 | 0.71 | 0.52 | 0 | 0 |
| October | 163.3 | 57.27 | 23.44 | 14.35 | 14.60 | 8.94 | 1.83 | 1.12 | 0 | 0 |
| November | 102.8 | 32.91 | 15.61 | 15.19 | 9.08 | 8.83 | 0.69 | 0.67 | 0 | 0 |
| December | 58.2 | 23.67 | 7.24 | 12.44 | 4.97 | 8.54 | 0.35 | 0.59 | 0 | 0 |
| Total | 1194.4 | 910.3 | 214.51 | 17.96 | 118.45 | 9.92 | 10.43 | 0.87 | 0 | 0 |
| Study Sites | Total Area | Va | Ps | SPs | Is | Other |
|---|---|---|---|---|---|---|
| Life 1 (m2) | 21,599.1 | 13,100.0 | 642.9 | 3723.6 | 2643.6 | 1490.0 |
| Ratio (%) | 100.0 | 60.6 | 3.0 | 17.2 | 12.2 | 6.9 |
| Life 2 (m2) | 29,300.0 | 18,600.0 | 929.2 | 9502.9 | 0 | 267.9 |
| Ratio (%) | 100.0 | 63.5 | 3.2 | 32.4 | 0.0 | 0.9 |
| Life 3 (m2) | 14,000.0 | 9100.0 | 0.0 | 4516.8 | 197.5 | 185.7 |
| Ratio (%) | 100.0 | 65.0 | 0.0 | 32.3 | 1.4 | 1.3 |
| Life 4 (m2) | 16,500.0 | 13,100.0 | 0.0 | 1732.9 | 1559.3 | 107.8 |
| Ratio (%) | 100.0 | 79.4 | 0.0 | 10.5 | 9.5 | 0.7 |
| Walk 1 (m2) | 48,400.0 | 30,700.0 | 5248.5 | 9289.4 | 3032.3 | 129.8 |
| Ratio (%) | 100.0 | 63.4 | 10.8 | 19.2 | 6.3 | 0.3 |
| Walk 2 (m2) | 90,300 | 59,300.0 | 2613.2 | 22,984.3 | 5402.5 | 0.0 |
| Ratio (%) | 100.0 | 65.1 | 2.9 | 26.2 | 5.9 | 0.0 |
| Walk 3 (m2) | 30,489.0 | 22,150.0 | 978.6 | 1355.9 | 4852.7 | 1151.8 |
| Ratio (%) | 100.0 | 72.6 | 3.2 | 14.4 | 5.7 | 3.8 |
| Walk 4 (m2) | 60,400.0 | 45,400.0 | 958.0 | 8957.9 | 4556.0 | 528.1 |
| Ratio (%) | 100.0 | 75.2 | 1.6 | 14.8 | 7.5 | 0.9 |
| Site | Va | Ps | SPs | Is | Total |
|---|---|---|---|---|---|
| mm/ha | |||||
| Life 1 | 159.26 | 18.60 | 177.93 | 205.11 | 560.91 |
| Life 2 | 166.70 | 19.82 | 334.76 | 9.80 | 531.08 |
| Life 3 | 170.69 | 0.00 | 333.00 | 29.34 | 533.03 |
| Life 4 | 208.49 | 0.00 | 108.40 | 108.29 | 425.18 |
| Walk 1 | 166.57 | 67.76 | 198.10 | 70.02 | 502.45 |
| Walk 2 | 172.45 | 18.08 | 262.72 | 64.13 | 517.38 |
| Walk 3 | 190.78 | 20.06 | 45.90 | 211.08 | 467.82 |
| Walk 4 | 197.38 | 9.91 | 153.08 | 90.22 | 450.59 |
| Average | 179.04 | 19.28 | 201.74 | 98.50 | 498.56 |
| Site | Va | Ps | SPs | Is | Total |
|---|---|---|---|---|---|
| mm | |||||
| Life 1 | 107.95 | 2.79 | 2.01 | 0.00 | 112.75 |
| Life 2 | 112.99 | 2.97 | 3.79 | 0.00 | 119.75 |
| Life 3 | 115.69 | 0.00 | 3.77 | 0.00 | 119.46 |
| Life 4 | 141.31 | 0.00 | 1.23 | 0.00 | 142.54 |
| Walk 1 | 112.90 | 10.15 | 2.24 | 0.00 | 125.29 |
| Walk 2 | 116.89 | 2.71 | 2.97 | 0.00 | 122.57 |
| Walk 3 | 129.31 | 3.00 | 0.52 | 0.00 | 132.83 |
| Walk 4 | 133.79 | 1.48 | 1.73 | 0.00 | 137.00 |
| Average | 121.35 | 2.89 | 2.28 | 0.00 | 126.52 |
| Site | Runoff | Infiltration Rate | Evapotranspiration | |||
|---|---|---|---|---|---|---|
| mm | (%) | mm | (%) | mm | (%) | |
| Life 1 | 560.91 | 52.33 | 112.75 | 10.52 | 398.16 | 37.15 |
| Life 2 | 531.08 | 49.55 | 119.75 | 11.17 | 420.99 | 39.28 |
| Life 3 | 533.03 | 49.73 | 119.46 | 11.15 | 419.33 | 39.12 |
| Life 4 | 425.18 | 39.67 | 142.54 | 13.30 | 504.10 | 47.03 |
| Walk 1 | 502.45 | 46.88 | 125.29 | 11.69 | 444.08 | 41.43 |
| Walk 2 | 517.38 | 48.27 | 122.57 | 11.44 | 431.87 | 40.29 |
| Walk 3 | 467.82 | 43.65 | 132.83 | 12.39 | 471.17 | 43.96 |
| Walk 4 | 450.59 | 42.04 | 137.00 | 12.78 | 484.23 | 45.18 |
| Average | 498.56 | 46.52 | 126.52 | 11.80 | 446.74 | 41.68 |
| Site | Mount by 1 ha | Mount by Site Areas | ||||
|---|---|---|---|---|---|---|
| Runoff | Evapotranspiration | Total | Infiltration | Evapotranspiration | Total | |
| Life 1 | 1127.5 | 3981.6 | 5109.1 | 2435.40 | 8600.26 | 11,035.66 |
| Life 2 | 1197.5 | 4209.9 | 5407.4 | 3508.68 | 12,335.01 | 15,843.68 |
| Life 3 | 1194.6 | 4193.3 | 5387.9 | 1564.93 | 5493.22 | 7058.15 |
| Life 4 | 1425.4 | 5041.0 | 6466.4 | 2351.91 | 8317.65 | 10,669.56 |
| Walk 1 | 1252.9 | 4440.8 | 5693.7 | 6064.04 | 21,493.47 | 27,557.51 |
| Walk 2 | 1225.7 | 4318.7 | 5544.4 | 11,068.07 | 38,997.86 | 50,065.93 |
| Walk 3 | 1328.3 | 4711.7 | 6040.0 | 4011.47 | 14,229.33 | 18,240.80 |
| Walk 4 | 1370.0 | 4842.3 | 6212.3 | 8274.80 | 29,247.49 | 37,522.29 |
| Average | 1265.2 | 4467.4 | 5732.6 | 4909.91 | 17,339.29 | 22,249.20 |
| Item | Regression Equation | Determination Coefficient (R2) | |
|---|---|---|---|
| Runoff rate | Green area ratio | y = −0.1383x + 137.13 | 0.9270 |
| Permeable sidewalk area ratio | y = 2.5849x + 490.58 | 0.0360 | |
| Some pervious sidewalk area ratio | y = 3.1108x + 437.76 | 0.4476 | |
| Impervious sidewalk area ratio | y = −0.871x + 506.56 | 0.0170 | |
| Infiltration rate | Green area ratio | y = 0.6417x − 13.009 | 0.9345 |
| Permeable sidewalk area ratio | y = −0.6188x + 128.43 | 0.0440 | |
| Some pervious sidewalk area ratio | y = −0.654x + 139.30 | 0.4224 | |
| Impervious sidewalk area ratio | y = 0.1576x + 125.08 | 0.0119 | |
| Evapotranspiration | Green area ratio | y = 0.1762x − 10.556 | 0.9246 |
| Permeable sidewalk area ratio | y = −1.9662x + 452.81 | 0.0339 | |
| Some pervious sidewalk ratio | y = −2.4568x + 494.76 | 0.4545 | |
| Impervious sidewalk area ratio | y = 0.7134x + 440.19 | 0.0185 | |
Publisher’s Note: MDPI stays neutral with regard to jurisdictional claims in published maps and institutional affiliations. |
© 2022 by the authors. Licensee MDPI, Basel, Switzerland. This article is an open access article distributed under the terms and conditions of the Creative Commons Attribution (CC BY) license (https://creativecommons.org/licenses/by/4.0/).
Share and Cite
Son, J.; Kwon, T. Evaluation and Improvement Measures of the Runoff Coefficient of Urban Parks for Sustainable Water Balance. Land 2022, 11, 1098. https://doi.org/10.3390/land11071098
Son J, Kwon T. Evaluation and Improvement Measures of the Runoff Coefficient of Urban Parks for Sustainable Water Balance. Land. 2022; 11(7):1098. https://doi.org/10.3390/land11071098
Chicago/Turabian StyleSon, Jinkwan, and Taegeun Kwon. 2022. "Evaluation and Improvement Measures of the Runoff Coefficient of Urban Parks for Sustainable Water Balance" Land 11, no. 7: 1098. https://doi.org/10.3390/land11071098