1. Introduction
Pinus nigra J.F. Arnold is a species that can grow up to 30 m (exceptionally 40 to 50 m), has a straight trunk with a light grey to dark grey brown colour bark, a conical crown in juvenile trees and umbrella shaped in older trees, stiff needles 8 to 16 cm long, reaches sexual maturity at 15–20 years, and flowers in May [
1].
P. nigra is considered a relict species [
2,
3]. Its widespread distribution of 3.5 million ha is fragmented due to climatic change of different glacial and interglacial episodes, geological events, and anthropogenic disturbances mainly in low elevation areas by human habitation [
1,
4,
5,
6,
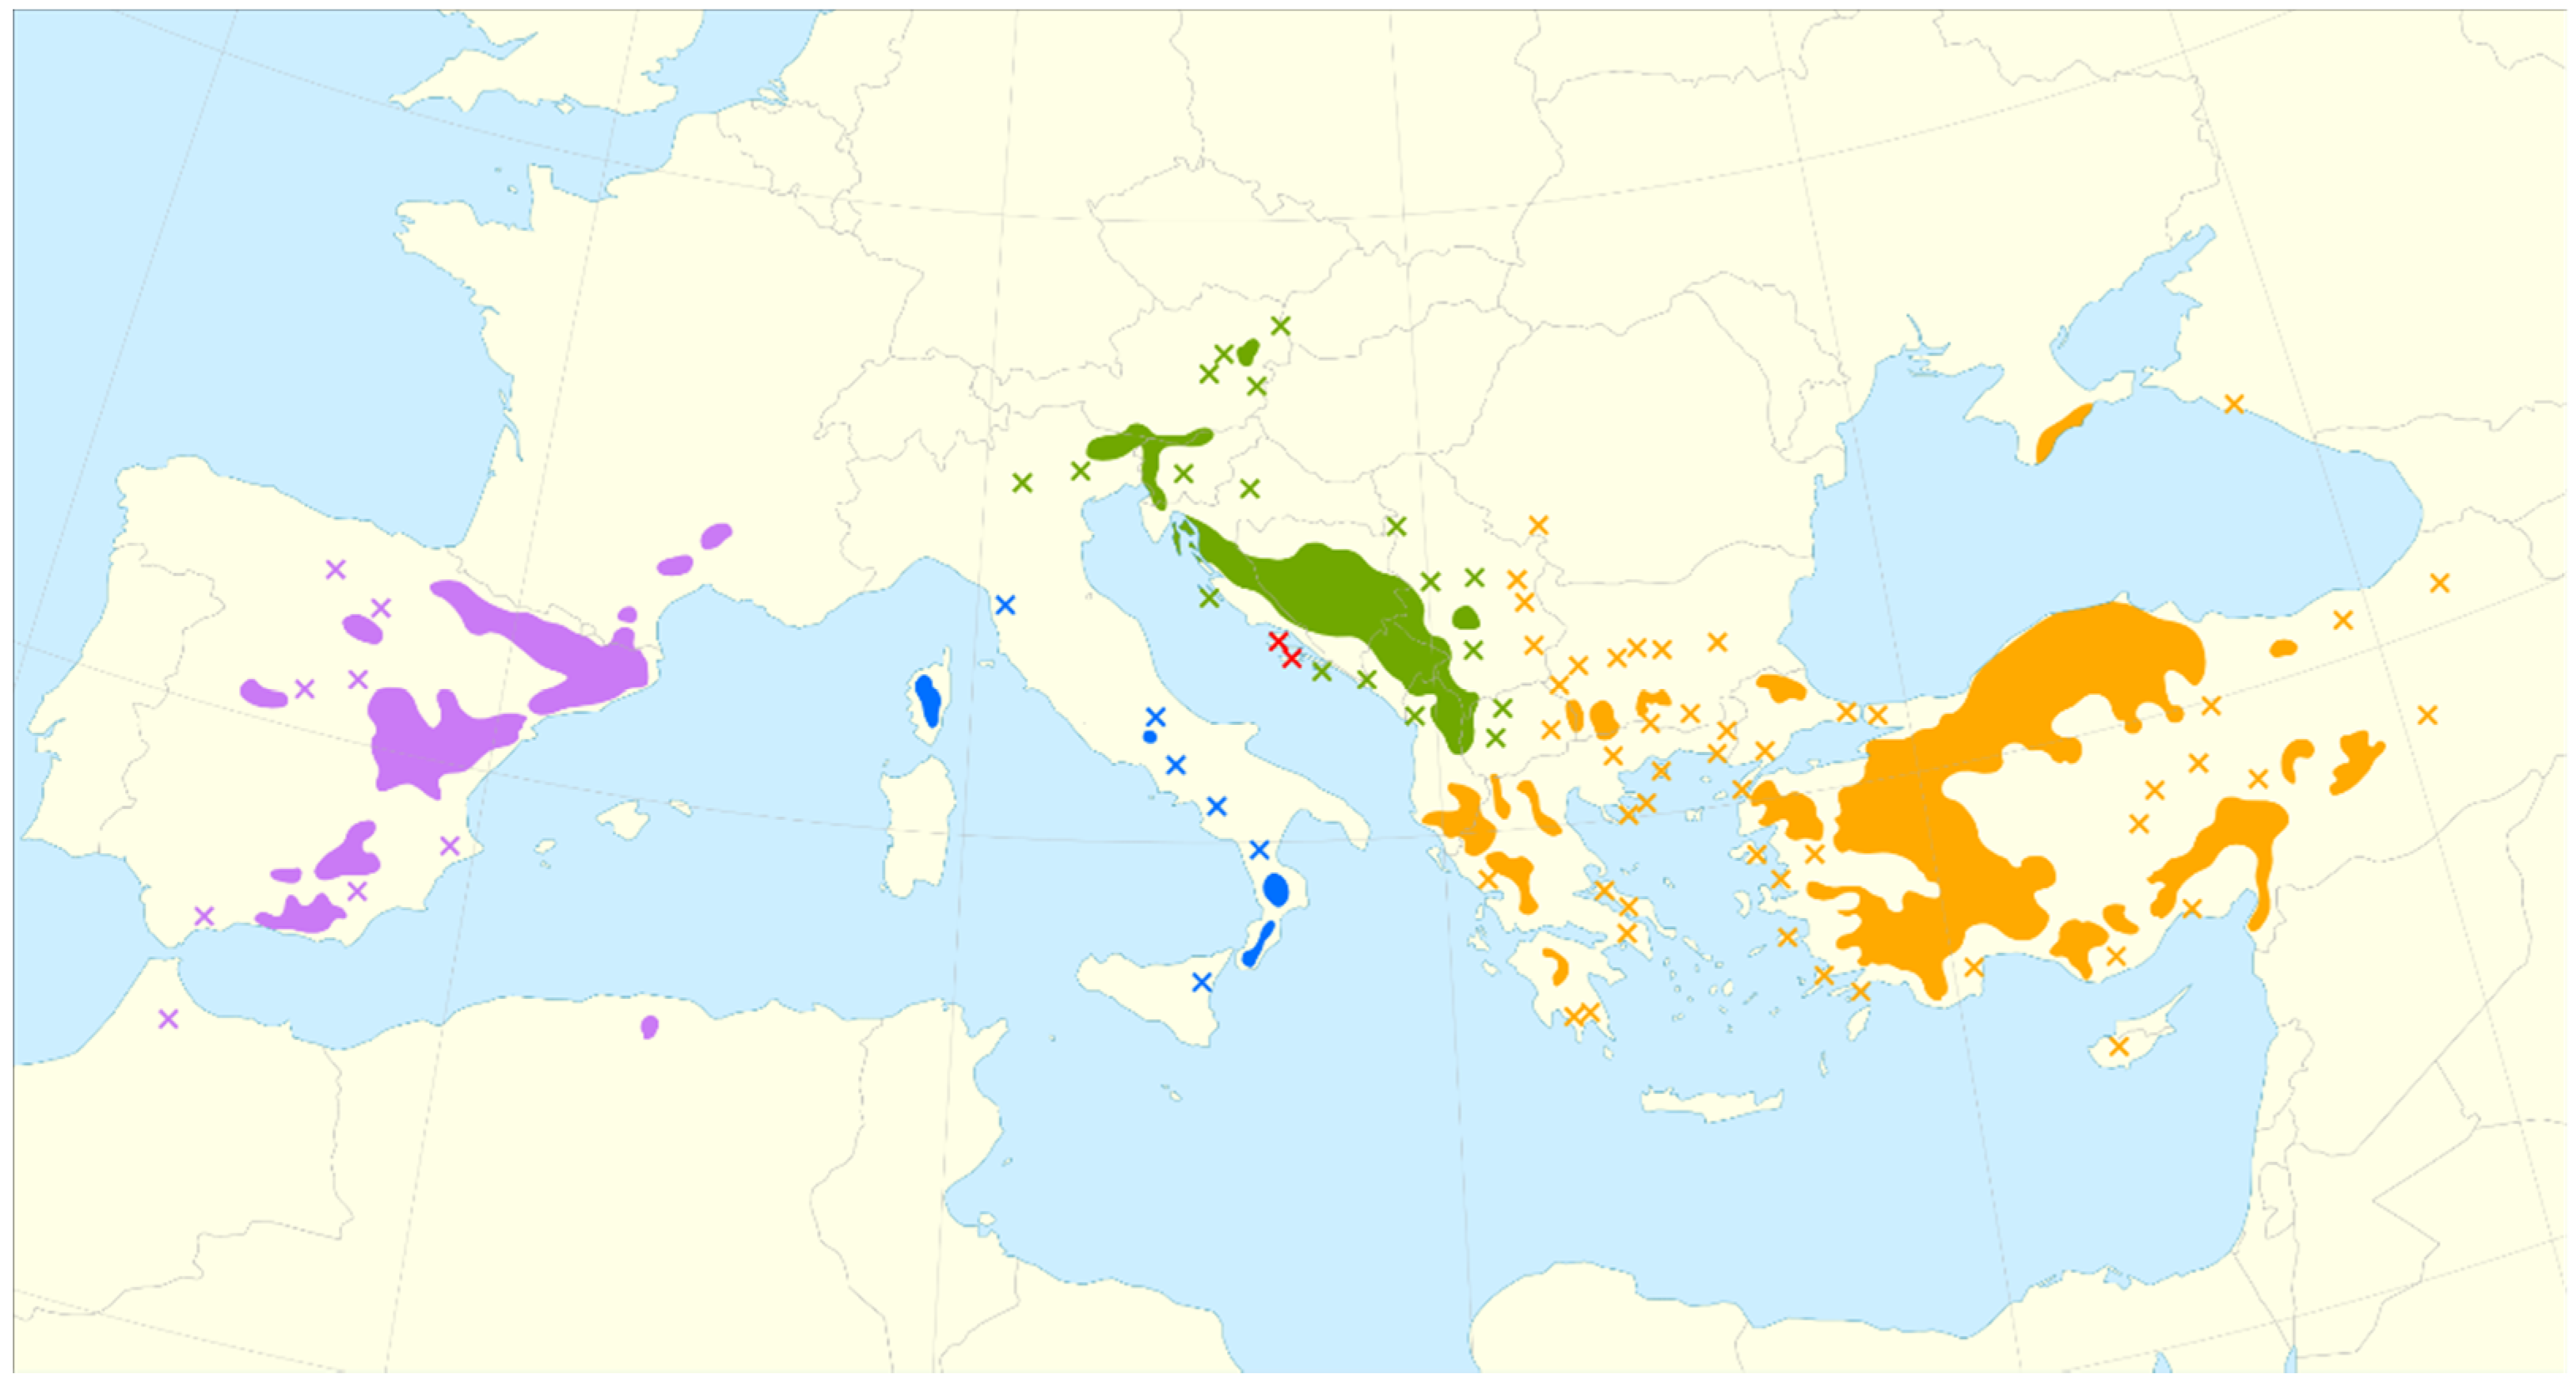
7]. The distribution of this species is extended from North Africa, through the Northern Mediterranean and Eastwards to the Black Sea, and the Corsica and Sicily islands (
Figure 1) [
8,
9]. The species common name is the European Black Pine, also frequently named as the Austrian Pine, the Australian Pine, the Corsican Pine, the Crimean Pine, or the Pyrenees Pine. Some common names given to
P. nigra were based on its large and fragmented distribution [
1].
The occupied area by this species is normally composed of basic soils on calcareous substrate, represented with one third of pure black pine stands and the remaining corresponds to mixed stands normally with other pines such as
P. sylvestris,
P. pinaster, and
P. halepensis [
10]. The oldest individual of
P. nigra has more than 1000 years and was found in the Iberian Peninsula, more specifically in the Sierra de Cazorla [
11]. Its natural presence in the Iberian Peninsula is in Eastern and Central Spain, approximately 200 km in distance from Portugal [
12,
13,
14].
In Portugal, the existing populations result from afforestation performed 50–90 years ago in the north and centre of the country in communal areas, which reached 18,000 ha by the 1970s [
15]. The initial planted regions comprised of mountains located at Gerês, Marão, Montezinho, Nogueira, Cabreira, Estrela, Padrela, Barroso, and Lousã [
16], typically in shallow and rocky soils. However, in less than 10 years, forest fires destroyed roughly half of the
P. nigra planting area, reducing it to almost 9000 ha [
15]. Until the beginning of this work, the existing populations in Portugal were just characterized morphologically by Louro [
15].
The Portuguese Institute of Sea and Atmosphere [
17] characterizes the climate in mainland Portugal as predominantly influenced by latitude, orography, and proximity to the Atlantic Ocean. Precipitation shows a high variability between regions, with the average annual precipitation exceeding 3000 mm in the northwest region (being one of the areas in Europe with the highest precipitation values), and may not exceed, on average, 500 mm per year in several inland areas south of the Tagus River. The precipitation presents very accentuated interannual variations, making the region vulnerable to extreme phenomena associated with the lack (droughts) or excess (floods) of precipitation. The average annual temperature varies between 6 and 9 °C in the high areas of the North and Central interior and values above 17 °C in the South coast.
Due to the effect of the site–climate interaction on the pattern of the trees [
7,
18,
19,
20], it is expected that climate change may, in the future, shape the distribution of black pine and the timber properties produced in some regions.
The distribution will probably be dependent on the geographical region, as site–climate interactions may play an important role in adaptation [
19]. Knowledge on the growth patterns in different regions outside the natural area of distribution can provide information concerning the species’ ecological amplitude. The Southern European region may represent a future analog of climate change compared to current conditions in the central region of European countries. Information on the growth characteristics of the species in diverse locations may provide insights that can help with assisted migration of the species as a measure of adaptive management facing climate change. Its biological diversity, conservation, and increment are key issues for assuring a sustainable forest management of the species [
21].
In the present study, tree rings of P. nigra trees, collected at a 1.30 m height, are analysed with the aim of identifying diameter growth characteristics of the species at its distribution edge and to investigate the possible occurrence of different long-term radial growth patterns among black pine populations. In case differences are detected, the authors also intend to assess whether these differences show temporal variability or are stable from the early stages of stand development.
2. Materials and Methods
2.1. Characteristics of the Studied Areas
The data collection planning began with the identification of
P. nigra stands that were representative of the distribution area in mainland Portugal. This information was obtained through the authors’ personal knowledge, complemented by information provided by ICNF—Instituto da Conservação da Natureza e das Florestas (Institute for Nature Conservation and Forests). Six planted stands with an overall area between 1.5 to 2 ha that are representative of the
P. nigra species distribution were identified, across three regions (Minho, Trás-os-Montes and Beiras). These populations are located in the mountain range between 400 to 1600 m of altitude at the north and centre of the country (
Figure 2). The forest stands were installed by plantation with a spacing of 2.5 m × 2.5 m, corresponding to a stand density approximately 1600 plants/ha. After three years, dead trees were replanted. No fertilization treatments were applied. The average silvicultural practice includes 2 to 3 thinning operations, the first at 8–10 years, a second at 15–18 years, and the third, if performed, is done a few years later.
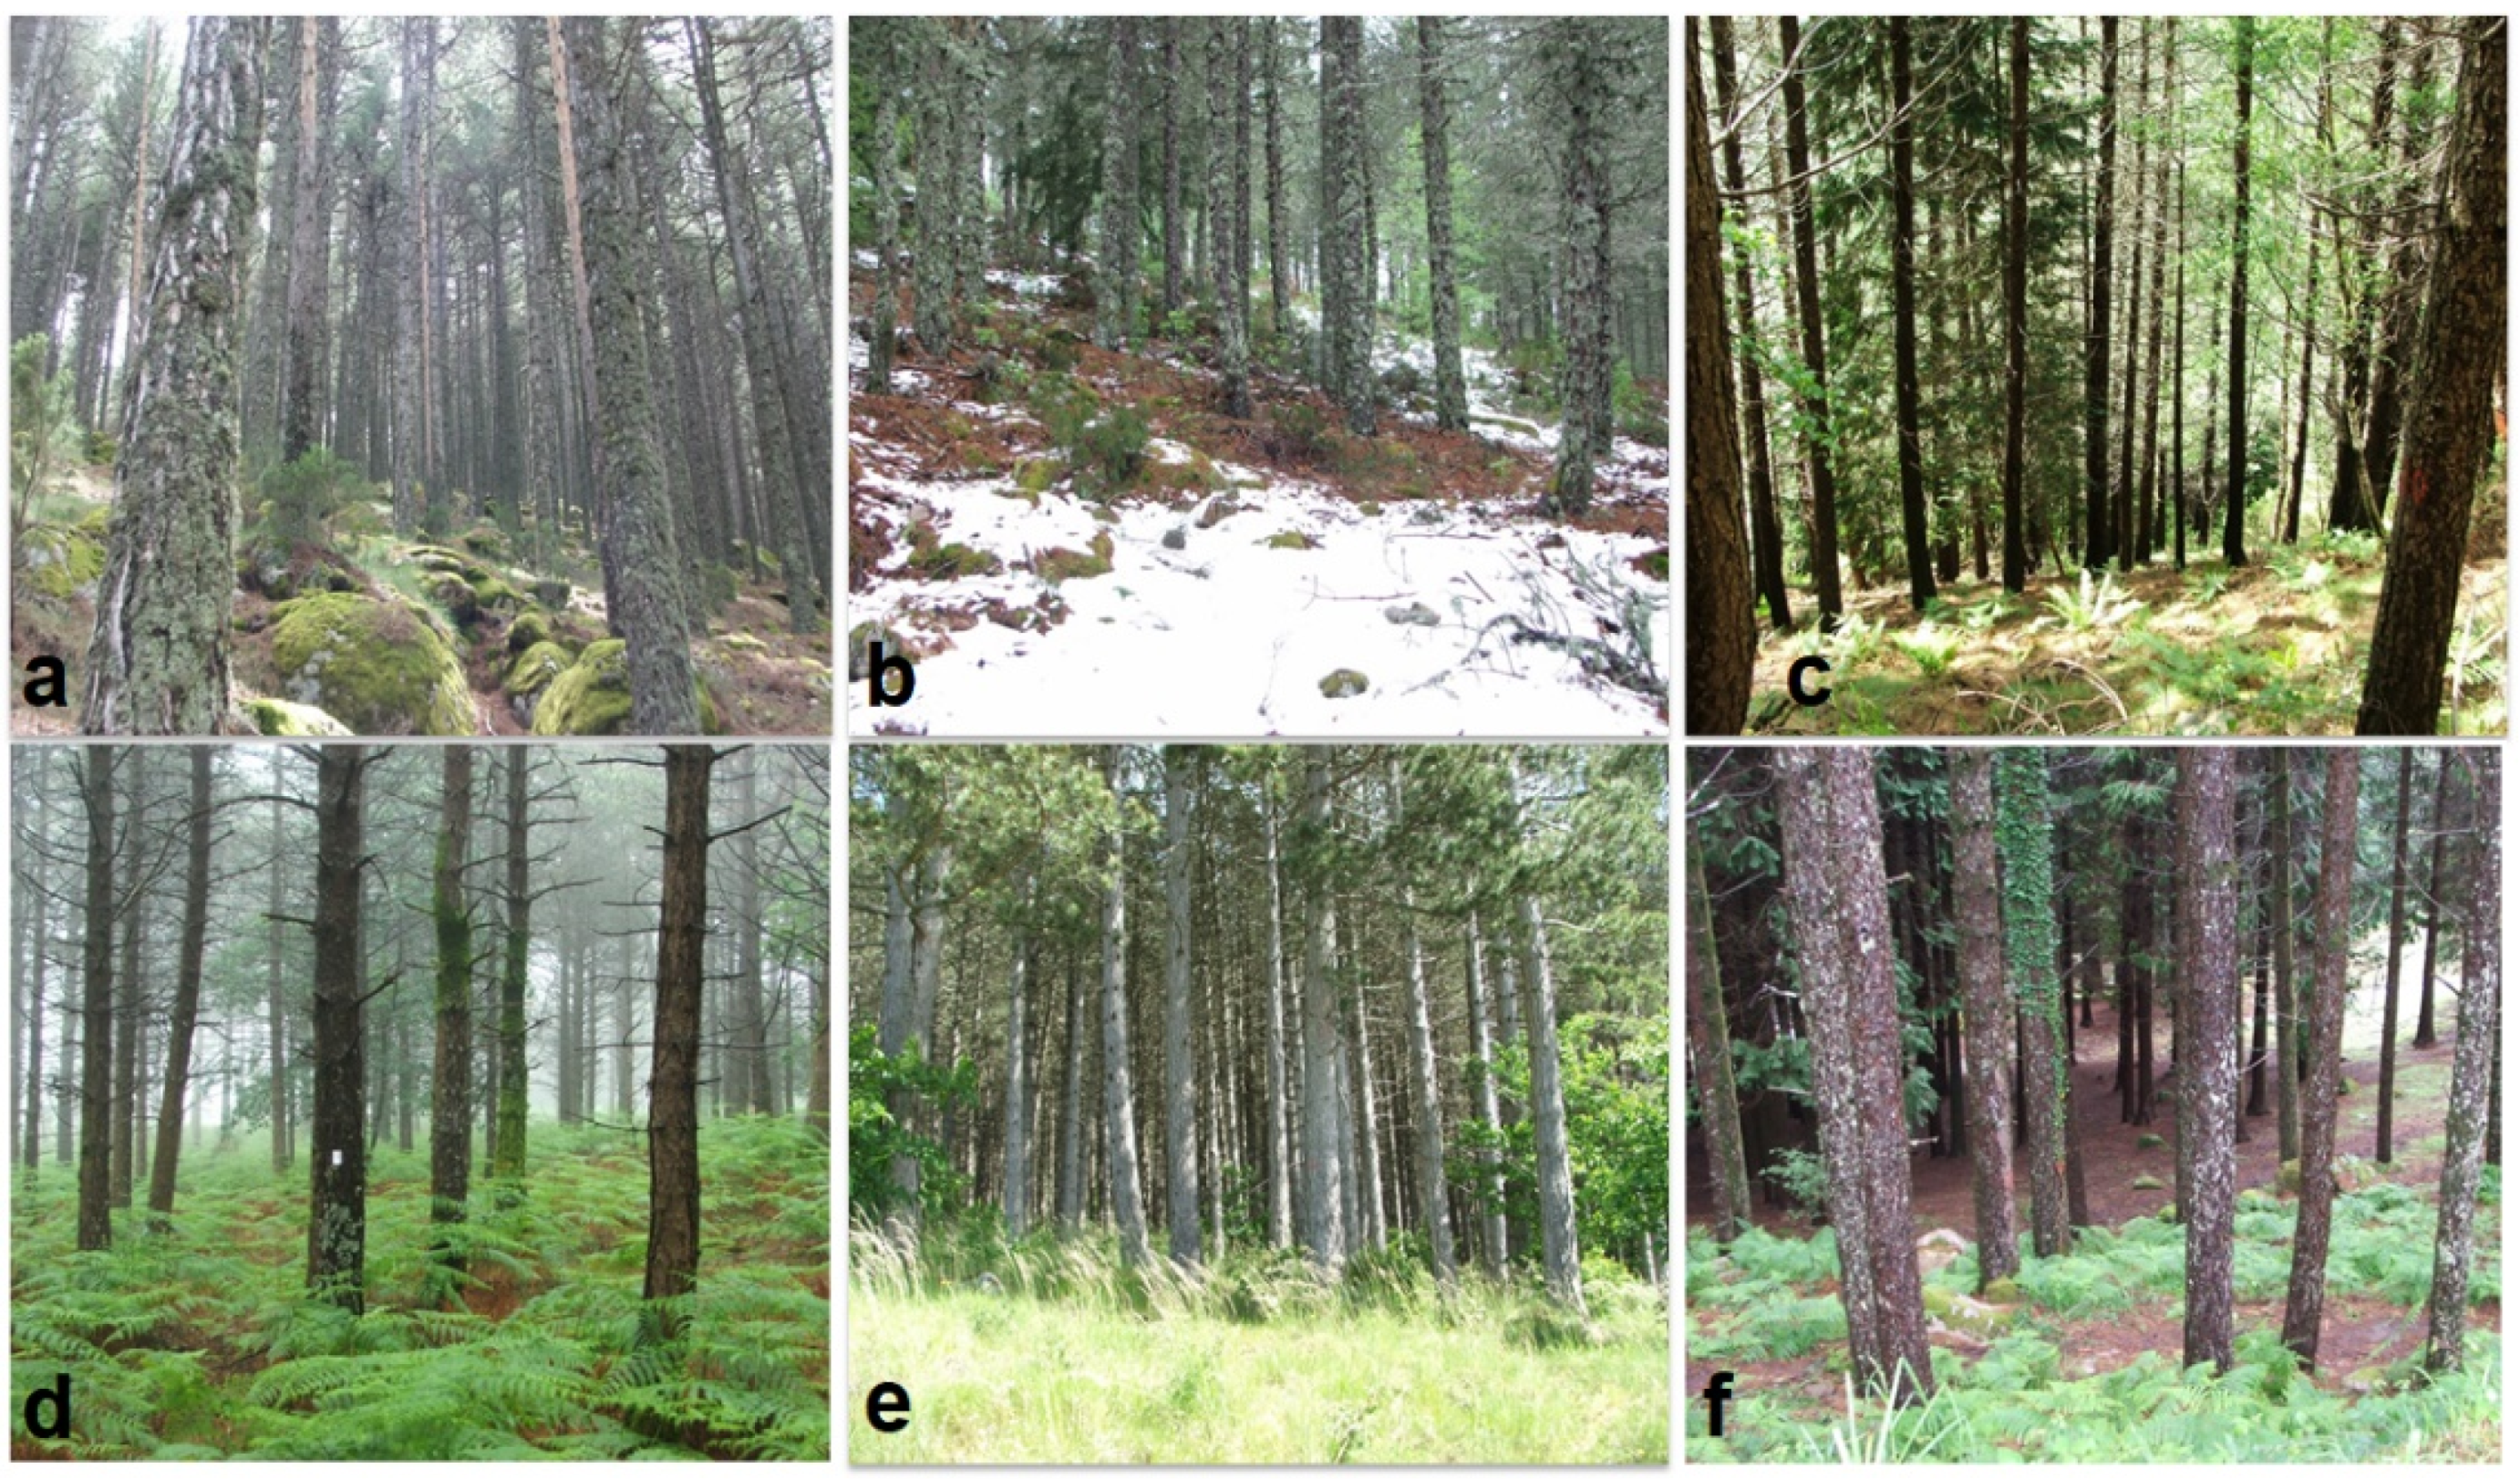
Two sample sites were chosen per region in Paredes de Coura and Caminha at Minho region; Manteigas and Vale do Zêzere at the Beiras region and Vila Pouca de Aguiar and Campeã at Trás-os-Montes region. The sites are managed and composed by pure even aged stands (
Figure 3). The location of the sample plots was chosen deliberately to ensure adequate representation of average stand development conditions at the selected sites and to avoid border effects. The identification and characterization of the sites are presented in
Table 1.
Paredes de Coura is located at the Northwest of Portugal, on the Arga mountain range, in a highland at 451 m of altitude with a minor slope of 7°. The soil type is a shallow umbric cambisol derived from schists, covered with herbaceous plants such as ferns, agrostis, and moss. The mean annual temperature is 13.3 °C and the annual mean precipitation is 1462 mm. On the same mountain range, located at 443 m of altitude in a valley with a slope of 20° is the Caminha study site, which has an umbric regosols soil derived of granites and a herbaceous cover that has been recently cut due to forest management. Regarding the tree stratum, a few individuals of Pinus sylvestris were found. The mean annual temperature is 14.7 °C and mean annual precipitation is 1276 mm.
Located at the Northern Centre of Portugal is the Vila Pouca de Aguiar study site in a plain area of the Padrela mountain range (slope of 2°) at 908 m of altitude and soil characterized by umbric cambisols derived from schists. The herbaceous cover was composed mainly of ferns and genista. The mean annual temperature is 12.1 °C, and mean annual precipitation is 1215 mm. In addition, close to this location is the Campeã study site located on hill of the Alvão mountain range at an altitude of 891 m with a slope of 30°. As in the previous case, the soil is characterized by umbric cambisols derived from schists, the herbaceous cover was mainly composed by ferns and genista. The mean annual temperature is 12.1 °C and the mean annual precipitation is 1349 mm.
In the Centre of the country, the Manteigas study site was established in the Serra da Estrela mountain range at 1144 m of altitude with a slope of 29° and soil of umbric regosols derived from granites. The soil cover was constituted by herbaceous patches of Erica arborea, ferns, and bare soil/rocks. The mean annual temperature is 9.2 °C and the mean annual precipitation is 1890 mm. The Vale do Zêzere study site is located in the same mountain range at 1560 m of altitude with a slope of 16° and also has soil of umbric regosols derived from granites. In the soil cover was detected scarce presence of genista and species such as Erica arborea and Sorbus aucuparia with large parts of bare soil/rocks. The mean annual temperature is 7.8 °C, and mean annual precipitation is 1710 mm.
2.2. Data Collection
In each studied site the coordinates were registered and in 2014 at least one sample plot, circular in shape, with an average area of 400 m2 was installed. The general characteristics of the site such as cardinal direction and slope, were evaluated and registered. In the sampled plots, we measured the total height and the diameter at breast height of all living trees, in order to assess tree development. Tree diameter was measured with a caliper, at 1.3 m breast height above the ground, in two perpendicular directions, with a resolution of 1 mm. Total height was measured with a Vertex hypsometer with a resolution of 10 cm. Mortality was evaluated and recorded whenever it occurred. Fifteen wood cores of 12 mm from bark to pith to bark were collected with an increment borer at 1.30 m above ground level in the dominant and codominant trees, in each site (90 trees in total), for anatomical, physical, chemical, and mechanical analyses to be investigated in an independent study. Additionally, two thinner wood cores from the trees with higher diameter were also collected at 20 cm above floor to help to validate the assessment of tree age.
A total of 90 trees were sampled to assess the mean age per site. Tree age was determined by adding 7 years to the total rings of the wood samples collected at breast height.
Wood cores were air-dried and cut into 2 mm radial strip wood (pith to cambium) for the ring width measurement with a precision of 0.001 mm through a microscope with a micrometric displacement table (Leitz SM-Lux, Leica Microsystems, Wetzlar, Germany). This procedure allowed the determination of the diameter growth through time, assessing the trees development.
Relative density of the stands was evaluated based on the Reineke Stand Density Index [
22],
(Equation (1)). The maximum size–density relationship, also known as self-thinning line, supports the definition of the
. This metric can be interpreted as the maximum expected number of trees (
, ha) for a stand when its average diameter (
, cm) is 25 cm. It is based on an allometric relationship between the number of individuals (plants) and their size (using
as a proxy) that assumes the variation in the number of trees is proportional to their growth in diameter.
In pure stands, the allometric coefficient “
” indicates the intensity of intraspecific competition (self-tolerance). It was originally assumed by Reineke to be a constant value equal to 1.605, but it was demonstrated that it varies with species [
23,
24,
25]. For instance, for
Quercus oak in Portugal it was defined as 1.806 [
24] while for
Pinus pinaster, [
25] found
= 1.987. For the case study the authors opted to use the value of 1.649 proposed by [
26] for the species in Turkey, as a proxy to assess relative density.
Dominant height was evaluated as the average height of the four largest trees per plot. Stand volume was estimated with the tree volume equation developed by [
27], for the species in Portugal. Site index was evaluated according to [
28].
2.3. Statistical Analysis
Data were considered by site (Paredes de Coura, Caminha, Vila Pouca de Aguiar, Campeã, Manteigas, and Vale do Zêzere) for statistical characterization and modelling purposes. The statistical analysis was performed with JMP software (SAS Institute). The Schumacher function [
29], proposed by the author for “generalized use” [
30], was selected as the base model to describe and examine the diameter–age growth pattern. The growth function is presented in Equation (2) and the yield function, used for modelling the diameter growth is shown in Equation (3).
In Equations (2) and (3),
is the response variable, assumed to be the variable diameter at 1.30 m of height (
, cm),
refers to tree age (years),
is the asymptote, and
is the constant expressing the rate of decrease in the relative growth rate. The model assumes that the relative growth rate increases linearly with the squared inverse of time [
30].
The parameters
and
were estimated using non-linear least squares methods. The fitting process of a set of observations taken from the same individuals, as happens with time series data, is usually associated with a problem of autocorrelation of the error term. The presence of autocorrelation from nondependent observations can affect the estimated values of the standard errors but does not produce bias on the parameters estimates [
31]. As the major focus is on the parameter estimates, the possibility of this problem occurring was not discarded but did not compromise the overall statistical analysis.
The evaluation of the quality of the adjustment was based on the visual analysis of the estimated curve superimposed on the scatter plot of the observed values of diameter-age, and on quantitative analysis, the latter through the value of the standard error associated to the parameters’ estimates, and the
and
-like statistics [
32], being aware of these estimates no longer have the minimum variance property [
31].
Statistical analysis was followed with analysis of variance (ANOVA) and Tukey’s test for comparison of means, to assess differences in diameter growth between sites. These analyses were performed on a sub-sample of diameter data from the sampled trees, selecting the diameter measurement corresponding to a fixed age, set at 50 years, in order to use a common age for all and eliminate the effect of multiple measurements of the same tree. The option for 50 years corresponds to one of the highest values that can be found common to all trees (lower minimum age values equal to 56,
Table 2). This age is associated with the maturity phase of the species, in which greater growth stability is expected.
4. Discussion
There is a lack of knowledge concerning the annual growth increments of the
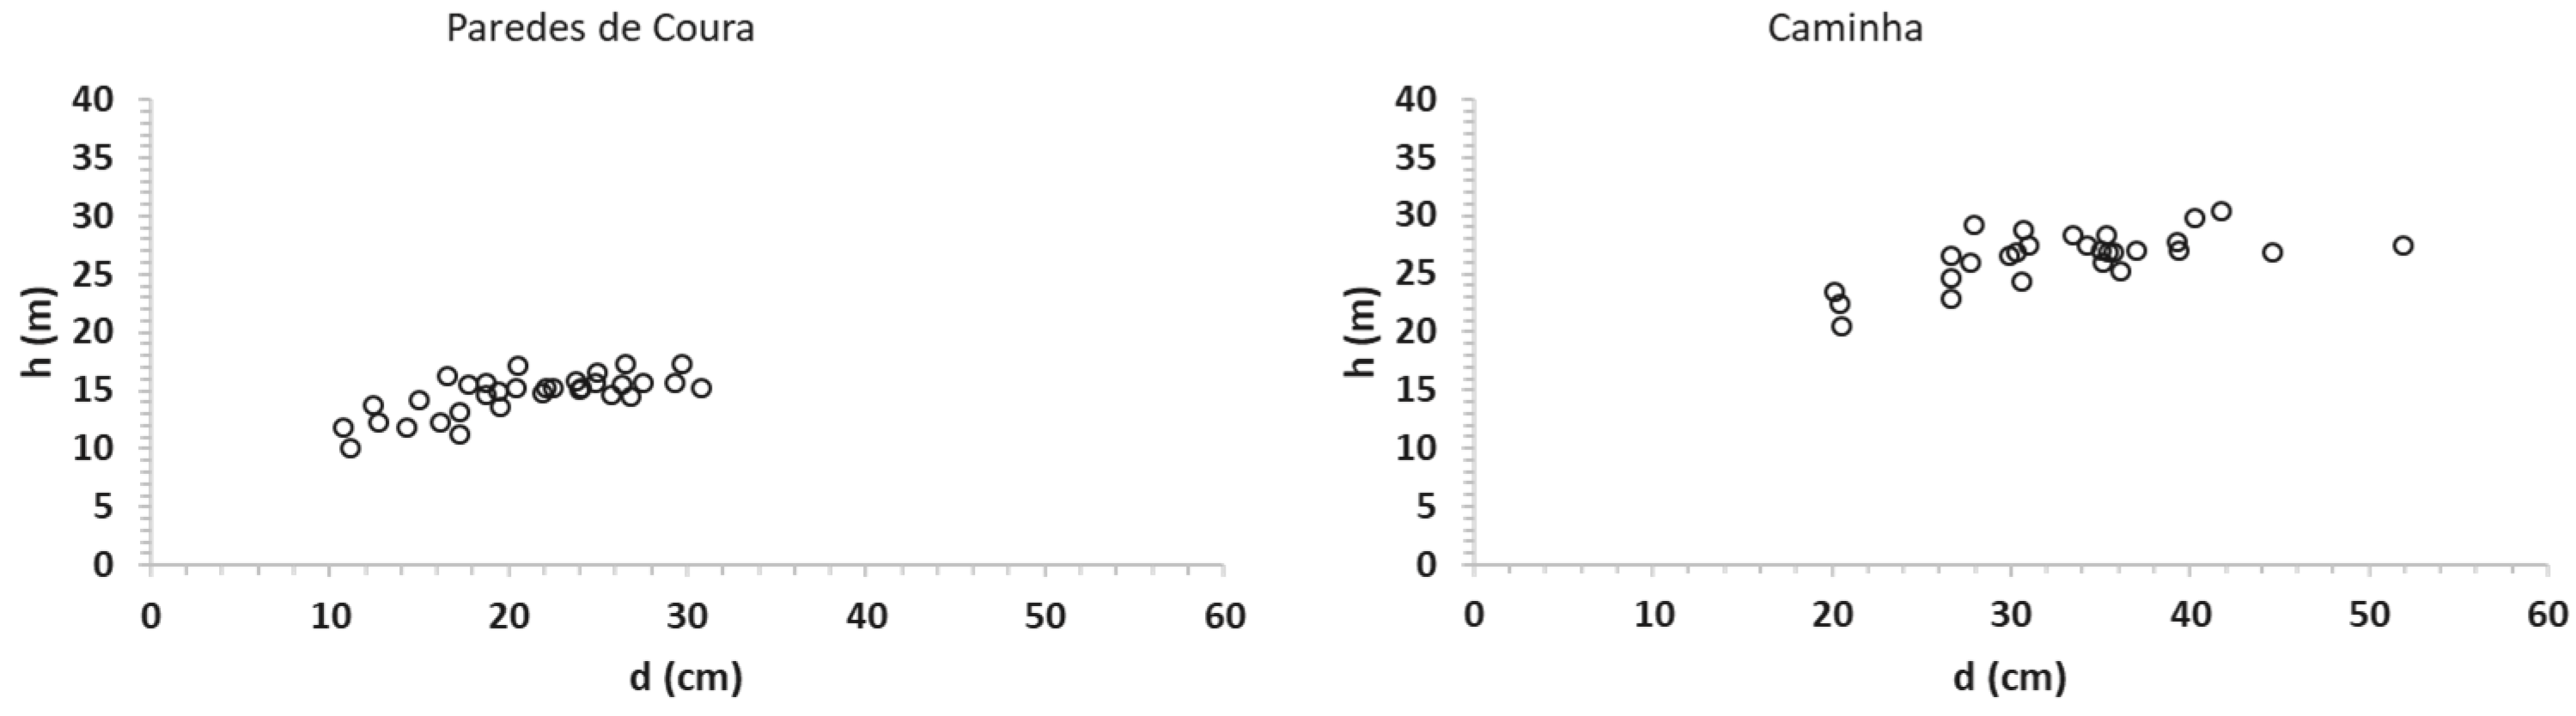
P. nigra stands planted in Portugal over 50–90 years ago. There is no data able to reflect the development of the species in the planted sites in what concerns its aptness. Information at different levels is required to evaluate its current status. Due to the multiple factors that can influence the trees growth such as soil, climate, altitude, slope, silvicultural management, and stand density, among others, we are unable to recover information on the individual influence of these factors, namely the ones that could heavily affect diameter growth, such as stand density. Nevertheless, the database allows the recognition of different marked growth patterns between sites and individual differences at some sites. Taking into account both the diameter and the height of the sampled populations (
Figure 6), trees from Paredes de Coura and Vale do Zêzere are clearly distinguished by the lower height values for fixed diameter values, and also by the overall lower maximum values observed for these variables, comparatively to the values achieved by trees of the same average age (around 58 years) from other sites (Caminha and Campeã, see
Table 3).
In a previous work [
33] carried out on the same trees as this article, it was found that concerning the climatic effect (temperature and precipitation), stronger relationships were observed with wood density than with ring width, with emphasis on the consistently positive effect of temperature on wood density. In general, it was concluded that water availability in the summer increases the latewood width, which consequently results in a higher ring width and wood density. However, the authors warn that in addition to climatic factors, other important factors can also influence tree growth. It was the case of the trees of Paredes de Coura, where despite the climatic conditions are apparently favourable, namely regarding the annual mean precipitation and temperature registered in that site, due to its location on top of the mountain with a thin layered soil profile, its growth (ring width) was much lower than expected. Regarding stand density, although the Paredes de Coura site presents a number of trees per hectare larger than the others (
Table 2), it is one of the two sampled sites presenting a lower site occupancy
equal to 32). On the reverse, the stands sampled in Caminha, Vila Pouca de Aguiar, and Campeã are the ones with the highest coverage levels, approaching the lower limit of self-thinning (
values around 50–56% [
34]. These three sites are also the ones presenting higher values of growing stock (stand volume 632–748 m
3 ha
−1). Taking into account the high value of
for Campeã, mortality noticed in this stand might be associated both with competition, but also to susceptibility to wind damages, due to its exposure in the Alvão mountain, on very steep terrain. The species is classified as being of medium stability to wind [
35]. In Portugal, public data on forest damages due to extreme weather events is rather limited, and when existing it usually does not provide information about the specific event associated with those damages [
36]. For this reason, it was not possible to confirm what were the main factors that contributed to the mortality, although, as stated by [
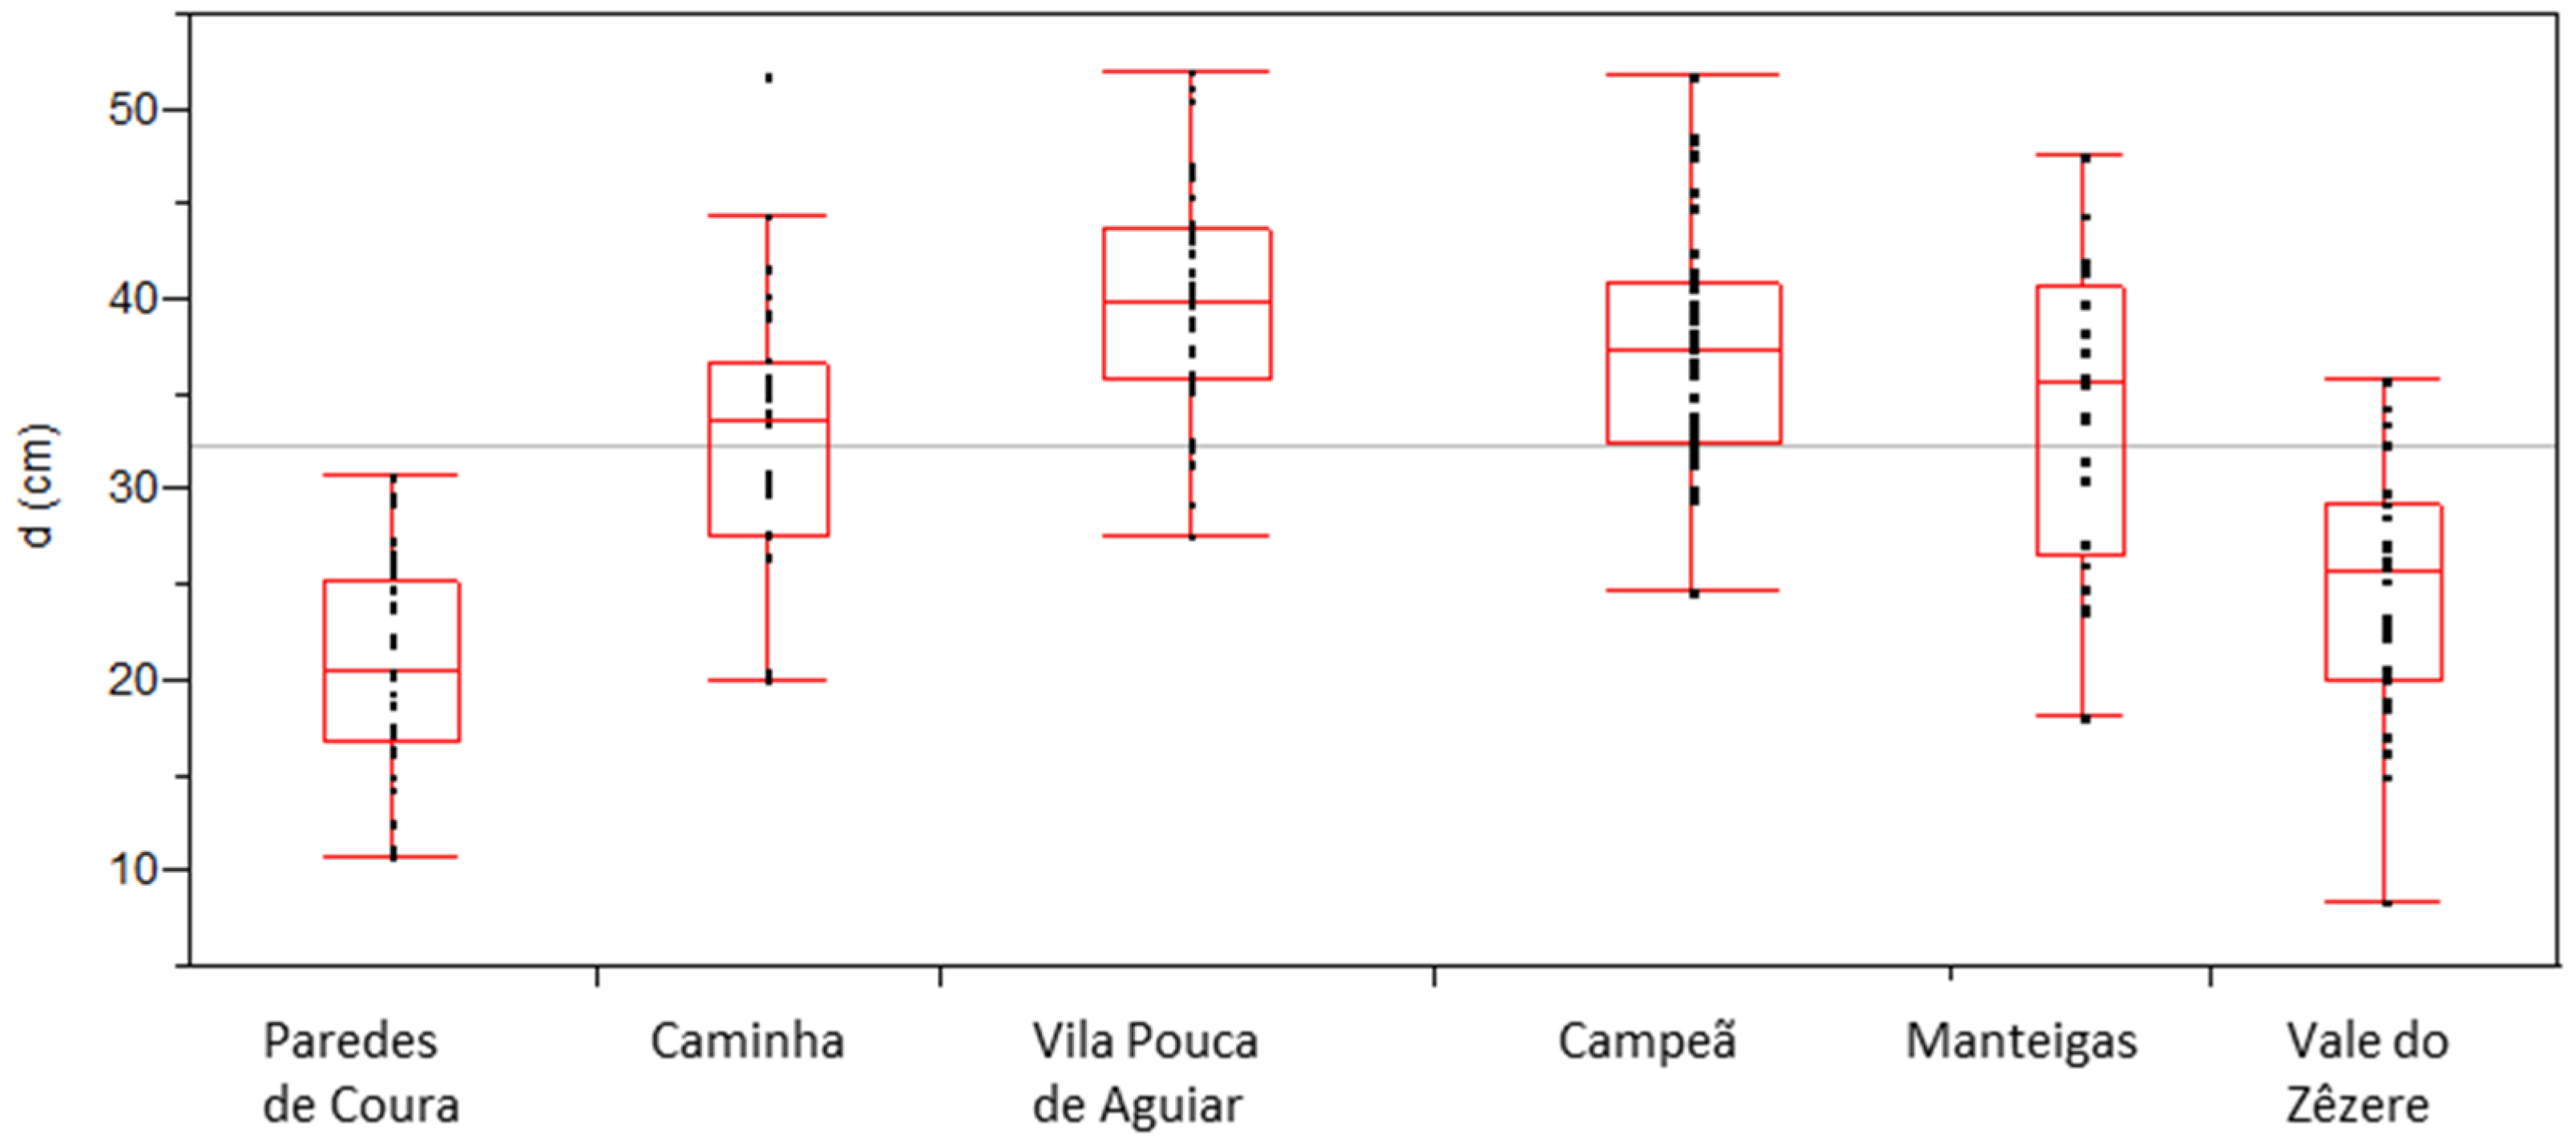
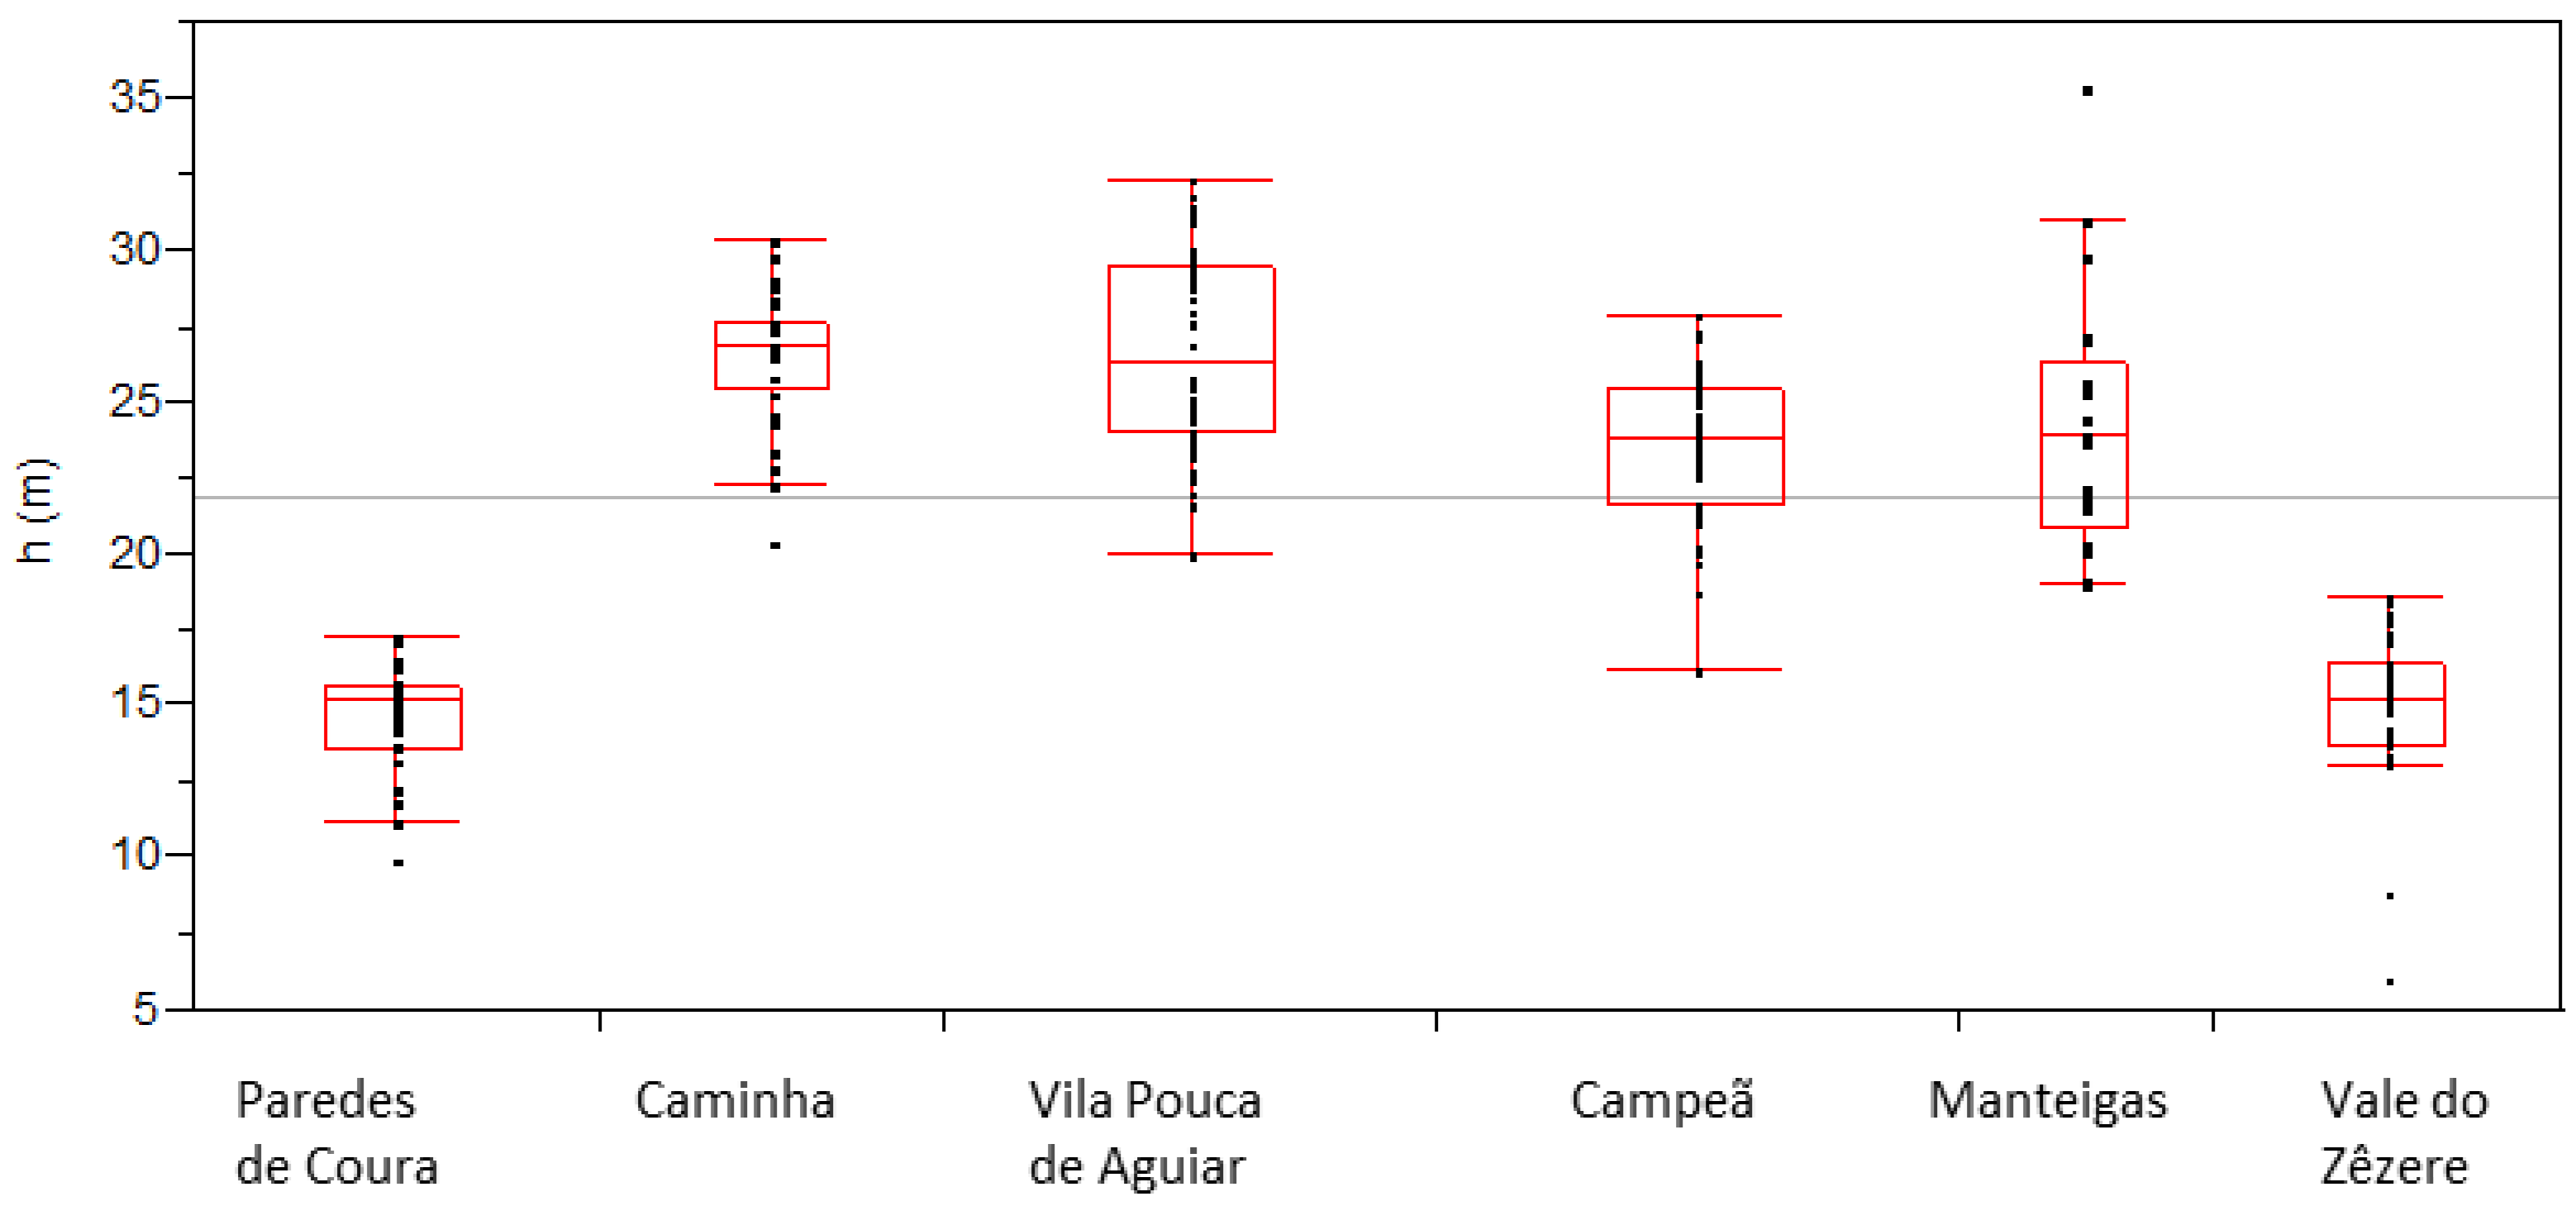
37], both types of causes—mortality due to extreme weather events and induced by competition—can simultaneously occur. In terms of differences in the diameter and height of the trees in the populations, the differences between sites are evident, with sites Paredes de Coura and Vale do Zêzere standing out as having the lowest values for these variables (
Table 3,
Figure 4 and
Figure 5). The effect that could be attributed to age is not sufficient to explain the differences since the trees at these two sites are of a similar age to those at the Caminha and Campeã sites, both with greater development both in diameter and height. The differences in average tree height (
Table 3 and
Figure 5) among populations with a similar age point to the effect of site and/or of genetics differences, clearly separating Paredes de Coura (14.6 m) and Vale do Zêzere (14.9) from Caminha (26.5 m) and Campeã (23.6) populations.
The tree height–diameter dispersion plot (
Figure 6) allowed us to identify structural differences among sites, with the trees from Paredes de Coura and Vale do Zêzere being distinguishing from the others.
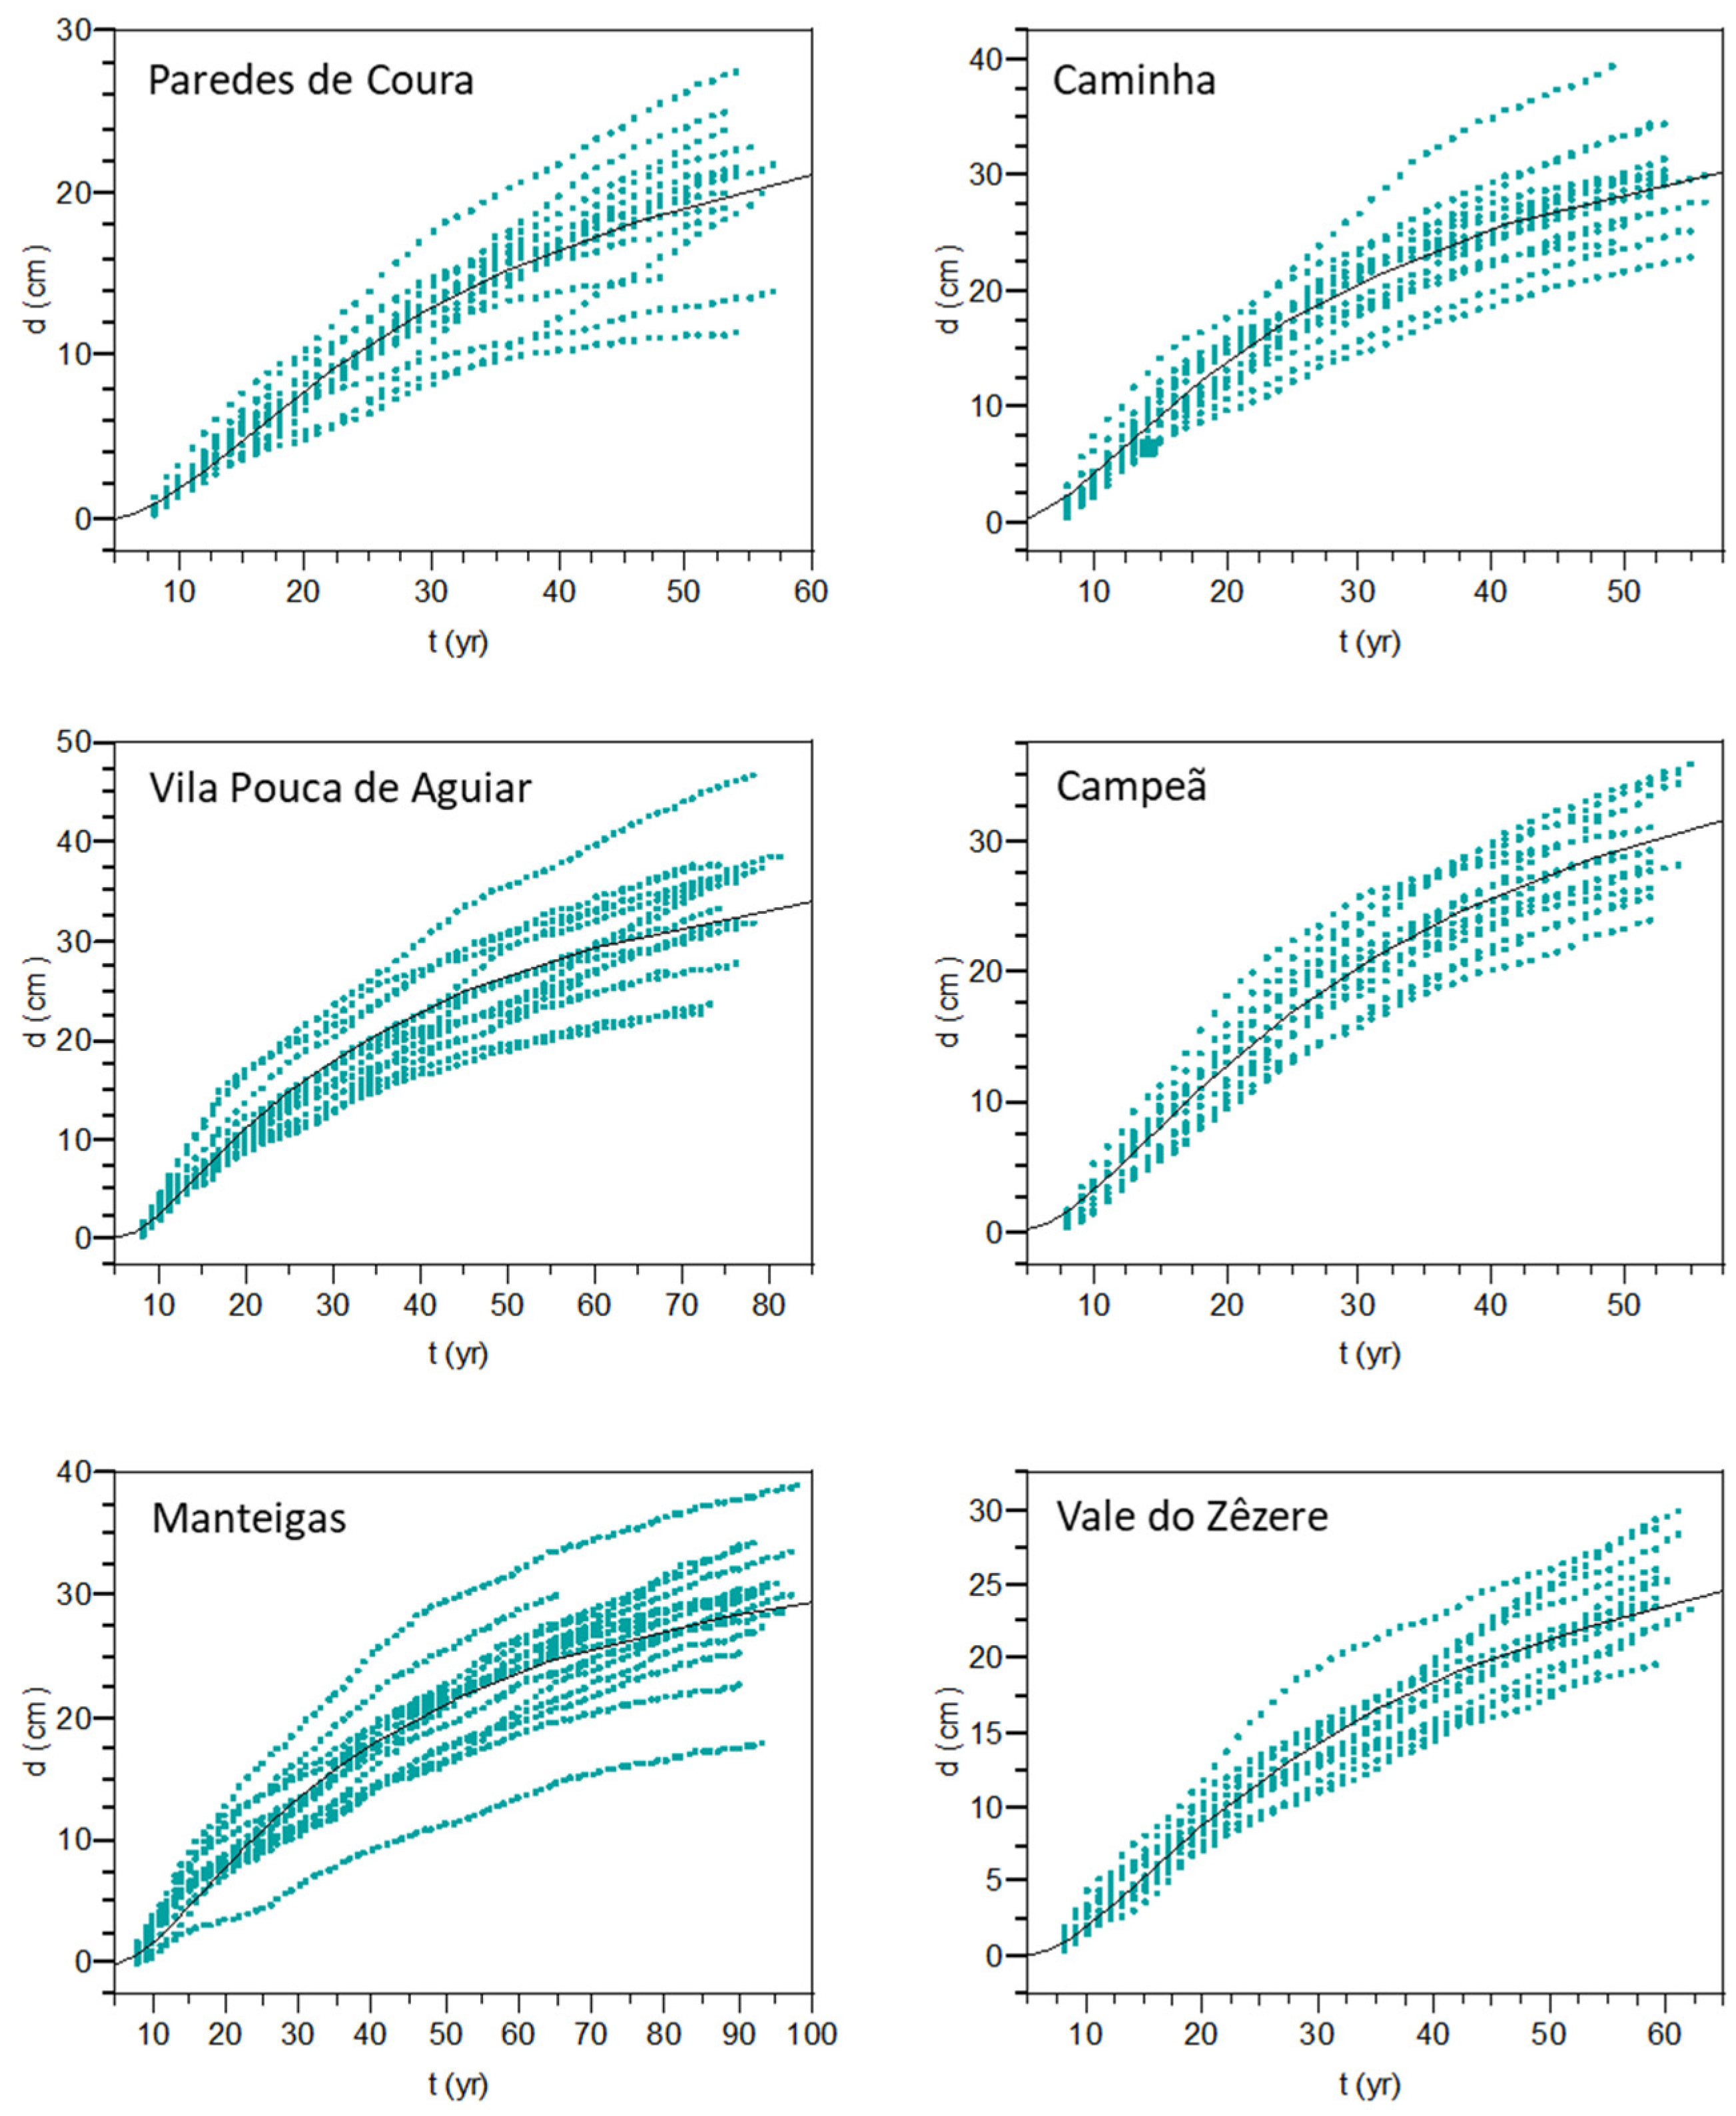
The patterns of radial growth development were adequately described with the Schumacher growth function, as shown by the goodness-of-fit statistics (
Table 4) and visually depicted in
Figure 7. Trees in Manteigas present a high growth variability, which results in a lower
-like value for this site comparatively to the overall values obtained. This high variability can be attributed, at least partially, to age. Trees from this population are the oldest with an age ranging from 90–98 years. Changes in the crown position of trees are likely to have occurred over time, so those sampled may have been codominant or more affected by competition at some earlier time. A relatively large variability of growth among trees is also evidenced in the mature stand of Vila Pouca de Aguiar, with 71–81 years.
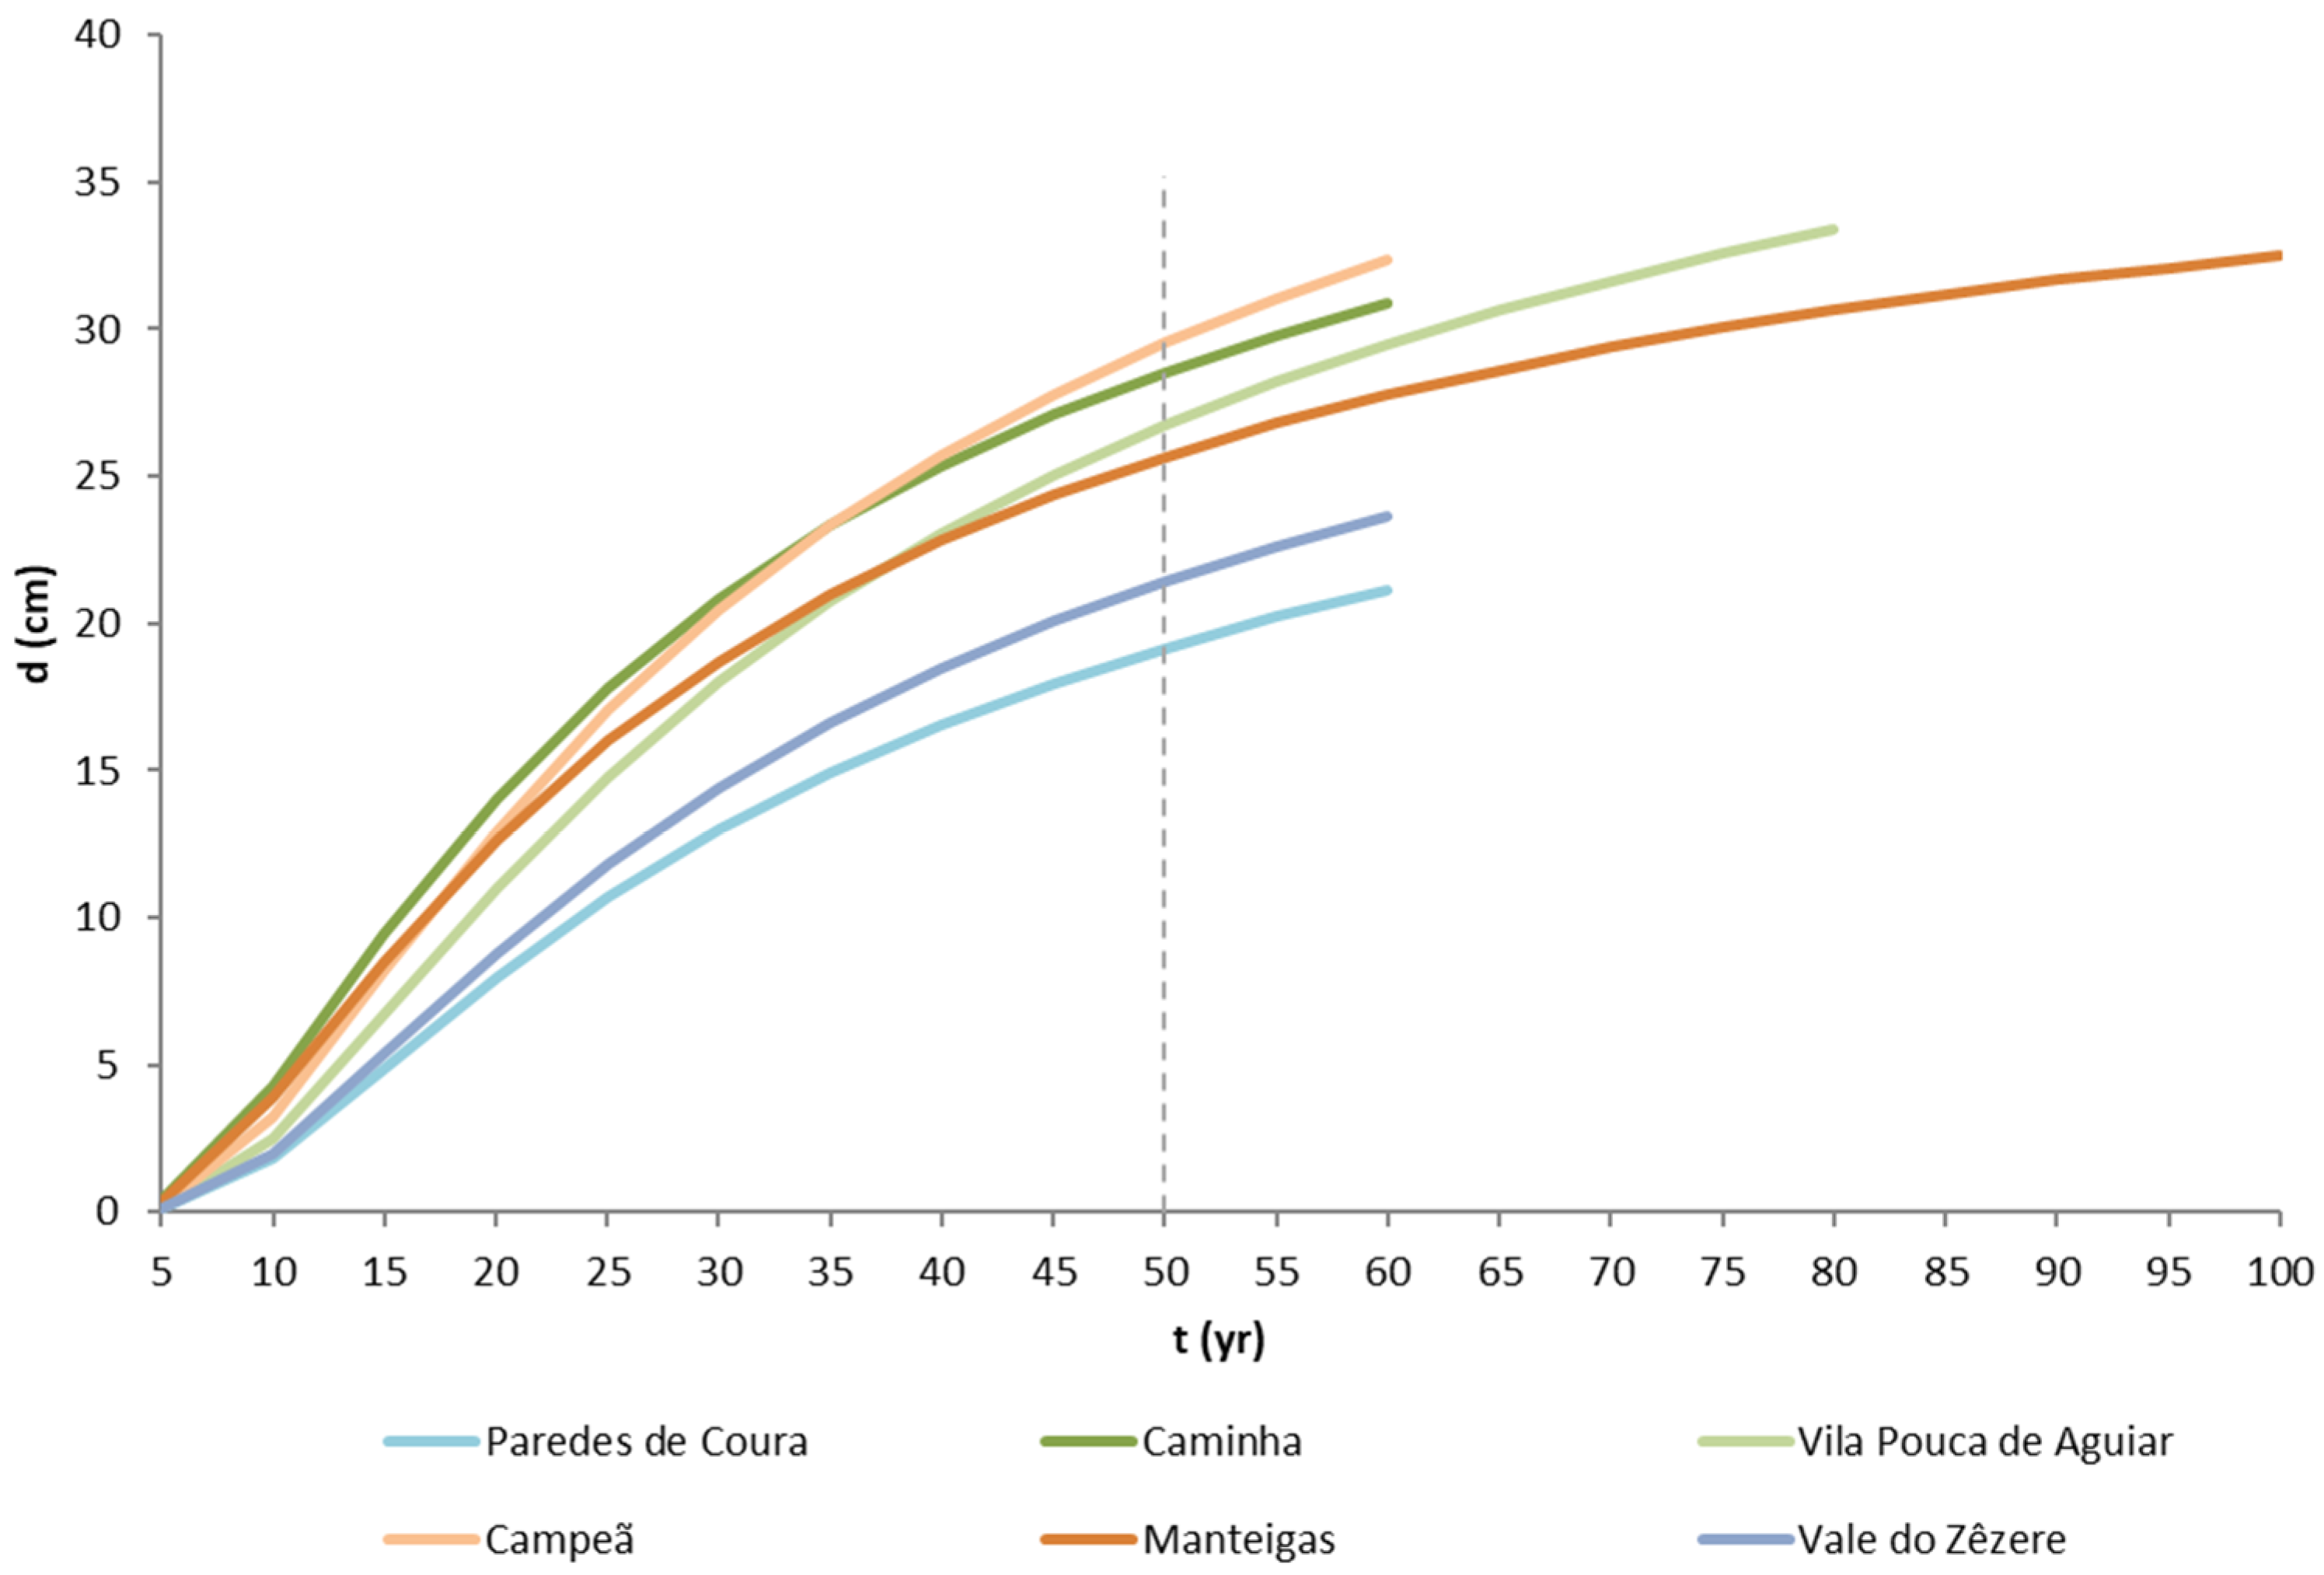
Observing
Figure 8, there are similarities in the diameter growth patterns of Paredes de Coura and Vale do Zêzere, both with the poorest diameter growth, an intermediate growth in Manteigas, and a higher development for the remaining sites. The highest asymptote estimates were obtained for Campeã, Vila Pouca de Aguiar, and Caminha (
Table 4). Paredes de Coura, which is closely located to Caminha (
Figure 2), unexpectedly presented the lower growth of the six study sites, with a similar development to the stands located at to the southernmost location, Vale do Zêzere. The differences in growth pattern continue throughout the development of the stands, with the lowest radial growth being very evident even at low ages at these two sites.
The differences in radial growth do not seem to be attributable to stand density, given the lower relative density values, far below the threshold for thinning, found at the sites where the stands showed less radial growth. This fact could be due to the conditions of the site that are not ideal, presenting shallow soil that could inhibit the trees growth. The trees in Manteigas, the site that presents the highest average growth rate for the species (
), do not overall outperform the growth observed in other populations (Campeã, Vila Pouca de Aguiar, and Caminha), as exposed by the lower value of the asymptote (ranking third, after Paredes de Coura and Vale do Zêzere). For these four populations Manteigas, Campeã, Vila Pouca de Aguiar, and Caminha, the growth pattern does not allow for a clear identification of which one shows the greatest growth potential up to the age of 30–40 years. From 40 years of age onwards, the pattern seems to stabilise (
Figure 8). These differences are statistically confirmed through ANOVA and the corresponding Tukey’s mean comparison test performed for the 50 year olds (
Table 5 and
Table 6).
Considering the distribution of the sites in the territory (
Figure 2), the analysis of the growth pattern does not show any similarities or differences that can be attributed to specific latitudinal or longitudinal gradients. In fact, as shown in
Table 3 (data characterization),
Table 4 (estimates of the parameters of the growth function), and
Table 6 (comparison of average values at a common age), the two populations with less growth development were observed in the latitudinal extremes (Paredes de Coura in the north, 41°52′0.00″ N, and Vale do Zêzere further south, 40°19′19.00″ N), while the three populations with better growth development cover the longitudinal extremes (Caminha, in the west, 8°43′57.00″ W and Vila Pouca de Aguiar further east, 7°35′31.36″ W). Based on the research results, the locations more suitable for planting
P. nigra in Portugal are the regions close to Vila Pouca de Aguiar, Campeã, and Caminha sites, although other characteristics, such as the type of the soil, should be previously considered, given the species’ behavior in Paredes de Coura. On the other hand, the population sampled in Vale do Zêzere has not shown any traits that sustain the option for this species, in afforestation or reforestation programs, in the region. Considering afforestation projects, future climate change should be considered. In terms of climate scenarios, Portugal will be warmer and drier (IPMA portal,
http://portaldoclima.pt/pt/, accessed on 8 April 2022). Warming should be greater in the south and interior than in the north and coast. The annual precipitation will decrease by about 15% in 2040 and 30% by 2100. The decrease in precipitation will be more pronounced in the southern region of Portugal (same source). Combining the location of
P. nigra sampled stands with the scenario of future changes, it is reasonable to assume that the growth potential of the species in Portugal will not be significantly affected in places where it currently performs best, because these locations do not correspond to the regions where changes in temperature and rainfall will have the greatest influence.
The comparison of the behavior of the species in mainland Portugal with the behavior of the species in its natural range can provide useful information about what to expect in the future in these regions. In a previous study by [
33], the average ring width for these Portuguese populations was calculated and compared with other results across Europe. It was concluded that for the same species, the average ring width was higher in these populations when compared to studies performed in Spain [
10,
19,
20], Greece [
38], and Austria [
39]. For a brief reference, to provide information about the potential development of these populations outside the growth range, the standing volume of the sampled stands, evaluated during the inventory (
Table 2), were compared with the expected values for the species in the Iberian system according to the stand tables developed by [
28]. It should be noted that the
P. nigra subspecies considered therein is
salzmannii. Four of the sampled sites, Caminha, Vila Pouca de Aguiar, Campeã, and Manteigas, identify with site quality class I (
of 20 m at a stand age of 60 years), corresponding to the best site quality among the ones defined by [
28], while Paredes de Coura and Vale do Zêzere are site quality class II (
of 17 m at a stand age of 60 years). The comparison of stand volume was made considering a moderate thinning regime, and took into account the degrees of occupation, quantified by the basal area, to perform the adjustment between the actual volume and the tabulated volume. A production lower than the values reported in the tables was found in Paredes de Coura (−17%), as well as in Vale do Zêzere and Manteigas (both with −11%). As for the other sites, with better growth, the production observed in Vila Pouca de Aguiar and in Campeã exceeds by +6% and +11%, respectively, of the tabulated value. In Caminha, the difference in standing volume reaches +22%. The comparison of stand measures, such as volume production, with other published data of
P. nigra growing in its natural growth range requires some caution, since the genetic component and the silviculture practiced, among other factors, have an influence on production. Despite the caveats mentioned, the results point to a distinct development of the species outside its natural range compared to other populations of the species in its natural range. Differences in growth pattern vary depending on several factors, which should at least take into account the effect of population and the climatic and site conditions where the populations grow.


