1. Introduction
Land use/land cover (LULC) is the result of a combination of natural and artificial forces, reflecting the natural attributes of land and the impact of human activities [
1]. The spatial distribution pattern of and dynamic changes in LULC not only affect the regional economic-social development but also regional environmental and climate change [
2]. Satellite remote sensing technology provides strong technical support for the large-scale and rapid acquisition of LULC information [
3]. In 1995, the International Geosphere-Biosphere Programme (IGBP) and the International Human Dimensions Programme on Global Environmental Change (IHDP) jointly proposed the Land Use and Land Cover Change project to evaluate the ecological and environmental effects of LULC change by studying the mechanisms through which human society, the ecological environment, and LULC change interact. Researchers are now paying more attention to LULC changes, which have become a frontier and hot topic in current global change research [
4,
5,
6].
Several medium- and high-resolution global-scale LULC datasets are available for users to browse and download for free. Some well-known datasets include the IGBP DISCover product of the United States Geological Survey (
https://daac.ornl.gov/, accessed on 5 January 2022) [
7], the UMD product of the University of Maryland (
https://idn.ceos.org/, accessed on 21 January 2022) [
8], the GLC product of European Commission Joint Research Centre (
https://forobs.jrc.ec.europa.eu/, accessed on 21 January 2022) [
9], the MODIS LC product of Boston University (
https://lpdaac.usgs.gov/, accessed on 21 January 2022) [
10], and the GLOBCOVER product of the European Space Agency (ESA,
https://www.esa.int/, accessed on 22 January 2022). Most of them have a spatial resolution of 300 m, 500 m, or 1 km, and the update frequency is 5 to 10 years. Since the early 2010s, with the rapid increase in remote sensing observation platforms, the enhancement in remote sensing cloud computing capabilities, and the improvement in LULC mapping technology, increasing numbers of LULC datasets with a high spatial resolution (10 to 30 m) have been constructed [
11]. These LULC datasets include the Globeland30 dataset developed by the National Geomatics Center of China (NGCC) [
12], which provides global 30 m resolution data in three issues of 2000, 2010, and 2020, which can be freely obtained by users (
http://www.globallandcover.com/, accessed on 31 January 2022); the GLC_FCS30 dataset developed by the Aerospace Information Research Institute, Chinese Academy of Sciences (AIR, CAS) [
13,
14,
15], with an update cycle of 5 years, containing eight 30 m resolution global data from 1985 to 2020, which can be freely obtained (
https://data.casearth.cn/, accessed on 31 January 2022); the LSV10 dataset developed by the European Space Agency (ESA) [
16], with a resolution of 10 m in 2020, which can be freely obtained (
https://esa-worldcover.org/, accessed on 31 January 2022); and the ESRI 2020 Land Cover 10 m (ESRI10) dataset developed by the Environmental Systems Research Institute (ESRI) [
17], with an update cycle of one year and containing five phases of global 10 m resolution data from 2017 to 2021, which can be freely accessed online (
https://www.arcgis.com/, accessed on 31 January 2022).
The above LULC datasets provide basic data support for scholars worldwide in conducting research in the fields of nature, ecology, environment, and resources [
18,
19]. However, different LULC datasets are different in terms of the classification system, product accuracy, etc. Therefore, their basic characteristics must be understood before conducting research in a specific study area. Scholars have evaluated the authenticity of different LULC datasets in different regions. Using field survey data as a reference, Heiskanen et al. tested and evaluated the vegetation type data of GLC, MODIS LC, and MODIS VCF datasets in northern Finland. The results showed that the overall accuracy of the first-level class of the three products was high, but their fine-type accuracy was substantially lower [
20]. Xu et al. evaluated the accuracy and consistency of CGLS-LC100, ESA-S2-LC20, and FROM-GLC-Africa30 datasets in Africa using measured sample data and statistics from the Food and Agriculture Organization of the United Nations (FAO). The results show that the overall accuracy of the three products was greater than 60%, and the CGLS-LC100 results were most consistent with the FAO statistics, but they found significant differences in the spatial details among the different products [
21]. David et al. used the stratified sampling method to evaluate the accuracy of the NLCD dataset in Alaska; the results showed that the overall accuracy of the first- and second-level classes was 83.9% and 76.2%, respectively [
22].
Analyzing the consistency of multisource LULC datasets is also important to explore the characteristics and application potential of LULC datasets, which is basic work required to improve and optimize existing datasets [
23,
24]. In this direction, Hu et al. proposed a basic process of analyzing the consistency of multisource LULC datasets, summarizing specific models of the similarity of the composition type, degree of category confusion, spatial consistency, and reference accuracy [
25,
26]. Yang et al. applied index methods such as statistical area, distribution pattern, and spatial analysis to compare the application potential of the IGBP DISCover, UMD, GLC, MODIS LC, GLCNMO, CCI-LC, and GlobeLand30 datasets in China [
27]. McCallum et al. set up test sites in South America, North America, Europe, Africa, Australia, Russia, and Asia, and compared the accuracy and consistency of GLC, UMD, MODIS LC, and IGBP DISCover datasets in these different regions using classification merging and grid-by-kilometer statistical area methods [
28]. Although different LULC datasets credibly describe the overall pattern of a region, their spatial consistency may widely vary in different study areas, spatial scales, and land types [
23,
24,
25,
26,
27,
28]. In addition, previous researchers mostly focused on the comparative analysis of multisource LULC datasets with coarse resolution. No comparative study of high-precision LULC datasets with 10 and 30 m resolution emerging since 2017 has yet been conducted.
The Indochina Peninsula is a key region connecting East Asia, South Asia, and Europe, and its geopolitical and economic statuses are important. In the Indochina Peninsula, except for Vietnam and Thailand, the remainder of the countries (Laos, Cambodia, and Myanmar) are the world’s least developed countries, as determined by the United Nations. Due to the underdevelopment of the regional economy and society, the Indochina Peninsula generally lacks national-scale LULC datasets developed for each country, and enough human and material resources to conduct ground truth tests on the global LULC datasets. However, the Indochina Peninsula serves as a bridge linking developed regions such as East Asia and Western Europe. Especially in the context of China’s Belt and Road initiative, the Indochina Peninsula has become an important area for China’s ambitious “six corridors and six channels serving multiple countries and ports” infrastructure planning. Therefore, the latest LULC status in the Indochina Peninsula must be understood, the dynamic history and future changes of LULC in this region need to be analyzed, and the economic, environmental, and climate change effects that may be caused by infrastructure construction must be explored. This has become an important issue of concern to scholars both in and outside the region. In this context, fully using the current internationally renowned LULC datasets to conduct analysis provides convenient source for researchers in the field.
To this end, in this study, we selected the LSV10, GLC_FCS30, ESRI10, and Globeland30 data products, and conducted accuracy and spatial consistency analyses in Myanmar, Vietnam, Thailand, Cambodia, and Laos, which are located on the Indochina Peninsula. To evaluate the degree of agreement and reliability between different datasets, we aimed to achieve three objectives:
- (1)
To reveal the law of land use/land cover composition on the Indochina Peninsula;
- (2)
To test the spatial consistency of the four LULC datasets on the Indochina Peninsula;
- (3)
To evaluate the overall and classification accuracies of the four LULC datasets to provide a basis for data selection in subsequent studies.
2. Study Area and Data
2.1. Study Area
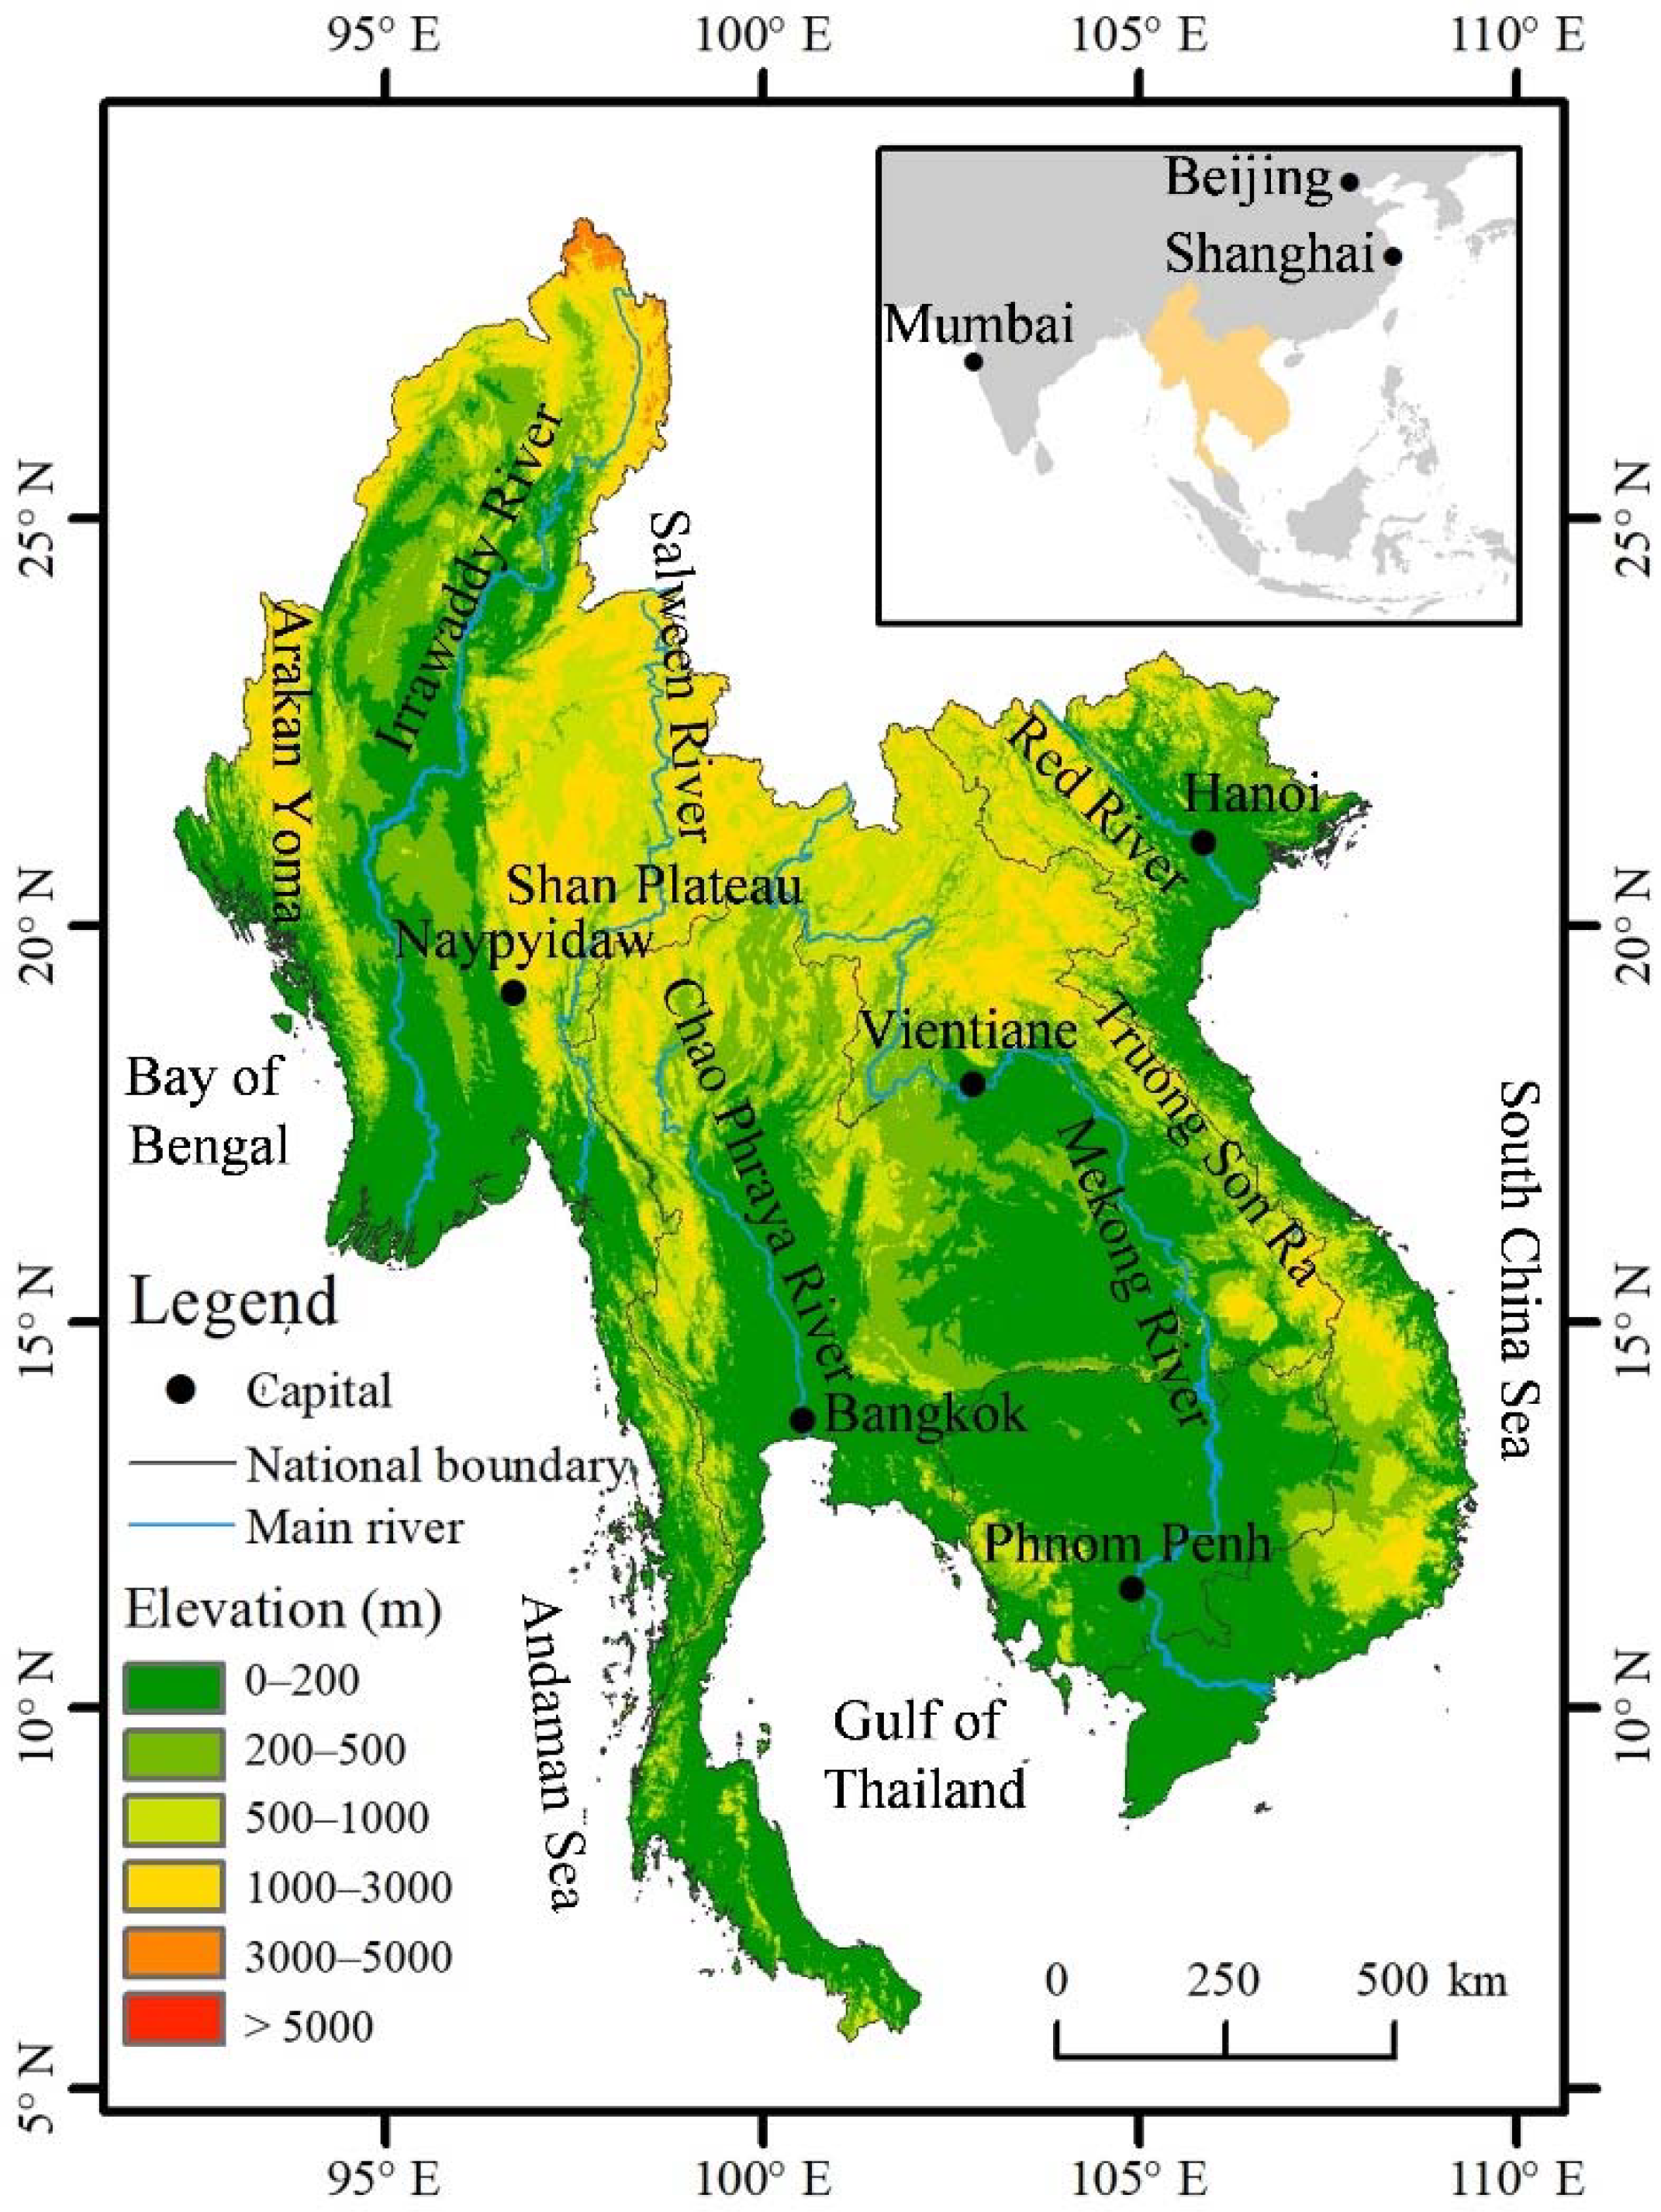
The Indochina Peninsula is located between China and the South Asian subcontinent; it borders China’s Guangxi, Yunnan, and Tibet regions to the north; the Bay of Bengal and the Andaman Sea on the northern edge of the Indian Ocean to the west; Malaysia to the south; and the South China Sea on the western edge of the Pacific Ocean to the east. The area ranges from approximately 92.0 to 109.5° E and 5.5 to 28.5° N. The study area included all the territories of Vietnam, Thailand, Laos, Cambodia, and Myanmar on the Indochina Peninsula, having a total area of 2.065 × 10
6 km
2 (
Figure 1).
The Indochina Peninsula has a tropical monsoon climate, experiencing high temperatures throughout the year, with the year divided into two seasons: dry and rainy. June–October is the rainy season, when the southwest monsoon prevails, and precipitation is abundant; November–May is the dry season, with the northeast monsoon prevailing and little rainfall. On the Indochina Peninsula, many mountains, rivers, and valleys are located in the north and south. The main mountain ranges are the Arakan Yoma in the west, a series of mountain ranges extending southward from the Shan Plateau in the middle, and the Truong Son Ra in the east. The main rivers are the Irrawaddy, Salween, Red, Mekong, and Chao Phraya Rivers. The overall terrain of the Indochina Peninsula is high in the north and low in the south. The northern mountains are high and the valleys are deep, being mostly plateau canyons and hills. The southern river valleys are open and the terrain is flat, with many estuary deltas and alluvial plains.
In 2018, the total population of the five countries was 0.242 × 10⁹, accounting for 3.10% of the world’s total population; the regional GDP was USD 0.864 × 10¹², accounting for 1.01% of the global economic total. The contribution of the added value of the primary, secondary, and tertiary industries to the regional GDP was roughly 12.1%, 52.0%, and 35.9%, respectively. Compared with the GDP proportion per population of the world, that of the Indochina Peninsula lags considerably behind. Compared with the industrial structure of developed countries, Indochina Peninsula is still in the initial stage of industrialization, which is reflected in the high contributions of primary and secondary industries to the total GDP. With economic globalization, especially the industrial restructuring and industrial transfer from neighboring China, the economy of the Indochina Peninsula grew rapidly from 2000 to 2020, with an average annual GDP growth rate of 9.32%, which has led to considerable improvements in the economic and social quality of the countries.
2.2. LULC Datasets
International academic institutions have released several global LULC datasets based on satellite remote sensing images. Due to the differences in satellite platforms and sensors, land classification systems, LULC mapping methods, and LULC dataset release times, the LULC datasets differ in terms of the current situation, spatial resolution, and product accuracy. In this study, we selected 4 LULC datasets that were the most current (2020), had the highest resolution (10–30 m), and had high precision (overall accuracy between 74% and 86%) for consistency evaluation: LSV10 [
16], GLC_FCS30 [
13,
14,
15], ESRI10 [
17], and Globeland30 [
12]. A brief summary of the datasets is provided in
Table 1.
2.3. Data Preprocessing
Before consistency analysis, we preprocessed the 4 LULC datasets, which included image stitching and cropping, projection transformation, upscaling transformation, and classification system merging.
First, we stitched together 38 LSV10, 16 GLC_FCS30, 10 ESRI10, and 16 Globeland30 datasets. Then, we converted the coordinate system of the stitched data to the WGS_1984_UTM_Zone_47N coordinate system (the central meridian was 99° E and the longitude range was 96–102° E). Then, we used the unified study area boundary data to cut them down and finally obtain 4 study-area LULC datasets.
As these 4 LULC datasets have different resolutions (10 or 30 m), we used the maximum area aggregation method to convert the 10 m resolution LSV10 and ESRI10 data to 30 m to be consistent with GLC_FCS30 and Globeland30.
Because the 4 LULC datasets use different LULC classification systems (
Table 2), we needed to reclassify them to the unified LULC classification system. Drawing on previous research experience [
25,
26,
27,
28], we identified 9 common LULC types (
Table 3).
After the above operations, the LULC data obtained in the four study areas had a small number of missing pixel values. We removed these pixels without including them in the analysis. This avoided introducing new uncertainties.
4. Result Analysis
4.1. Regional Land Composition
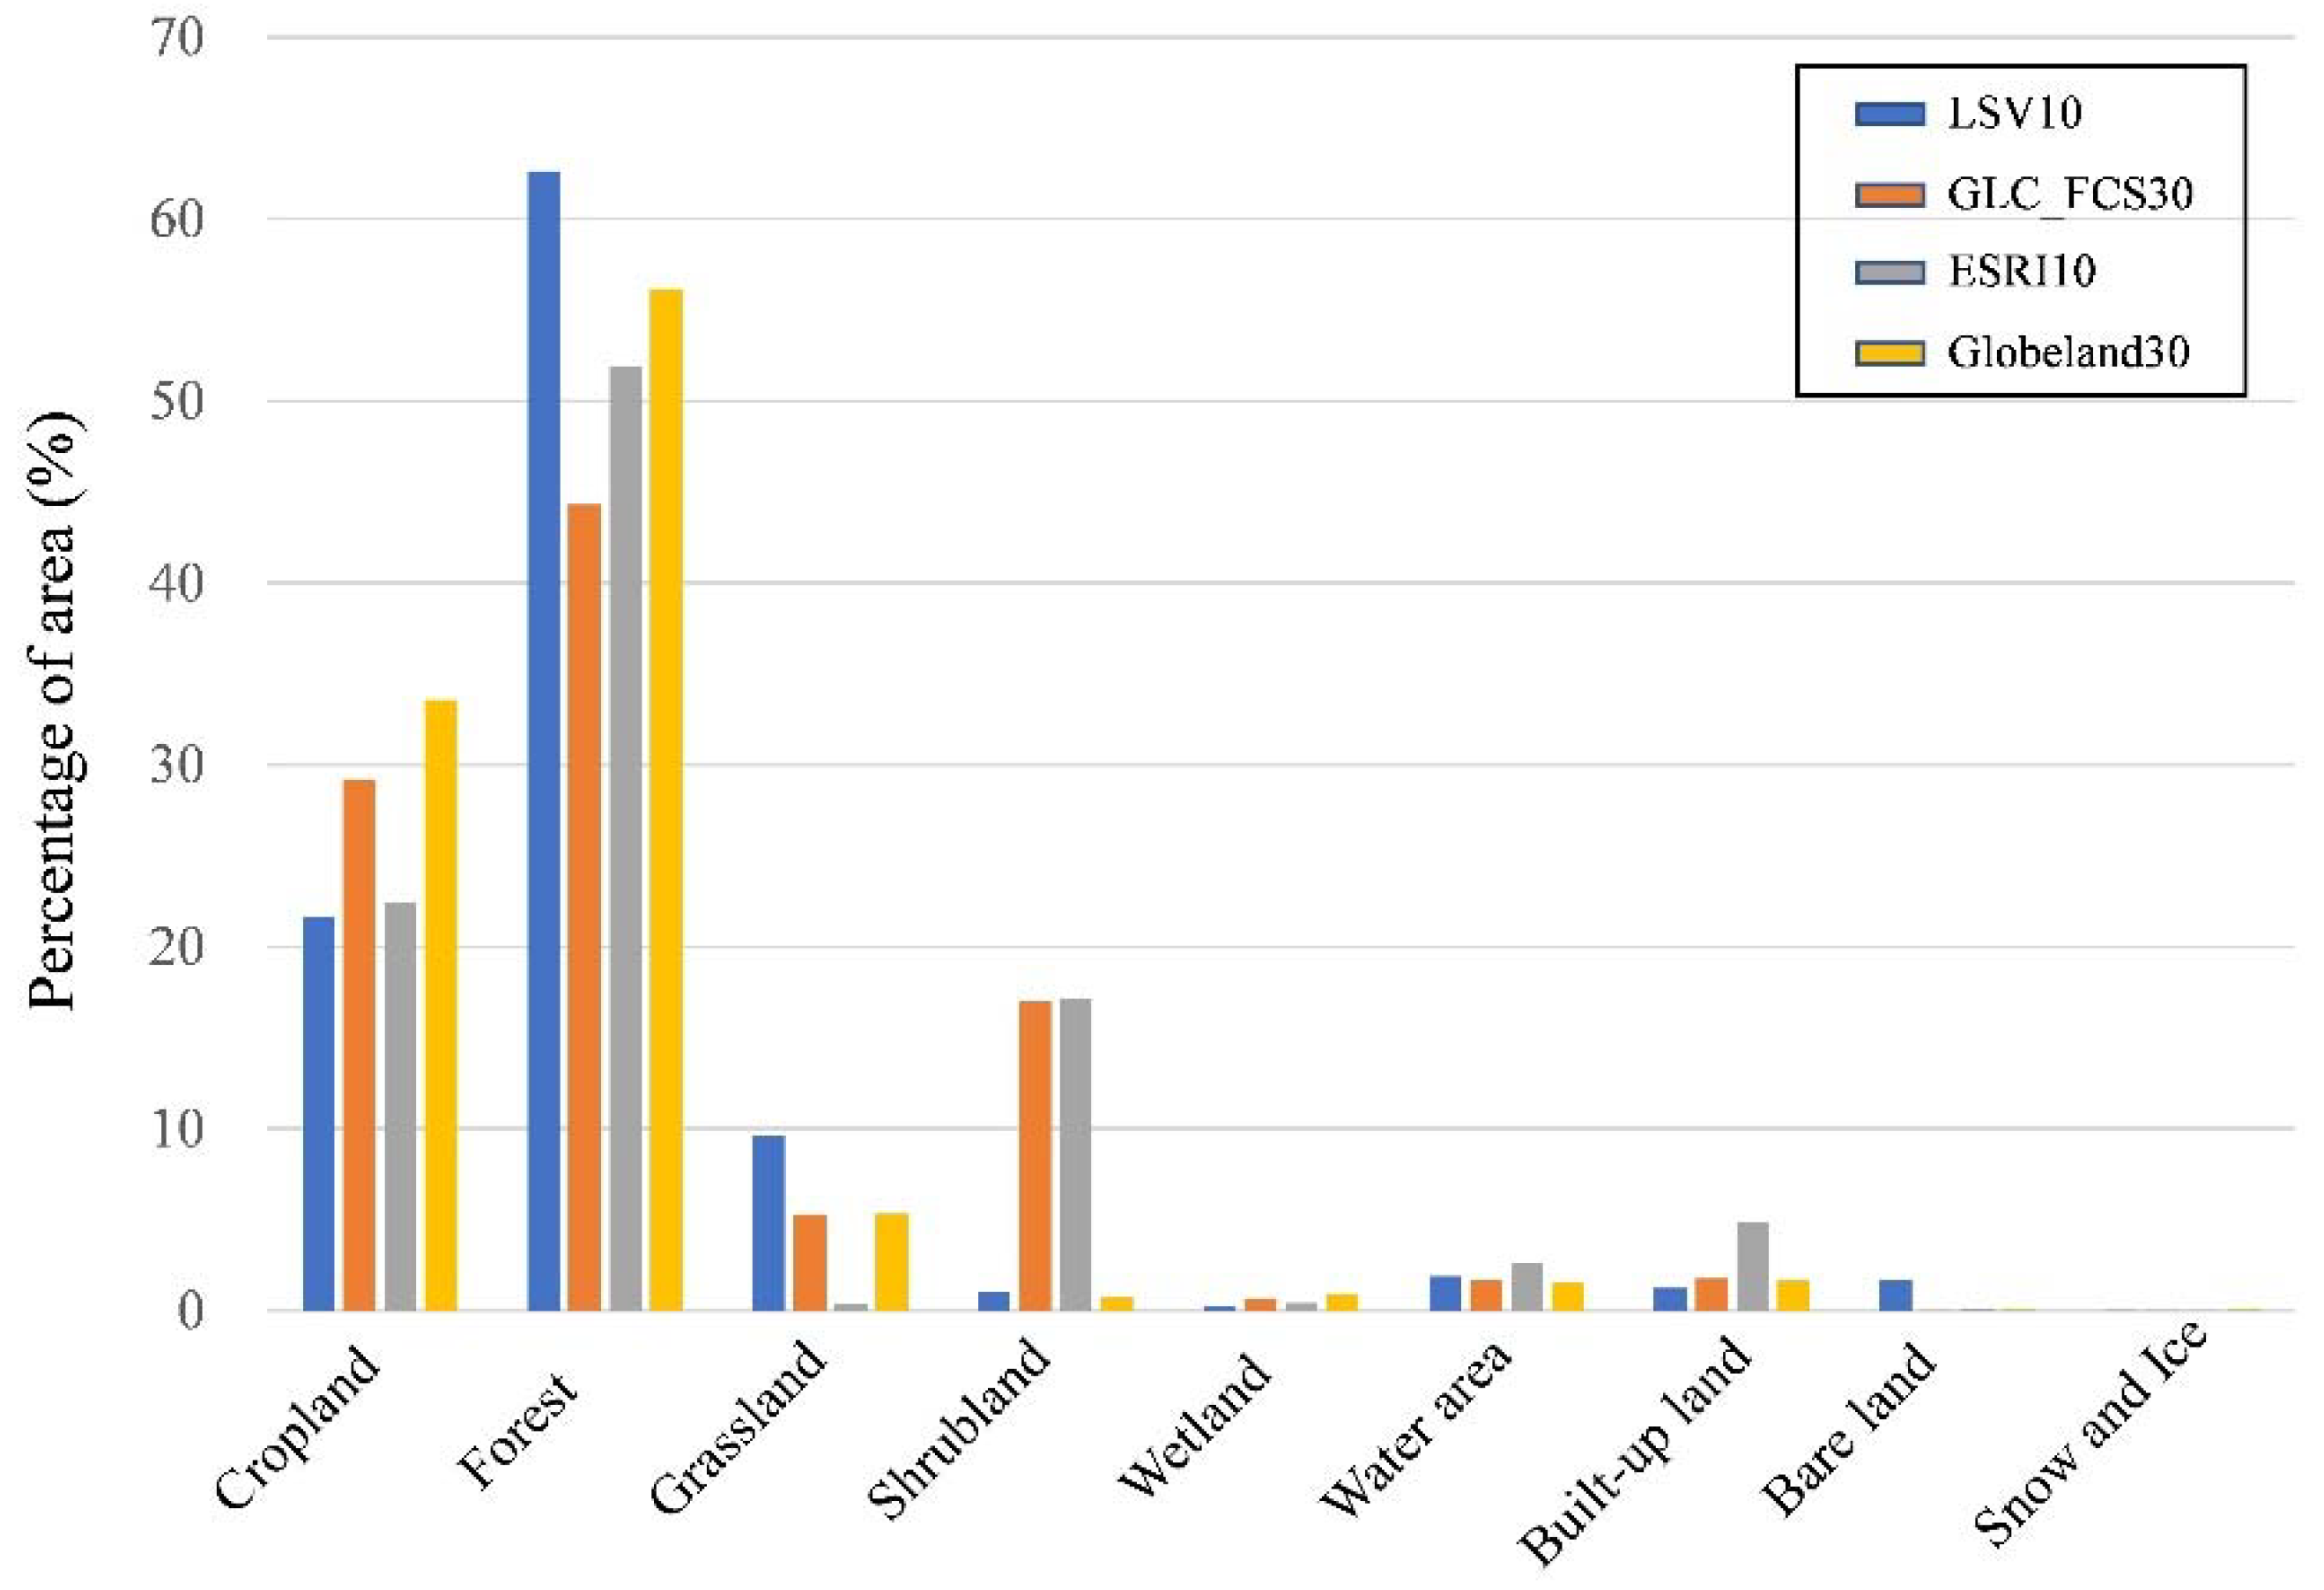
From the four LULC datasets, the LULC composition of the Indochina Peninsula is shown in
Figure 3. In general, different LULC products provided consistent descriptions of the land composition of the Indochina Peninsula: mainly dominated by forest, followed by cropland, shrubland and grassland, then built-up land and water area; the areas of wetland, bare land, and snow and ice were small.
In the four LULC datasets, forest is the land type with the largest area (44.3–63.6%), followed by cropland. The proportion of cropland in the LSV10 and ESRI10 datasets is smaller (21.7–22.4%); the proportion of cropland in the GLC_FCS30 and Globeland30 datasets is larger (29.2–33.6%). In the GLC_FCS30 and Globeland30 datasets, the proportions of grassland are similar (about 5.3%); the proportion of grassland in the LSV10 dataset exceeds 9.3%; and the proportion of grassland in the ESRI10 dataset is only 0.3%. The area of shrubland differed the most among the four LULC datasets (coefficient of variation is 104.4%). The shrubland areas in the GLC_FCS30 and ESRI10 datasets account for a similar proportion (about 17%), while they only account for 1% in the LSV10 dataset, and the least in the Globeland30 dataset (0.7%).
By conducting correlation analysis on the land area series of the four LULC products (
Table 4), we found that the correlation coefficients between different LULC products are all above 0.9, which is a high correlation. The correlation between GLC_FCS30 and ESRI10 is the highest, at 0.972; the correlation between LSV10 and Globeland30 is next, at 0.969; the correlations between GLC_FCS30 and Globeland30, LSV10, and ESRI10, and ESRI10 and Globeland30 are in the middle, ranging from 0.929 to 0.943; the correlation between LSV10 and GLC_FCS30 is the lowest, but also above 0.9.
4.2. Confusion of Land Type
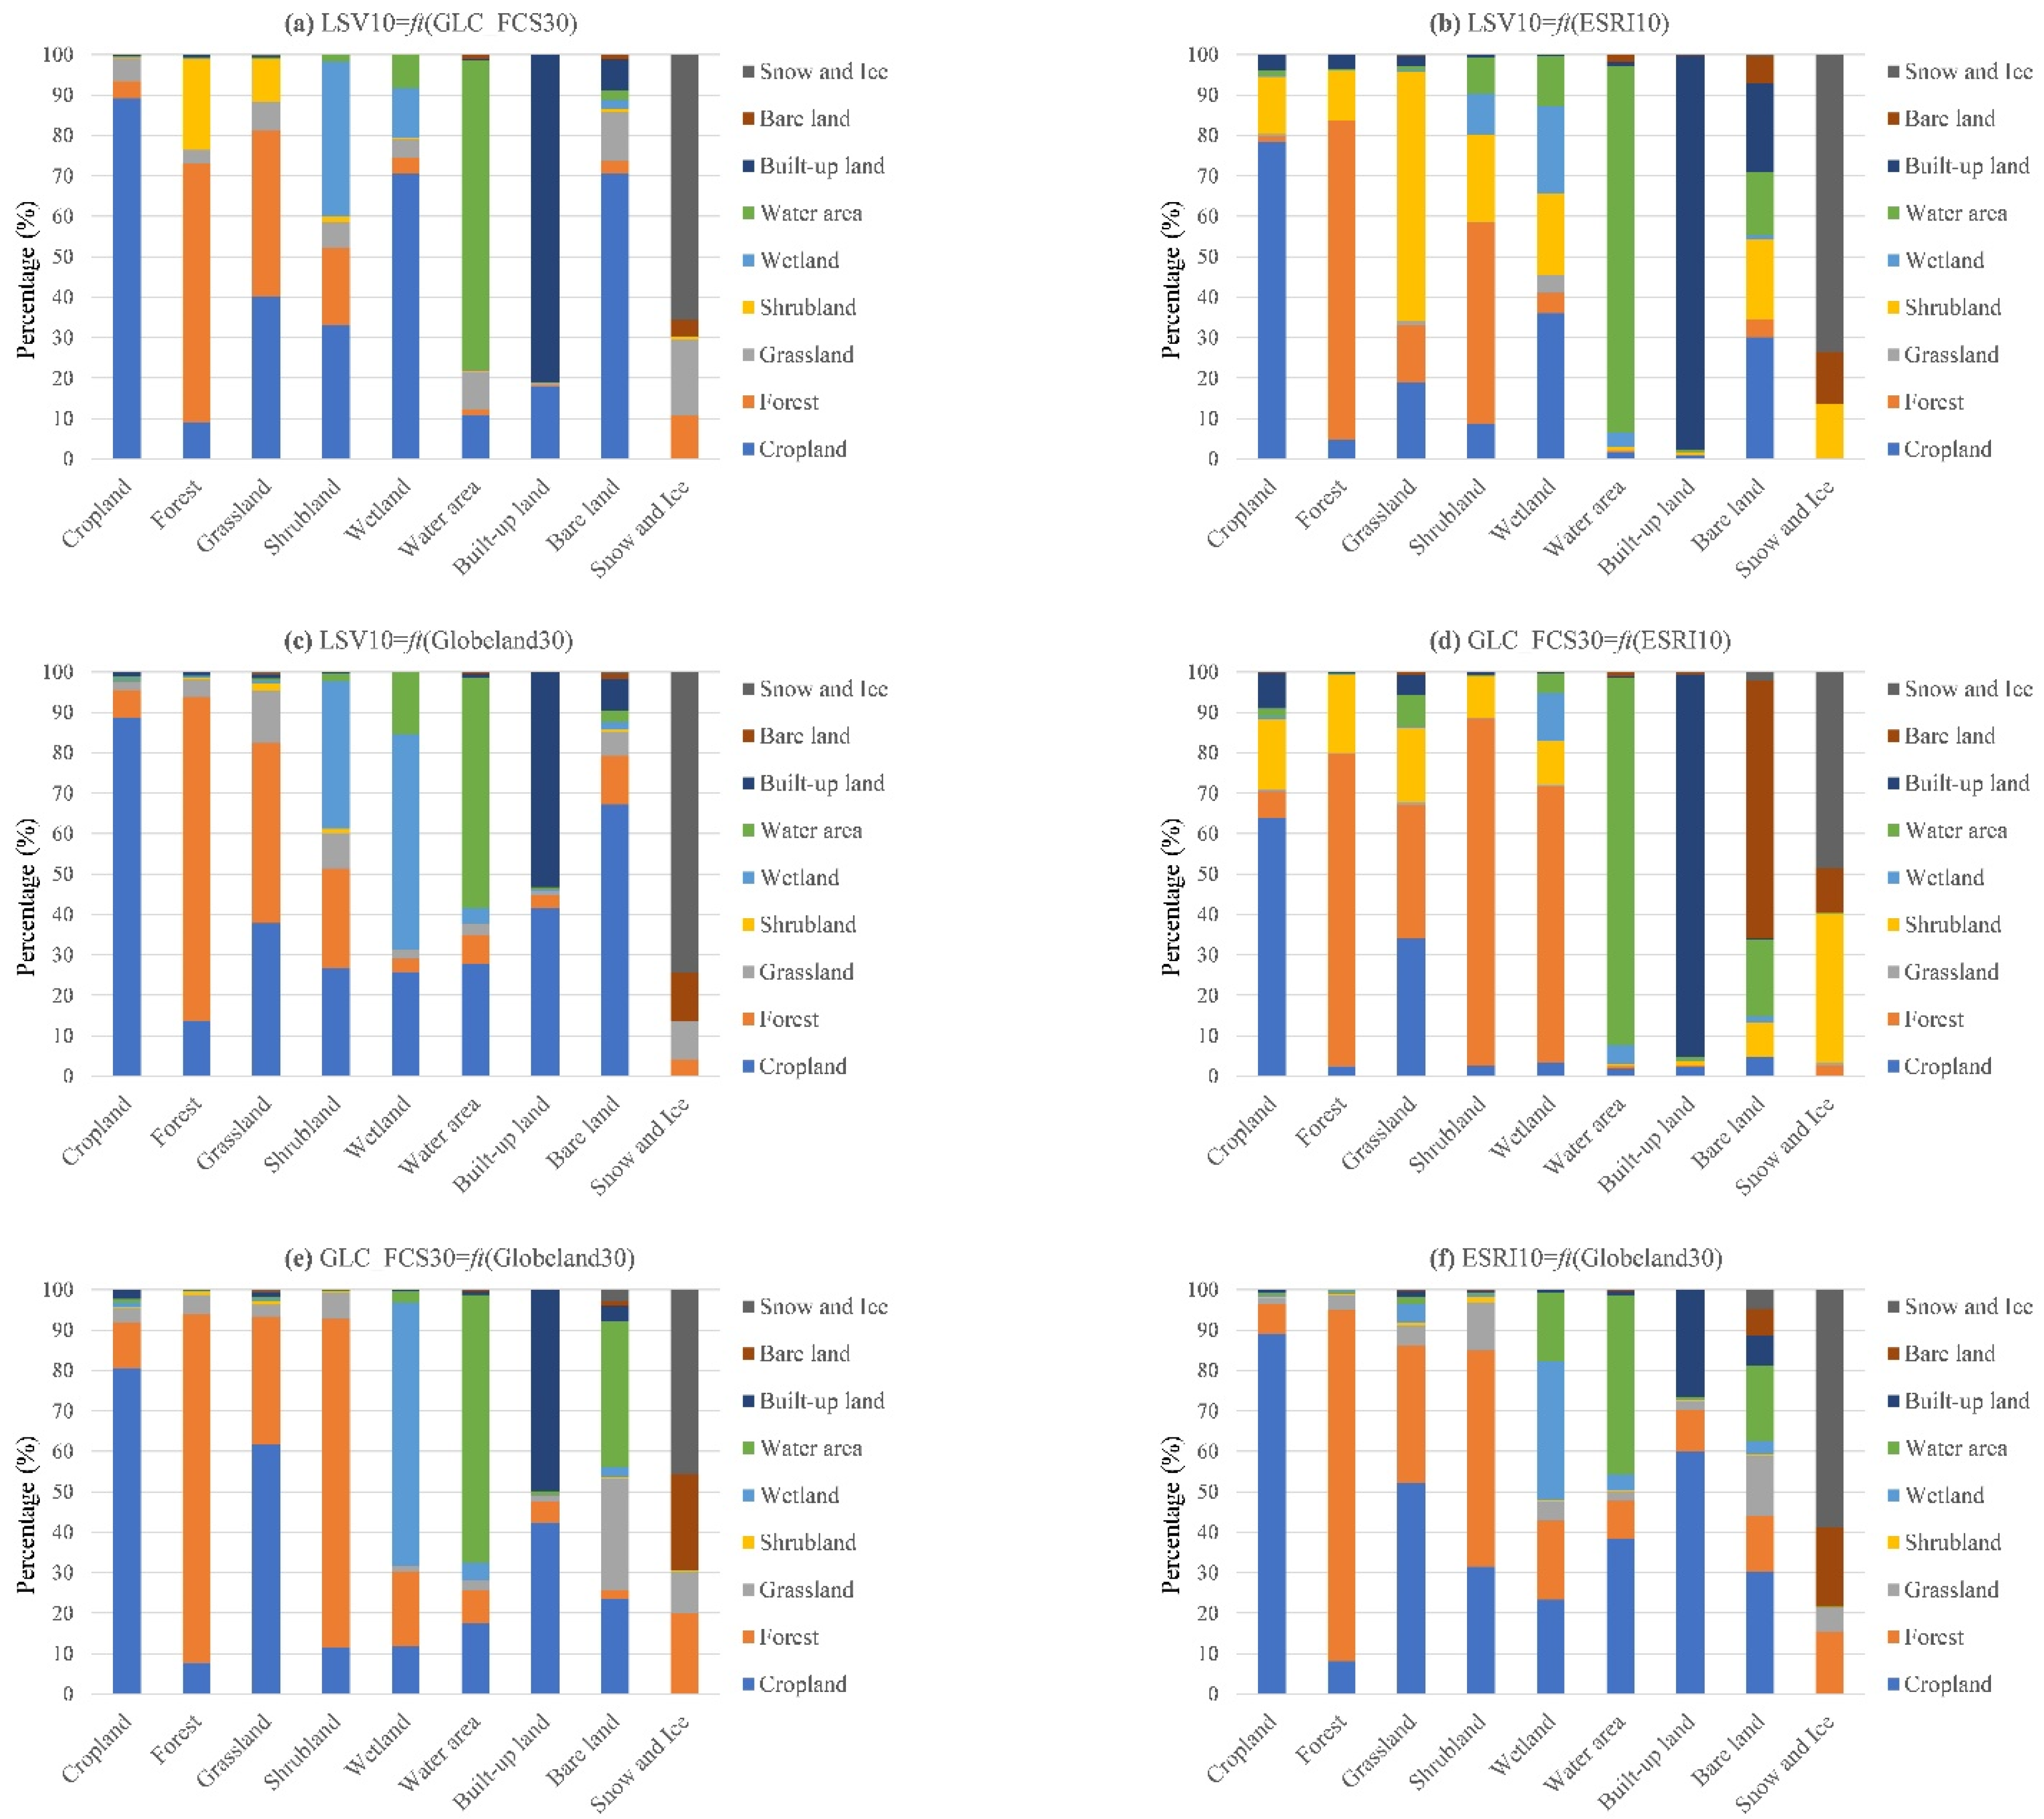
We analyzed the degree of land type confusion for the different LULC datasets, and the results are shown in
Figure 4a. When the LULC type on the abscissa is the same as the land type on the ordinate, the pixels are pure; otherwise, the pixel type is confused.
The correct pixel identification of cropland, forest, water area, and built-up land is high; the degree of confusion with other land types is low. The proportion of these land types that were consistent in the pairwise comparison of the multisource LULC datasets is mostly above 70%. Among them, the LSV10/GLC_FCS30 (
Figure 4a) and the ESRI10/Globeland30 combinations (
Figure 4f) have the highest accuracy of cropland, reaching over 89%. The GLC_FCS30/Globeland30 (
Figure 4e) and the ESRI10/Globeland30 combinations (
Figure 4f) have the highest forest identification accuracy, reaching over 86%. The LSV10/ESRI10 combination (
Figure 4b) and the GLC_FCS30/ESRI10 combination (
Figure 4d) have the highest purity degree of water area, reaching over 95%. The LSV10/ESRI10 (
Figure 4b) and the GLC_FCS30/ESRI10 combinations (
Figure 4d) have the highest identification degree of built-up land, reaching over 97%. Conversely, the pixel identification of grassland, shrubland, and wetland is low; the degree of confusion with other land types is high. The proportion of these land types that were consistent in the pairwise comparison of the multisource LULC datasets is mostly less than 30% and even less than 10%. Among them, the LSV10/Globeland30 combination (
Figure 4c) has the highest purity degree of grassland, at 16%; the LSV10/ESRI10 (
Figure 4b) and the GLC_FCS30/ESRI10 combinations (
Figure 4d) have the lowest purity degree of grassland, at only 1%. The LSV10/ESRI10 combination (
Figure 4b) has the highest identification degree of shrubland, at 22%; the GLC_FCS30/Globeland30 combination (
Figure 4e) has the lowest, less than 1%. The GLC_FCS30/Globeland30 combination (
Figure 4e) has the highest-accuracy identification of wetland, at 66%; the LSV10/GLC_FCS30 combination (
Figure 4a) has the lowest, at 13%.
In conclusion, from the analysis of the confusion of land types, we found that the four LULC datasets have a high pixel identification accuracy and good consistency of cropland, forest, water area, and built-up land. This partly reflects the high accuracy of different LULC datasets for these land types. The four LULC datasets have low identification accuracy and poor consistency for grassland, shrubland, and wetland, reflecting that the accuracy of different LULC datasets in these land types is inconsistent, so further verification is needed.
4.3. Spatial Consistency
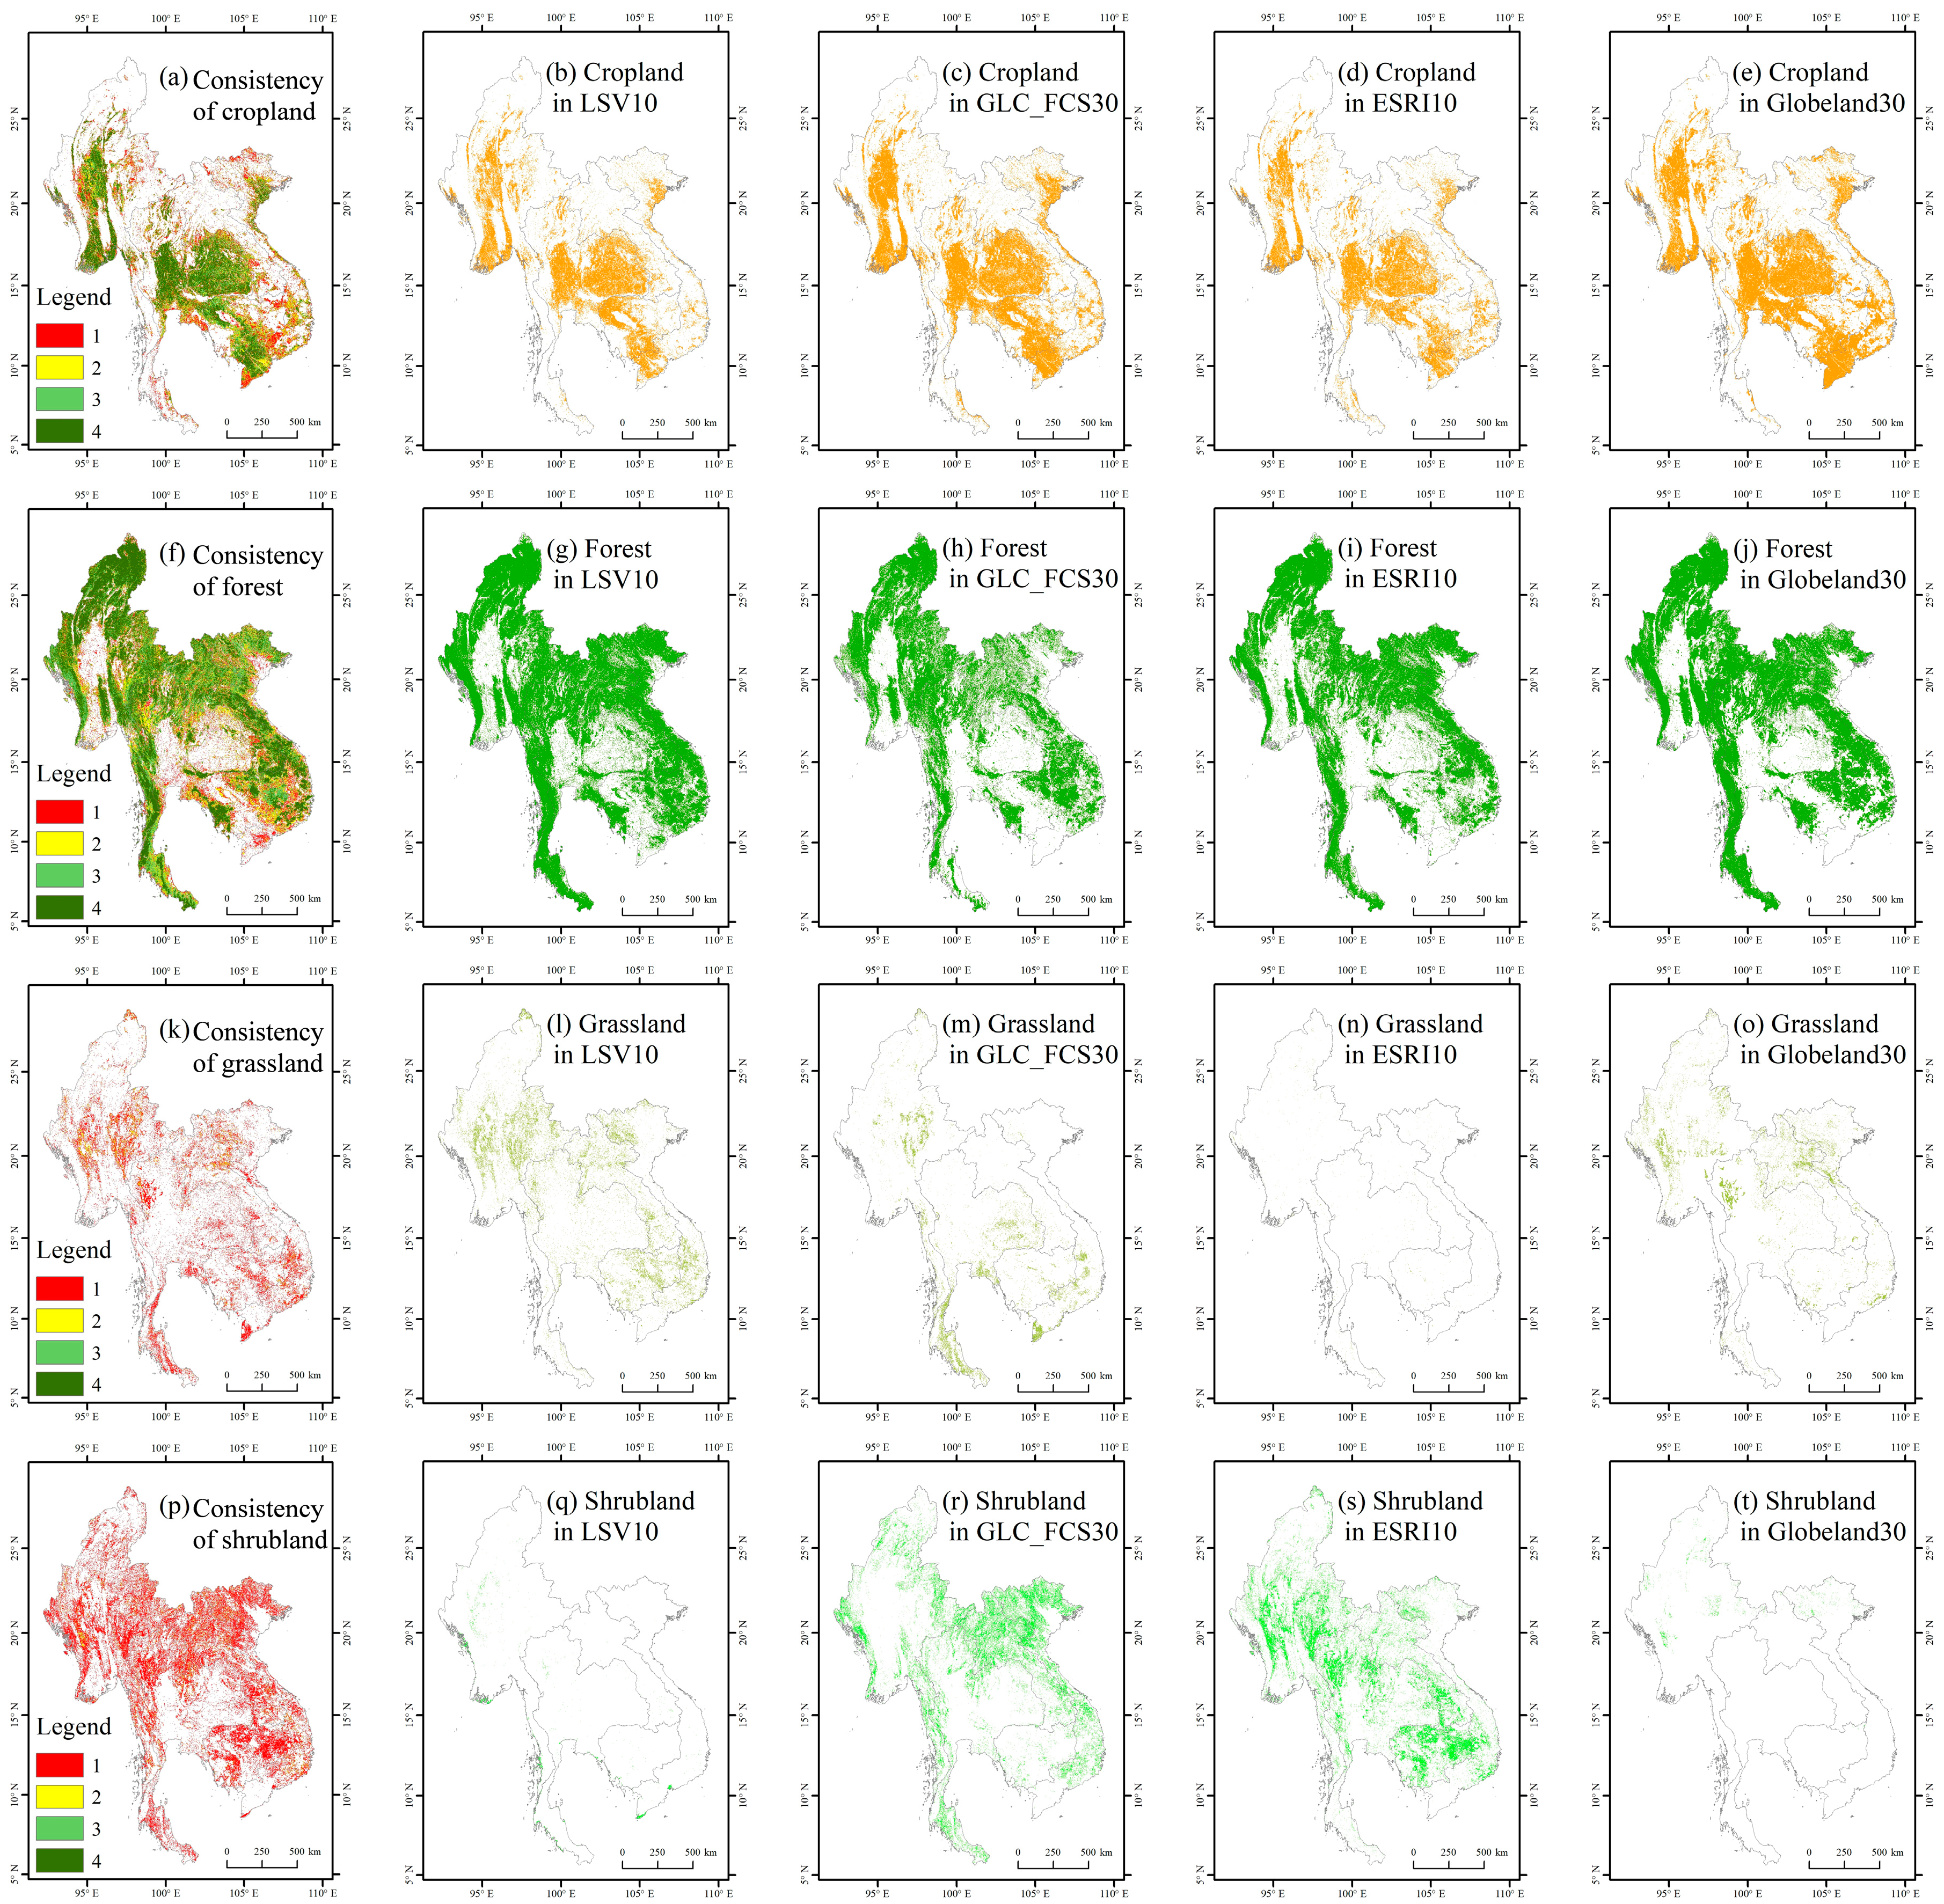
To analyze the spatial differentiation characteristics of the consistency of land cover type identification, we selected four land types (cropland, forest, grassland, and shrubland), which account for the largest proportion of the study area, and conducted a pixel-by-pixel comparative analysis. The results (
Figure 5) show that the four LULC datasets have the highest spatial consistency for forest and cropland, and most of the pixels are identified as the same land type by three to four LULC datasets. The spatial consistency of grassland identification is lower, and that of shrubland is lowest: only a few pixels are identified as the same land type by two LULC datasets, and very few pixels are identified as the same land type by three to four LULC datasets.
Cropland (
Figure 5a–e) is an important land type on the Indochina Peninsula and is widely distributed throughout the region. For the four LULC datasets, the cropland spatial distribution pattern is the same. In the GLC_FCS30 and Globeland30 datasets, the cropland pixels are denser and the cropland area is larger. Conversely, in the LSV10 and ESRI10 datasets, the cropland area is smaller. To analyze the consistency of cropland identification, the proportion of cropland identified by three to four LULC datasets is 56.27%; that identified by one to two LULC datasets is 43.73%. The spatial distribution of cropland is the most concentrated in the northwest (the middle and lower reaches of the Irrawaddy River), the middle (the middle and lower reaches of the Chao Phraya and Mekong Rivers), and the eastern and southern coastal areas. In these areas, we found that the spatial consistency of cropland is the highest, and three to four LULC datasets generally identify these pixels as cropland. The distribution of cropland is fragmented in the southeast (south of Truong Son Ra), the northeast (the area of the Red River basin, excluding the delta), and the south (the southernmost peninsula of Vietnam). In these areas, the spatial consistency of multisource LULC datasets is low, and one to two LULC datasets generally identify these pixels as cropland.
Forest (
Figure 5f,g) is the most important land type on the Indochina Peninsula, having the largest area and the widest spatial distribution. In the LSV10, ESRI10, and Globeland30 datasets, the forest spatial distribution pattern and quantity are similar. In the GLC_FCS30 dataset (
Figure 5j), the forest pixels are sparse, and their number is low. To analyze the consistency of forest identification, we found that the proportion of forest identified by three to four LULC datasets is 71.60% and that identified by one to two LULC datasets is 28.40%. From the perspective of spatial distribution, forest is most concentrated in the northwest (the upper reaches of the Irrawaddy River, the Arakan Yoma, and the Shan Plateau), the vast area in the north-central region (the upper reaches of the Chao Phraya River and the Mekong River), the east (Truong Son Ra), the southwest (Mountains in southern Myanmar). In these areas, the spatial consistency of multisource LULC datasets is the highest, and three to four LULC datasets generally identify these pixels as forest. In the southeast (Mekong Delta and southern Truong Son Ra), the forest distribution is more fragmented. In these areas, the spatial consistency of the four LULC datasets is low, and one to two LULC datasets generally identify these pixels as forest.
The spatial consistency of the identification of grassland (
Figure 5k–o) is poor in the four LULC datasets. The spatial distribution and quantity of grassland identified by the datasets widely vary. The grassland area in the LSV10 dataset is the largest, and most of the pixels are located in the northeastern half of the study area. The grassland areas in the GLC_FCS30 and Globeland30 datasets are similar, but most of the pixels in the GLC_FCS30 dataset are located in the southwest half of the region and most of the pixels in the Globeland30 dataset are located in the northern half. The grassland area in the LSV10 dataset is the smallest, being much less than in the other three. As shown in
Figure 5l, the grassland area is barely visible. From analyzing the consistency of grassland identification, we found that 88.81% of the pixels are identified as grassland by only one LULC dataset, 10.69% of the pixels are identified as grassland by two LULC datasets, and only 0.49% of the pixels are identified as grassland by three to four LULC datasets.
The spatial consistency of shrubland in the Indochina Peninsula (
Figure 5p–t) was the worst in the multisource LULC datasets. The amount of shrubland identified in the datasets widely varies, as do the spatial distribution patterns. The GLC_FCS30 and ESRI10 datasets identify the largest shrubland area, reporting similar values. The pixels in the GLC_FCS30 dataset are the densest in the northeast area, followed by the southwest area, and the middle area is sparse. Conversely, the shrubland pixels in the ESRI10 dataset are less distributed in the northeast and southwest regions, and more distributed in the middle. The shrubland area in the LSV10 and Globeland30 datasets is small:
Figure 5q,t show that the shrubland distribution is sporadic. From our analysis of the consistency of shrubland identification, we found that 92.85% of the pixels are correctly identified as shrubland by only one LULC dataset, 6.42% of the pixels are identified as shrubland by two LULC datasets, and only 0.06% of the pixels are identified as shrubland by three to four LULC datasets. From a spatial point of view, the shrubland and forest distribution patterns are highly consistent across the datasets, and the grassland and shrubland patterns are generally consistent. Shrubland and grassland are mainly distributed in the low mountain and hilly areas, and distribution relationship with forest and cropland shows a mosaic pattern. Due to the complexity of the spatial distribution, the fragmentation of the spatial form, and the spectral characteristics of the same object with different spectra, we expected the spatial consistency of the above two land types to be low.
We analyzed the overall consistency of the identification of various types of land among the datasets, and the results are shown in
Figure 6. In the Shan Plateau, Arakan Yoma, Truong Son Ra, the upper reaches of the three rivers (Mekong, Chao Phraya, and Irrawaddy Rivers), where forest is concentrated, and in the middle and lower reaches of the three rivers, and the eastern and southern coastal areas, where cropland is concentrated, the spatial consistency of the multisource LULC datasets is the highest. Most datasets reach full agreement on all pixels. In southern Truong Son Ra, the lower Mekong River basin, and the Mekong Delta, where cropland, forest, grassland, and shrubland are mixed, the spatial consistency of the multisource LULC datasets is the least accurate, and with low or no agreement on many pixels.
We also calculated additional statistics on various types of land. The results show that the area of full agreement on land types of the four LULC datasets accounts for 48.88% of the total area of the Indochina Peninsula; the area with high agreement accounts for 28.99% of the region; the area with low agreement accounts for 20.02% of the region; and the area with no agreement accounts for 2.11% of the region. Considering a reliability of 75% (that is, of the four LULC datasets, at least three identify pixels as the same land type), 77.87% of the land type information in the Indochina Peninsula is reliable; the other 22.13% of the land type information is uncertain.
4.4. Data Accuracy
On the Indochina Peninsula (
Table 5), the overall accuracy of the four LULC datasets is between 72% and 83%, as follows: LSV10 (83.25%) > ESRI10 (77.27%) > Globeland30 (73.88%) > GLC_FCS30 (72.27%).
For the LSV10 dataset, the accuracy of cropland, forest, water area, and built-up land identification is highest. Their user and producer accuracies are all above 86%. The accuracy of grassland identification is at a medium level, but the dataset considerably overestimated the grassland area. The identification accuracy is the worst for shrubland, wetland, and bare land.
For the GLC_FCS30 dataset, the identification accuracy of forest, water area, and built-up land was highest. Their user and producer accuracies are all above 79%. The identification accuracy of cropland is in the middle, but the dataset substantially overestimated the cropland area. Wetland, grassland, shrubland, and bare land identification accuracies are the lowest.
For the ESRI10 dataset, the cropland and forest identification accuracies are highest, and their user and producer accuracies are above 82%. The identification accuracy of water area, built-up land, and bare land is in the middle, but water area is considerably overestimated, built-up land is substantially underestimated, and bare land is underestimated. The identification accuracies of grassland, shrubland, and wetland are the lowest.
For the Globeland30 dataset, the cropland, forest, built-up land, and water area identification accuracies are the highest. The user and producer accuracies are above 72% in general. The dataset remarkably overestimates cropland and forest and notably underestimates built-up land. The identification accuracy of bare land is in the middle, whereas those of grassland, shrubland, and wetland are the lowest.
In conclusion, the LSV10 dataset has the highest overall accuracy. In four LULC datasets, the accuracy of cropland, forest, water area, and built-up land is generally high. For grassland, shrubland, and wetland, the accuracy of the four datasets is not ideal.
5. Discussion
In this study, we found that the overall accuracy of the four LULC datasets in the Indochina Peninsula is ranked from high to low as LSV10 (83.25%) > ESRI10 (77.27%) > Globeland30 (73.88%) > GLC_FCS30 (72.27%). These are ±10% deviations from the accuracy claimed by the original authors (74.4%, 85.96%, 85.72%, and 81.4%, respectively) [
12,
13,
14,
15,
16,
17]. As the assessment of the accuracy by LULC dataset makers is based on the global validation sample base, our accuracy assessment was limited to the Indochina Peninsula, which is a region with specific LULC types. Moreover, the Indochina Peninsula is in the tropics, with lush vegetation and more complex surface cover. Therefore, their results would differ from those we obtained in this study. This also shows that quantitatively analyzing the actual accuracy of each LULC dataset is necessary before conducting land science research in a specific area.
Our findings show that the four LULC datasets have high identification accuracy of cropland, forest, water area, and built-up land. LSV10 has the highest cropland identification accuracy, whereas the difference between user accuracy and producer accuracy is less than 3%, indicating that the dataset is suitable for research and applications based on cropland, such as grain production potential and cultivated land protection policy. LSV10 and ESRI10 have the highest forest identification accuracies, both exceeding 95%, and so are suitable for forest-based research and applications, such as wildlife conservation, forest resource assessment, and forest ecological services research. GLC_FCS30 has the highest water area identification accuracy, and so is suitable for natural hydrology-related studies, such as fishery production evaluation, hydropower generation evaluation, and water area ecological protection. LSV10 has the highest built-up land identification accuracy, and so is suitable for research and applications based on built-up land, such as urban heat island, urban dynamic expansion, and urban and rural development planning research.
Our findings show that the identification accuracy of the four datasets for grassland, shrubland, and wetland is low, so they are unsuitable for scientific research and land management planning of these land types. The classification error of these land types is an important factor that reduces the overall accuracy of LULC datasets. On the one hand, the spectral characteristics and texture characteristics of these land types are similar, and their spatial distributions are fragmented. On the other hand, we found differences in the definition of grassland-shrubland and wetland-grassland in the different datasets, which could have led to confusion in the construction of the training samples and final mapping results of the LULC datasets [
32]. Therefore, grassland-shrubland, wetland-grassland, and wetland-water area must be more scientifically defined, and more accurate training samples must be built to provide an appropriate foundation for improving the classification accuracy of grassland, shrubland, and wetland in the future. In addition, the classification accuracies of grassland, shrubland, and wetland must be improved to enable the development of process monitoring methods based on time series image data by integrating laser tree height data and radar water retrieval data [
33].
We evaluated the multisource LULC datasets from two dimensions: consistency and accuracy. Consistency analysis does not introduce validation samples: LULC datasets were used as a reference to analyze the similarity of land composition, degree of category confusion, and spatial consistency. The advantage of this method is that all pixels of the datasets can be included in the analysis to reveal the difference. The disadvantage is that the results are relative and cannot be absolutely evaluated [
34]. The accuracy test method introduces verification samples as close to reality as possible, and calculates the accuracy parameters of each dataset. The advantage is that it can evaluate the overall accuracy of each LULC dataset and the classification accuracy of each land class. The disadvantages are that the representativeness of sample data is limited [
35], and that the validation of samples produces new uncertainties [
36].
In this study, scaling up and reclassification provided the basis for follow-up evaluation, and were important sources of uncertainty [
37]. Scaling has little effect on large areas of forest, large areas of cropland, and water that have higher spatial continuity. However, with mixed land types, scaling leads to changes in fine spatial information and quantity [
38,
39]. The classification systems of LSV10, ESRI10, and Globeland30 show high correspondence with the merging system, and the subjective factors have little influence on the reclassification process. GLC_FCS30 has 30 fine classes, so the reclassification is easily affected by the knowledge level of the researchers [
40,
41]. In addition, due to their similar morphology (forest, shrubland, grassland, wetland, etc.), mixed distribution and limited image resolution, sampling methods based on Google Earth and visual interpretation are uncertain, and thereby affect the accuracy verification results [
42,
43].
6. Conclusions
In this study, we converted four well-known LULC datasets (LSV10, GLC_FCS30, ESRI10, and Globeland30, with a spatial resolution of 10 or 30 m) into a unified and comparable benchmark through scaling up and classification merging. We analyzed the similarity of composition type, degree of LULC confusion, spatial consistency, and validation accuracy in detail. In this study, we are the first to evaluate the spatial consistency and accuracy of LULC datasets in the Indochina Peninsula. Our findings provide a quantitative basis for people in various countries and fields in selecting LULC data and provide a reference method for assessing the accuracy of multisource LULC datasets in other regions.
Our findings show that forest is the main land type on the Indochina Peninsula, followed by cropland, shrubland, grassland, built-up land, and water. The overall accuracy of different LULC datasets is between 72% and 83%. LSV10 has the highest overall accuracy. The accuracy and consistency of each LULC dataset are higher for cropland, forest, water, and built-up land and lower for grassland, shrubland, and wetland.
Based on the above analysis results, we provided clear suggestions for countries in the Indochina Peninsula countries for relevant researchers when selecting LULC datasets for agriculture, fisheries, forest, and ecological protection, and urban and rural development. We provided some recommendations to improve some land mapping methods that have a low spatial consistency and accuracy. In future research, strengthening field investigation, scientifically defining classification systems, and integrating multisource data such as laser detection and radar inversion will be important for improving the accuracy and availability of LULC datasets.


