1. Introduction
Land is the most fundamental natural resource and material basis for human economic and social activities. Land-use/land-cover (LULC) change is a direct characterization signal through which various human production activities act on the earth’s surface ecological environment [
1,
2]. LULC is related to many important issues, such as global climate and ecological environment change, the surface energy cycle, and human survival and development [
3,
4,
5]. In the 1990s, the IGBP (the International Geosphere-Biosphere Programme) and IHDP (the International Human Dimensions Programme on Global Environmental Change) jointly launched the “LULC Change Scientific Research Program”. Moreover, the IGBP and IHDP launched the Global Land Program in 2005. In 2010, the United States held the first Open Science Conference on Global Land Program. In 2013, Verburg and other researchers advocated for the establishment of land system science [
6,
7]. The implementation of these scientific programs, conferences, and initiatives has given scientists around the world and the public a new understanding of the theoretical significance and application value of LULC research.
Since the 1990s, many well-known institutions around the world have developed multiple sets of global land-cover products such as IGBP DISCover [
8], GLC2000 [
9], MODIS Collections 5 [
10], GlobCover 2009 [
11], etc. The early LULC products had a low spatial resolution and had no comparable datasets with continuous time-series; therefore, it is challenging to analyze finer time-series-based changes in LULC changes at small scales [
12]. Since the 2000s, with the development of High-resolution Earth Observation Technology and remote sensing cloud computing technology, Chen et al. from the China National Basic Geographic Information Center produced GlobeLand30 products with 10-year intervals and a 30 m resolution from 2000 to 2020. The overall accuracy was over 80% [
13]. Gong et al. of Tsinghua University produced FROM-GLC10 and FROM-GLC30 products with a 10 m/30 m resolution in 2015 and 2017, and their overall accuracies were 72.76% and 72.43%, respectively [
14]. Liu et al. of the Chinese Academy of Sciences developed a five-year interval GLC_FCS30 (Global Land-Cover product with Fine Classification System) covering 30 land-cover types from 1985 to 2020, achieving an overall accuracy of 68.7% [
15]. The Copernicus Global Land Service (CGLS) provided CGLS-LC100 at a 100 m resolution for 2015–2019, achieving an overall accuracy of over 80% [
16]. Karra et al. developed the 2020 Esri 10 at 10 m resolution with an overall accuracy of 85% [
17]. In addition, many scholars have conducted comparative studies on the accuracy of LULC products. Wang et al. compared the consistency of four high-resolution LULC products (LSV10, GLC_FCS30, ESRI10, and Globeland30) on the Indochina Peninsula. The results showed that the overall accuracy of the four LULC datasets was between 72% and 83% [
18]. Armel et al. explored the consistency of GLC2000, GLOBCOVER, MODIS, and ECOCLI MAP on the African continent. The results showed that the consistency of the four LULC products was between 56% and 69% [
19]. Hu et al. analyzed the consistency of GLOBCOVER2005, GLOBCOVER2009, GLC2000, and MODIS2000 on the European continent, and the results showed that the consistency of the four types of products was between 38.56% and 77.65% [
20]. It is clear that the LULC products that have been released in recent years have shown huge improvements in spatial resolution, temporal continuity, and product accuracy of the datasets.
With the support of the above-mentioned LULC datasets, LULC research has continued to be developed and has included analyses of the spatio-temporal patterns in LULC change [
21], discussions on the driving force mechanism of LULC change [
22], the ecological effects of LULC changes [
23], and the monitoring and modeling of LULC changes [
24]. From the perspective of research scales, there have been many studies on the global, intercontinental, and transnational scales. For instance, Eric et al. [
25] found that the global tropics reflect the trends of cropland, agricultural intensification, pasture expansion, tropical deforestation, and urban expansion and that these trends are driven by climate change, external policy interventions, the pressure of economic development and production on resource scarcity, the weak adaptive capacity of ecosystems, etc. Hu et al. [
26] found that the area of cultivated land, forest land, shrubland, grassland, water bodies, and wetlands in Central Asia was increasing, while the area of bare land was decreasing. They also found that cultivated land expansion was influenced by human activities and precipitation; that urban expansion was influenced by population and economic development; and that natural vegetation changes were influenced by climate. In addition to the above-mentioned LULC studies at the intercontinental and transnational scales, studies at the national and regional scales remain critical. These studies at the national and regional scales could reveal the spatio-temporal patterns of local LULC changes in a more specific and profound way as well as reveal, the effects of regional economic, social development, and climate change characteristics on LULC changes. These studies also could provide scientific information for sustainable land development planning, ecological protection, etc., at national and regional levels.
Vietnam is a developing country located in Southeast Asia. Existing research is usually carried out on a smaller regional scale. Disperati et al. [
27] studied the temporal and spatial changes in land use/cover in the Tam Giang-Cau Hai Lagoon area in central Vietnam from 1965 to 2014 based on AVHRR and Landsat satellite images using a computer visual interpretation method. Using the maximum likelihood method based on Landsat satellite images, Vu and Shen [
28] conducted automatic land mapping in the Dong Trieu District from 2000 to 2019. In general, there is a lack of temporal and spatial analysis studies on LULC changes that have been conducted on a national scale in the Vietnam region. In addition, analyzing the driving mechanisms behind LULC changes in the region has been limited to qualitative analysis rather than quantitative statistical and model simulation. These deficiencies are due to the lack of well-established, reliable, and long-term LULC datasets.
In response to the existing problems in the previous LULC studies conducted in Vietnam, this paper selected the long-term, high-resolution GLC_FCS30 datasets and integrated critical national economic and social development data. Supported by the above data, our study attempts to analyze the spatio-temporal pattern and dynamic changes in Vietnam’s LULC and explore the impact of regional climate, population, and economic development in Vietnam on its land-use/cover change processes. We attempt to answer the following three questions:
- (1)
What are the spatio-temporal patterns of land use/cover in Vietnam during the period 2000–2020?
- (2)
What are the main drivers of land-use/cover change in Vietnam from 2000 to 2020?
- (3)
What are the uncertainties in the analysis of land-use/cover change in Vietnam?
2. Data and Methods
2.1. Study Area
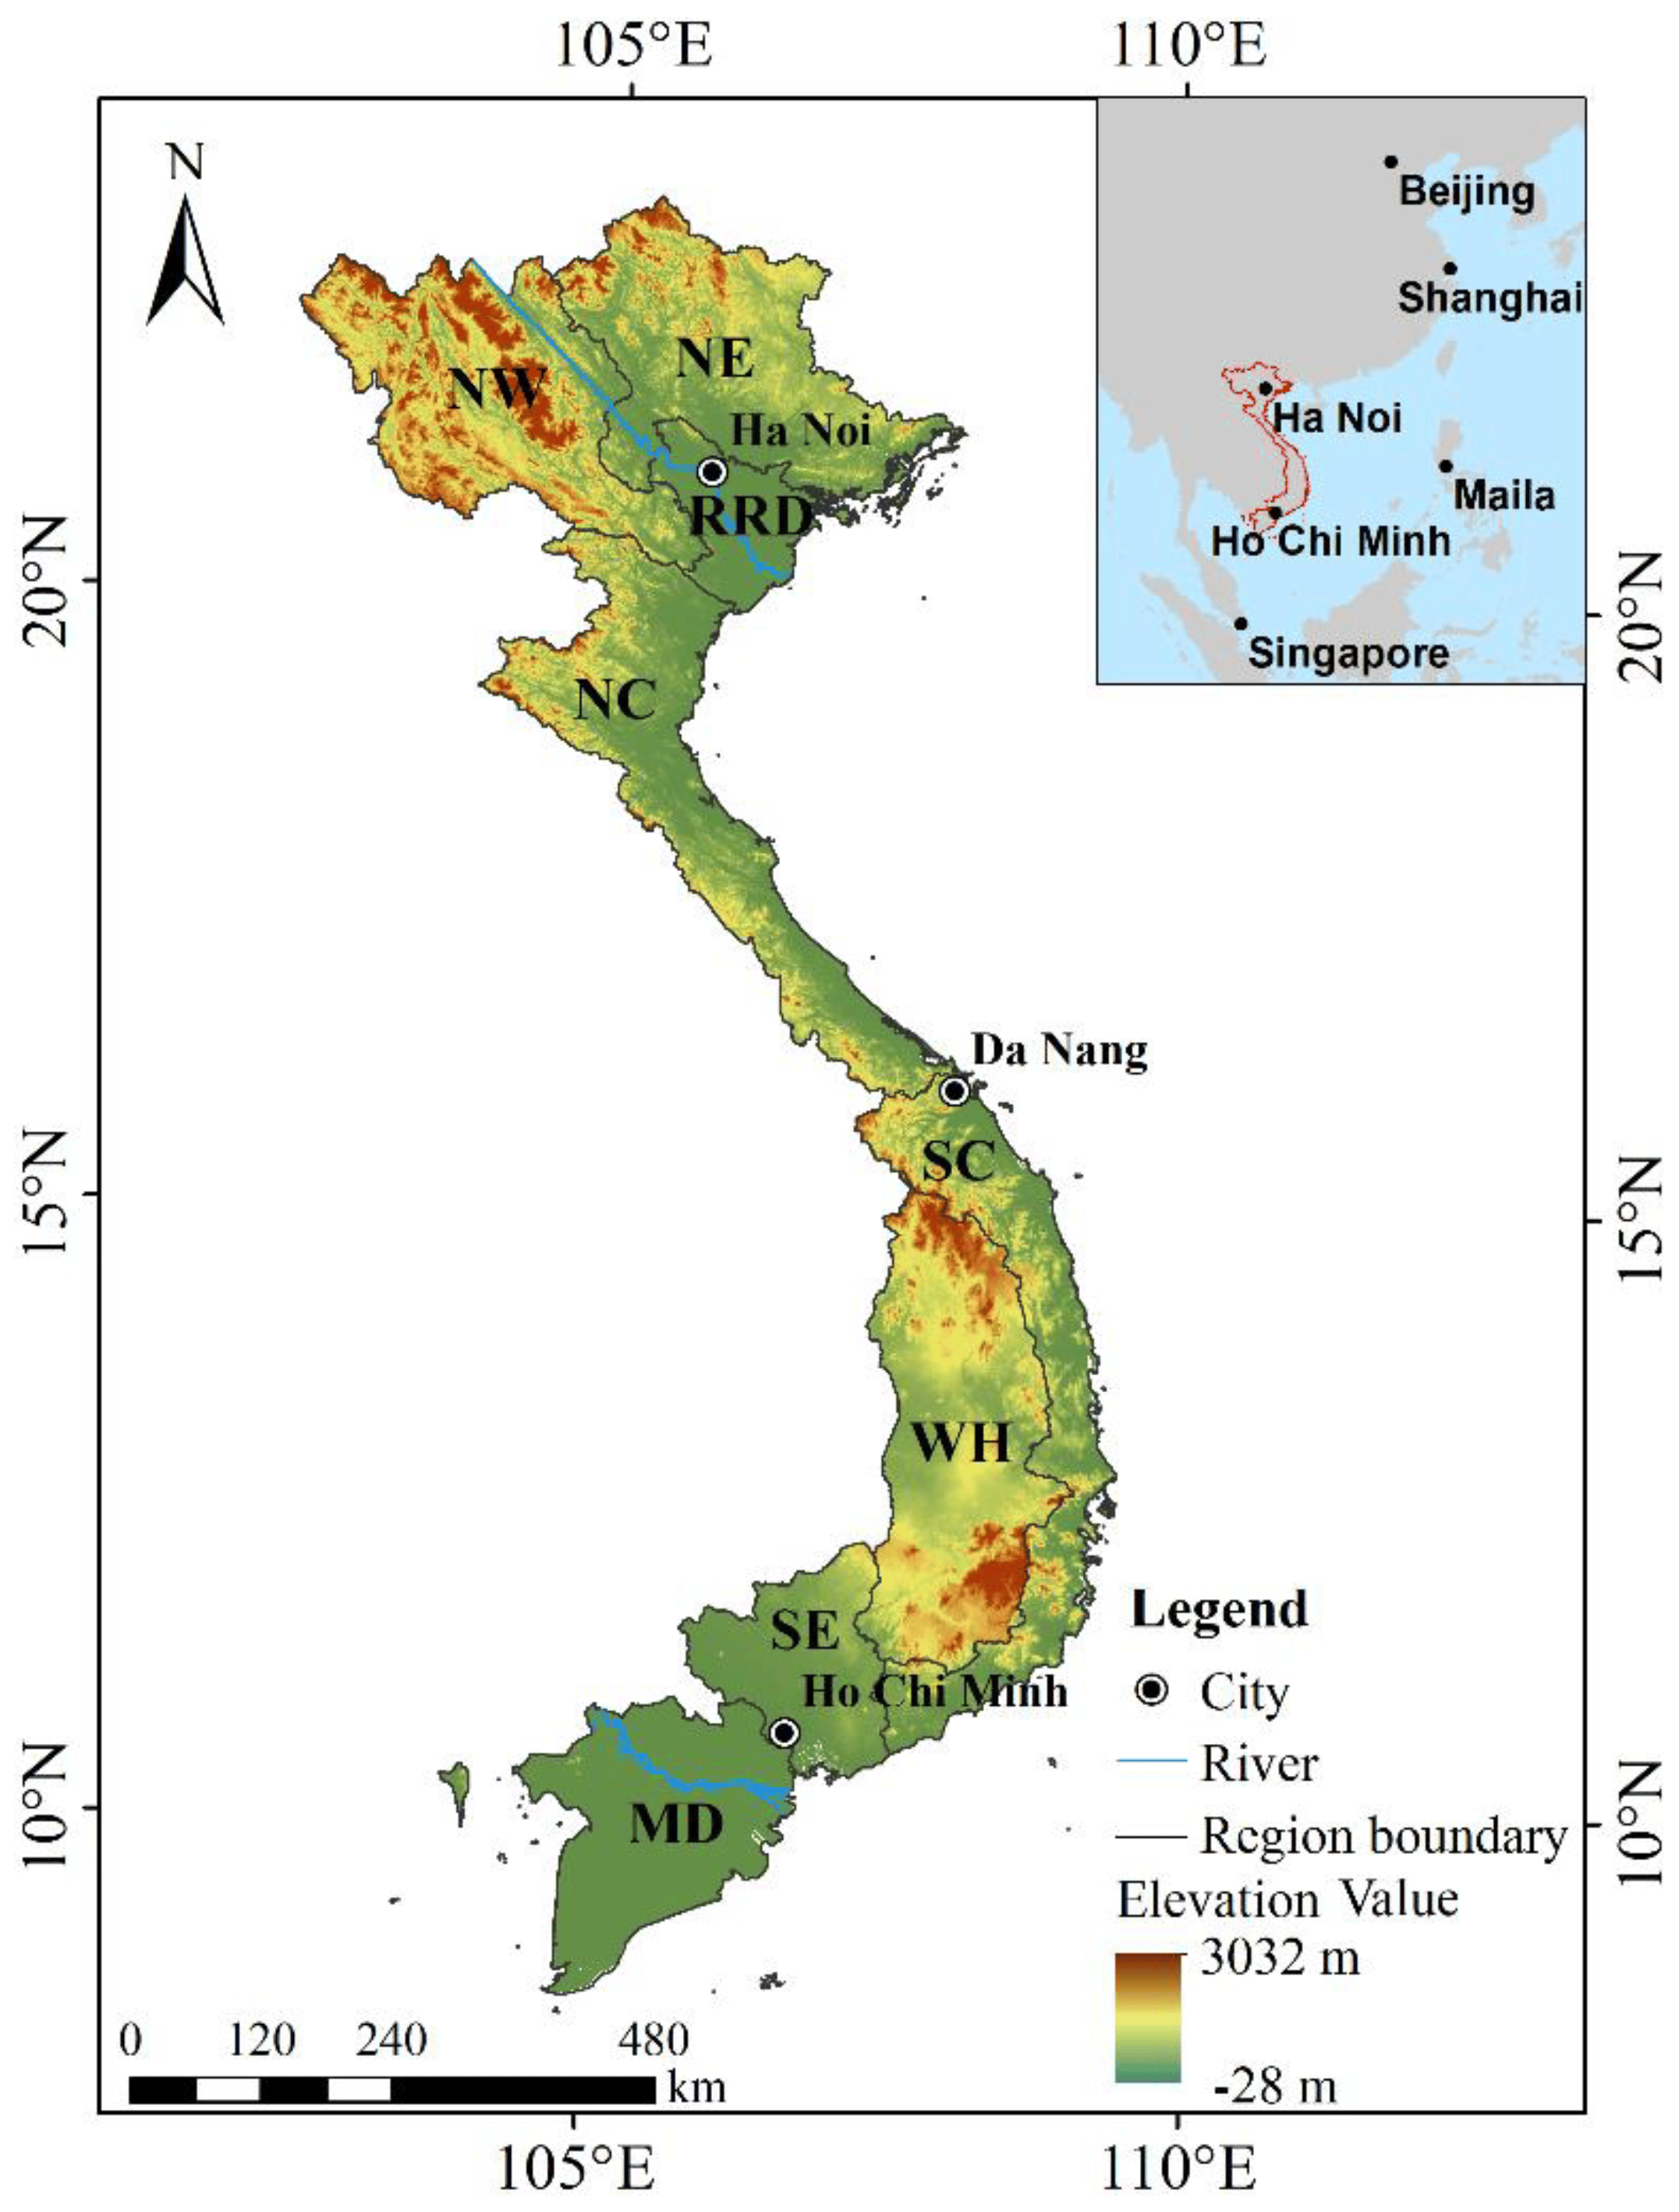
Vietnam is located on the eastern coast of the Indo-China Peninsula in the southeast of the Asian continent (8°10′–23°24′ N, 102°09′–109°30′ E) and borders China to the north and Laos and Cambodia to the west. The territory of Vietnam is S-shaped and has a total area of about 3.3 × 10
5 km
2 (
Figure 1). The whole of Vietnam is located south of the Tropic of Cancer and has a tropical monsoon climate and an average annual temperature of about 23°C. Vietnam has a distinct rainy and dry season, with the rainy season being from May to October and the dry season being from November to April of the following year. Due to the differences in latitude and topography, the annual precipitation in various regions of Vietnam ranges from 1200 mm to 3000 mm. In Vietnam, 90% of the precipitation occurs in the rainy season, and the annual average humidity reaches 84%.
The terrain of Vietnam is long and narrow, including the north, middle, and south regions of the country. The northern part of the country is mostly mountainous, with the altitude decreasing from west to east. The western terrain is steep, with an altitude of about 1500–2500 m, and is the highest area in the Indo-China Peninsula. Due to Red River souring, the northern plain is a flat triangular area that is known as the Red River Delta (RRD). The Annan Mountains, which stretch for more than 1200 km through the middle, constitute the backbone of Vietnam’s terrain; Vietnam’s largest plateau, the “West Highland “ (WH), is located in the Annan Mountains. The Mekong Delta (MD) is in the south and has relatively stable terrain and a dense river network. It is the largest and most fertile plain in Vietnam.
2.2. Data Sources
The GLC_FCS30 dataset (2000, 2005, 2010, 2015, 2020) comes from the China Earth Big Data Science and Engineering Data Sharing Service System (
https://data.casearth.cn/sdo/list?searchKey=GLC_FCS30, accessed on 3 June 2022). This dataset was developed by Liu at the Institute of Aerospace Information Innovation, Chinese Academy of Sciences. The product contains nine first-level land-cover types and 30 s-level fine land-cover types. The overall accuracy of the first-level classification is 82.5% and the second-level accuracy is 68.7% [
29]. According to the actual land distribution in the study area, this paper conducts research on the first-level land types, and the land types (grassland, wetlands) with very small areas are merged (
Table 1). To be explained, impervious surface areas (ISAs) are defined as man-made land surface areas that water cannot pass through. They are primarily associated with human activities and habitation through the construction of transportation infrastructure and buildings [
30].
Taking into account the need for monthly data accuracy and time horizon, the meteorological data (2000–2020 annual) are from the GLDAS-2.1 [
31] and PERSIANN-CDR [
32] datasets, both of which have a spatial resolution of 0.25 radians. Both the GLDAS-2.1 and PERSIANN-CDR datasets are global scales, with temporal resolutions of 3 h for GLDAS-2.1 and 1 day for PERSIANN-CDR. We used the Google Earth Engine to calculate the annual total rainfall, rainy season rainfall, and annual average temperature data for Vietnam. The economic and social statistics for 2000–2020 (annual) are from the Vietnam Statistics Office (
https://www.gso.gov.vn/, accessed on 3 June 2022) and the World Bank (
https://data.worldbank.org.cn/country/vietnam?view=chart, accessed on 3 June 2022). Based on the Meteorological and economic statistics shown in
Table 2, this paper aims to establish a system of drivers of LULC change in Vietnam.
2.3. LULC Analysis Method
Integrated land-use dynamics are used to monitor the intensity of integrated land-use changes in the target zone [
33]. Furthermore, it reflects an integrated impact of regional human economic and social activities on LULC changes. The calculation method is as follows:
where
D is the integrated land-use dynamic degree during the study time period; Δ
Si is the total area of LULC type
i converted to other land types from the beginning of the study to the end of the study period;
Si is the total area of LULC type
i at the beginning of the study; and T is the research period.
The single land-use dynamic degree is used to characterize the rate and magnitude of the change in a LULC type within a certain period of time [
34]. The calculation method is as follows:
In the formula, Di is the dynamic degree of the land-use/cover type at the study time; Si1, Si2 denote the area of the land type i at the beginning and end of the study, respectively.
The land-use transition matrix is used to characterize the land-use change process. This matrix can reflect the land-use structure at the beginning and at the end of the study period and reveal the conversion rate and direction of each LULC type [
35]. Using ArcGIS, we could spatially overlay the land-use data between the two periods. The overlayed data could be used to calculate the transition matrix of the LULC types in Vietnam. This matrix can reflect the conversion between various LULC types in Vietnam during the study period. In this paper, we have visualized the transition matrix. Its expression is:
where:
S denotes the land area;
i and
j represent the LULC types at the beginning and end of the study period, respectively.
n indicates the number of LULC types.
2.4. Analysis of Driving Mechanism
The traditional method correlates all of the drivers at once using a certain model and then identifies the key drivers affecting LULC change. The shortage of the method makes it difficult to eliminate the influence on the final results due to the existence of self-correlation between the driving factors [
36].
Before conducting PCA (principal component analysis) and multiple linear stepwise regression analysis, it is necessary to perform a normality test. The normality test is used to check whether or not the data distribution is normal [
37]. Normality testing can be conducted using the Shapiro–Wilk test, which uses a database that has not been processed in the frequency distribution table, and is limited to samples between 3 and 50 elements [
38]. The significance test of the value of W with Shapiro–Wilk
Table 2 can be seen in the probability value (
p). Many authors consider the Shapiro–Wilk W statistic to be the best statistic for checking the data normality, especially for small sample sizes [
39]. If
p > 0.05, then the data is normally distributed. On the contrary, if
p < 0.05, then the data are not normally distributed. Its formula is as follows:
where:
is a coefficient of the Shapiro–Wilk test (in our study,
0.6646,
), and
are values of the samples
(i.e.,
). If n is even, let m = n/2, and if n is odd, let m = (n − 1)/2 (in our paper, n = 5, m = 2).
is the average of the data.
This paper first carried out the PCA algorithm on 18 factors based on the SPSS platform to eliminate the internal correlation among the factors. The PCA algorithm projects a series of variables onto a few key factors, that is, it derives a few principal components from the original variables. The key factors retain as much information about the original variables as possible and demonstrate non-internal correlations. Thus, the PCA algorithm eliminates data redundancy. Then, regression models are constructed for each LULC change based on the key factors.
PCA is a statistical method for dimensionality reduction. The PCA process can be roughly summarized in two steps: The first step is to perform a linear transformation on a set of variables that may be internally correlated by using orthogonal transformation. The purpose of linear transformation is to transform a set of potentially correlated variables into a set of linearly uncorrelated variables. The second step is to recombine selected variables into a few uncorrelated comprehensive variables. These recombined variables are called principal components. Generally, we use the variance of F1 to indicate the information richness of F1. The larger the variance, the more information F1 contains. If F1 is not enough to express the information of many original indicators, then we consider selecting F2 as an additional indicator. Moreover, if the information already exists in F1, then it is not necessary to present the information in F2 nor in F3, F4...FP. Its construction formula is as follows:
where A
1i, A
2i,
, A
pi are the eigenvectors corresponding to the eigenvalues of the covariance matrix of the variable X, and Z
X1, Z
X2,
, Z
Xp are the values of the original variables after the Z standardization process.
LULC change is affected by many factors. In order to predict the dependent variable more effectively, this paper uses multiple linear stepwise regression to select the optimal combination from multiple independent variables. In this study, each land-use/cover type is the dependent variable. Additionally, climate, population, economic and social development, and other indicators are the independent variables. A multiple linear stepwise regression analysis is carried out with the support of the R language software platform. The multiple regression model is as follows:
In the formula, α1, α2, …, αn represent the correlation coefficient, β is a constant term, Y is the dependent variable, and X is the independent variable.
3. Results
3.1. Spatial Distribution
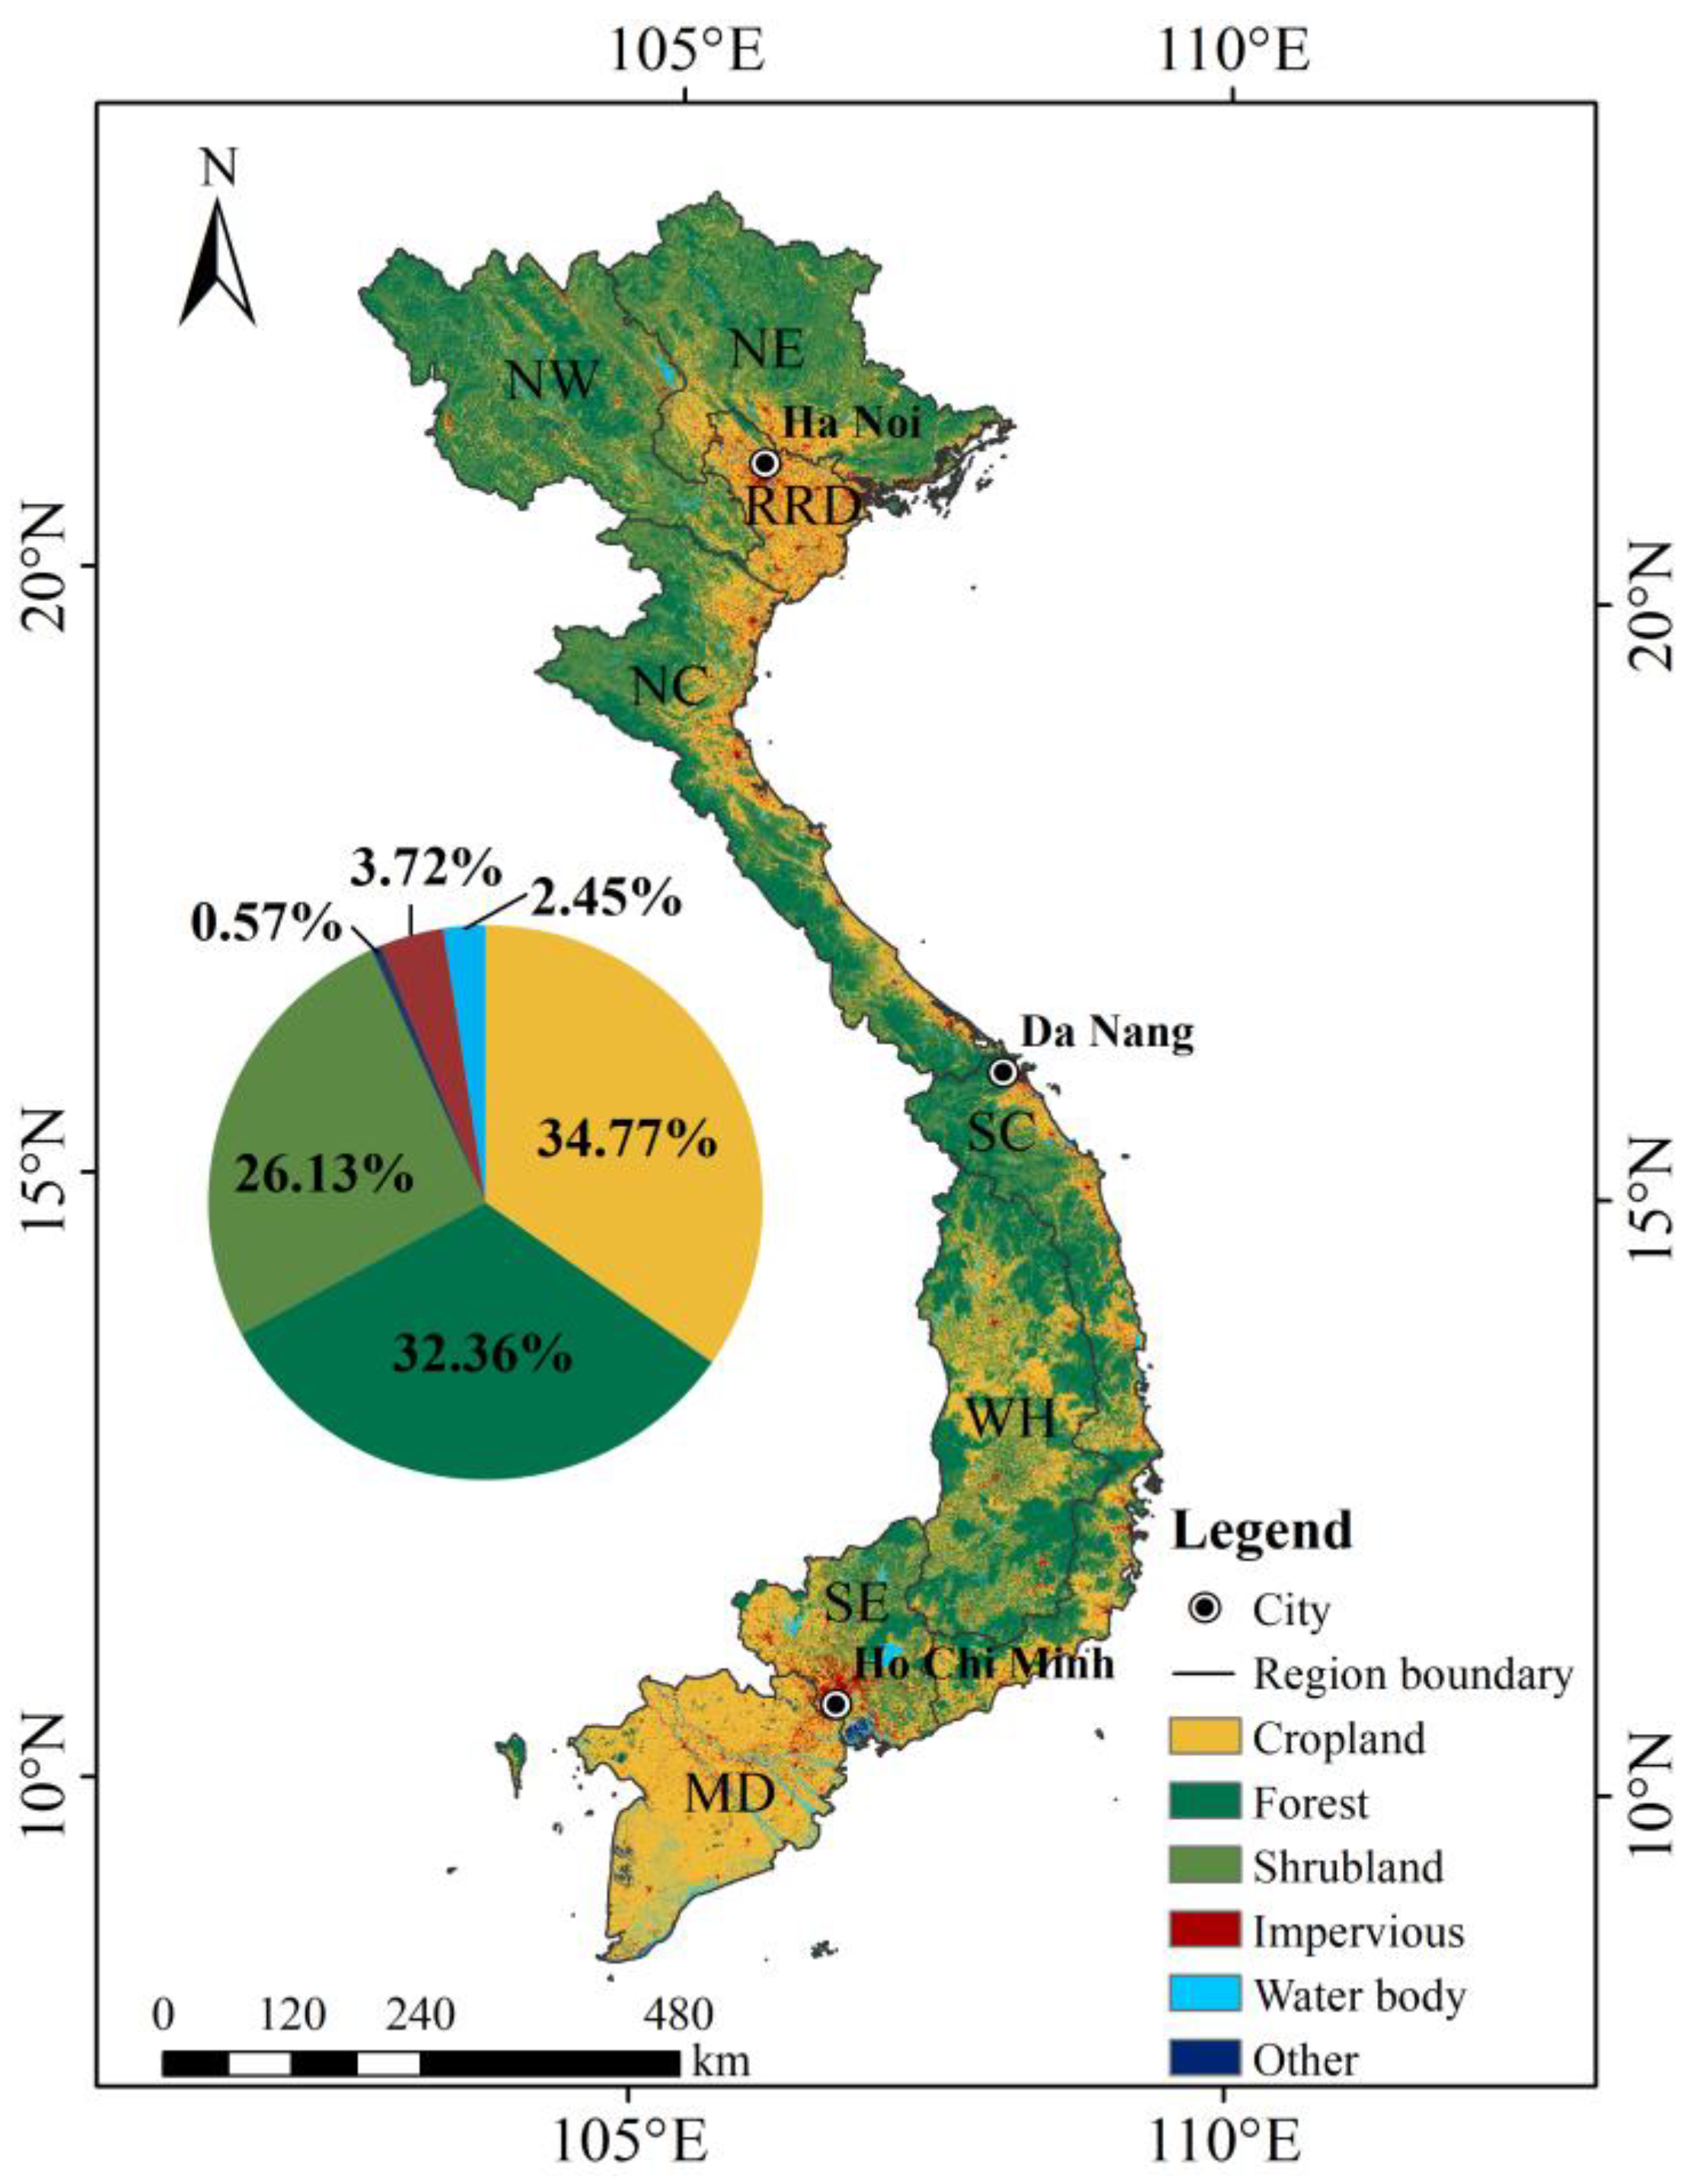
Statistics for various types of land areas in Vietnam in 2020 show that (
Figure 2): in Vietnam, cropland (total area 11.46 × 10
4 km
2, accounting for 34.77% of the area) and forest land (10.67 × 10
4 km
2, 32.36%) were the main land-cover types, followed by shrubland (8.61 × 10
4 km
2, 26.13%), impervious surfaces (1.22 × 10
4 km
2, 3.72%), water bodies (0.81 × 10
4 km
2, 2.45%), and other land types (grassland, wetlands) (0.19 × 10
4 km
2, 0.57%).
Nationally, cropland is widely distributed and is mainly concentrated in the two major plains of the Red River Delta in the north and the Mekong River Delta in the south, followed by the coastal region in the north-central and the south-central and the West Highland areas. Forest land and shrubland are mainly distributed in the mountainous areas of the Northwest, the Northeast, the North Central Coast, and the South-Central Coast. Impervious surfaces are scattered throughout the study area, with HoNoi and Ho Chi Minh being the most densely distributed. Water bodies are distributed in the Red River system in the northeast and the Mekong River basin in the south. The other land-cover type is distributed in the Northwest area, the eastern coast of the Ho Chi Minh City region, and the coastal area of the Mekong River Delta.
From a regional perspective, the Northwest region of Vietnam was dominated by forest and shrubland, of which forest accounts for 41.8%, shrubland accounts for 41.7%, and cropland accounts for only 13.7%. Most Northeast areas comprise cropland, forest, and shrubland (21.3%, 33.8%, and 41.8%, respectively). The Red River Delta mainly consists of cropland and impervious surfaces, which account for 71.2% and 17.4% of the region’s land area, respectively. The South-Central Coast mainly consists of cropland, forest, and shrubland (30.1%, 38.9%, and 24.7%, respectively). The West Highland is dominated by forest (47.5%) followed by cropland and shrubland (31.8%, 18.4%, respectively). The Southeast mainly consists of cropland (41.5%) followed by forest and shrubland, which account for 23.6% and 19.6% of the region’s land area. Most of the Mekong River Delta area is cropland, which accounts for 84% of the land in the Mekong River Delta region.
3.2. Spatio-Temporal Dynamic Changes
From 2000 to 2020, the impervious surfaces throughout Vietnam expanded greatly, while the cropland and forest areas decreased. In the meantime, the area of shrubland, water bodies, and other land types have expanded to varying degrees. The impervious area changed significantly from 6.10 × 10³ km2 to 12.21 × 10³ km2 from 2000 to 2020. The absolute growth is 6.11 × 10³ km2, showing a relative increase of 100%. The cropland and forest area decreased sharply (−6.86 × 10³ km2, −4.40 × 10³ km2, respectively), decreasing by 5.56% and 3.96%, respectively. The shrubland area increased by 4 × 10³ km2 or by about 4.87%; the water body and other land areas increased little (+0.89 × 10³ km2, +0.25 × 10³ km2, respectively), but the growth rate was more significant (+12.29%, +15.04%, respectively) due to their smaller relative areas.
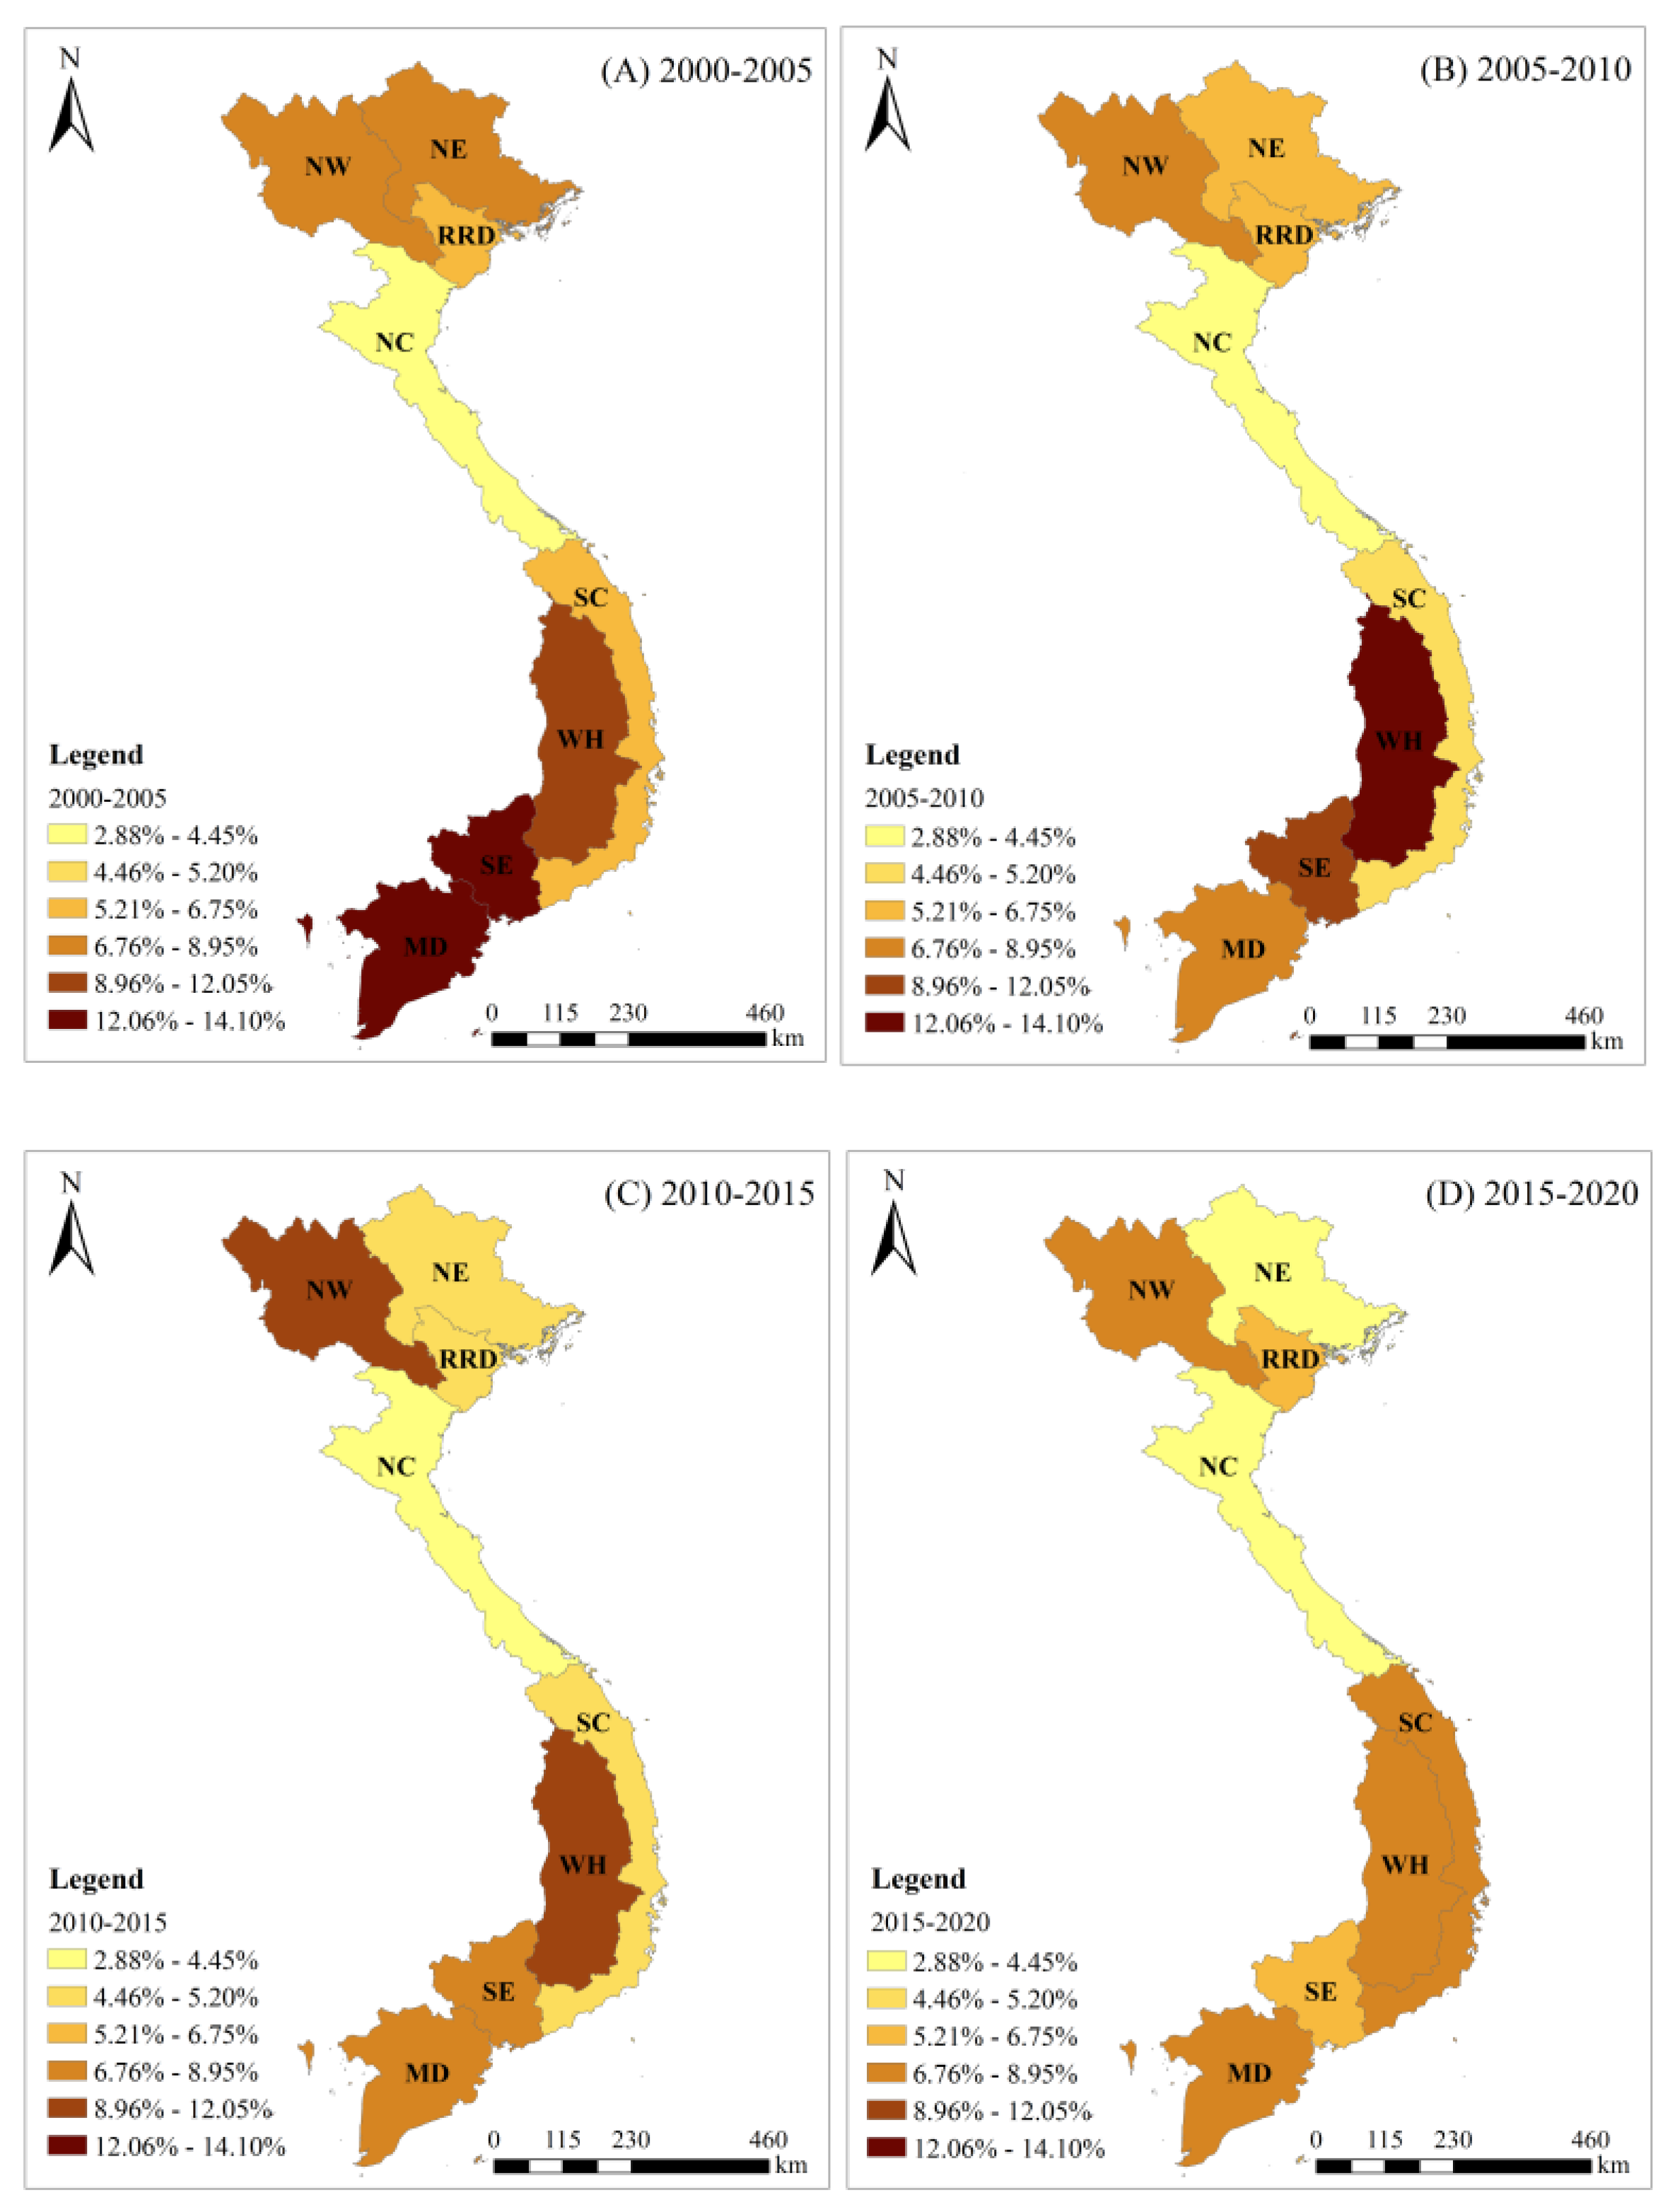
In terms of the change in dynamic degree, the rate of LULC change increased rapidly in the early period (2000–2010) and decreased rapidly in the later period (2010–2020). In 2000–2005 and 2005–2010, the integrated dynamic degree of LULC in Vietnam was 7.52% and 6.43%, respectively. The integrated dynamic degree of LULC in Vietnam gradually decreased to 5.87% and 5.53% in 2010–2015 and 2015–2020, respectively. There are significant differences in the integrated dynamic degree in northern, central, and southern Vietnam, and the highest was in the south, followed by the north, and the lowest was in the middle (
Figure 3). From 2000 to 2005 (
Figure 3A), the Mekong River Delta and the Southeast regions demonstrate the most active land change, showing integrated dynamic degrees of 14.10% and 13.96%, respectively, mainly due to the decrease in cropland. This was followed by the West Highland (9.99%), whose land-use change was mainly due to the decrease in forest areas. The integrated dynamic degree of land use in other regions ranges from 6.27% to 8.91%. From 2005 to 2010 (
Figure 3B), in addition to the increase in the integrated dynamic degree of land use in the West Highland region, it was as high as 13.53%, which was mainly due to the substantial reduction in forest areas. The integrated dynamic degree of land use in other regions showed an obvious downward trend (mostly between 5.19% and 8.41%, Southeast was 11.32%). From 2010 to 2015 (
Figure 3C), with the exception of the Northwest region, which increased to 12.04%, the integrated dynamic degree in other regions continued to show a downward trend (mostly between 4.42% and 6.94%, while the West Highland was 11.03%). By 2015–2020 (
Figure 3D), the integrated dynamic degree of land-use cover in each region was generally low, ranging from 3.35% to 8.47%. It is noteworthy that the degree of land-use change in the North Central Coast region was low from 2000 to 2020, and its integrated dynamic degree was between 2.28% and 4.42%. Land-use change in the North Central Coast region was mainly caused by reductions in cropland.
3.3. Source and Destination
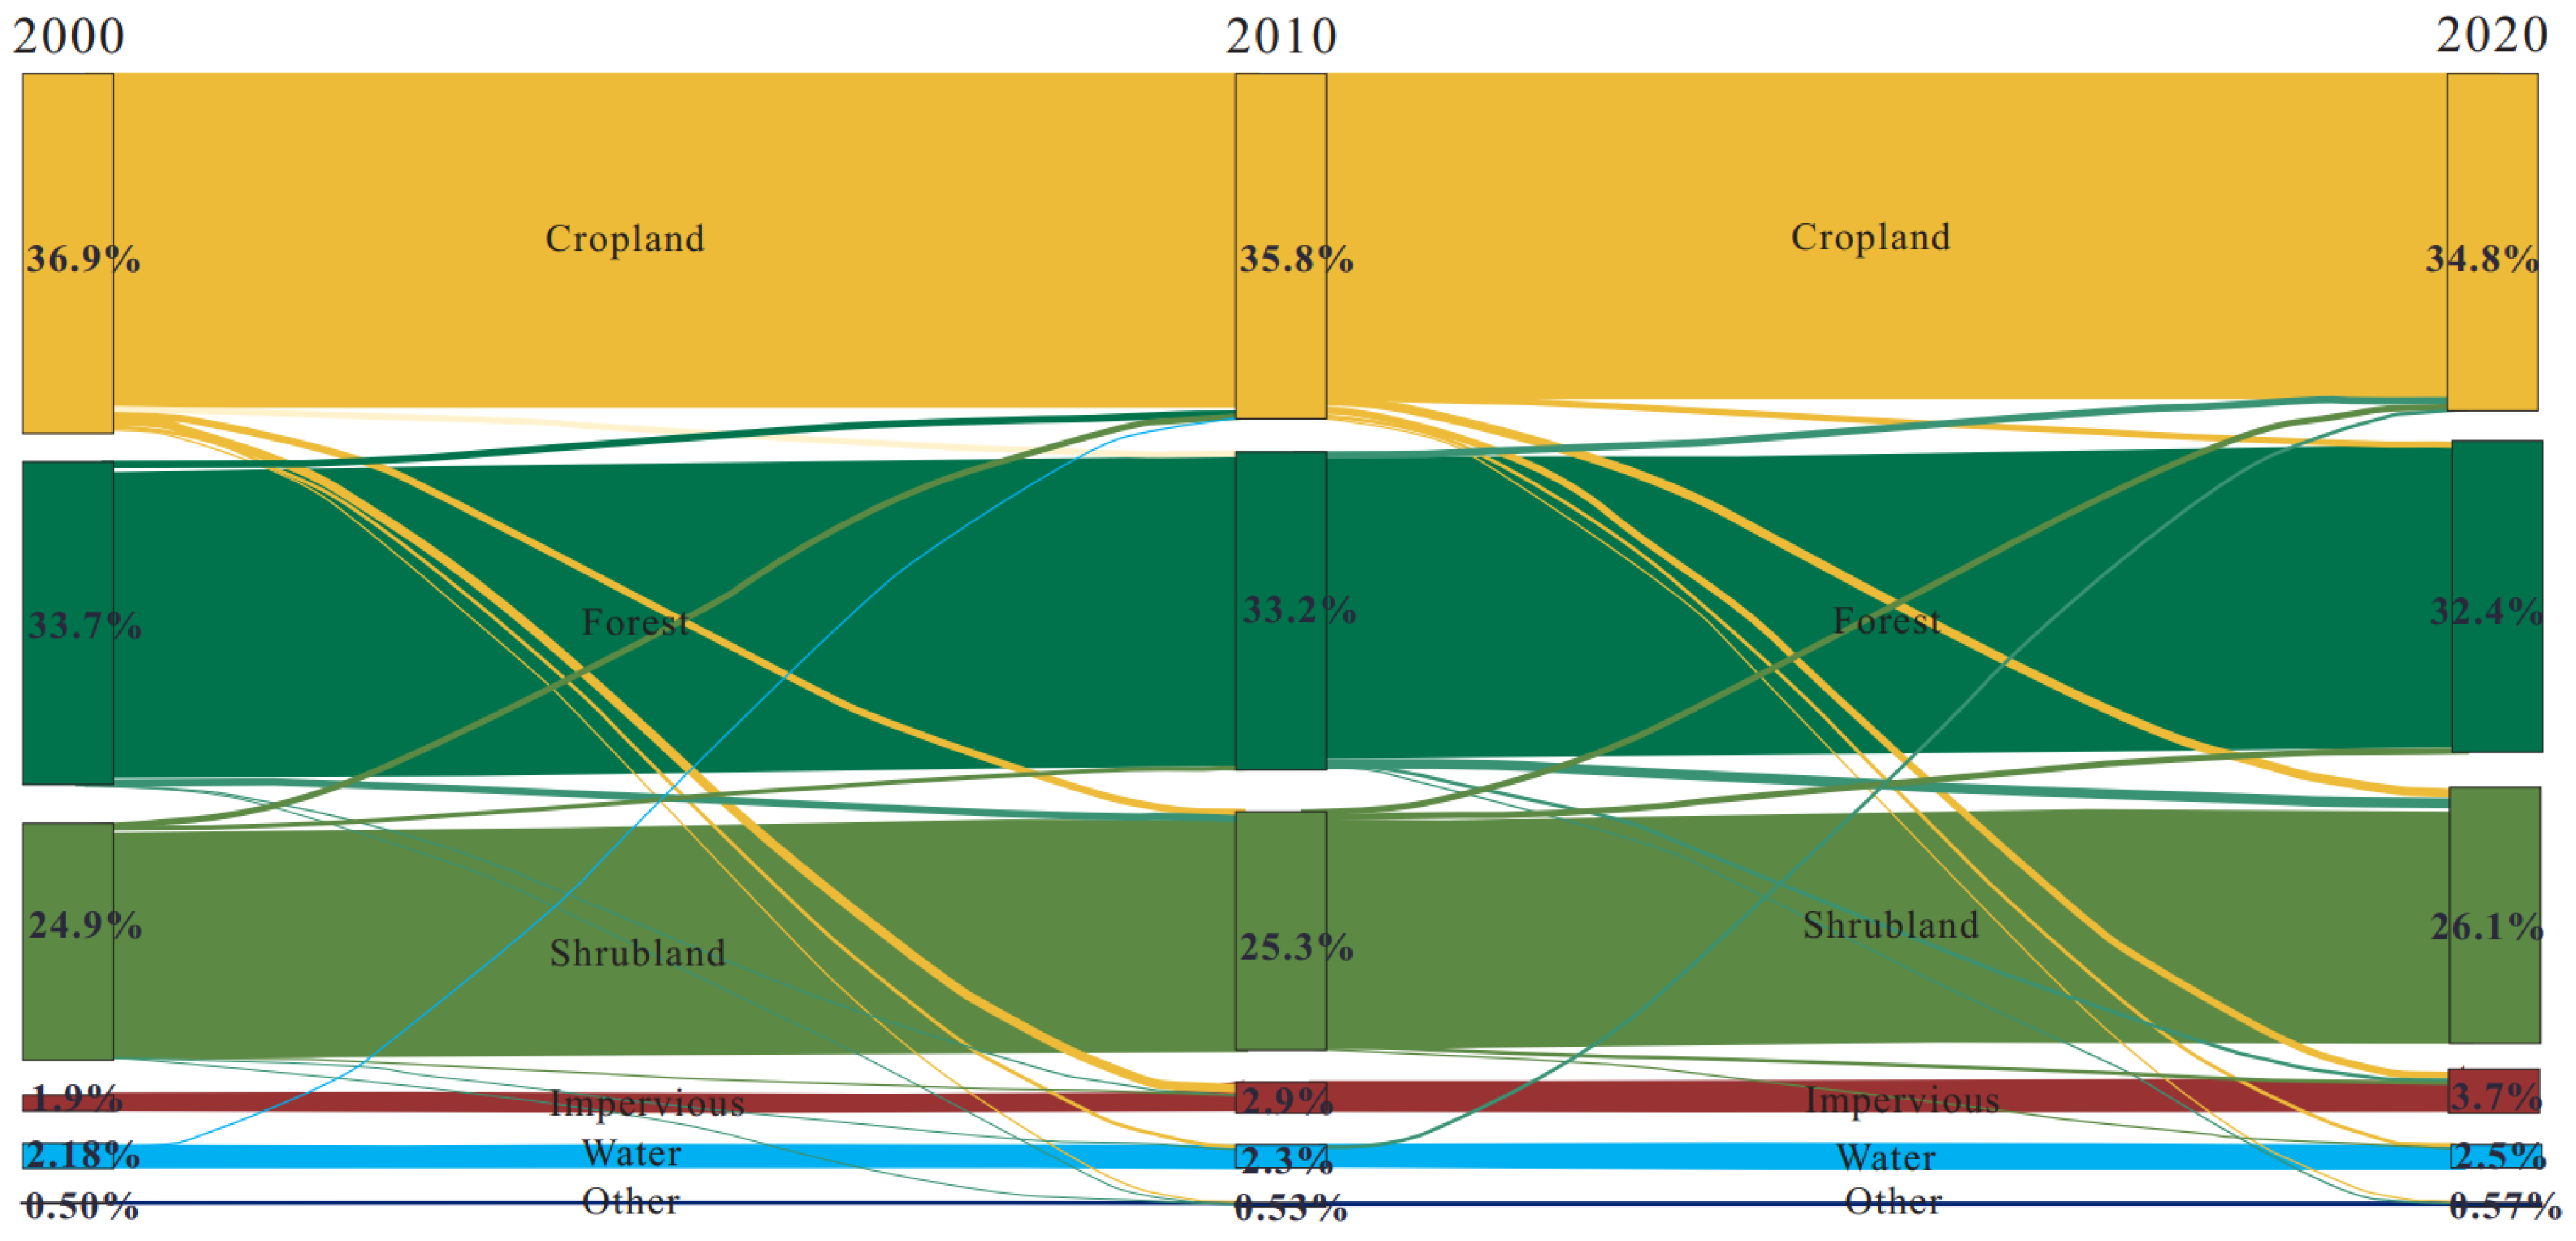
By analyzing the area and composition of LULC change in Vietnam from 2000 to 2020 (
Figure 4), we found that the conversion areas of all of the LULC types were 1.7 × 10
4 km
2 (5.16%) from 2000 to 2010, and 2.0 × 10
4 km
2 (6.07%) from 2010 to 2020. The most important LULC change processes in different periods are the interconversion among forest, cropland, and shrubland, and the one-way conversion of cropland to impervious surfaces. In addition, there are a few other LULC changes, such as the conversion of forest and shrubland to impervious surfaces, the interconversion between water body and cropland, etc.
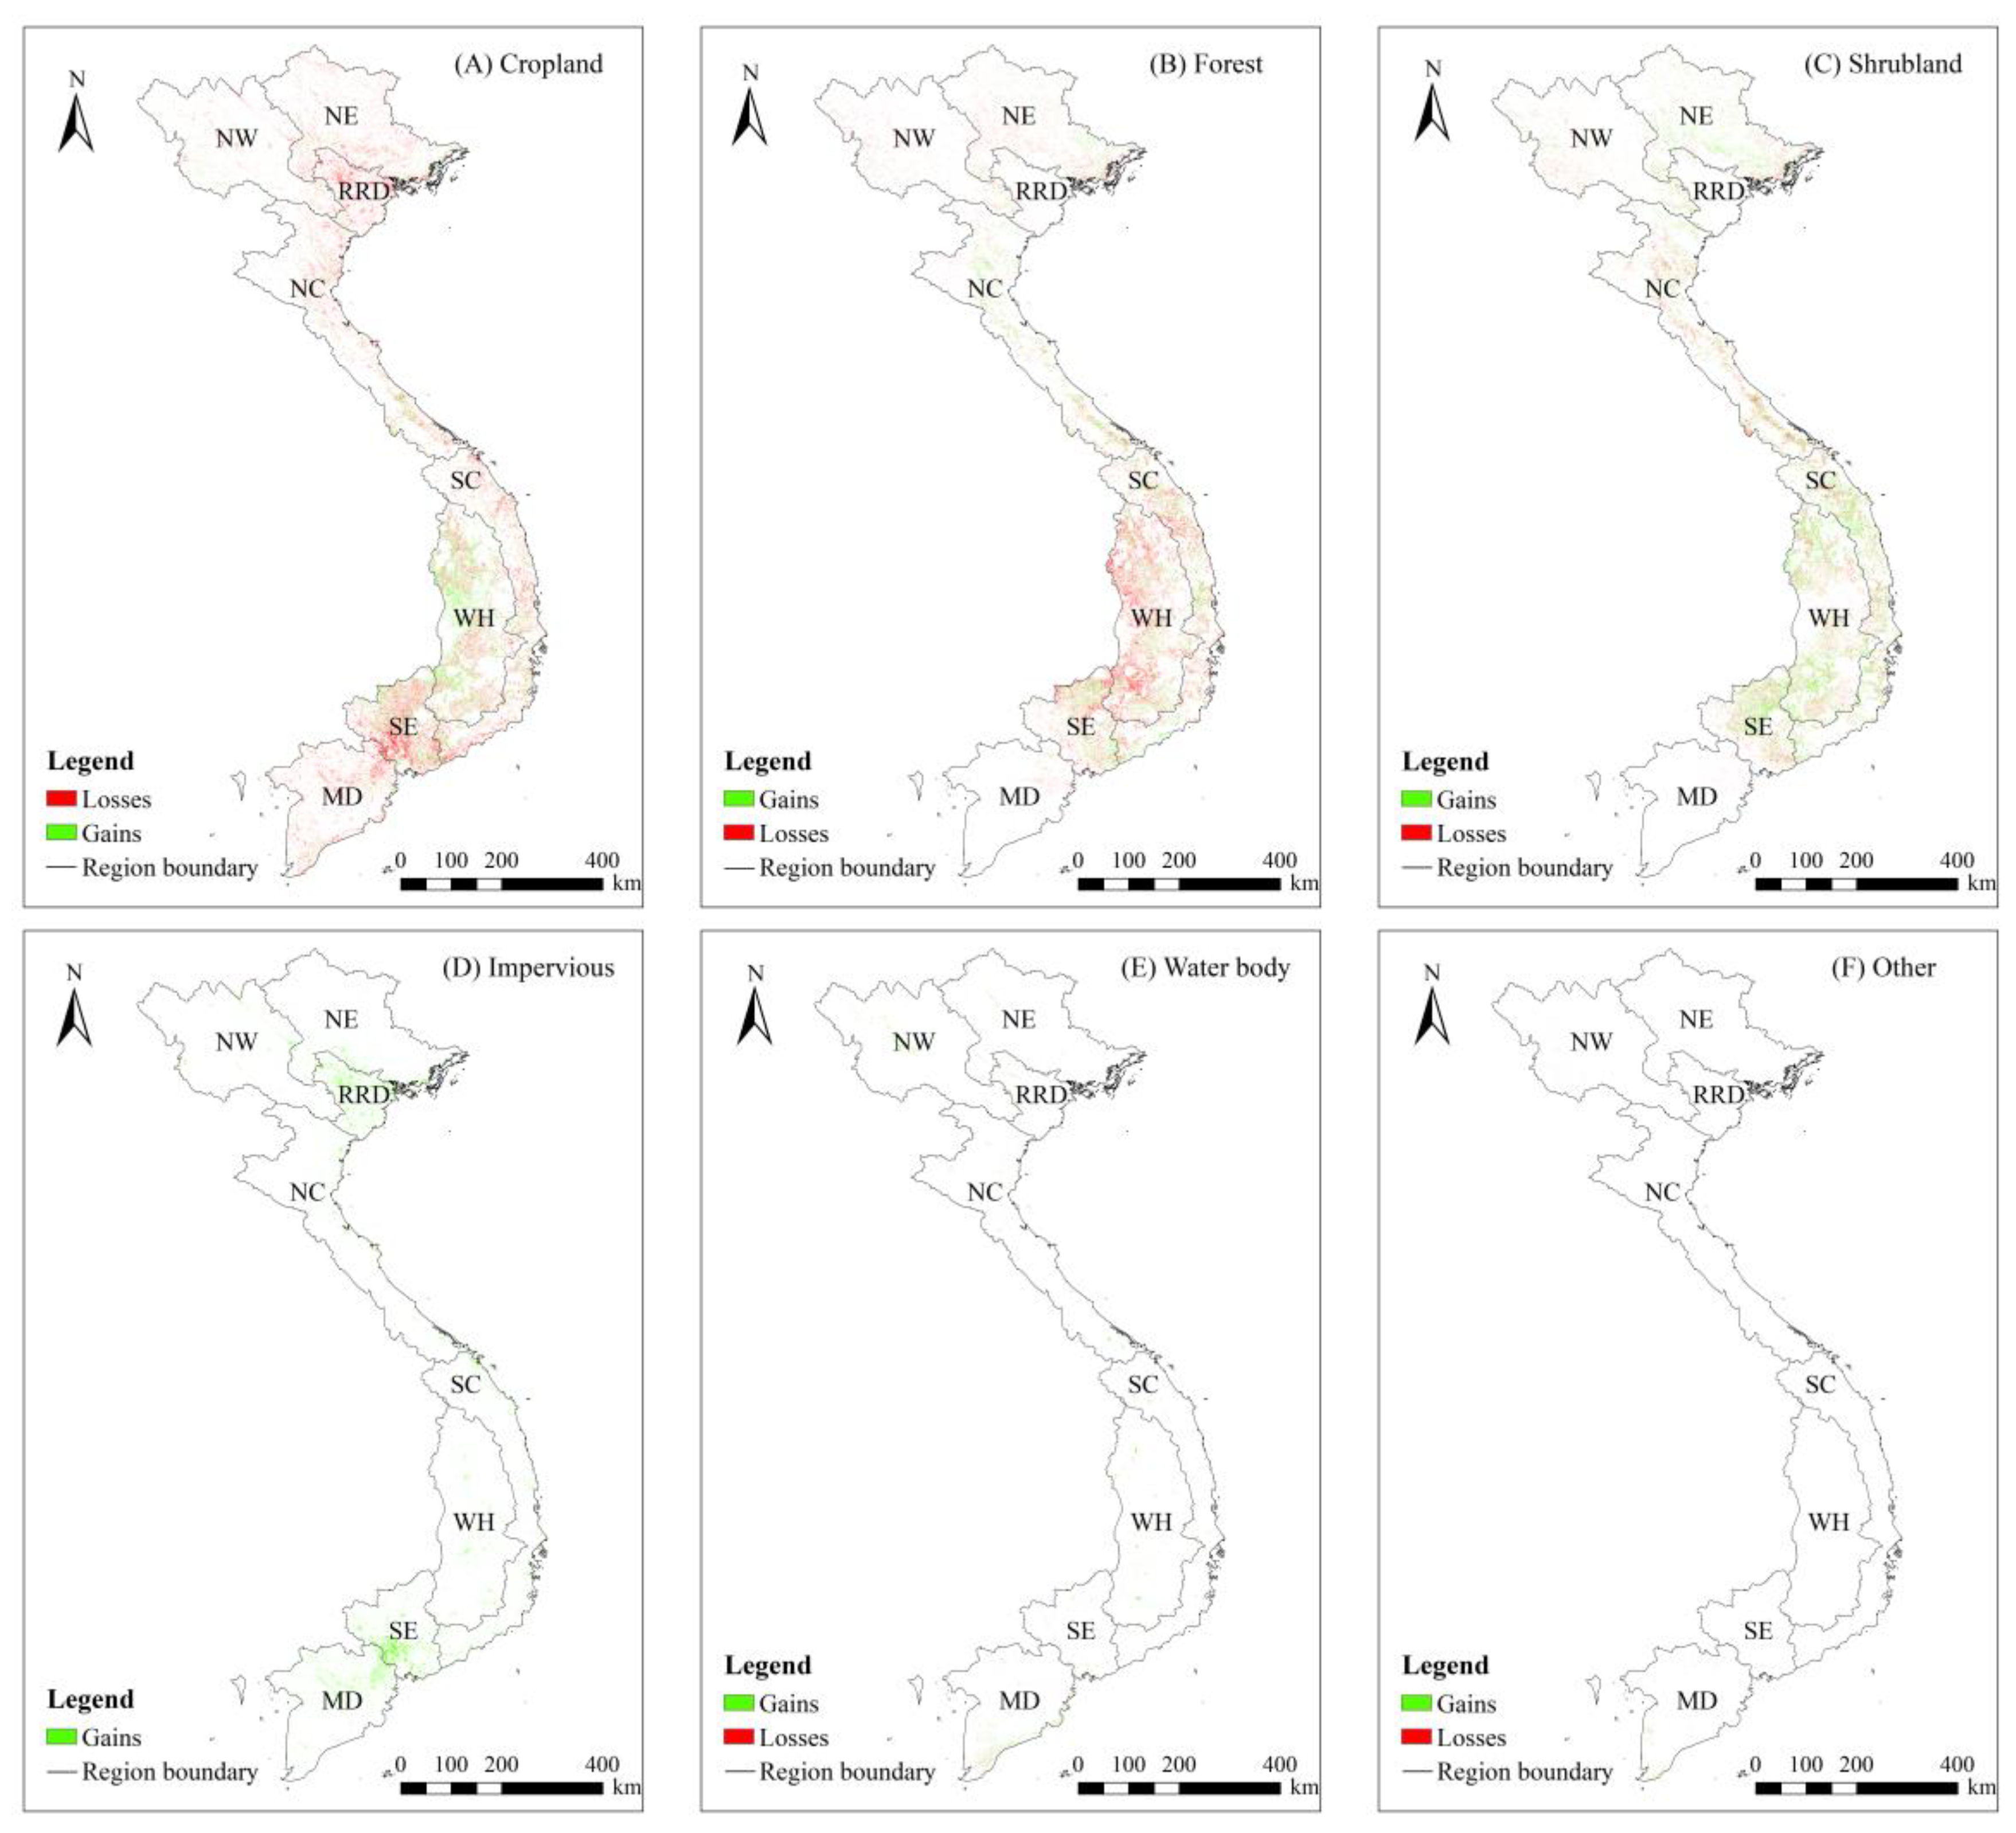
From 2000 to 2020, cropland decreased at an annual rate of about 0.28%, and the overall cropland showed a downward trend. The area of lost cropland totaled 14.73 × 10
3 km
2, which was mainly converted to forest land (21.69%), shrubland (34.09%), and impervious surfaces (36.07%), most of which were distributed in the Southeast and Red River Delta. Moreover, cropland area grew by 7.88 × 10
3 km
2, mainly from forest (55.04%) and shrubland (40.15%), mostly in the Southeast and West Highland, with little forest and shrubland being distributed in the North Central Coast and the South-Central Coast (
Figure 5A).
The forest area also showed a decreasing trend, showing an integrated dynamic degree of LULC of −0.20%. In total, 10.79 × 10
3 km
2 of forest area was lost, mainly to cropland (40.20%) and shrubland (54.20%). During the same period, forest area increased by 6.39 × 10
3 km
2, mainly from cropland (50%) and shrubland (49.50%). The forest conversion process was mainly concentrated in the South-Central Coast, the West Highland region, and the Southeast (
Figure 5B).
The integrated dynamic degree of shrubland was 0.24%, and the area continues to increase. In total, 6.90 × 10
3 km
2 of shrubland area was lost, mainly to cropland (45.84%) and forest (45.85%), most of which was mainly distributed in the North Central Coast, the South-Central Coast, the West Highland region, and the Southeast. Shrubland area increased to10.90 × 10
3 km
2, mainly from cropland (46.06%) and forest (53.64%). These increases mainly occurred in the Southeast, the West Highland region, and the South-Central Coast (
Figure 5C).
For impervious surfaces, the area gained was much larger than the area lost due to the effects of solid and continuous human activities. Furthermore, the process of impervious surface loss does not occur in some small-scale areas. In Vietnam, from 2000 to 2020, the integrated dynamic degree of impervious surfaces was as high as 5.02%. The net gain in the area of impervious surfaces was 6.12 × 10
3 km
2 and was mainly from cropland (86.81%); some obvious change was concentrated in the Red River Delta, the West Highland region, and the Mekong River Delta (
Figure 5D).
Water bodies showed a slight increasing trend, and their integrated dynamic degree was 0.61%. There was a decrease in the water body area of 0.45 × 10
3 km
2, and this area was mainly converted to cropland (75.96%), mostly in the Mekong River Delta. During the same period, there was an increase in the area of 1.33 × 10
3 km
2, mainly from cropland (73.39%), which occurred in all regions (
Figure 5E).
The integrated dynamic degree of other land was 0.75%, and the area continued to increase. In addition, other land types (grassland and wetlands) only lost 0.07 × 10
3 km
2 of their total area, mainly to cropland, and these losses were sporadically distributed in the Northwest region. During the same period, other land area types demonstrated a 0.31 × 10
3 km
2 increase in their total area, mainly from cropland, mostly in the Mekong River Delta (
Figure 5F).
3.4. Economic, Social, and Climate Change
Based on the statistical indicators of Vietnam’s economic and social development from 2000 to 2020 (annual) in
Table 2, we analyzed the climate, economic, and social changes in Vietnam from 2000 to 2020. Additionally, we used the simple linear regression and exponential regression (GDP, population growth rate) methods to calculate their trends, which made it easier to study the driving mechanism. The details are as follows:
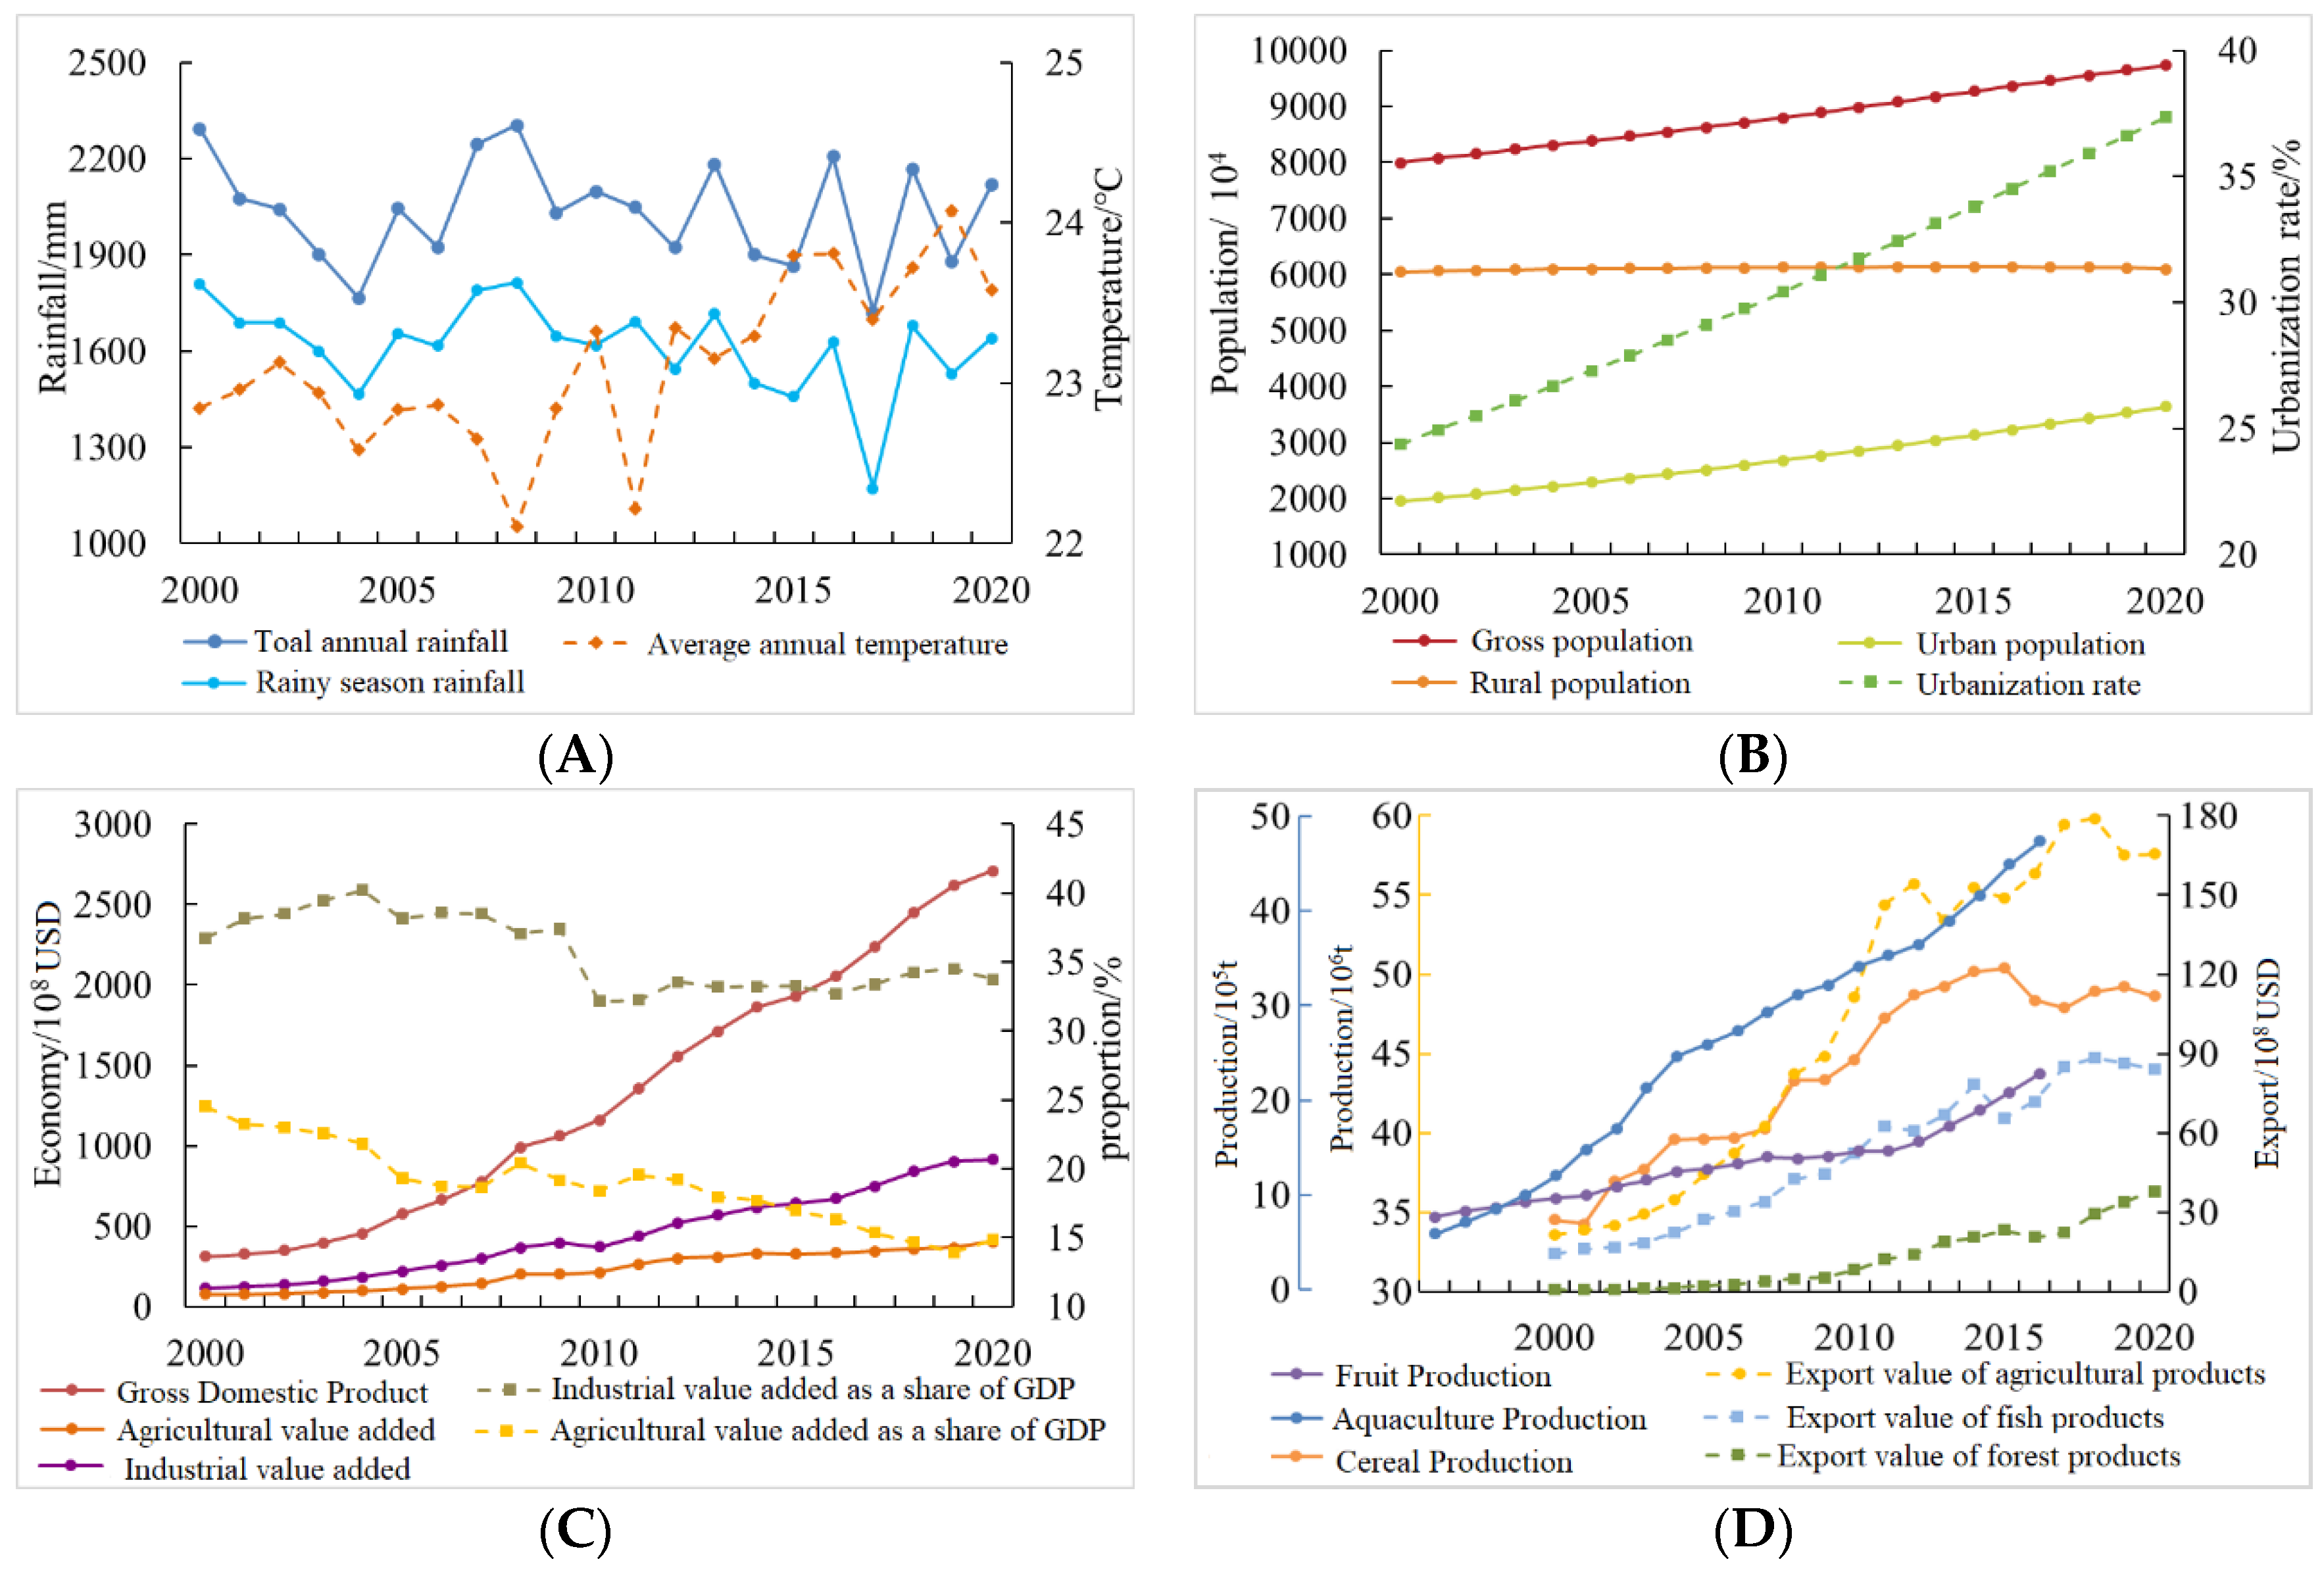
From 2000 to 2020, Vietnam’s climate generally showed a slight warming and drying trend. For many years, the average annual temperature has been 23.1 °C and has shown an overall increasing trend (0.5 °C/10a) over the past 20 years. The change in the total precipitation in the rainy season from 2293.76 mm in 2000 to 2117.78 mm in 2020 is basically consistent with the total annual precipitation, which also shows a downward trend (
Figure 6A).
The total population of the country is demonstrating a high growth trend. The annual growth rate of the country’s total population is 9.91‰, with a total increase of 17.43 million people in the past 20 years. Among them, the rural population has increased by 559,300, and the urban population has increased by 16,868,900. Urbanization is developing rapidly. The urbanization rate is steadily increasing, increasing from 24.6% in 2000 to 37.3% in 2020, with an annual increase of 6.3 percentage points (
Figure 6B).
Vietnam’s national economy is developing rapidly. The average annual growth rate of the national GDP is 11.4%, from USD 31.173 billion in 2000 to USD 271.158 billion in 2020. The value-added from the primary industries and the value-added from secondary industries maintained the same rapid growth trend as the GDP. Due to the rapid development of tertiary industries, the proportion of the primary and secondary industries in the GDP shows a downward trend (
Figure 6C).
From 2000 to 2020, the national grain output showed a rapid upward trend (8.2 × 10
5 t/a), from 3.5 × 10
7 t in 2000 to 4.8 × 10
7 t in 2020. Compared to grain output, the rising trend of fruit production and aquaculture production was more significant (annual growth rates of 6.3 × 10
4 t/a and 2.1 × 10
5 t/a), from 7.7 × 10
5 t and 5.9 × 10
5 t in 2000 to 22.8 × 10
5 t and 47.3 × 10
5 t in 2020. In addition to the obvious increase in material production, the value of the exports from agriculture, forestry, and aquaculture has also increased significantly. The average annual growth rate of the export value of agricultural, forestry, and aquaculture products reached 9.2 × 10
8 USD/a, 1.8 × 10
8 USD/a, and 4.2 × 10
8 USD/a. Compared to 2000, the export value of agricultural, forestry, and aquaculture products in 2020 was 7.7 times, 60.9 times, and 5.9 times higher than before (
Figure 6D).
3.5. Driving Forces and Driving Mechanisms of LULC
We calculated the W values of all of the independent variables using Formula (4), and the
p-value was obtained by linear interpolation based on
Table 2 of the Shapiro–Wilk Tables. For example, we calculated the W value of the total annual precipitation (X1) to be 0.966, and we then looked for a value of 0.966 when
n = 5 in
Table 2 of the Shapiro–Wilk Tables to determine whether the
p-value lies between 0.50 (W = 0.927) and 0.90 (W = 0.979). Using the linear interpolation value of 0.966 between these values, we determined that the
p-value is 0.80. Since the
p-value = 0.80 > 0.05, we retain the hypothesis that X1 is normally distributed. According to this, we can conclude that all of the independent variables (X1–X18) in our study are normally distributed (
Table 3). Since the
p-value is based on linear interpolation, it is not very accurate, but the important thing is that it is much higher than 0.05, meaning that our normality test has a high degree of confidence.
Since the 18 factors in the statistic have different units of measurement, the magnitude of their values varies widely. We first standardized the data so that all of the variables had the same standard deviation. Then, PCA was performed in SPSS. The PCA showed that (
Table 4) the information on the changes in the 18 indicators in Vietnam over the past 20 years can be summarized in two dimensions. The priority principal component, F1, is the economic and social development feature, which is highly positively correlated with 10 factors: the gross population (X4), urban population (X6), urbanization rate (X7), gross domestic product (X8), agricultural value-added (X9), industrial value-added (X10), cereal production (X13), aquaculture production (X14), export value of agricultural products (X16), and export value of fish products (X18). F2 is the climate change dimension and has a strong positive correlation with two factors: the total annual precipitation (X1) and rainy season precipitation (X2). In terms of the contribution of F1 and F2, the effect of F1 is much more significant than F2 (84.04% vs. 10.75%).
We took the area of various land-use types as the dependent variables and the two principal components as the independent variables. By applying the multiple linear stepwise regression method, we obtained the regression models of the area of each category with the principal components F1 (economic and social) and F2 (climate change) (
Table 5). The results reveal that the cropland area was significantly negatively correlated with F1, which indicates that with the improvement of national economic and social development level in Vietnam, the cropland area in the country has decreased. In contrast, there was a significant positive correlation between F1 and the area of three land-cover types: impervious surfaces, shrubland, and water bodies. The positive correlation reveals that with the improvement of Vietnam’s national economic and social development level, the area of impervious surfaces, shrubland, and water bodies will continue to increase accordingly. The forest area is negatively correlated to F1 and F2. This simultaneous correlation shows that with the improvement of Vietnam’s national economic and social development level and the increase in precipitation, the forest area in the country will gradually decrease. In general, the changes in the major LULC types in Vietnam are mainly affected by economic and social development changes, while climate change only affects the forest area.
Furthermore, we used six land area types as dependent variables and the following twelve explanatory factors as input variables: X4, X6, X7, X8, X9, X10, X13, X14, X16, and X18 in F1 and X1 and X2 in F2. Then, we established the multiple linear regression models of the different land-use types (
Table 6). This model indicated that the cropland area is significantly negatively correlated with the urban population (X6) and significantly positively correlated with GDP (X8). In addition, the impervious surface area has a significant positive correlation with the urbanization rate (X7) but a significant negative correlation with the urban population (X6). The water area has a significant positive relationship with aquaculture production (X14). There is no reliable statistical relationship between the forest and shrubland areas and the related economic, social, and climatic factors. The above results reveal that the main LULC type changes in Vietnam are mainly influenced by core economic and social development factors such as the GDP size, urban population size, and urbanization rate. Except for the water body area being directly related to aquaculture production, other industry development factors (physical quality factor, value quantity) have no plausible impact on LULC use. All of the climate change factors have no plausible impact on LULC change.
5. Conclusions
Based on the global public LULC dataset and authoritative economic and social statistical data, this paper analyzed Vietnam’s LULC change from 2000 to 2020 using dynamic degree, flow direction analysis, principal component analysis, and correlation analysis. The spatio-temporal patterns of the LULC change in Vietnam revealed the impact of economic and social development on LULC. Moreover, we also briefly discussed the potential impact of changes in LULC on national sustainable development and the uncertainty in research. Our research aims at the latest and longest time-series analysis of LULC variation patterns and mechanisms on a national scale.
Our research suggested that Vietnam’s LULC types are dominated by cropland, forest, and shrubland. In the past 20 years, the area of Vietnam’s cropland and forest area has decreased, while the shrubland, water body, and other land-use areas have shown an increasing trend, and impervious surface area has shown a high expansion trend. LULC changes in Vietnam are mainly influenced by human economic activities and have no statistical relationship with climate changes or fluctuations. The current LULC changes in Vietnam tend to be detrimental to the stability and sustainable development of the ecosystem, and the Vietnam government needs to pay attention and take targeted measures.
This paper established a LULC spatio-temporal evolution analysis method based on the GLC-FCS30 datasets. Simultaneously, we provide a driving mechanism analysis method based on principal components and multiple linear stepwise regression analysis. This technical route may be adapted to other countries and regions. However, this method also has some shortcomings, such as relying on the basic LULC data, and the driving factors of the modeling process have been over-simplified. For future work, on the one hand, we should improve the accuracy of the basic data. On the other hand, we need to focus on building artificial intelligence modeling methods (Geo-AI) based on big data and spatial reasoning to improve the credibility of the drive mechanism.


 ,
, 


