
Torrential Hazard Prevention in Alpine Small Basin through Historical, Empirical and Geomorphological Cross Analysis in NW Italy

 , , and
Abstract
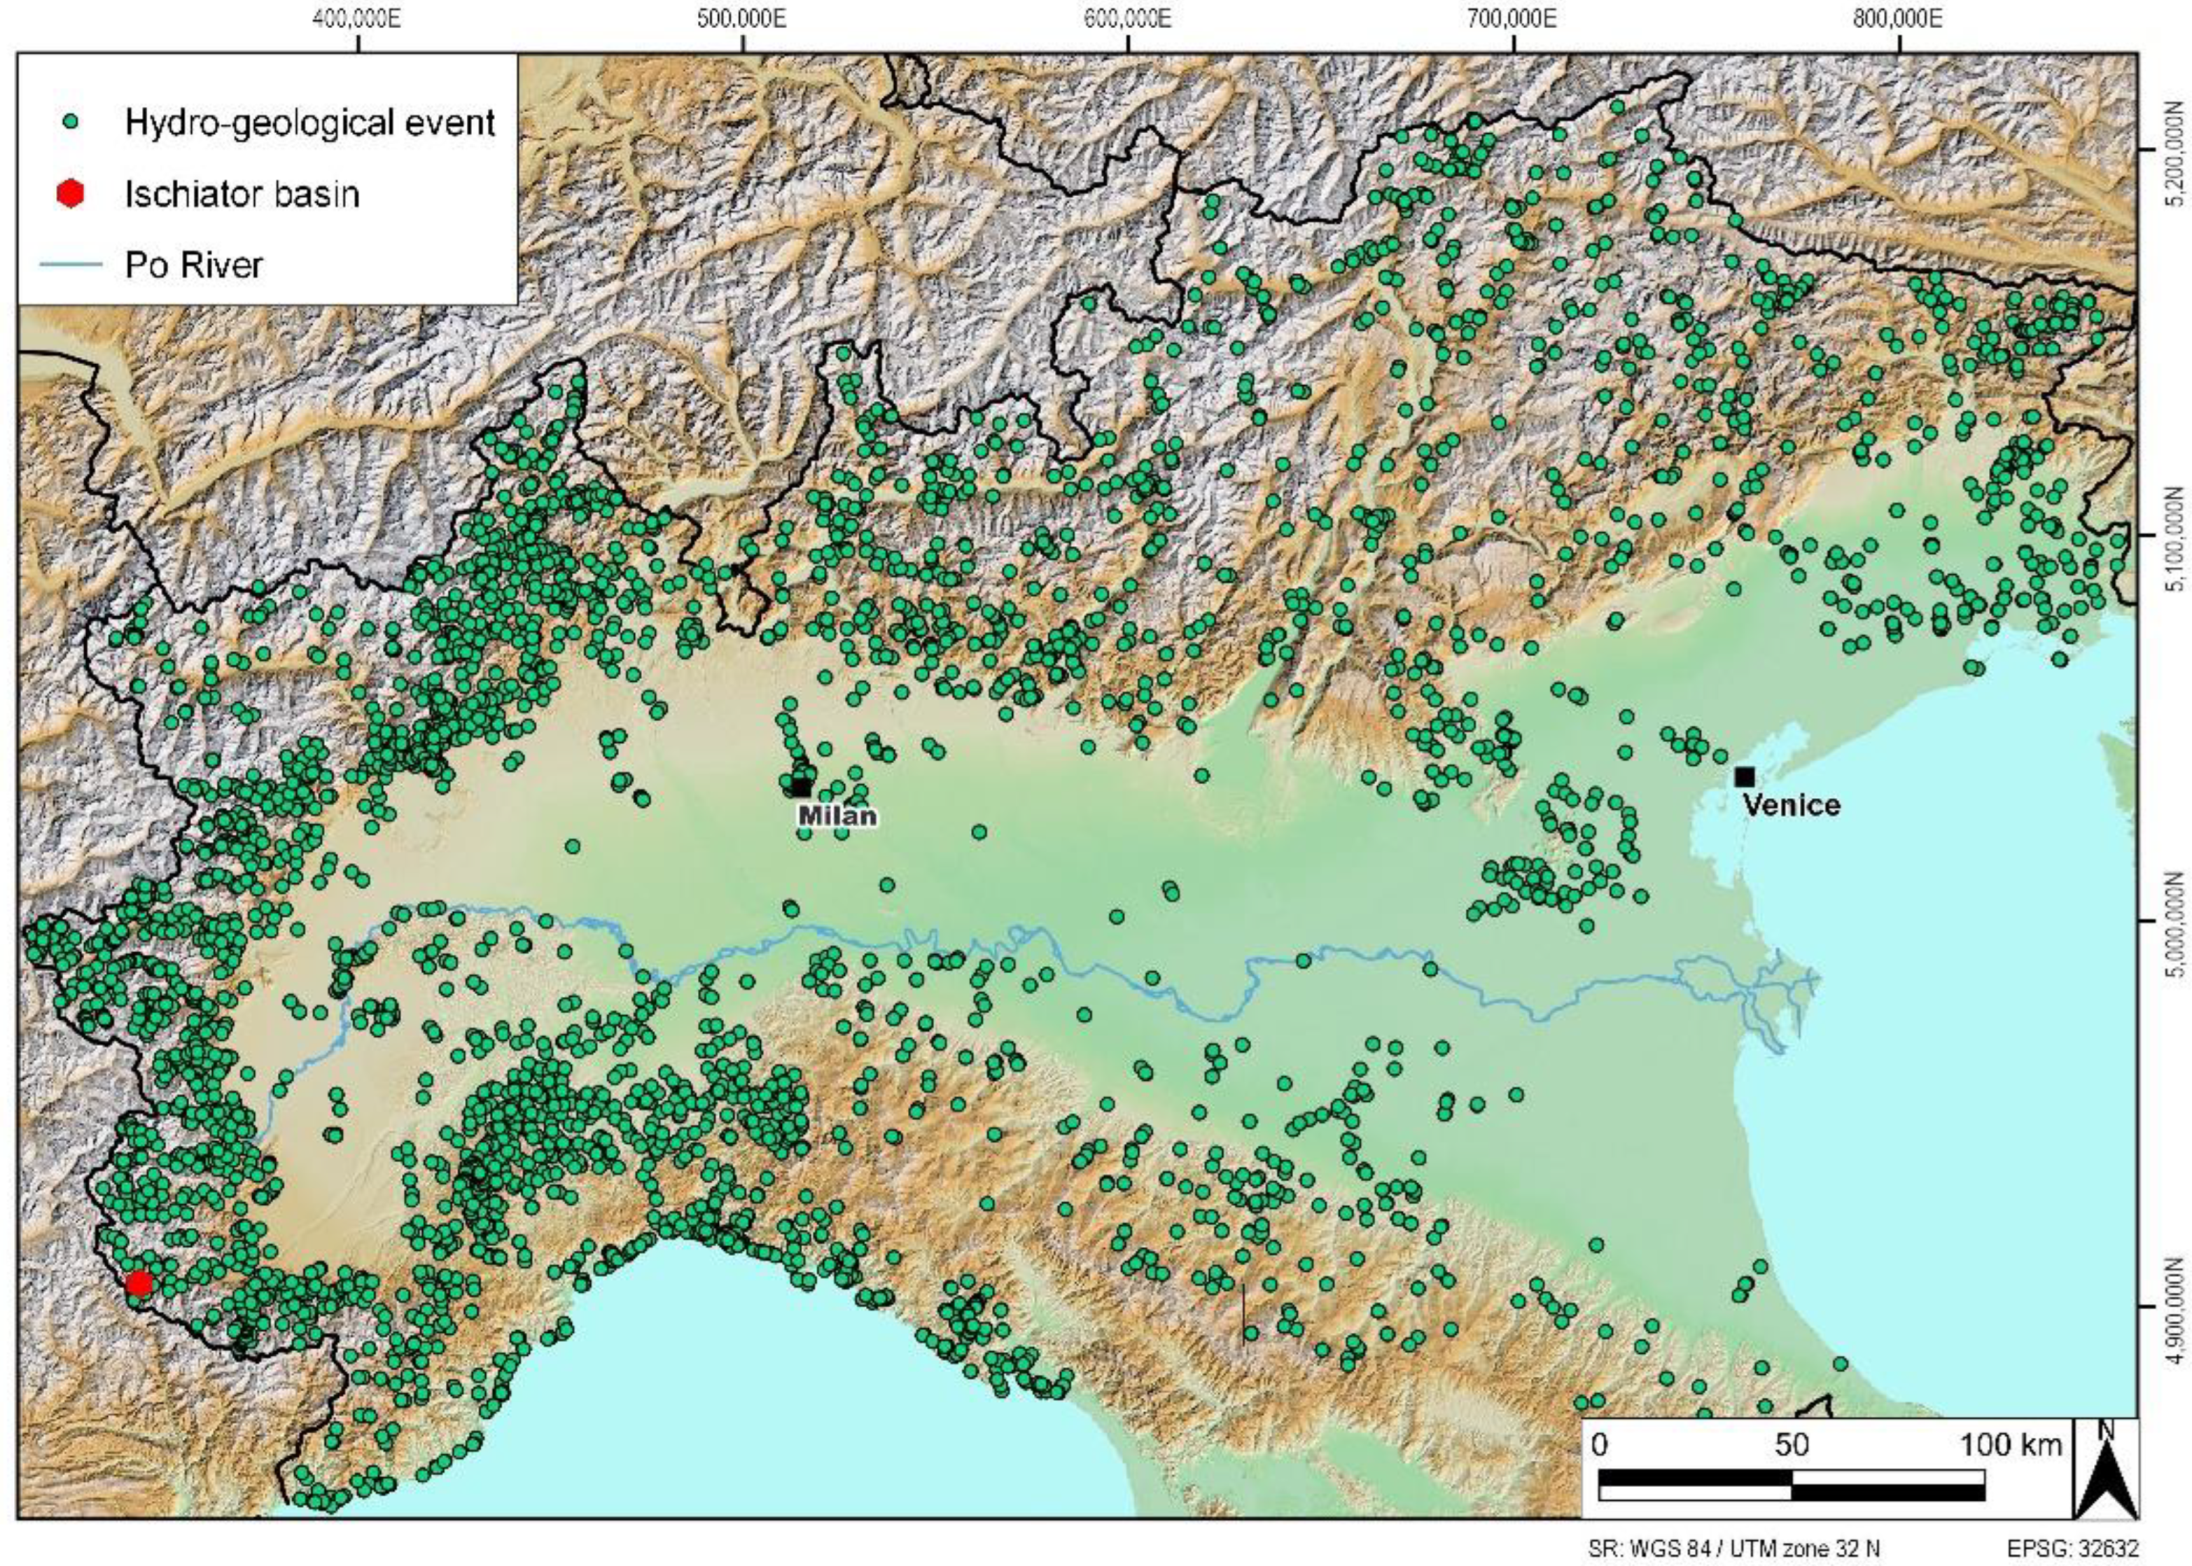
:1. Introduction
2. General Settings
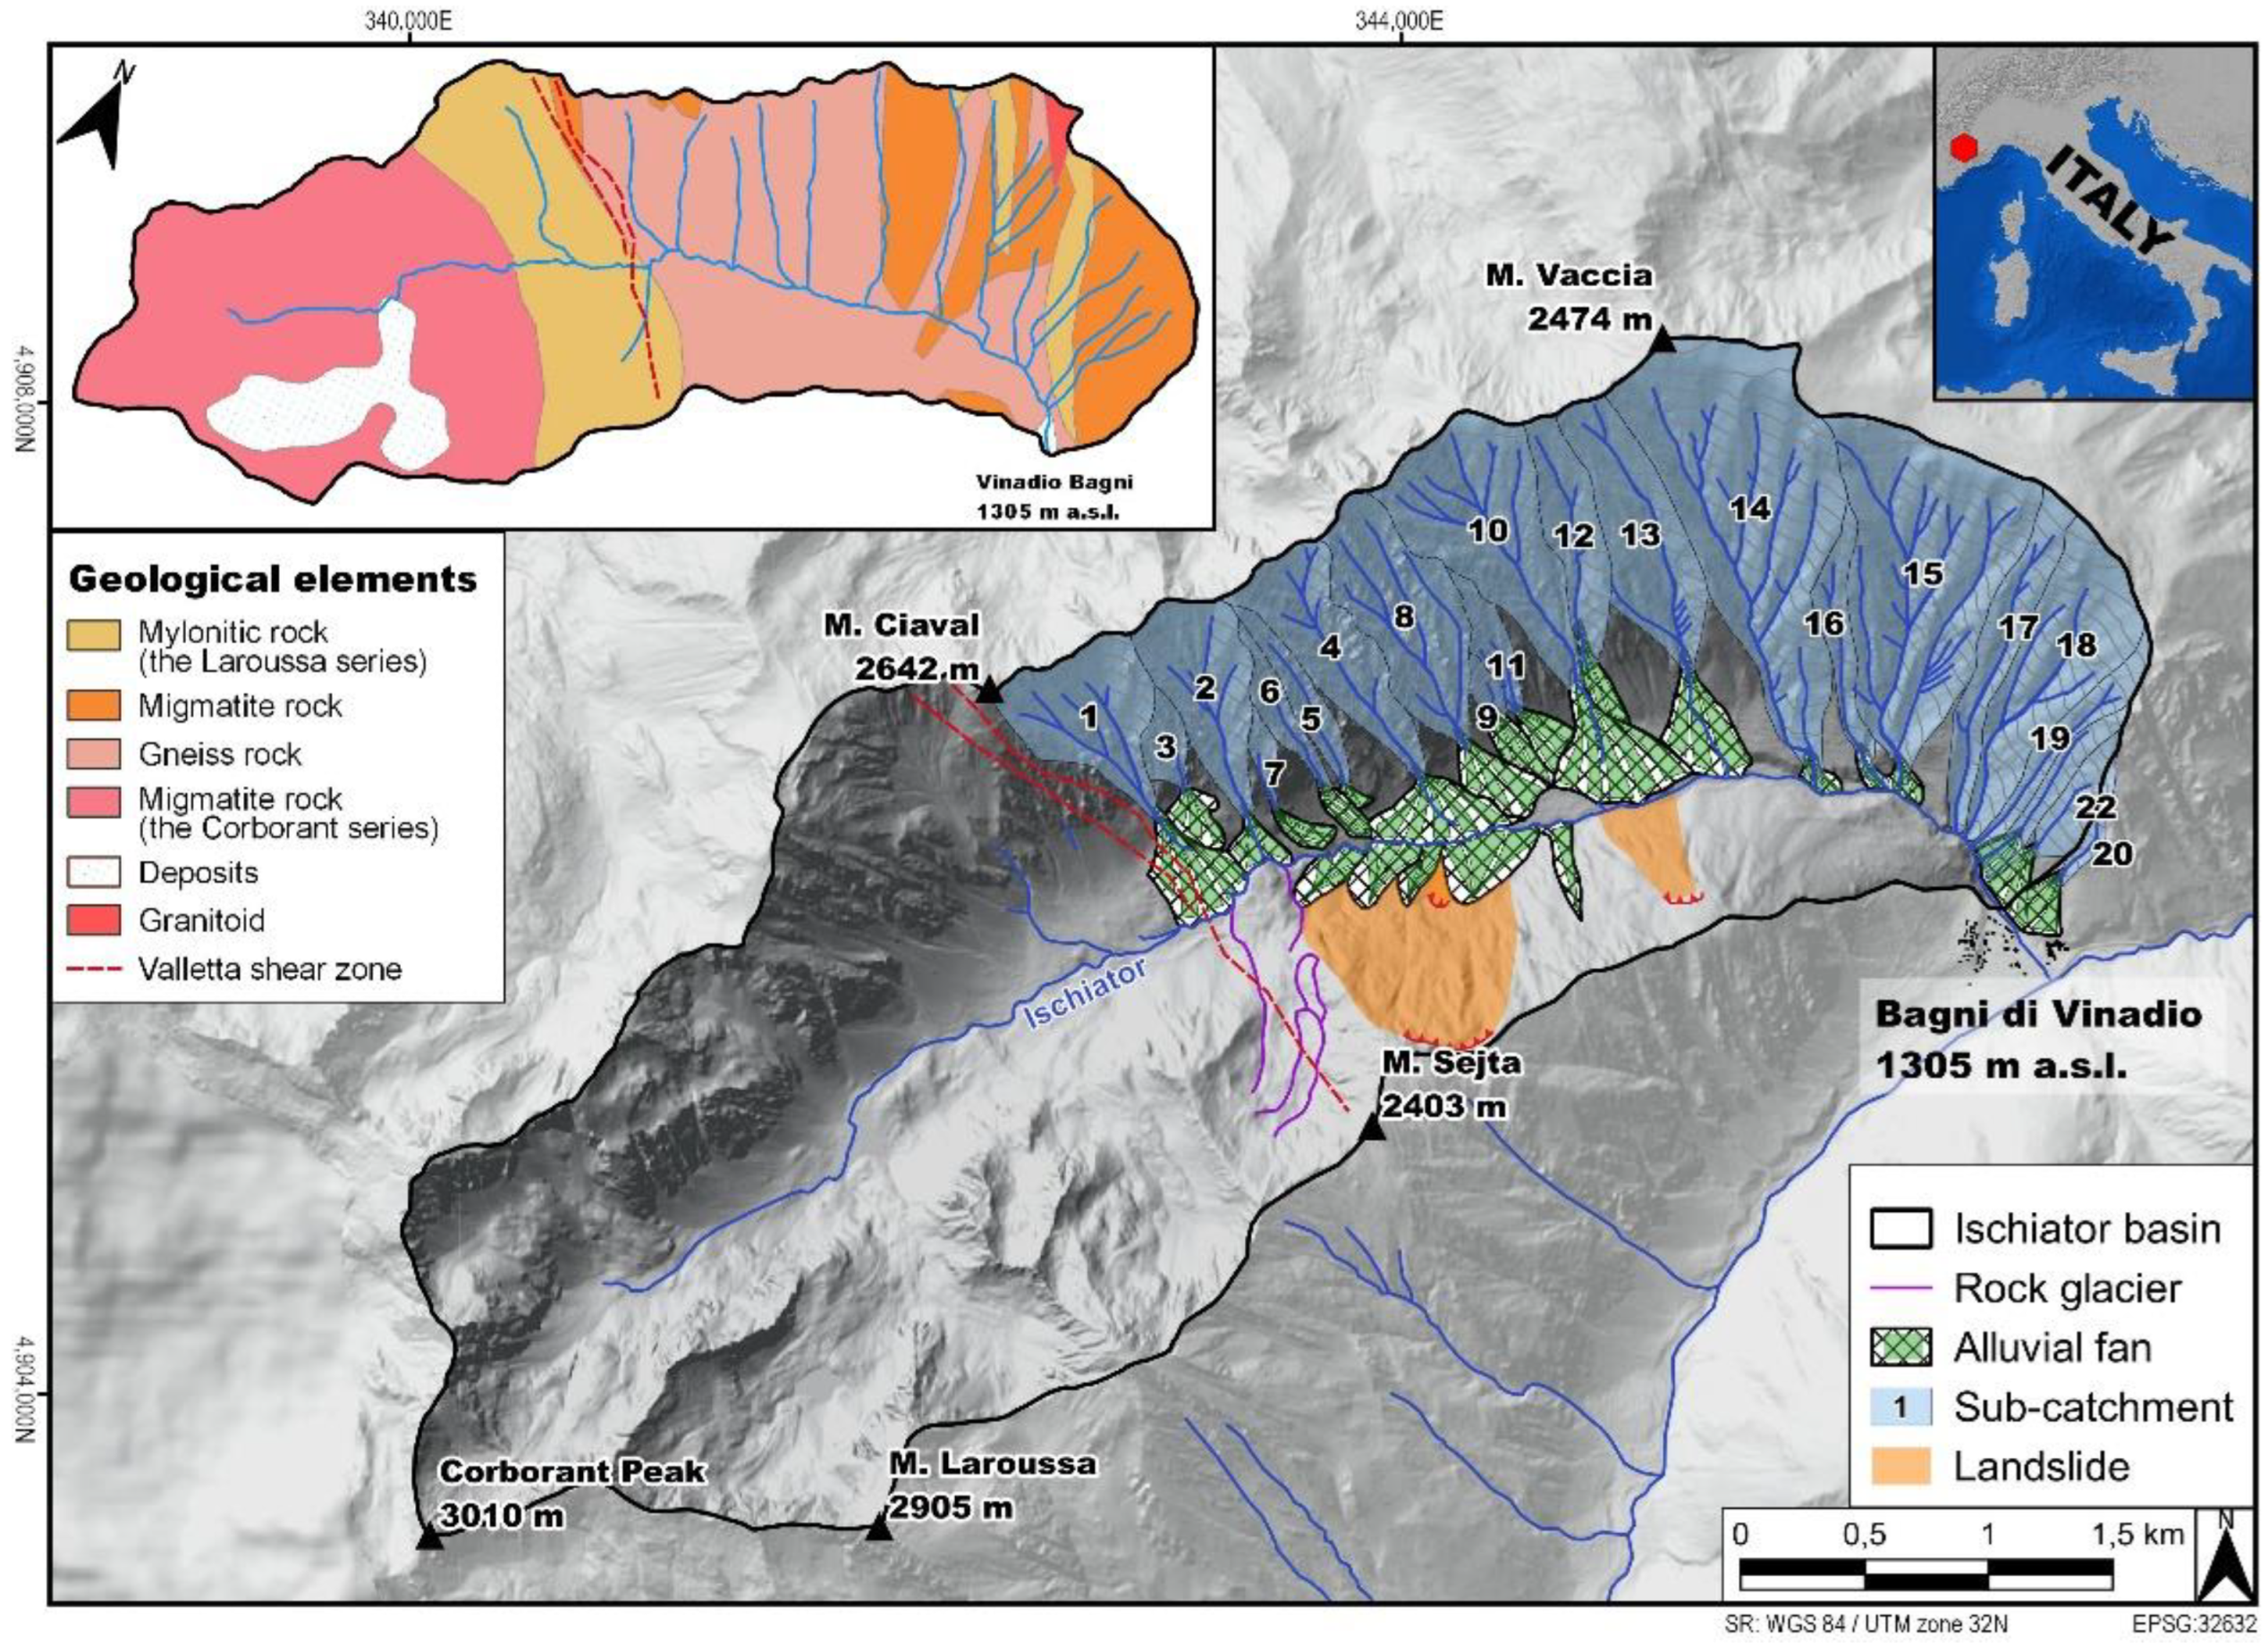
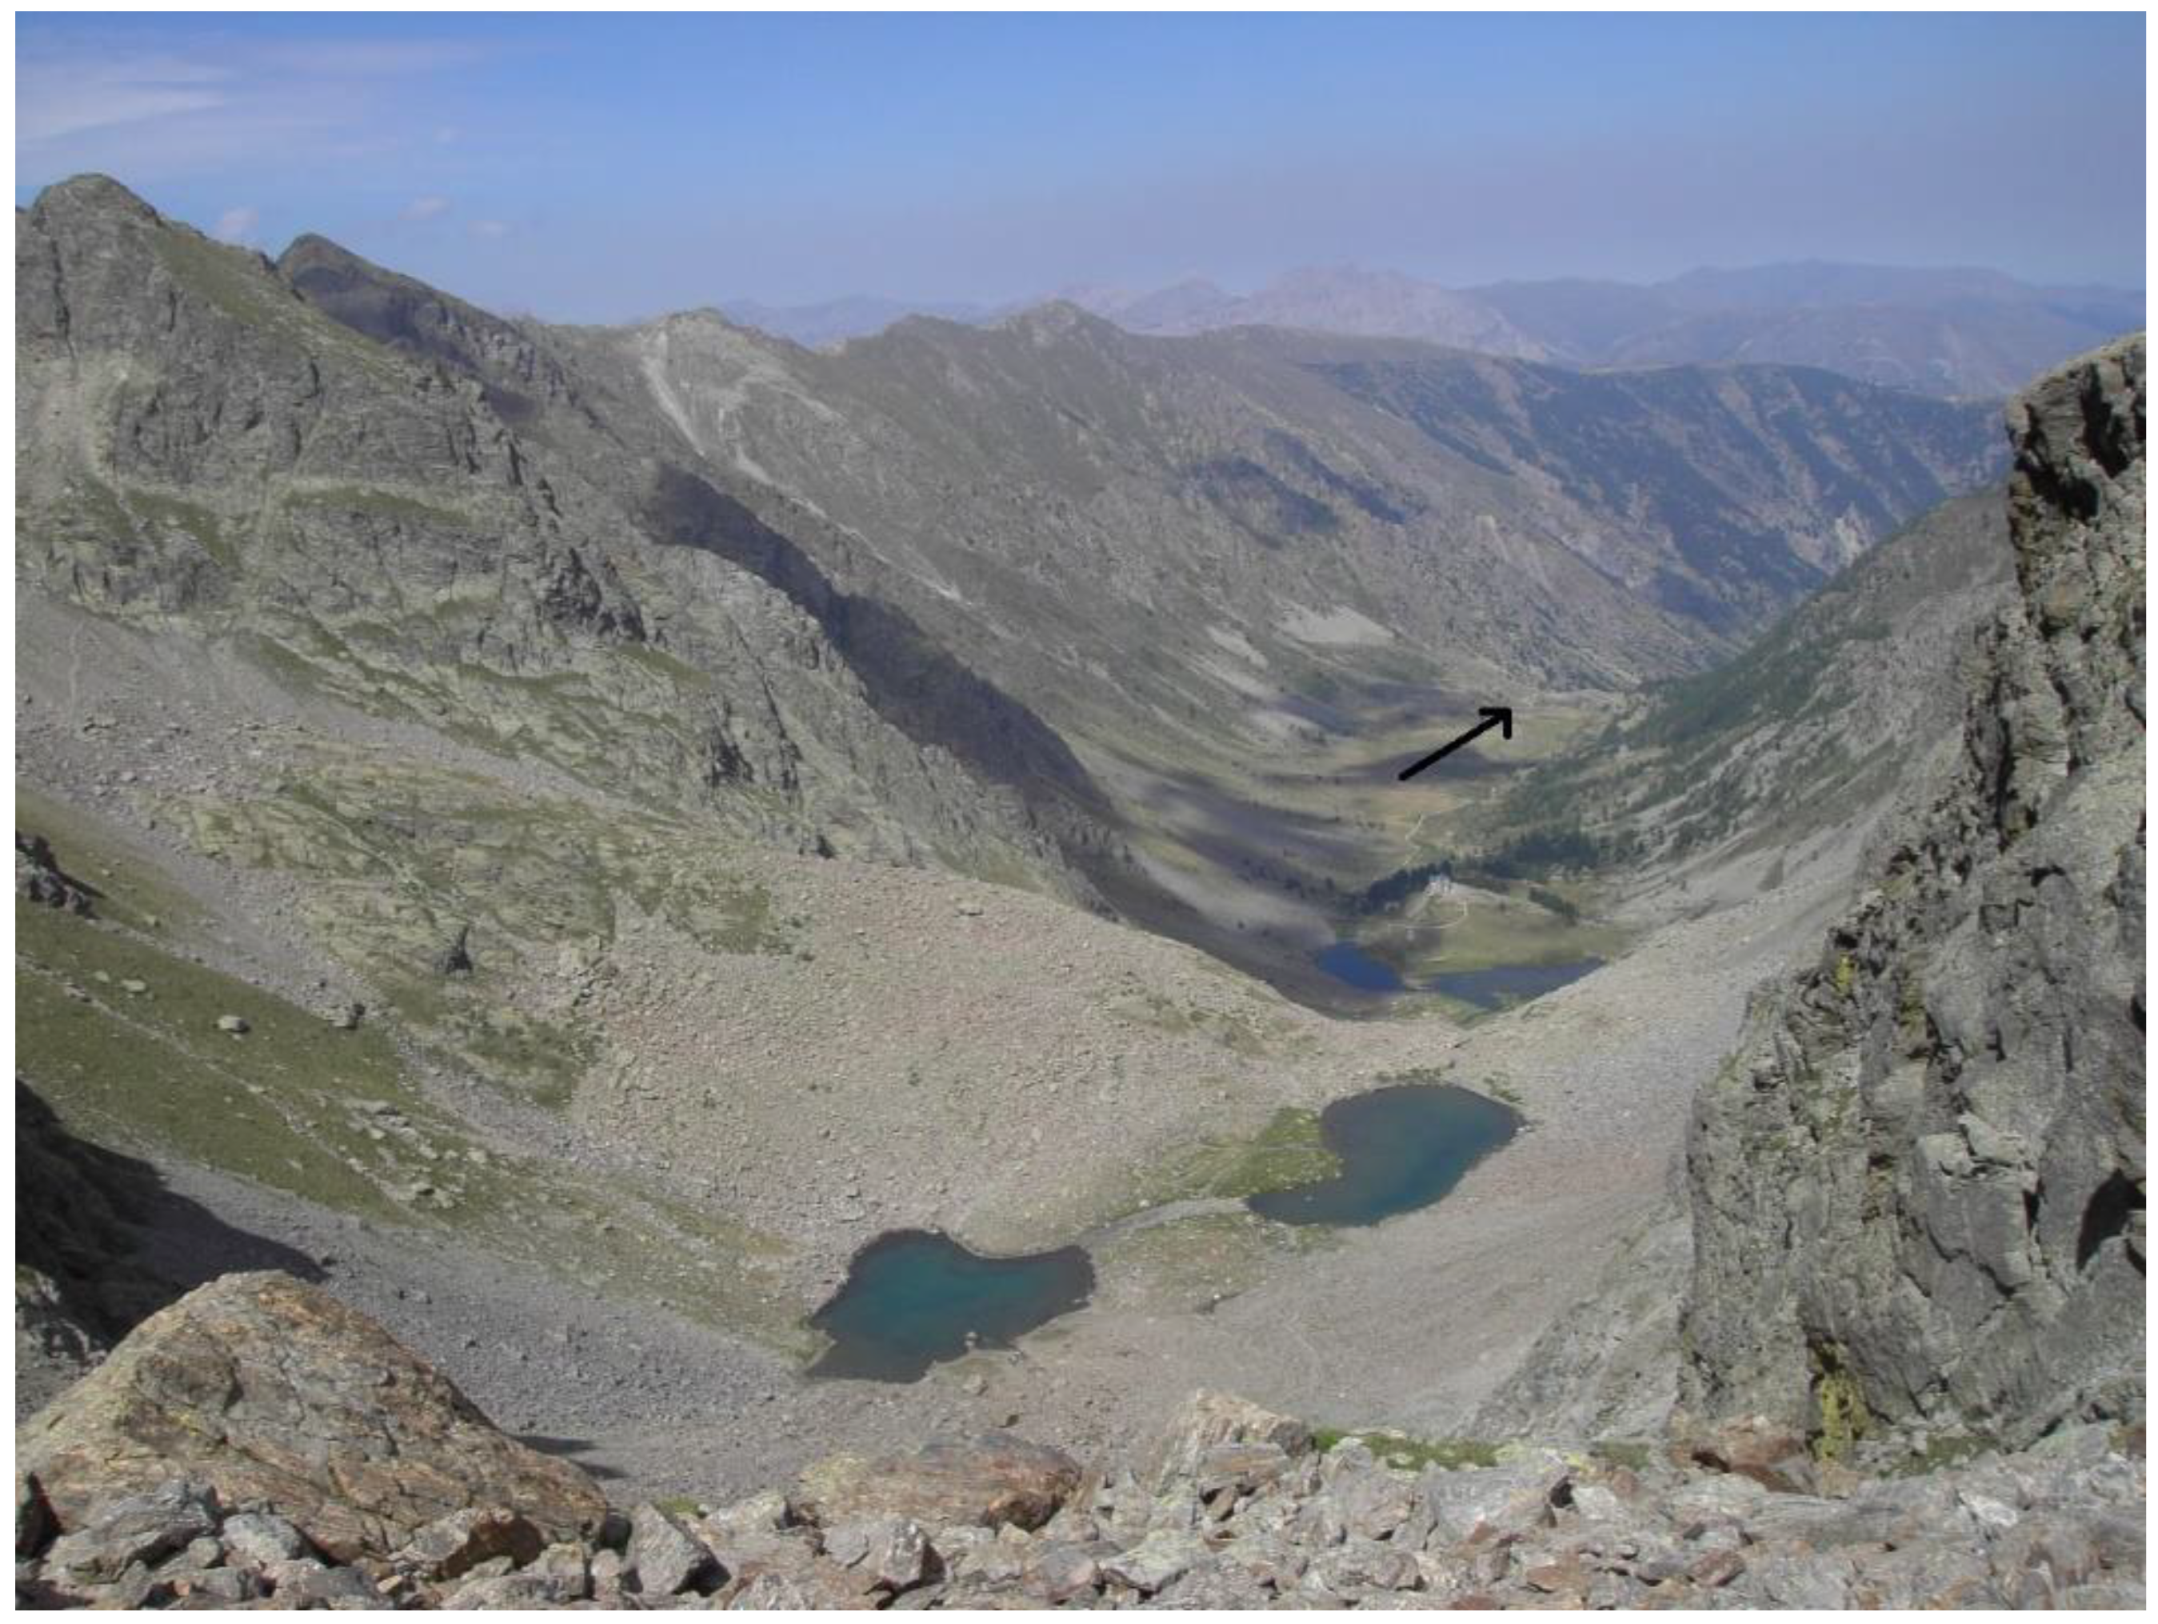
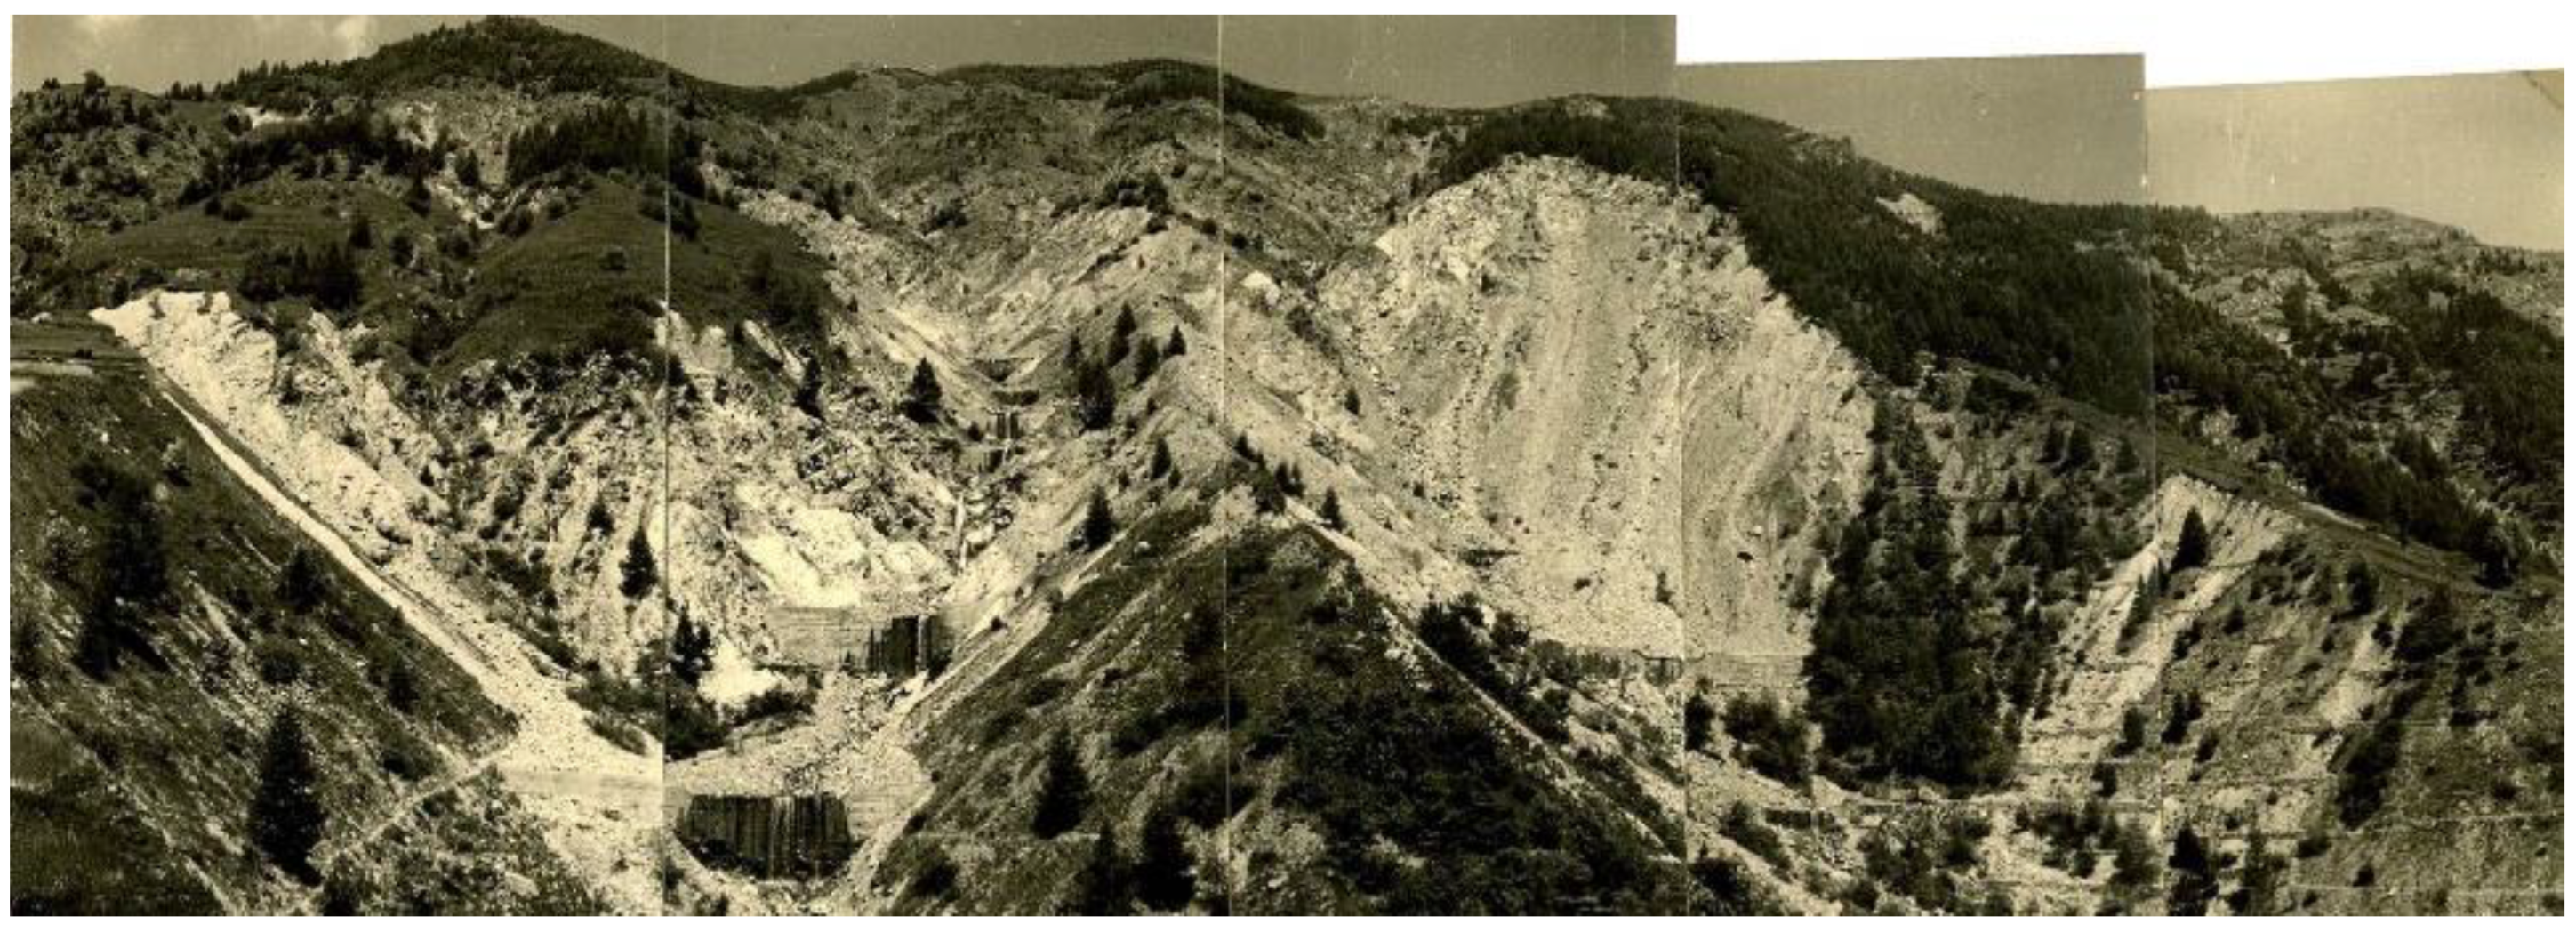
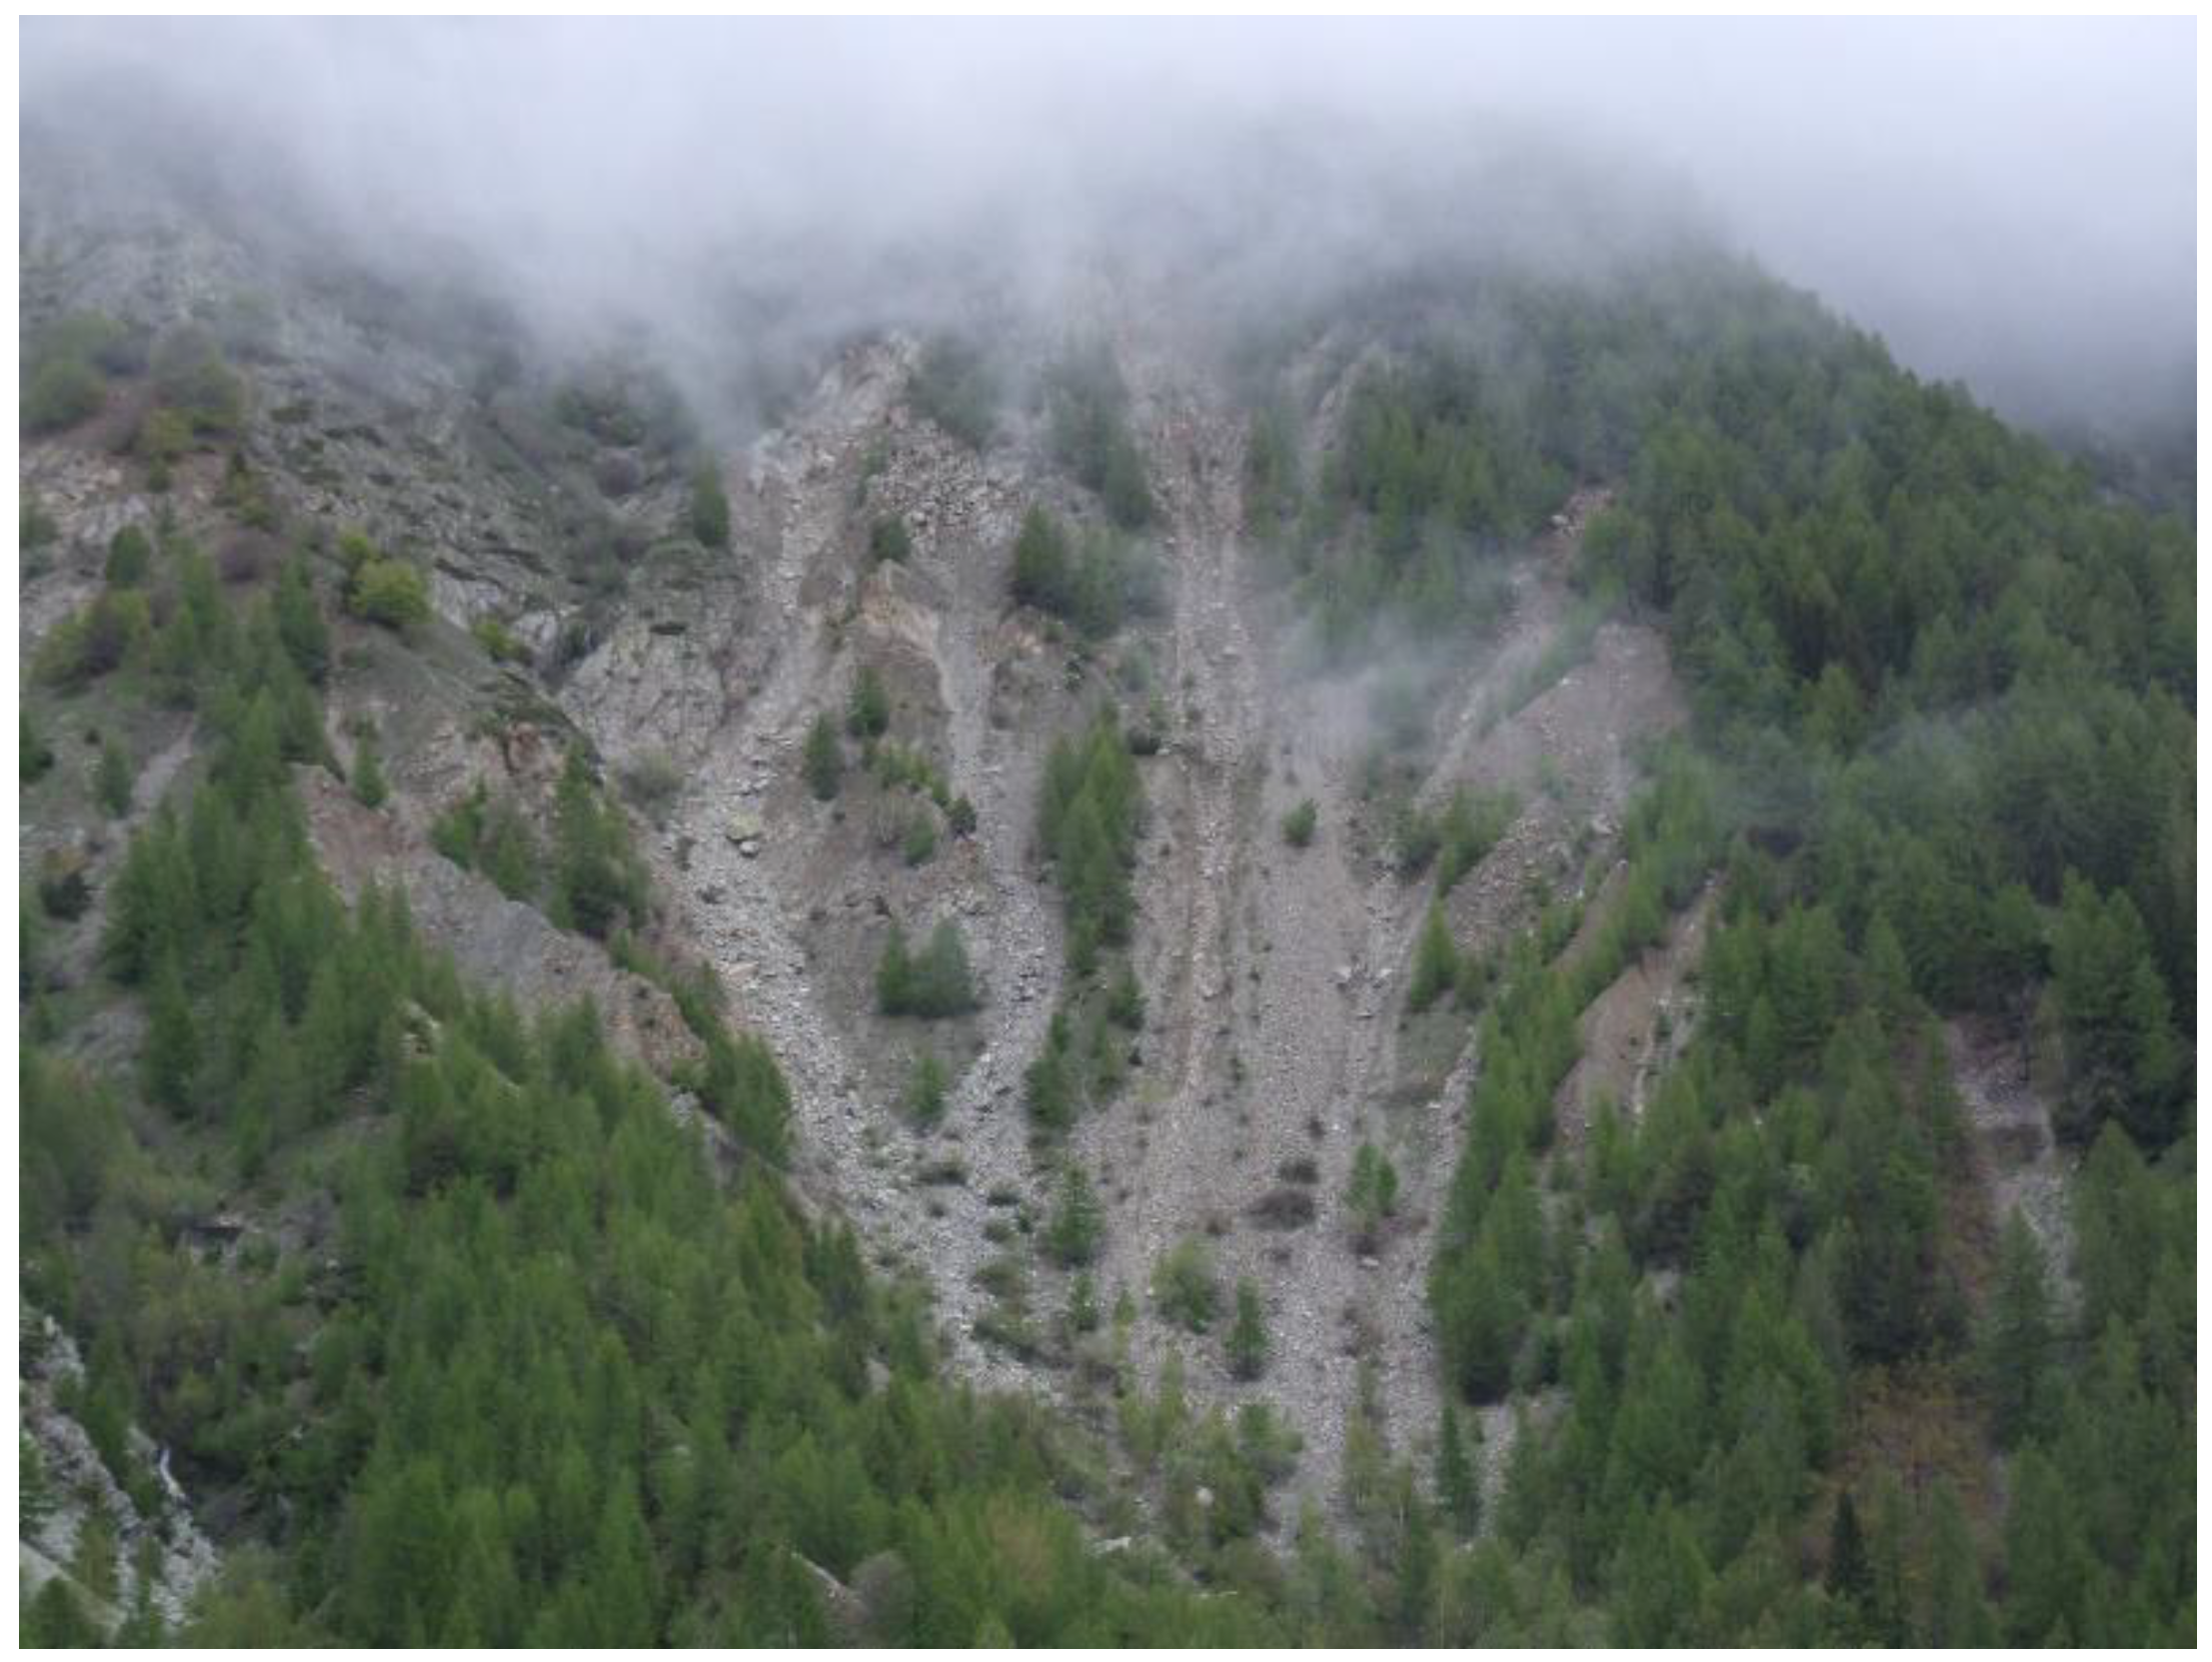
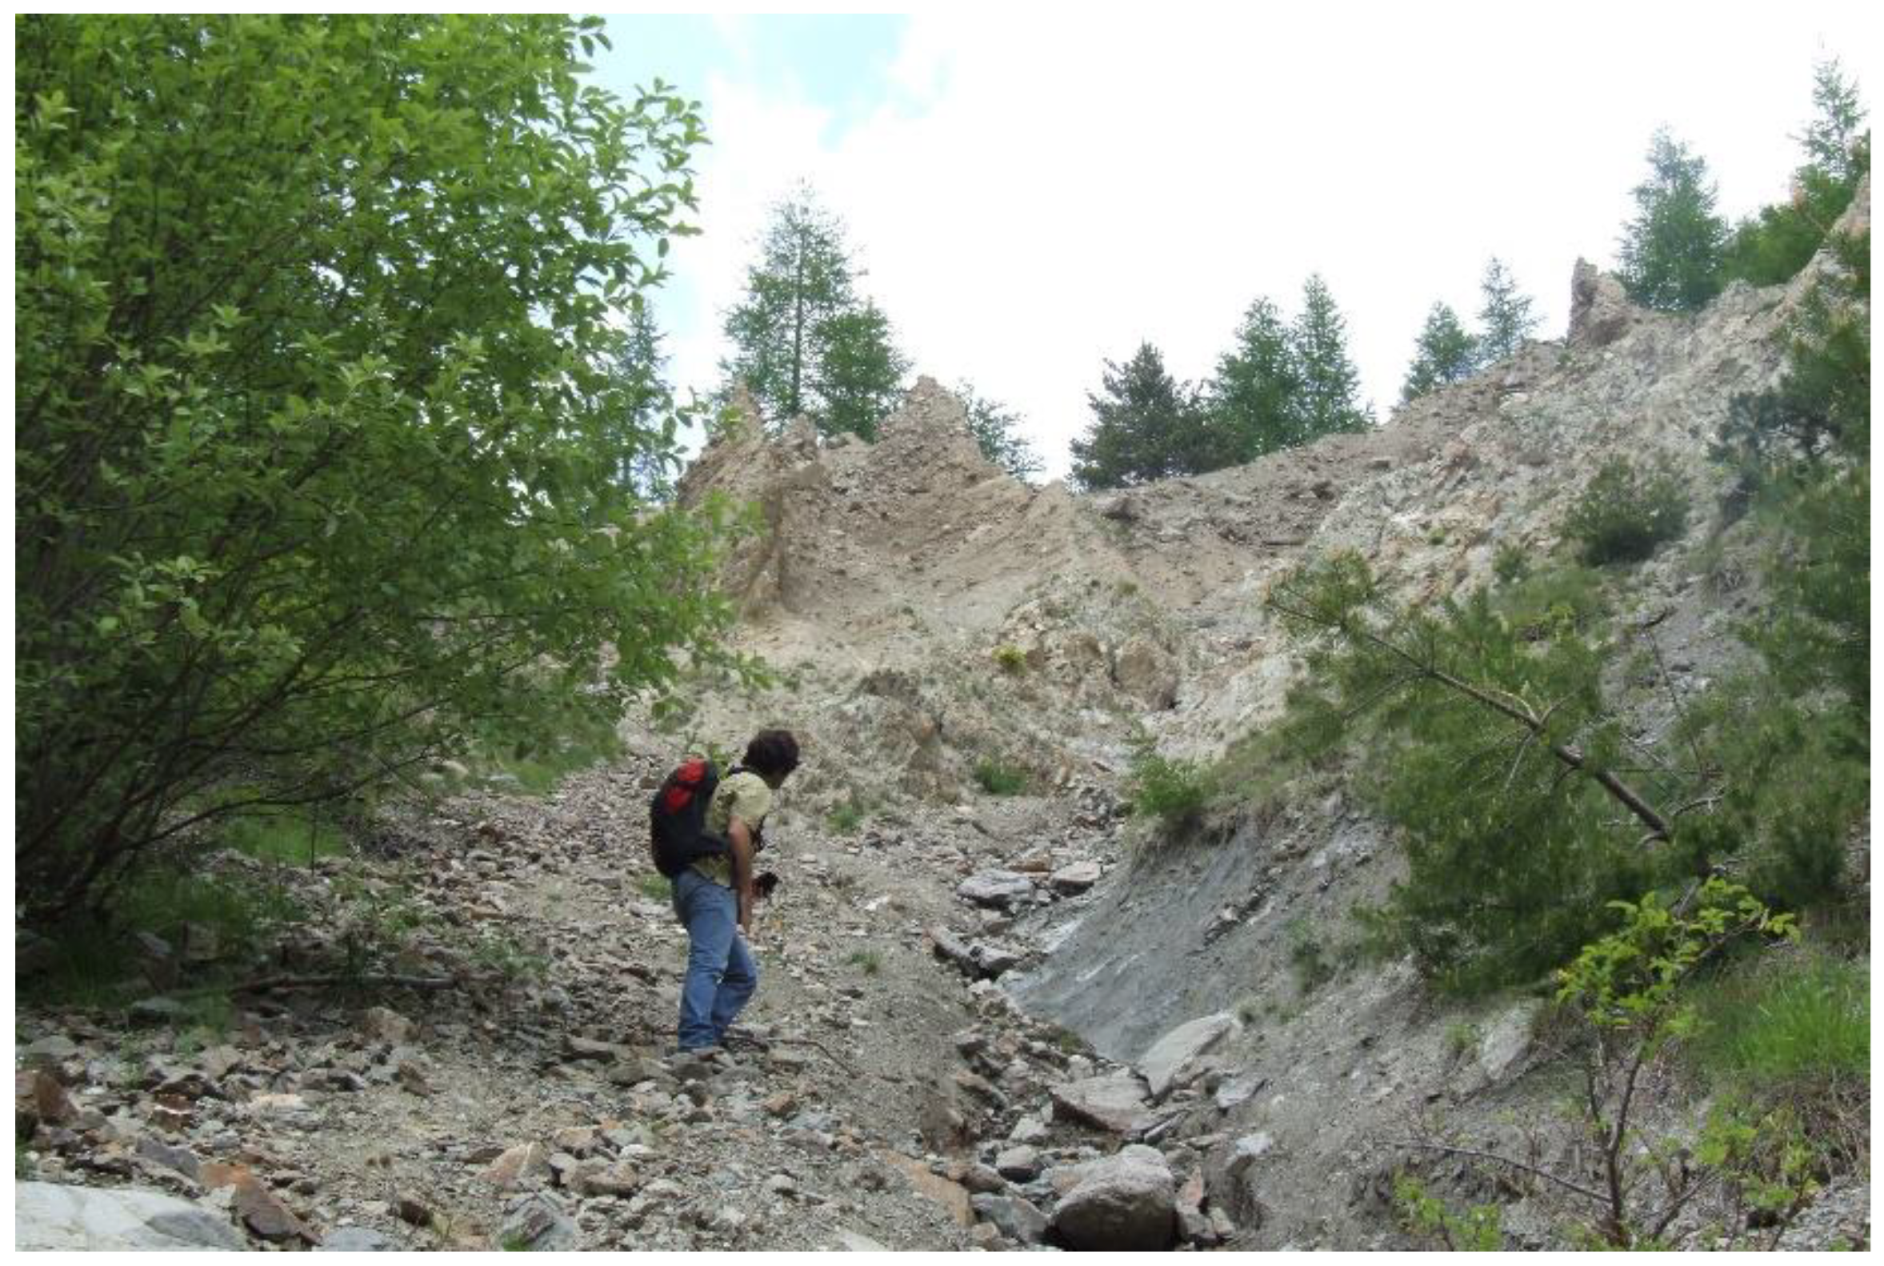
2.1. Geology and Geomorphology of the Ischiator Catchment
2.2. Hydro-Meteorological Hazards and Vulnerability in Case Studies
3. Materials and Methods
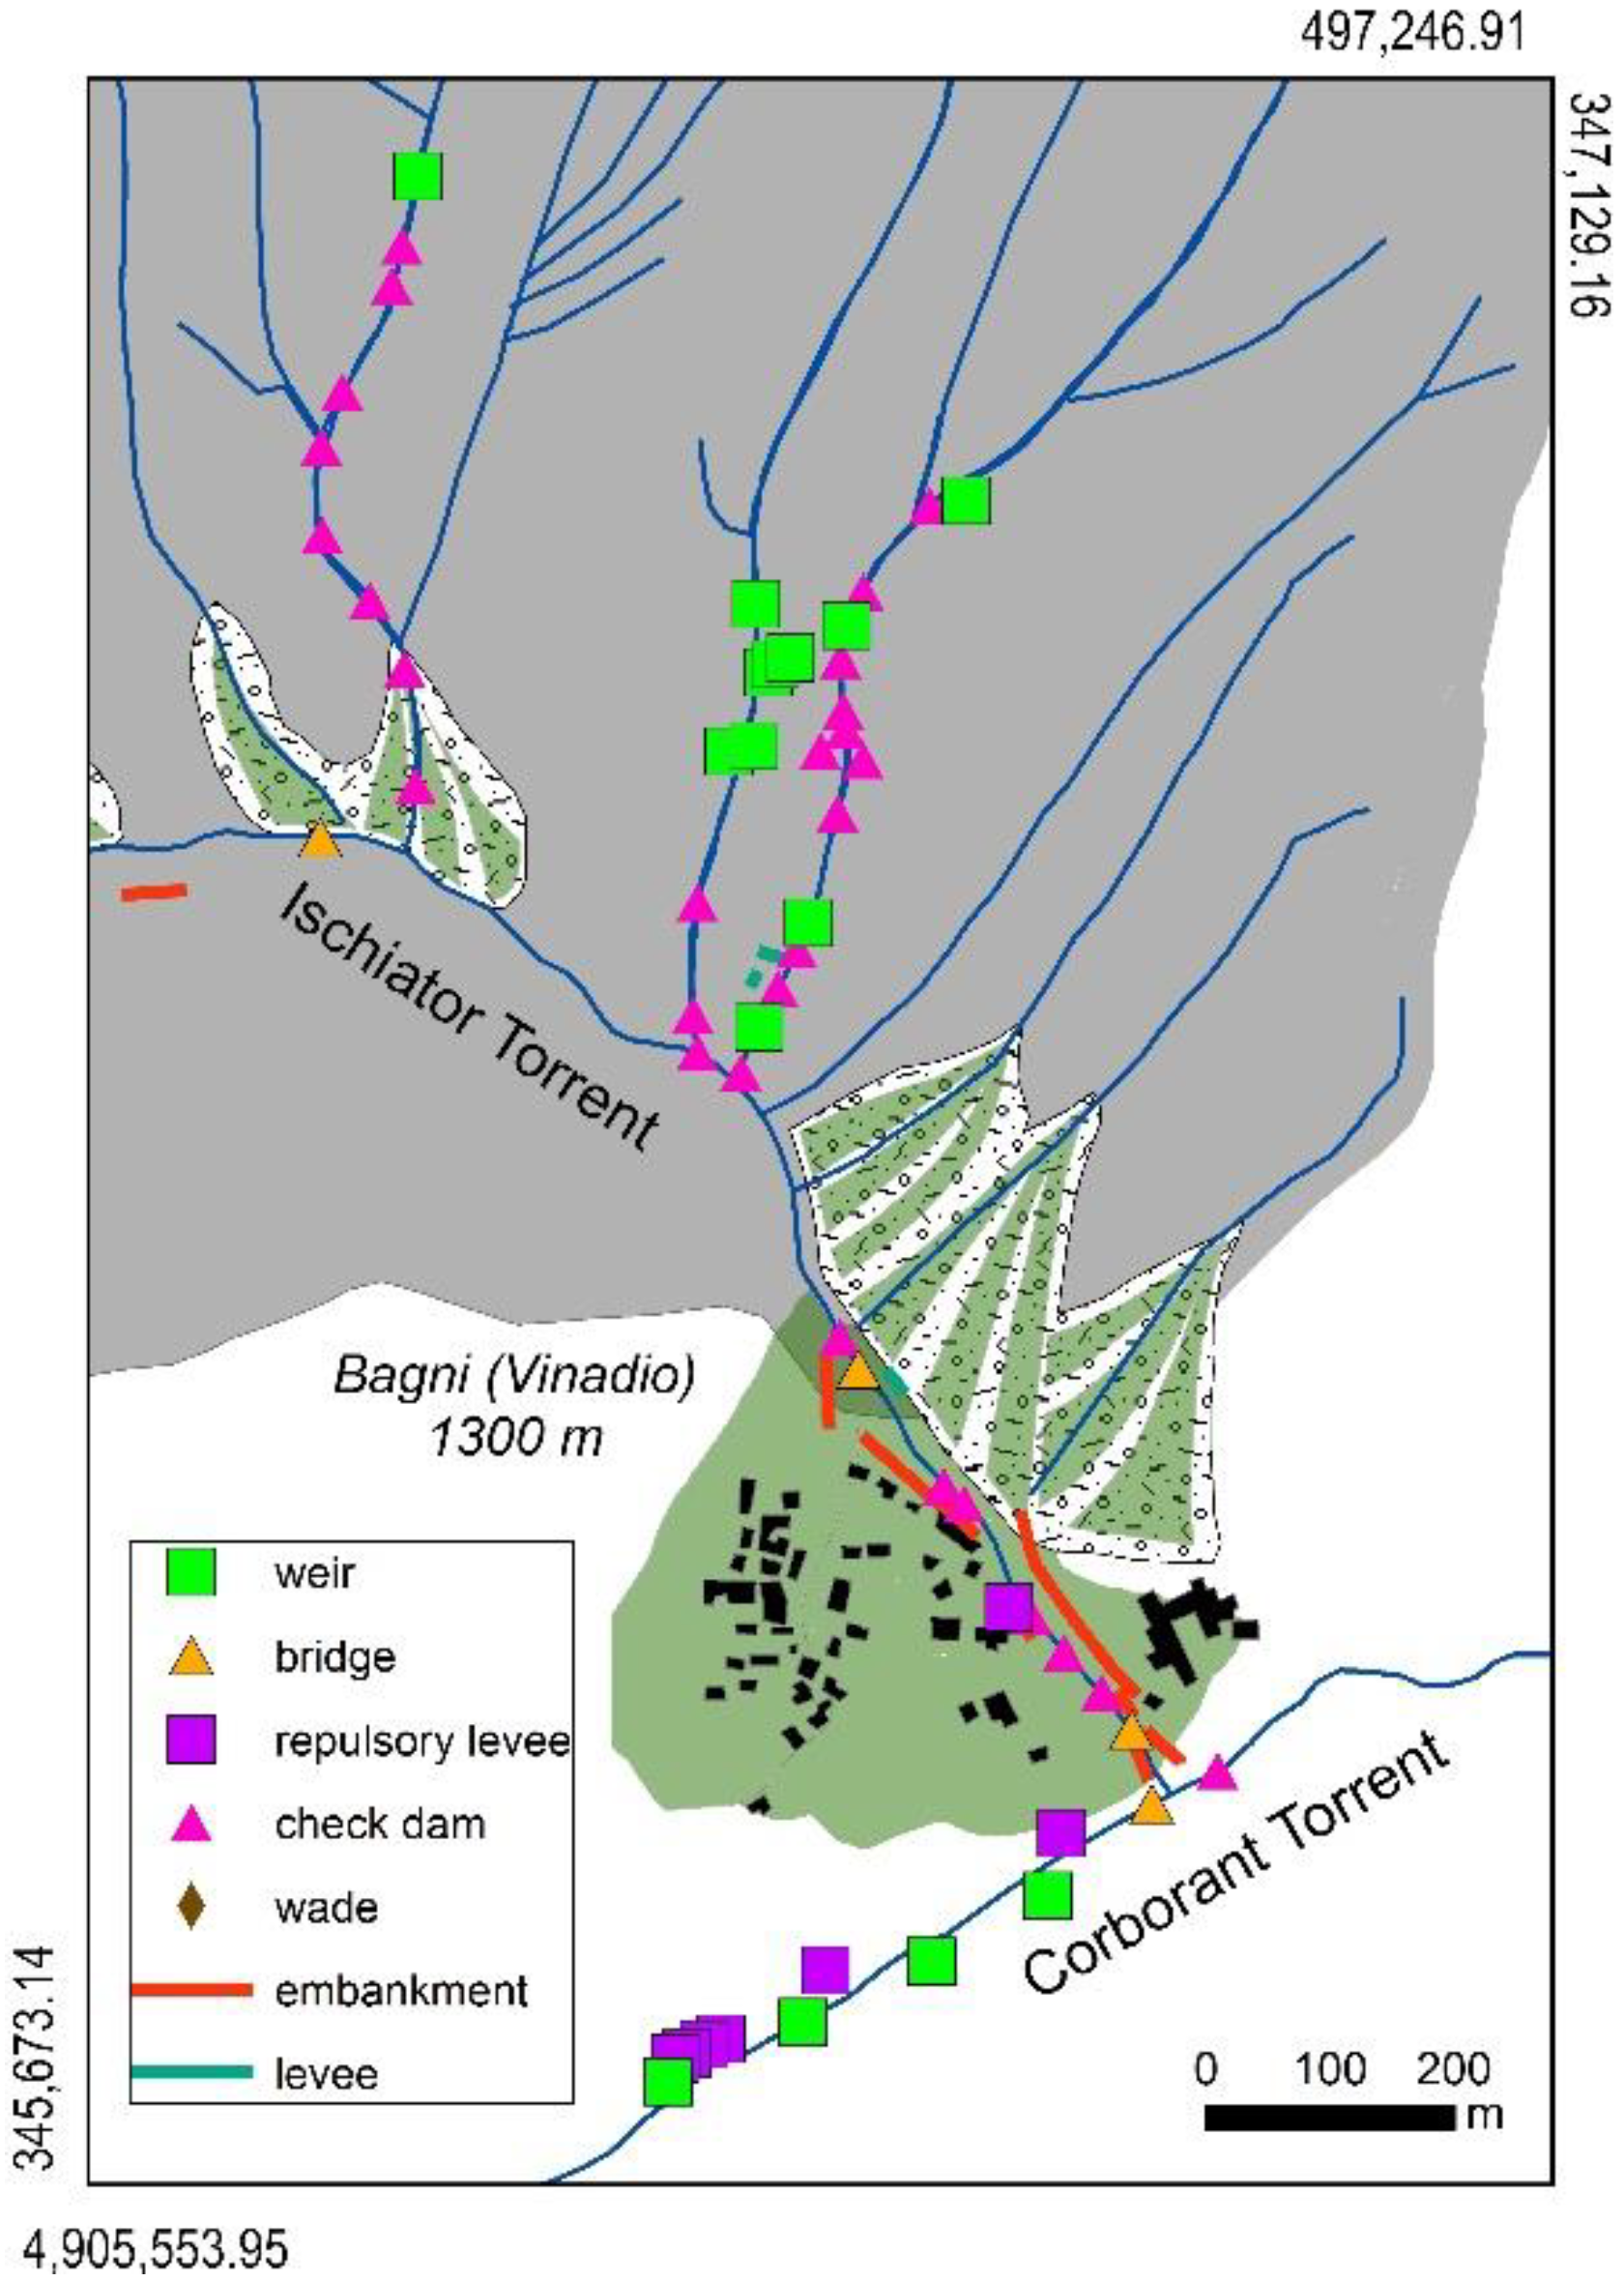
3.1. Census of Regulation and Protection Hydraulic Works
3.2. Method for Magnitude Debris-Flow Evaluation
- M: evaluation of magnitude of debris supply;
- AE: actual catchment area (m2) computed as A/cos (Iv);
- tgs: average slope gradient (Iv) [%];
- r: proportionality coefficient (between 0 and 1), that is the ratio between surface extent of the loose materials directly liable to be carried downstream and actual catchment area;
- h: average thickness (m) of the debris package which could be delivered into the stream network;
- n: adimensional coefficient comprised between 0 and 10, expressing the potential debris availability in case of an exceptional event (e.g., slope failure)/actual catchment area. The closer the value of the coefficient “n” is to n. 10, the greater the level of instability in the basin, and consequently, the amount of material that can implement the debris mixture.
- f: frequency factor, expressing the number of events occurring in a standard time lapse equal to 100 years.
3.3. Hazard Map
4. Results
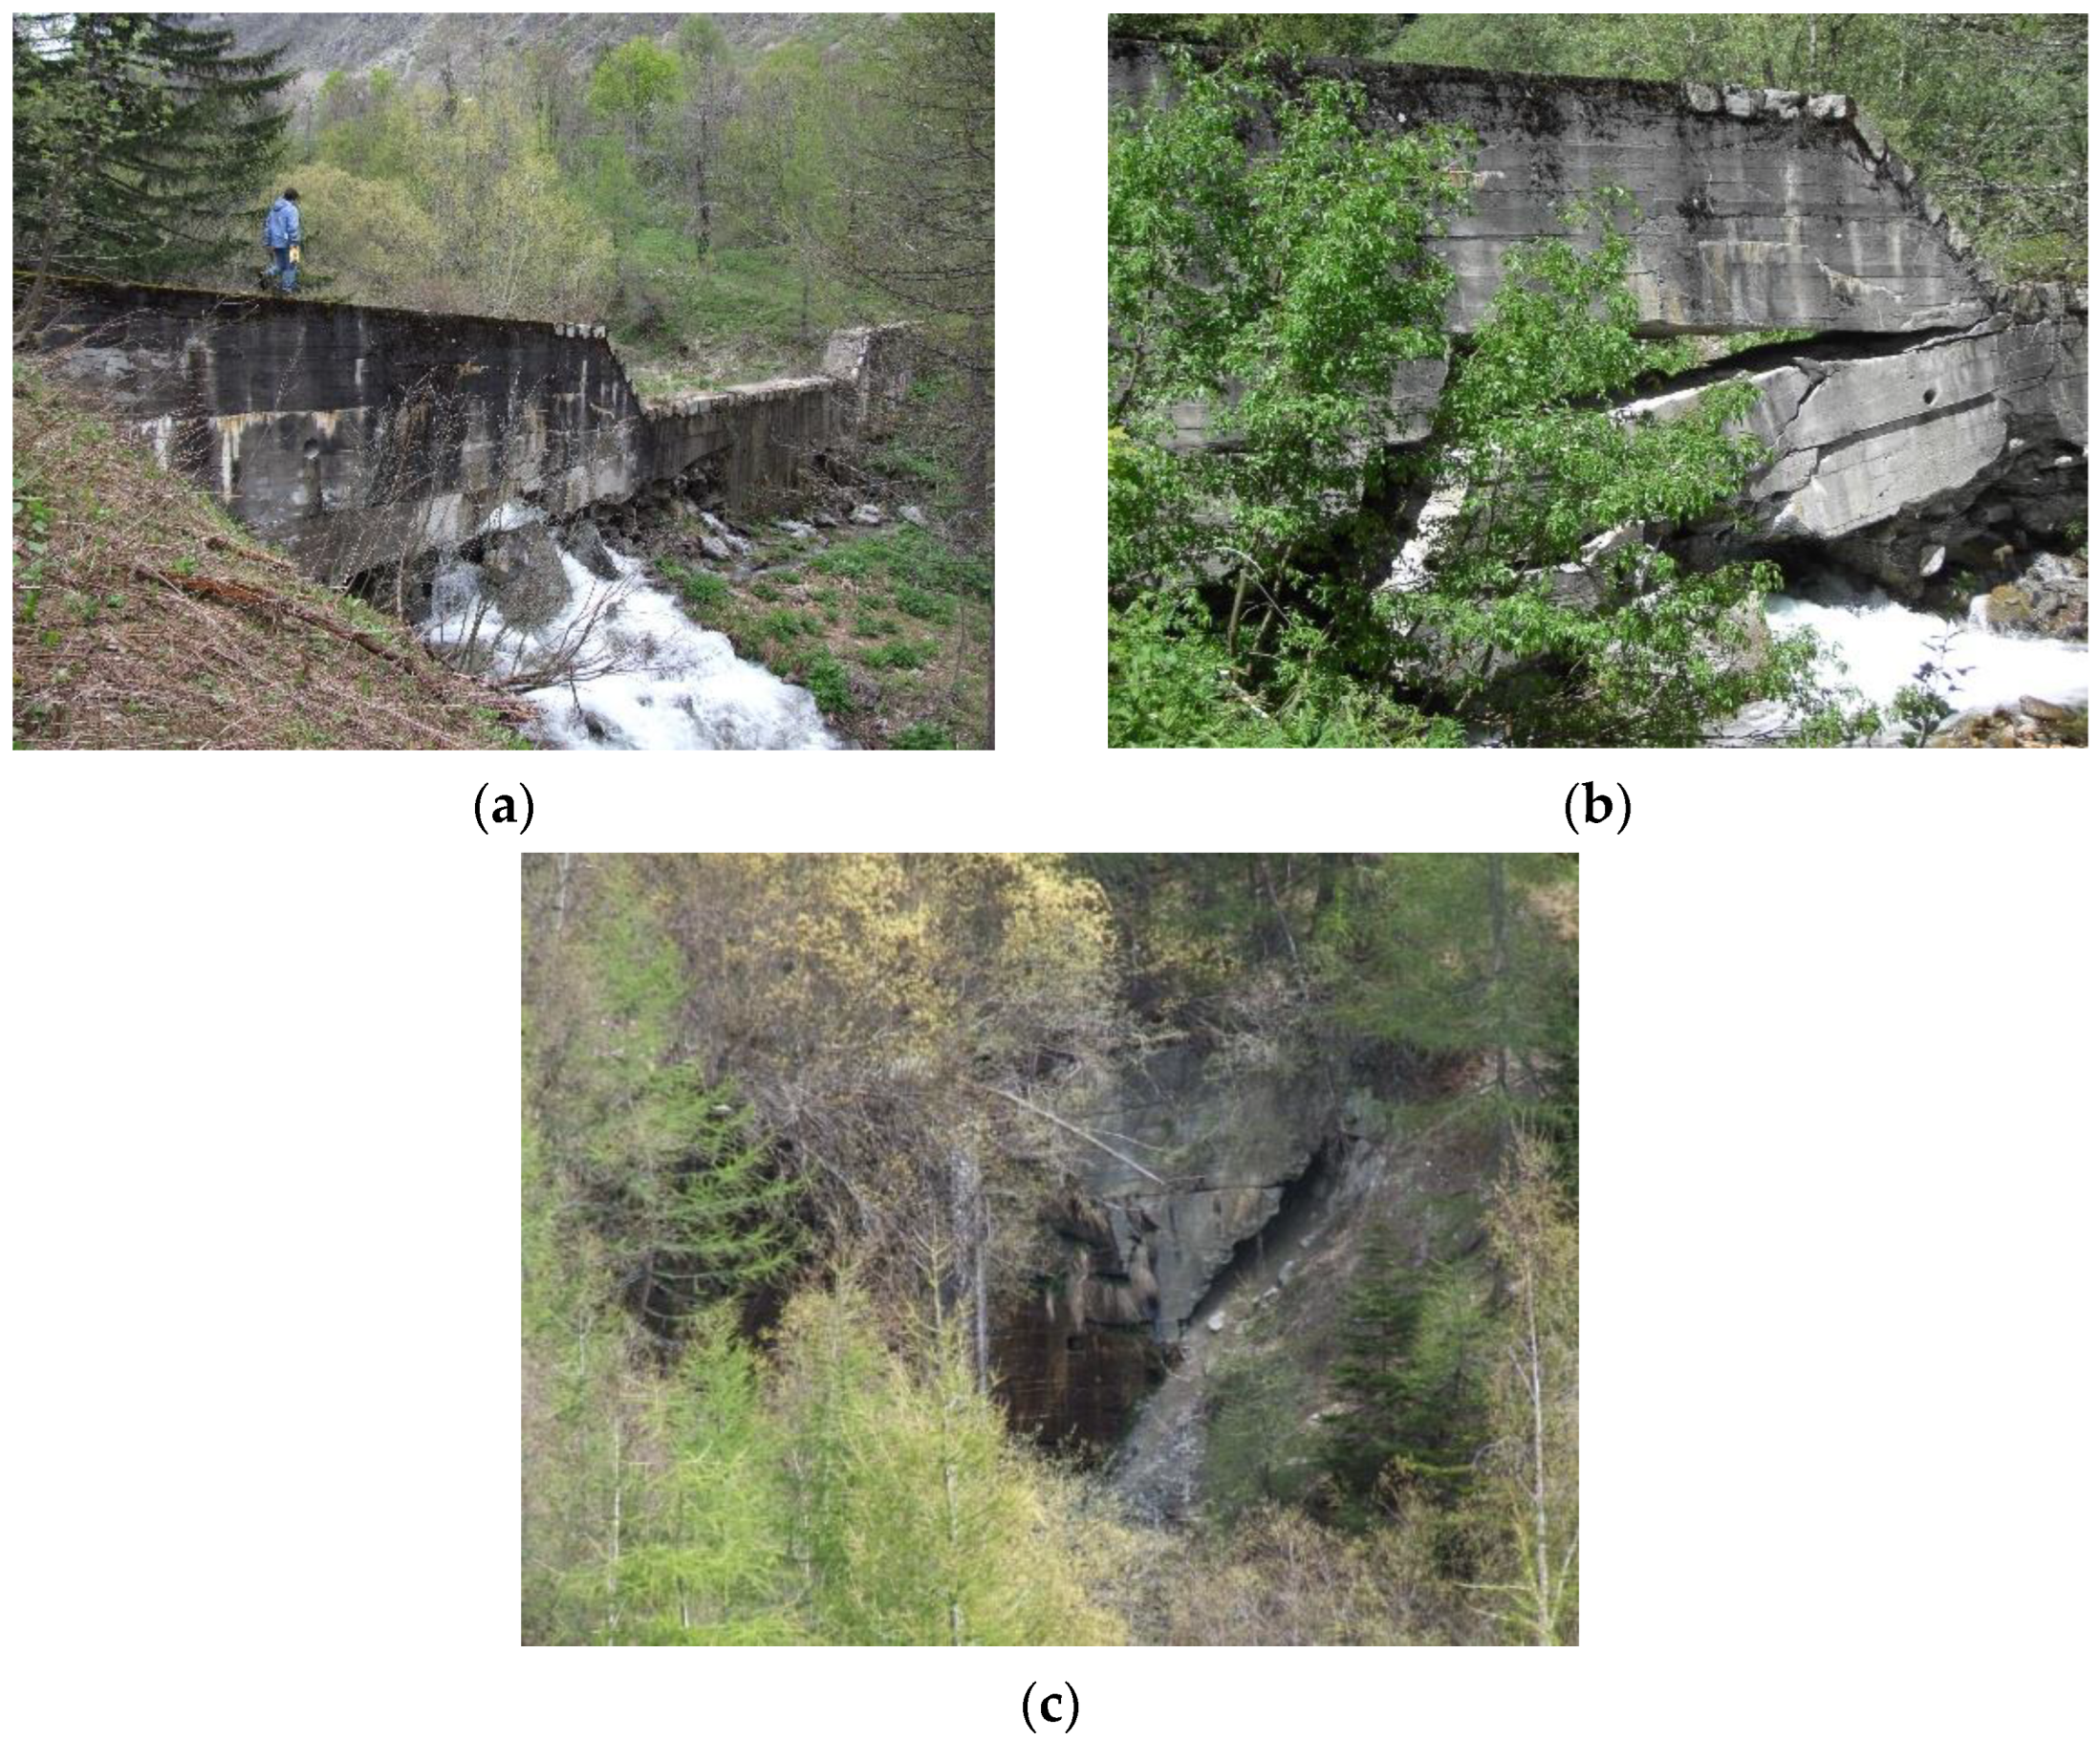
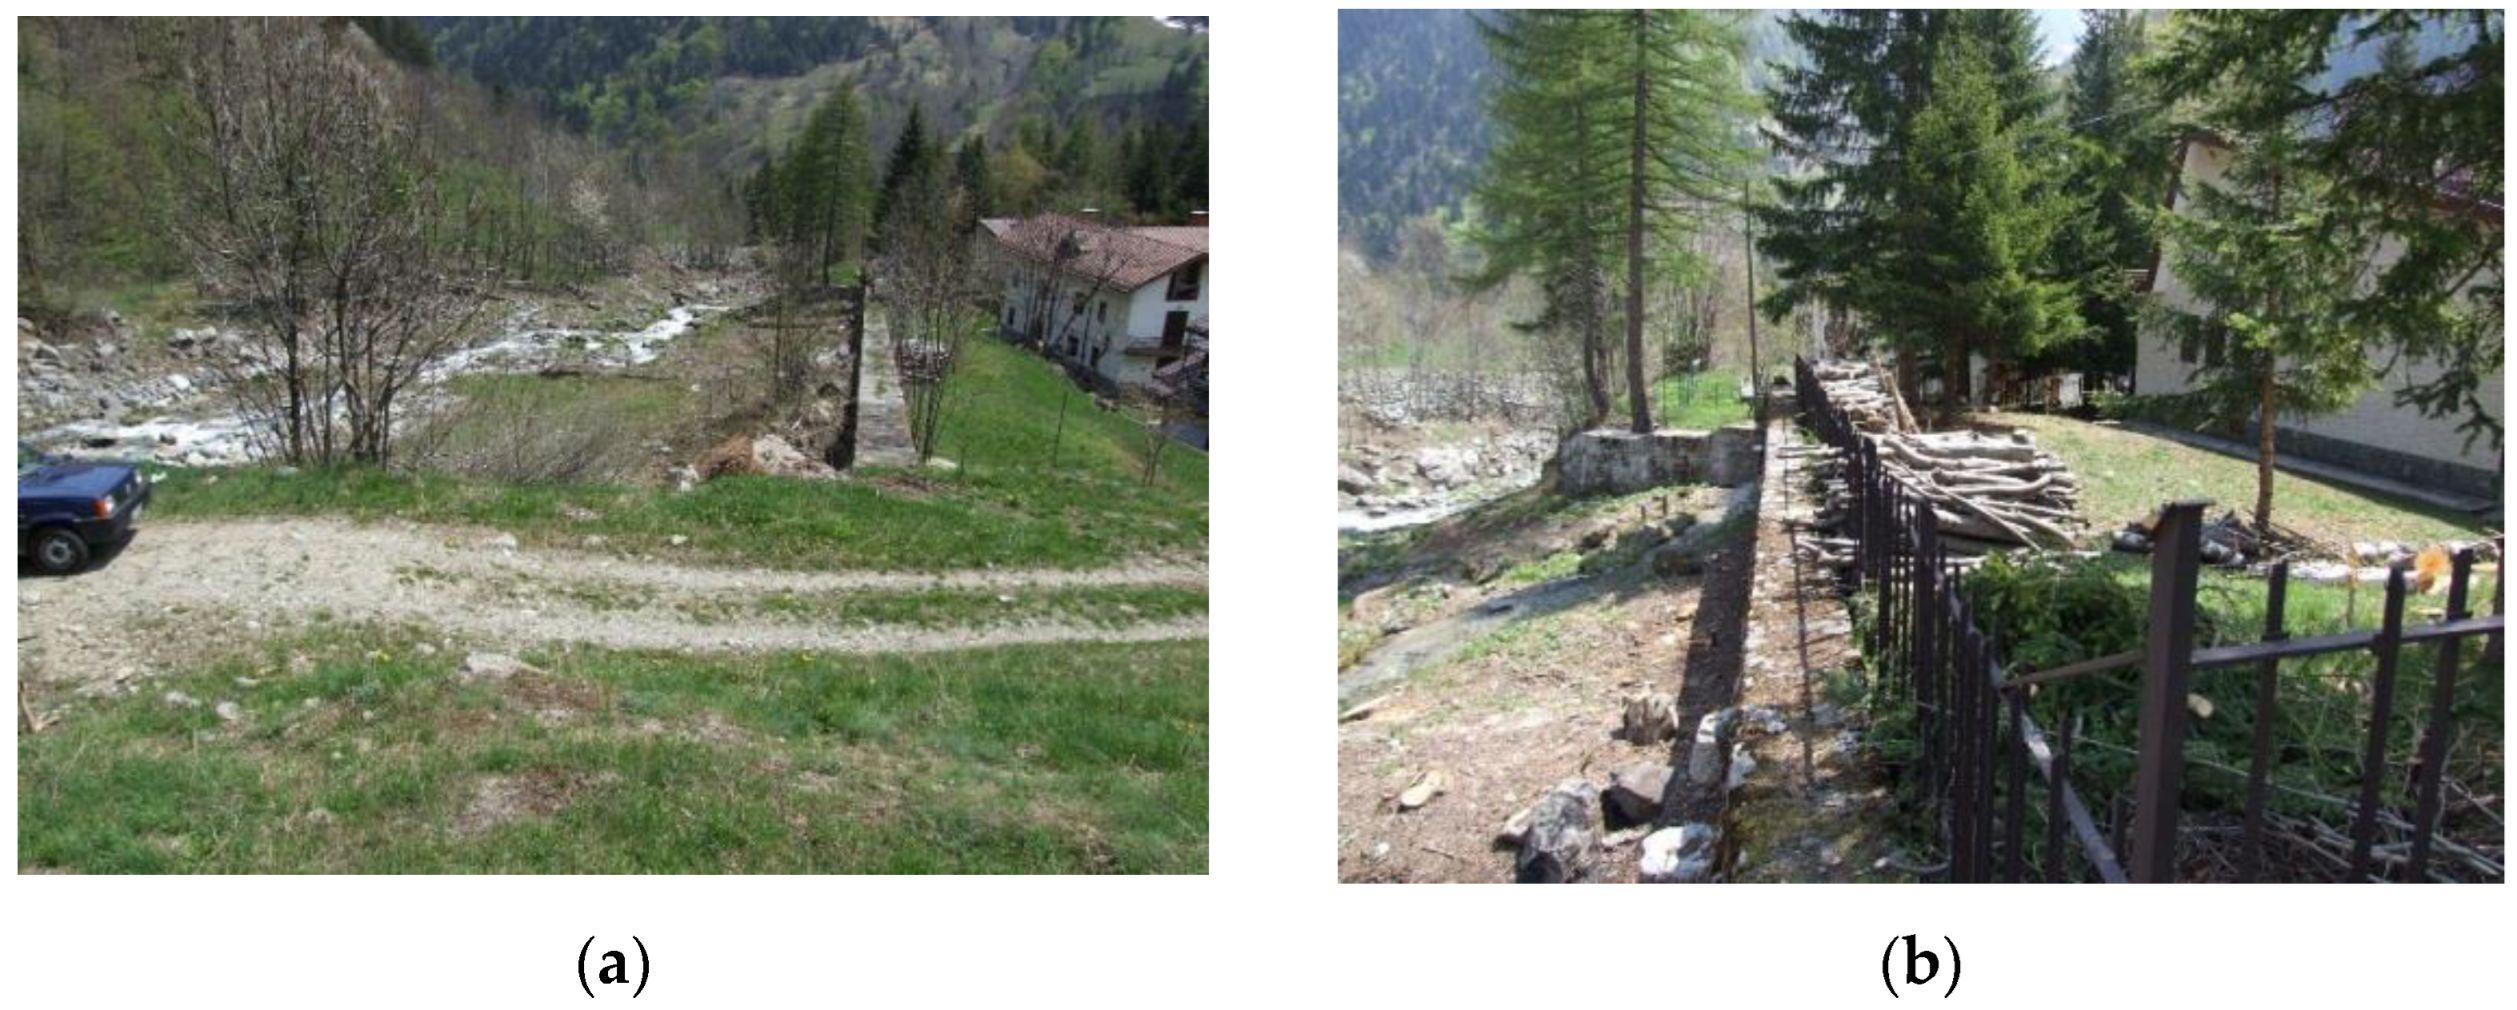
4.1. State of the Hydraulic Defence Works
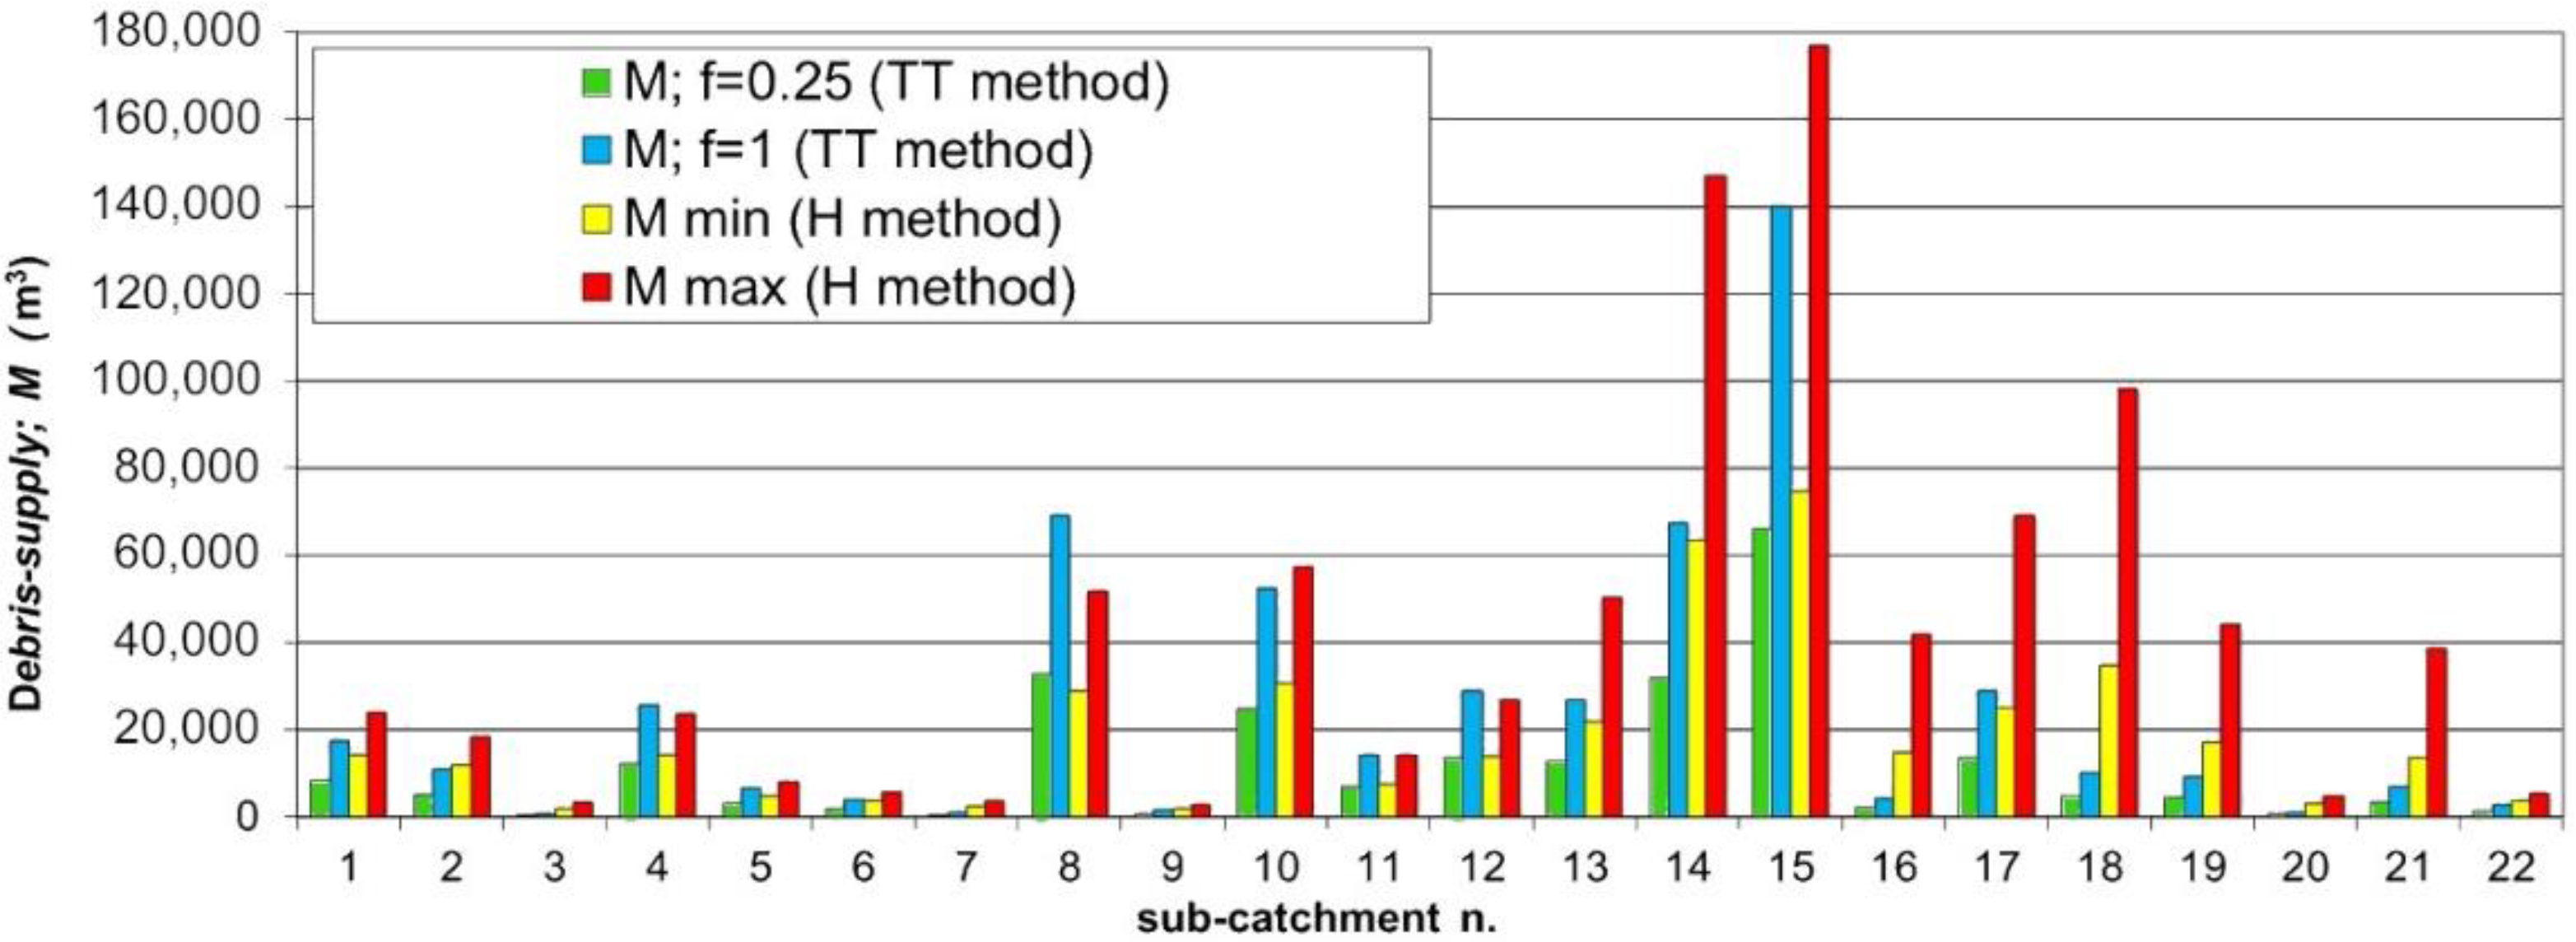
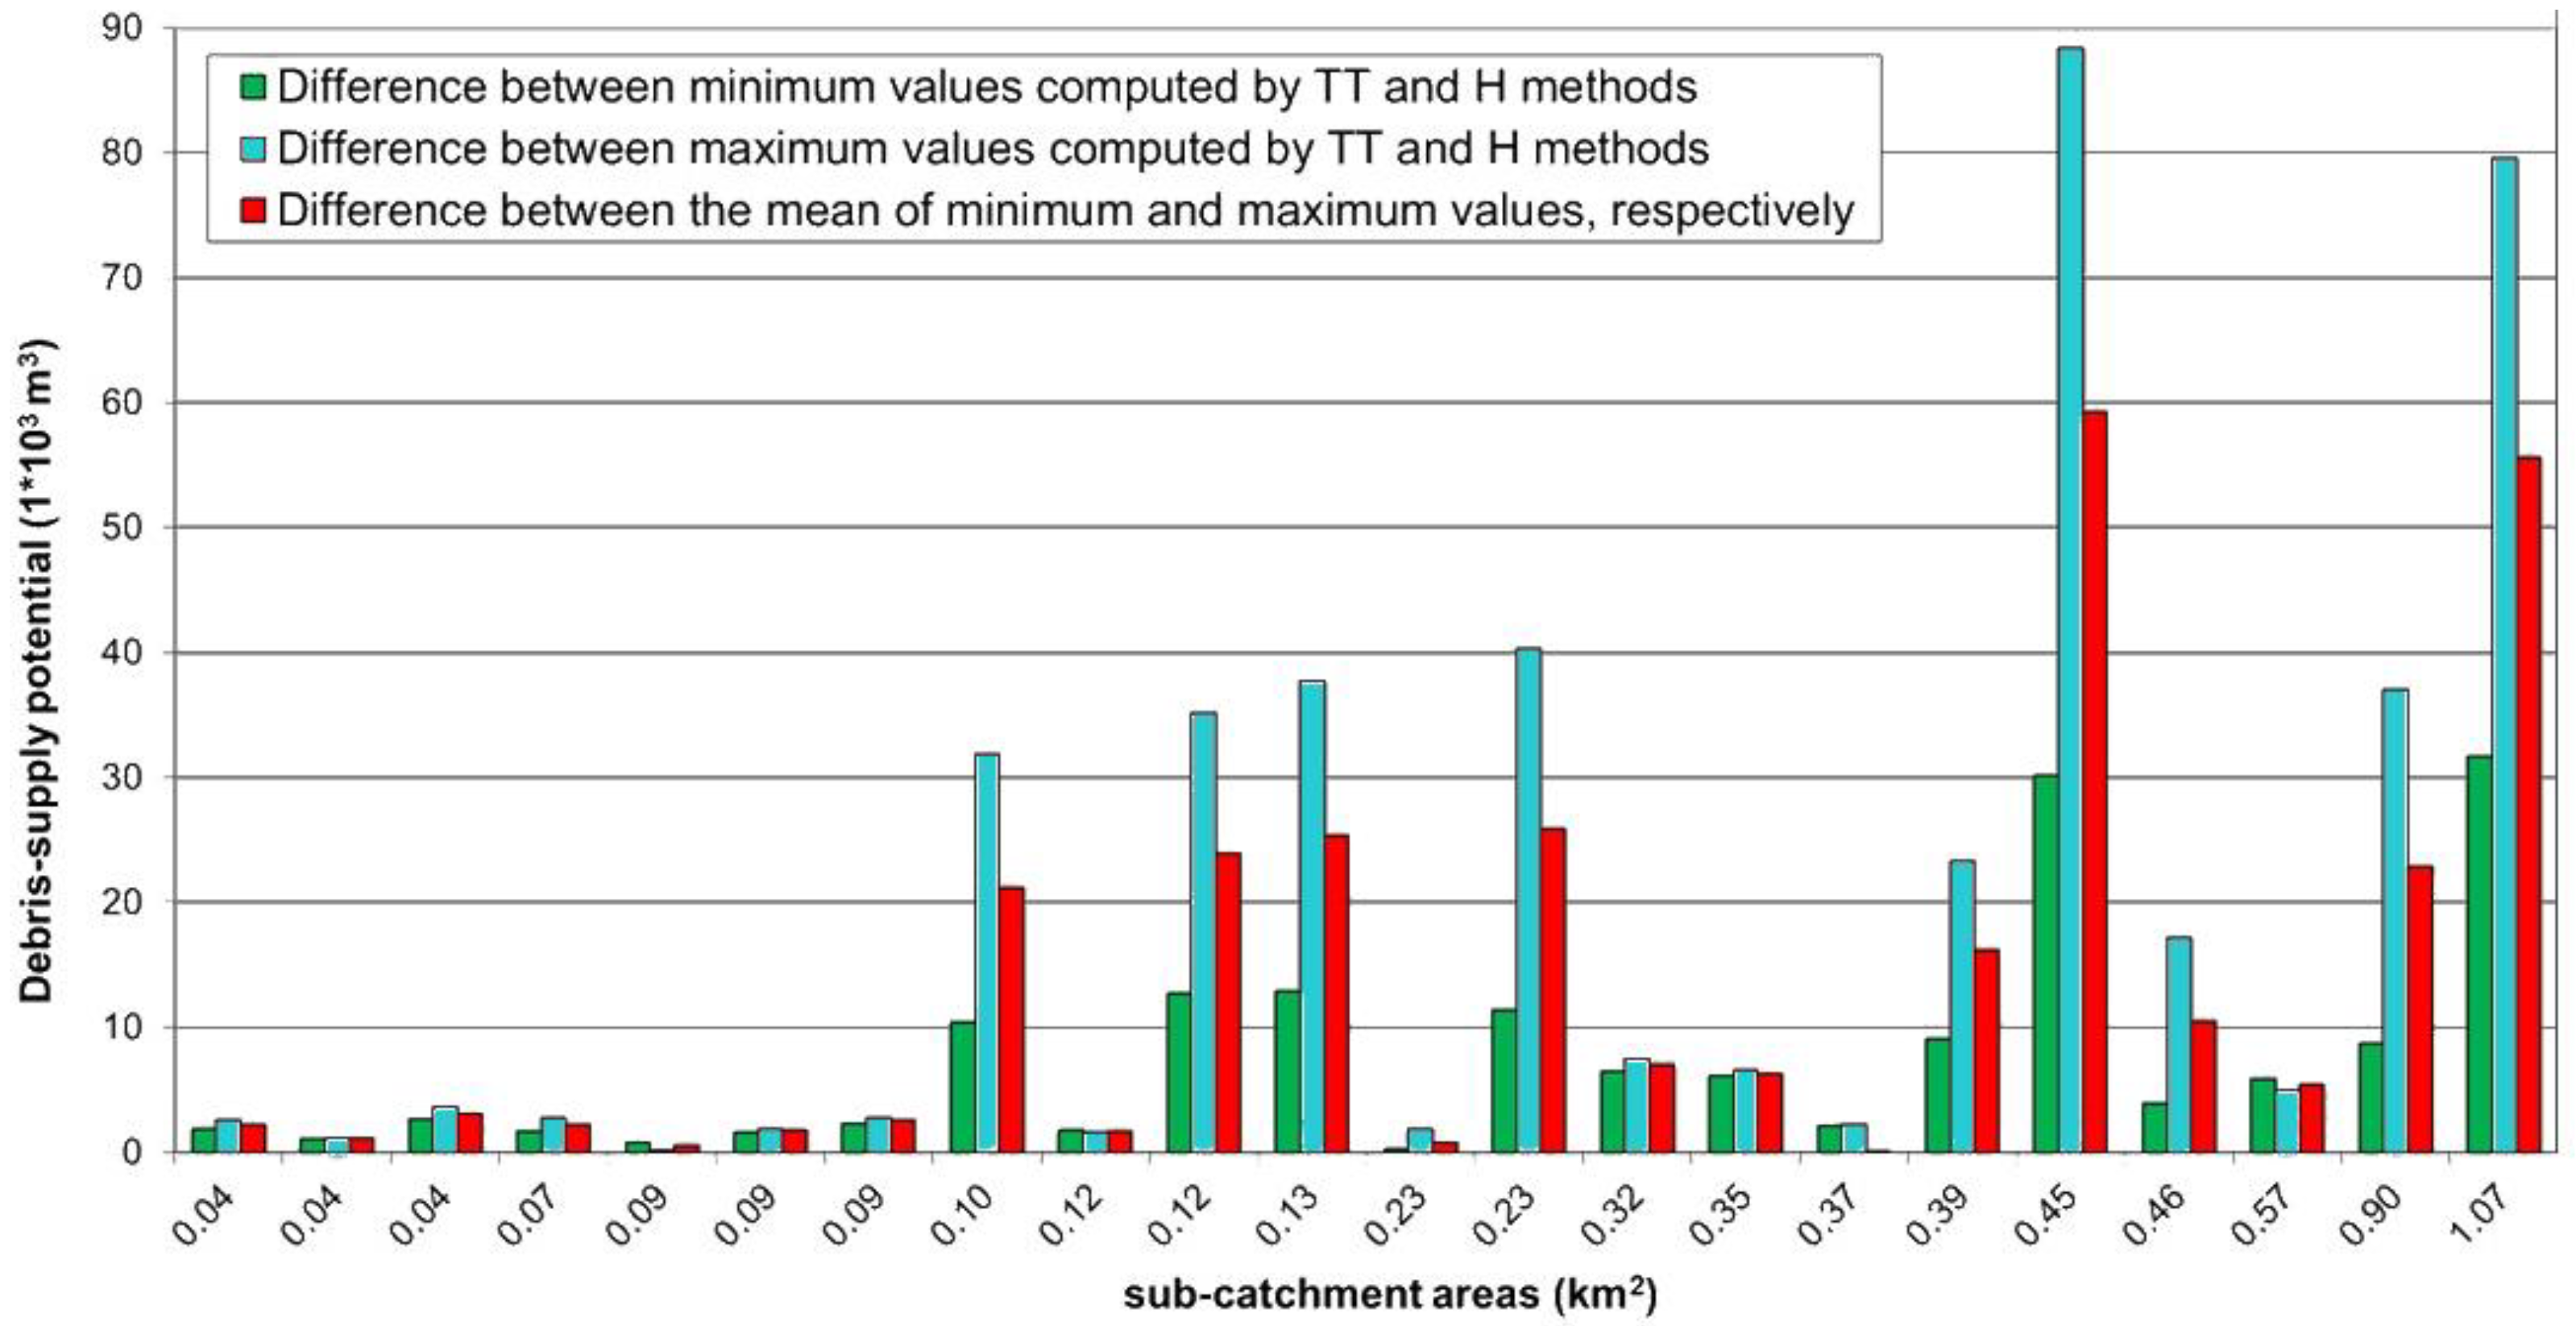
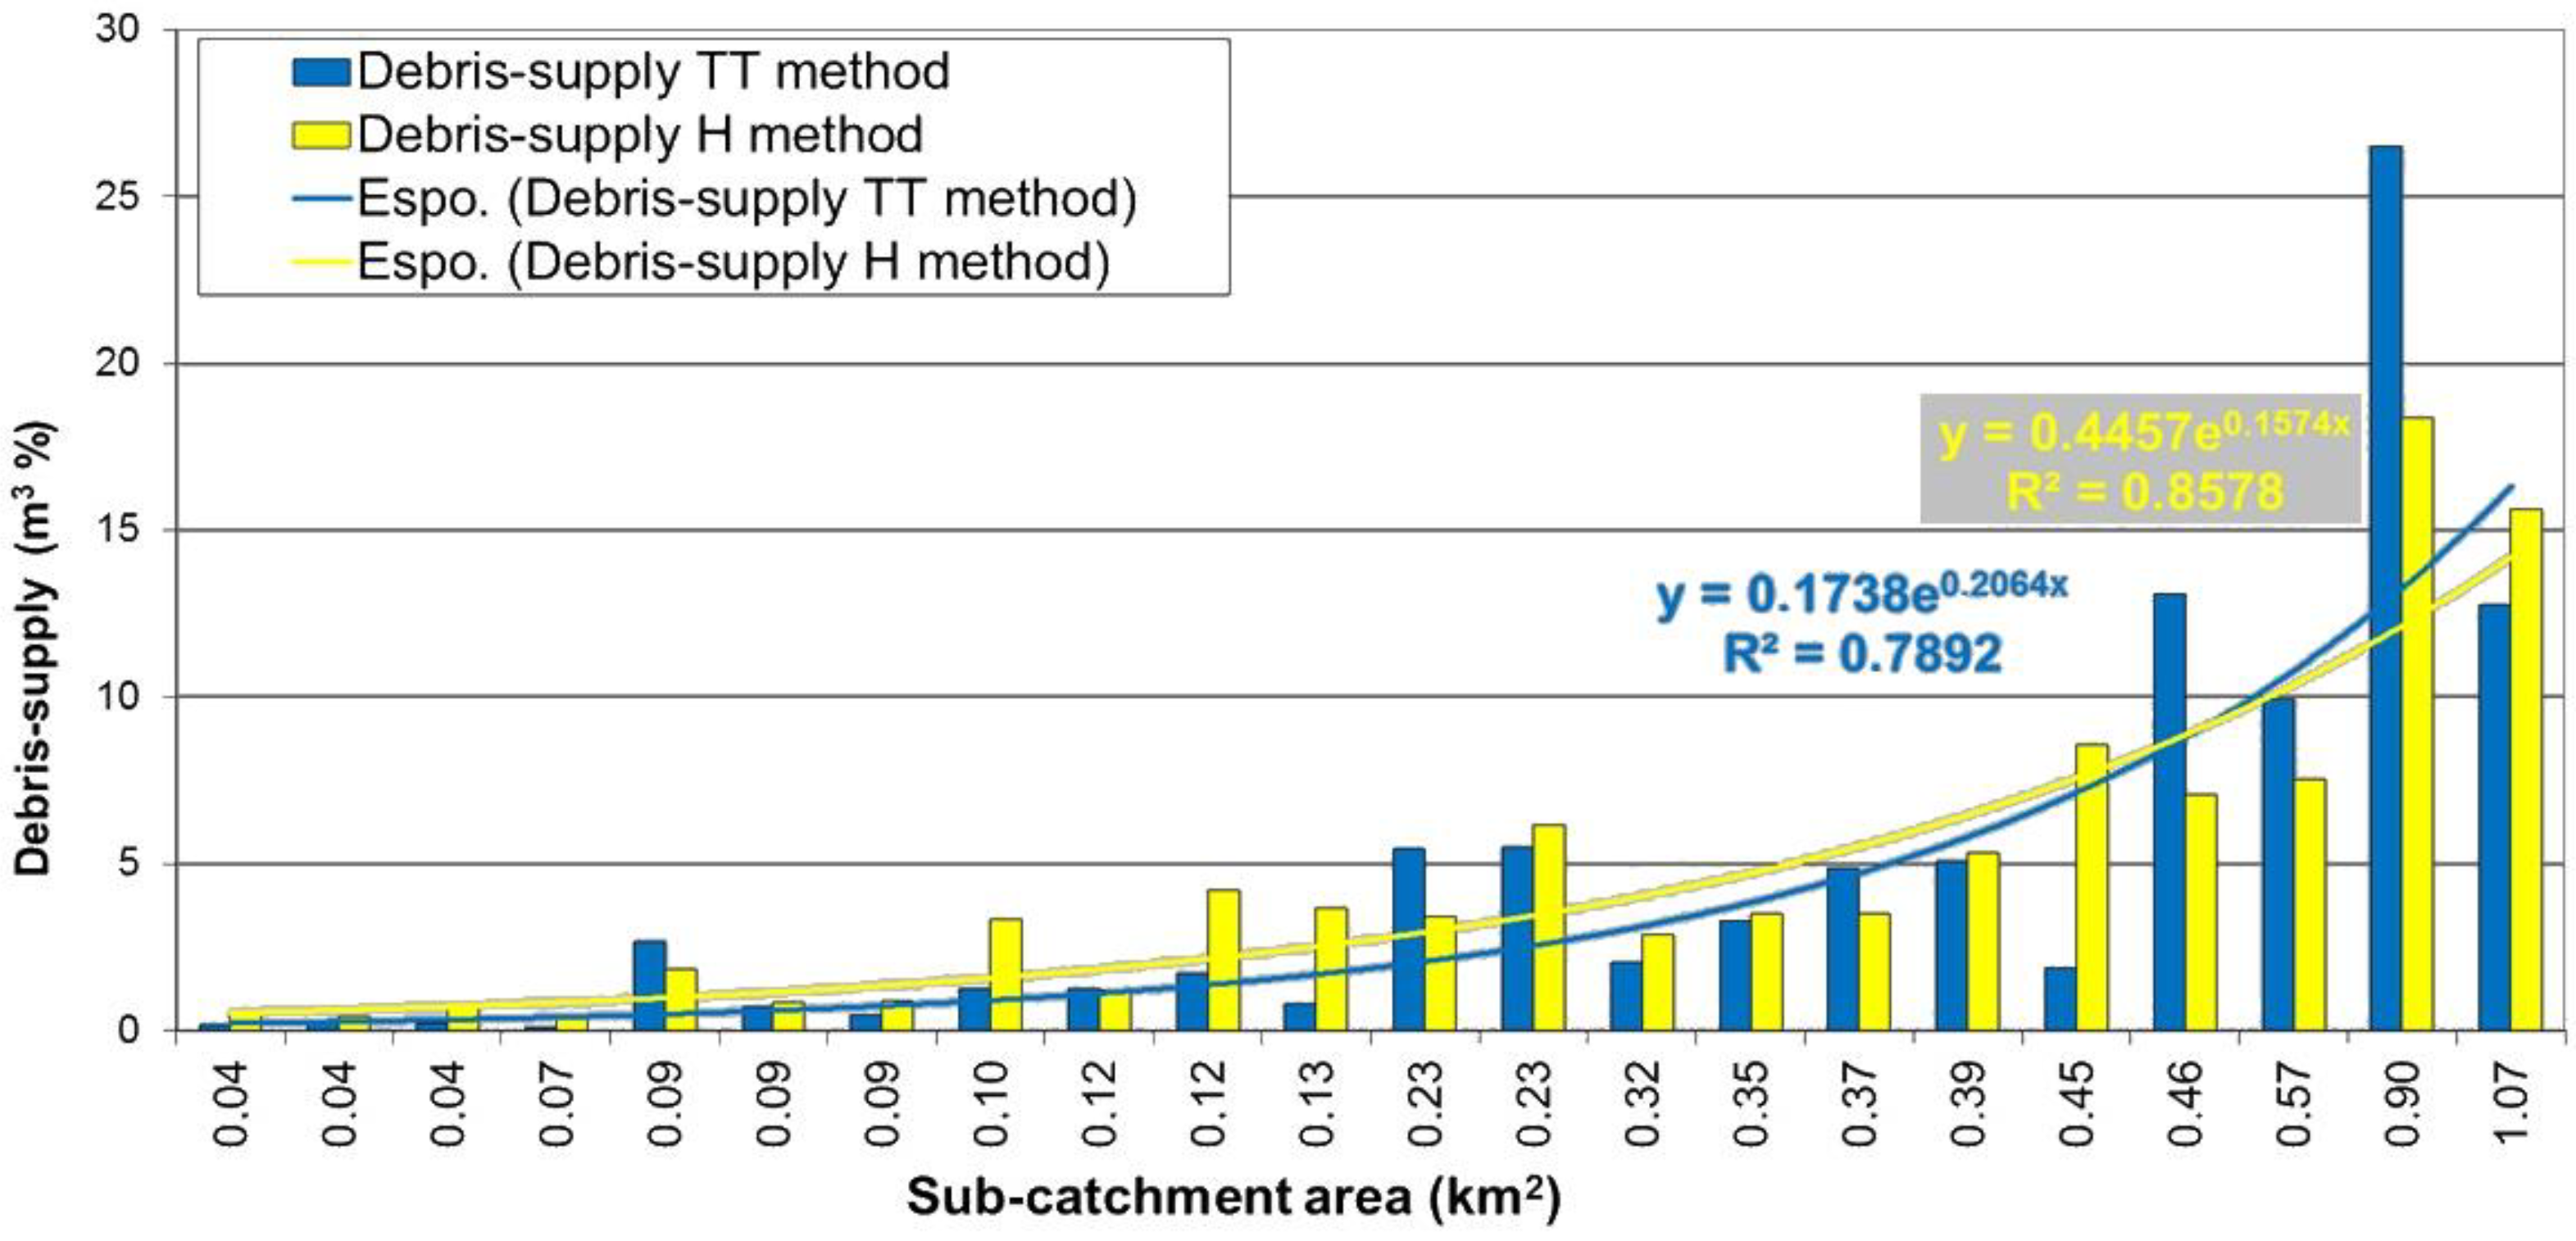
4.2. Debris-Flow Magnitude
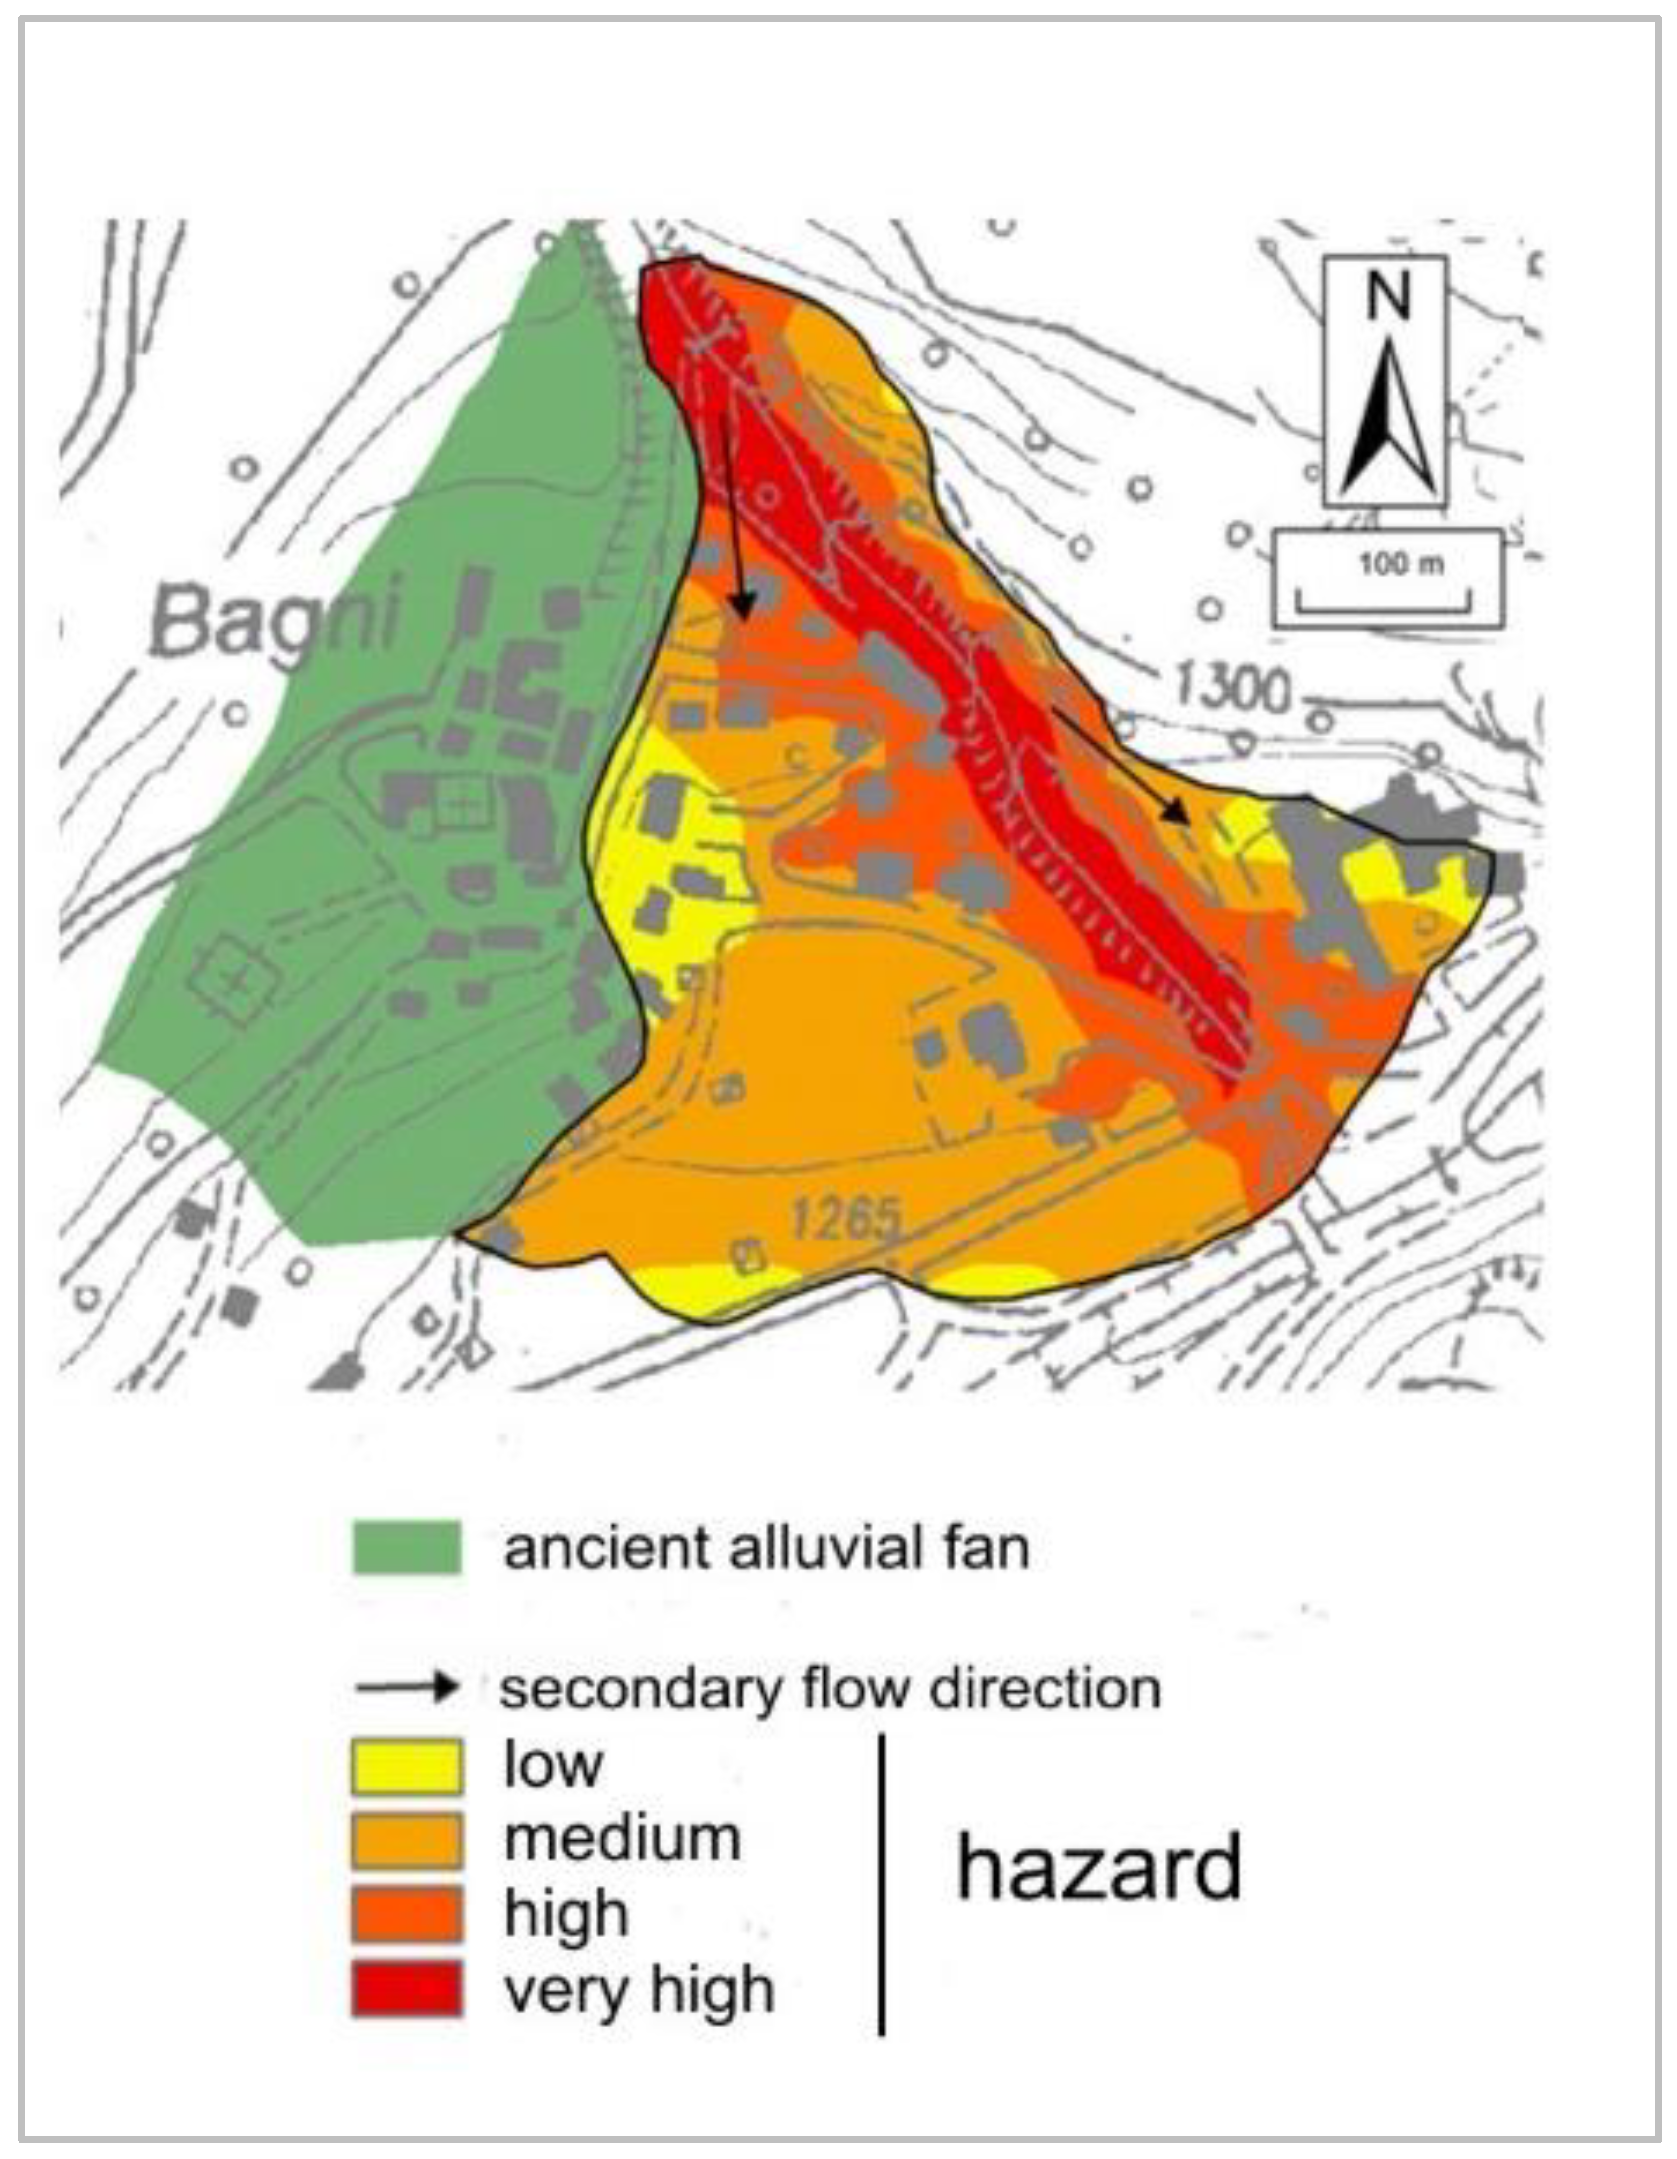
4.3. Hazard Map
5. Discussion
6. Conclusions
Author Contributions
Funding
Institutional Review Board Statement
Informed Consent Statement
Data Availability Statement
Acknowledgments
Conflicts of Interest
Appendix A

| Date | Damage Description | Data Source | Intensity |
|---|---|---|---|
| Middle of the 18th Century | Destruction of the former buildings on the right side of the Ischiator alluvial fan. | CNR-IRPI Archive | VH |
| 17 August 1754 | A votive chapel in Bagni destroyed by the Ischiator flood. | Archive of the Vinadio Municipality | H |
| 26–27 August 1834 | The flooding of the Ischiator Stream removed the access bridge to the Vinadio spa. | Archive of the Vinadio Municipality | H |
| October 1839 | Several roads and crossings damaged. | Archive of the Vinadio Municipality | H |
| 1842 | Eroded bridge abutments in the Bagni di Vinadio district. | Archive of the Vinadio Municipality | H |
| October 1846 | Damage to various roads and crossings totalling LIT 2931 (equivalent to approximately EUR 15000 today). | Archive of the Vinadio Municipality | H |
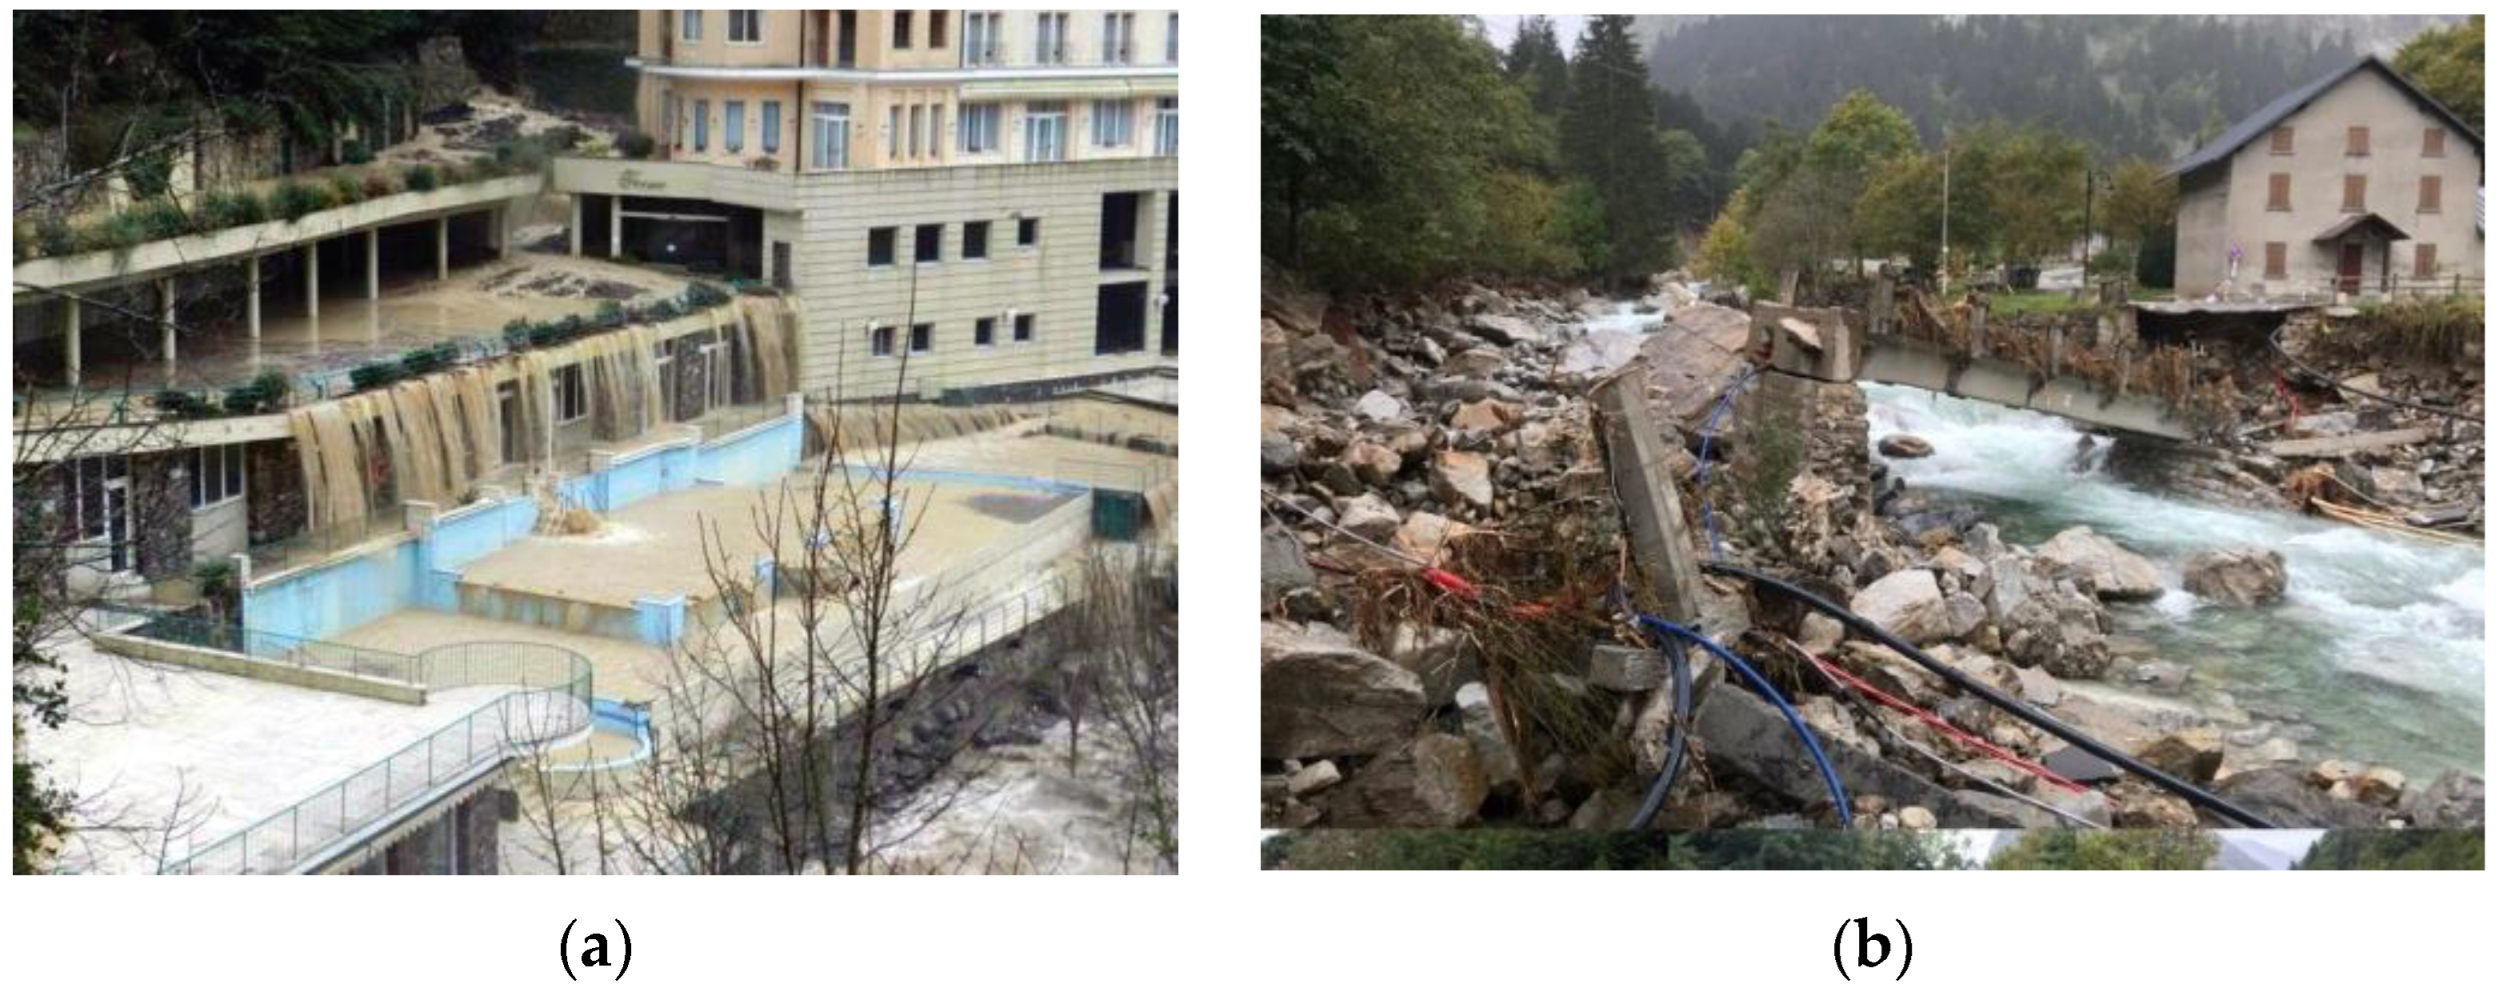
| 3 August 1853 | A debris flow with high magnitude produces deep bank erosion, triggering lateral landslides. The spa was flooded with debris. The existing longitudinal defences on the side of the stream were destroyed. The military barracks were also flooded. | Archive of the Vinadio Municipality | VH |
| 10 July 1873 | An intense flood removes bridges along the Stura Stream. | Archive of the Vinadio Municipality | H |
| May 1894 | Damage to the spa bridge. | Archive of the Vinadio Municipality | VH |
| October–November 1926 | The huge amount of solid matter transported along the Ischiator Stream caused the removal of several bridges, others seriously damaged, and serious damage to roads, houses and hydraulic regulation works. | Archive of the Vinadio Municipality | H |
| 13–14 June 1957 | Damage to the bridge over the Ischiator near the spa; damage also to the banks near the spa. Several weirs in the tributaries of the Ischiator were damaged (e.g. in the Comba Vaccia basin). The Ischiator Stream brought considerable debris to the alluvial fan, diverting its course and constituting a very serious danger for the inhabitants of the Bagni di Vinadio district. | CNR-IRPI Archive | VH |
| 18–19 May 1977 | Damage to the access bridge to the village of Bagni di Vinadio, bank erosion. The floods have brought considerable solid transport. Debris removal and rectification of the riverbed planned. | Archive of Italian Forestry Corps | M |
| 1979 | The threat to the houses in the Ischiator alluvial fan was particularly serious: the waters overflowed the right bank in the area of the Spa hotel. | Dott. Geol. P.F. Sorzana, personal comunication | H |
| 24–25 August 1987 | The intense rainfall triggered widespread mobilisation and transport of debris along the minor incisions on the left-hand side of the slope, also causing some road closures. | Dott. Geol. P.F. Sorzana, personal comunication | H |
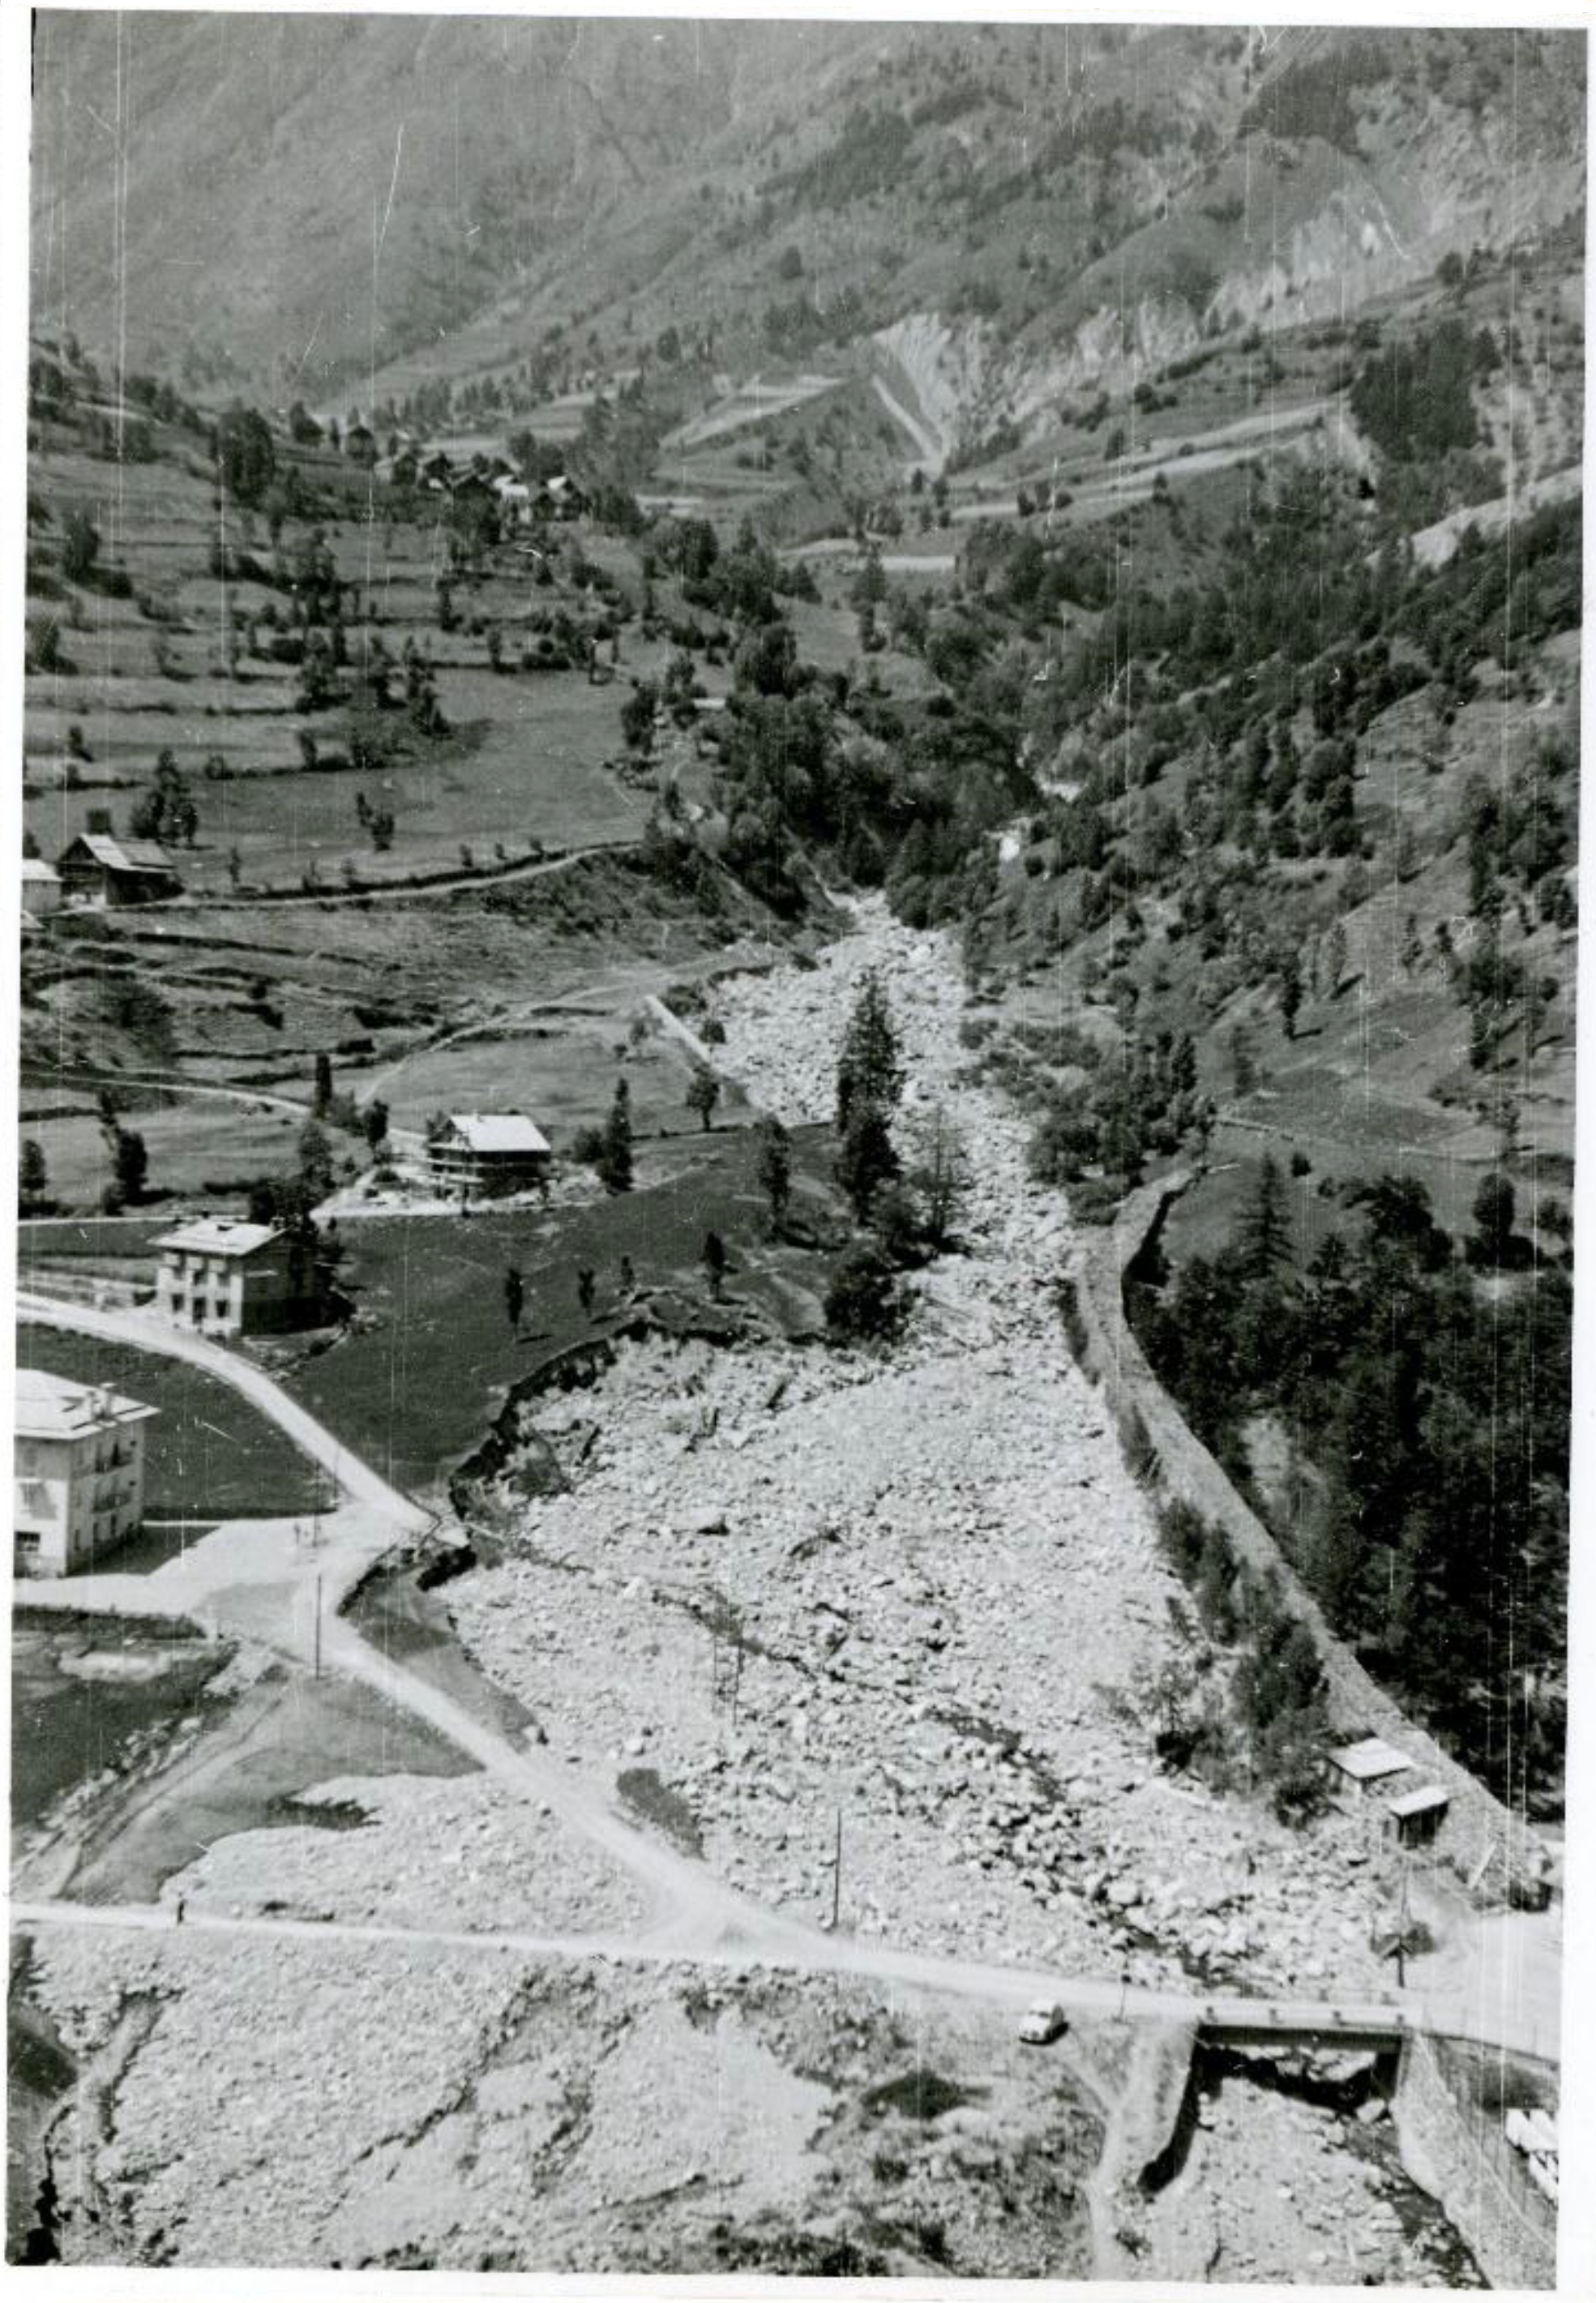
| 13 June 2000 | Intense torrential flooding concomitant with that of the main watercourse, considerable debris deposits in Pianche di Vinadio. | AVI Project [58] | H |
| June 2020 | The steep slope below the municipal road was affected by a rapid debris flow. There was no direct damage to human infrastructures, but a possible retrogressive development of the landslide could involve the municipal road and the aqueduct. The landslide material reached the Ischiator Stream riverbed. | ARPA Piemonte [59] | L |
References
- Govi, M.; Turitto, O. Recent and Past Floods in Northern Italy, River Flood Disasters; ICSU SC/IDNDR Workshop: Koblenz, Germany, 1997; pp. 13–32. [Google Scholar]
- Tropeano, D.; Turconi, L. Using historical documents in landslide, debris flow and stream flood prevention. Applications in Northern Italy. Nat. Hazards 2004, 31, 663–679. [Google Scholar] [CrossRef]
- Stoffel, M.; Wyżga, B.; Marston, R.A. Floods in mountain environments: A synthesis. Geomorphology 2016, 272, 1–9. [Google Scholar] [CrossRef]
- Mostbauer, K.; Kaitna, R.; Prenner, D.; Hrachowitz, M. The temporally varying roles of rainfall, snowmelt and soil moisture for debris flow initiation in a snow-dominated system. Hydrol. Earth Syst. Sci. 2018, 22, 3493–3513. [Google Scholar] [CrossRef] [Green Version]
- Sassa, K.; Fukuoka, H.; Fawu, W. Mechanism and risk assessment of landslide-triggered-debris flows: Lesson from the 1996.12. 6 Otari debris flow disaster, Nagano, Japan. In Landslide Risk Assess; Balkema: Rotterdam, The Netherlands, 2018; pp. 347–356. [Google Scholar]
- Armanini, A.; Michiue, M. Recent Development on Debris-Flows; Springer: New York, NY, USA, 1997; pp. 163–165. [Google Scholar]
- Cannon, S.H.; Powers, P.S.; Savage, W.Z. Fire-related hyperconcentrated and debris flows on Storm King Mountain, Glenwood Springs, Colorado, USA. Environ. Geol. 1998, 35, 210–218. [Google Scholar] [CrossRef]
- Cannon, S.H.; Gartner, J.E. Wildfire-related debris flow from a hazards perspective. In Debris-Flow Hazards and Related Phenomena; Springer Praxis Books; Springer: Berlin/Heidelberg, Germany, 2005; pp. 363–381. [Google Scholar] [CrossRef]
- Conedera, M.; Tinner, W.; Neff, C.; Meurer, M.; Dickens, A.F.; Krebs, P. Reconstructing past fire regimes: Methods, applications, and relevance to fire management and conservation. Quat. Sc. Rev. 2009, 28, 555–576. [Google Scholar] [CrossRef]
- Riley, K.L.; Bendick, R.; Hyde, K.D.; Gabet, E.J. Frequency-magnitude distribution of debris flows compiled from global data, and comparison with post-fire debris flows in the western U.S. Geomorphology 2013, 191, 118–128. [Google Scholar] [CrossRef]
- Gees, A. Analyse historischer und seltener Hochwasser in der Schweiz. Bedeutung für das Bemessungshochwasser. Geogr. Bernensia 1997, 53, 1–156. (In Germany) [Google Scholar]
- Barnikel, F.; Becht, M. A historical analysis of hazardous events in the Alps the case of Hindelang (Bavaria, Germany). Nat. Hazards Earth Syst. Sci. 2003, 3, 625–635. [Google Scholar] [CrossRef]
- Tropeano, D.; Turconi, L. Geomorphic classification of alpine catchments for debris-flow hazard reduction. In Proceedings of the Debris-Flow Hazards Mitigation: Mechanics, Prediction and Assessment, Davos, Switzerland, 10–12 September 2003; Millpress Science Publishers: Rotterdam, The Netherlands, 2003; pp. 1221–1232, ISBN 90-77017-78-X. [Google Scholar]
- Hürlimann, M.; Copons, R.; Altimir, J. Detailed debris flow hazard assessment in Andorra: A multidisciplinary approach. Geomorphology 2006, 78, 359–372. [Google Scholar] [CrossRef]
- Lega, M.; Casazza, M.; Turconi, L.; Luino, F.; Tropeano, D.; Savio, G.; Ulgiati, S.; Endreny, T. Environmental Data Acquisition, Elaboration and Integration: Preliminary Application to a Vulnerable Mountain Landscape and Village (Novalesa, NW Italy). Engineering 2018, 4, 635–642. [Google Scholar] [CrossRef]
- Turconi, L.; Nigrelli, G.; Conte, R. Historical datum as a basis for a new GIS application to support civil protection services in Northwestern Italy. Comput. Geosci. 2014, 66, 13–19. [Google Scholar] [CrossRef]
- Papa, M.N.; Sarno, L.; Vitiello, F.S.; Medina, V. Application of the 2D Depth-Averaged Model, FLATModel, to Pumiceous Debris Flows in the Amalfi Coast. Water 2018, 10, 1159. [Google Scholar] [CrossRef] [Green Version]
- Stancanelli, L.M.; Musumeci, R.E. Geometrical Characterization of Sediment Deposits at the Confluence of Mountain Streams. Water 2018, 10, 401. [Google Scholar] [CrossRef] [Green Version]
- Luino, F.; Nigrelli, G.; Turconi, L.; Faccini, F.; Agnese, C.; Casillo, F. A proper land-use planning through the use of historical research. Disaster Adv. 2016, 9, 8–19. [Google Scholar]
- Apollonio, C.; Balacco, G.; Novelli, A.; Tarantino, E.; Piccinni, A.F. Land use change impact on flooding areas: The case study of Cervaro basin (Italy). Sustainability 2016, 8, 996. [Google Scholar] [CrossRef] [Green Version]
- Luino, F.; Paliaga, G.; Roccati, A.; Sacchini, A.; Turconi, L.; Faccini, F. Anthropogenic changes in the alluvial plains of the Tyrrhenian Ligurian basins. Rend. Online Soc. Geol. Ital. 2019, 48, 10–16. [Google Scholar] [CrossRef]
- Paliaga, G.; Faccini, F.; Luino, F.; Turconi, L. A spatial multicriteria prioritizing approach for geohydrological risk mitigation planning in small and densely urbanized Mediterranean basins. Nat. Hazards Earth Syst. Sci. 2019, 19, 53–69. [Google Scholar] [CrossRef] [Green Version]
- Roccati, A.; Luino, F.; Turconi, L.; Piana, P.; Watkins, C.; Faccini, F. Historical Geomorphological Research of a Ligurian Coastal Floodplain (Italy) and Its Value for Management of Flood Risk and Environmental Sustainability. Sustainability 2018, 10, 3727. [Google Scholar] [CrossRef] [Green Version]
- Giraud, R.E. Guidelines for the Geologic Evaluation of Debris-Flow Hazards on Alluvial Fans in Utah: Utah Geological Survey; Miscellaneous Publication: Salt Lake City, UT, USA, 2005; Volume 6, 16p. [Google Scholar]
- Pankaj, J.; van Westen, C.; Jetten, V. Quantitative assessment of landslide hazard along transportation lines using historical records. Landslides 2011, 8, 279–291. [Google Scholar] [CrossRef]
- Chen, Y.; Qiu, Z.; Li, B.; Yang, Z. Numerical Simulation on the Dynamic Characteristics of a Tremendous Debris Flow in Sichuan, China. Processes 2018, 6, 109. [Google Scholar] [CrossRef] [Green Version]
- FEMA. Guidelines and Specifications for Flood Hazard. Mapping Partners, Appendix G: Guidance for Alluvial Fan Flooding Analyses and Mapping; Federal Emergency Management Agency: Hyattsville, MD, USA, 2003; pp. 1–33. Available online: https://www.fema.gov/sites/default/files/nepa/Guidelines_and_Specifications_for_Flood_Hazard_Mapping_Partners_Appendix_G-Guidance_for_Alluvial_Fan_Flooding_Analyses_and_Mapping__Feb_2002_.pdf (accessed on 25 May 2020).
- House, P.K. Using geology to improve floodplain management on alluvial fans: An example from Laughlin, Nevada. J. Am. Water Resour. Ass. 2005, 41, 1–17. [Google Scholar] [CrossRef]
- Chang, T.-C.; Wang, Z.-Y.; Chien, Y.-H. Hazard assessment model for debris flow prediction. Environ. Earth Sci. 2010, 60, 1619–1630. [Google Scholar] [CrossRef]
- Luna, B.Q.; Blahut, J.; Camera, C.; van Westen, C.; Apuani, T.; Jetten, V.; Sterlacchini, S. Physically based dynamic run-out modelling for quantitative debris flow risk assessment: A case study in Tresenda, northern Italy. Environ. Earth Sci. 2014, 72, 645–661. [Google Scholar]
- Turconi, L.; De, S.K.; Demurtas, F.; Demurtas, L.; Pendugiu, B.; Tropeano, D.; Savio, G. An analysis of debris-flow events in the Sardinia Island (Thyrrenian Sea, Italy). Environ. Earth Sci. 2013, 69, 1509–1521. [Google Scholar] [CrossRef]
- He, S.; Liu, W.; Li, X. Prediction of impact force of debris flows based on distribution and size of particles. Environ. Earth Sci. 2016, 75, 298. [Google Scholar] [CrossRef]
- Holub, M.; Suda, J.; Fuchs, S. Mountain hazards: Reducing vulnerability by adapted building design. Environ. Earth Sci. 2012, 66, 1853–1870. [Google Scholar] [CrossRef] [Green Version]
- Bathrellos, G.D.; Gaki-Papanastassiou, K.; Skilodimou, H.D.; Papanastassiou, D.; Chousianitis, K.G. Potential suitability for urban planning and industry development by using natural hazard maps and geological—Geomorphological parameters. Environ. Earth Sci. 2012, 66, 537–548. [Google Scholar] [CrossRef]
- Bathrellos, G.D.; Skilodimou, H.D.; Chousianitis, K.; Youssef, A.M.; Pradhan, B. Suitability estimation for urban development using multi-hazard assessment map. Sci. Total Environ. 2017, 575, 119–134. [Google Scholar] [CrossRef]
- Bathrellos, G.D.; Karymbalis, E.; Skilodimou, H.D.; Gaki-Papanastassiou, K.; Baltas, E.A. Urban flood hazard assessment in the basin of Athens Metropolitan city, Greece. Environ. Earth Sci. 2016, 75, 319. [Google Scholar] [CrossRef]
- Guzzetti, F.; Tonelli, G. Information system on hydrological and geomorphological catastrophes in Italy (SICI): A tool for managing landslide and flood hazards. Nat. Hazards Earth Syst. Sci. 2004, 4, 213–232. [Google Scholar] [CrossRef]
- SICI Project—Information System on Hydrological and Geomorphological Catastrophes. Available online: www.sici.irpi.cnr.it/ (accessed on 21 December 2021).
- Blahut, J.; Horton, P.; Sterlacchini, S.; Jaboyedoff, M. Debris flow hazard modelling on medium scale: Valtellina di Tirano, Italy. Nat. Hazards Earth Syst. Sci. 2010, 10, 2379–2390. [Google Scholar] [CrossRef]
- Cama, M.; Lombardo, L.; Conoscenti, C.; Rotigliano, E. Improving transferability strategies for debris flow susceptibility assessment: Application to the Saponara and Itala catchments (Messina, Italy). Geomorphology 2017, 288, 52–65. [Google Scholar] [CrossRef]
- Aronica, G.T.; Brigandí, G.; Morey, N. Flash floods and debris flow in the city area of Messina, north-east part of Sicily, Italy in October 2009: The case of the Giampilieri catchment. Nat. Hazards Earth Syst. Sci. 2012, 12, 1295–1309. [Google Scholar] [CrossRef]
- Luino, F.; Turconi, L. Eventi di Piena e Frana in Italia Settentrionale Nel Periodo 2005–2016; SMS: Moncalieri, Italy, 2017; 476p, ISBN 978-88-903023-8-1. [Google Scholar]
- Lee, T.-L.; Chen, C.-H.; Pai, T.-Y.; Wu, R.-S. Development of a Meteorological Risk Map for Disaster Mitigation and Management in the Chishan Basin, Taiwan. Sustainability 2015, 7, 962–987. [Google Scholar] [CrossRef] [Green Version]
- Luino, F.; Belloni, A.; Turconi, L.; Faccini, F.; Mantovani, A.; Fassi, P.; Caldiroli, G. A historical geomorphological approach to flood hazard management along the shore of an alpine lake (northern Italy). Nat. Hazards 2018, 94, 471–488. [Google Scholar] [CrossRef]
- Audisio, C.; Turconi, L. Urban floods: A case study in the Savigliano area (North-Western Italy). Nat. Hazards Earth Syst. Sci. 2011, 11, 2951–2964. [Google Scholar] [CrossRef]
- Coeur, D.; Lang, M. The Contribution of Historical Data for the Understanding of Floods and Risk Prevention. Floods 2017, 1, 227–239. [Google Scholar] [CrossRef]
- Sacchi, R. Notizie geologiche sulla dorsale M. Sejta—M. Corborant (Massiccio dell’Argentera). Atti Soc. It. Sc. Nat. 1961, 100, 397–406. (In Italian) [Google Scholar]
- Faure-Muret, A. Etudes géologique sur le massif de l’Argentera-Mercantour et ses enveloppes sédimentaires. Thèse Sc., Mém. Serv. Carte géol. France, Paris. Imp. Nat. 1955, 1, 1–336. (In French) [Google Scholar]
- Malaroda, R. Carta Geologica del Massiccio dell’Argentera alla scala 1:50.000 e Note Illustrative. Mem. Soc. Geol. It. 1970, 9, 557–663. (In Italian) [Google Scholar]
- Sacchi, R. Geologia della regione a sud-ovest di Vinadio (Massiccio Cristallino dell’Argentera). Boll. Serv. Geol. It. 1959, LXXXI, 223–256. (In Italian) [Google Scholar]
- Rubatto, D.; Schaltegger, U.; Lombardo, B.; Compagnoni, R. Complex Paleozoic magmatic and metamorphic evolution in the Argentera Massif (Western Alps) resolved with U-Pb dating. Schweiz. Mineral. Und Petrogr. Mitt. 2001, 81, 213–228. [Google Scholar]
- Rubatto, D.; Ferrando, S.; Compagnoni, R.; Lombardo, B. Carboniferous high-pressure metamorphism of Ordovician rotoliths in the Argentera Massif (Italy), Southern European Variscan belt. Lithos 2009, 116, 65–76. [Google Scholar] [CrossRef]
- Baietto, A.; Perello, P.; Cadoppi, P.; Martinotti, G. Alpine tectonic evolution and thermal water circulations of the Argentera Massif (South-Western Alps). Swiss J. Geosci. 2009, 102, 223–245. [Google Scholar] [CrossRef]
- Sacco, F. Il Gruppo dell’Argentera. In Estr. Memorie della Reale Accademia delle Scienze di Torino; Serie II; Accademia delle Scienze di Torino: Torino, Italy, 1911; Volume LXI. (In Italian) [Google Scholar]
- Tropeano, D.; Turconi, L. Predictability of the Mass Transport of Sediments in Alpine Catchments. The Case Study of T. Thuras (NW Italy). Available online: http://www.interpraevent.at/palm-cms/upload_files/Publikationen/Tagungsbeitraege/2000_3_321.pdf (accessed on 15 November 2021).
- Pan, H.-L.; Jiang, Y.-J.; Wang, J.; Ou, G.-Q. Rainfall threshold calculation for debris flow early warning in areas with scarcity of data. Nat. Hazards Earth Syst. Sci. 2018, 18, 1395–1409. [Google Scholar] [CrossRef] [Green Version]
- Hirschberg, J.; Badoux, A.; McArdell, B.W.; Leonarduzzi, E.; Molnar, P. Limitations of rainfall thresholds for debris-flow prediction in an Alpine catchment. Nat. Hazards Earth Syst. Sci. 2021, 2021, 1–26. [Google Scholar] [CrossRef]
- AVI Project. Available online: http://avi.gndci.cnr.it/welcome_en.htm (accessed on 15 November 2021).
- ARPA Piemonte. Available online: http://webgis.arpa.piemonte.it/geodissesto/sifrap/sifrap_ii_liv_scheda.php?cod_frana=004-61130-00 (accessed on 1 March 2022).
- Tropeano, D.; Turconi, L. Valutazione Del Potenziale Detritico in Piccoli Bacini Delle Alpi Occidentali e Centrali; CNR-GNCDI: Perugia, Italy, 1999; pp. 1–151, (In Italian, with English Abstr.). [Google Scholar]
- Hungr, O.; Morgan, C.; Kellerhals, R. Quantitative analysis of debris torrent hazards for design of remedial measures. Can. Geotech. J. 1984, 21, 663–667. [Google Scholar] [CrossRef]
- Ambrogio, S.; Turconi, L. Analisi geomorfologica di dettaglio per la valutazione del potenziale detritico: L’esempio del mud-flow del 17 giugno 2003, Comune di Novalesa (Val Cenischia, Provincia di Torino). In Proceedings of the AIQUA Congress: ‘La Geologia del Quaternario in Italia: Temi Emergenti e zone d’ombra´, Roma, Italy, 16–18 February 2004. (In Italian). [Google Scholar]
- Turconi, L.; Tropeano, D. Ermittlung von Geschiebefrachten in wildbächen von Westlichen und Zentralen italienische Alpen. Wildbach Lawinenverbau 2000, 63, 37–47. (In English) [Google Scholar]
- Chen, H.-W.; Chen, C.-Y. Warning Models for Landslide and Channelized Debris Flow under Climate Change Conditions in Taiwan. Water 2022, 14, 695. [Google Scholar] [CrossRef]
- Luino, F. Sequence of instability processes triggered by heavy rainfall in northwestern Italy. Geomorphology 2005, 66, 13–39. [Google Scholar] [CrossRef]
- Lyu, L.; Wang, Z.; Cui, P.; Xu, M. The role of bank erosion on the initiation and motion of gully debris flows. Geomorphology 2017, 285, 137–151. [Google Scholar] [CrossRef]
- Aulitzky, H. Preliminary two-fold classification of torrents. In Mitteilungen der Forstlichen Bundesvers; Mitteilungen der Forstlichen Bundesversuchsanstalt: Wien, Austria, 1980; pp. 243–256. [Google Scholar]
- Ceriani, M.; Fossati, D.; Quattrini, S. Valutazione delle pericolosità idrogeologica sulle conoidi alpine; esempio della metodologia di Aulitzky applicata al conoide del torrente Re di Gianico, Valcamonica (Brescia). Alpi Centrali. Idraul. E Costr. Idraul. Conf. 1998, 3, 15–26. (In Italian) [Google Scholar]
- Pelletier, J.D.; Mayer, L.; Pearthree, P.A.; House, P.K.; Klawon, J.E.; Vincent, K.R. An integrated approach to flood hazard assessment on alluvial fans using numerical modeling, field mapping, and remote sensing. Geol. Soc. Am. Bull. 2005, 117, 1167–1180. [Google Scholar] [CrossRef]
- Glade, T. Linking debris-flow hazard assessments with geomorphology. Geomorphology 2005, 66, 189–213. [Google Scholar] [CrossRef]
- van Westen, C.J. The modeling of landslide hazards using GIS. Surv. Geophys. 2000, 21, 241–255. [Google Scholar] [CrossRef]
- Lin, P.S.; Lin, J.Y.; Hung, J.C.; Yang, M.D. Assessing debris-flow hazard in a watershed in Taiwan. Eng. Geol. 2002, 66, 295–313. [Google Scholar] [CrossRef]
- Melelli, L.; Taramelli, A. An example of debris-flows hazard modelling using GIS. Nat. Hazards Earth Syst. Sci. 2004, 4, 347–358. [Google Scholar] [CrossRef] [Green Version]
- Zhao, Y.; Meng, X.; Qi, T.; Chen, G.; Li, Y.; Yue, D.; Qing, F. Modeling the Spatial Distribution of Debris Flows and Analysis of the Controlling Factors: A Machine Learning Approach. Remote Sens. 2021, 13, 4813. [Google Scholar] [CrossRef]
- Fiebiger, G. Structures of debris flow countermeasures. In Debris-Flow Hazards Mitigation: Mechanics, Prediction and Assessment; Chen, C.H., Ed.; ASCE: New York, NY, USA, 1997; pp. 596–605. [Google Scholar]
- Heinimann, H.R.; Hollenstein, K.; Kienholz, H.; Krummenacher, B.; Mani, P. Methoden zur Analyse und Bewertung Von Naturgefahren, Umwelt—Materialen, 85; BUWAL: Bern, Switzerland, 1998; p. 247p. (In German) [Google Scholar]
- Jakob, M.; Hungr, O. Debris-Flow Hazards and Related Phenomena, XLII; Springer: Berlin/Heidelberg, Germany, 2005; p. 739. ISBN 978-3-540-27129-1. [Google Scholar]
- Guzzetti, F.; Carrara, A.; Cardinali, M.; Reichenbach, P. Landslide hazard evaluation: A review of current techniques and their application in a multi-scale study, central Italy. Geomorphology 1999, 31, 181–216. [Google Scholar] [CrossRef]
- Audisio, C.; Nigrelli, G.; Pasculli, A.; Sciarra, N.; Turconi, L. A Gis Spatial Analysis Model for Landslide Hazard Mapping Application in Alpine Area. Int. J. Sustain. Dev. Plan. 2017, 12, 883–893. [Google Scholar] [CrossRef]
- Mark, R.K.; Ellen, S.D. Statistical and simulation models for mapping debris-flow hazard. In Geographical Information Systems in Assessing Natural Hazards; Carrara, A., Guzzetti, F., Eds.; Kluwer Academic Publishers: Dordrecht, The Netherlands, 1995; pp. 93–106. [Google Scholar]
- Iverson, R.M.; Reid, M.E.; Lahusen, R.G. Debris-flow mobilization from landslides. Annu. Rev. Earth Planet. Sci. 1997, 25, 85–138. [Google Scholar] [CrossRef]
- Hofmeister, R.J.; Miller, D.J.; Mills, K.A.; Hinkle, J.C.; Beier, A.E. GIS Overview Map of Potential Rapidly Moving Landslide Hazards in Western Oregon; IMS22-Text; Oregon Department of Geology and Mineral Industries: Portland, OR, USA, 2002; 52p. [Google Scholar]
- Huggel, C.; Kääb, A.; Haeberli, W. Regional-scale models of debris flows triggered by lake outbursts: The 25 June 2001 debris flow at Täsch (Switzerland) as a test study. In Proceedings of the 3rd International Conference on Debris-Flow Hazards Mitigation; Rickenmann, D., Chen, C., Eds.; Millpress: Rotterdam, The Netherlands, 2003; pp. 1151–1162. [Google Scholar]
- Vallance, J.W.; Cunico, M.L.; Schilling, S.P. Debris-Flow Hazards Caused by Hydrologic Events at Mount Rainier, Washington; Open-File Report 03-368; USGS: Vancouver, BC, Canada, 2003. [Google Scholar]
- Pallas, R.; Vilaplana, J.M.; Guinau, M.; Falgas, E.; Alemany, X.; Munoz, A. A pragmatic approach to debris flow hazard mapping in areas affected by Hurricane Mitch: Example from NW Nicaragua. Eng. Geol. 2004, 72, 57–72. [Google Scholar] [CrossRef]
- Aleotti, P.; Polloni, G.; Tropeano, D.; Turconi, L. Numerical modeling to determine risk scenarios in an alpine alluvial fan. Manag. Inf. Syst. 2004, 9, 153–162. [Google Scholar]
- Pasuto, A.; Soldati, M. An integrated approach for hazard assessment and mitigation of debris flows in the Italian Dolomites. Geomorphology 2004, 61, 59–70. [Google Scholar] [CrossRef]
- Hussin, H.Y.; Quan Luna, B.; van Westen, C.J.; Christen, M.; Malet, J.-P.; van Asch, T.W.J. Parameterization of a numerical 2-D debris flow model with entrainment: A case study of the Faucon catchment, Southern French Alps. Nat. Hazards Earth Syst. Sci. 2012, 12, 3075–3090. [Google Scholar] [CrossRef]
- Chen, H.X.; Zhang, L.M. EDDA 1.0: Integrated simulation of debris flow erosion, deposition and property changes. Geosci. Model. Dev. 2015, 8, 829–844. [Google Scholar] [CrossRef] [Green Version]
- Schraml, K.; Thomschitz, B.; McArdell, B.W.; Graf, C.; Kaitna, R. Modeling debris-flow runout patterns on two alpine fans with different dynamic simulation models. Nat. Hazards Earth Syst. Sci. 2015, 15, 1483–1492. [Google Scholar] [CrossRef] [Green Version]
- Luino, F.; Turconi, L.; Petrea, C.; Nigrelli, G. Uncorrected land-use planning highlighted by flooding: The Alba case study (Piedmont, Italy). Nat. Hazards Earth Syst. Sci. 2012, 12, 1–18. [Google Scholar] [CrossRef] [Green Version]
- Wang, Y.; Nie, L.; Zhang, M.; Wang, H.; Xu, Y.; Zuo, T. Assessment of Debris Flow Risk Factors Based on Meta-Analysis—Cases Study of Northwest and Southwest China. Sustainability 2020, 12, 6841. [Google Scholar] [CrossRef]
- Notti, D.; Giordan, D.; Cina, A.; Manzino, A.; Maschio, P.; Bendea, I.H. Debris Flow and Rockslide Analysis with Advanced Photogrammetry Techniques Based on High-Resolution RPAS Data. Ponte Formazza Case Study (NW Alps). Remote Sens. 2021, 13, 1797. [Google Scholar] [CrossRef]
- Roccati, A.; Paliaga, G.; Luino, F.; Faccini, F.; Turconi, L. GIS-Based Landslide Susceptibility Mapping for Land Use Planning and Risk Assessment. Land 2021, 10, 162. [Google Scholar] [CrossRef]


| Date | Number of Events | Intensity |
|---|---|---|
| Ante 1850 | 6 | H to VH |
| 1851–1900 | 3 | H to VH |
| 1901–1950 | 1 | H |
| 1951–2000 | 5 | M to VH |
| Post 2000 | 1 | L |
| Years | Data Description | Data Source/Archive |
|---|---|---|
| 1954 | Stereoscopic aerial images B/W of T. Stura valley | CNR-IRPI Archive |
| 1963 | Stereoscopic aerial images B/W of Piedmont Region | CNR-IRPI Archive |
| 1975 | Stereoscopic aerial images B/W of Piedmont Region | CNR-IRPI Archive |
| 1991 | Stereoscopic aerial images B/W of Piedmont Region | CNR-IRPI Archive |
| 2000 | Stereoscopic aerial images B/W–2000 flood event effects in the Piedmont Region | CNR-IRPI Archive |
| 2010 | Stereoscopic aerial images—Infrared | Piedmont Region webgis |
| 2009–2011 | Stereoscopic aerial images—Shadowed relief | Piedmont Region webgis |
| 2016 | Stereoscopic aerial images color—Flood event effects in Piedmont Region | Piedmont Region webgis |
| 2021 | Satellite images | GoogleEarth |
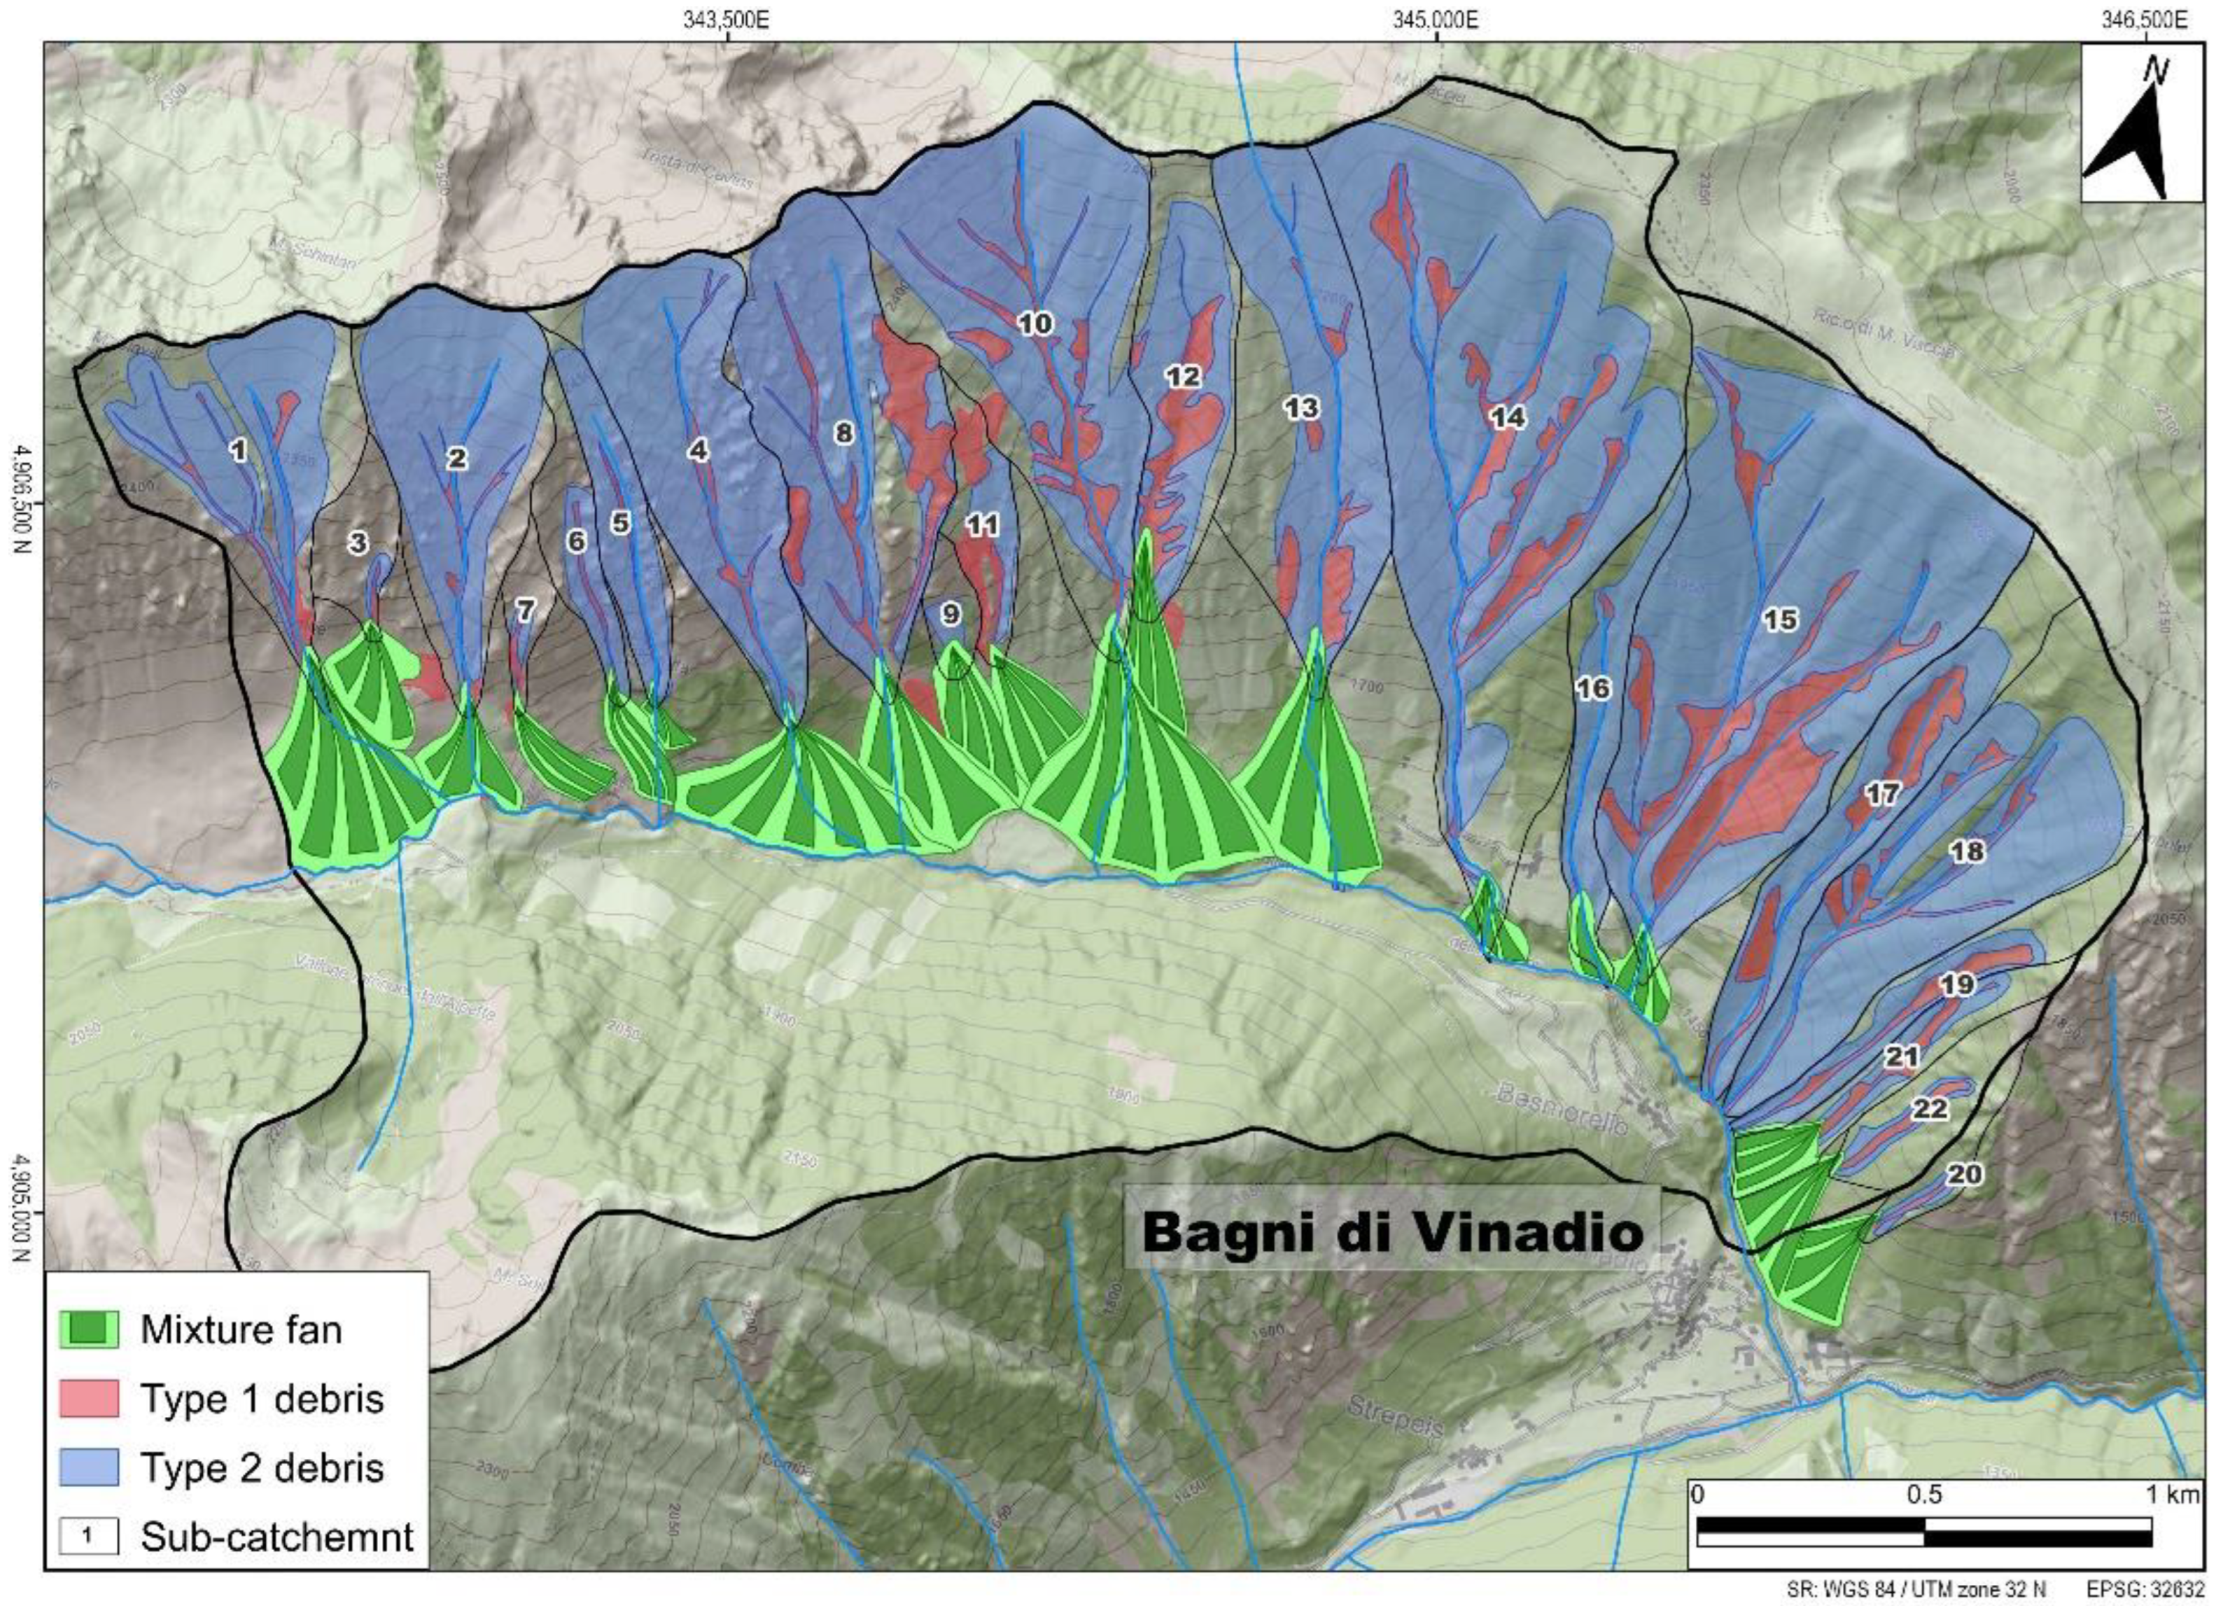
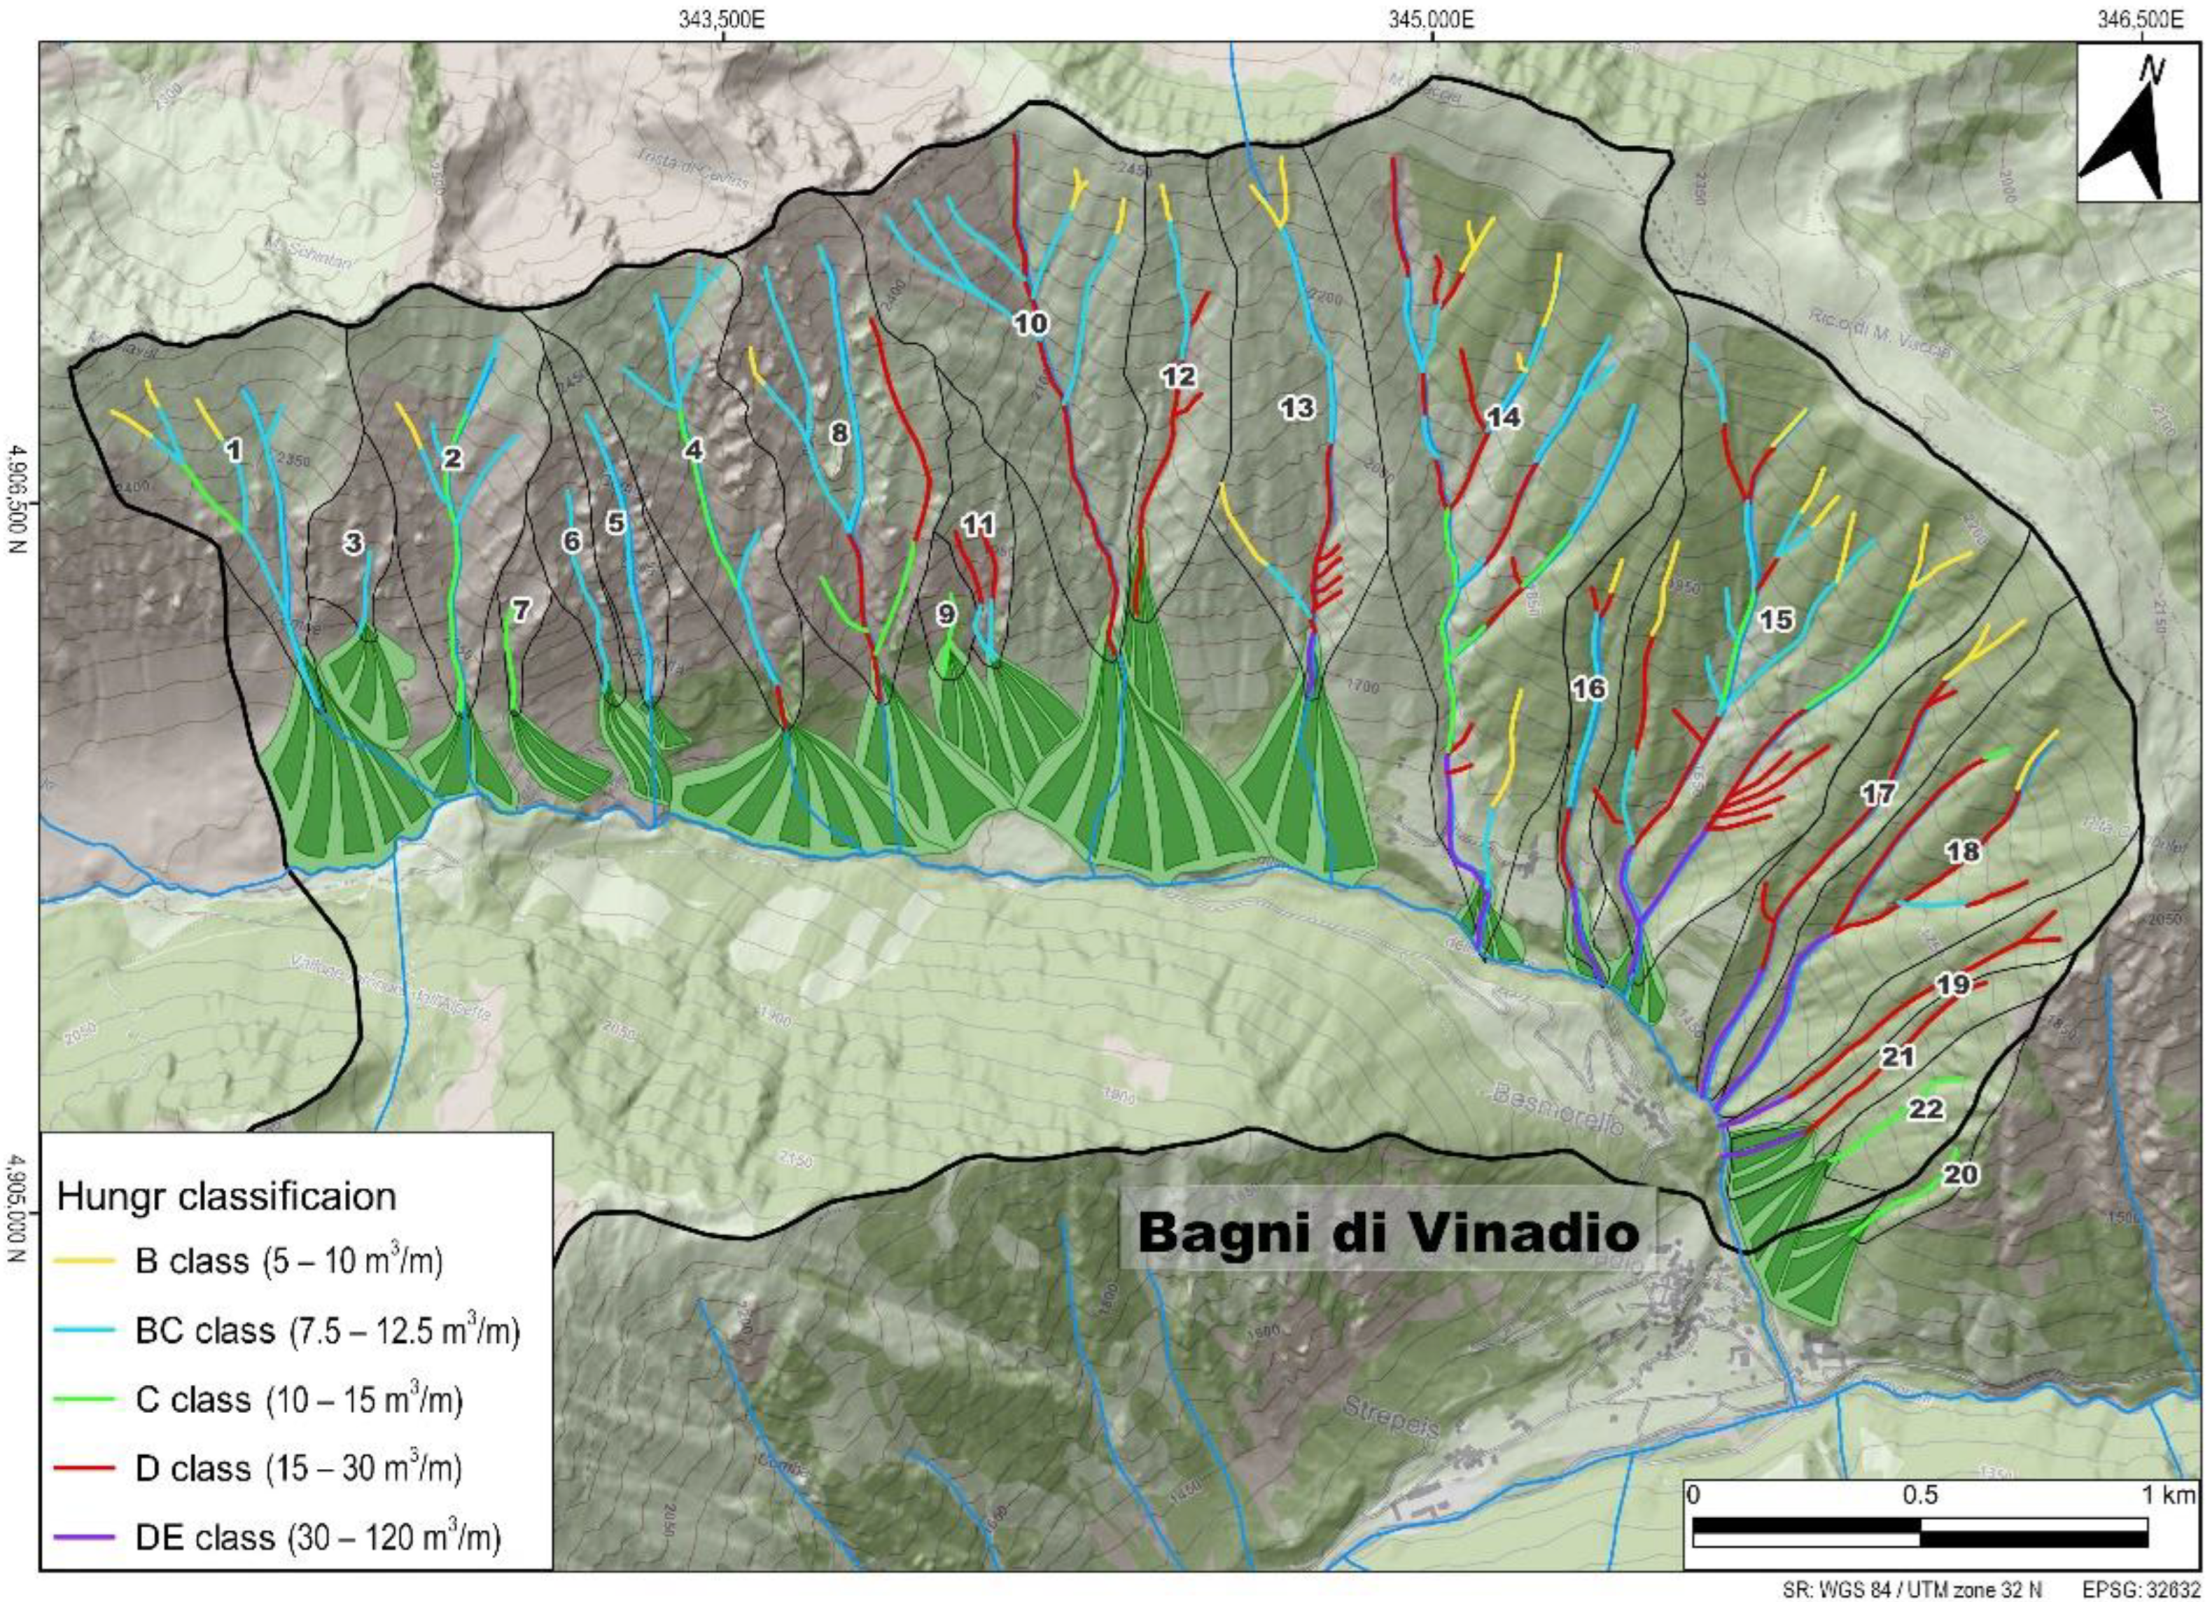
| Catchment Number (See Figure 3) | Effective Area (km2) | Average Slope % |
|---|---|---|
| 1 | 0.353 | 79.17 |
| 2 | 0.316 | 77.88 |
| 3 | 0.071 | 89.92 |
| 4 | 0.367 | 97.83 |
| 5 | 0.118 | 106.37 |
| 6 | 0.092 | 106.09 |
| 7 | 0.036 | 90.13 |
| 8 | 0.461 | 93.20 |
| 9 | 0.039 | 101.87 |
| 10 | 0.569 | 80.95 |
| 11 | 0.085 | 93,87 |
| 12 | 0.227 | 76.95 |
| 13 | 0.395 | 76.34 |
| 14 | 1.072 | 70.33 |
| 15 | 0.899 | 72.36 |
| 16 | 0.129 | 71.25 |
| 17 | 0.232 | 70.47 |
| 18 | 0.449 | 73.48 |
| 19 | 0.122 | 73.36 |
| 20 | 0.044 | 87.83 |
| 21 | 0.098 | 75.49 |
| 22 | 0.094 | 80.99 |
Publisher’s Note: MDPI stays neutral with regard to jurisdictional claims in published maps and institutional affiliations. |
© 2022 by the authors. Licensee MDPI, Basel, Switzerland. This article is an open access article distributed under the terms and conditions of the Creative Commons Attribution (CC BY) license (https://creativecommons.org/licenses/by/4.0/).
Share and Cite
Turconi, L.; Tropeano, D.; Savio, G.; Bono, B.; De, S.K.; Frasca, M.; Luino, F. Torrential Hazard Prevention in Alpine Small Basin through Historical, Empirical and Geomorphological Cross Analysis in NW Italy. Land 2022, 11, 699. https://doi.org/10.3390/land11050699
Turconi L, Tropeano D, Savio G, Bono B, De SK, Frasca M, Luino F. Torrential Hazard Prevention in Alpine Small Basin through Historical, Empirical and Geomorphological Cross Analysis in NW Italy. Land. 2022; 11(5):699. https://doi.org/10.3390/land11050699
Chicago/Turabian StyleTurconi, Laura, Domenico Tropeano, Gabriele Savio, Barbara Bono, Sunil Kumar De, Marco Frasca, and Fabio Luino. 2022. "Torrential Hazard Prevention in Alpine Small Basin through Historical, Empirical and Geomorphological Cross Analysis in NW Italy" Land 11, no. 5: 699. https://doi.org/10.3390/land11050699