Article

Exploring Multiscale Influence of Urban Growth on Landscape Patterns of Two Emerging Urban Centers in the Western Himalaya

by
Sonali Sharma
1,2,*,
Pawan Kumar Joshi
1,3,* and
Christine Fürst
2
1
School of Environmental Sciences, Jawaharlal Nehru University, New Delhi 110 067, India
2
Department of Sustainable Landscape Development, Institute for Geosciences and Geography, Martin-Luther-University Halle-Wittenberg, Von-Seckendorff-Platz 4, 06120 Halle (Saale), Germany
3
Special Centre for Disaster Research, Jawaharlal Nehru University, New Delhi 110 067, India
*
Authors to whom correspondence should be addressed.
Land 2022, 11(12), 2281; https://doi.org/10.3390/land11122281
Submission received: 12 November 2022 / Revised: 8 December 2022 / Accepted: 8 December 2022 / Published: 13 December 2022

Abstract

:
The Western Himalaya are experiencing and epitomizing growing urbanization trends due to rapid population and tourism rise across the Indian Himalayan region. The pace and process of urban development in these regions are largely unplanned and unregulated; consequently, the altered landscape composition and configuration are influencing key ecological processes and functions supporting human wellbeing. Existing urbanization research addressing this issue has mainly focused on large urban centers, underrepresenting the potential role of medium-sized cities in sustainable landscape planning. Thus, this study attempted to quantify land use/land cover and landscape pattern dynamics in response to urban growth and expansion in and around two emerging urban centers—Dharamsala and Pithoragarh, Western Himalaya, over the past two decades. The study was split into three temporal periods, and intensity analysis was used to characterize transformational patterns in the city and outer zone of each landscape. The results indicate that, during the T2 and T3 period, the overall LULC dynamics was highest in Dharamsala and Pithoragarh, respectively. The urban development in Dharamsala occurred at the expense of cropland followed by vegetation and forest, while, in Pithoragarh, it occurred at the expense of cropland followed by vegetation loss dominated. Furthermore, the landscape pattern results highlighted the aggregation and homogenization at the city level, with a higher degree of disaggregation, fragmentation, and heterogeneity in outer zone. This paper highlights the importance of transformational patterns based on intensity analysis and landscape patterns to sustainable landscape development and planning. In addition, considering the past to present urban development trajectories, this study purposes a framework for sustainable landscape development in Himalaya for urban planners and policymakers.

1. Introduction

The proportion of the world population living in urban areas was 56.2% in 2020 and is expected to reach 68.4% by the middle of this century. This will mean every four of five people living in urban areas, making urbanization an inevitably transformative force of the 21st century. Being most of the world’s population preferred residing sites while facing a range of socioeconomic and environmental challenges [1,2], globally, urban areas are at the center of the sustainable development stories [3]. The increasing expansion of urban areas with no sign of slowdown has emerged as the most critical anthropogenic force that has brought about profound terrestrial landscape transformation at local, regional [4,5], and global [6,7] scales. Landscape transformations are characterized by evident changes in landscape types and patterns. The changes in landscape types inherit the conversion and loss of highly productive ecosystems, including forested and agricultural lands into agricultural or/and built-up lands, respectively. Concurrently, the dispersed pattern of urban expansion vividly changes the landscape pattern through fragmentation which involves the conversion of single, continuous natural land patches to heterogeneous, discontinuous, and complex mosaics. That is, the fragmented urban landscape contains isolated natural land patches embedded in a matrix of built-up land tissue [8]. Such fragmentation of landscapes has profound negative effects on the ecosystem structure, function, and dynamics [9], thereby disrupting the flow and eventually the paradigm of ‘landscape pattern—ecological processes/functions—ecosystem services—human wellbeing’ [10,11,12]. This means that any disruption in landscape patterns compromises functional integrity by interfering with critical ecological processes supporting human wellbeing [13]. In fragmented landscapes, the key ecological processes, including nutrient, material, and energy cycling [14,15,16,17], are reduced, leading to diminished potential of ecosystem services supply [18]. This results in a range of ecological and environmental issues such as biodiversity loss [15,19], soil erosion [20,21], environmental pollution [1], changed local climatic conditions [4,22], and land degradation [21,23]. Such alterations make urban landscapes ecologically even more fragile and vulnerable. Therefore, while finding the solutions for sustaining the crucial ecosystem processes/functions for urban planning per se, various scholars [12,24,25,26,27] have emphasized understanding the process of landscape pattern changes in and around the urban areas following the principles of landscape ecology.
Quantifying landscape patterns and identifying their linkages with ecological processes lie among the central goals of landscape ecology [10,28,29,30]. It provides the tools, i.e., landscape metrics (LM), which characterize the landscape structure and have been successfully employed as indicators of landscape functions over time [25,31,32]. Urban landscapes are highly dynamic, and their growth dynamics are subject to socioeconomic developments, transitional probabilities of nearby ecosystems, local governance, and planning controls [33]. The dynamicity of urbanization needs both spatial (macro and micro) and longitudinal scale analysis, which invites the need for benchmark data across spatial and temporal scales. In recent decades, remote sensing data with the GIS technique were proven crucially effective in supporting and advancing urban growth dynamics studies by capturing heterogeneity, at both spatial and temporal scales, of land use and land cover (LULC) types and patterns in and around urban areas [34].
In India, urbanization in the Himalaya is a relatively new [35] phenomenon, yet it is rising extensively. Over the past few decades, the entire Indian Himalayan Range (IHR) has undergone significant socioeconomic transformation, where rapid population, mass tourism, road infrastructure, and settlement expansion are accounting for 49% average decadal urban population growth rate, compared to 30.06% national urban population growth rate. The western Himalayan region of IHR epitomizes this extraordinary transformation owing to higher urban population (61.73%) and infrastructural development against the eastern Himalaya (38.27%) [36]. The nature and pace of such urbanization is majorly unplanned and unregulated. Therefore, such increasing numbers, growth rates, and physical extents of urban centers are bottlenecking sustainable development in Himalaya by altering and disrupting the key ecological functions and processes of natural and semi-natural land units. Recently, the literature has considerably grown around the theme of urbanization in the Himalaya [37,38,39,40,41]. However, surprisingly, despite the increased emphasis and adoption of LM to understand the landscape structural changes and their influence on ecosystem functions, few and only large urban centers of the Western Himalayan region [42,43] have been explored under the umbrella of LM. With this, the medium-sized urban centers with substantial population and urban growth rates have remained unexplored. As highlighted by the United Nations urbanization projections [44], medium-sized urban centers need more focus, as most of future urbanization will be taking place in them [45]. This being the case, exploring medium-sized urban centers, especially those undergoing substantial growth and development [45], and their landscape pattern dynamics has huge potential for setting up and shaping the narrative of sustainable landscape and urban development in the Himalaya [46].
Moreover, the application of LM tools in the Himalayan region could be relevant for many reasons. First and foremost, a large proportion of urban centers and their surrounding ecosystems have recently been shaped by anthropogenic activities with natural and semi-natural land units converted into other land units. For instance, Anees et al. [42] reported how rapid urban and agricultural land expansion in Srinagar led to the high fragmentation of landscape structure within and surrounding Srinagar. The findings from Mann et al. [43] also highlighted how the regions around protected forests are under the constant threat of landscape fragmentation due to the raised demand of agricultural land and human built-up infrastructures. Similarly, Munsi et al. [47] also identified the role of urban and agricultural land development in forest fragmentation in the Dehradun forest division, Uttarakhand.
Second, the Himalaya have distinctive ecological processes that need to be maintained for sustaining biological diversity and humanity. It is well documented that the Himalaya, by virtue of its biodiversity and variety of ecosystem services, support millions of people living in their immediate vicinity and billions living away from them. Hence, the Himalaya, like other mountainous systems [48], are indispensable to global sustainable development goals [49,50,51].
Therefore, the process of urbanization and its consequent landscape pattern changes in Himalaya are essential but understudied causes for concern. At the same time, developing an understanding of these changes holds the potential to apply these indicators for ecological research and or planning purposes. The current study, therefore, aims to fulfill and address the knowledge gaps identified and mentioned above with three objectives in two rapidly urbanizing landscapes of the Western Himalaya over the past two decades: (1) to map the spatial pattern of urban development dynamically and determine the variations in intensity and size of its development; (2) to explore the spatiotemporal changes in landscape types; (3) to address the landscape pattern transformation with the evolution of urban growth and expansion.

2. Materials and Methods

2.1. Study Sites

The study was undertaken in two rapidly urbanizing landscapes: Dharamsala (in Himachal Pradesh) and Pithoragarh (in Uttarakhand), both located in the Indian western Himalayan region (Figure 1). The main climate of both study sites is monsoon-influenced humid subtropical (Cfa). The study sites are among the top touristic destinations of their respective states. Hence, tourism is a key component of economic development, while this is concurrently building pressure on natural and semi-natural land units for creating infrastructures and facilities for the continued flow of tourists.
In general, the urban landscapes are multiscale, and the patterns of urban expansion are scale-dependent [52]. Hence, for achieving our intention to comprehensively understand each study site, a spatially nested hierarchical approach was needful for multiscale-level analysis [53,54]. Therefore, the present study was conducted at two scales: city and sub-watershed. For multiscale-level analysis, the Dharamsala study site encompassed an area of 311 km2 which included Dharamsala city (27.6 km2) and its sub-watershed (with an additional 1 km2 buffer). The shape of the Dharamsala sub-watershed is elongated. The sub-watershed area footprint of Dharamsala is confined within 32.14° N–32.34° N latitude and 76.23° E–76.43° E longitude and is centrally located in northeast Kangra district of Himachal Pradesh. The elevation in the Dharamsala sub-watershed falls gradually from north to south, characterized by steeply sloped mountains in the upper region, hills in the middle region, and plains in the lower region, thus constraining urban development in the upper region. Hence, over the past two decades, the speed of the urban expansion process has been evidently faster in the lower and middle regions of sub-watershed than the upper region. The focal urban center, Dharamsala, has experienced immense population and household growth (18.07% and 30.95%, respectively) compared to the mountainous urban centers of Himachal Pradesh at similar altitude. However, the city experienced even more pronounced growth by 2015, with the population reaching 53,543 compared to 22,586 in 2011 (more than a twofold increase) [55]. The increasingly rapid economic development, with mass tourism and urbanization, in Dharamsala has also led to rapid urban developments in nearby villages. Additionally, the presence of the religious leader Dalai Lama attracts many domestic and international tourists to Dharamsala. The city is the center of the Tibetan exile world in India and serves as the Central Tibetan Administration.
The area of the Pithoragarh study site was 90.74 km2 which included Pithoragarh city (2.77 km2) and its sub-watershed (with an additional 1 km2 buffer). The shape of Pithoragarh sub-watershed is circular. The sub-watershed area footprint of Pithoragarh is located within latitudes 29.55° N–29.63° N and longitudes 80.16° E–80.29° E. It lies on the southwestern border of the eponymous district in Uttarakhand state. The elevation within the sub-watershed ranges between 1369 m and 2323 m. Here, the steeply sloped mountains dominate the northwestern and eastern parts, while plain areas are in the central part of the sub-watershed. Most of the urban development over the past two decades has occurred in and around the central, relatively plain area of the sub-watershed. Similar to Dharamsala, Pithoragarh is ranked first among urban centers situated at similar altitude in Uttarakhand state in terms of population and household growth (24.6% and 37.7%, respectively, over a decade) (Census of India, 2001; 2011). The study site was situated in Saur valley, surrounded by forest adobes; the city is called ‘Little Kashmir’. The most attributable reasons for Pithoragarh’s urban development are as follows (i) consolidated centrality, i.e., being the headquarters of the Pithoragarh district, several facilities including healthcare, education, and employment opportunities are concentrated in and around the urban center; (ii) the Saur valley is among the largest semi-urban valley of Uttarakhand state with scope for further expansion unlike other valley-situated towns such as Nainital; (iii) the expansion of Pithoragarh army cantonment. Among all these key factors, economic centrality is the dominant factor of rapid LULC change in the landscape.

2.2. Data Acquisition and Preprocessing

In the present study, the high-spatial-resolution (Sentinel 2a, 10 m and ASTER, 15 m) multitemporal remotely sensed satellite data were used to map the urban dynamics of each study site at four timepoints spanning the past two decades (2001–2019). The time corresponds to the period of rapid urbanization at both study sites since the initialization of their socioeconomic transformations. The satellite data were downloaded from the USGS (United States Geological Survey) web portal (http://earthexplorer.usgs.gov/ (accessed on 23 May 2020)), and the spatial coordinate system for Dharamsala and Pithoragarh was projected to WGS_1984_UTM_43N and WGS_1984_UTM_44N, respectively. Other data included were the city administrative map and CARTOSAT-DEM (30 m) elevation data. The city administrative maps were digitized from the Dharamsala municipal corporation [55] and Pithoragarh district Census book [56]. The CARTOSAT-DEM data were retrieved from Bhuvan, an Indian geo-platform.
The satellite image selection criteria were as follows: (a) the months with easy segregation and detection of vegetation types since a variety of forest types and agricultural land were prominent LULC types in both study sites; (b) to attain high-quality data, the images with minimum cloud cover were selected. On the basis of these fundamentals, all images were acquired from March to April. Table S1 (see Supplementary Materials) highlights further details on the date of image acquisitions, path/row of the images, and their respective satellite sensors.

2.3. Image Classification and Accuracy Assessment

Since the landscapes were big and highly heterogeneous, multitemporal and high-spatial-resolution Google Earth images, the existing literature [52], field survey data, and regional characteristics of landscapes were used to increase the accuracy of classification. The Pithoragarh landscape was divided into eight LULC classes: oak, pine, vegetation, waterbody, barren land, cropland, open area, and built-up land. Similarly, the Dharamsala landscape was divided into 12 LULC classes: deodar, oak, pine, oak mixed, pine mixed, mixed forest, vegetation, barren land, glaciated region, cropland, open area, and built-up land. For a description of each LULC class, see Table S2.
The satellite imageries were classified by employing the maximum likelihood classification (MLC), based on discriminant analysis, a supervised classification technique. Furthermore, to evaluate the accuracy of LULC classification, 250 random points were generated using a stratified random sampling approach and were examined using satellite imageries, Google Earth images, and field survey data (reference points). Furthermore, the tabulated data (confusion error matrix) obtained from a comparison between the reference points and actual classified map were used to assess the accuracy of LULC map for each year.

2.4. Intensity and Stationarity Analysis in LULC Transitions

Intensity and stationarity analysis is a top-down spatial hierarchical approach of LULC change detection [57,58]. It observes LULC change intensities at three levels: time intervals, category, and transition, for each period. The observed LULC change intensity is compared with a corresponding uniform and hypothetical LULC change intensity that would occur if the annual speed of the changes was evenly distributed throughout the spatiotemporal extent.
Analysis at the time interval level reflects the overall change in each time interval and identifies intervals characterized with fast or slow changes, by comparing the annual rate of change S ( t ) during each interval with the uniform rate of change U spanning all intervals. Following Equations (1) and (2), S ( t ) and U are computed. The even distribution of S ( t ) over the whole time interval signifies stable/stationary changes; otherwise, unstable changes are indicated.
S ( t ) = { j = 1 J [ ( i = 1 J C t i j ) C t j j ] } / [ j = 1 J ( i = 1 J C t i j ) ] Y t + 1 Y t × 100 % .
U = t = 1 T 1 { j = 1 J [ ( i = 1 J C t i j ) C t j j ] } / [ j = 1 J ( i = 1 J C t i j ) ] Y T Y 1 × 100 % .
Analysis at the category level helps in determining the change intensities of each LULC category (type) and identifies the variations in change intensities among the LULC categories in each time interval. It employs category level loss ( L t j ) and gain ( G t j ) intensities to determine whether loss or gain during each interval is relatively dormant or active compared to all intervals (U). The even distribution of L t j or G t j corresponding to U signifies stable changes; otherwise, unstable changes are indicated. Category levels L t j and G t j during the interval t can be obtained using Equations (3) and (4).
G t j = { ( i = 1 J C t i j ) C t j j } / ( Y t + 1 Y t ) i = 1 J C t i j × 100 % .
L t j = { ( j = 1 J C t i j ) C t i i } / ( Y t + 1 Y t ) j = 1 J C t i j × 100 % .
Analysis at the transition level focuses on the transition of a particular LULC category and describes the variations in intensity with which the gain of a particular category transitions from other categories in a time interval. For a specific land category n, R t i n represents the transition intensity from category i to category n in a particular time interval t, and W t n is the mean transition intensity over that time interval. Both these are computed using Equations (5) and (6). W t n is computed with an assumption that category n is increasing over the entire time period. Similarly, for a specific land category m, Q t m j (Equation (7)) represents the transition intensity from category m to category j in a particular time interval, and V t m (Equation (8)) is the mean transition intensity over that time interval, computed with an assumption that category m is decreasing over the entire time period. The even distribution of transition intensity of each LULC category when compared with U signifies a stable change. Otherwise, it is unstable.
R t i n = C t i n / ( Y t + 1 Y t ) j = 1 J C t i j × 100 % .
W t n = [ ( j = 1 J C t i n ) C t n n ] / ( Y t + 1 Y t ) j = 1 J [ ( i = 1 J C t i j ) C t n j   ] × 100 % .
Q t m j = C t m j / ( Y t + 1 Y t ) i = 1 J C t i j × 100 % .
V t m = [ ( j = 1 J C t m j ) C t m m ] / ( Y t + 1 Y t ) i = 1 J [ ( j = 1 J C t i j ) C t i m   ] × 100 % .
In order to investigate the effects of urban expansion on surrounding forest types as a whole, we combined oak, pine, deodar, oak mixed, pine mixed, and mixed forest into one forest class. Then, using the excel sheet developed and provided by [57], the transition matrices at two levels, city and outer zone, for Dharamsala (2002–2010—T1, 2010–2016—T2, and 2016–2019—T3) and Pithoragarh (2001–2008—T1, 2008–2016—T2, and 2016–2019—T3) were inserted for intensity analysis at all three levels described above.

2.5. Landscape Metrics for Measuring Landscape Structural Dynamics

Landscape metrics are widely adopted tools for quantitatively describing the regional landscape pattern changes. The information provided by any single metric is highly limited; therefore, for comprehensive information synthesis, according to the diversity of LULC types, a series of landscape metrics were selected reflecting area, density, aggregation, shape, and diversity (Table 1). Results from earlier studies have recognized the importance of selected LMs for understanding urban growth dynamics [27,48,59]. These metrics can capture both class- and landscape-level landscape composition, patch shape, and aggregated landscape characteristics.
The scale-dependent nature of landscape metrics has been widely investigated by many scholars [53,54,60], i.e., more accurate results can be obtained by understanding and analyzing how landscape metrics behave on different scales. Therefore, to limit the systematic bias by avoiding the interference of multiscale interactions, the selected landscape metrics were analyzed at three different scales, 100 × 100 m, 250 × 250 m, and 500 × 500 m, in both study sites. After the preliminary test of the effect of varying scale on the landscape metrics, the scale of 100 × 100 m and 250 × 250 m was chosen for Pithoragarh and Dharamsala, respectively, considering the size of respective cities, and these scales also retained more details of the landscape pattern than any of the larger or smaller scale sizes analyzed. The LM quantification was performed in RStudio with the ‘landscapemetrics’ package [61] on the basis of the classified LULC maps generated and described in Section 2.3. The package ‘landscapemetrics’ analyzes the categorical landscape pattern while complying with the definitions of FRAGSTATS suite, and it additionally implements newer metrics on the basis of recent literature developments [62,63]. Each metric was calculated according to the eight-cell neighbor rule [32]. For a detailed understanding and calculation formulas of each landscape metric, please refer to [64].

3. Results

In this section, we quantify the impact of urbanization on landscape composition and configuration. Then, we describe three types of LULC transitions using intensity and stationarity analysis that are crucial for detailed change detection against the traditionally recognized transition matrix approach. Lastly, we show the evolution of landscape patterns with urban expansion within and beyond city limits.

3.1. LULC Classification

3.1.1. Spatial Distribution of LULC Types and Significant changes

The classified LULC maps of Dharamsala and Pithoragarh over the past two decades are displayed in Figures S1 and S2. The overall classification accuracy of each LULC map was assessed between 89.64% and 95.31%. In both study sites, barren land, cropland, and oak species laden forested areas were the predominant LULC types over the study period. The spatial distribution of the forested lands, barren land, and waterbodies was mostly undisturbed, while the gain in the built-up land during the study period resulted in a change in the spatial distribution of other LULC types.
Figure 2 illustrates the proportional distribution of each classified LULC type at the city and outer zone levels of Dharamsala and Pithoragarh. Comparing the two results, it can be seen that the proportional changes in LULC types were not larger at the outer zone level in general, but their spatiotemporal differences were pronounced as depicted in Figures S1 and S2. The proportional changes in cropland, vegetation (loss), and built-up (gain) LULC types were more obvious than other LULC types, at both the city and the outer zone levels of both study sites. Temporally, the proportional decrease in cropland was highest at the city level with a value of 11.59% and 27.17%. However, it stands out in Figure 2 that areal changes in cropland were more evident in the outer zone with a loss of 5.07 km2 and 4.54 km2 in Dharamsala and Pithoragarh, respectively. Similar trends were also observed in the vegetation LULC type, which observed a proportionally higher decrease (5.02% and 6.96%) at the city level, in contrast to a higher net areal loss of 4.03 km2 and 1.52 km2 in the outer zones of Dharamsala and Pithoragarh, respectively. Likewise, the proportional increase in built-up LULC type was higher at the city level of Pithoragarh (34.43%) followed by Dharamsala (10.49%). Moreover, the net areal increase was more evident in the outer zone with a value of 5.14 km2 followed by 4.61 km2 against the city-level increase values of 0.95 km2 and 2.84 km2 in Pithoragarh and Dharamsala, respectively.

3.1.2. Spatiotemporal Dynamics of Urban Expansion

Figures S1 and S2 illustrate the overall spatial extent of urban developments in Dharamsala and Pithoragarh over the past two decades. As per our results, the built-up land area experienced around two- and fivefold increases in Dharamsala and Pithoragarh, respectively, during the study period. The hot zones for urban expansion were around the respective city boundaries. Interestingly, in both study sites, the built-up land expansion in T2 followed by T3 of respective sites tended to spread and grow significantly outside the city boundaries and in all directions. For instance, in Pithoragarh, by the year 2019, several built-up land groups gradually emerged and formed by connecting and aggregating with existing built-up land groups, thereby encompassing almost all directions of the sub-watershed. However, in Dharamsala, the majority of built-up land groups are concentrated around the city boundary, while various small built land groups with growing connections in the western direction newly emerged by the year 2019.

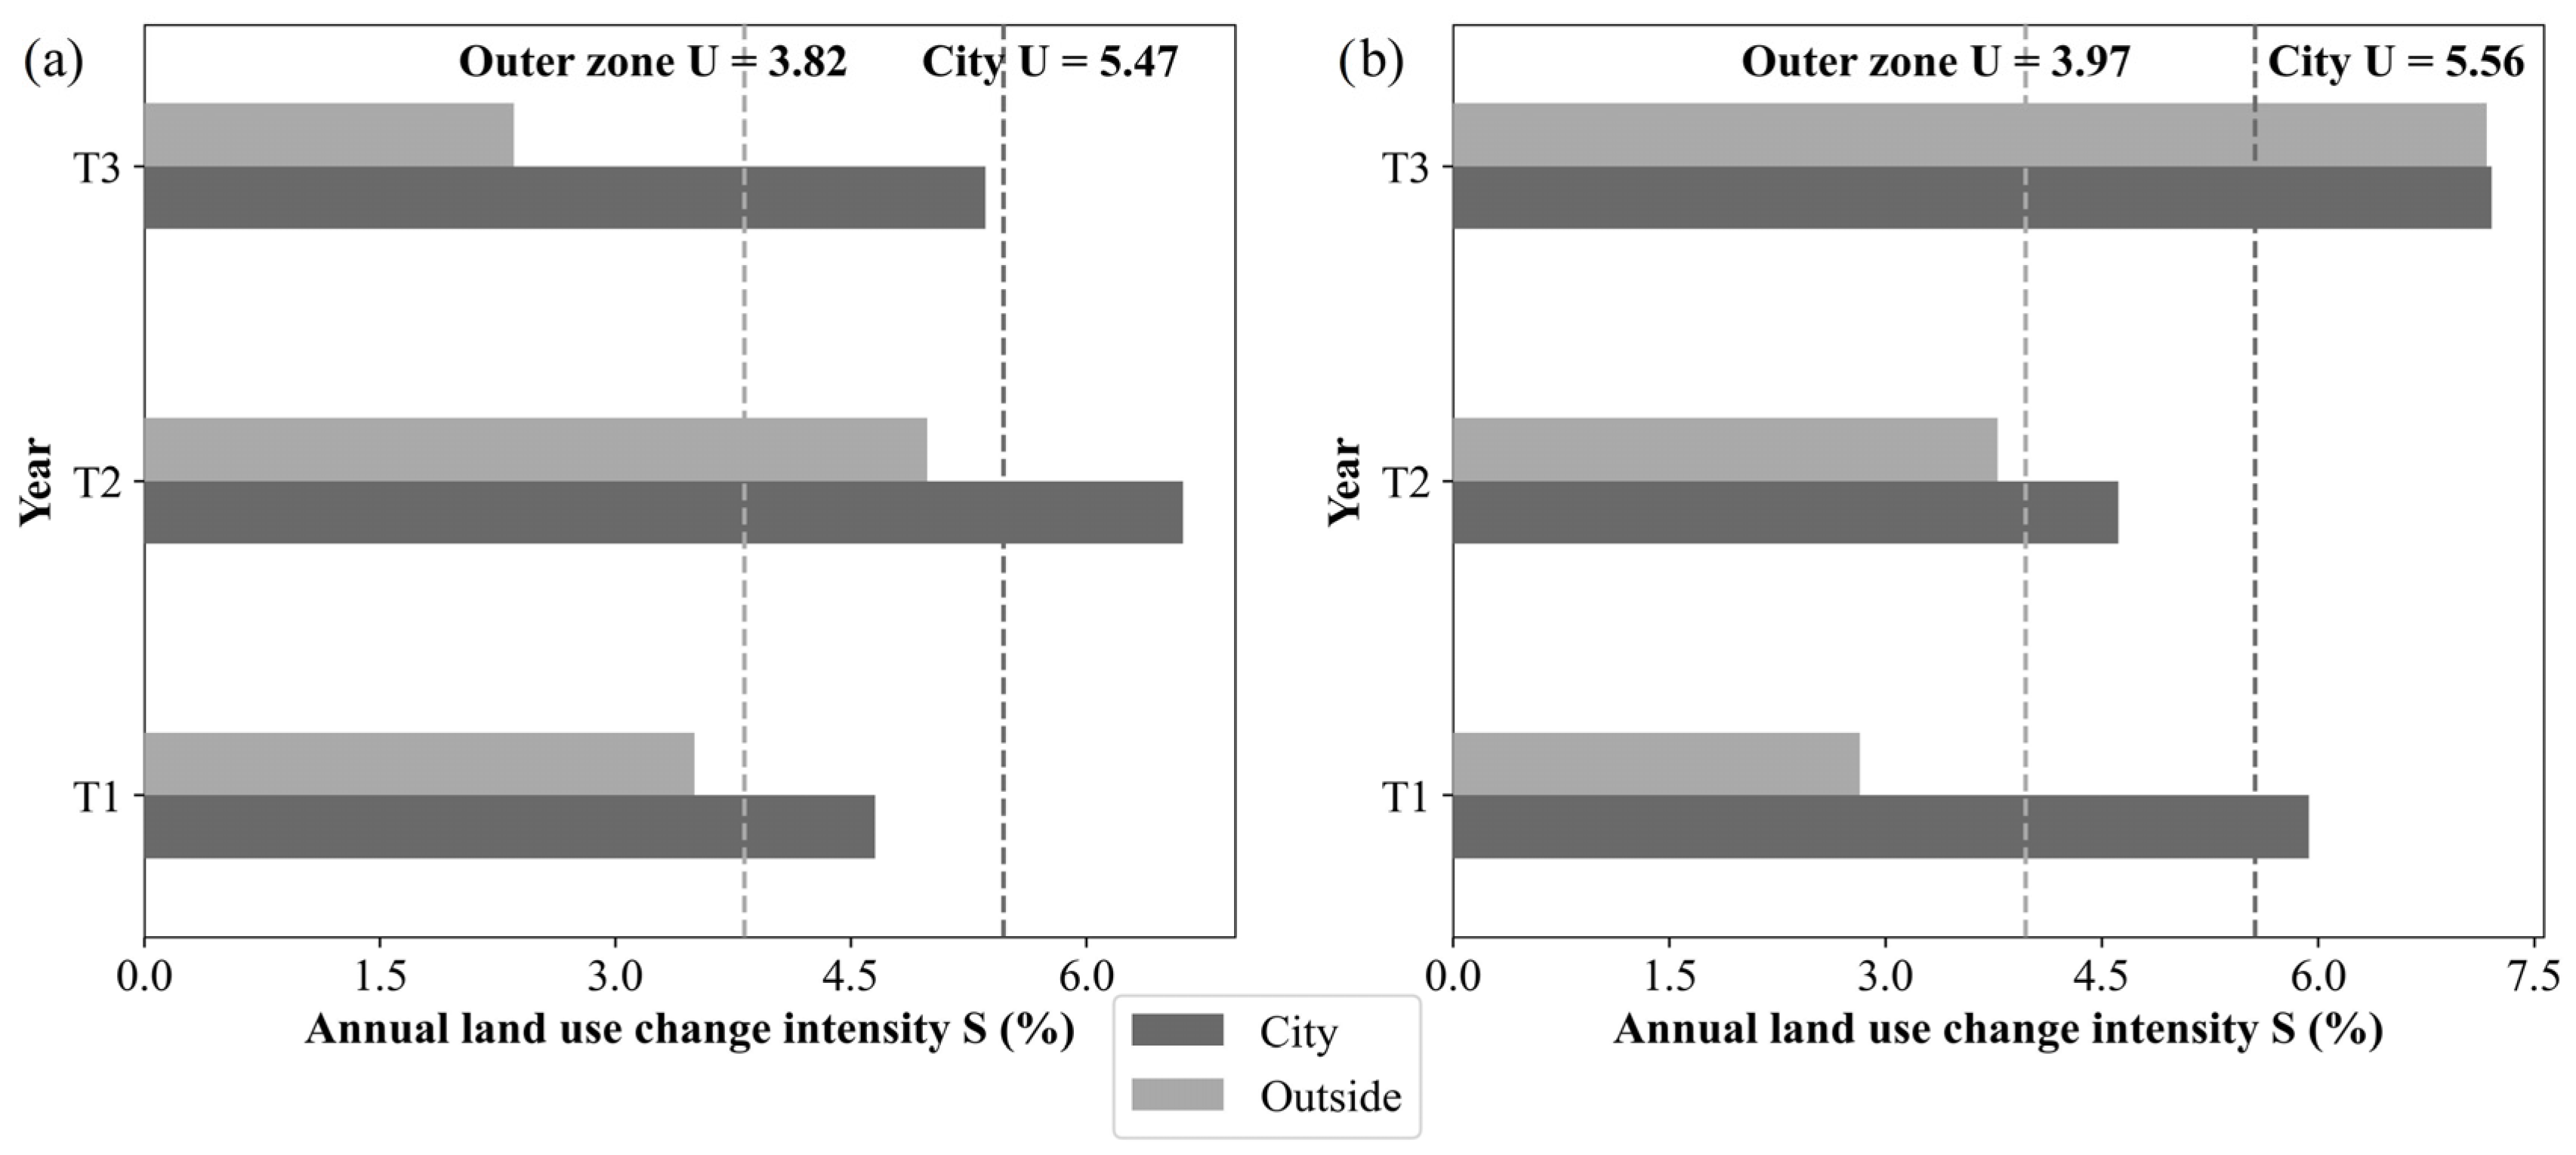
3.2. Intensity Analysis

3.2.1. Interval Level

In Dharamsala, the annual land-use change intensity (S) was greater than the uniform intensity (U) from 2010 to 2016 (T2) in both the city and the outer zone, indicating the fastest land-use changes at each level of the urban hierarchy during the T2 period. During the T3 period (2016–2019), S was significantly smaller in outer zone (2.36), while, in the city, it was closer (5.36) to U (5.47), indicating even greater LULC dynamics within the city (see Figure 3). This implies that the rate of land-use changes within the short 3 year period (T3) was much faster than the rate of land-use changes in the previous two periods. The most attributable reasons for the observed higher S during T3 at the city level are as follows: (a) in 2015, the Smart city project of the Government of India issued a decision on Dharamsala as the first city of state Himachal Pradesh to be selected, even edging out state capital Shimla; (b) being announced as the winter capital of Himachal Pradesh state in the year 2017. These pioneering decisions, along with tourism and road infrastructural growth and expansion, triggered overall dramatic urban development from 2010 to 2019.
In Pithoragarh, S was observed to increase along each period in the outer zones with the highest value (7.17) observed in the T3 period compared to just 2.82 in T1. While, at the city level, S was observed to be highest in the T1 and T3 periods, S in the outer zone level was equivalent in the T3 period, indicating a similar level of urban development-driven changes beyond city limits. Even during the T2 period, S in the outer zone (3.59) was significantly closer to U (3.97), signifying a higher degree of LULC dynamics in the outer zone. The smaller administrative limits of the city and the large expanse of semi-urban Saur valley offer enough scope and space for urban developments in Pithoragarh landscape. Additionally, the rapid increase in socioeconomic developments in Pithoragarh is the most referable reason for such observed trends of land-use changes.

3.2.2. Categorical Level

Figure 4 illustrates the categories that have undergone active and dormant changes in terms of intensity over the study period. Forest is the only category whose changing intensity was less than uniform in both study sites during all time intervals, indicating rather dormant changes, except for active loss in the Dharamsala outer zone during T1. On the other hand, for both levels during all intervals, open area, vegetation cropland, and barren land recorded intensively active gains or/and losses, unlike built-up land, which recorded intensive active gains with dormant losses at both study sites. Area occupied by the open area category was less than 2% of the total area of study sites; however, urban developments in the regions affected the changes in open area, with most resulting in simultaneous intensive active gains and losses. Likewise, the vegetation category recorded intensively active losses in all time intervals with dormant to fewer active gains. It needs to be noted that, even though the change intensity of the cropland category has been relatively flat, its change in area loss was more significant than other categories. In contrast to the above categories, the change intensity of the built-up area was always greater than uniform for outer zones, while a monotonically declining trend in change intensity was observed at the city level over each time interval reaching below uniform intensity by T3. In Pithoragarh, the active change intensity of waterbody might have been due to overutilization and climatic conditions. Additionally, the active gains in cropland in outer zones can be attributed to the active loss of barren land, as also evident in Figure S2.

3.2.3. Transitional Level

Since the aim of our analysis considered urban expansion-driven changes, this research primarily focused on the transitions to built-up land. The transition intensities from cropland, vegetation, forests, waterbody, and open area to built-up LULC for the three time intervals are illustrated in Figure 5. As per the transitional intensity change of built-up land at the Dharamsala city level, the active transitions to built-up land were mainly from open area, cropland, and vegetation LULC types, and the uniform intensity also observed an increment in T2 and T3 against T1. As for the open area, the annual change intensities were all above the uniform intensity and the highest among all transitions at both levels of assessment. For the three periods, the transitions from open area followed by vegetation and cropland to built-up land were active with the largest intensities during the T2 and T3 periods at both levels. As for barren land, the transition intensity was closer to uniform intensities at the Dharamsala city level, which signifies the potential of barren land (majorly comprising hilly terrains and dry riverbed) as a target in future urban developments. Lastly, as for forest LULC, the transitions to urban land remained dormant across the study periods. However, the rapid urban development during T2 period promoted its transition to built-up land at city level. Even though a similar transition was not relatively significant in the outer zone of Dharamsala, the T2 period experienced a similarly higher transition intensity. The large transitions from forest to built-up land can be somewhat attributed to the increasing extent of urban and road infrastructural developments in the forested regions in the wake of increasing forest stays for tourism industries.
At the Pithoragarh city level, the expansion of built-up land targeted open area during T1 and T3 the most, while, during the most active period T2, cropland was the most active target for transitions. However, in the outer zone, open area was the most actively targeted LULC type for built-up transitions, followed by cropland and vegetation. In the case of Pithoragarh, forest LULC type was the most dormant LULC across the study period, which, to a certain extent, signifies the role of the Indian forest act, 1927, under which the state government recognized two reserved forests, namely, Chandak and Saurlekh.

3.3. Temporal Landscape Metrics

3.3.1. Variation in Landscape-Level Landscape Patterns

The quantified temporal series of landscape metrics for Dharamsala and Pithoragarh at the city and outer zone levels are displayed in Figures S3 and S4. Both figures show that changes in selected metrics were obvious at both studied levels of the landscape. For instance, in Dharamsala, the AI and SHP_MN generally decreased, whereas PD, LPI, LSI, and SHDI increased monotonically, in descending order, at both levels of assessment during the study period. Similar trends were also observed in Pithoragarh except for the decreased LPI at both levels and increased SHP_MN after the year 2008.
A major increase in landscape fragmentation index PD was observed in Dharamsala city, where it was increased by 630%, followed by Pithoragarh with a value of 217%, while the AI index showed the highest declining trend in the city of Dharamsala (−20%) followed by the outer zone of Dharamsala (−11%). In the case of Pithoragarh, the AI index decreased by 9% and 6% in the city and outer zone, respectively. Such a lesser difference between the two levels signifies a higher degree of fragmentation in the outer zone of Pithoragarh. This is evident in the equivalently increased diversity index, SHDI, and complexity index, LSI, at both levels in Pithoragarh, i.e., 19% and 78% in the city, and 18% and 80% in the outer zone. Meanwhile, Dharamsala city recorded a higher increase (39%) in SHDI, followed by the outer zone (7%), indicating that, in Dharamsala city, the landscape pattern had become relatively more heterogeneous and fragmented than the outer zone. Since the earliest year of the study period had cropland as the largest patch type at the city level of both study sites and the outer zone of Pithoragarh, the urban development led to its shrinkage and fragmentation, leading to the observed decline in the dominance index, LPI. However, in the case of the Dharamsala outer zone, LPI increased from 10.27 to 16.72 as the dominant patch (barren land and glacier) became more obvious in 2019. The decrease in SHP_MN was most evident in Dharamsala city and the outer zone of Pithoragarh. Overall, with the urban growth and expansion, the landscape fragmentation in Pithoragarh became more obvious, gaining heterogeneity at both levels, i.e., city and outer zone, while, in Dharamsala, the heterogeneity was majorly enhanced at the city level.

3.3.2. Variation in Class-Level Landscape Patterns

Figure 6 shows the varying built-up class-level landscape patterns in 250 × 250 m fishnet grids of Dharamsala. In general, over the study period, AI revealed that the built-up area was highly aggregated within and around the city. However, from the spatiotemporal variation perspective, the AI continued to decline, indicating isolated growth of newer built-up areas. As shown, in 2010 and 2016, the spatial extent of high AI was distributed across the landscape; however, by 2019, AI decreased for most parts of the landscape, indicating isolated development of newer built-up areas. PD, however, was opposite to AI, with higher values beyond city boundaries, demonstrating a tendency of expansion and a higher degree of fragmented growth beyond the city core. Notedly, the decrease in PD and AI values during urbanization demonstrates that the city core area continued to expand. In outer zones, however, positive PD values increased, especially in 2016, due to considerably large-scale urban development as observed in Section 3.2.1. The monotonically increasing trend and variations in LSI values across the landscape revealed increased irregularities and disaggregation due to and among the newly developed built-up patches over the study period. The similar range of LSI values at both the city and the outer level indicates a comparable degree of shape irregularity even beyond city limits. Similar findings were observed with SHP_MN, indicating a similar level of geometrical complexities across the landscape. Our observations indicate that increasing trends of shape complexity were observed in the western direction of landscape, while, within the city boundary, high SHP_MN value grids changed to lower SHP_MN value grids, indicating more compact growth in the core. The LPI, representing the dominance of built-up patches, revealed the prominence of the built-up areas in the city core and eastern part of the landscape in 2002. Over the course of study, the majority of the landscape area remained unchanged in LPI. In comparison to 2002, the years 2016 and 2019 indicated extensive urban growth and, hence, expansion of LPI in the eastern direction from the city center, leading to the integration of far eastern built-up areas within the city core.
Figure 7 shows the varying built-up class level landscape patterns in 100 × 100 m fishnet grids of Pithoragarh. As shown, the higher AI indicated that the built-up area was more aggregated in nature in 2001 and 2008 at both levels, but the high LULC change intensity in the following years caused fragmentation of the landscape, resulting in lowered AI, implying the disaggregated development of newer built-up patches. The AI pattern also revealed that built-up areas intensively aggregated in all directions of the Pithoragarh landscape. Similar to Dharamsala, PD values were also opposite to AI in Pithoragarh. The random and scattered distribution of high PD values across the landscape in 2016 and 2019 demonstrated a tendency of expansion and a higher degree of fragmentation even beyond the city boundary over the process of urbanization. Over the study period, the increased trend and spatial extent of higher LSI values in the majority of the landscape parts indicated the least compact form of urban development. However, the dissimilar range of LSI values between both city and outside level indicated a highly disaggregated form of urban development in the eastern part of outer zones, in contrast to aggregated urban development in the northern part of city. Similar to Dharamsala, we observed that SHP_MN at both city and outer zone levels of the landscape indicated a similar level of geometrical complexities across the landscape. In 2001, the LPI pattern in Pithoragarh clearly indicated urban growth in all directions from the city boundary. However, lowered LPI was observed in 2008 in the eastern and western parts of the outer zone, while increased LPI in the city core indicated compact urban development by 2008. Due to a higher degree of LULC change by the year 2016, we observed larger built-up patches distant in the northeastern direction, which were also connected with city core. The 2019 pattern revealed the establishment of large built-up patches simultaneously connected to the city core at a far distance in the eastern and northeastern parts of the outer zone.
The key difference between urbanization-driven landscape pattern changes of Dharamsala and Pithoragarh, as evident in Figure 6 and Figure 7, was that, over the course of the study period, Pithoragarh experienced scattered yet single-core cluster expansion of built-up land, as evidenced by its positively connected LPI values in all directions around the city boundary, in contrast Dharamsala, where the majority of development was still focused around the city boundary with few eastern grids in the outer zone with increased LPI values. That is, overall, the Dharamsala landscape showed obvious multi-core network expansion with disaggregated growth even beyond the city boundary, while Pithoragarh showed an obvious single-core urbanizing landscape with a higher degree of continuity in urban extent.

4. Discussion

4.1. Spatiotemporal Changes in LULC Types and Landscape Pattern

The present study exemplified the dilemma of rapid urban expansion in and around two rapidly emerging urban centers of Western Himalaya. The topographical constraints in mountainous landscapes limit urban developments to a certain extent and promote heterogeneity in landscape disorders. The results of our study showed that, in both urban landscapes, there existed large spatial and temporal differences in LULC and landscape patterns changes. These changes appeared to be especially distinguished in the outer zones of each urban landscape, and their changing rates were the fastest during the second decade of the study. The development of road infrastructure, the tourism sector, and government-oriented strategies have accelerated the spatial connections and configurations between the main city and surrounding villages. As observed and addressed, significant LULC change in Dharamsala and Pithoragarh, especially recent urban growth in the outer zone at the expense of semi-natural and natural land units, has resulted in a highly fragmented landscape and imbalanced landscape patterns. Specifically, in the case of Dharamsala, several small patches of built-up land were produced by the year 2019, leading to more patches of cropland and forested lands interlaced with the resource-intensive human activity that accompanies urbanization. The urbanization-driven changes in LULC and landscape patterns are complex in nature, and various methods have been developed to understand and elucidate them. Intensity analysis [58,64,65] and landscape metrics change analysis [8,42,48,66] are among the key ones.
Specifically, the time interval intensity analysis revealed the nonuniform nature and rate of LULC changes over two scales of the study. For instance, the rate of land-use change intensity was the fastest during 2010–2016 at both studied scales in Dharamsala, while, for Pithoragarh city, it was fastest during 2001–2008 in the city but during 2016–2019 in the outer zone. Stable transitions reflect the long-term transition trend over any landscape [65] and can be used to guide sustainable landscape development. Therefore, the stable transitions derived from past to present changes among the variety of LULC types can act as an efficient tool for the relevant stakeholders to predict and regulate the extent to which LULC can be changed [65]. Both Dharamsala and Pithoragarh, as tourist destinations, attract people from all over the country, and such intensive tourism influx brings up rapid socioeconomic transformations in the landscape. These transformations have escalated the demand for many natural resources, especially land. As per the results of our study, categorically, the transitions of cropland followed by vegetation and forested land in Dharamsala, and the transitions of cropland followed by vegetation to built-up land in Pithoragarh remained stable over the past two studied decades. Notedly, the dormant transition of forest LULC type in Pithoragarh emphasizes the inseparability of development from top-down policy regulations of the government. These observations imply that, in the short term, these productive LULC types will continue to decrease, and, at their expense, built-up area will continue to increase. Undeniably, the increased urbanity enhances the sustainable development goals (SDGs) in terms of education, health infrastructure, and better living conditions in such topographically challenging landscapes. However, its environmental and ecological impacts on the inherently vulnerable and fragile Himalayan landscape are indispensably irreversible.
Furthermore, following the conclusion of [53,54], the landscape pattern analysis in the present study was carried out at two scales for developing a comprehensive understanding of each study site. Each urban landscape became more uniform at the city level as large increments in built-up areas led to connectivity among them. However, the outer zone level had different patterns. The changes at the outer zone level appeared to be especially distinguished as the landscape became abruptly more fragmented and heterogeneous, and these changes were evidently the fastest during the second decade of the study. As a result, both urban landscapes evolved spatiotemporally from a typical city compact core to a mixture of sprawling, compact, and interconnected morphologies beyond city limits and in the outer zone by 2016 and 2019. Thus, observations from the present study and many other studies [42,67] imply that studies conducted at a single scale may not be sufficient to interpret such peculiar changes.
Additionally, our analysis results reflected that the T2 period (2008–2016 and 2010–2016) and the lower and middle parts of each respective sub-watershed with the most pronounced changes should be taken into consideration by relevant policymakers and stakeholders. Specifically, the LULC and landscape pattern changes in the lower and middle parts of the sub-watershed need to be planned and regulated, and the forest lands of Dharamsala should be protected under the recent trends of rapid urbanization. Furthermore, extra attention paid to the T2 period in future environmental and ecological research on the urbanization in Dharamsala and Pithoragarh could be of great value for managers, planners, and scholars to design sustainably appropriate strategies for future urban developments.

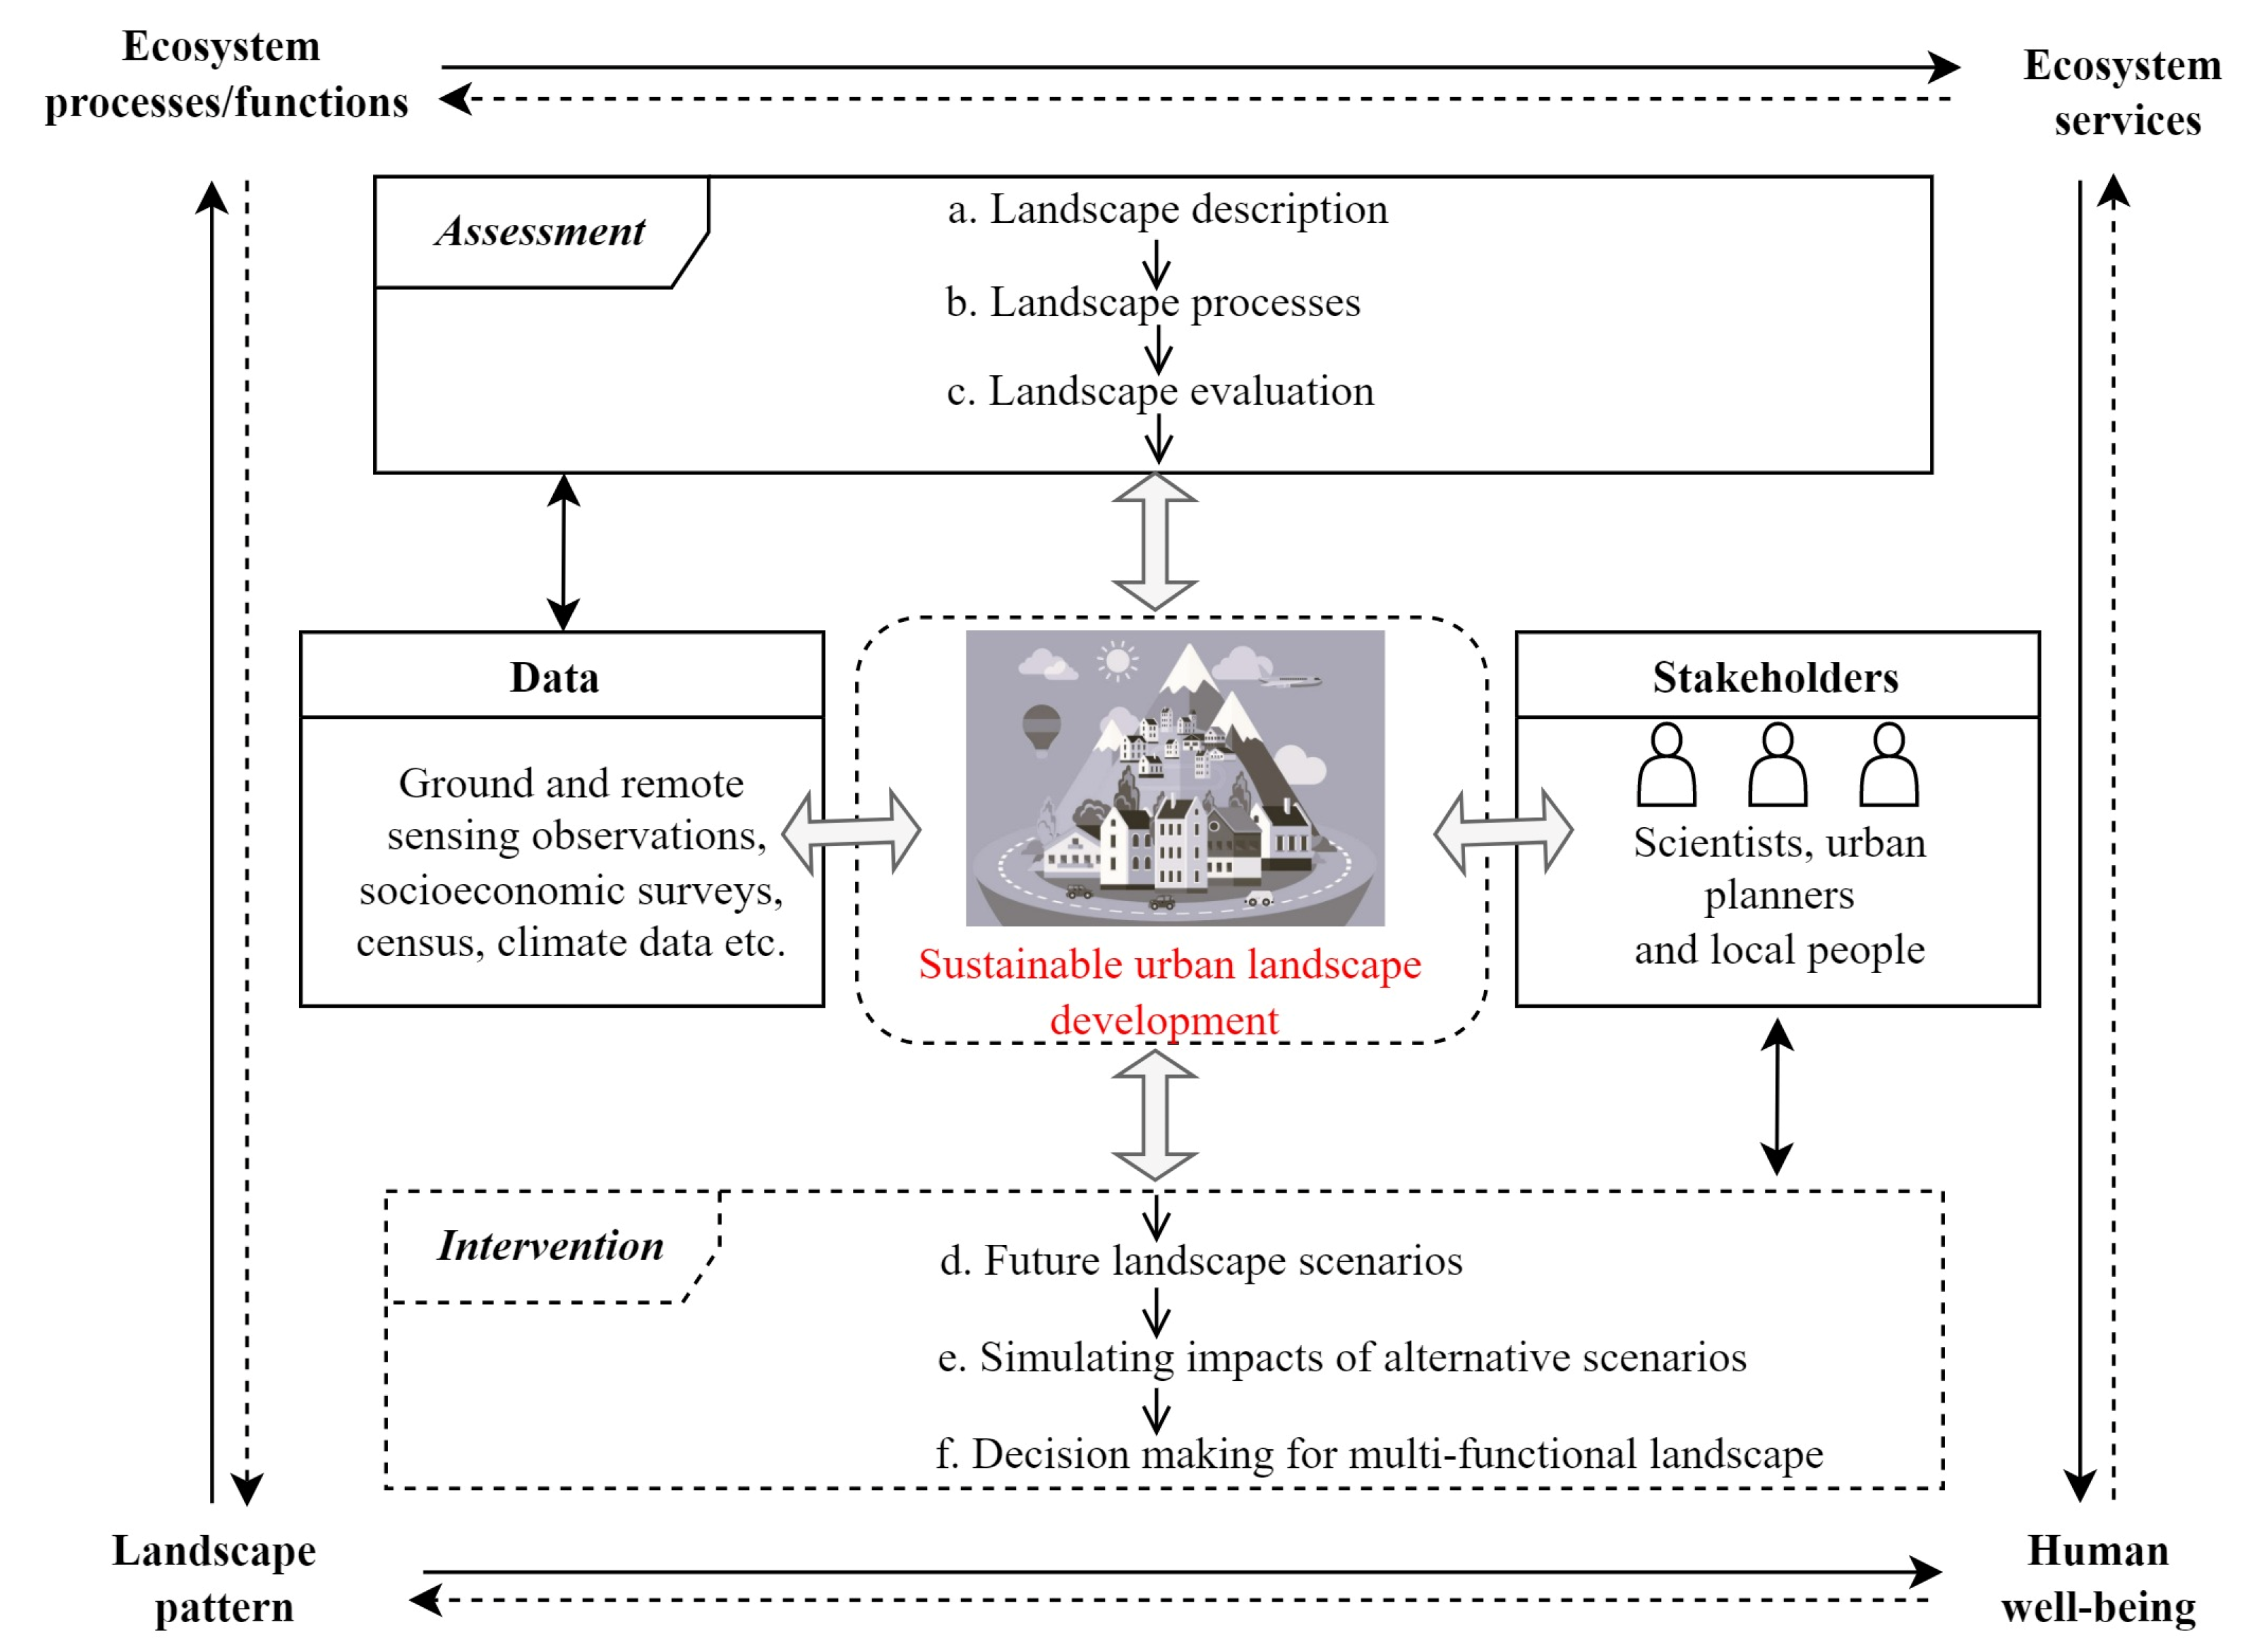
4.2. Framework for Sustainable Landscape Development in Himalaya

The foremost aim of sustainable landscape development lies in the optimization of LULC and landscape patterns to support human wellbeing using spatially explicit approaches. We propose a conceptual framework of sustainable landscape development in Himalaya through integrating the paradigm ‘landscape pattern—ecological processes/functions—ecosystem services—human wellbeing’ and Geodesign, an approach proposed by [68]. Our framework (see Figure 8) takes care of the multifunctionality of Himalayan urban landscapes and is drawn on multiple studies that have prominently focused on sustainable urban planning [48,69,70]. Our framework is prominently focused on integrating the ecological principles for guiding sustainable built-up land development in ecologically fragile mountainous regions. The integration of the Geodesign approach could promisingly extend the paradigm ‘landscape pattern—ecological processes/functions—ecosystem services—human wellbeing’ through a multidisciplinary collaboration and direct interaction among various stakeholder including urban planners, ecologically and geographically oriented scientists, and the local people. The integrated framework guides sustainable landscape development in two broad steps (assessment and intervention), following a strong sustainability perspective, as highlighted by [69].

4.2.1. Assessment

In general, this step refers to understanding the past to present condition of the landscape under study. At first, in phase (a), landscape description is used to characterize a general picture of the study site and, while doing so, the first and foremost task is to find the appropriate boundary of study site. It is always suggested to consider both socioeconomic and ecological boundaries to define the study site [71] as it provides a multiscale and hierarchical vision for planning future urban development. Furthermore, landscape sustainability is inherently multiscale [69]. The next step includes the data collection for the characterization of ecosystem services and the rising eco-environmental issues of any landscape. In the case of Himalayan landscapes, the lack of a consistent data source necessitates the integration of data from multiple sources, including government agencies, research institutes, remote sensing, and field surveys. Using the GIS technique, the synthesis of raster maps helps in the visualization of collected spatiotemporal data (e.g., local population changes and LULC maps of varying timepoints for urban expansion study). Then, in phase (b), the landscape process reflects the evolution of the study site with or without interventions. It encompasses the need to analyze the spatiotemporal pattern of urban expansion, including rate, intensity, and composition, while quantifying the underlying losses and changes in pattern of crucial natural and semi-natural land units on the basis of the data collected or synthesized in the previous step (e.g., LULC maps). The preceding sections of our study (e.g., multitemporal LULC mapping, time interval intensity analysis, and landscape metrics analysis) coincide with the first two phases of the assessment step and, hence, answer two important questions: How should the study site be described in the context of scale and time? How does the study site operate? However, for promoting and adopting sustainable urban landscape development in Himalaya, two additional phases in the assessment step and three additional phases in the intervention step need to be considered in future studies. Moreover, within the current phase, the spatiotemporal mapping and quantification of major and crucial ecosystem services can develop a foundational understanding of spatial interaction between ecosystem services supply and LULC dynamics. Lastly, in phase (c), landscape evaluation phase seeks to assess the multifunctionality of Himalayan landscapes. The inherently fragile and vulnerable nature of Himalayan urban landscapes necessitates assessing the regulation capacity of its natural and semi-natural land units against a variety of disasters such as landslides and floods under past and present LULC conditions. Through assessing the impact of urbanization on crucial ecosystem services and human wellbeing this phase can answer the following question: Is the current study site working well?

4.2.2. Intervention

This step is concerned with the future of the study sites. At first, in phase (d), future landscape scenario development takes input from the observation of the landscape evaluation phase to build a series of alternative future development scenarios for the planned multifunctional (e.g., erosion control, flood regulation, carbon sequestration, and cropland productivity) landscape. Here, stakeholders can either adopt the alternative scenarios developed by scientists according to local demand and ecological sustainability of landscapes or can propose their scenarios. In Himalayan landscapes, the main aim of designing future landscapes should be mainly based on the level of fragmentation, loss of natural units, and capacity of future landscape to provide crucial landscape functions and services. For instance, regions with highly fragmented natural units need to be redesigned for restoring their ecological integrity and ecosystem services supply capacity. Similarly, existing and future infrastructural developments should also be assessed through the lens of geological and flood disaster risks. Moreover, specifically in the case of Himalayan landscapes, the integration of climate change scenarios is also very crucial as it can help measure the changes in functionality and operation of landscapes and its processes under rapidly changing climatic conditions. This phase helps in building answers for the following question: How might the study site be altered? Next, in phase (e), simulating impacts of alternative landscape scenarios just like the evaluation phase, the assessment indicators can be quantified to assess positive and negative impacts associated with designed alternative scenarios of the future landscape. In the context of developing the Himalayan urban landscape while integrating multifunctionality, mapping and analyzing the supply capacity of multiple ecosystem services (such as carbon sequestration, food production, flood regulation, soil erosion, and retention) under various scenarios, along with the total benefits associated with each scenario, will be critical for the next and final decision-making process. This phase can also help in identifying site-specific needs for redesigning the landscape to enhance its multifunctionality through implementing nature-based solutions. Lastly, in phase (f), decision making includes group discussion among various stakeholders involved in the process based on the results of the previous two phases. In general, considering the socioeconomic growth and development with urbanization, a balanced scenario combined with an offensive (exploiting natural resources for development) and defensive (avoiding any loss/exploitation of natural resources) design approach is adopted. This would lead to the next step of implementation plan development. However, any ‘no’ output from the discussion could lead to revisiting former phases for redesigning scenarios.
The proposed framework in our research integrates the principles of landscape ecology with a Geodesign approach to provide scientific context for a well-informed and collaborative decision-making process for ecologically fragile and vulnerable Himalayan urban landscapes that are in dire need to change in response to the simultaneous current pressure of intensive urban urbanization and climate change.

4.3. Limitations and Future Outlooks

The present study produced and mapped the quantitative estimates of urbanization-driven spatiotemporal variations in LULC types, along with their intensity analysis and landscape patterns in two rapidly urbanizing landscapes of the Western Himalaya. This provides a systematic integration of medium-sized urban centers and extends the previous studies in Himalaya. However, the present study had certain limitations which need to be addressed in future studies. Even though the results of present study demonstrated the response of landscape composition and configuration to fast-paced urban expansion in and around two rapidly urbanizing medium-sized cities of Himalaya, certain limitations related to impact analysis of these changes on human society, natural ecological environments, and ecosystem services still need to be further studied. Previous studies [12,27,72] emphasized the need to explore the impact of landscape pattern on ecosystem services. Therefore, we look forward to future research following and using our framework, to elucidate past and present conditions under the paradigm ‘landscape pattern—ecological processes/functions—ecosystem services—human wellbeing’ and seek a sustainable urban landscape development strategy for Himalayan and other mountainous regions. Additionally, analyzing the impact of socioeconomic factors on landscape transformations, according to a set comprehensive indicator, such as gross domestic product, population growth rate, or human activity index, at a relatively broader temporal scale, is also crucial and needs to be considered in future research.

5. Conclusions

In the present study, the LULC and landscape pattern change trajectories of two rapidly emerging urban landscapes represent a typical urbanization trend that is sweeping across the city level and beyond; the trend is a particular form of unplanned, unregulated, and extensive urbanization in many developing countries, including India. The built-up area continues to expand and encroach on natural and semi-natural land units, mostly cropland, vegetation, and forest land. Over the past two decades, built-up area increased by 104% and 387%, while forest, vegetation, and cropland encountered urban growth-driven loss of 1%, 2%, and 17%, and 15%, 11%, and 15% in Dharamsala and Pithoragarh, respectively. These changes not only brought socioeconomic transformations in each urban landscape but also affected key ecological processes through altering landscape composition and configuration. In particular, during the study period, the Pithoragarh landscape evolved and expanded majorly as a single core, while the Dharamsala landscape exhibited multicore expansion. The growth of newer urban areas in both landscapes was generally spontaneous, with little or absence of any intervention of local governmental authorities. Such unplanned and extensive urban expansion in the ecologically relevant mountain ecosystem, i.e., Himalaya, can lead to the loss and deterioration of natural land units, which in turn can adversely impact the urban environment and overall human wellbeing. Given that the nature of urban growth and expansion in Western Himalaya is not sustainable in many ways, to promote sustainable landscape development in western Himalaya and other mountainous regions of the world, we suggest adopting the proposed framework that integrates the multifunctionality of Himalayan or any mountainous landscape with the Geodesign approach and the key characteristics of mountainous urban landscapes. Hence, the results and the proposed framework of this study provide an important reference value for ecological development and future urbanization planning in Himalaya and other similar mountainous regions.

Supplementary Materials

The following supporting information can be downloaded at https://www.mdpi.com/article/10.3390/land11122281/s1: Table S1. Details of satellite data used for land use/land cover map synthesis; Table S2. LULC classes used in current study. Note: Here, the classes with an asterisk (*) are in both Pithoragarh and Dharamsala, except for waterbody; Figure S1. Land use/land cover changes in Dharamsala in 2002, 2010, 2016, and 2019; Figure S2. Land use/land cover changes in Pithoragarh in 2001, 2008, 2016, and 2019; Figure S3. Temporal series of landscape metrics of Dharamsala quantified at landscape level; Figure S4. Temporal series of landscape metrics of Pithoragarh quantified at landscape level.

Author Contributions

Conceptualization, S.S. and P.K.J.; methodology, S.S.; software, S.S.; validation, S.S. and P.K.J.; formal analysis, S.S.; investigation, S.S.; resources, P.K.J. and C.F.; data curation, S.S.; writing—original draft preparation, S.S.; writing—review and editing, P.K.J. and C.F.; visualization, S.S.; supervision, P.K.J. and C.F.; funding acquisition, C.F. All authors read and agreed to the published version of the manuscript.

Funding

S.S. would like to express her gratitude for the research support from the University Grants Commission (UGC) for the Junior Research Fellowship (JRF, funding id 384/(CSIRNETJUNE2019)) and DAAD (Deutscher Akademischer Austauschdienst, funding ID 2021/22 (57552338).

Data Availability Statement

Not applicable.

Conflicts of Interest

The authors declare no conflict of interest. The funders had no role in the design of the study; in the collection, analyses, or interpretation of data; in the writing of the manuscript, or in the decision to publish the results.

References

  1. Keivani, R. A Review of the Main Challenges to Urban Sustainability. Int. J. Urban Sustain. Dev. 2009, 1, 5–16. [Google Scholar] [CrossRef]
  2. Vardoulakis, S.; Dear, K.; Wilkinson, P. Challenges and Opportunities for Urban Environmental Health and Sustainability: The HEALTHY-POLIS Initiative. Environ. Health 2016, 15, S30. [Google Scholar] [CrossRef] [PubMed] [Green Version]
  3. Seto, K.C.; Golden, J.S.; Alberti, M.; Turner, B.L. Sustainability in an Urbanizing Planet. Proc. Natl. Acad. Sci. USA 2017, 114, 8935–8938. [Google Scholar] [CrossRef] [PubMed] [Green Version]
  4. Cao, Q.; Liu, Y.; Georgescu, M.; Wu, J. Impacts of Landscape Changes on Local and Regional Climate: A Systematic Review. Landsc. Ecol. 2020, 35, 1269–1290. [Google Scholar] [CrossRef]
  5. Rienow, A.; Kantakumar, L.N.; Ghazaryan, G.; Dröge-Rothaar, A.; Sticksel, S.; Trampnau, B.; Thonfeld, F. Modelling the Spatial Impact of Regional Planning and Climate Change Prevention Strategies on Land Consumption in the Rhine-Ruhr Metropolitan Area 2017–2030. Landsc. Urban Plan. 2022, 217, 104284. [Google Scholar] [CrossRef]
  6. Foley, J.A.; DeFries, R.; Asner, G.P.; Barford, C.; Bonan, G.; Carpenter, S.R.; Chapin, F.S.; Coe, M.T.; Daily, G.C.; Gibbs, H.K.; et al. Global Consequences of Land Use. Science 2005, 309, 570–574. [Google Scholar] [CrossRef] [Green Version]
  7. Grimm, N.B.; Faeth, S.H.; Golubiewski, N.E.; Redman, C.L.; Wu, J.; Bai, X.; Briggs, J.M. Global Change and the Ecology of Cities. Science 2008, 319, 756–760. [Google Scholar] [CrossRef] [PubMed] [Green Version]
  8. Canedoli, C.; Crocco, F.; Comolli, R.; Padoa-Schioppa, E. Landscape Fragmentation and Urban Sprawl in the Urban Region of Milan. Landsc. Res. 2018, 43, 632–651. [Google Scholar] [CrossRef]
  9. With, K.A. Landscape Effects on Ecosystem Structure and Function. In Essentials of Landscape Ecology; Oxford University Press: Oxford, UK, 2019; pp. 512–546. ISBN 978-0-19-883838-8. [Google Scholar]
  10. Wu, J. Landscape Sustainability Science: Ecosystem Services and Human Well-Being in Changing Landscapes. Landsc. Ecol. 2013, 28, 999–1023. [Google Scholar] [CrossRef]
  11. Peng, J.; Liu, Y.; Corstanje, R.; Meersmans, J. Promoting Sustainable Landscape Pattern for Landscape Sustainability. Landsc. Ecol. 2021, 36, 1839–1844. [Google Scholar] [CrossRef]
  12. Hu, Z.; Yang, X.; Yang, J.; Yuan, J.; Zhang, Z. Linking Landscape Pattern, Ecosystem Service Value, and Human Well-Being in Xishuangbanna, Southwest China: Insights from a Coupling Coordination Model. Glob. Ecol. Conserv. 2021, 27, e01583. [Google Scholar] [CrossRef]
  13. Zambrano, L.; Aronson, M.F.J.; Fernandez, T. The Consequences of Landscape Fragmentation on Socio-Ecological Patterns in a Rapidly Developing Urban Area: A Case Study of the National Autonomous University of Mexico. Front. Environ. Sci. 2019, 7, 152. [Google Scholar] [CrossRef]
  14. Uuemaa, E.; Roosaare, J.; Mander, Ü. Scale Dependence of Landscape Metrics and Their Indicatory Value for Nutrient and Organic Matter Losses from Catchments. Ecol. Indic. 2005, 5, 350–369. [Google Scholar] [CrossRef]
  15. Fahrig, L. Effects of Habitat Fragmentation on Biodiversity. Annu. Rev. Ecol. Evol. Syst. 2003, 34, 487–515. [Google Scholar] [CrossRef] [Green Version]
  16. Haddad, N.M.; Brudvig, L.A.; Clobert, J.; Davies, K.F.; Gonzalez, A.; Holt, R.D.; Lovejoy, T.E.; Sexton, J.O.; Austin, M.P.; Collins, C.D.; et al. Habitat Fragmentation and Its Lasting Impact on Earth’s Ecosystems. Sci. Adv. 2015, 1, e1500052. [Google Scholar] [CrossRef] [PubMed] [Green Version]
  17. Saunders, D.A.; Hobbs, R.J.; Margules, C.R. Biological Consequences of Ecosystem Fragmentation: A Review. Conserv. Biol. 1991, 5, 18–32. [Google Scholar] [CrossRef]
  18. Mitchell, M.G.E.; Bennett, E.M.; Gonzalez, A. Strong and Nonlinear Effects of Fragmentation on Ecosystem Service Provision at Multiple Scales. Environ. Res. Lett. 2015, 10, 094014. [Google Scholar] [CrossRef]
  19. Hanski, I. Landscape Fragmentation, Biodiversity Loss and the Societal Response: The Longterm Consequences of Our Use of Natural Resources May Be Surprising and Unpleasant. EMBO Rep. 2005, 6, 388–392. [Google Scholar] [CrossRef] [Green Version]
  20. Shoshany, M. Landscape Fragmentation and Soil Cover Changes on South- and North-Facing Slopes during Ecosystems Recovery: An Analysis from Multi-Date Air Photographs. Geomorphology 2002, 45, 3–20. [Google Scholar] [CrossRef]
  21. Smiraglia, D.; Tombolini, I.; Canfora, L.; Bajocco, S.; Perini, L.; Salvati, L. The Latent Relationship Between Soil Vulnerability to Degradation and Land Fragmentation: A Statistical Analysis of Landscape Metrics in Italy, 1960–2010. Environ. Manag. 2019, 64, 154–165. [Google Scholar] [CrossRef]
  22. Pawe, C.K. The Heat Is on in the Himalayas: Assessing Srinagar’s Urban Heat Island Effect. In Environmental Change in the Himalayan Region; Saikia, A., Thapa, P., Eds.; Springer International Publishing: Cham, Switzerland, 2019; pp. 157–171. ISBN 978-3-030-03361-3. [Google Scholar]
  23. Kun, Á.; Oborny, B.; Dieckmann, U. Five Main Phases of Landscape Degradation Revealed by a Dynamic Mesoscale Model Analysing the Splitting, Shrinking, and Disappearing of Habitat Patches. Sci. Rep. 2019, 9, 11149. [Google Scholar] [CrossRef] [PubMed] [Green Version]
  24. Jones, K.B.; Zurlini, G.; Kienast, F.; Petrosillo, I.; Edwards, T.; Wade, T.G.; Li, B.; Zaccarelli, N. Informing Landscape Planning and Design for Sustaining Ecosystem Services from Existing Spatial Patterns and Knowledge. Landsc. Ecol. 2013, 28, 1175–1192. [Google Scholar] [CrossRef]
  25. Syrbe, R.-U.; Walz, U. Spatial Indicators for the Assessment of Ecosystem Services: Providing, Benefiting and Connecting Areas and Landscape Metrics. Ecol. Indic. 2012, 21, 80–88. [Google Scholar] [CrossRef]
  26. Peng, J.; Liu, Y.; Wu, J.; Lv, H.; Hu, X. Linking Ecosystem Services and Landscape Patterns to Assess Urban Ecosystem Health: A Case Study in Shenzhen City, China. Landsc. Urban Plan. 2015, 143, 56–68. [Google Scholar] [CrossRef]
  27. Chen, W.; Zeng, J.; Chu, Y.; Liang, J. Impacts of Landscape Patterns on Ecosystem Services Value: A Multiscale Buffer Gradient Analysis Approach. Remote Sens. 2021, 13, 2551. [Google Scholar] [CrossRef]
  28. Turner, M.G. Landscape Ecology: The Effect of Pattern on Process. Annu. Rev. Ecol. Syst. 1989, 20, 171–197. [Google Scholar] [CrossRef]
  29. Turner, M.G. Landscape Ecology: What Is the State of the Science? Annu. Rev. Ecol. Evol. Syst. 2005, 36, 319–344. [Google Scholar] [CrossRef]
  30. Wu, J. Landscape Ecology. In Ecological Systems; Leemans, R., Ed.; Springer: New York, NY, USA, 2013; pp. 179–200. ISBN 978-1-4614-5754-1. [Google Scholar]
  31. Uuemaa, E.; Antrop, M.; Roosaare, J.; Marja, R.; Mander, Ü. Landscape Metrics and Indices: An Overview of Their Use in Landscape Research. Living Rev. Landsc. Res. 2009, 3, 1–28. [Google Scholar] [CrossRef]
  32. McGarigal, K. Landscape Pattern Metrics. In Wiley StatsRef: Statistics Reference Online; Balakrishnan, N., Colton, T., Everitt, B., Piegorsch, W., Ruggeri, F., Teugels, J.L., Eds.; Wiley: Hoboken, NJ, USA, 2014; ISBN 978-1-118-44511-2. [Google Scholar]
  33. Seto, K.C.; Sánchez-Rodríguez, R.; Fragkias, M. The New Geography of Contemporary Urbanization and the Environment. Annu. Rev. Environ. Resour. 2010, 35, 167–194. [Google Scholar] [CrossRef] [Green Version]
  34. Weng, Q. (Ed.) Global Urban Monitoring and Assessment through Earth Observation; Taylor & Francis Series in Remote Sensing Applications; First Issued Paperback; CRC Press: Boca Raton, FL, USA, 2019; ISBN 978-0-367-86762-1. [Google Scholar]
  35. Joshi, N. Adopting a Governance Lens to Address Urban Risks in the Uttarakhand Himalayas: The Case of Almora, India. Int. J. Disaster Risk Reduct. 2021, 54, 102044. [Google Scholar] [CrossRef]
  36. Anees, M.M.; Sharma, R.; Joshi, P.K. Urbanization in Himalaya—An Interregional Perspective to Land Use and Urban Growth Dynamics. In Mountain Landscapes in Transition; Schickhoff, U., Singh, R.B., Mal, S., Eds.; Sustainable Development Goals Series; Springer International Publishing: Cham, Switzerland, 2022; pp. 517–538. ISBN 978-3-030-70237-3. [Google Scholar]
  37. Diksha; Kumar, A. Analysing Urban Sprawl and Land Consumption Patterns in Major Capital Cities in the Himalayan Region Using Geoinformatics. Appl. Geogr. 2017, 89, 112–123. [Google Scholar] [CrossRef]
  38. Ishtiaque, A.; Shrestha, M.; Chhetri, N. Rapid Urban Growth in the Kathmandu Valley, Nepal: Monitoring Land Use Land Cover Dynamics of a Himalayan City with Landsat Imageries. Environments 2017, 4, 72. [Google Scholar] [CrossRef]
  39. Mukherji, A.; Scott, C.; Molden, D.; Maharjan, A. Megatrends in Hindu Kush Himalaya: Climate Change, Urbanisation and Migration and Their Implications for Water, Energy and Food. In Assessing Global Water Megatrends; Biswas, A.K., Tortajada, C., Rohner, P., Eds.; Water Resources Development and Management; Springer: Singapore, 2018; pp. 125–146. ISBN 978-981-10-6694-8. [Google Scholar]
  40. Tiwari, P.C.; Tiwari, A.; Joshi, B. Urban Growth in Himalaya: Understanding the Process and Options for Sustainable Development. J. Urban Reg. Stud. Contemp. India 2018, 4, 15–27. [Google Scholar]
  41. Sharma, K. Urbanization Induced Land Use-Land Cover Changes in the Manipur Valley and Surrounding Hills: A Landscape Metrics Approach. In Environmental Change in the Himalayan Region; Saikia, A., Thapa, P., Eds.; Springer International Publishing: Cham, Switzerland, 2019; pp. 137–155. ISBN 978-3-030-03361-3. [Google Scholar]
  42. Anees, M.M.; Mann, D.; Sharma, M.; Banzhaf, E.; Joshi, P.K. Assessment of Urban Dynamics to Understand Spatiotemporal Differentiation at Various Scales Using Remote Sensing and Geospatial Tools. Remote Sens. 2020, 12, 1306. [Google Scholar] [CrossRef] [Green Version]
  43. Mann, D.; Rankavat, S.; Joshi, P.K. Road Network Drives Urban Ecosystems—A Longitudinal Analysis of Impact of Roads in the Central Himalaya. Geocarto Int. 2022, 37, 1100–1125. [Google Scholar] [CrossRef]
  44. UN-Habitat (Ed.) The Value of Sustainable Urbanization; World Cities Report; UN-Habitat: Nairobi, Kenya, 2020; ISBN 978-92-1-132872-1. [Google Scholar]
  45. Arku, G.; Marais, L. Global South Urbanisms and Urban Sustainability—Challenges and the Way Forward. Front. Sustain. Cities 2021, 3, 692799. [Google Scholar] [CrossRef]
  46. Mell, I.C.; Sturzaker, J. Sustainable Urban Development in Tightly Constrained Areas: A Case Study of Darjeeling, India. Int. J. Urban Sustain. Dev. 2014, 6, 65–88. [Google Scholar] [CrossRef]
  47. Munsi, M.; Areendran, G.; Ghosh, A.; Joshi, P.K. Landscape Characterisation of the Forests of Himalayan Foothills. J. Indian Soc. Remote Sens. 2010, 38, 441–452. [Google Scholar] [CrossRef]
  48. Jia, L.; Ma, Q.; Du, C.; Hu, G.; Shang, C. Rapid Urbanization in a Mountainous Landscape: Patterns, Drivers, and Planning Implications. Landsc. Ecol. 2020, 35, 2449–2469. [Google Scholar] [CrossRef]
  49. Ojha, H.R. Building an Engaged Himalayan Sustainability Science. One Earth 2020, 3, 534–538. [Google Scholar] [CrossRef]
  50. Dobriyal, P.; Badola, S.; Hussain, S.A.; Badola, R. Toward SDGs: Forest, Market and Human Wellbeing Nexus in Indian Western Himalayas. Front. Ecol. Evol. 2022, 10, 846549. [Google Scholar] [CrossRef]
  51. Pandit, M.K. The Himalayas Must Be Protected. Nature 2013, 501, 283. [Google Scholar] [CrossRef] [PubMed] [Green Version]
  52. Kumar, S.; Meenakshi; Das Bairagi, G.; Vandana; Kumar, A. Identifying Triggers for Forest Fire and Assessing Fire Susceptibility of Forests in Indian Western Himalaya Using Geospatial Techniques. Nat. Hazards 2015, 78, 203–217. [Google Scholar] [CrossRef]
  53. Wu, J.; Shen, W.; Sun, W.; Tueller, P.T. Empirical Patterns of the Effects of Changing Scale on Landscape Metrics. Landsc. Ecol. 2002, 17, 761–782. [Google Scholar] [CrossRef]
  54. Wu, J. Effects of Changing Scale on Landscape Pattern Analysis: Scaling Relations. Landsc. Ecol. 2004, 19, 125–138. [Google Scholar] [CrossRef]
  55. DMC Dharamshala Municipal Corporation 2022. Available online: https://edharamshala.in/ (accessed on 2 May 2022).
  56. Census of India District Census Handbook, Pithorgarh 2011. Available online: https://censusindia.gov.in/nada/index.php/catalog/1318/download/4286/DH_2011_0507_PART_A_DCHB_PITHORAGARH.pdf (accessed on 2 May 2022).
  57. Aldwaik, S.Z.; Pontius, R.G. Intensity Analysis to Unify Measurements of Size and Stationarity of Land Changes by Interval, Category, and Transition. Landsc. Urban Plan. 2012, 106, 103–114. [Google Scholar] [CrossRef]
  58. Pontius, R.; Gao, Y.; Giner, N.; Kohyama, T.; Osaki, M.; Hirose, K. Design and Interpretation of Intensity Analysis Illustrated by Land Change in Central Kalimantan, Indonesia. Land 2013, 2, 351–369. [Google Scholar] [CrossRef]
  59. Cai, Y.-B.; Li, H.-M.; Ye, X.-Y.; Zhang, H. Analyzing Three-Decadal Patterns of Land Use/Land Cover Change and Regional Ecosystem Services at the Landscape Level: Case Study of Two Coastal Metropolitan Regions, Eastern China. Sustainability 2016, 8, 773. [Google Scholar] [CrossRef] [Green Version]
  60. Fu, G.; Wang, W.; Li, J.; Xiao, N.; Qi, Y. Prediction and Selection of Appropriate Landscape Metrics and Optimal Scale Ranges Based on Multi-Scale Interaction Analysis. Land 2021, 10, 1192. [Google Scholar] [CrossRef]
  61. Hesselbarth, M.H.K.; Sciaini, M.; With, K.A.; Wiegand, K.; Nowosad, J. Landscapemetrics: An Open-source R Tool to Calculate Landscape Metrics. Ecography 2019, 42, 1648–1657. [Google Scholar] [CrossRef] [Green Version]
  62. Kendall, T.J.; Duff, C.M.; Thomson, A.M.; Iredale, J.P. Integration of Geoscience Frameworks into Digital Pathology Analysis Permits Quantification of Microarchitectural Relationships in Histological Landscapes. Sci. Rep. 2020, 10, 17572. [Google Scholar] [CrossRef] [PubMed]
  63. Hesselbarth, M.H.K.; Nowosad, J.; Signer, J.; Graham, L.J. Open-Source Tools in R for Landscape Ecology. Curr. Landsc. Ecol. Rep. 2021, 6, 97–111. [Google Scholar] [CrossRef]
  64. McGarigal, K.; Marks, B.J. FRAGSTATS: Spatial Pattern Analysis Program for Quantifying Landscape Structure.; U.S. Department of Agriculture, Forest Service, Pacific Northwest Research Station: Portland, OR, USA, 1995; p. PNW-GTR-351.
  65. Sang, X.; Guo, Q.; Wu, X.; Fu, Y.; Xie, T.; He, C.; Zang, J. Intensity and Stationarity Analysis of Land Use Change Based on CART Algorithm. Sci. Rep. 2019, 9, 12279. [Google Scholar] [CrossRef] [Green Version]
  66. Asante-Yeboah, E.; Ashiagbor, G.; Asubonteng, K.; Sieber, S.; Mensah, J.C.; Fürst, C. Analyzing Variations in Size and Intensities in Land Use Dynamics for Sustainable Land Use Management: A Case of the Coastal Landscapes of South-Western Ghana. Land 2022, 11, 815. [Google Scholar] [CrossRef]
  67. Yi, Y.; Zhao, Y.; Ding, G.; Gao, G.; Shi, M.; Cao, Y. Effects of Urbanization on Landscape Patterns in a Mountainous Area: A Case Study in the Mentougou District, Beijing, China. Sustainability 2016, 8, 1190. [Google Scholar] [CrossRef] [Green Version]
  68. Steinitz, C. A Framework for Geodesign: Changing Geography by Design; ESRI Press: Redlands, CA, USA, 2012; ISBN 978-1-58948-333-0. [Google Scholar]
  69. Huang, L.; Xiang, W.; Wu, J.; Traxler, C.; Huang, J. Integrating GeoDesign with Landscape Sustainability Science. Sustainability 2019, 11, 833. [Google Scholar] [CrossRef] [Green Version]
  70. Gu, Y.; Deal, B.; Larsen, L. Geodesign Processes and Ecological Systems Thinking in a Coupled Human-Environment Context: An Integrated Framework for Landscape Architecture. Sustainability 2018, 10, 3306. [Google Scholar] [CrossRef] [Green Version]
  71. Barham, E. Ecological Boundaries as Community Boundaries: The Politics of Watersheds. Soc. Nat. Resour. 2001, 14, 181–191. [Google Scholar] [CrossRef]
  72. Duarte, G.T.; Santos, P.M.; Cornelissen, T.G.; Ribeiro, M.C.; Paglia, A.P. The Effects of Landscape Patterns on Ecosystem Services: Meta-Analyses of Landscape Services. Landsc. Ecol. 2018, 33, 1247–1257. [Google Scholar] [CrossRef]
Figure 1. Geographic locations of the study sites which fall in two Indian Western Himalayan states: Himachal Pradesh and Uttarakhand (Row 1); satellite image of each study site at the sub-watershed boundary overlaid by the city administrative boundary (yellow color) (Row 2).
Land 11 02281 g001
Figure 2. Variations in the proportion of LULC among the reference years of study period at city and outer zone level in (a) Dharamsala and (b) Pithoragarh.
Land 11 02281 g002
Figure 3. Interval level changes in terms of intensity during three study periods in (a) Dharamsala and (b) Pithoragarh.
Land 11 02281 g003
Figure 4. Category level changes in terms of intensity during three time intervals in Dharamsala and Pithoragarh, at the city level (Column 1) and outer zone (Column 2). FO: forest, VEG: vegetation, GL: glacier, WB: waterbody, BL: barren land, CL: cropland, OA: open area, and BU: built-up. The black dashed line represents the uniform intensity, and its value is placed next to it.
Land 11 02281 g004
Figure 5. Transition level changes in terms of intensity during three time intervals in Dharamsa-la and Pithoragarh, at the city level (Column 1) and outer zone (Column 2). FO: forest, VEG: vegetation, WB: waterbody, BL: barren land, CL: cropland, OA: open area.
Land 11 02281 g005
Figure 6. Spatiotemporal evolution of selected landscape metrics at 250 m cell size in 2002, 2010, 2016, and 2019 in Dharamsala.
Land 11 02281 g006
Figure 7. Spatiotemporal evolution of selected landscape metrics at 250 m cell size in 2002, 2010, 2016, and 2019 in Pithoragarh.
Land 11 02281 g007
Figure 8. A conceptual framework for integrating landscape ecology and Geodesign for sustainable urban landscape development in the Himalaya.
Land 11 02281 g008
Table 1. Details of selected landscape metrics.
Structural CategoryLandscape MetricsDescription
AggregationPatch density (PD)Level: C/L
Number of patches per unit area of a landscape
Aggregation index (AI)Level: C/L
Ratio of observed number of like adjacencies to the maximum possible number of adjacencies in a landscape
Landscape shape index (LSI)Level: C/L
Perimeter–area ratio of the form measuring the shape complexity of a landscape or a specific patch type
ShapeMean shape index (SHP-MN)Level: C/L
Mean value of the patch shape index
Area and edgeLargest patch index (LPI)Level: C/L
Area of the largest patch divided by total area of a landscape
DiversityShannon’s diversity index (SHDI)Level: L
Proportion of abundance of a landscape
Publisher’s Note: MDPI stays neutral with regard to jurisdictional claims in published maps and institutional affiliations.

