Article

Landsat-Satellite-Based Analysis of Long-Term Temporal Spatial Dynamics of Cyanobacterial Blooms: A Case Study in Taihu Lake

1
College of Biology and the Environment, Co-Innovation Center for Sustainable Forestry in Southern China, Nanjing Forestry University, Nanjing 210037, China
2
College of Horticulture and Plant Protection, Henan University of Science and Technology, Luoyang 471023, China
*
Author to whom correspondence should be addressed.
Land 2022, 11(12), 2197; https://doi.org/10.3390/land11122197
Submission received: 3 November 2022 / Revised: 30 November 2022 / Accepted: 1 December 2022 / Published: 4 December 2022
(This article belongs to the Special Issue Monitoring and Simulation of Wetland Ecological Processes)

Abstract

:
Cyanobacterial blooms in large and shallow freshwater lakes have become one of the most severe ecological problems threatening the environment and public health. Although great progress has been made in Taihu Lake in cyanobacterial bloom monitoring, most previous studies have used MODIS images with a resolution greater than 250 m, available after 2000, while the fine-scale studies on its long-term spatio-temporal dynamics to date are insufficient. This study monitored the spatiotemporal distribution of cyanobacterial blooms in Taihu Lake between 1984 and 2021 using Landsat images of 30 m resolution on the cloud computation platform Google Earth Engine and calculated the cyanobacterial blooms’ area percentage and the cyanobacterial bloom frequency index. Then, we investigated the influence of water quality and meteorological factors on area and frequency using Spearman correlation and principal component analysis. The results show that cyanobacterial blooms spread from the northern to the central, western, and eastern parts of Taihu Lake from 1984 to 2021. With the exception of East Lake, the area and frequency of cyanobacterial blooms increased significantly. Hypereutrophic water conditions, high temperatures, abundant sunshine hours, and low wind velocities all favor cyanobacteria blooms in Taihu Lake, and the key influencing factors of dynamics in cyanobacterial blooms are the comprehensive trophic level index, annual sunshine hours, and annual maximum wind speed. This study can serve as a reference for lake eutrophication monitoring and water resource management and protection.

1. Introduction

A lake is one of the main components of surface water and also one of the most important ecosystems of the terrestrial water cycle [1]. It not only provides a large volume of fresh water resources for human activities, but also adjusts the hydrologic cycle and potable water supply, improving the function of the river basin water environment; thus, in maintaining regional ecological and environmental stability, it plays an important role [2,3]. However, due to the impact of natural factors and human activities, with global climate warming, large amounts of nitrogen, phosphorus, and other nutrients enter the lake, which lead to the eutrophication of the lake, ultimately resulting in cyanobacteria outbreaks [4]. As one of the most serious water environment problems around the world, algal blooms seriously threaten the health of aquatic ecosystems [5]. Since the 1980s, cyanobacterial blooms have occurred in 68% of the world’s lakes [6]. Cyanobacterial blooms threaten aquatic life, such as fish, and can cause disease and death in humans [7]. Therefore, it is highly necessary to prevent and control cyanobacteria blooms under the premise that the occurrence frequency and distribution range of cyanobacteria blooms are increasing significantly.
As China’s third-largest freshwater lake (2400 km2), Taihu Lake provides drinking water and maintains important fisheries for surrounding cities. In the 1960s, Taihu Lake was in a nutrient-poor state. In 1981, it was still a moderately nutrient-rich lake. However, since the late 1980s, cyanobacteria blooms have begun to occur frequently in Meiliang Bay in the north of Taihu Lake [8]. This has caused great harm to social development [9]. It has seriously affected the sustainable development of the society and economy in the Taihu Basin [10]. At present, most remote sensing monitoring of cyanobacteria blooms in lakes uses MODIS images as data sources, while a few use Landsat images as data sources. Among them, MODIS images have a high temporal resolution and can be observed twice a day on the ground [11]. However, the spatial resolution of MODIS is greater than or equal to 250 m, which is very rough. Moreover, the time period of MODIS images is from 2000, so MODIS data are not suitable for the long-term monitoring of the changes in cyanobacterial blooms. In contrast, Landsat data date back as far as the 1970s, with a spatial resolution of 30 m and higher pixel accuracy. Moreover, Landsat has a higher spectral resolution in the near-infrared band, which makes it more sensitive to cyanobacteria blooms, and it has a stronger recognition ability [12]. The Google Earth Engine (GEE) cloud platform can quickly access and process a large number of regularly updated Earth observation data such as Landsat, which is convenient for users who wish to access and analyze remote sensing big data resources and provides feasibility for the remote sensing image analysis of large-scale and long time series [13]. By combining Landsat images and prior knowledge of transparency and water depth with the Normalized Difference Vegetation Index (NDVI), Ratio Vegetation Index (RVI), and transparency threshold, Ma et al. finally classified aquatic vegetation in Taihu Lake into floating leaf vegetation and submerged vegetation [14]. Oyama et al. conducted in situ spectral measurements and satellite data analysis for cyanobacterial blooms and aquatic plants and used Landsat images to distinguish the two, which was applied to six lakes in Japan and Indonesia, and they finally succeeded in distinguishing water, cyanobacterial blooms and aquatic macrophytes [15]. Jia et al. embedded relevant processing programs into GEE and developed an operational monitoring workflow for cyanobacteria blooms, which was used to measure the spatial–temporal patterns of cyanobacterial blooms for Taihu Lake between 2000 and 2018 [16]. In addition, the study showed that temperature, wind speed, sunshine duration, and the eutrophication degree of water, among others, are factors affecting the occurrence of cyanobacteria blooms [17,18,19]. However, the long-term spatiotemporal changes in cyanobacterial blooms in lakes and their driving mechanisms have not been further studied. We still need to continuously monitor cyanobacterial blooms, especially for long-term records, and to obtain more detailed environmental data so that we can more accurately assess the processes that drive these blooms.
In order to solve the above problems, based on the Landsat data provided by the long time-series GEE platform and the climate and eutrophication data of Taihu Lake, the long-term observation and analysis of cyanobacteria blooms in Taihu Lake from 1984 to 2021 was carried out by using the floating algae index (FAI) threshold, Spearman correlation analysis, and principal component analysis (PCA). This is conducive to our better understanding of the occurrence and development of the whole process, thus permitting effective governance. Our research objectives are (1) to monitor the long-term spatiotemporal variation of cyanobacterial blooms in Taihu Lake from 1984 to 2021 using Landsat images on the GEE cloud platform and (2) to determine the main drivers of cyanobacterial blooms.

2. Materials and Methods
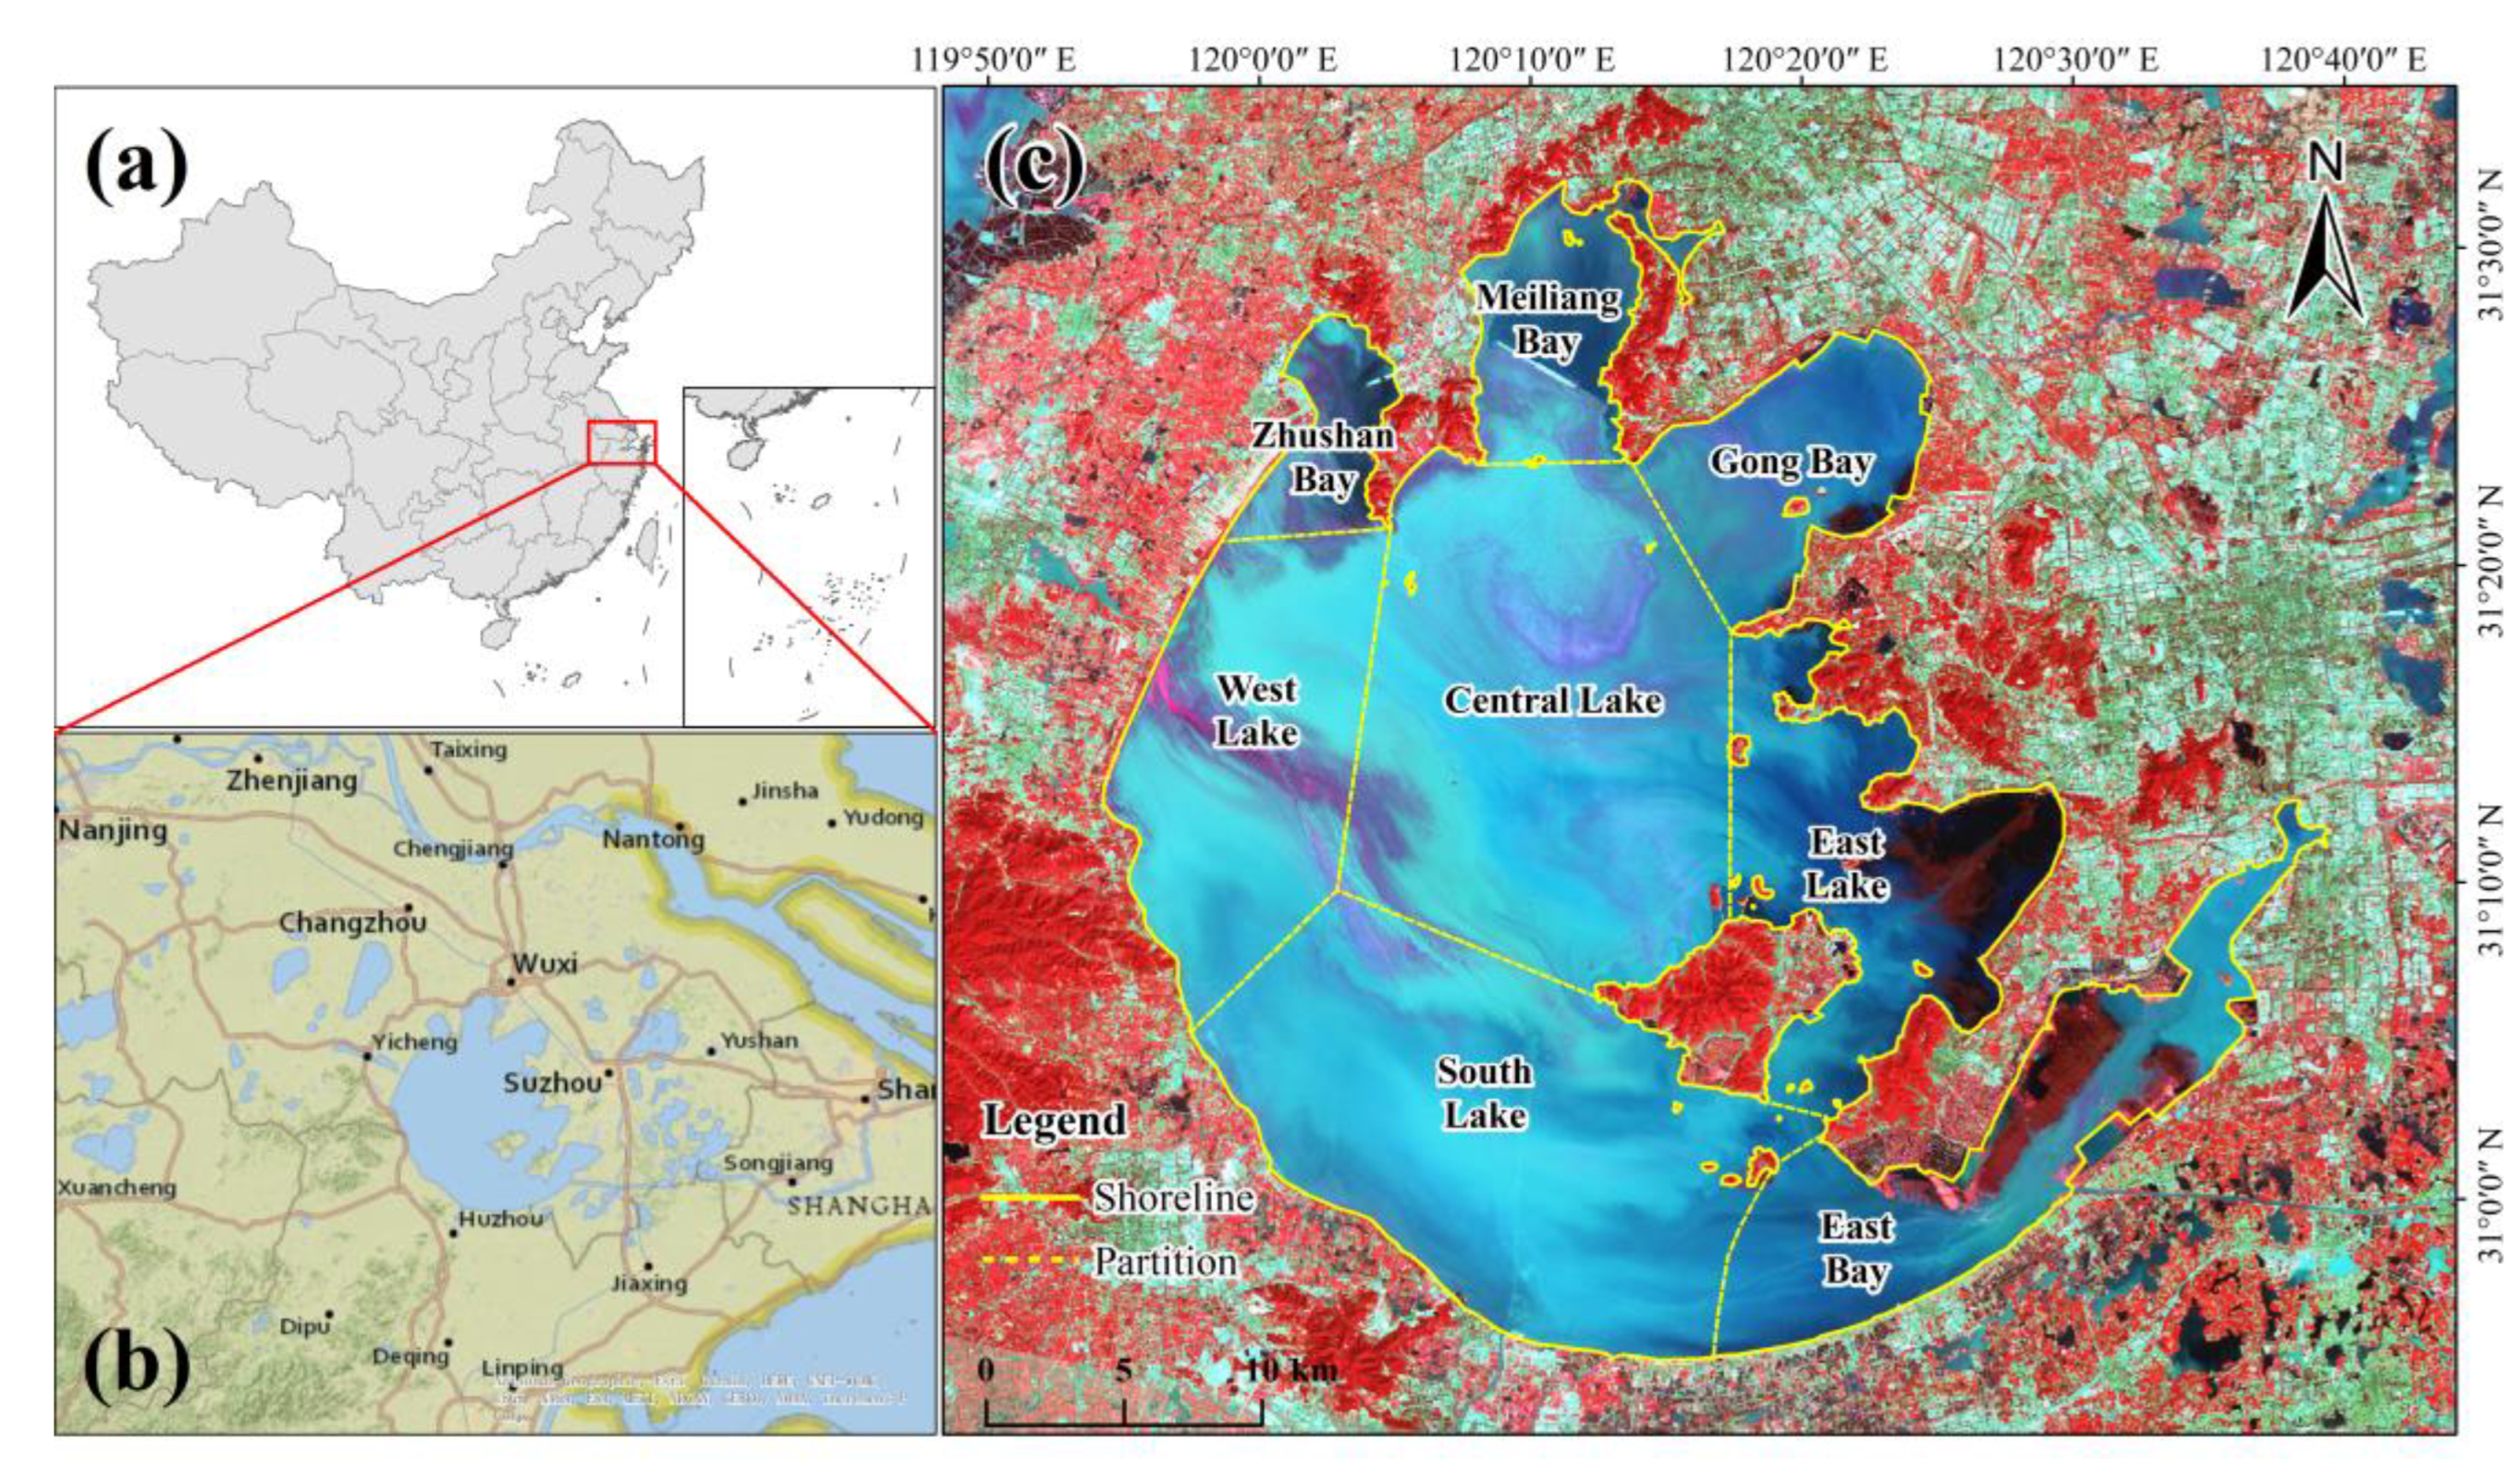
2.1. Study Area

Taihu Lake (30°55′40″~31°32′58″ N; 119°52′32″~120°36′10″ E), located on the southern edge of the Yangtze River Delta, is one of the five largest freshwater lakes in China (Figure 1). It covers an area of approximately 2338 km2, with an average water depth of 1.9 m and water temperatures between 3.5 and 35.0 °C [20]. Since the 1980s, domestic sewage and industrial and agricultural wastewater entering Taihu Lake have been increasing due to the continuous and rapid development of cities around Taihu Lake. This has led to the deterioration of the lake water quality and an increase in the frequency of cyanobacterial blooms [21,22]. The cyanobacterial bloom outbreak in 2007 caused serious water security problems, affecting the normal drinking water supply of approximately 2 million people [23]. After the accident, government personnel implemented a series of projects and policy measures to control the eutrophication of water quality and algae blooms in Taihu Lake. However, the expected results have not yet been fully achieved [24]. Recent studies reported that the largest cyanobacteria blooms in history occurred in 2017 [25,26]. According to previous studies [16,27], we divided Taihu Lake into eight segments (Zhushan Bay, Meiliang Bay, Gong Bay, East Bay, East Lake, Central Lake, West Lake, and South Lake) for convenience of analysis (Figure 1c).

2.2. Data Acquisition and Processing

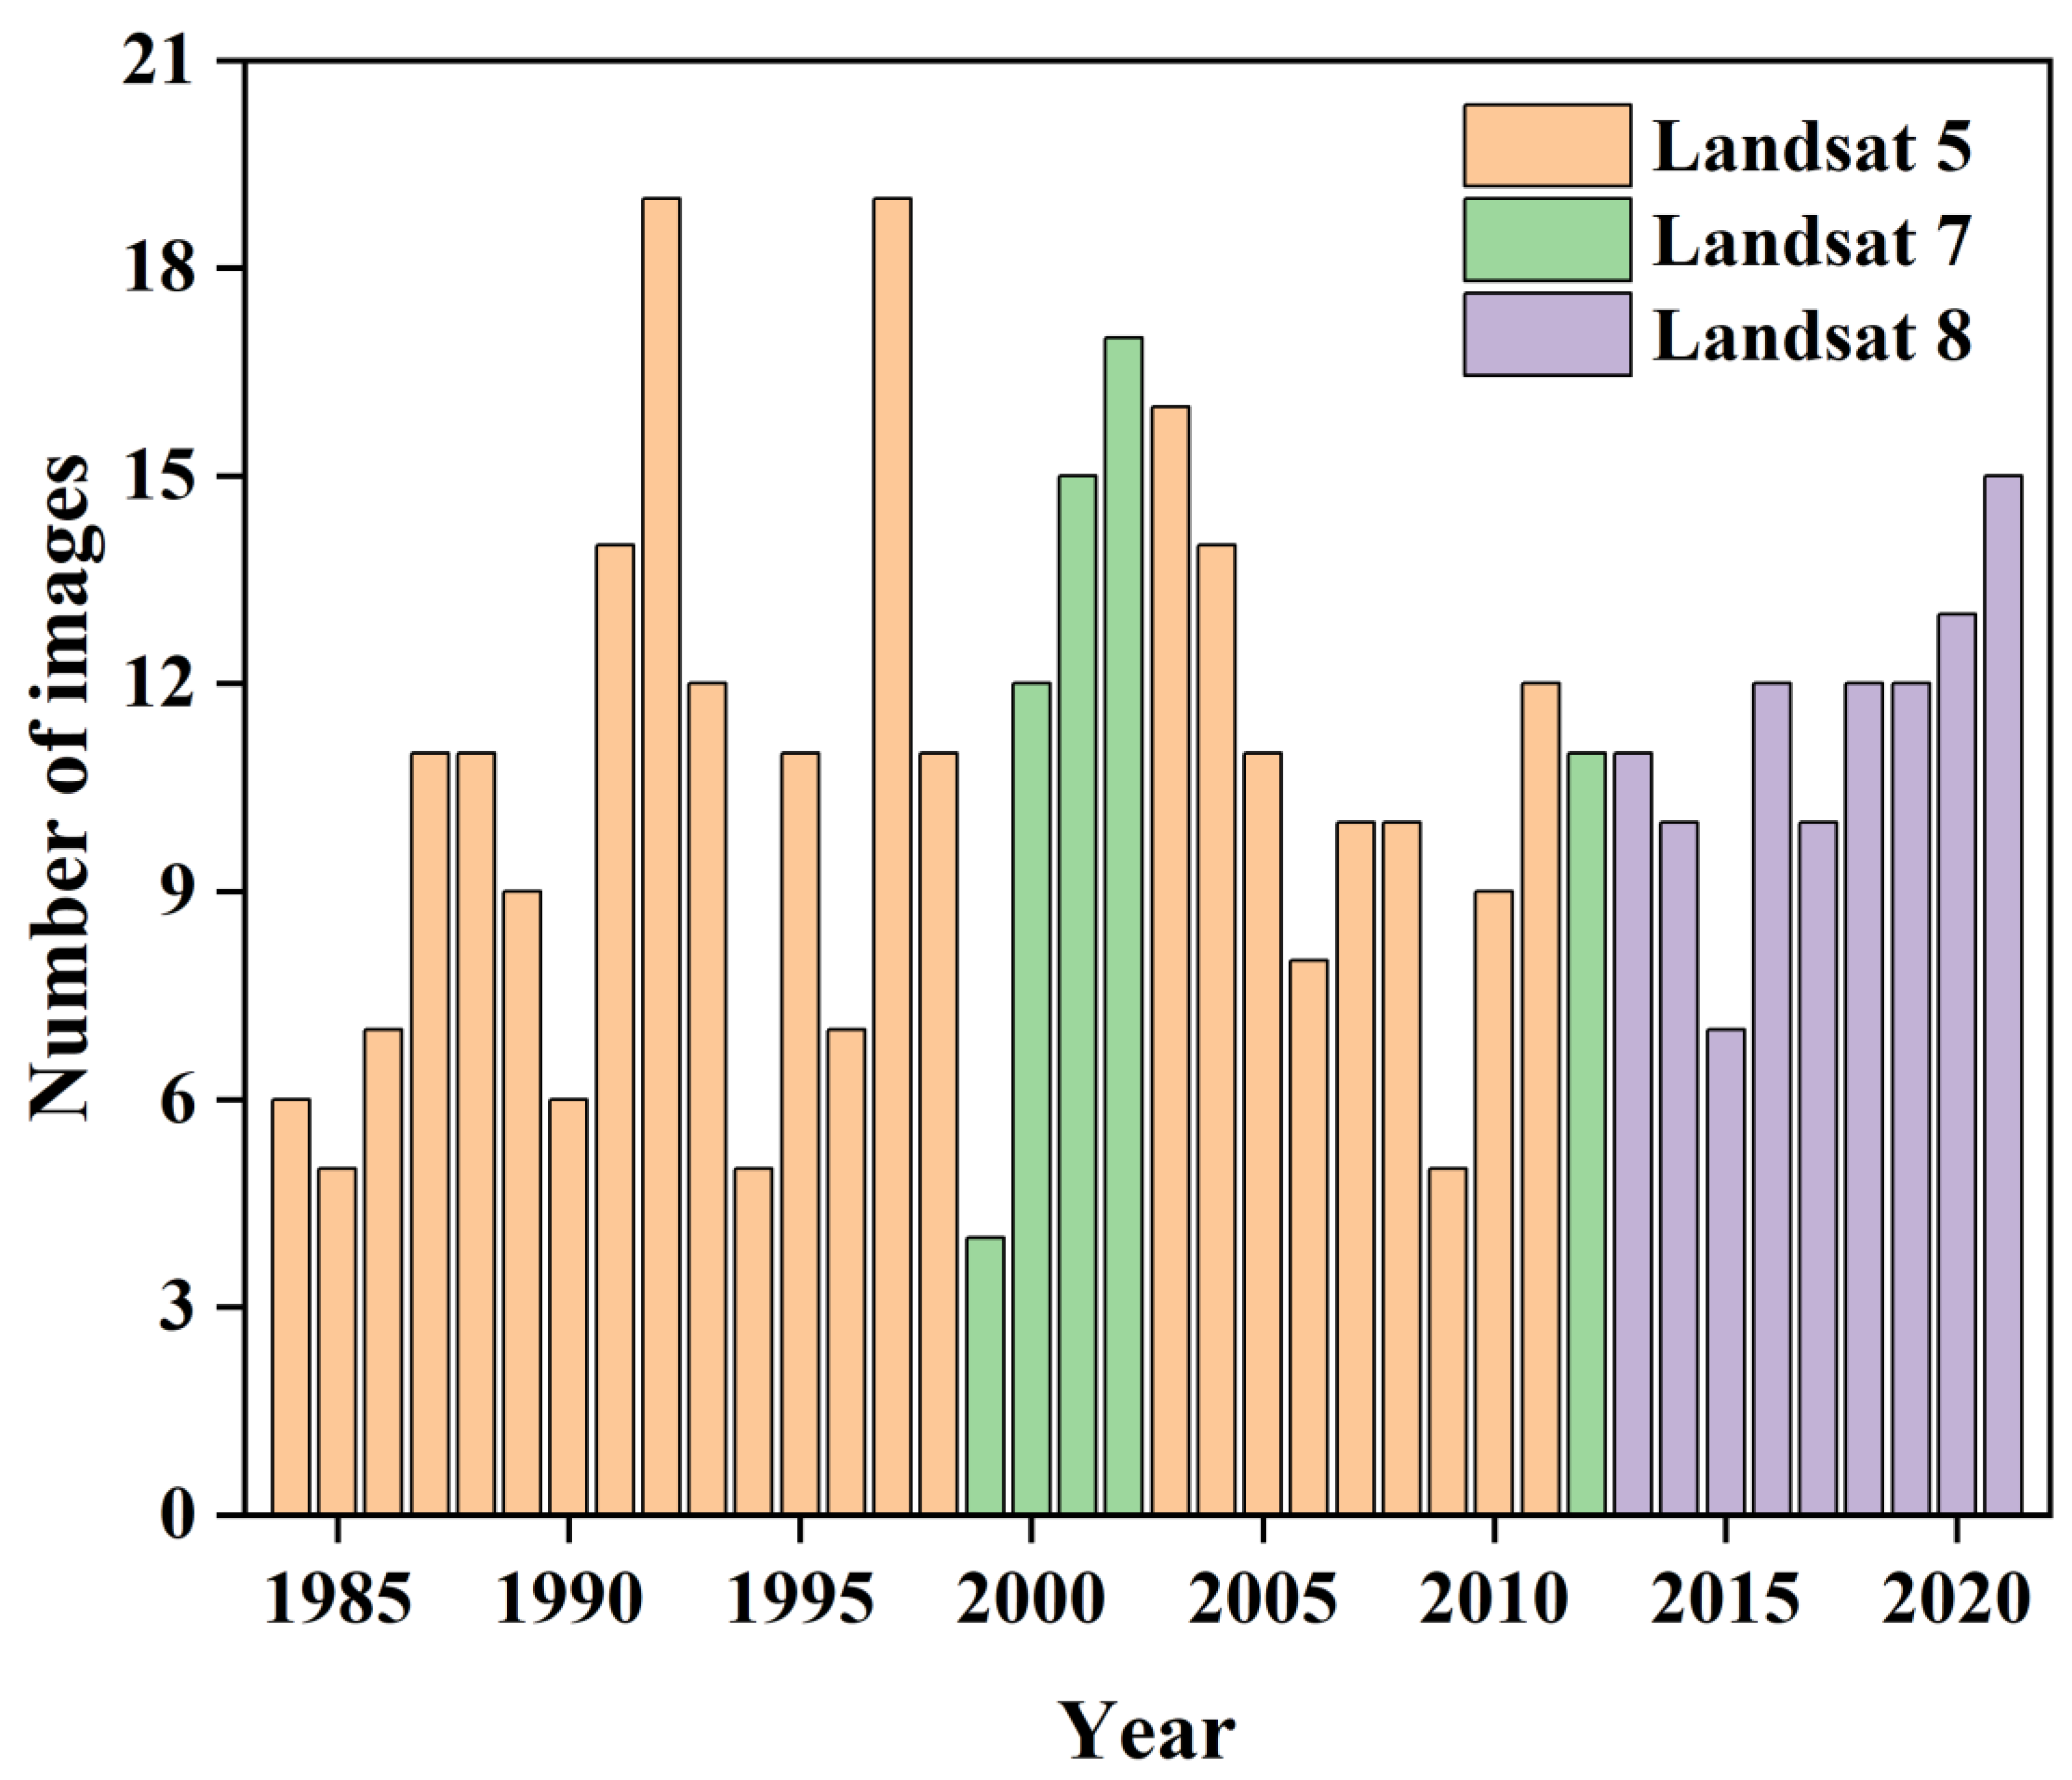
2.2.1. Landsat Image Data

In this paper, time-series Landsat images with a moderate spatial resolution (30 m) and a revisit period of 16 days were used to identify and map cyanobacterial blooms in Taihu Lake. Previously, Landsat images were downloaded from the United States Geological Survey (USGS) website [28], but these are now archived on GEE [29]. We used all the available Landsat 5/7/8 surface reflectance images for low cloud cover (<20%) from 1984 to 2021. The Landsat series data provided by GEE were atmospherically corrected (i.e., Level 2 product). A total of 409 Landsat images were acquired. Figure 2 shows the annual number of Landsat images for the period of 1984–2021. The data-preprocessing operation, including cloud removal, clipping, and image composition, was completed on the GEE platform. In addition, in order to facilitate the extraction of cyanobacteria blooms, the FAI [30] was calculated and added to each image of the preprocessed collection.

2.2.2. Other Data

In this study, we collected the meteorological, water quality, and human activity data of Taihu Lake. Due to the paucity of water quality data for some years, we only obtained data between 1991 and 2018, which exceeded 70% of the time span in this study (1984–2021). Therefore, we believed that the amount of data was sufficient for the analysis of this study.
Meteorological data included the annual mean temperature (T), annual precipitation (P), annual maximum wind speed (WS), and annual sunshine hours (SH) of Taihu Lake. These meteorological data were acquired from the Dongshan Meteorological Station (station no. 58358, 31°04′ N, 120°26′ E) on the China Meteorological Data Sharing Service System [31].
The water quality factor data included the total nitrogen (TN), total phosphorus (TP), Secchi disk depth (SD), chemical oxygen demand (CODMn), and chlorophyll a (Chla). The water quality data for 1991–1997 were collected from the National Earth System Science Data Center [32] and the published literature [33]. In addition, water quality data for other years were obtained from the Taihu Basin Authority of the Ministry of Water Resources [34]. Based on the above data, we calculated the comprehensive trophic level index (TLI) [35] to represent the eutrophication level of Taihu Lake from 1991 to 2018.
The human activity data, including the population (POP) and the gross domestic product in primary industries (PGDP), secondary industries (SGDP), and tertiary industries (TGDP) in the surrounding cities of Taihu Lake, were collected from the China City Statistical Yearbook [36].

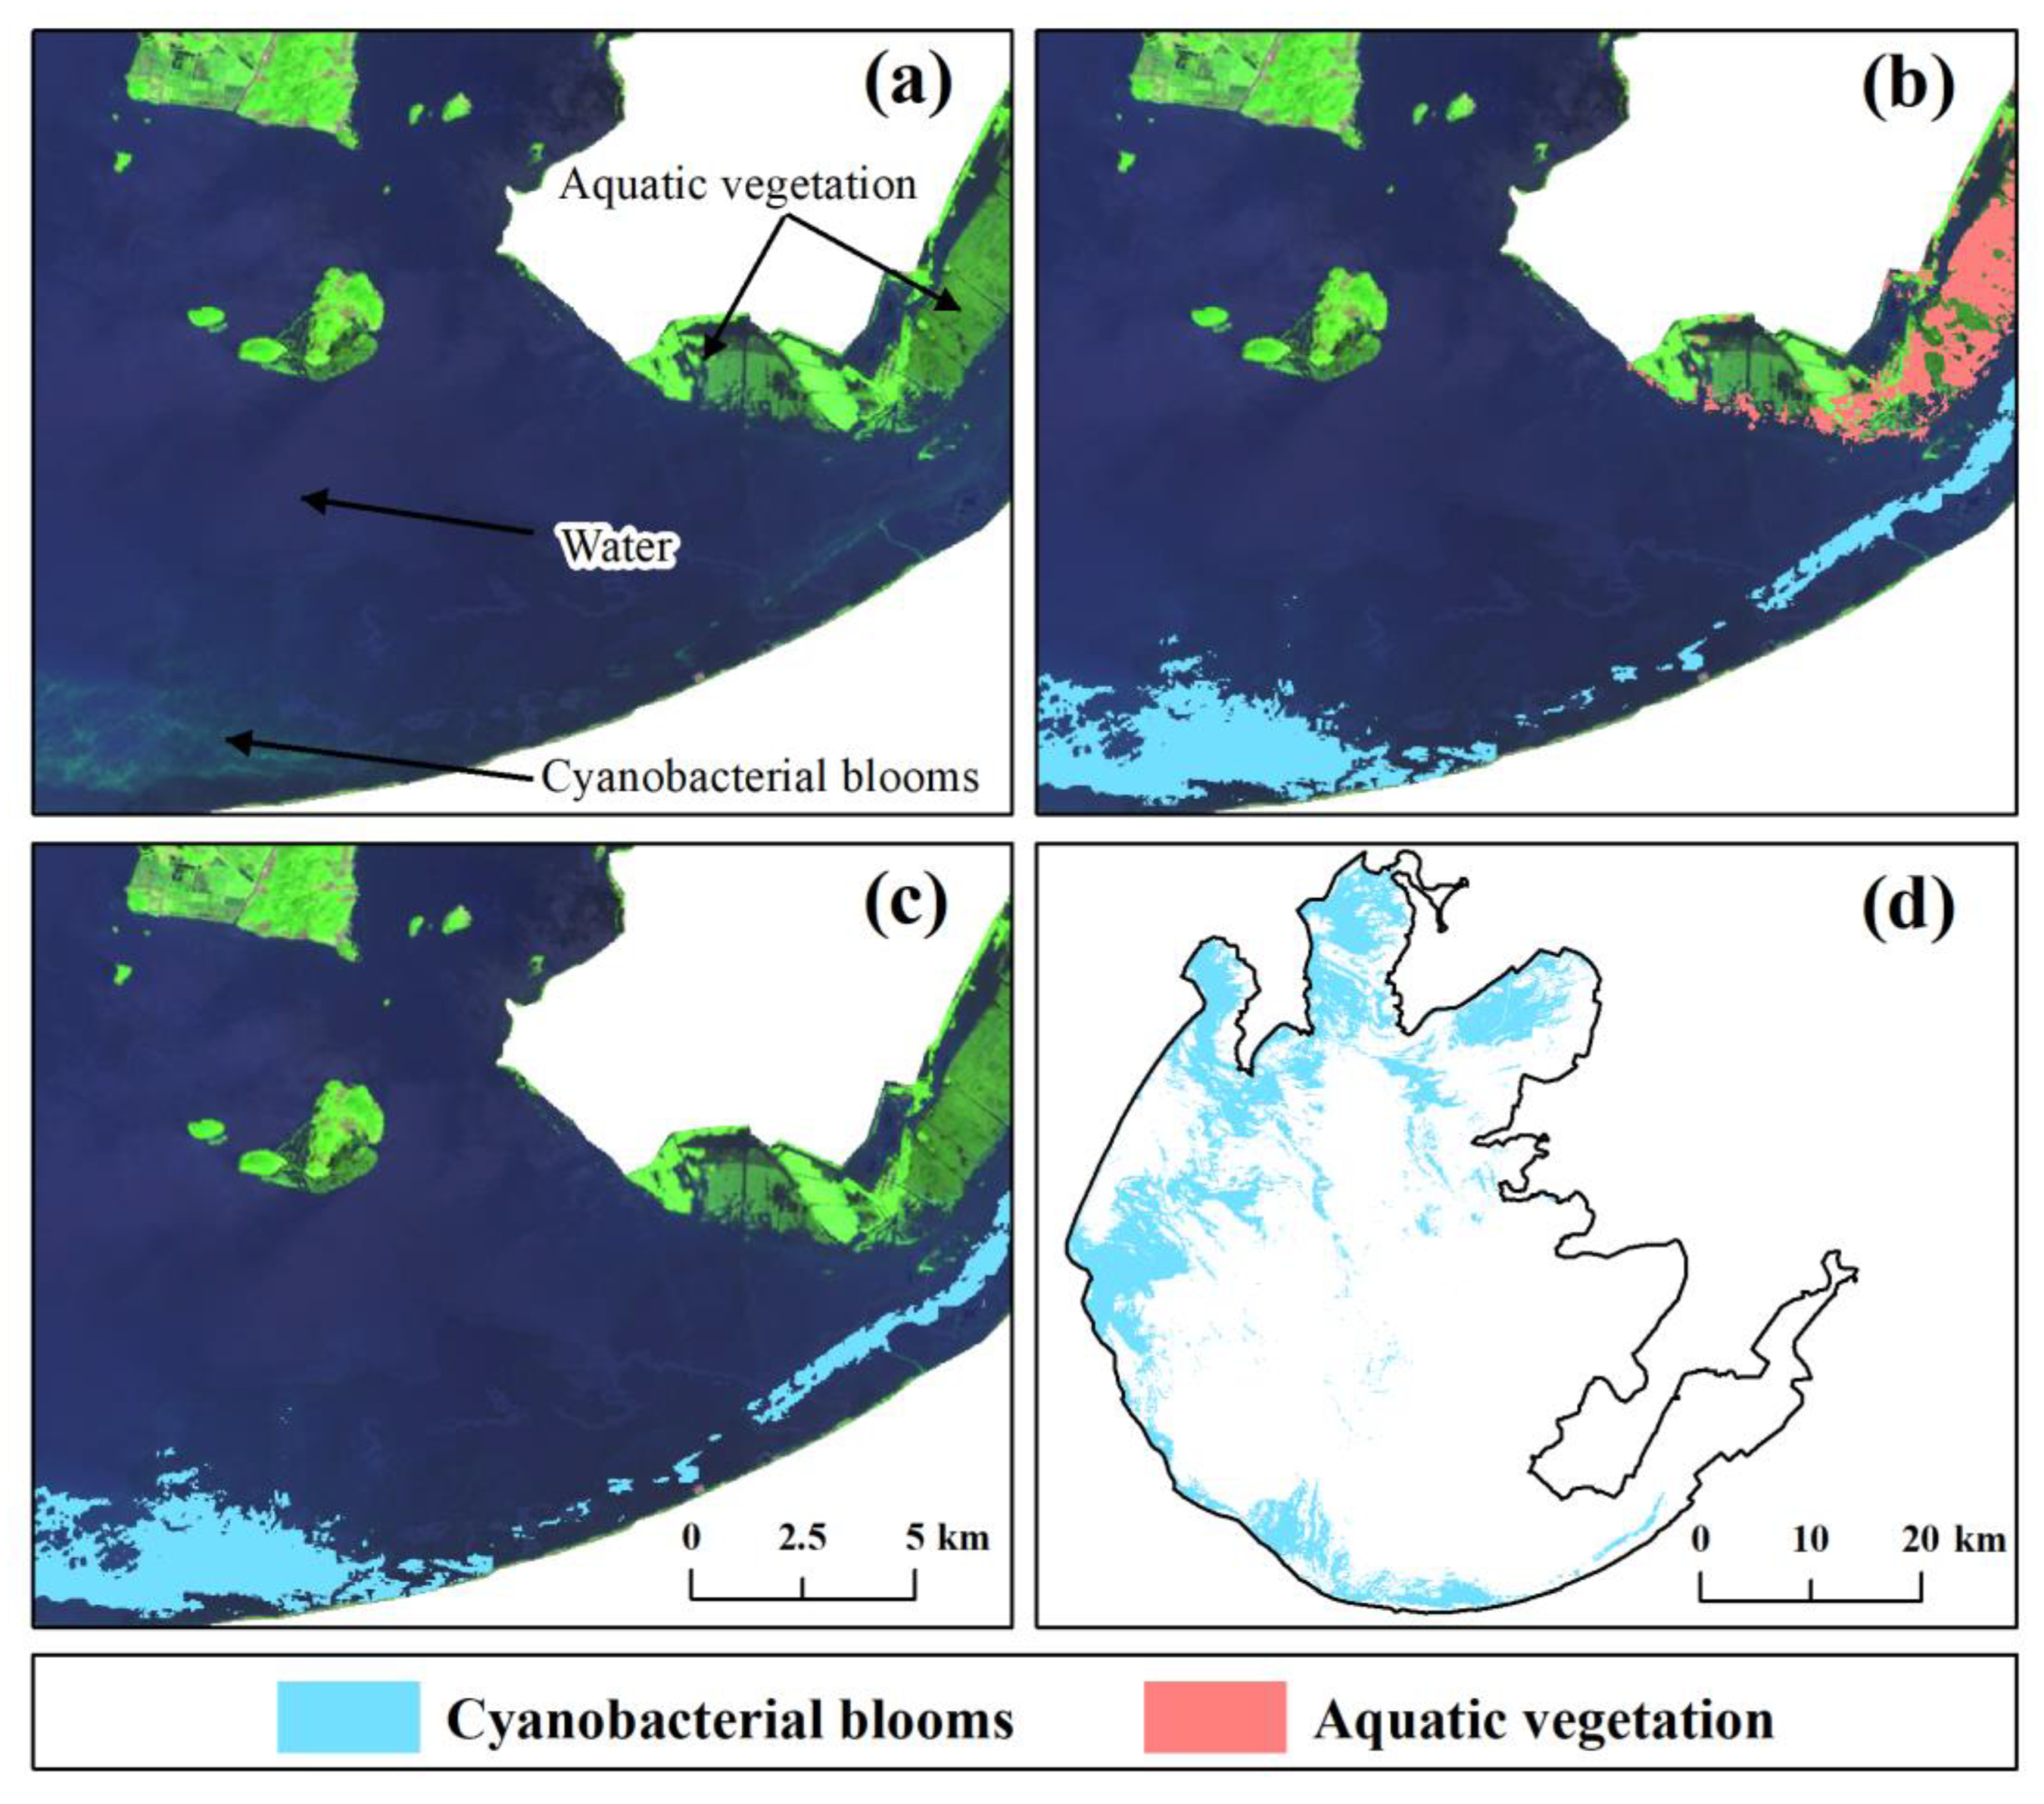
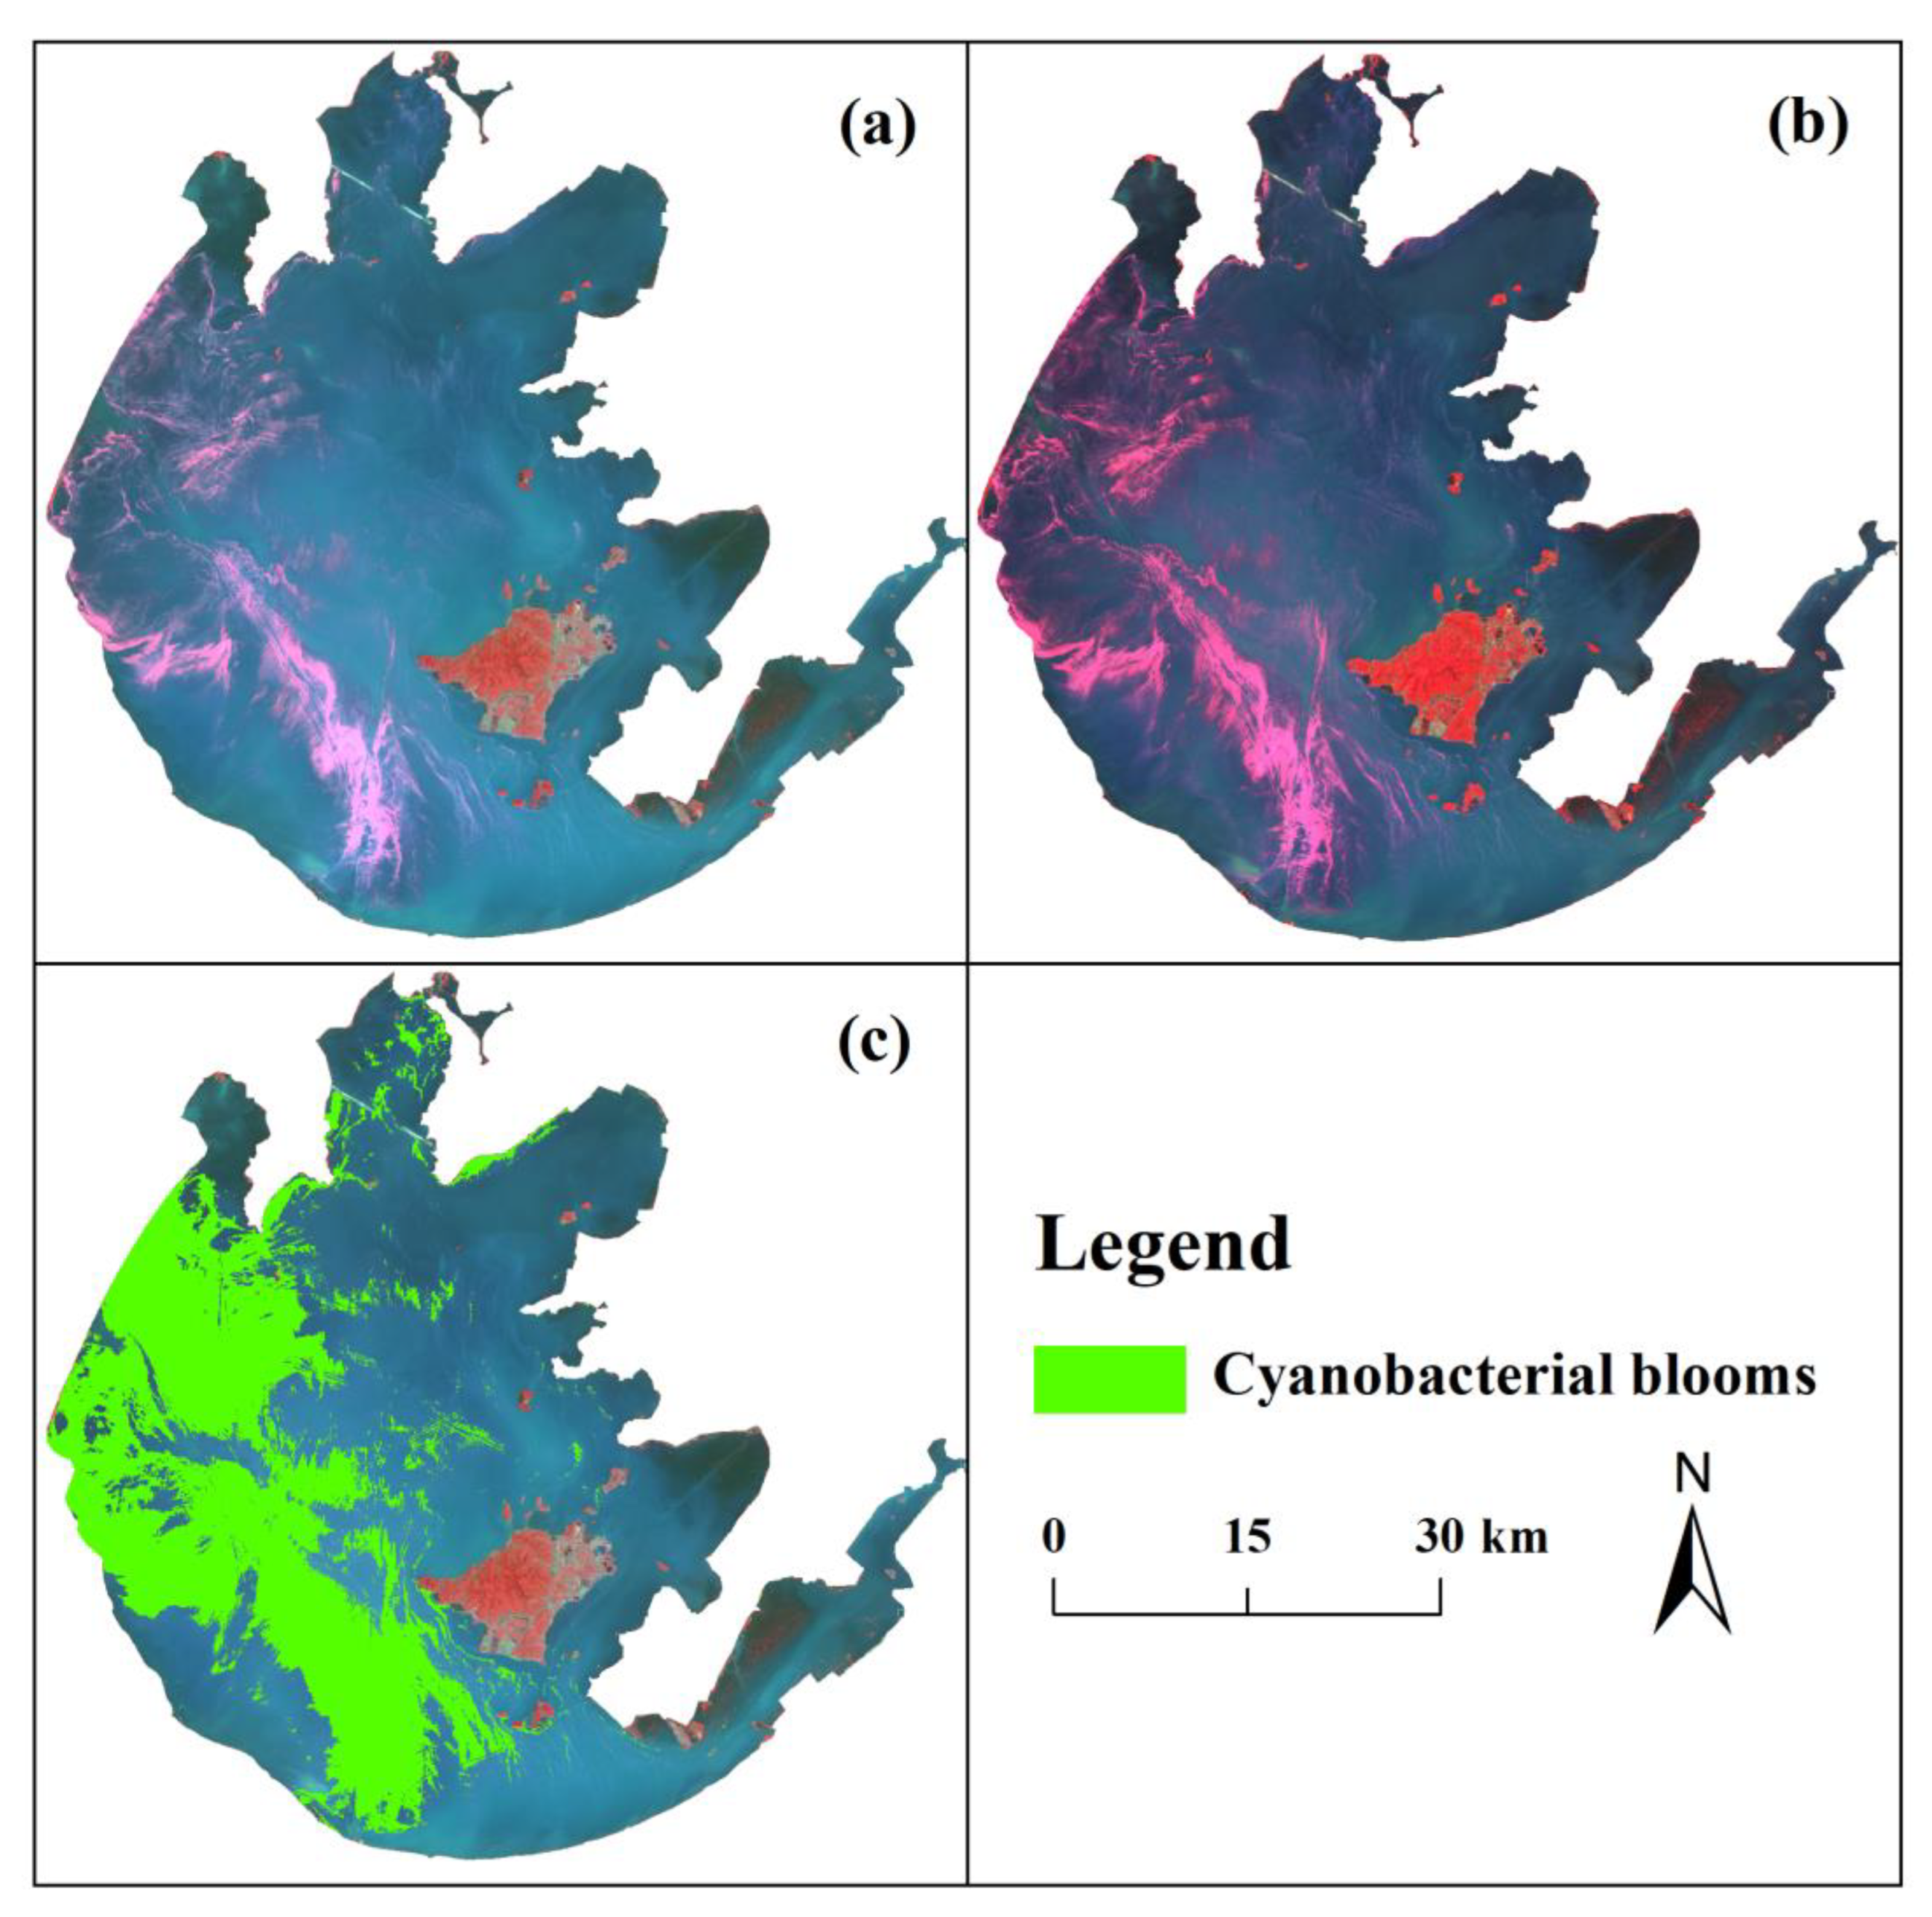
2.3. Annual Mapping of Cyanobacterial Blooms

Compared to land surfaces, water strongly absorbs light at the red-NIR-SWIR wavelengths. In fact, due to this high absorption, water is opaque or ‘black’ in SWIR wavelengths, even in the most turbid environments. This provides the basis for the use of these wavelengths to correct for atmospheric effects [37]. In addition, algae floating on the water surface have a higher reflectance in the NIR than in the other wavelengths and can be easily distinguished from the surrounding water. The difference between NIR and a baseline between red and SWIR1 band reflectance can be used to detect floating algae [38]. Therefore, we selected the FAI to monitor the interannual dynamics of cyanobacterial blooms in Taihu Lake. Although the FAI was originally calculated using MODIS data [38], it can also be computed based on the NIR, red, and SWIR1 band reflectance of Landsat imagery, using a linear baseline algorithm [15]. The FAI is defined as
FAI = ρ NIR ρ red + ρ SWIR 1 ρ red × λ NIR λ red λ SWIR 1 λ red
where ρNIR, ρred, and ρSWIR1 are the surface reflectance values in the near-infrared, red, and shortwave infrared bands, respectively. λNIR, λred, and λSWIR1 are the center wavelengths for these bands (on the GEE cloud platform, λNIR = 835 nm, λred = 660 nm, λSWIR1 = 1650 nm for landsat 5 TM or landsat 7 ETM+; λNIR = 865 nm, λred = 655 nm, λSWIR1 = 1609 nm for Landsat 8 OLI).
Hu et al. [39] found that the FAI > −0.004 can be used as a distinguishing threshold for cyanobacterial blooms. Based on this threshold, we obtained the preliminary extraction result; those pixels with FAI values greater than −0.004 were defined as cyanobacterial blooms and the remaining were non-cyanobacterial pixels. However, aquatic vegetation dominates in the East Bay [16]. The optical characteristics of aquatic vegetation were similar to those of floating cyanobacteria, and the FAI thresholds were unable to distinguish between the two. Therefore, both cyanobacterial blooms and aquatic vegetation pixels were present in the initial extraction results (Figure 3a,b). Then, pixels falling into aquatic vegetation zone were excluded by manual modification (Figure 3c), which could be reliably detected visually by the operator. The final extraction results of the cyanobacterial blooms in Taihu Lake in 2021 are shown in Figure 3d.

2.4. Spatiotemporal Dynamics of Annual Cyanobacterial Blooms

We calculated the two parameters developed by Zong et al. [40] to analyze the interannual dynamics of cyanobacterial blooms: the yearly cyanobacterial bloom area percentage (CAP) and the cyanobacterial bloom frequency index (CFI). The CAP represents the extent of cyanobacterial bloom coverage, while CFI reflects the frequency of occurrence. The formulae are as follows:
CAP = N CB N total × 100 %
CFI = i = 0 n i · N i N total
where NCB is the total number of pixels with FAI values greater than −0.004, Ntotal is the total number of pixels in the Taihu Lake, i is the number of instances of FAI greater than −0.004 in the pixels, n is the maximum number of instances of Taihu Lake, and Ni is the total number of pixels with an FAI greater than −0.004 detected i times.

2.5. Accuracy Validation

The accuracy evaluation is crucial to the verification of the spatial distribution of cyanobacteria blooms. Ideally, field data are the best reference for validating the extraction results, but they are difficult to achieve in practice [16,40]. Hence, we used two other methods to validate the coverage of cyanobacterial blooms extracted from Landsat images. The first method involved a comparison with concurrent higher-resolution observations [39,40]. We overlaid the cyanobacterial bloom distribution extracted from Landsat images with Sentinel-2 images of the same period and visually checked the consistency of the two. The second method was to compare our extraction results with those of other studies [16]. The results of similar studies verified the cyanobacterial bloom coverage in this study at different periods.

2.6. Driver Analysis

To assess the impact of environmental factors (represented by T, P, WS, SH, and TLI) on cyanobacterial blooms’ characteristics (including CAP and CFI), we conducted a Spearman correlation analysis and PCA. Through a Spearman correlation analysis, the effects of various meteorological or water quality factors on cyanobacterial blooms in Taihu Lake were separately displayed. The PCA was carried out to identify the key drivers of the annual cyanobacterial blooms’ dynamics in Taihu Lake. Firstly, in order to reduce the analytical error caused by the difference in values between different indicators, the environmental monitoring data were standardized by the Z-Score separately. Then, KMO and Bartlett tests were performed on the data, and the KMO values were all greater than 0.6 and the Bartlett significance was less than 0.05, which proved that PCA could be performed. Finally, the principal components with eigenvalues greater than 1 were extracted. All of the data analyses were carried out using SPSS 19.0 [41], and graphs were generated by OriginPro 2022b [42].

3. Results

3.1. Accuracy Validation

3.1.1. Accuracy Assessment for Cyanobacterial Bloom Map

The spatial texture of cyanobacterial blooms can be easily recognized through 30 m resolution Landsat true color imagery [16,39]. Therefore, the accuracy can be verified using Sentinel-2 images with higher resolution (10 m). Since Landsat and Sentinel-2 have different transit times, different wind or cloud environments may lead to spatial differences between the two images, but it is guaranteed that they have similar spatial information at shorter intervals (i.e., within a few hours) in most cases. The cyanobacterial bloom coverage extracted from Landsat images based on FAI > −0.004 was in general agreement with the visual inspection of Sentinel-2 images (Figure 4a–c), confirming the accuracy of our extraction results. However, in some areas, our extracted cyanobacteria bloom coverage was greater or lower than that in practice, which may be related to the resolution of the images.

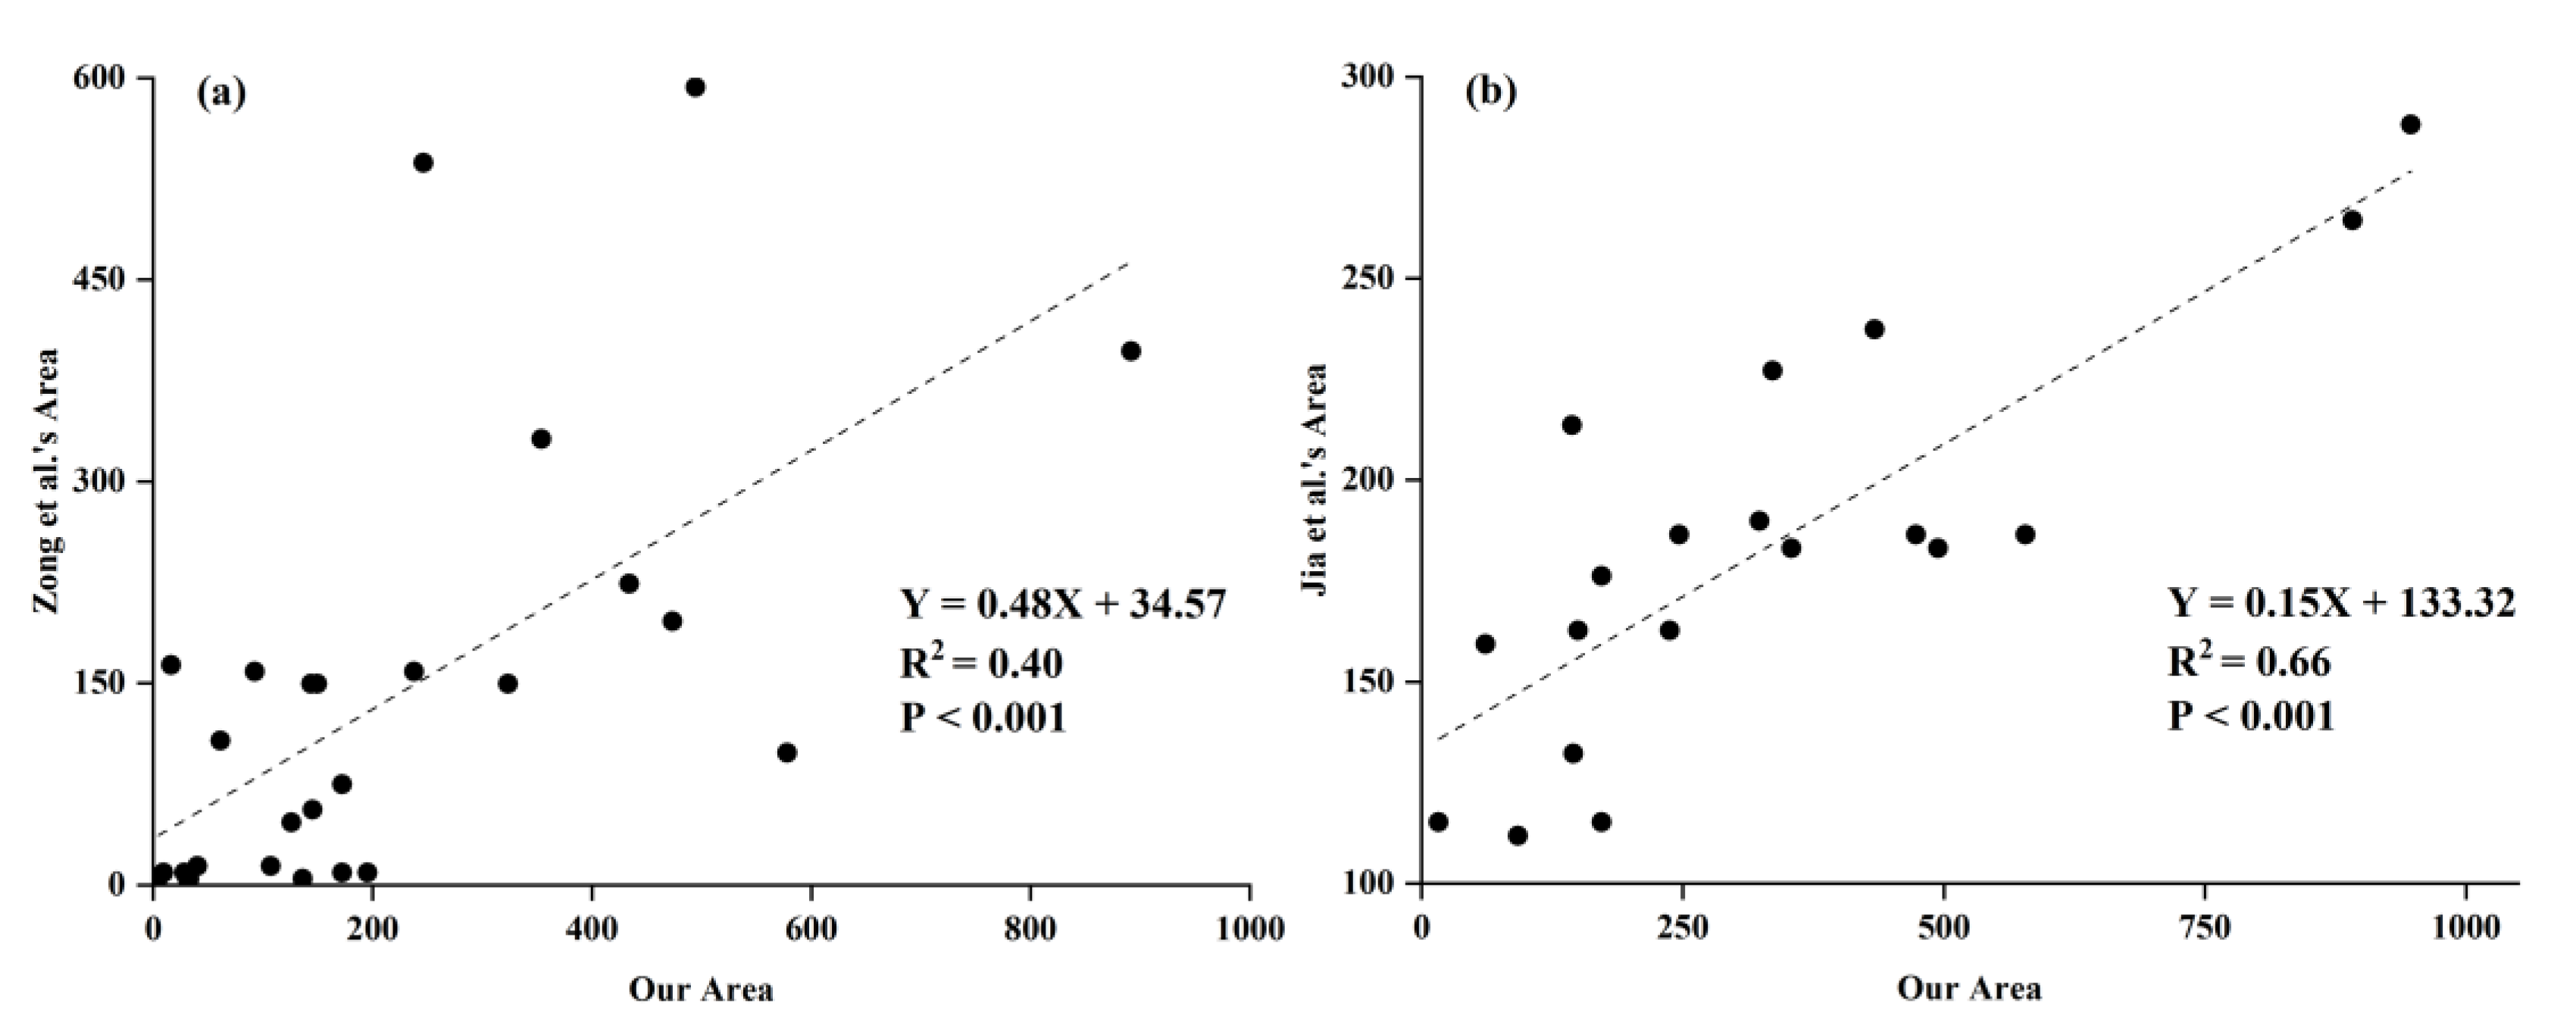
3.1.2. Accuracy Assessment for Annual Cyanobacterial Bloom Area

Our research focused on the long time-series variation of the spatial distribution of cyanobacterial blooms in Taihu Lake. Long-term trend dynamics should receive more attention than short-term and local details. Thus, in addition to qualitatively comparing our maps with others, we also used the area from Zong et al. [40] and Jia et al. [16] to quantitatively validate our results (Figure 5). The area of this study showed a general correlation with that of Zong et al.; the coefficient of determination (R2) was equal to 0.4, and the linear slope was 0.48. The linear regression analysis between our annual cyanobacteria bloom area and that of Jia et al. showed that the correlation was good, the fitting effect was good, the determination coefficient (R2) was close to 0.7, and the linear slope was 0.15.

3.2. Spatiotemporal Dynamics of Annual Cyanobacterial Blooms

The spatial dynamics of cyanobacterial blooms in Taihu Lake were mapped at a fine scale based on Landsat data (Figure 6). The results show that the spatial information of cyanobacterial blooms could be clearly observed, and the spatial distribution was relatively aggregated, mostly in blocks or strips. Initially, cyanobacterial blooms were mainly found in Zhushan Bay, Meiliang Bay, and Gong Bay in the northwestern part of the lake. Subsequently, they began to spread to the central and western parts of the lake. Since the 21st century, they have rapidly taken over most of the West Lake, South Lake, and Central Lake. In 2017, almost the entirety of Taihu Lake was occupied. In recent years, the expansion of cyanobacterial blooms has eased, with the Central Lake’s cyanobacterial blooms almost disappearing, but sporadic blooms have started to appear in the East Lake and East Bay.
As shown in Figure 7, the CAP for cyanobacterial blooms across the lake has increased consistently over the last 40 years (from 0.05% to 38.28%, p < 0.05). From 1984 to 2004, the CAP changes were more stable, fluctuating from 0.05% to 7.89%. From 2005 to 2010, the CAP fluctuated more, reaching 36.03% in 2007. The CAP then declined but remained in a high range, peaking in 2017 (38.28%). All eight sub-lakes showed a significant upward trend in CAP, except for the East Lake. The Central Lake’s CAP ranged from 0 to 14.76%. The East Bay and East Lake had a CAP of 0–0.42%. The CAP of Gong Bay was 0–2.61%. The CAP for Meiliang Bay ranged from 0.02 to 3.61%. The CAP for the South Lake ranged from 0 to 10.04%. The West Lake’s CAP ranged from 0 to 9.05%. The CAP for Zhushan Bay ranged from 0 to 2.27%.

3.3. Interannual Changes in the Frequency of Cyanobacterial Blooms

Across the entire lake, the CFI showed a significant upward trend (from 0.0005 to 0.66, p < 0.05) (Figure 8). In 2017, the CFI of the entire lake reached a peak of 0.66. Cyanobacterial blooms occurred more frequently in the Central Lake, South Lake, and West Lake. From 1984 to 2021, the CFI continued to increase in all lake areas except the East Lake and East Bay (where the CFI was almost zero). Specifically, between 1984 and 2004, the CFI of the western and northern lake areas increased each year, particularly in Zhushan Bay. However, the CFI of the Central Lake and South Lake remained stable. From 2005 to 2010, all lake areas showed a significant increase in CFI. Although there have been clear points of decline in the CFI across all lake areas after 2010, the values remain high and have continued to increase in recent years.

3.4. Drivers of Annual SpatioTemporal Changes in Cyanobacterial Blooms

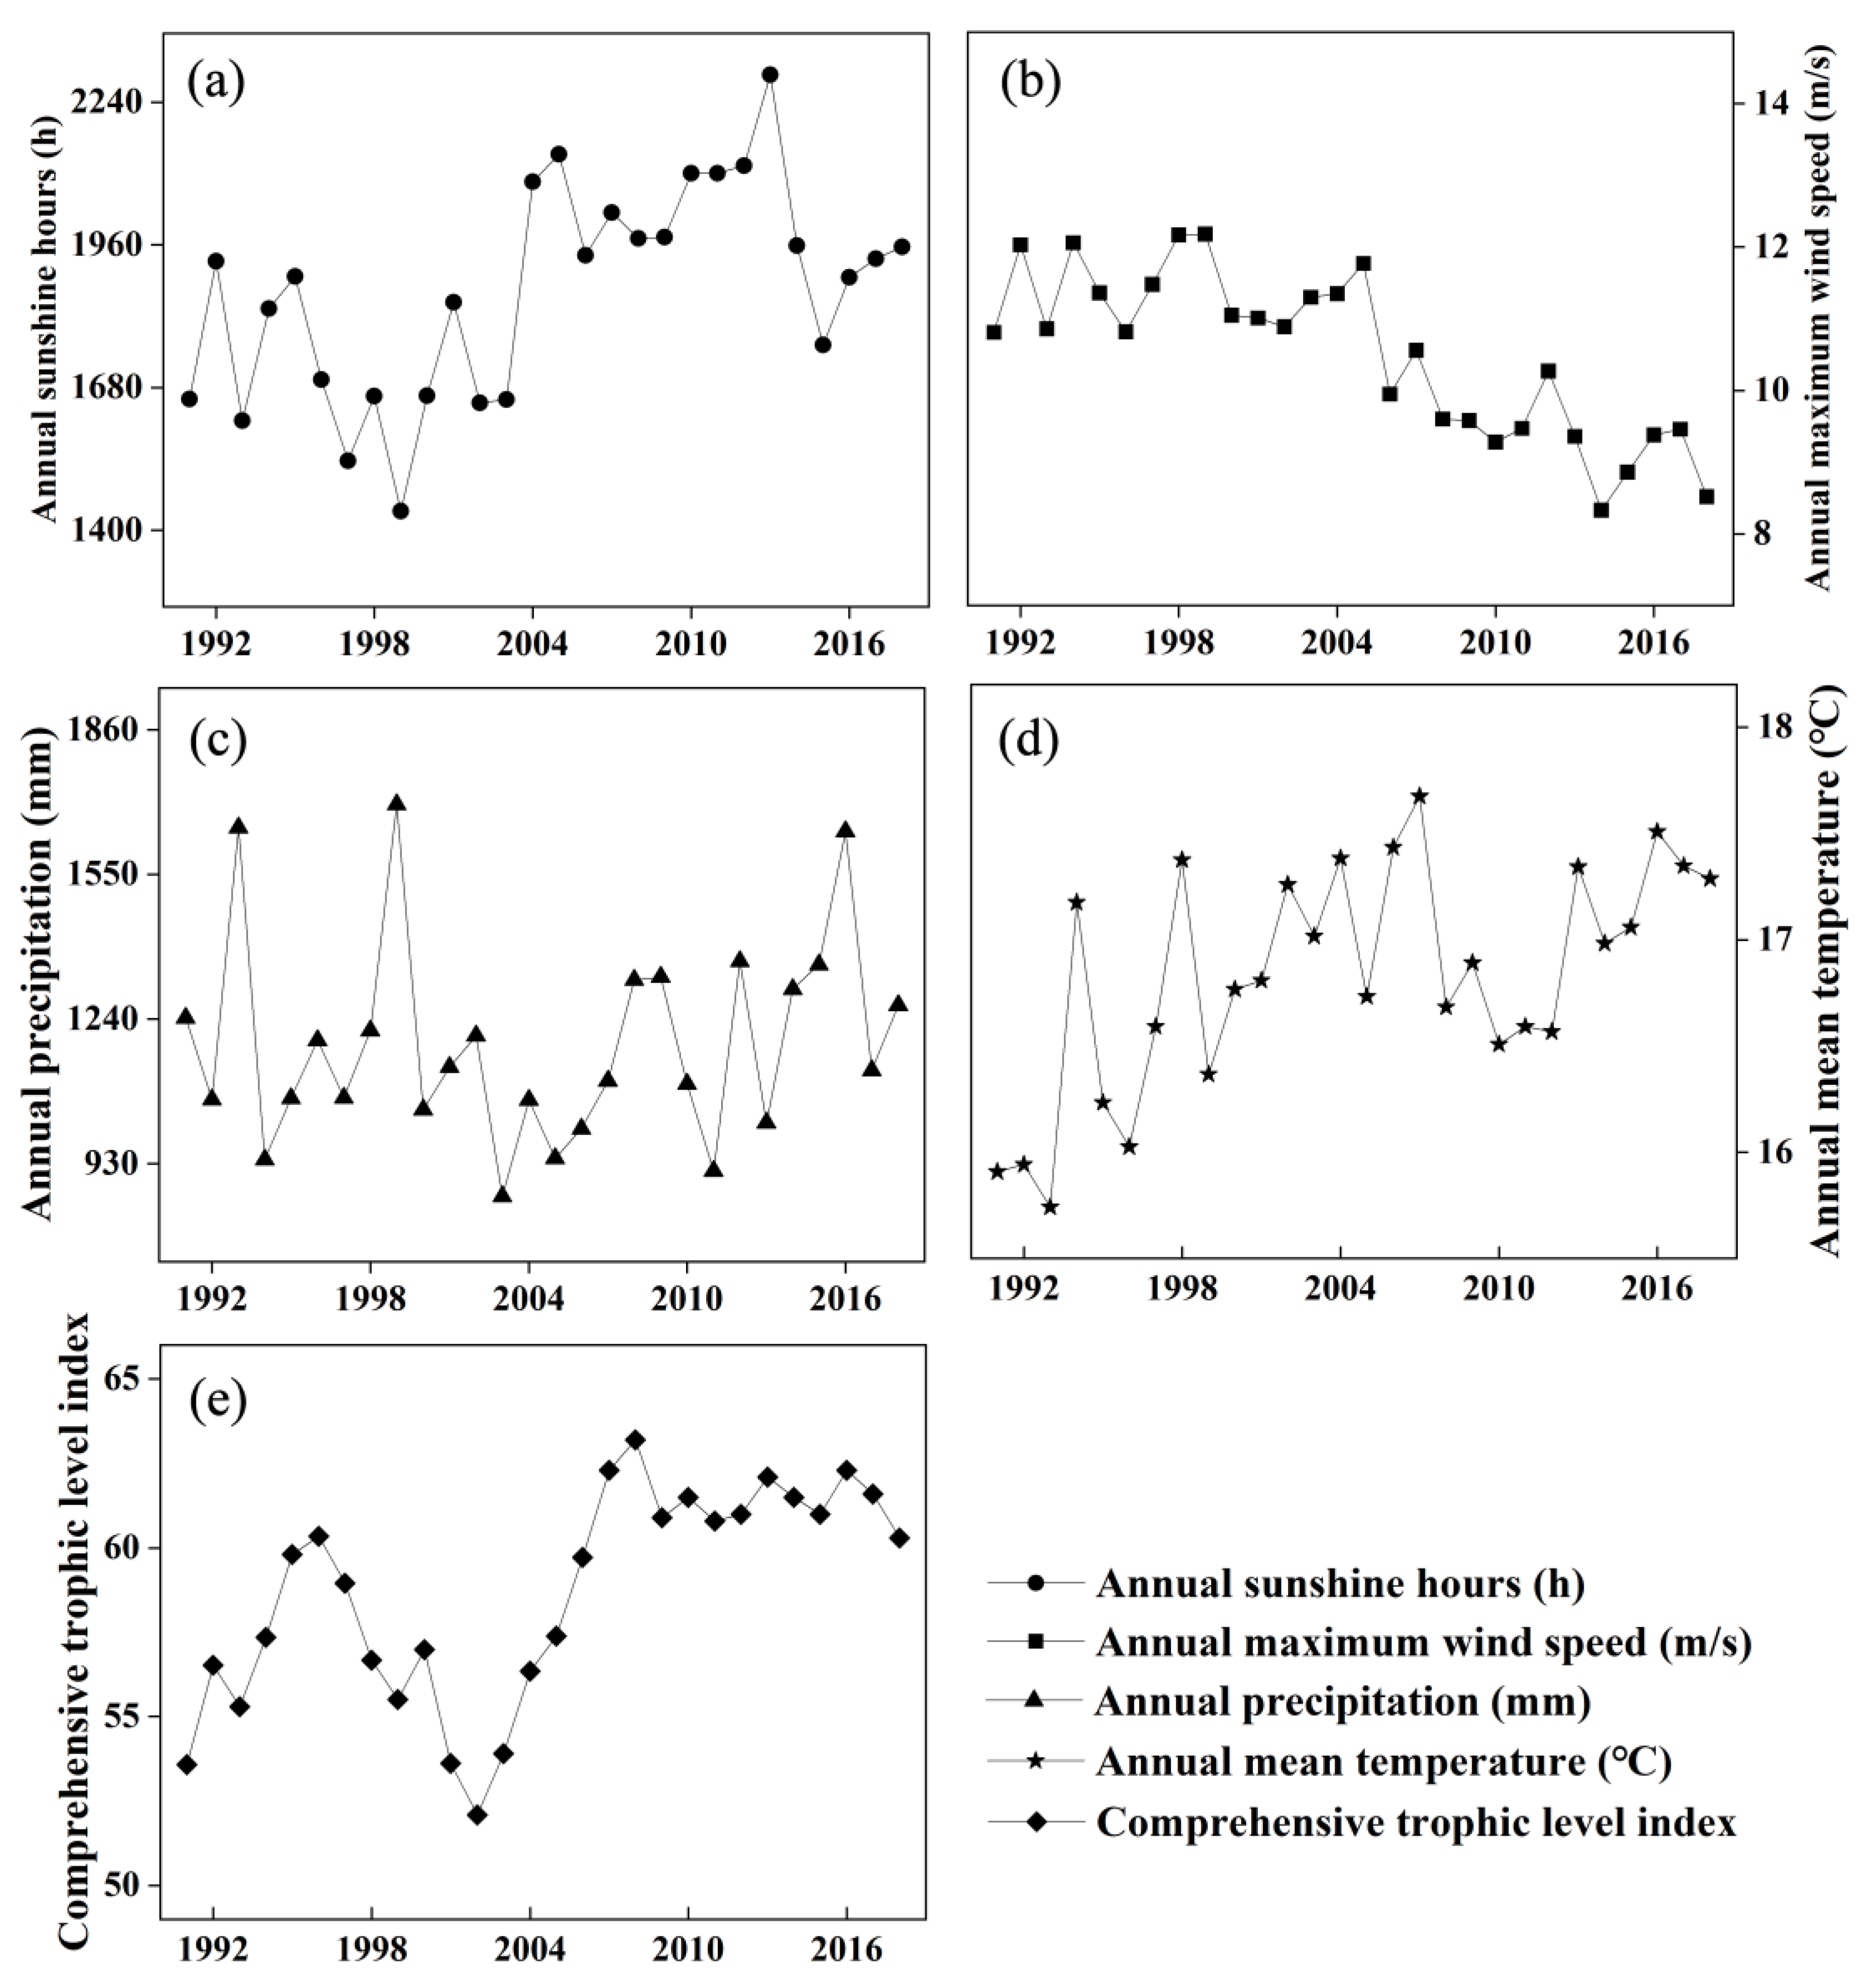
3.4.1. Meteorological and Water Quality Changes

Figure 9 shows the interannual variation in SH, WS, P, T, and TLI from 1991 to 2018. SH shows an overall upward trend, with a high value from 2004 to 2013 compared to the period before 2004, and a lower value in recent years. From 1990 to 2020, WS showed a decreasing trend, with the lowest value occurring around 2015, which may have contributed to the cyanobacterial bloom outbreak in 2017. Despite the two peaks, P was more stable before 2005, and after 2005, there was an upward trend. T showed an upward and then downward trend, with the pivotal year being around 2007, but after 2012, there was a significant recovery in temperature. Between 1990 and 2002, the TLI rose and then fell. After this period, the TLI increased significantly. The eutrophication level of Lake Tai has been at a high level in recent years.

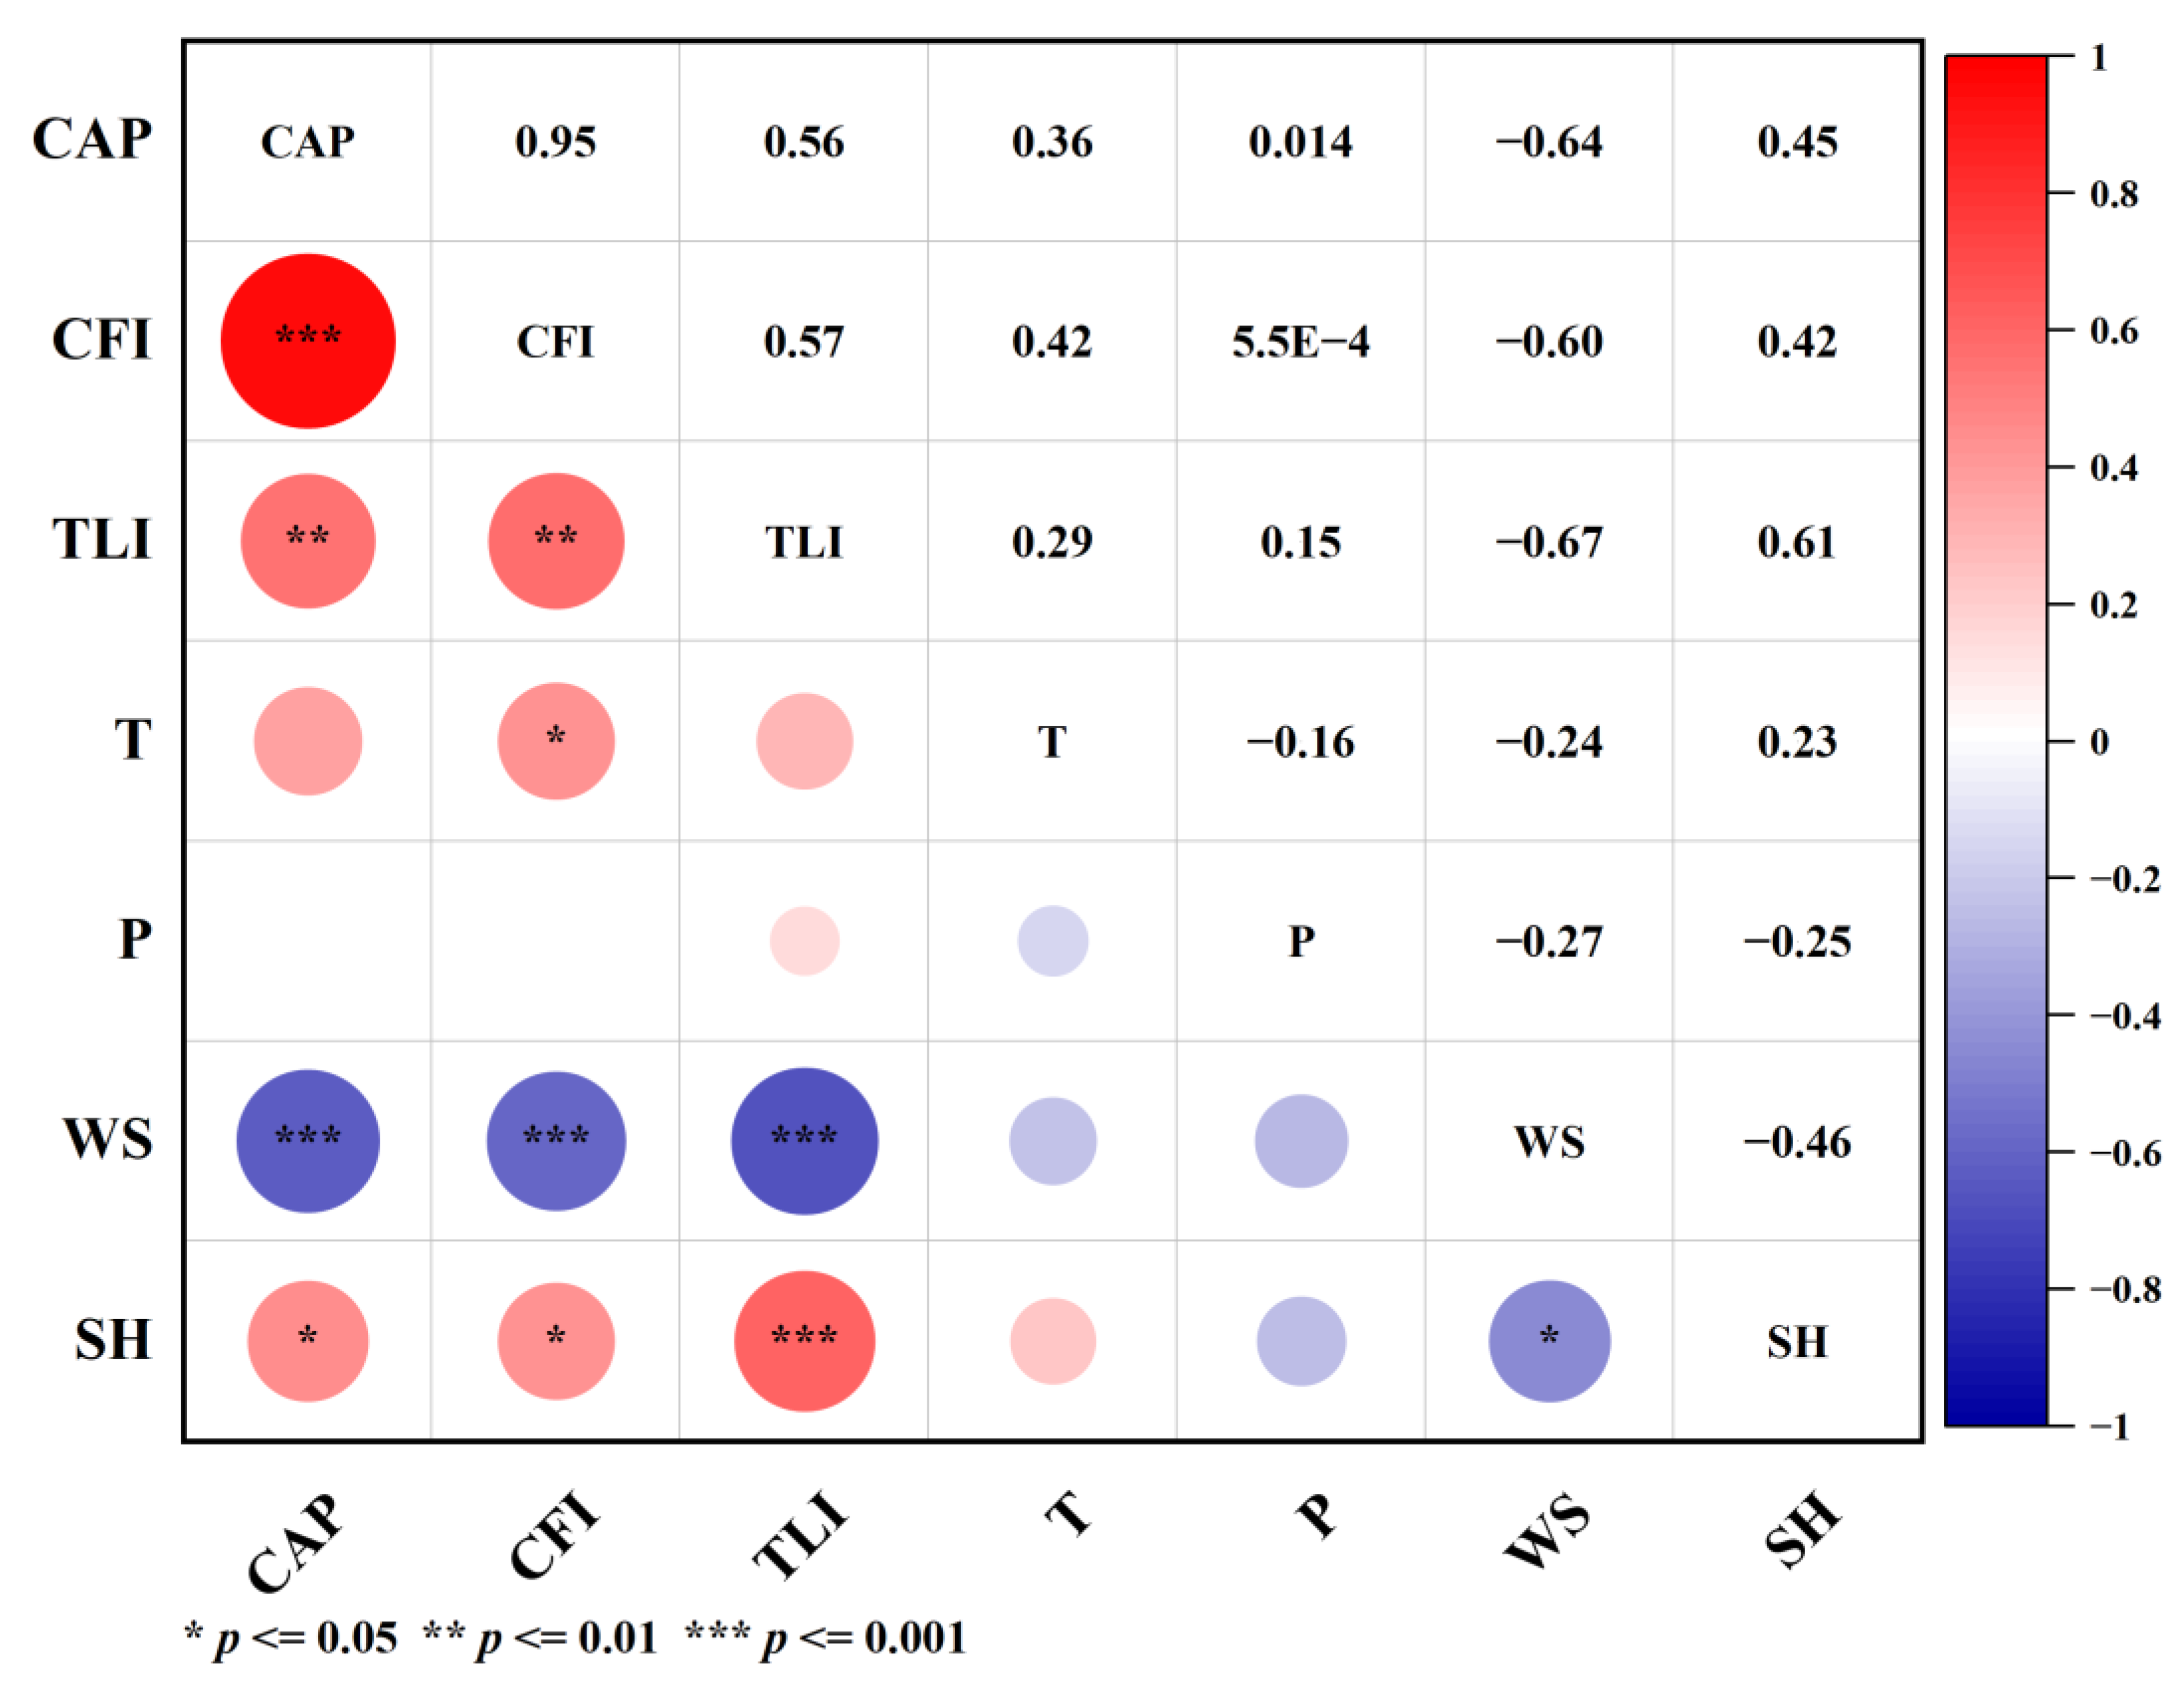
3.4.2. Influence of Individual Meteorological or Water Quality Factor

The influences of individual meteorological or water quality factors on the interannual characteristics (CAP and CFI) of the cyanobacterial blooms in Taihu Lake were determined via the Spearman correlation coefficient (Figure 10). The TLI had a highly significant positive correlation with CAP and CFI (p < 0.01); the correlation coefficients were 0.56 and 0.57, respectively. SH was significantly positively correlated with CAP and CFI (p < 0.05); the correlation coefficients were 0.45 and 0.42, respectively. T was positively correlated with CAP and CFI; the correlation coefficients were 0.36 and 0.42, respectively. P was associated with CAP and CFI, showing a weak positive correlation, and the correlation coefficients were 0.014, 5.5 × 10⁻⁴, respectively. In contrast, WS had a highly significant negative correlation with CAP and CFI (p < 0.001), and the correlation coefficients were −0.64 and 0.60, respectively. In terms of the absolute values of the correlation coefficients, the influence of TLI and WS on cyanobacterial blooms was greater than that of other factors.

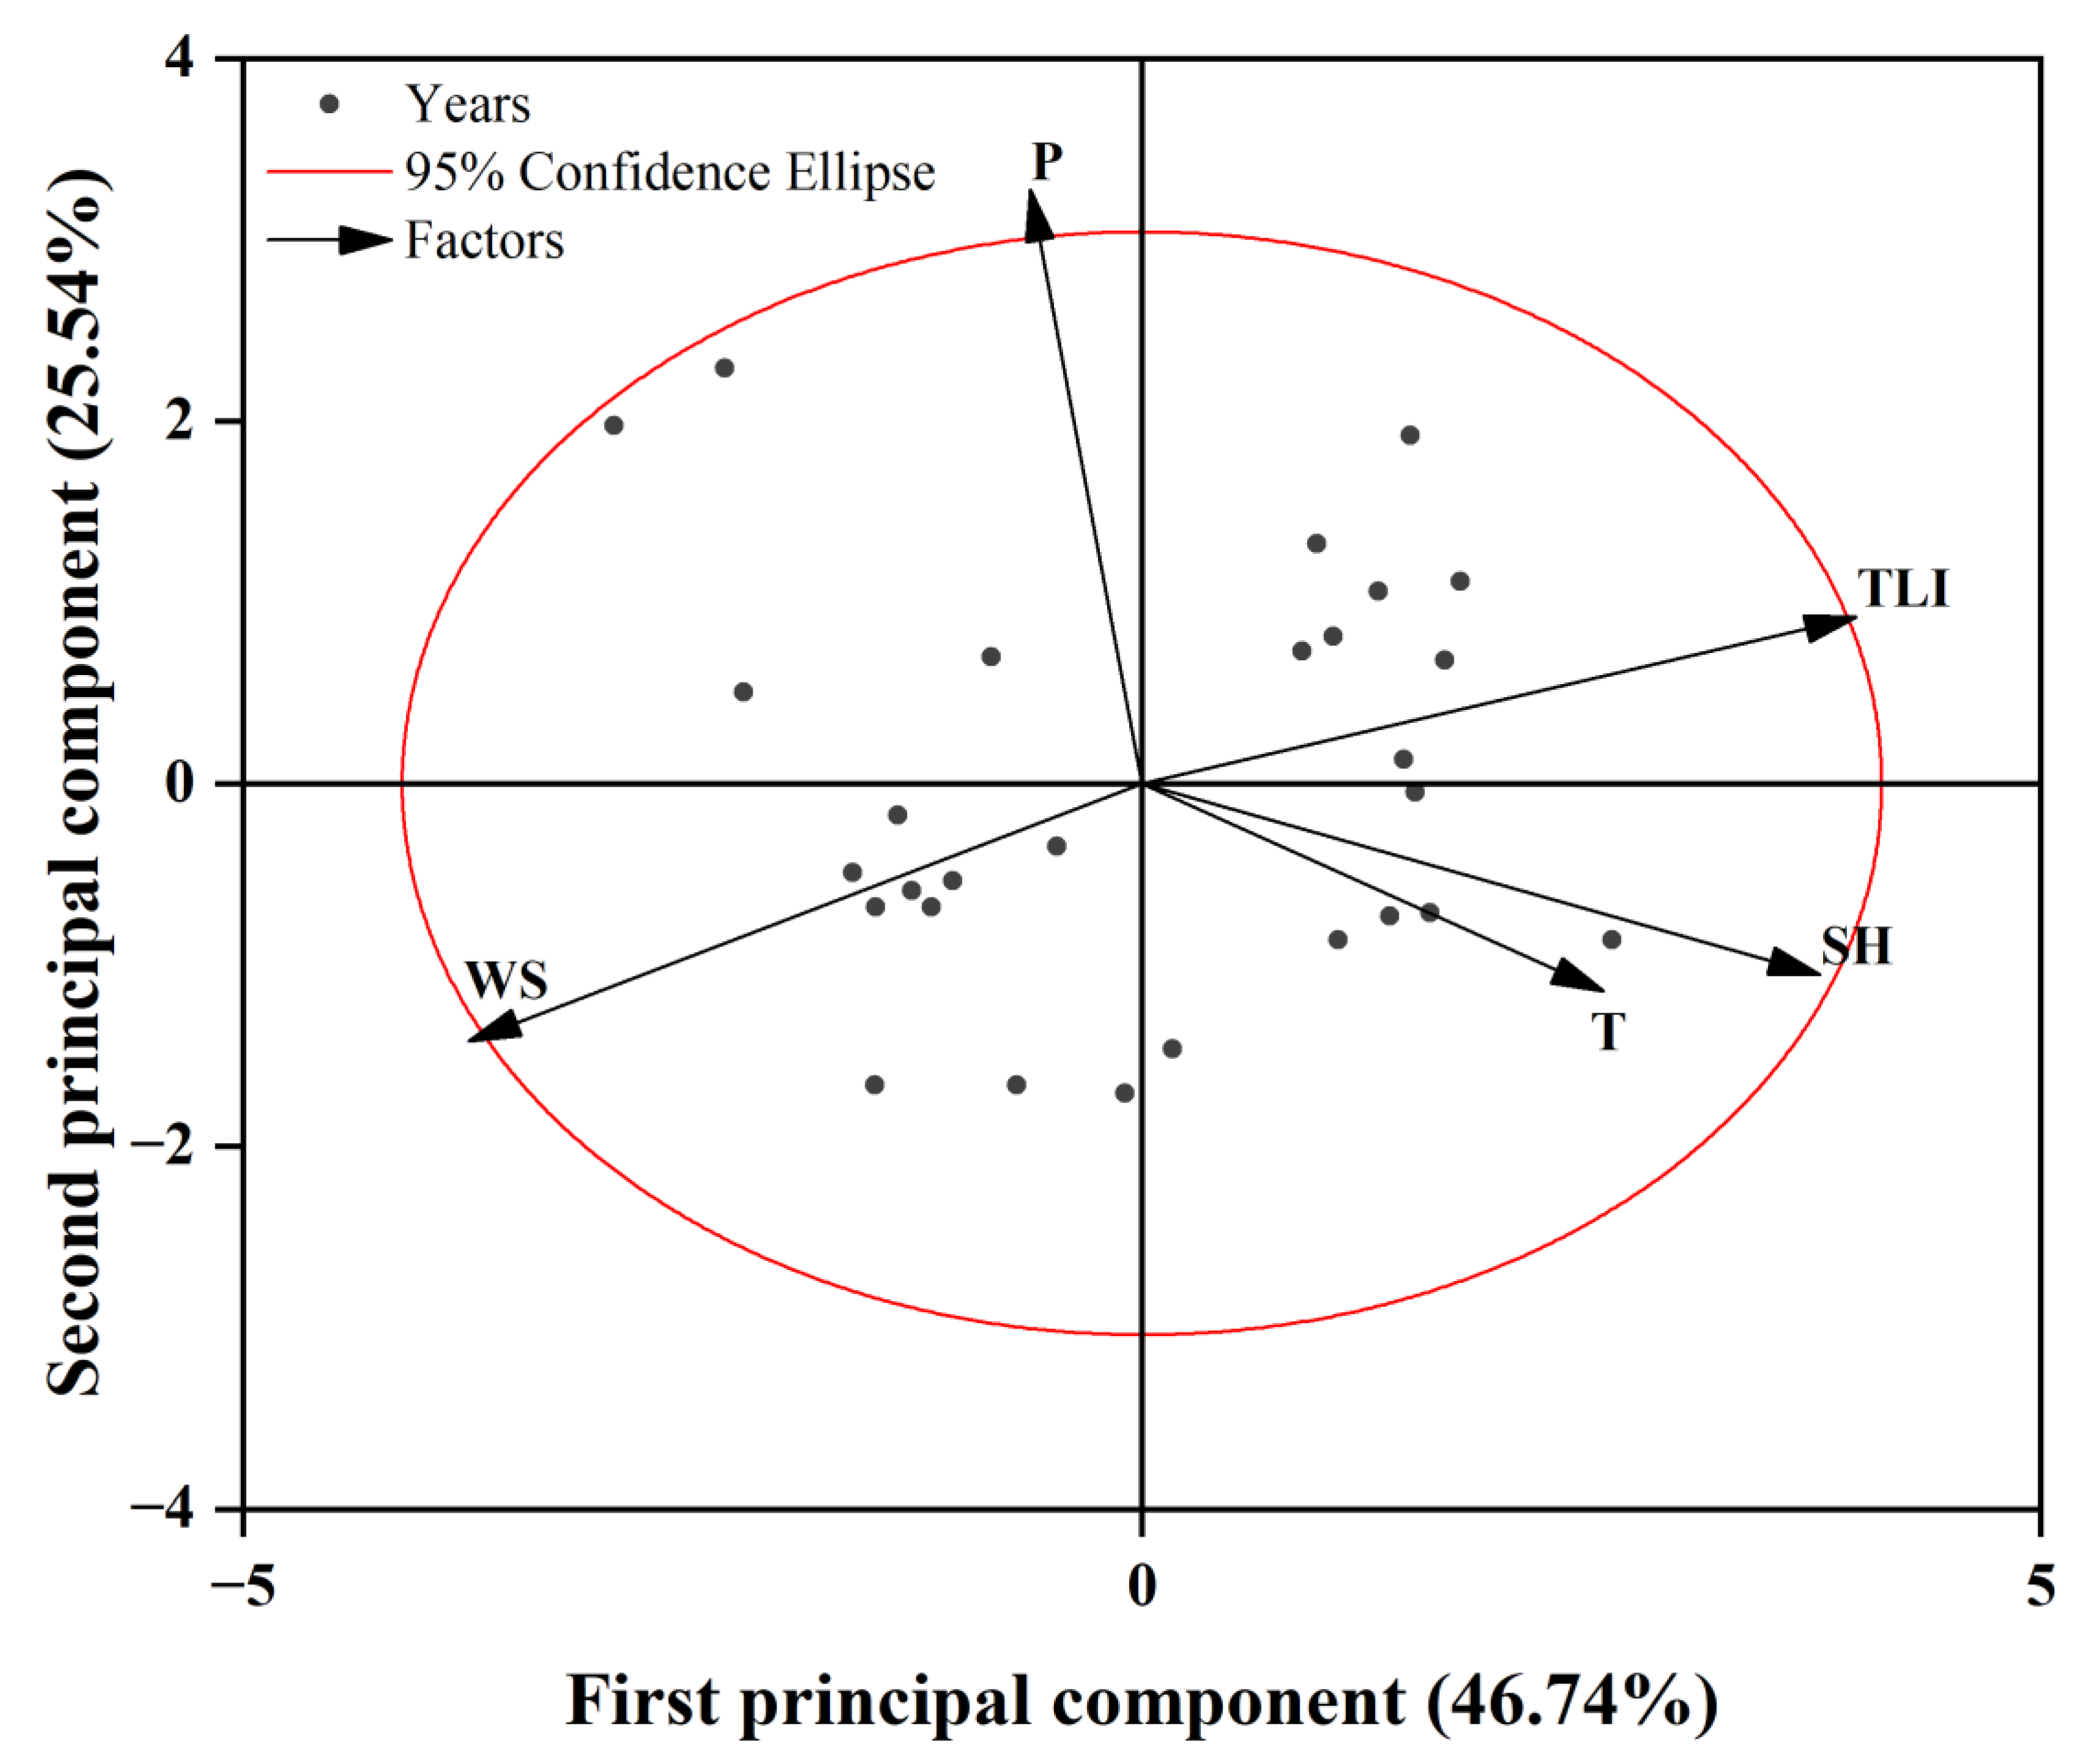
3.4.3. Analysis of the Major Factors Influencing Cyanobacterial Blooms

The main influencing factors for the interannual characteristics (CAP and CFI) of cyanobacterial blooms in Taihu Lake were identified through PCA (Figure 11, Table 1). The first principal component (PC1) was the most important; its variance contribution rate was the largest, contributing to 46.74% of the overall variance. Judging from the factor load, TLI, SH, T, and WS were most closely related to the first principal component. TLI, SH, and T were positively correlated with PC1, of which the factor load of TLI was the largest (0.556). Followed by SH and T, the factor load was 0.528 and 0.359, respectively. WS was negatively correlated with PC1 and the factor loading was −0.525. The contribution rate of the second principal component (PC2) to the total variance was 25.53%. P was significantly positively correlated with PC2, and the factor load was 0.819. Therefore, the second principal component mainly reflected the influence of annual precipitation on the interannual temporal and spatial dynamics of cyanobacteria blooms in Taihu Lake. In general, the principal factors affecting the interannual temporal and spatial dynamics of cyanobacterial blooms in Taihu Lake were TLI, SH, T, and WS.

4. Discussion

4.1. Drivers of Cyanobacterial Bloom Dynamics in Taihu Lake

The spatiotemporal dynamics of cyanobacterial blooms are controlled by a combination of meteorological and water quality factors in Taihu Lake [43]. The results show that the eutrophication level (TLI) experienced an increasing trend from 1984 to 2021, contributing to the expansion of cyanobacterial blooms (Figure 10, Figure 11). The Taihu Lake Basin has high population density and a developed economy. Domestic sewage, industrial effluents, and agricultural fertilizers have been identified as the main drivers of eutrophication in the lake [44,45]. These pollution loads are often associated with economic and population growth. As shown in Figure 12, the POP, PGDP, SGDP, and TGDP in the surrounding cities of Taihu Lake increased by around 1.25, 9.90, 96.82, and 322.80 times, respectively, from 1991 to 2018. With the rapid expansion of the population and the significant economic growth of surrounding cities, the pollutants and nutrients of the Taihu Lake have increased significantly, creating a suitable environment for the growth of algae blooms [46]. In 2007, a severe cyanobacterial bloom event occurred in Taihu Lake, affecting the normal water supply of residents in the surrounding areas. Following this, the government took numerous measures to reduce the nutrient load and pollutants entering Taihu Lake [16,47]. In recent years, the eutrophication level of Taihu Lake has gradually stabilized, and it is significantly lower than that in 2007 (Figure 9). Nevertheless, our results show that the area of cyanobacterial blooms in Taihu Lake has continued to display an increasing trend in recent years, with another severe outbreak in 2017, which may be related to the extreme floods in 2015 and 2016, and possibly also to extreme weather events [16,48].
In addition to the over-enrichment of nutrients promoting blooms, the climate changes in the past few decades have also created a suitable environment for the reproduction of cyanobacterial blooms [16,49,50]. The annual maximum wind speed (WS) in Taihu Lake has continued to decline, showing a highly significant negative correlation with the CAP and CFI of cyanobacteria blooms (Figure 9, Figure 10 and Figure 11). Previous studies have confirmed that strong winds can affect the vertical movement of cyanobacterial blooms and even lead to the disappearance of water blooms [51,52]. Mu et al. [53] found that the area of blooms in Dianchi Lake shrank with increasing wind speeds, which is consistent with our results. Moreover, climate warming and the increasing sunshine hours have promoted the process of cyanobacterial blooms (Figure 10 and Figure 11), which is consistent with previous studies [43,53,54]. Despite the significant increase in temperature in Taihu Lake due to climate warming, the changes in nutrients, light, and wind speed have a more significant impact on cyanobacteria blooms than climate warming [43,55], as confirmed by our results. Published studies also suggest that the air temperature is not the key factor for the formation of water blooms in Dianchi Lake [53]. Furthermore, we found that a precipitation change is unlikely to directly affect the dynamics of cyanobacterial blooms, which is similar to the findings of Zhang et al. [1]. However, other studies have shown that precipitation may have a positive or negative effect on cyanobacterial blooms [40,53,56]. Overall, the formation of cyanobacteria blooms is complex and can be affected by a combination of eutrophication and meteorological factors.

4.2. Innovations and Reliability of This Study

Compared with other studies, this study has some innovations and contributions. We completed a fine-scale spatiotemporal mapping of the long time series (1984–2021) for cyanobacterial blooms in Taihu Lake, one of the five major freshwater lakes in China, based on the GEE platform, and we further explored their potential influences, which was lacking in previous studies. On the one hand, the vast computing and storage capacity of the GEE platform facilitates the generation of long time-series datasets [57], which are important for accurate impact factor analysis, but most previous studies have focused on the dynamics of cyanobacterial blooms from 2000 onwards [16,39]. On the other hand, the higher spatial resolution (30 m) of the Landsat data used in this study compared to the MODIS data (250 m), making it less difficult and more accurate to map cyanobacterial blooms on a fine scale (Figure 13). In fact, many floating algae may be far smaller than the optimal resolution of MODIS. Through comparative analysis, we found that all cyanobacterial blooms that could be identified in MODIS images were shown on Landsat images, but some blooms could only be identified on Landsat images due to their small size (Figure 13d–f). Studies have shown that floating algae are at least a quarter of the width of the MODIS pixel size (approximately 60–250 m) in order to be detected on MODIS images [38]. At the boundary, the cyanobacterial blooms extracted based on MODIS image or Landsat image were highly consistent with the true pixel distribution (Figure 13g–i), confirming the applicability of the FAI algorithm [15,38]. However, the data-processing results obtained from MODIS and Landsat were less consistent at the boundary (Figure 13i), due to the spatial resolution of the images. The pixel size of the MODIS image (250 m) is much larger than that of the Landsat image (30 m), so the extracted results of the cyanobacterial blooms at the boundary did not overlap exactly. The higher spatial resolution allows for more realistic ground object information [39,40], so we believe that the extraction results based on Landsat images are closer to the actual coverage of cyanobacterial blooms. In conclusion, finer, more accurate and more realistic spatial information of cyanobacterial blooms can be easily identified from Landsat images rather than MODIS images.

4.3. Uncertainty and Limitations of Detection and Mapping of Cyanobacterial Blooms

The errors and uncertainties in the annual maps of cyanobacterial blooms are caused by three main factors. First, the accuracy validation results illustrate that the algorithm (FAI > −0.004) originally developed for monitoring cyanobacterial blooms with MODIS data [38] is also well suited to Landsat imagery with a higher resolution. However, the occurrence of cyanobacterial blooms was not surveyed in the field to verify the accuracy of this threshold. In the published literature, an FAI threshold of −0.025 was determined by the interpretation of satellite images and in situ measurements [58]. Because most previous studies have used FAI > −0.004 to determine whether the pixel is a cyanobacterium pixel [16,39], we also adopted this threshold. Secondly, Oyama et al. [15] found that the FAI is effective in distinguishing lake water from others (cyanobacterial blooms and aquatic plants), but it is less useful in distinguishing between aquatic macrophytes and cyanobacterial blooms. However, aquatic macrophytes are concentrated in the East Bay, East Lake, and Gun Bay [30], which are obviously different from cyanobacterial blooms, so we eliminated the effect of aquatic macrophytes on the study results through a post-classification process. Finally, unlike the MODIS satellite, the revisit period of the Landsat satellite is 16 days, which means that the Landsat satellite cannot fully observe all cyanobacterial bloom occurrences during the year. Moreover, due to the cloudy and rainy weather, it is difficult to obtain satellite images on clear days. Even, only four images were available in 1999. The lack of data was an obstacle to the long-term monitoring of the cyanobacteria blooms in Taihu Lake. Therefore, there may be some uncertainties in the coverage and frequency of cyanobacteria blooms in this study. Nevertheless, as the dynamics of cyanobacteria blooms are consistent with those of previous studies in Taihu Lake [16,39,40], the results of this work can still provide some scientific reference value for long-term monitoring studies of cyanobacterial blooms in large and shallow lakes.

5. Conclusions

In this study, the long-term, fine-scale mapping of cyanobacterial blooms in Taihu Lake and the identification of key influencing factors were achieved using Landsat images, the FAI threshold algorithm, Spearman correlation analysis, and PCA. Several conclusions were reached in our study.
(1)
The long-term trend and dynamics of cyanobacterial blooms were consistent with the ground truth and previous studies, confirming the feasibility of long-term monitoring for cyanobacterial blooms based on Landsat data and the FAI threshold.
(2)
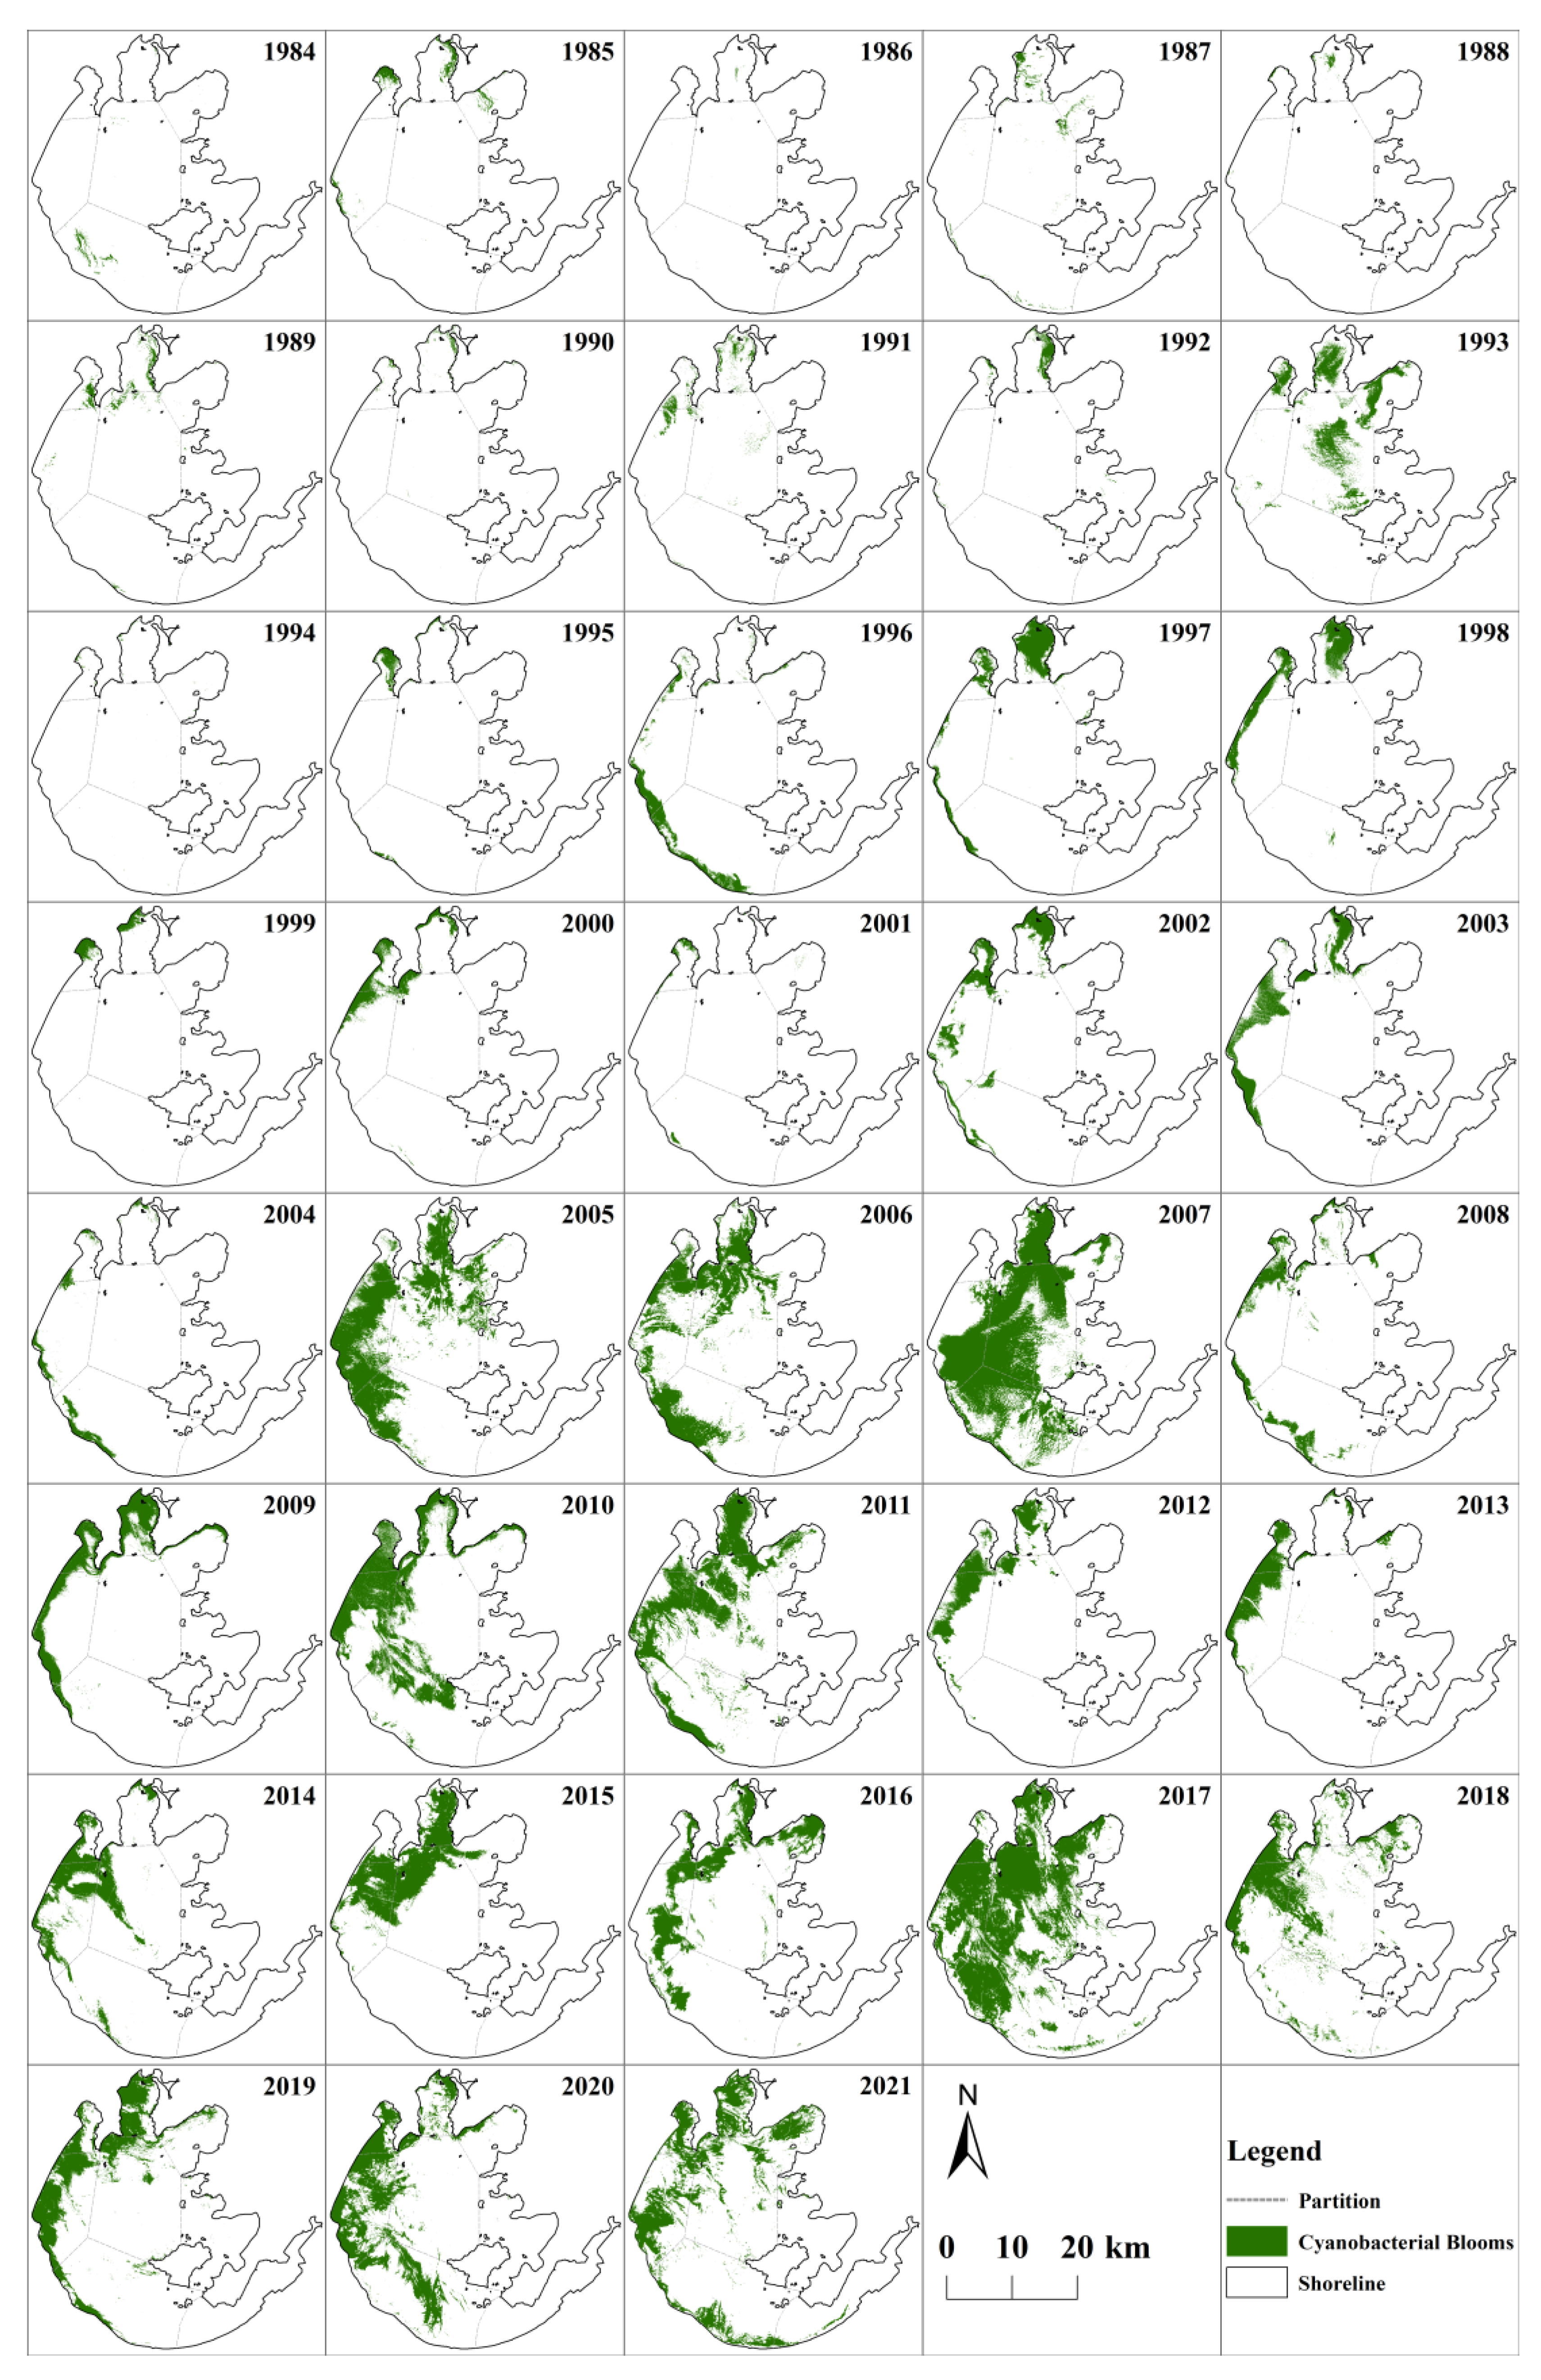
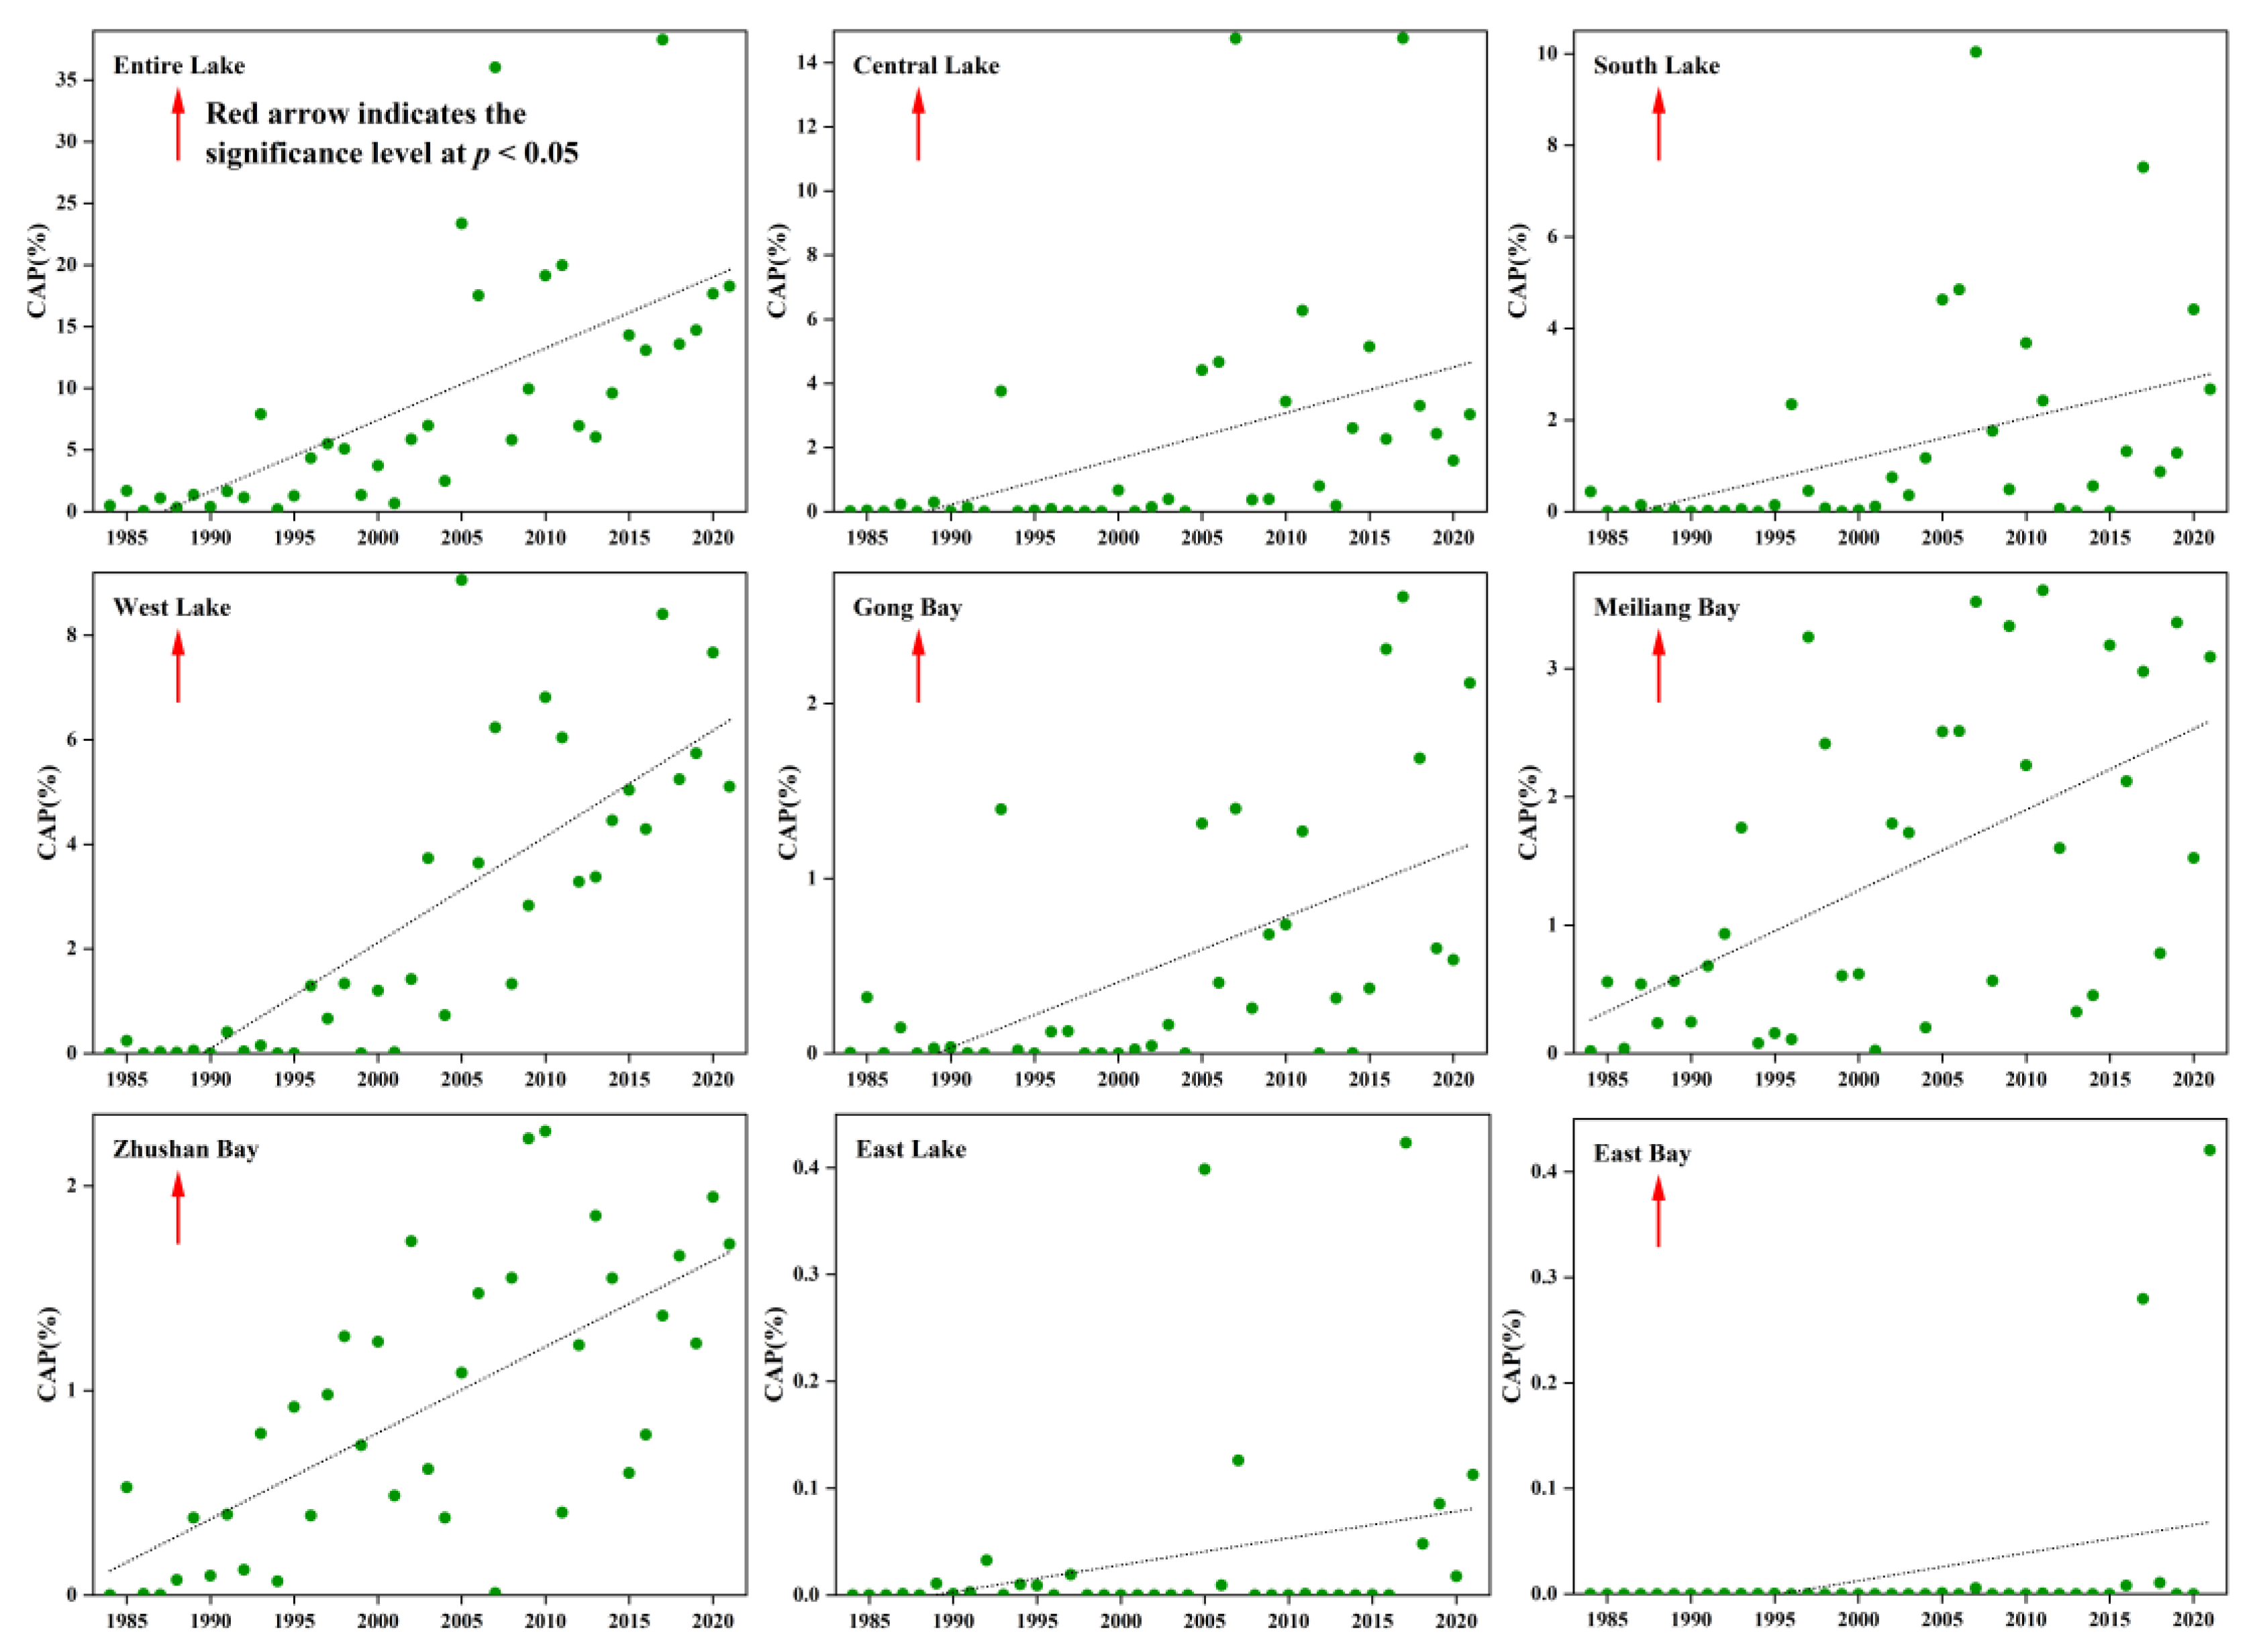
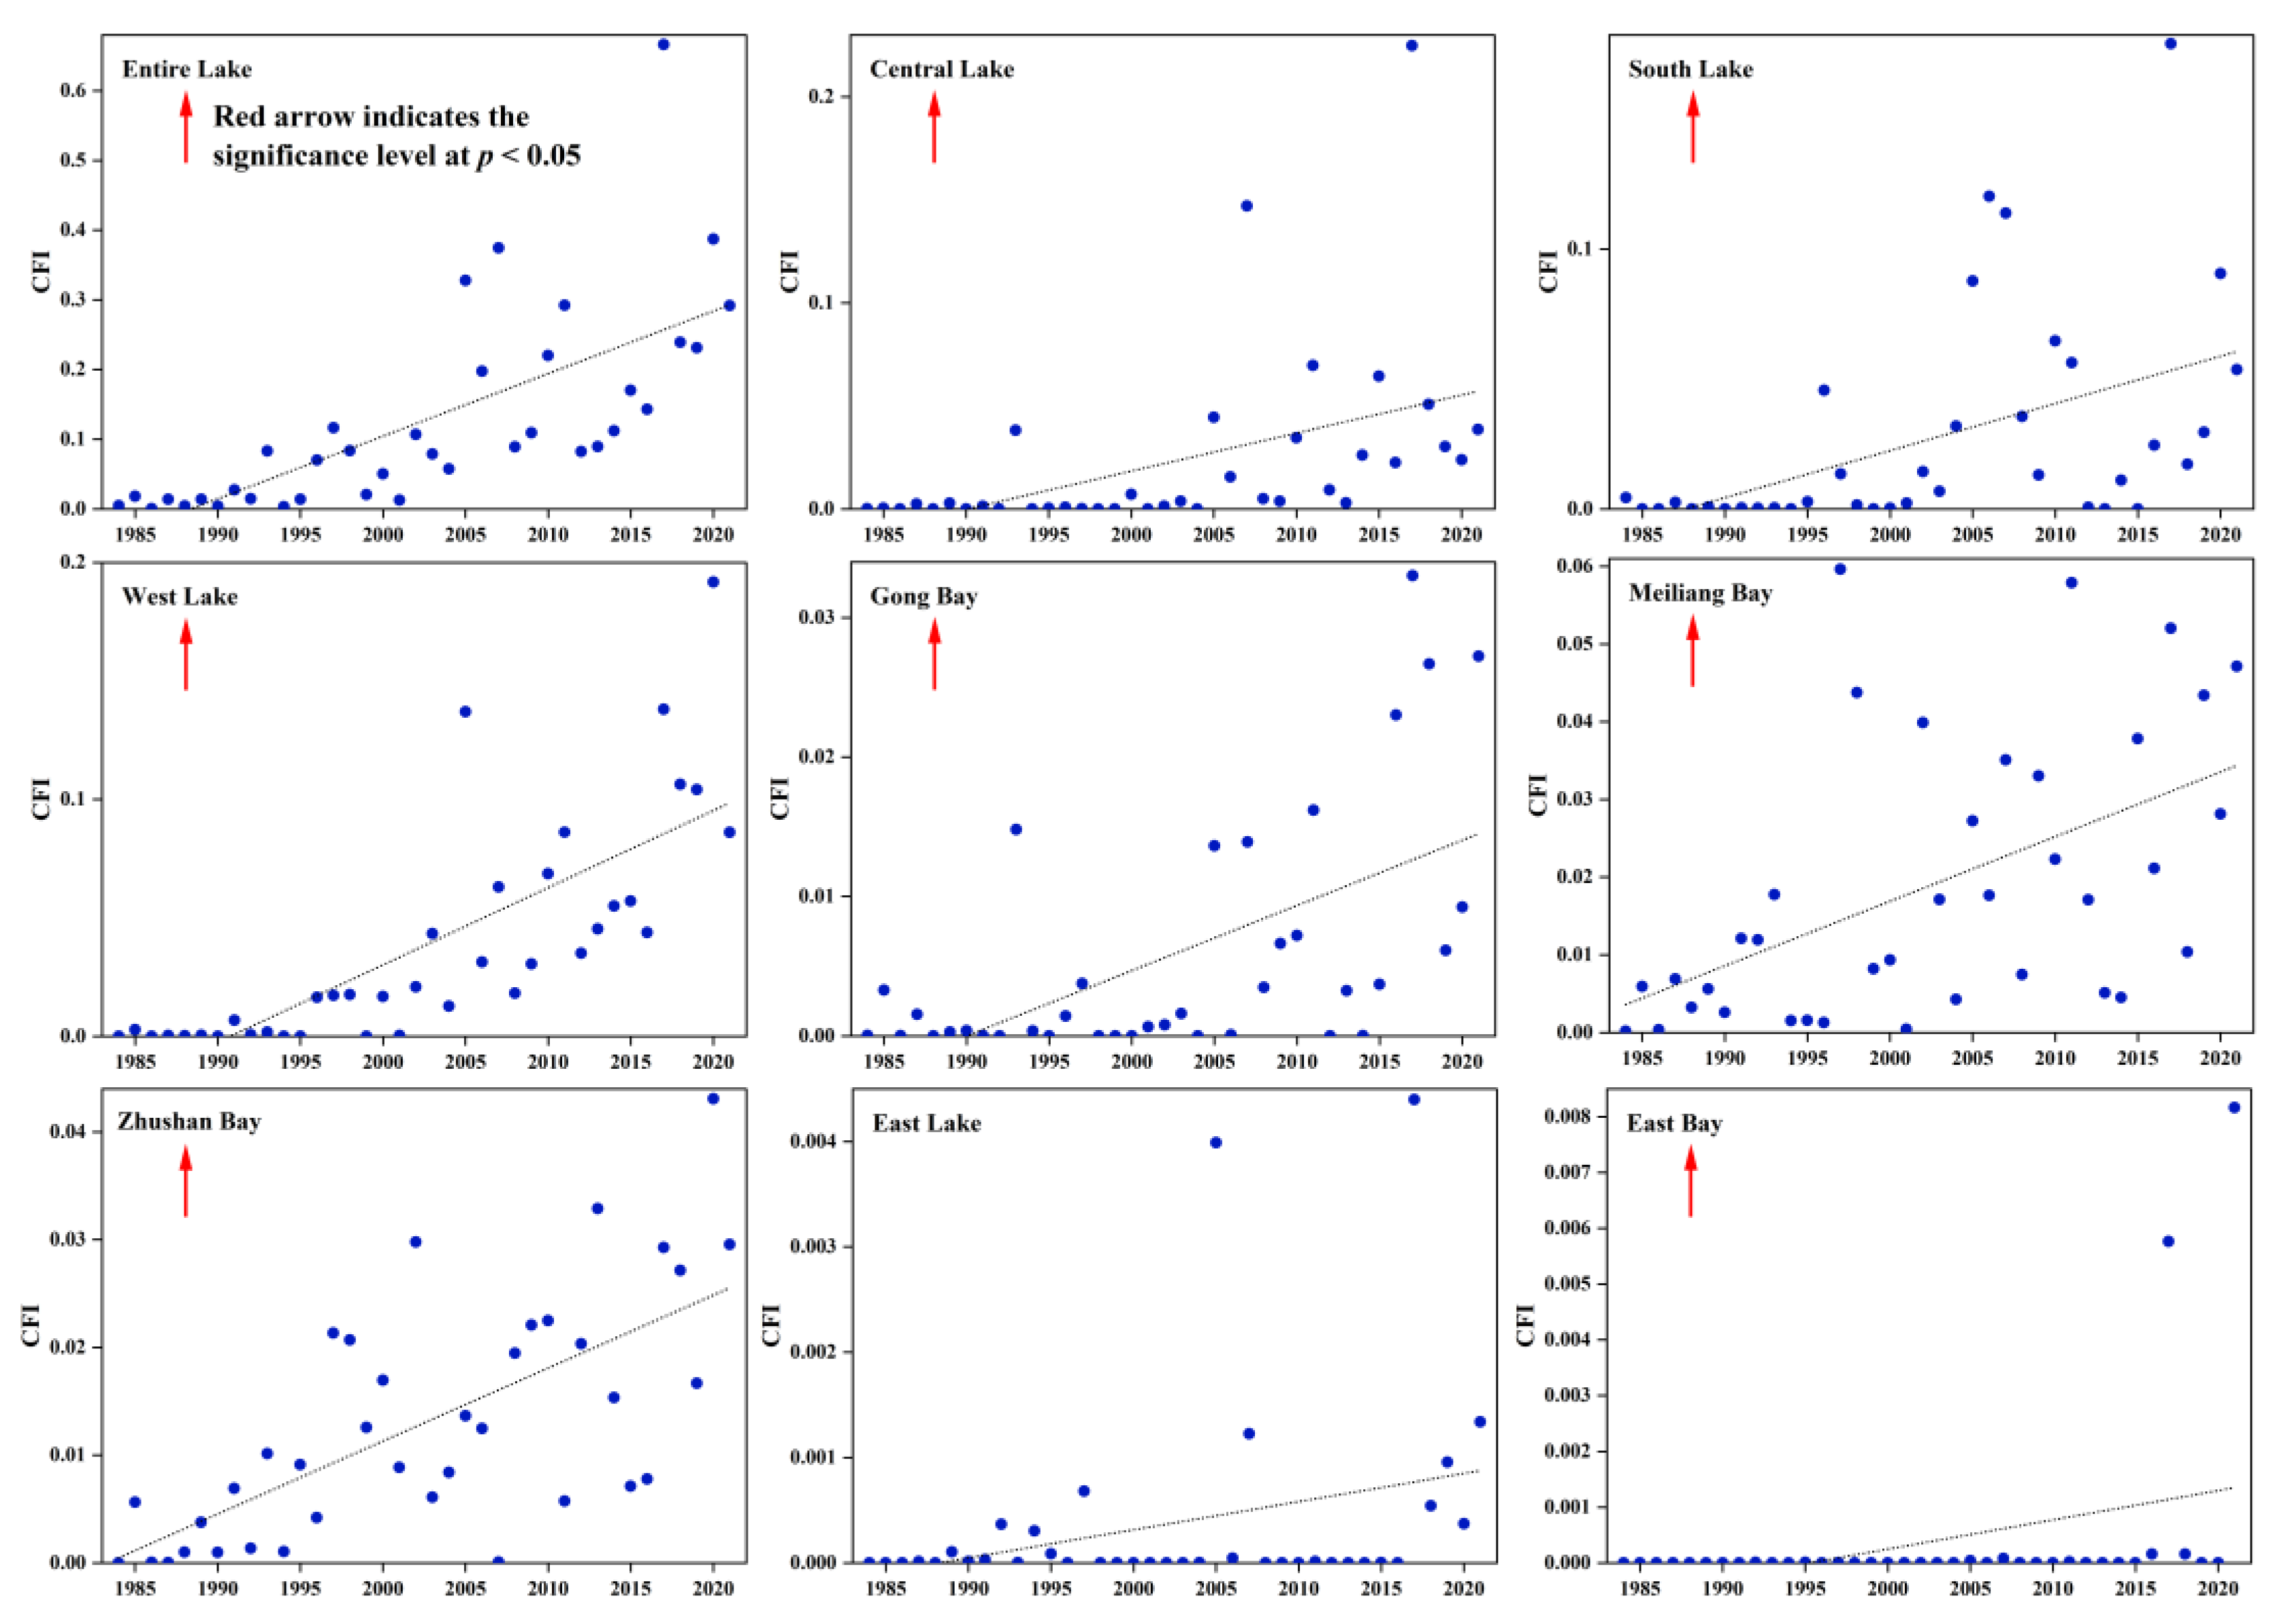
Spatial information on cyanobacterial blooms can be clearly observed. From 1984 to 2021, cyanobacterial blooms spread from the northern part of Taihu Lake to the central and western parts. In recent years, sporadic blooms have started to appear in the East Lake and East Bay. The percentage of area (from 0.05% to 38.28%, p < 0.05) and frequency of occurrence (from 0.0005 to 0.66, p < 0.05) continued to increase with a significant trend.
(3)
The occurrence of cyanobacterial blooms in Taihu Lake was influenced by a combination of eutrophication and meteorological factors, with a cumulative variance of 72.2 81%. TLI and SH were the most significant positive factors (both correlation coefficients > 0.42, p < 0.05) and WS was the most significant negative factor (both correlation coefficients > 0.6, p < 0.05).
Accurate long time-series observation and driver analysis are of great help to achieve better bloom control or mitigation in order to achieve the environmental monitoring and governance of large shallow lakes, such as Taihu Lake. In the future, we may apply the methods from this study to other lakes and coastal waters in China for similar purposes. In addition, we may fuse multiple data types (e.g., MODIS, Landsat, and Sentinel data) to construct a higher-spatial-resolution (10 m) and/or higher-temporal-resolution (daily or monthly) cyanobacterial bloom dataset.

Author Contributions

Conceptualization, Z.L., D.Y. and J.L.; methodology, D.Y. and J.L.; software, J.L.; validation, J.L. and Y.L.; formal analysis, J.L. and S.X.; investigation, J.L. and Y.L.; writing—original draft preparation, J.L., Y.L., S.X., L.C., M.L. and C.W.; writing—review and editing, Z.L. and D.Y.; visualization J.L., Y.L. and S.X.; supervision, Z.L.; funding acquisition, Z.L. All authors have read and agreed to the published version of the manuscript.

Funding

This research was funded by the National Natural Science Foundation of China (No. 41871097) and the Priority Academic Program Development of Jiangsu Higher Education Institution (PAPD).

Data Availability Statement

The datasets used during the current study are available from the corresponding author upon reasonable request.

Acknowledgments

The authors are grateful to the editors and anonymous reviewers for providing suggestions and advice.

Conflicts of Interest

The authors declare no conflict of interest.

References

  1. Zhang, Y.; Ma, R.; Duan, H.; Loiselle, S.; Xu, J. Satellite analysis to identify changes and drivers of CyanoHABs dynamics in Lake Taihu. Water Sci. Technol. Water Supply 2016, 16, 1451–1466. [Google Scholar] [CrossRef]
  2. Hou, X.; Feng, L.; Duan, H.; Chen, X.; Sun, D.; Shi, K. Fifteen-year monitoring of the turbidity dynamics in large lakes and reservoirs in the middle and lower basin of the Yangtze river, China. Remote Sens. Environ. 2017, 190, 107–121. [Google Scholar] [CrossRef]
  3. Wang, Y.; Liu, X.; Gao, Y.; Yang, C.; Wang, S. Impacts of algae bloom on spatial distribution variations of the typical heavy metals from sediments in Chaohu Lake. Acta Sci. Circumstantiae 2022, 1–10. [Google Scholar] [CrossRef]
  4. Cao, J.; Tian, Z.; Chu, Z.; Niu, Y.; Zheng, B. Nitrogen and phosphorus control thresholds of cyanobacteria blooms in Lake Taihu. J. Lake Sci. 2022, 34, 1–16. [Google Scholar] [CrossRef]
  5. Brooks, B.W.; Lazorchak, J.M.; Howard, M.D.A.; Johnson, M.V.; Morton, S.L.; Perkins, D.A.K.; Reavie, E.D.; Scott, G.I.; Smith, S.A.; Steevens, J.A. Are harmful algal blooms becoming the greatest inland water quality threat to public health and aquatic ecosystems? Environ. Toxicol. Chem. 2016, 35, 6–13. [Google Scholar] [CrossRef] [PubMed]
  6. Ho, J.C.; Michalak, A.M.; Pahlevan, N. Widespread global increase in intense lake phytoplankton blooms since the 1980s. Nature 2019, 574, 667–670. [Google Scholar] [CrossRef]
  7. Wang, H.; Xu, C.; Liu, Y.; Jeppesen, E.; Sevenning, J.; Wu, J.; Zhang, W.; Zhou, T.; Wang, P.; Nangombe, S.; et al. From unusual suspect to serial killer: Cyanotoxins boosted by climate change may jeopardize megafauna. Innovation 2021, 2, 100092. [Google Scholar] [CrossRef] [PubMed]
  8. Chen, Y.; Fan, C.; Teubner, K.; Dokulil, M. Changes of nutrients and phytoplankton chlorophyll-a in a large shallow lake, Taihu, China: An 8-year investigation. Hydrobiologia 2003, 506, 273–279. [Google Scholar] [CrossRef]
  9. Yin, P.; Zhang, J.; Hu, X. Study on countermeasures to enhance emergency prevention and control ability of cyanobacteria bloom and lake flooding in Taihu Lake. Water Resour. Dev. Manag. 2022, 8, 18–22. [Google Scholar] [CrossRef]
  10. Peng, L.; Ti, C.; Li, H.; Wang, L.; Yan, X. Estimates and characteristics of pollutant discharge from pond cultures in the Taihu Basin. J. Lake Sci. 2020, 32, 70–78. [Google Scholar] [CrossRef]
  11. Yan, F.; Zhang, M. Daily Dynamic Remote Sensing Monitoring of Cyanobacterial Blooms in Taihu Lake. China Resour. Compr. Util. 2022, 40, 170–172. [Google Scholar] [CrossRef]
  12. Chao, M.; Zhao, Q.; Yang, T.; Xie, F. Comparative Research of Cyanobacteria Blooms Extraction Methods Based on Landsat8 Images. J. Atmos. Environ. Opt. 2021, 16, 520–528. [Google Scholar] [CrossRef]
  13. Gorelick, N.; Hancher, M.; Dixon, M.; IIyushchenko, S.; Thau, D.; Moore, R. Google Earth Engine: Planetary-scale geospatial analysis for everyone. Remote Sens. Environ. 2017, 202, 18–27. [Google Scholar] [CrossRef]
  14. Ma, R.; Duan, H.; Gu, X.; Zhang, S. Detecting Aquatic Vegetation Changes in Taihu Lake, China Using Multi-temporal Satellite Imagery. Sensors 2008, 8, 3988–4005. [Google Scholar] [CrossRef] [Green Version]
  15. Oyama, Y.; Matsushita, B.; Fokushima, T. Distinguishing surface cyanobacterial blooms and aquatic macrophytes using Landsat/TM and ETM+ shortwave infrared bands. Remote Sens. Environ. 2015, 157, 35–47. [Google Scholar] [CrossRef]
  16. Jia, T.; Zhang, X.; Dong, R. Long-Term Spatial and Temporal Monitoring of Cyanobacteria Blooms Using MODIS on Google Earth Engine: A Case Study in Taihu Lake. Remote Sens. 2019, 11, 2269. [Google Scholar] [CrossRef] [Green Version]
  17. Shi, K.; Zhang, Y.; Zhou, Y.; Liu, X.; Zhu, G.; Qin, B.; Gao, G. Long-term MODIS observations of cyanobacterial dynamics in Lake Taihu: Responses to nutrient enrichment and meteorological factors. Sci. Rep. 2017, 7, 40326. [Google Scholar] [CrossRef] [PubMed] [Green Version]
  18. Zhou, B.; Cai, X.; Wang, S.; Yang, X. Analysis of the Causes of Cyanobacteria Bloom: A Review. J. Resour. Ecol. 2020, 11, 405–413. [Google Scholar] [CrossRef]
  19. Zhu, G.; Shi, K.; Li, W.; Li, N.; Zou, W.; Guo, C.; Zhu, M.; Xu, H.; Zhang, Y.; Qin, B. Seasonal forecast method of cyanobacterial bloom intensity in eutrophic Lake Taihu, China. J. Lake Sci. 2020, 32, 1421–1431. [Google Scholar] [CrossRef]
  20. Qin, B.; Xu, P.; Wu, Q.; Luo, L.; Zhang, Y. Environmental issues of Lake Taihu, China. Hydrobiologia 2007, 581, 3–14. [Google Scholar] [CrossRef]
  21. Li, S.; Liu, C.; Sun, P.; Ni, T. Response of cyanobacterial bloom risk to nitrogen and phosphorus concentrations in large shallow lakes determined through geographical detector: A case study of Taihu Lake, China. Sci. Total Environ. 2022, 816, 151617. [Google Scholar] [CrossRef] [PubMed]
  22. Lian, H.; Lei, Q.; Zhang, X.; Yen, H.; Wang, H.; Zhai, L.; Liu, H.; Huang, J.; Ren, T.; Qiu, W.; et al. Effects of anthropogenic activities on long-term changes of nitrogen budget in a plain river network region: A case study in the Taihu Basin. Sci. Total Environ. 2018, 645, 1212–1220. [Google Scholar] [CrossRef]
  23. Wang, M.; Shi, W.; Tang, J. Water property monitoring and assessment for China’s inland Lake Taihu from MODIS-Aqua measurements. Remote Sens. Environ. 2011, 115, 841–854. [Google Scholar] [CrossRef]
  24. Qin, B.; Paerl, H.W.; Brookes, J.D.; Liu, J.; Jeppesen, E.; Zhu, G.; Zhang, Y.; Xu, H.; Shi, K.; Deng, J. Why Lake Taihu continues to be plagued with cyanobacterial blooms through 10 years (2007–2017) efforts. Sci. Bull. 2019, 64, 354–356. [Google Scholar] [CrossRef] [Green Version]
  25. Zhu, W.; Chen, H.; Wang, R.; Feng, G.; Xue, Z.; Hu, S. Analysis on the reasons for the large bloom area of Lake Taihu in 2017. J. Lake Sci. 2019, 31, 621–632. [Google Scholar] [CrossRef] [Green Version]
  26. Shi, K.; Zhang, Y.; Zhang, Y.; Li, N.; Qin, B.; Zhu, G.; Zhou, Y. Phenology of Phytoplankton Blooms in a Trophic Lake Observed from Long-Term MODIS Data. Environ. Sci. Technol. 2019, 53, 2324–2331. [Google Scholar] [CrossRef] [PubMed]
  27. Huang, L.; Fang, H.; He, G.; Jiang, H.; Wang, C. Effects of internal loading on phosphorus distribution in the Taihu Lake driven by wind waves and lake currents. Environ. Pollut. 2016, 219, 760–773. [Google Scholar] [CrossRef] [PubMed]
  28. United States Geological Survey. Available online: https://earthexplorer.usgs.gov (accessed on 5 December 2021).
  29. Google Earth Engine. Available online: https://code.earthengine.google.com (accessed on 10 December 2021).
  30. Liang, Q.; Zhang, Y.; Ma, R.; Loiselle, S.; Li, J.; Hu, M. A MODIS-Based Novel Method to Distinguish Surface Cyanobacterial Scums and Aquatic Macrophytes in Lake Taihu. Remote Sens. 2017, 9, 133. [Google Scholar] [CrossRef] [Green Version]
  31. China Meteorological Data Sharing Service System. Available online: http://data.cma.cn (accessed on 15 March 2022).
  32. National Earth System Science Data Center. Available online: http://www.geodata.cn (accessed on 20 March 2022).
  33. Lv, X.; Wu, S.; Zhang, Y.; Zhou, D.; Yang, Q.; Liu, X. Analysis on variation of main indicators of eutrophication and mutrition level in Taihu lake. J. Water. Resour. Water Eng. 2014, 25, 1–6. [Google Scholar] [CrossRef]
  34. Taihu Basin Authority of Ministry of Water Resources. Available online: http://www.tba.gov.cn (accessed on 20 March 2022).
  35. Xie, H.; Hu, M.; Ji, X.; Cao, B.; Jia, S.; Xu, J.; Jin, X. Water Quality Evolution Characteristics and Pollution Factors Analysis in Poyang Lake from 2011 to 2019. Environ. Sci. 2022, 1–17. [Google Scholar] [CrossRef]
  36. China City Statistical Yearbook. Available online: https://data.cnki.net/Yearbook (accessed on 25 March 2022).
  37. Wang, M.; Shi, W. Estimation of ocean contribution at the MODIS near-infrared wavelengths along the east coast of the U.S.: Two case studies. Geophys. Res. Lett. 2005, 32, L13606. [Google Scholar] [CrossRef] [Green Version]
  38. Hu, C. A novel ocean color index to detect floating algae in the global oceans. Remote Sens. Environ. 2009, 113, 2118–2129. [Google Scholar] [CrossRef]
  39. Hu, C.; Lee, Z.; Ma, R.; Yu, K.; Li, D.; Shang, S. Moderate Resolution Imaging Spectroradiometer (MODIS) observations of cyanobacteria blooms in Taihu Lake, China. J. Geophys. Res. 2010, 115, C04002. [Google Scholar] [CrossRef] [Green Version]
  40. Zong, J.; Wang, X.; Zhong, Q.; Xiao, X.; Ma, J.; Zhao, B. Increasing Outbreak of Cyanobacterial Blooms in Large Lakes and Reservoirs under Pressures from Climate Change and Anthropogenic Interferences in the Middle-Lower Yangtze River Basin. Remote Sens. 2019, 11, 1754. [Google Scholar] [CrossRef] [Green Version]
  41. IBM Corp. IBM SPSS Statistics for Windows, Version 19.0; IBM Corp.: Armonk, NY, USA, 2010. [Google Scholar]
  42. OriginLab Corporation. OriginPro, Version 2022b; OriginLab Corporation: Northampton, MA, USA, 2022. [Google Scholar]
  43. Zhang, M.; Yang, Z.; Shi, X. Expansion and drivers of cyanobacterial blooms in Lake Taihu. J. Lake Sci. 2019, 31, 336–344. [Google Scholar] [CrossRef] [Green Version]
  44. Duan, H.; Ma, R.; Xu, X.; Kong, F.; Zhang, S.; Kong, W.; Hao, J.; Shang, L. Two-Decade Reconstruction of Algal Blooms in China’s Lake Taihu. Environ. Sci. Technol. 2009, 43, 3522–3528. [Google Scholar] [CrossRef] [PubMed]
  45. Guo, W.; Yang, F.; Li, Y.; Wang, S. New insights into the source of decadal increase in chemical oxygen demand associated with dissolved organic carbon in Dianchi Lake. Sci. Total Environ. 2017, 603–604, 699–708. [Google Scholar] [CrossRef]
  46. Jing, Y.; Zhang, Y.; Hu, M.; Chu, Q.; Ma, R. MODIS-Satellite-Based Analysis of Long-Term Temporal-Spatial Dynamics and Drivers of Algal Blooms in a Plateau Lake Dianchi, China. Remote Sens. 2019, 11, 2582. [Google Scholar] [CrossRef] [Green Version]
  47. Xu, D.; Pu, Y.; Zhu, M.; Luan, Z.; Shi, K. Automatic Detection of Algal Blooms Using Sentinel-2 MSI and Landsat OLI Images. IEEE J.-Stars 2021, 14, 8497–8511. [Google Scholar] [CrossRef]
  48. Yang, Z.; Zhang, M.; Shi, X.; Kong, F.; Ma, R.; Yu, Y. Nutrient reduction magnifies the impact of extreme weather on cyanobacterial bloom formation in large shallow Lake Taihu (China). Water Res. 2016, 103, 302–310. [Google Scholar] [CrossRef]
  49. Zhang, Y.; Shi, K.; Liu, J.; Deng, J.; Qin, B.; Zhu, G.; Zhou, Y. Meteorological and hydrological conditions driving the formation and disappearance of black blooms, an ecological disaster phenomena of eutrophication and algal blooms. Sci. Total Environ. 2016, 569–570, 1517–1529. [Google Scholar] [CrossRef] [PubMed]
  50. Jöhnk, K.D.; Huisman, J.; Sharples, J.; Sommeijer, B.; Visser, P.M.; Stroom, J.M. Summer heatwaves promote blooms of harmful cyanobacteria. Glob. Change Bio. 2008, 14, 495–512. [Google Scholar] [CrossRef] [Green Version]
  51. Shi, K.; Zhang, Y.; Zhu, G.; Qin, B.; Pan, D. Deteriorating water clarity in shallow waters: Evidence from long term MODIS and in-situ observations. Int. J. Appl. Earth Obs. 2018, 68, 287–297. [Google Scholar] [CrossRef]
  52. Wu, T.; Qin, B.; Brookes, J.D.; Shi, K.; Zhu, G.; Zhu, M.; Yan, W.; Wang, Z. The influence of changes in wind patterns on the areal extension of surface cyanobacterial blooms in a large shallow lake in China. Sci. Total Environ. 2015, 518–519, 24–30. [Google Scholar] [CrossRef] [PubMed]
  53. Mu, M.; Wu, C.; Li, Y.; Lyu, H.; Fang, S.; Yan, X.; Liu, G.; Zheng, Z.; Du, C.; Bi, S. Long-term observation of cyanobacteria blooms using multi-source satellite images: A case study on a cloudy and rainy lake. Environ. Sci. Pollut. Res. 2019, 26, 11012–11028. [Google Scholar] [CrossRef]
  54. Zhu, G. Eutrophic status and causing factors for a large, shallow and subtropical Lake Taihu, China. J. Lake Sci. 2008, 20, 21–26. [Google Scholar] [CrossRef] [Green Version]
  55. Jochimsen, M.C.; Kümmerlin, R.; Straile, D. Compensatory dynamics and the stability of phytoplankton biomass during four decades of eutrophication and oligotrophication. Ecol. Lett. 2013, 16, 81–89. [Google Scholar] [CrossRef] [Green Version]
  56. Li, S.; Liu, J.; Song, K.; Liang, C.; Gao, J. Analysis on Spatial and Temporal Character of Algae Bloom in Lake Chaohu and Its Driving Factors Based on Landsat Imagery. Resour. Environ. Yangtze Basin 2019, 28, 1205–1213. [Google Scholar] [CrossRef]
  57. Yan, D.D.; Li, J.T.; Yao, X.Y.; Luan, Z.Q. Quantifying the Long-Term Expansion and Dieback of Spartina Alterniflora Using Google Earth Engine and Object-Based Hierarchical Random Forest Classification. IEEE J. Sel. Top. Appl. Earth. Obs. Remote Sens. 2021, 14, 9781–9793. [Google Scholar] [CrossRef]
  58. Liu, X.; Zhang, Y.; Shi, K.; Zhou, Y.; Tang, X.; Zhu, G.; Qin, B. Mapping Aquatic Vegetation in a Large, Shallow Eutrophic Lake: A Frequency-Based Approach Using Multiple Years of MODIS Data. Remote Sens. 2015, 7, 10295–10320. [Google Scholar] [CrossRef]
Figure 1. Map of the study area. (a) Map of China; (b) Taihu Basin; (c) Taihu Lake, Landsat OLI imagery on 21 September 2021, R:G:B = band 5:4:3.
Land 11 02197 g001
Figure 2. Annual number of Landsat images from 1984 to 2021.
Land 11 02197 g002
Figure 3. The cyanobacterial bloom extraction process in East Bay in 2021 (ac) and final extraction results for the entire lake in 2021 (d). (a) Landsat annual mean composite imagery in 2021, R:G:B = band 6:5:4. (b) Landsat imagery overlapped with the initial extraction results of cyanobacterial blooms without manual modification (including aquatic vegetation and cyanobacterial blooms). (c) Landsat imagery overlapped with manually modified bloom extraction results (cyanobacterial blooms only).
Land 11 02197 g003
Figure 4. Validation of the cyanobacterial bloom map in Taihu Lake. (a) Landsat OLI imagery on 3 May 2020, R:G:B = band 5:4:3. (b) Sentinel-2 MSI imagery on 3 May 2020, R:G:B = band 8:4:3. (c) Landsat OLI imagery overlapped with cyanobacterial blooms extracted from Landsat.
Land 11 02197 g004
Figure 5. The linear regression between our annual cyanobacterial bloom area and that of Zong et al. [40] (a) and Jia et al. [16] (b).
Land 11 02197 g005
Figure 6. Spatial distribution of annual cyanobacterial blooms for the entire lake and each segment.
Land 11 02197 g006
Figure 7. Annual cyanobacterial bloom area percentage for the entire lake and each segment. The arrows indicate that the CAP values showed a significant (p < 0.05) increasing trend over 38 years.
Land 11 02197 g007
Figure 8. Annual cyanobacterial bloom frequency for the entire lake and each segment. The arrows indicate that the CFI values showed a significant (p < 0.05) increasing trend over 38 years.
Land 11 02197 g008
Figure 9. Interannual change in (a) annual sunshine hours (SH); (b) annual maximum wind speed (WS); (c) annual precipitation (P); (d) annual mean temperature (T); (e) comprehensive trophic level index (TLI) during 1991–2018 in Taihu Lake.
Land 11 02197 g009
Figure 10. Correlation analysis of meteorological and water quality factors with cyanobacterial blooms in Taihu Lake.
Land 11 02197 g010
Figure 11. Identification of major influencing factors for cyanobacterial blooms in Taihu Lake with a principal component analysis.
Land 11 02197 g011
Figure 12. The POP, PGDP, SGDP, and TGDP in the surrounding cities of Taihu Lake.
Land 11 02197 g012
Figure 13. Comparison between Landsat and MODIS data. (a) MODIS imagery on 5 December 2014, R:G:B = band sur_refl_b05:sur_refl_b02:sur_refl_b01. (b) Landsat imagery on 5 December 2014, R:G:B = band 7:5:4. (c) Cyanobacterial blooms extracted from Landsat and MODIS imagery. (di) Enlargement of the small areas marked by red boxes in (ac).
Land 11 02197 g013
Table 1. Principal component loading matrix.
ComponentLoading Matrix
Principal Component 1Principal Component 2
TLI0.5560.229
T0.359−0.287
P−0.0870.819
WS−0.525−0.355
SH0.528−0.264
Variance percentage/%46.74425.536
Cumulative variance percentage/%46.74572.281
Publisher’s Note: MDPI stays neutral with regard to jurisdictional claims in published maps and institutional affiliations.

