Article

Identification of Land Use Conflicts in Shandong Province from an Ecological Security Perspective

1
School of Management Engineering, Shandong Jianzhu University, Jinan 250101, China
2
Binhu New District Construction and Development Center in Xintai, Taian 271200, China
3
Zhuhai Nature Resource and Planning Technology Center, Zhuhai 519000, China
*
Author to whom correspondence should be addressed.
Land 2022, 11(12), 2196; https://doi.org/10.3390/land11122196
Submission received: 28 October 2022 / Revised: 30 November 2022 / Accepted: 1 December 2022 / Published: 3 December 2022

Abstract

:
Accurate identification of land use conflicts is an important prerequisite for the rational allocation of land resources and optimizing the production–living–ecological space pattern. Previous studies used suitability assessment and landscape pattern indices to identify land use conflicts. However, research on land use conflict identification from the perspective of ecological security is insufficient and not conducive to regional ecological, environmental protection, and sustainable development. Based on ecological security, this study takes Shandong Province as an example and comprehensively evaluates the importance of ecosystem service function and environmental sensitivity. It identifies the ecological source, and extracts ecological corridors with a minimum cumulative resistance model from which ecological security patterns are constructed. It identifies land use conflicts through spatial overlay analysis of arable land and construction land. The results show that: (1) Shandong Province has formed an ecological security pattern of “two ecological barriers, two belts, and eight cores” with an area of 15,987 km2. (2) The level of arable land–ecological space conflict is low, at 39.76%. The proportions of serious and moderate conflicts are 13.44% and 26.97%, respectively, distributed primarily on the Jiaodong Peninsula and the low hill areas of Ludong. (3) Construction land–ecological space conflict is reasonably stable and controllable, at 76.39%, occurring mainly around urban construction land, with serious and moderate conflict concentrated in the eastern coastal areas, mainly between rural settlements and ecologically safe space in the region. This study has important theoretical and practical reference values for identifying land use conflicts, protecting regional ecological security, and optimizing land use patterns.

1. Introduction

The concept of conflict, which first originated in sociology, refers to the psychological or behavioral contradictions that arise when two or more social units are incompatible or mutually exclusive in their goals [1]. With rapid urbanization and industrialization, increasing intensity of land development, and growing tension between people and land, scholars have introduced the concept of conflict into the field of land resources, resulting in the phrase “land use conflict” [2]. The concept of land use conflict can be traced back to 1970s. When the goals of different stakeholders in a specific land parcel were irreconcilable, land use conflict would occur. Land conflict can be understood as a dispute or abuse of land property rights [3]. Land use conflict refers to the contradictory state in the process of land resource utilization [1,4]. Li, Zhu [5] defined the conflict between agriculture and ecological functions as the space–time game generated in the process of agricultural activities and ecological protection. Based on stakeholder theory, Steinhäußer, Siebert [6] defined land use conflict as the inconsistency and disharmony between various stakeholders in the way and quantity of land use in the utilization of land resources, and the conflict between various land use practices and the natural environment. Although there is no clear and unified concept of land use conflict, studies have generally accepted that land use conflict is caused by the multiplicity and finiteness of land resources and the diversity of demands [7]. Currently, land use conflicts have become a global issue [1,4,8,9,10,11]. Land use conflicts hinder the rational and sustainable use of land resources, exacerbate human–land conflicts, and are detrimental to sustainable development.
The study of land use conflicts is an important breakthrough in revealing the evolutionary mechanisms of complex human–land relations, and the accurate identification of land use conflicts is a core element of land use conflict research. As early as the 1970s, scholars carried out land use conflict identification employing interviews, field research, and participatory mapping [12,13,14]. In recent years, as land use conflicts have increased in intensity and scope and as technology has advanced, quantitative analysis methods are commonly used to identify land use conflicts [15,16,17,18]. Quantitative analysis can accurately identify the scale, intensity, spatial distribution, and change characteristics of land use conflicts, which can deepen our knowledge and understanding of land use conflicts and help us to take corresponding countermeasures to mediate land use conflicts. The two main categories include the landscape pattern method and the comprehensive evaluation method. Among them, the landscape pattern index method is based on land use data, and by analyzing the external pressure on the landscape, the degree of spatial exposure, and the spatial stability of the landscape, the rank and type of land use conflicts are judged comprehensively [19]. The integrated evaluation method focuses on the construction of an evaluation index system to comprehensively evaluate land use conflicts by considering the dimensions of land use suitability, propensity, competitiveness, and diversity of demand [20,21,22,23]. The above methods have achieved the quantitative identification of land use conflicts, promoted the development of land use conflict research, and provided inspiration for this study. However, the land use conflict identification described above belongs to the category of potential land use conflict identification, which reduces the significance of guidance for real land use. Land use conflicts are also closely related to socioeconomic development. Currently, China has proposed carbon neutrality and carbon peaking, and has an increased focus on the construction of ecological civilization, promoting the green development concept that green water and green mountains are precious, and that mountains, forests, fields, lakes, and grasses are a living community. Ecological security has received unprecedented attention, but research on the identification of land use conflicts from the perspective of ecological security is relatively lacking, making it difficult to effectively support the current allocation and use of land resources in China.
Shandong Province is a populous and economically powerful province in China. The rapid development of urbanization and industrialization has led to an increasingly prominent conflict between agricultural production, economic development, and ecological protection, a situation that serves as a microcosm of China. Taking Shandong Province as an example, this study attempts to construct an ecological security pattern based on the importance of ecosystem service function and ecological sensitivity and to quantitatively identify arable land–ecological space conflict and construction land–ecological space conflict from an ecological security perspective to provide a scientific reference for land use conflict mediation and optimization of the spatial pattern of the land in Shandong Province.

2. Study Area and Data Sources
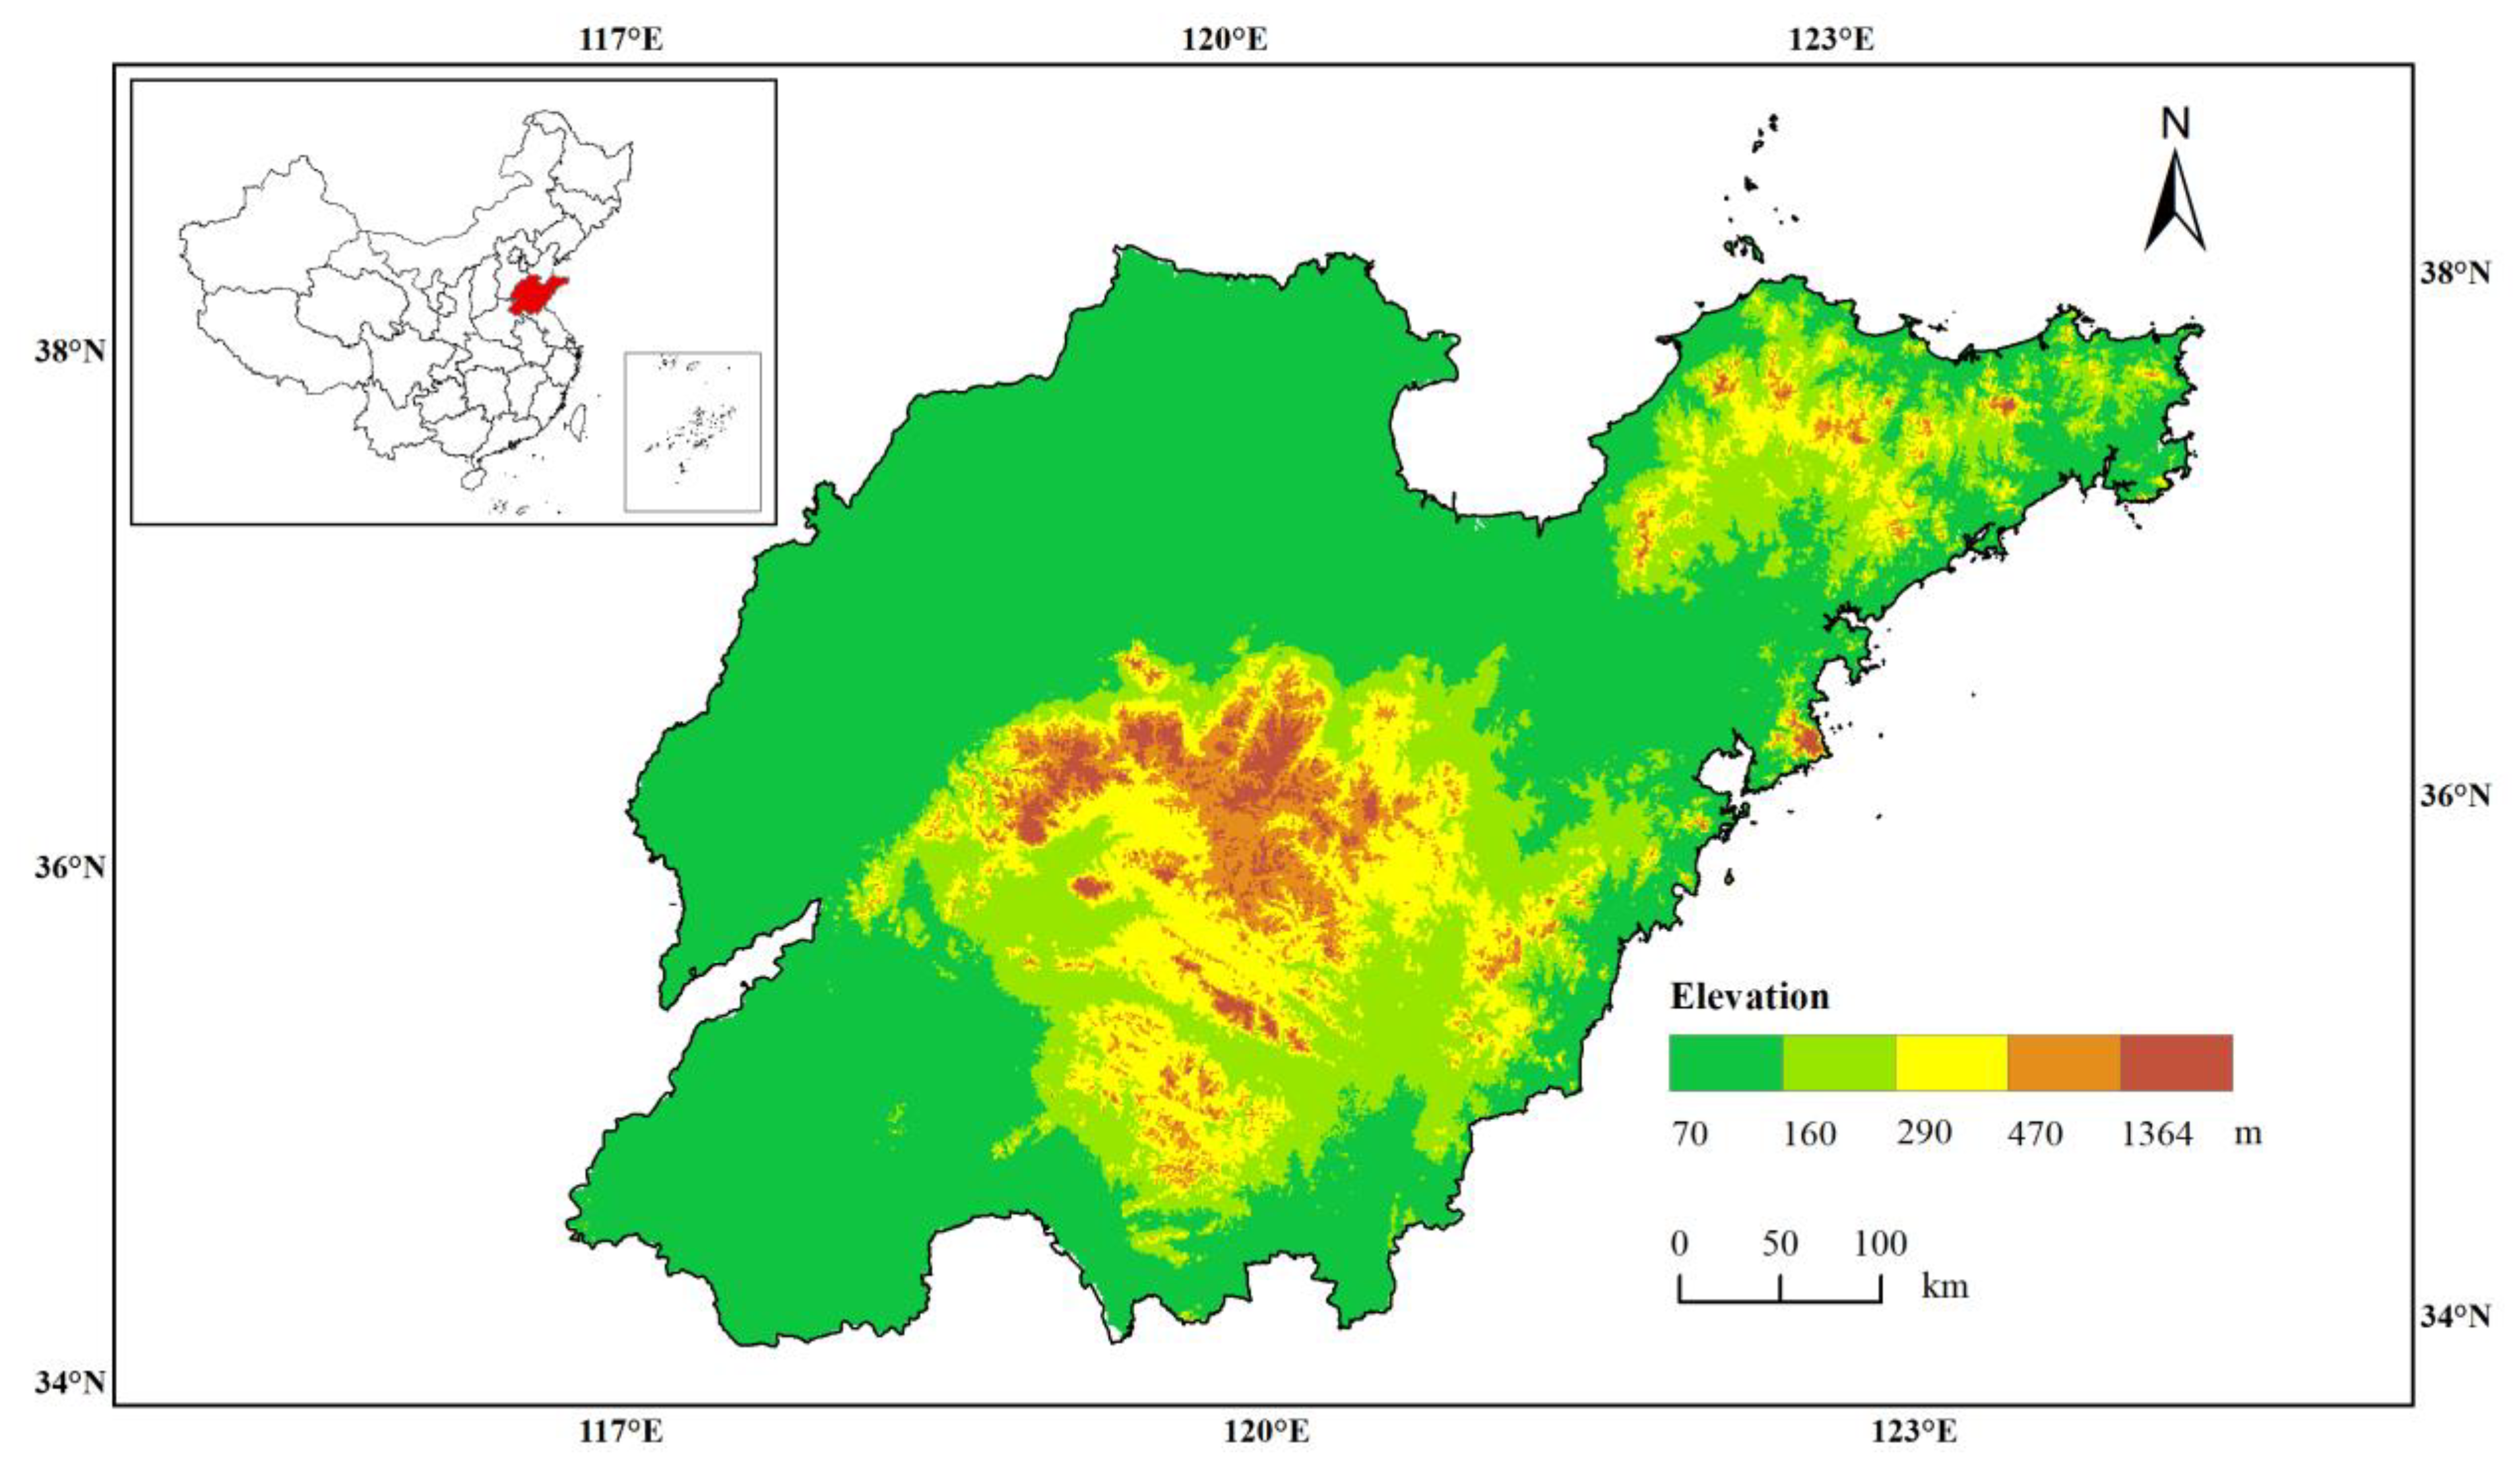
2.1. Study Area

Shandong Province is geographically located at 34°22.9′ N–38°24.1′ N and 114°47.5′ E–122°42.3′ E (Figure 1), with a total land area of about 1.57 × 10⁷ hm2, accounting for about 1.63% of the total land area of China. Its topography is complex, with mountains in the center, hills in the east, and plains in the west and north. Shandong Province has a developed and rapidly developing economy, with a high level of industrialization and urbanization. With the growth of population and rapid urban expansion, the spatial pattern of land use has changed significantly. Shandong Province has more people, less land, less water, and less forest, and the contradiction between land supply and demand is outstanding; the province is very short of forest and water resources, which are closely related to ecology, and the per capita wetland and forest possessions are among the 20th in China, the poor endowment of ecological resources coexists with the continuous increase in demand for land resources.

2.2. Data Sources and Processing

The data used for the study mainly include DEM data from the ASTER GDEM data product of the geospatial data cloud platform (http://www.gscloud.cn/, accessed on 16 March 2022) with a spatial resolution of 30 m. The slope and relief amplitude were extracted through GIS spatial analysis tools; basic geographic data (rivers and waters, traffic roads) were obtained from the geospatial data cloud (https://www.gscloud.cn/, accessed on 16 March 2022); the locations of chemical plants and mines were obtained using the Google Maps coordinate selection system. The soil data were obtained from the Chinese soil dataset (V1.1) in the World Soil Database. Precipitation data were obtained from the National Meteorological Science Data Sharing Service Platform (http://data.cma.cn/index.html/, accessed on 18 March 2022) for 109 meteorological stations in and around the study area in 2020, and the precipitation in the study area was obtained by kriging interpolation. The annual scale mean values of net primary productivity of vegetation, land use data, and NDVI, all with a spatial resolution of 1 km, were obtained in 2020 from the Chinese Academy of Sciences Resource and Environment Science and Data Center (https://www.resdc.cn/, accessed on 18 March 2022).

3. Methodology

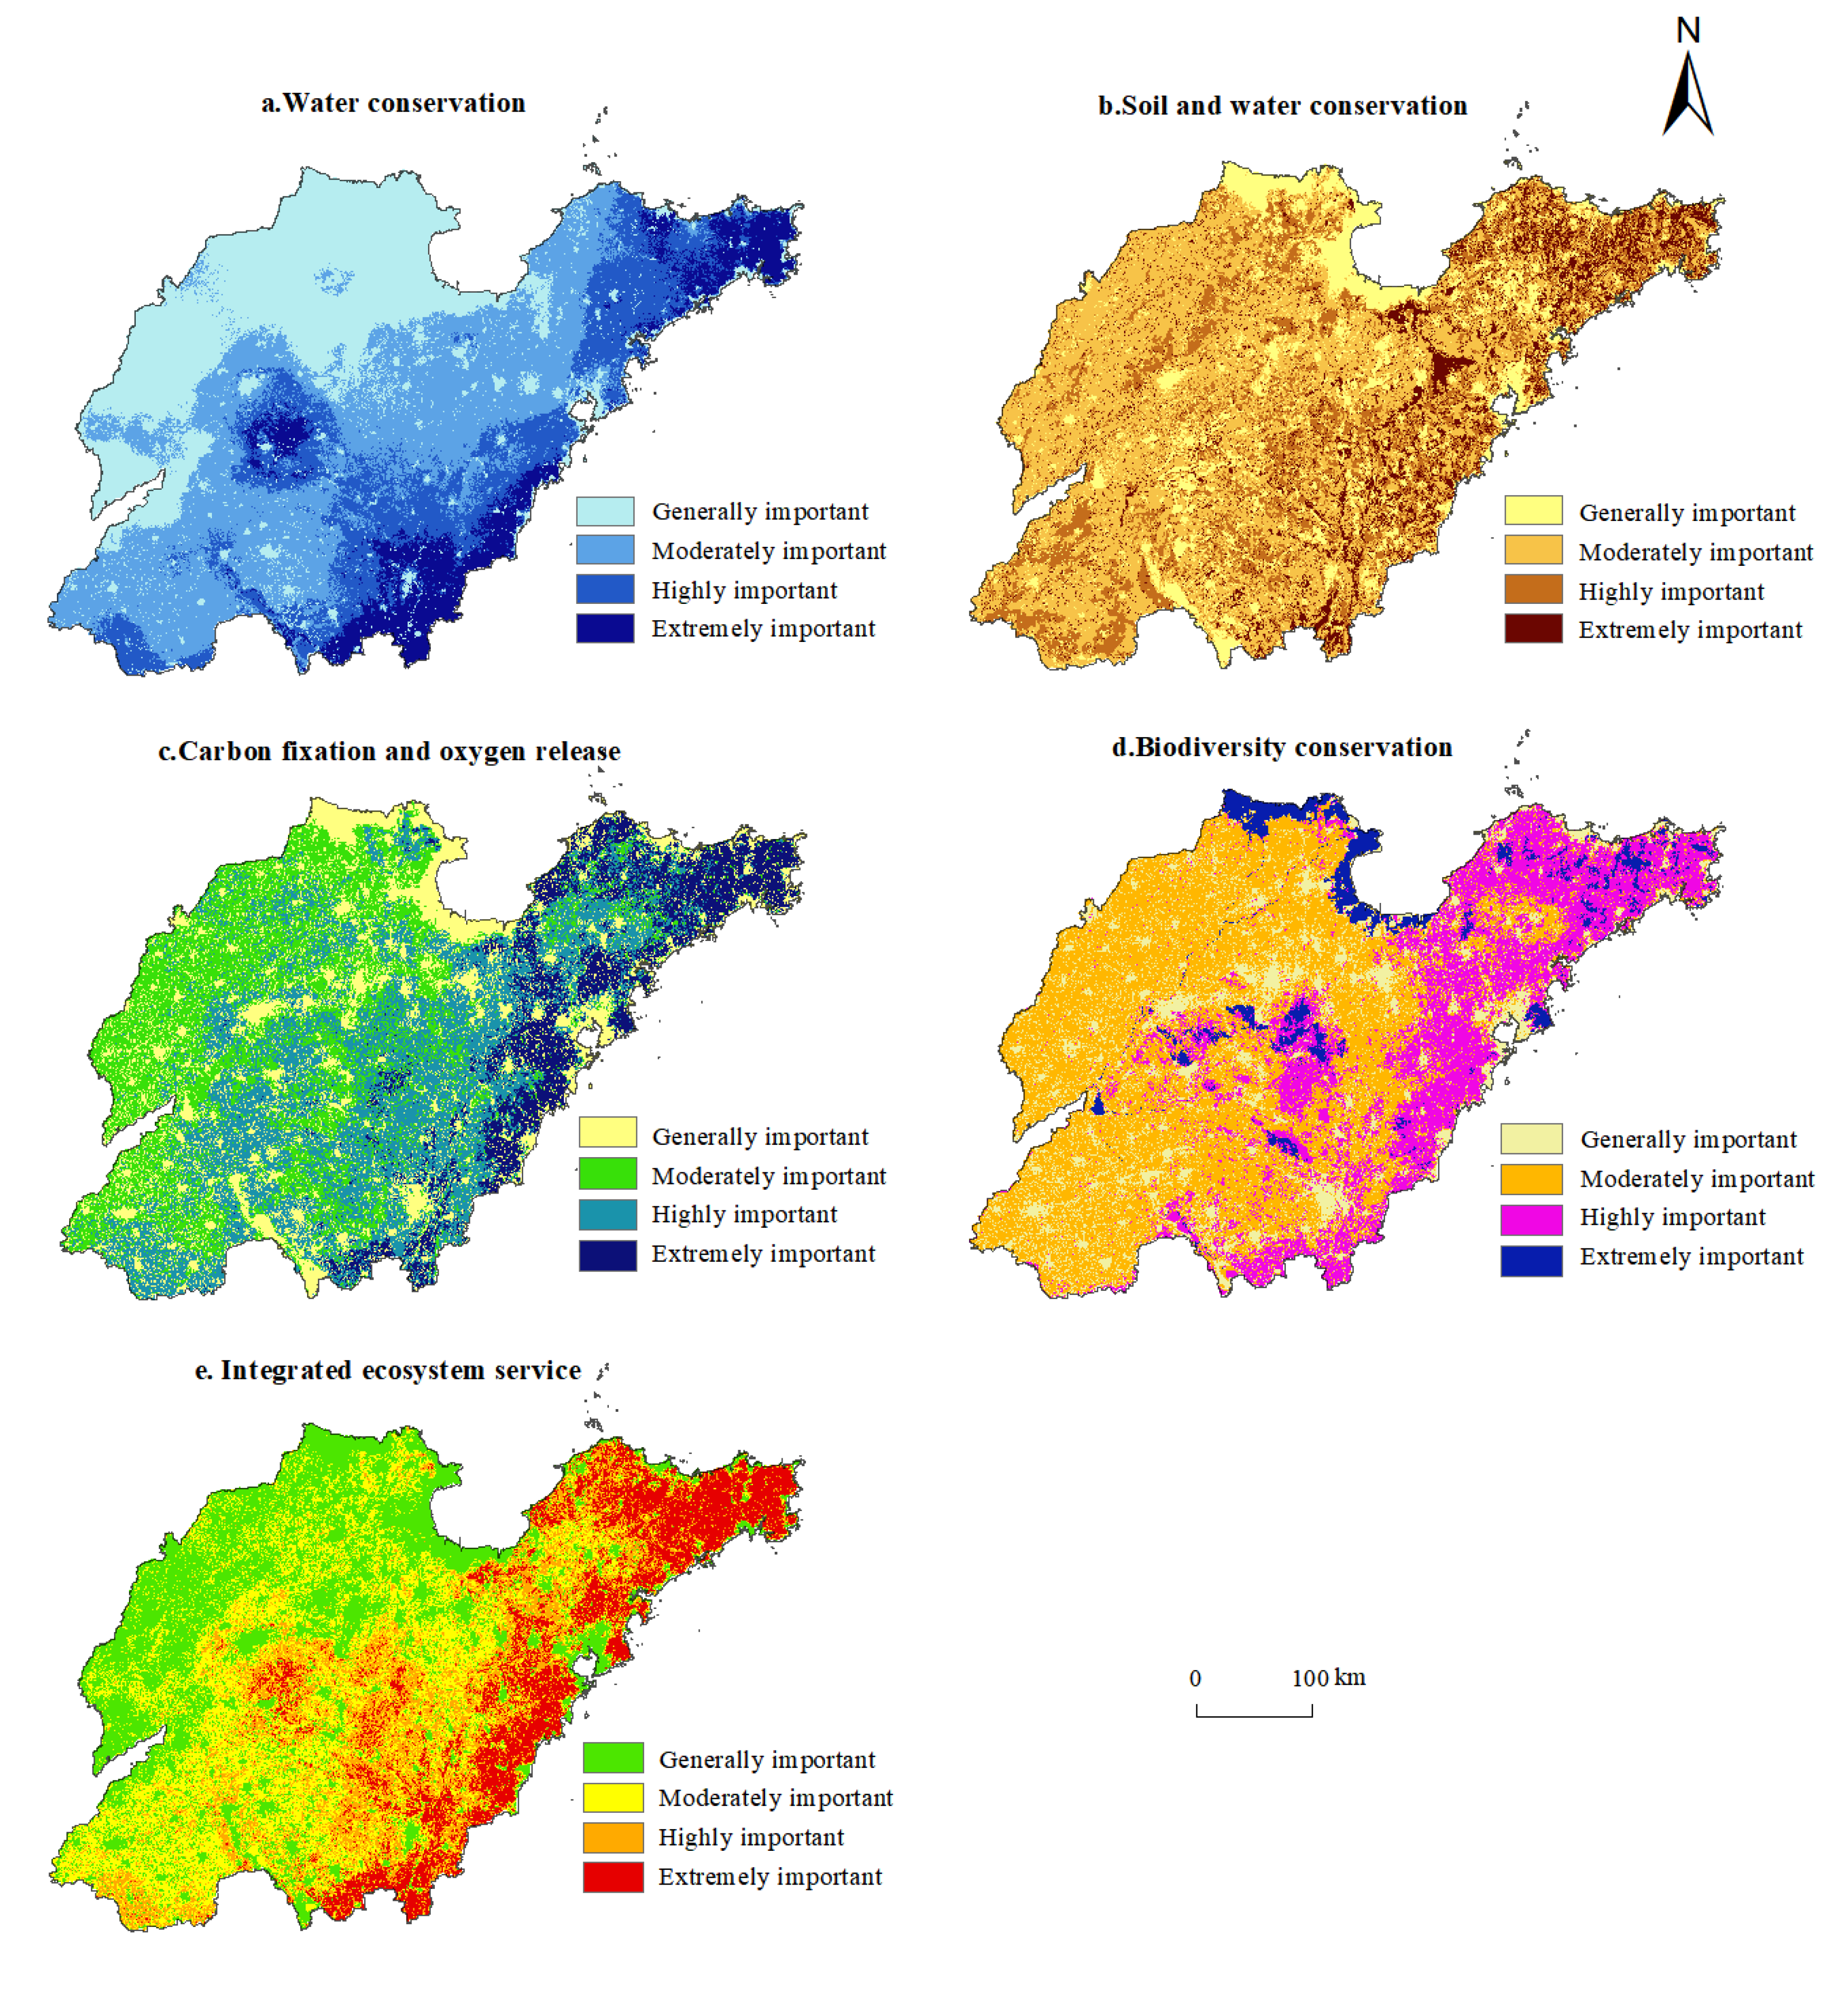
3.1. Evaluation of the Importance of Ecosystem Service Functions

Ecosystem service functions are the natural environmental conditions and functions that ecosystems and ecological processes create and maintain to ensure human survival. They include water conservation, soil and water conservation, wind and sand control, biodiversity, carbon fixation, and oxygen release. In line with relevant studies [24,25], combined with the guidelines for ecological protection red-line delineation and the background conditions of ecosystems and development needs in Shandong Province, this paper comprehensively evaluates the importance of Shandong’s ecosystem service functions in terms of water conservation, soil and water conservation, carbon fixation and oxygen release, and biodiversity conservation. The raster value corresponding to 30%, 50%, and 80% of the total value of ecosystem services is used as the cutoff point for the assessment of ecosystem service functions, which are classified into four levels: extremely important, highly important, moderately important, and generally important, and the measurement method of each ecosystem service function is shown in Table 1.

3.2. Evaluation of Ecological Sensitivity

Ecological sensitivity is the degree to which an ecosystem is sensitive to disturbance by natural and human activities in a region. It is used to reflect the ease with which ecological imbalances and ecological problems can occur when a regional ecosystem is disturbed [31]. There are high mountains in the middle of Shandong Province and low and gentle hills in the east. Therefore, there is a risk of soil erosion. The Yellow River Delta and other areas have a salinization problem. Therefore, the ecological sensitivity of Shandong Province was evaluated from two aspects: soil erosion and salinization. Referring to relevant studies [31,32,33,34,35], and in combination with the actual situation of the ecological environment and data availability in Shandong Province, seven evaluation indicators were selected to construct an ecological sensitivity evaluation index system (Table 2). On this basis, the geometric mean model was used to estimate the ecological sensitivity.

3.3. Constructing Ecological Security Patterns

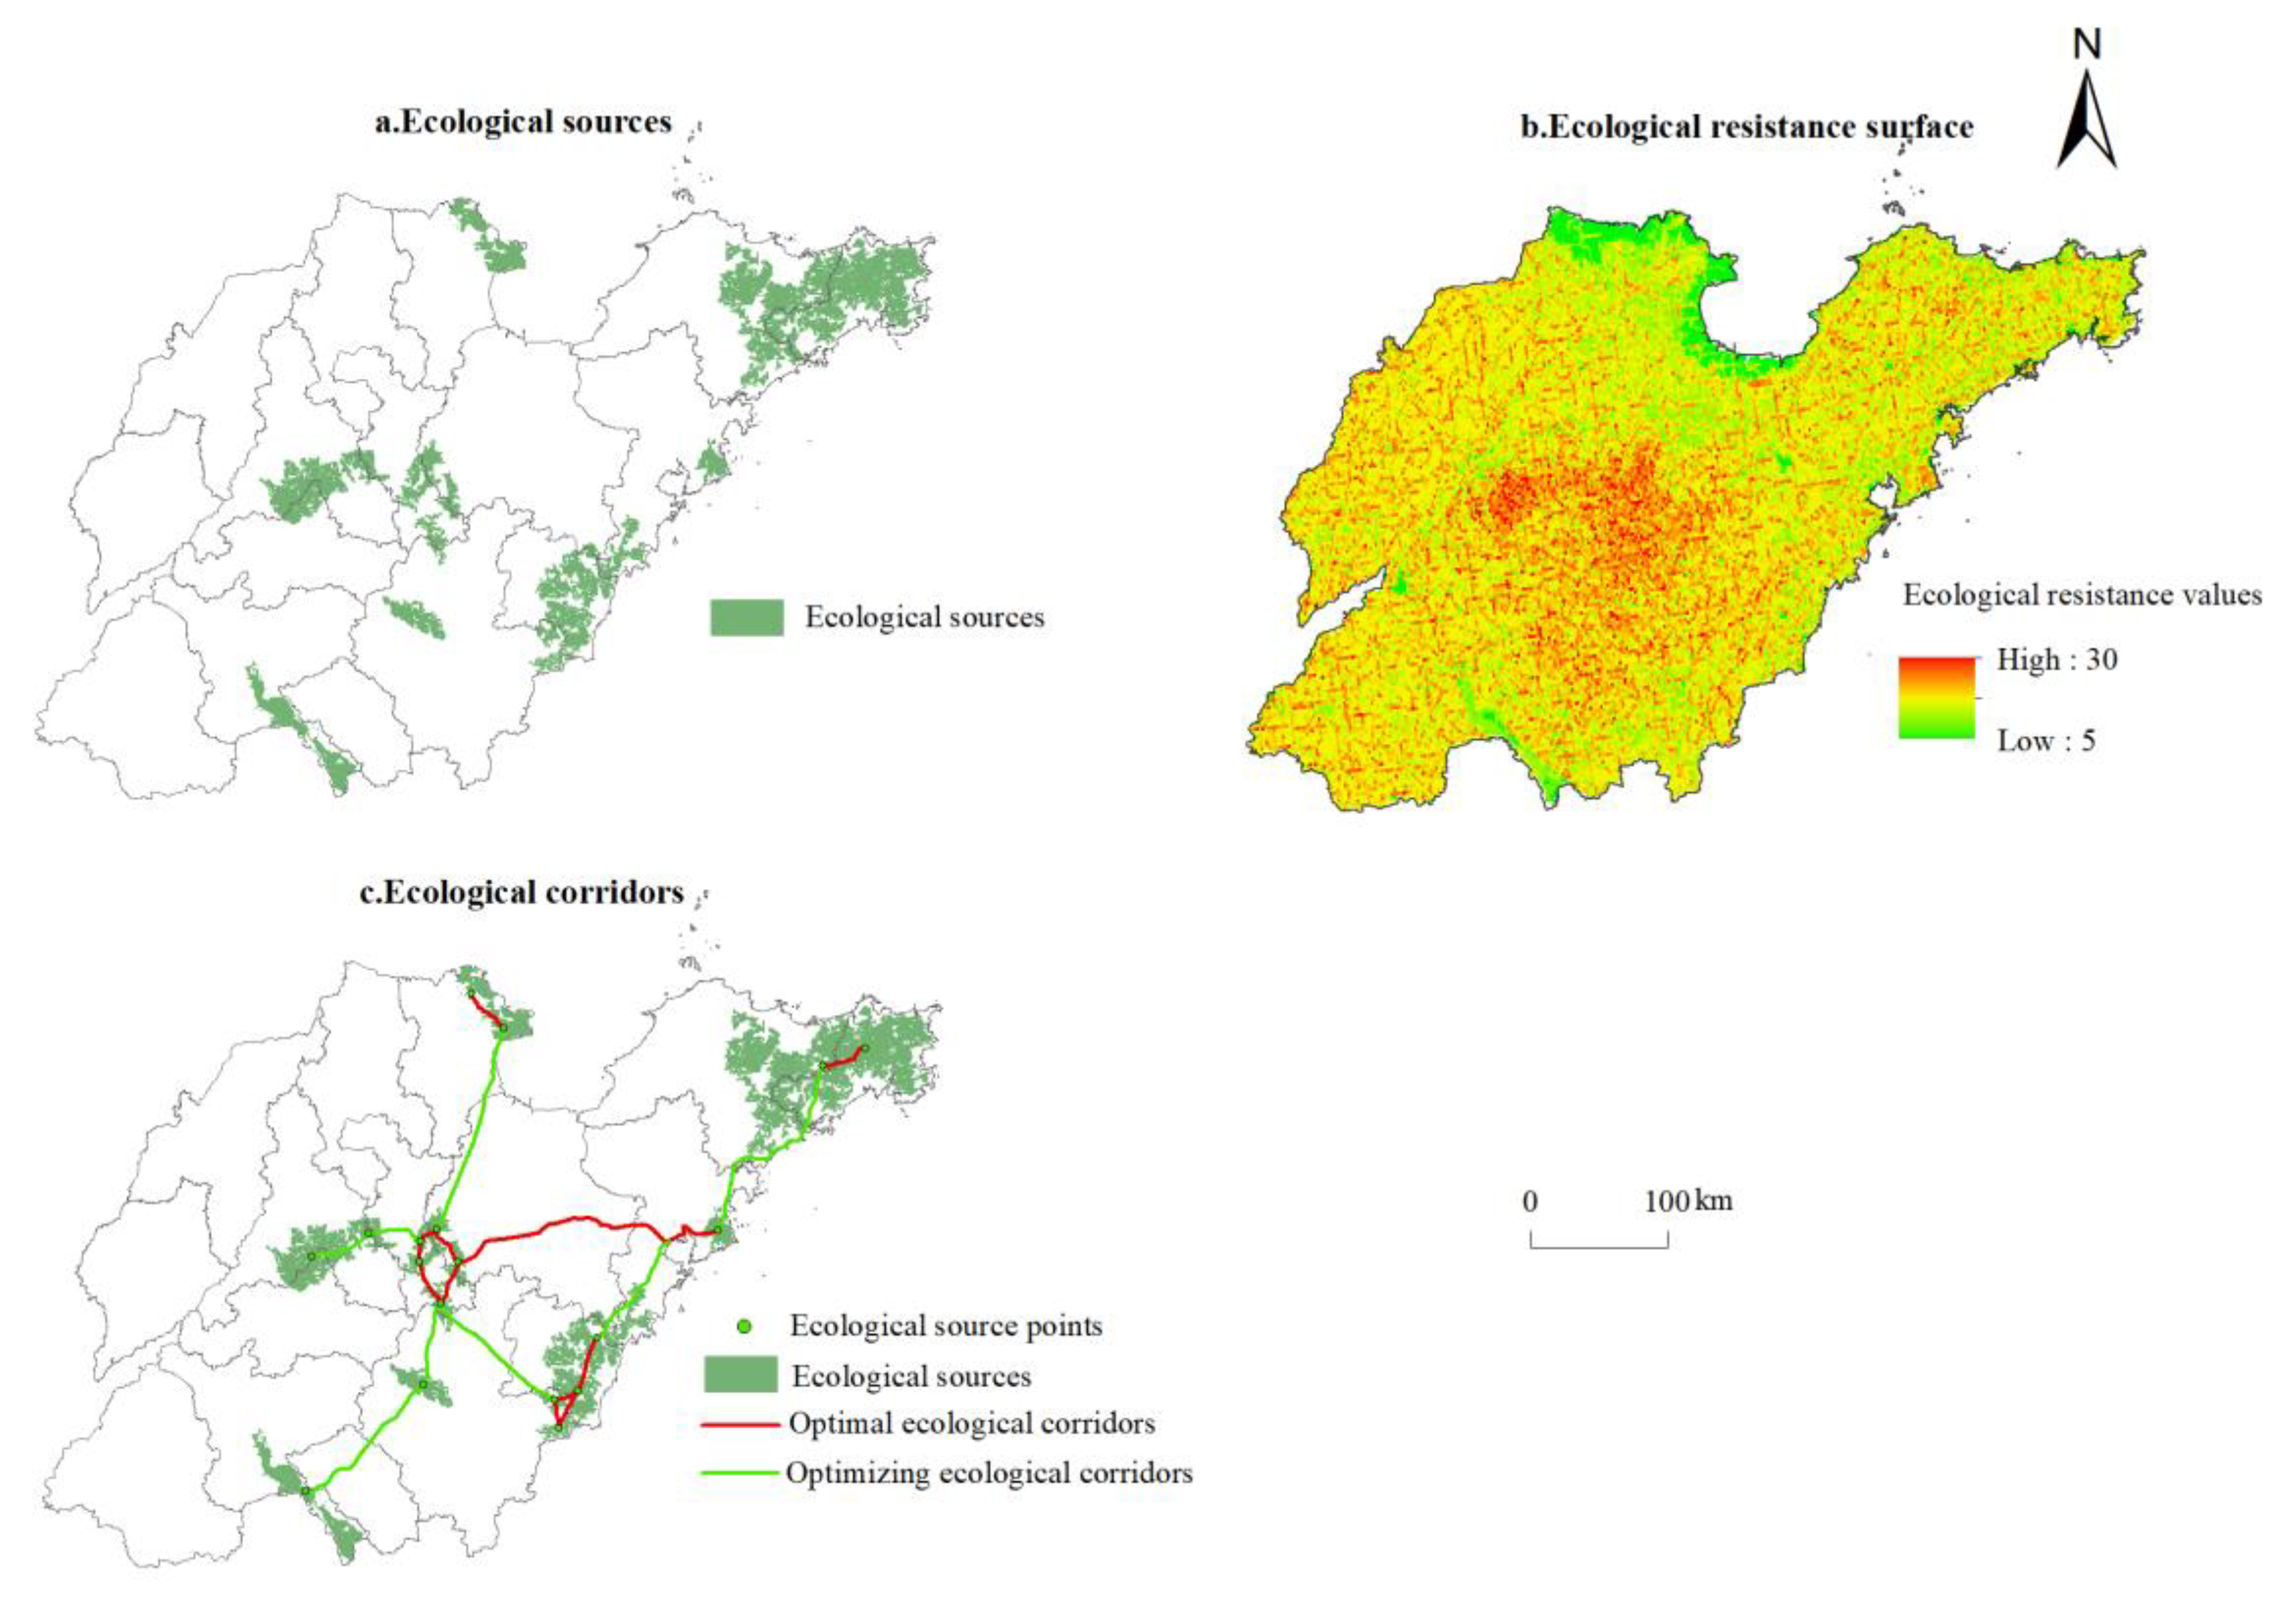
3.3.1. Identification of Ecological Sources

Ecological sources are areas of high habitat quality that contribute positively to the ecological environment and are the starting point for species maintenance and dispersal and the ecological protection floor [39]. In this paper, the importance of ecosystem service functions and ecological sensitivity layers are spatially overlaid using ArcGIS 10.5 software, and in line with Cannikin’s law, extremely important ecosystem service functions and highly sensitive ecological areas are extracted as ecological source areas, while the Yellow River Delta National Nature Reserve and Nansi Lake Reserve are included in the ecological source areas. The source areas were also included in the Yellow River Delta National Nature Reserve and Nansi Lake Reserve.

3.3.2. Ecological Resistance Surface

The construction of the ecological resistance surface is the core of ecological corridor extraction, reflecting the spatial distribution of the intensity of resistance to ecological flows as they run between ecological functions [40]. The ecological processes of horizontal spatial movement of species and the flow and transfer of ecological functions are mainly influenced by the state of land cover and the degree of anthropogenic disturbance. Therefore, with reference to relevant studies [41,42,43,44,45], this paper selects eight evaluation indicators from two aspects of ecological attributes and ecological disturbances to construct an evaluation index system of ecological resistance (Table 3). According to the landscape resistance value of each resistance factor and the corresponding indicator weights, a weighted superposition is made in GIS software to obtain the spatial distribution of the ecological resistance surface.

3.3.3. Ecological Corridors

A consensus has emerged in the field of ecological research regarding the achievement of ecological functions such as biodiversity conservation and pollution control through the construction of ecological corridors while meeting the growing human need for nature [46]. In this paper, the geometric center of an ecological source site is taken as the ecological source point, and the ecological resistance surface is used as the basis to simulate and calculate the minimum resistance that species need to overcome to move between source sites, thereby constructing an ecological corridor for biological flow, with the following calculation formula:
MCR = f min j = n i = m D i j × R i
In Equation (1), MCR is the minimum cumulative resistance value; D i j is the spatial distance of a species from source j to landscape unit i ; R i is the coefficient of resistance of landscape unit i to the movement of a species; f denotes the positive correlation between the minimum cumulative resistance and the ecological process.
The interaction matrix between the ecological source patches was calculated through the gravity model (2) to quantitatively evaluate the interaction strength between the source patches so that the relative importance of potential corridors in the region could be judged more scientifically, and the potential corridors with highly important were considered optimal ecological corridors [47,48]. Simultaneously, to ensure connectivity between the source sites, the study area was combined with the actual situation to set up potential ecological corridors.
G i j = N i N j D i j 2 = 1 P i × l n S i 1 P i × l n S j L i j L m a x 2 = L m a x 2 l n S i S j L i j 2 P i P j
In Equation (2), G i j is the interaction strength between patch i and patch j ; N i and N j are the weighting coefficients of patch i and patch j , respectively; D i j is the normalized resistance value of the potential corridor between patch i and patch j ; P i is the overall resistance value of patch i ; S i is the area of patch i ; L i j is the cumulative resistance value of the potential corridor between patch i and patch j ; and L m a x is the maximum resistance value of all corridors in the study area.

3.3.4. Ecological Security Pattern

The ecological security pattern is derived from the coupling theory of spatial pattern and ecological process in landscape science, focusing on the potential landscape ecological pattern [49]. The ecological security pattern is a spatial configuration scheme to optimize the territorial spatial pattern of regional ecological space, which is of great significance for maintaining the integrity of the landscape pattern and regional ecological security [50], improving the quality and stability of the ecosystem, ensuring the sustainable supply of regional ecosystem services, and improving human well-being.
Therefore, based on the evaluation results of the importance of ecosystem service functions and ecological sensitivity, together with the extracted ecological sources and ecological corridors, this study comprehensively constructed an ecological security pattern including low, medium, high and extremely high levels of ecological security. Specifically, the 400 m buffer zone of the ecological sources and ecological corridors was taken as the low ecological safety level, while the high, medium, and low levels of the ecosystem service function importance and ecological sensitivity evaluation results and the 400–800 m buffer zone, 800–1200 m buffer zone, and 1200–1600 m buffer zone of the ecological corridors were taken as the medium, high, and extremely high ecological safety levels, respectively.

3.4. Land Use Conflicts Identification and Classifications

With the increase and diversification in land use demand, land resources are increasingly scarce, leading to a variety of land use conflicts. Among them, land use conflict mainly occurs between construction land and arable land, and ecological space and productive land (arable land and construction land). Combined with the current background of ecological civilization construction in China, land use conflict from the perspective of ecological security in this paper refers to the unreasonable occupation of ecological security space by human social and economic activities such as agricultural production and economic construction, which is mainly manifested as the mismatch and overlapping relationship among arable land, construction land, and ecological space [5,51]. The arable land–ecological space conflict is the occupation of ecological space by agricultural farming activities, expressed as the overlapping relationship between arable land and ecological space. The construction land–ecological space conflict is the occupation of ecological space by economic construction activities, expressed as the overlapping relationship between construction land and ecological space. The integrated land use conflict is the occupation of ecological space by agricultural farming, economic construction, and other human activities. The integrated land use conflict is the occupation of ecological space by economic activities such as farming and economic construction, manifested as the overlapping relationship among arable land, construction land, and ecological space, namely the superimposed result of the conflict between arable land and construction land, a comprehensive manifestation of the superimposed effect of land use conflict [52]. According to the overlapping relationship among arable land, construction land, and low, medium, high, and extremely high ecological safety levels, land use conflict is divided into four types: stable and controllable, mild conflict, moderate conflict, and serious conflict.

4. Results

4.1. Spatial Distribution Characteristics of Ecosystem Service Functions

The spatial differences in the importance of each individual ecosystem service function in the study area are evident(Figure 2). Among them, the extreme importance of carbon sequestration and oxygen release function is 13.02%, with a spatial distribution pattern of high in the east and low in the west, due to the abundant forest resources in the eastern region, while the northwestern region is a plain dominated by food production, and forest resources are scarce. The proportion of areas with extremely important soil and water conservation functions is 10.46%, mainly in the eastern part of Shandong Province, which does not form a continuous distribution compared with the water conservation function, being mainly in the form of a point and block distribution. The importance of water conservation function is 9.72%, mainly in the southwest, northeastern Yanwei, and the central areas of Shandong Province, due to the high precipitation in the eastern coastal areas and the rich vegetation resources in the southwestern and central areas, which have strong water storage capacity. The extremely important areas of biodiversity account for 5.11% and are mainly distributed in the mountainous hills of south-central Shandong and the Yellow River Delta, mainly due to the good water and heat conditions, numerous mountains and high vegetation cover in these areas, while the low-value areas are distributed in urban built-up areas with high intensity of human activities.
The importance of integrated ecosystem service functions in the study area shows a spatial distribution pattern of high in the east and low in the west. The area of extremely important ecosystem service function is 25,086 km2, accounting for 16.17%, mainly in the mountainous areas of central Shandong, the Jiaodong Peninsula, and the eastern coastal areas, which are rich in forest vegetation resources and have many rivers. The highly important area is 30,997 km2, accounting for 19.98%, mainly located around the extremely important area. The areas of moderately important and general important account for 31.27% and 32.61% of the total area of the study area, respectively. The areas of moderately important and general important account for 31.27% and 32.61% of the total area of the study area, respectively, and are mainly located in the plains with fewer forest resources and in the built-up areas of cities and towns, which are more affected by human activities.

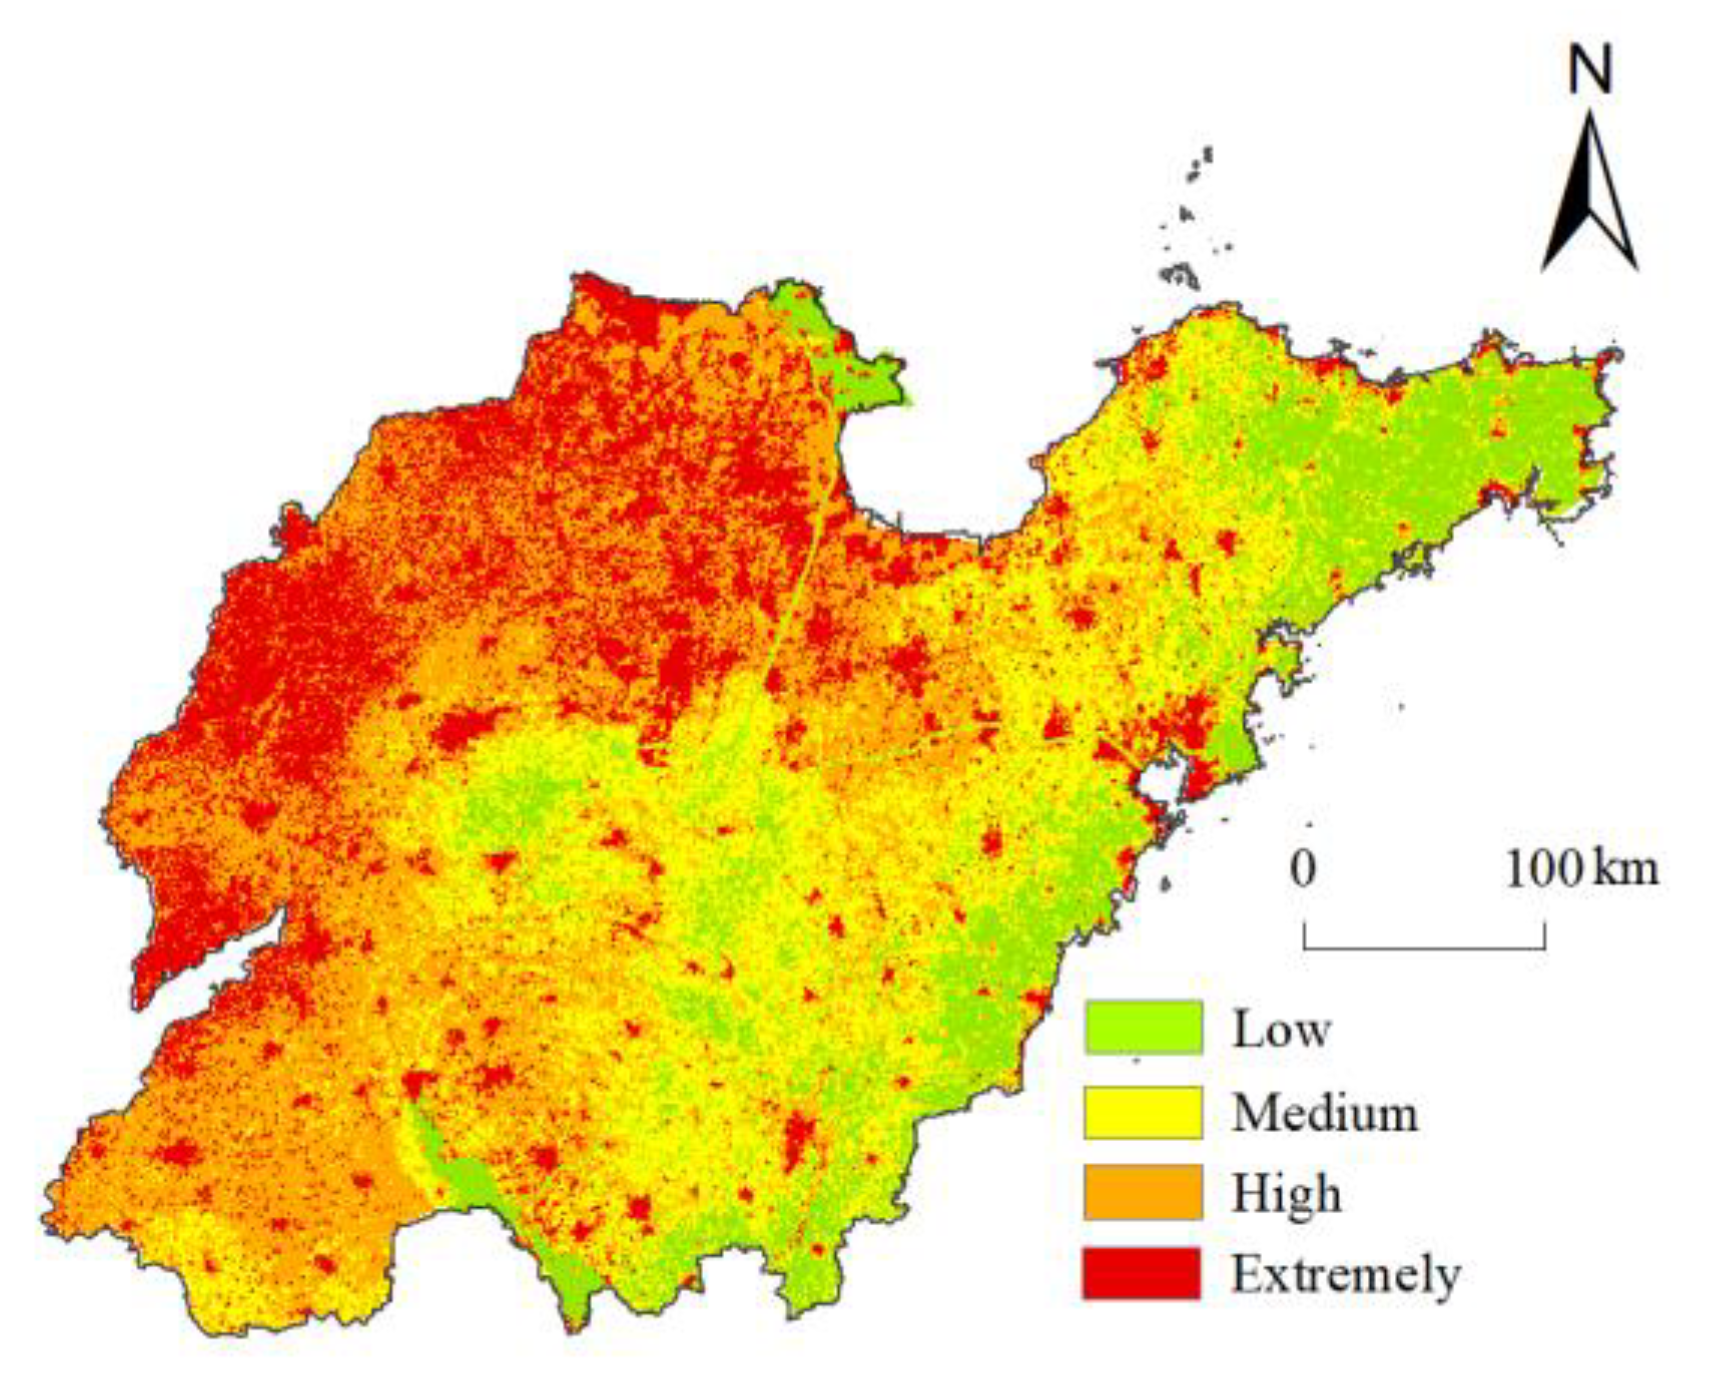
4.2. Spatial Distribution Characteristics of Ecological Sensitivities

As Figure 3 shows, the spatial distribution of ecological sensitivity in the study area varies widely. The highly and moderately sensitive area of soil erosion is 43,889 km2, accounting for 28.29%, which indicates that the risk of soil erosion in the study area is higher. The area of highly sensitive areas is 11,775 km2, accounting for 7.59%, and is mostly distributed in areas with high elevation slopes in the middle hills. The sensitivity to salinization is mainly dominated by nonsensitive areas, with an area of 146,187 km2, accounting for 94.23%, of which the highly sensitive areas are mainly concentrated in the Yellow River Delta, which is affected by various hydrodynamic factors such as the Yellow River and the Bohai Sea, with shallow groundwater deposits, high mineralization, and high soil salinity.
There is a significant difference in the proportion of each level of ecological sensitivity. The ecologically highly sensitive areas cover an area of 12,431 km2, accounting for 8.01%, and are mostly located near mountains, hills, and rivers, with high vegetation cover in mountainous areas and sensitive and fragile ecology near water bodies, where human activities can easily cause damage to the ecological environment that is difficult to reverse. The ecologically sensitive and insensitive areas account for 41.37% and 27.90% of the total area of the study area, respectively, and are mainly located in the western and northern parts of Shandong Plain and the built-up areas of cities and towns.

4.3. Ecological Sources and Corridors

According to Cannikin’s law, after extracting the highly important ecosystem service functions and ecologically sensitive areas, and excluding the fragmented patches with an area of fewer than 5 km2, we obtained eighteen ecological source areas, including the Yellow River Delta and the South Four Lakes Reserve (Figure 4a), with an area of 15,987 km2, accounting for 10.26% of the total study area, mainly distributed in the mountainous hills of south-central Shandong, low mountainous hills in eastern Shandong, and the hills of the Jiaodong Peninsula.
Based on the landscape resistance values for each resistance factor and the corresponding index weights, the spatial distribution of ecological resistance was obtained by weighted superposition (Figure 4b). Additionally, 12 optimal ecological corridors, 587.43 km in length, were initially extracted by combining the ecological source areas with the minimum cumulative resistance model and the gravity model, mainly distributed in the mountainous hills of central Shandong and the Jiaodong Peninsula. The initial extracted optimal ecological corridors have problems such as disconnected landscape patches and intermittent ecological functions. Therefore, the disconnected ecological source points were further used as sources to find the subminimal resistance paths, and the strength of interaction and connectivity between ecological sources was comprehensively evaluated, resulting in seven optimizing ecological corridors of 681.78 km (Figure 4c).

4.4. Spatial Distribution Characteristics of Ecological Security Pattern

Figure 5 shows the ecological security pattern of the study area, with a low ecological safety-level spatial area of 22,107 km2, accounting for 14.25% of the area, which mainly includes the ecological barriers of mountainous hills in south-central Shandong and low hills in eastern Shandong, covering the extremely important areas of water conservation, biodiversity maintenance, soil and water conservation, carbon sequestration, and oxygen release ecological functions in Shandong Province, and highly sensitive areas of soil erosion and salinization, which maintain ecological safety. These areas have a good ecological environment and are rich in biodiversity. They are areas of high value for ecosystem service functions and ecological sensitivity. The spatial area of the medium ecological safety level is 41,251 km2, accounting for 26.59%, which is widely distributed in the study area. These areas are ecologically fragile and serve as the conservation areas and protective barriers for ecological source lands and should be strengthened for ecological protection. The high ecological safety level covers 56,641 km2, accounting for 36.51% of the total area. As a transitional zone between human activities and natural ecology, it should embody the integrated protection policy of “green water and green mountains are golden mountains,” implement the concept of “green, open development,” and promote the compatible and coordinated development of the three regional functions. The area of extremely high ecological safety level is 35,138 km2, accounting for 22.65%, mainly in the construction land of the whole region and the plain areas of western and northern Shandong, where the ecological environment is poor due to the influence of human activities and background conditions. There is need to improve the level of intensive use, reduce the encroachment of ecological space, realize the combination of development, utilization, and protection, and build a green, ecological, and livable city.

4.5. Spatial Distribution Characteristics of Land Use Conflict

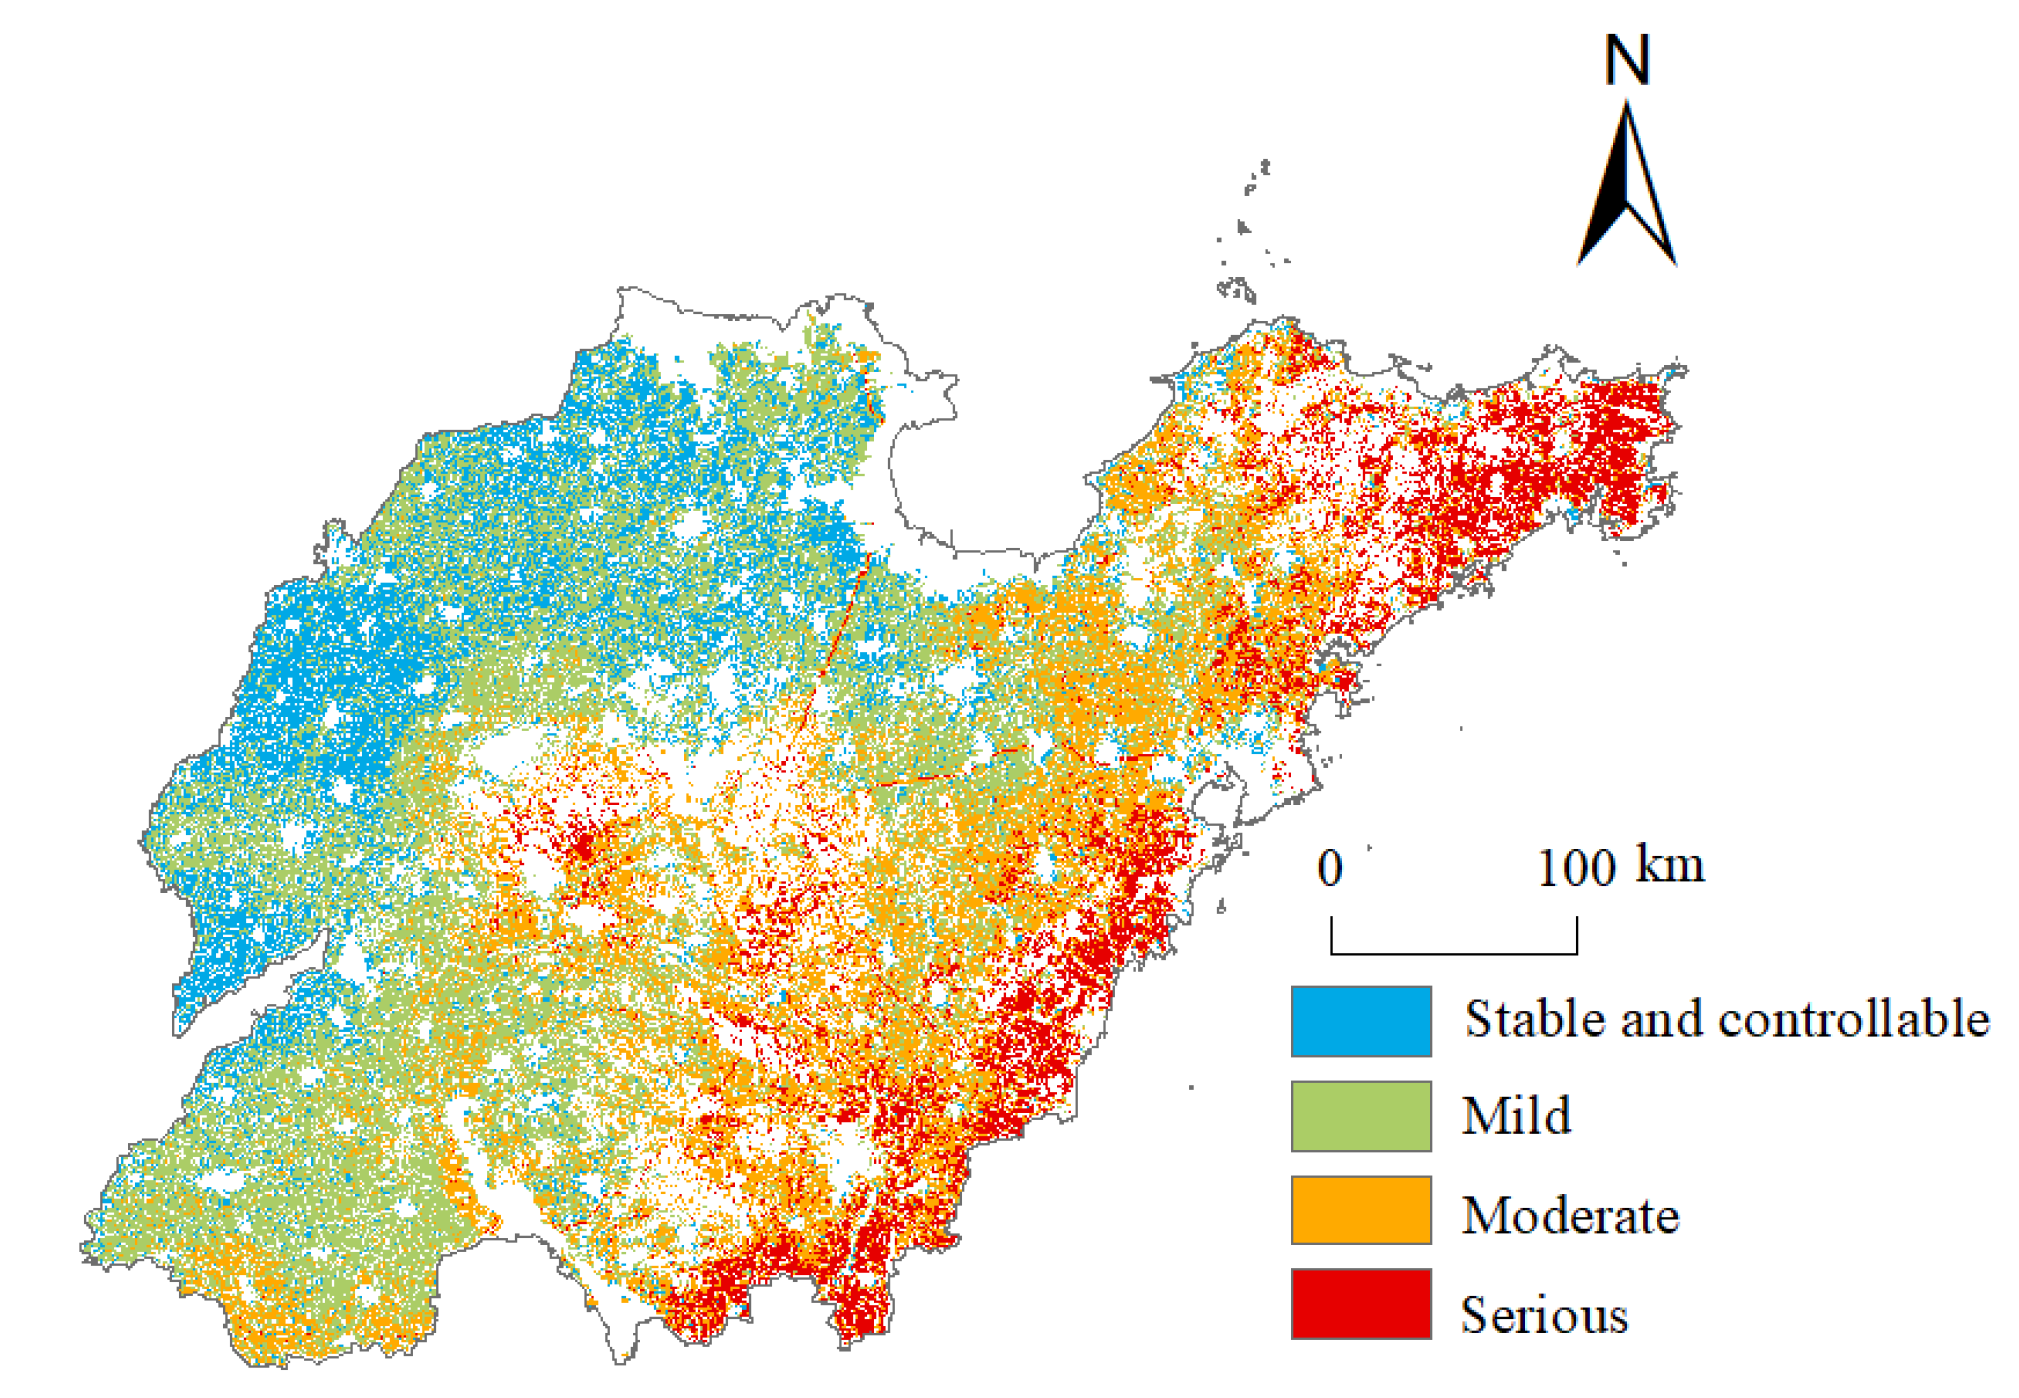
4.5.1. Arable Land–Ecological Space Conflict

As Figure 6 shows, the distribution of Arable land–ecological space conflict in the study area is relatively concentrated and intense: first, because of the large area of arable land in Shandong Province, which accounts for 64.48%; second, because of the natural ecological environment in Shandong Province and the large area of ecological source land patches. Specifically, the areas of stable and controllable, mild, moderate, and serious conflicts are 20,327, 40,764, 27,649, and 13,775 km2, respectively, among which, stable and controllable mild conflict is mainly distributed in the plain areas of western and northern Shandong. This is mainly because there is less ecological space, such as forest land, and land use in this region is mainly for farming and construction. Serious conflict and moderate conflict areas are mainly located in the Jiaodong Peninsula and the low hills of eastern Shandong, primarily because these areas are close to important water conservation functional areas, soil and water conservation functional areas, and biodiversity reserves, where the ecosystem service functions are high and ecological security is easily affected by human activities. Therefore, the conflict between arable land production and ecological protection is prominent.

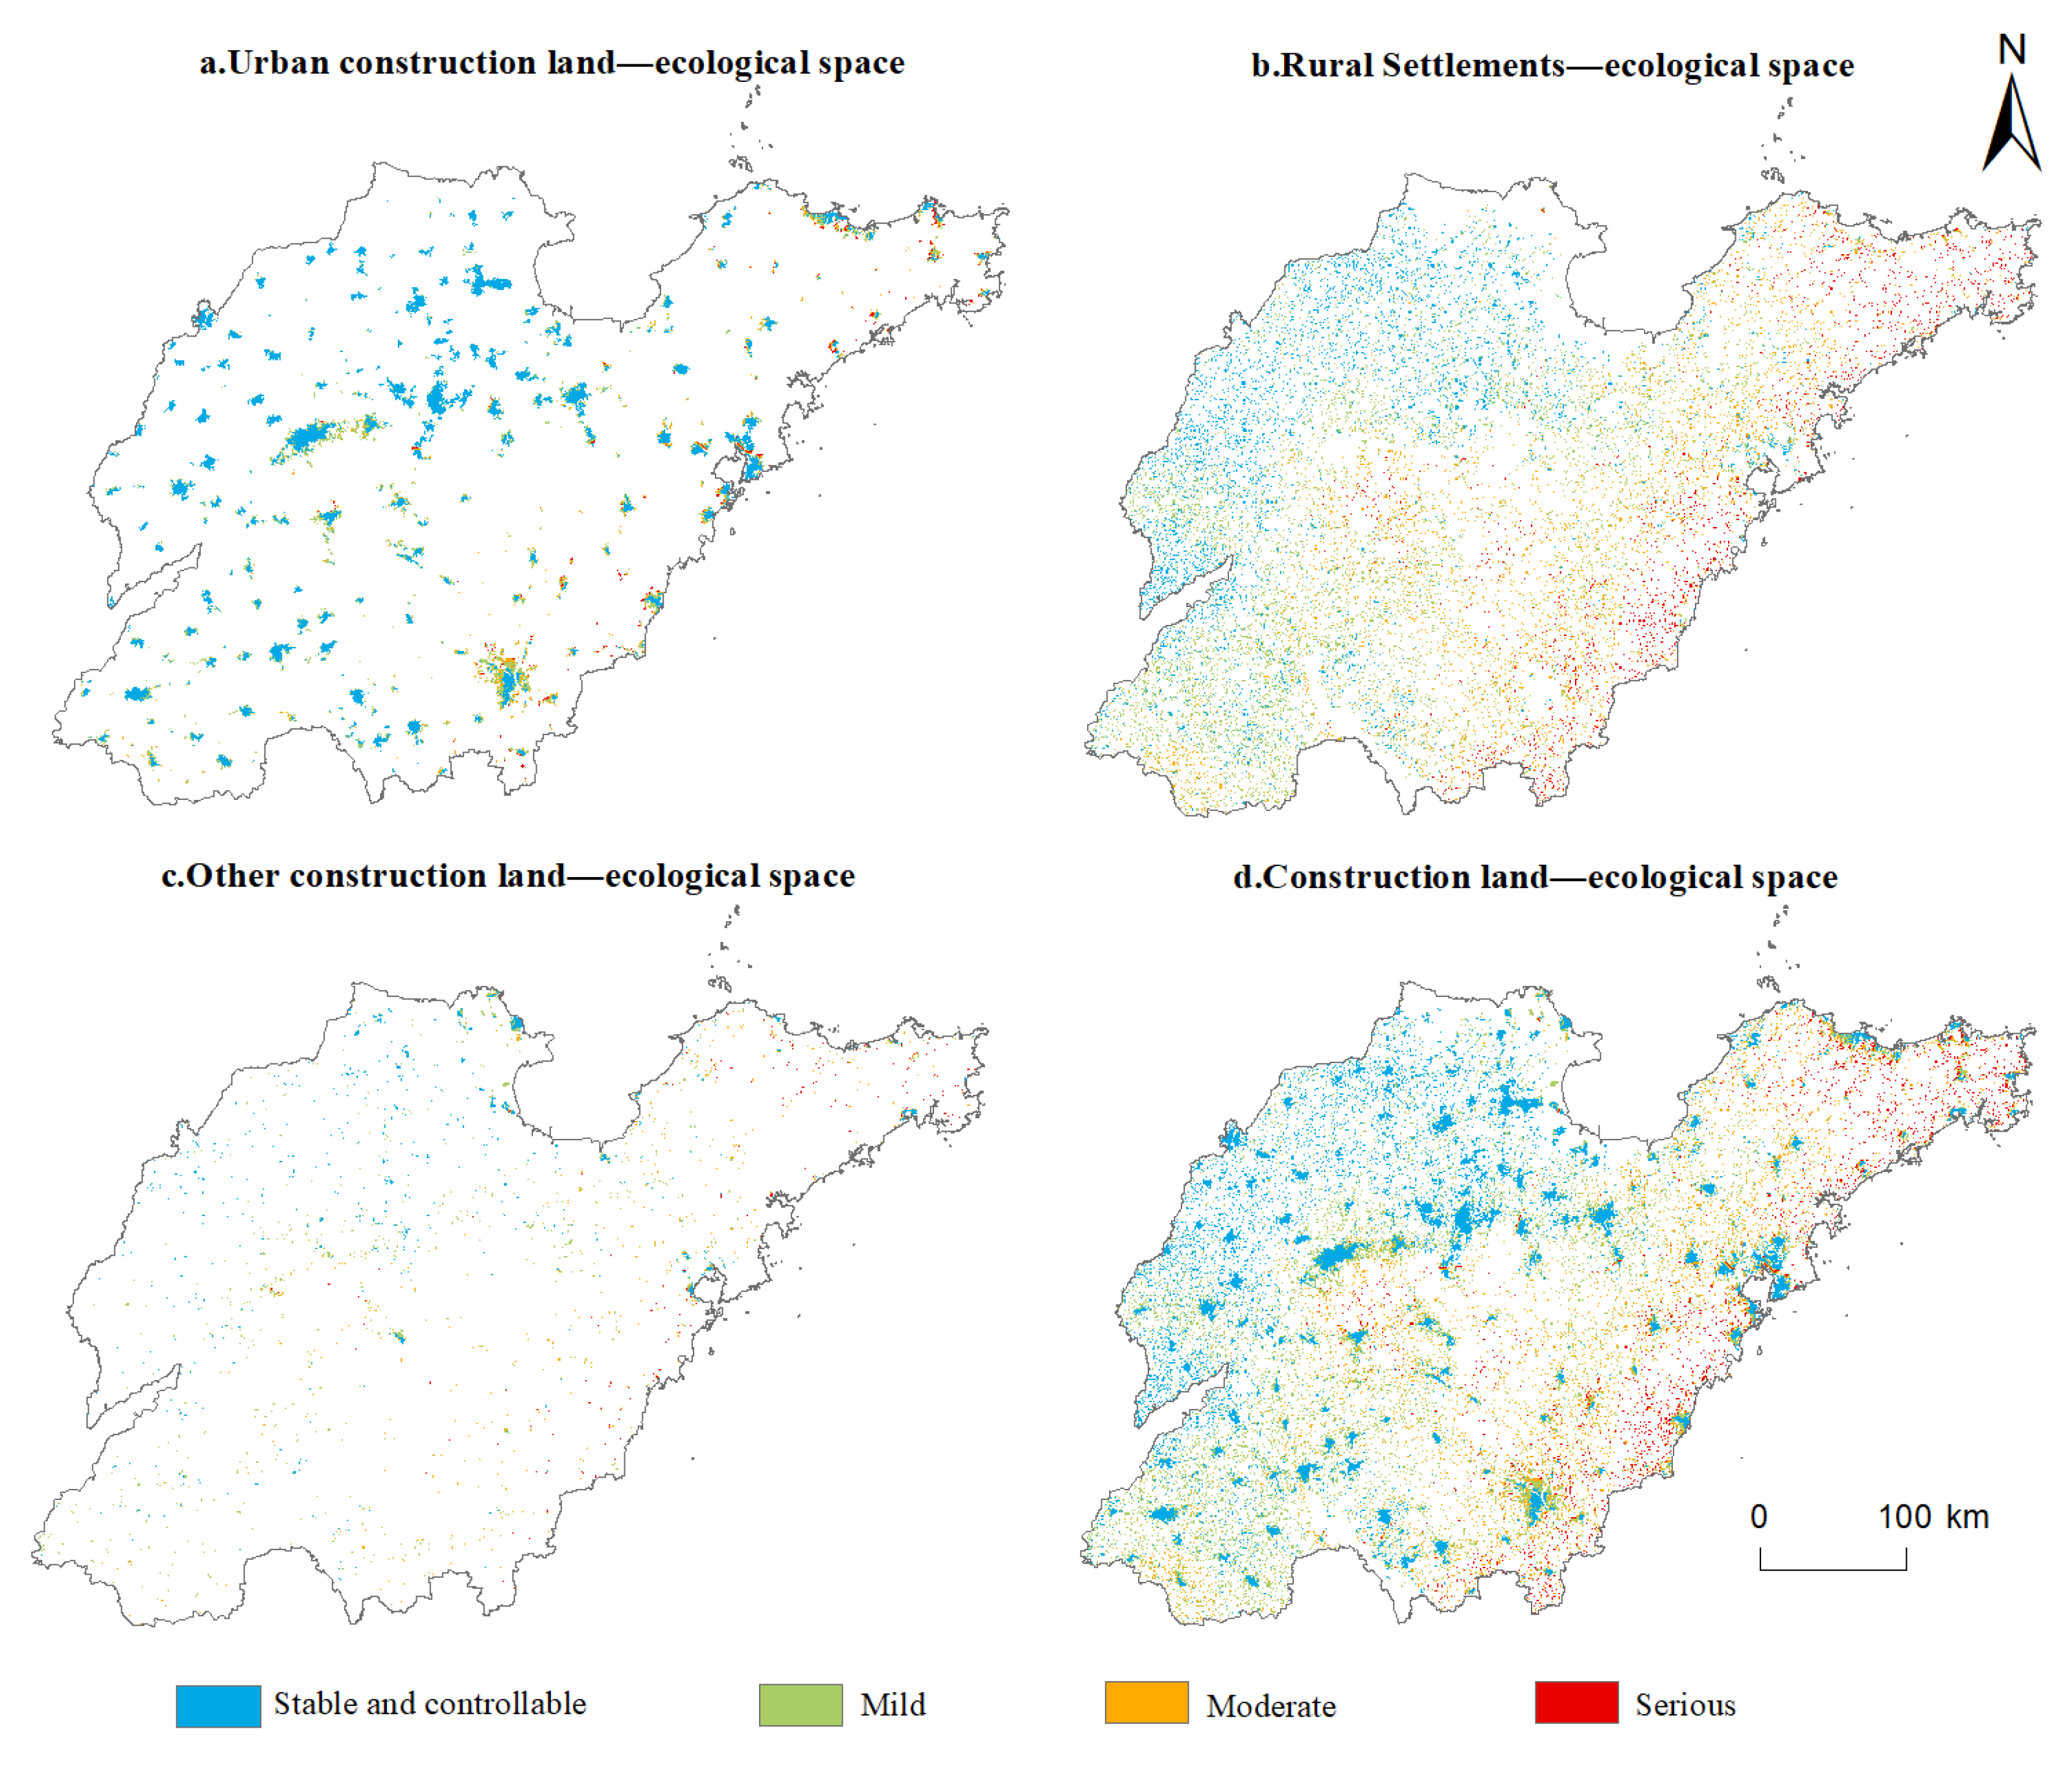
4.5.2. Construction Land—Ecological Space Conflict

Construction land includes urban construction land, rural settlements, and other construction land. There is a clear spatial divergence in the intensity of land use conflict between the various types of construction land (Figure 7).
The intensity of urban construction land–ecological space conflict is mainly stable and controllable mild conflict, with an area constituting 89.13% of urban construction land, mainly distributed in urban built-up areas with a high level of ecological safety, where construction land is spatially adjacent to arable land. Therefore, the conflict between construction land and ecological space is low. The area of serious and moderate conflict only accounts for 10.87% of urban construction land. This is mainly located in the suburban areas of the city. These areas are closer to forest land, waters, and other ecological space than the central urban areas, and human activities are likely to trigger ecological risks.
The areas of stable and controllable, mild, moderate, and serious conflicts among rural settlements–ecological space are 4235, 6172, 3372, and 1435 km2, respectively. Of the total area, 31.60% is occupied by serious and moderate conflict, much higher than that of urban construction land use, mainly concentrated in the low hills of eastern Shandong and the hills of central Shandong. Compared with the spatial distribution pattern of large, concentrated, and contiguous land plots in cities and towns, the layout of rural settlements is scattered, especially in mountainous areas, where the scale is even smaller. Lack of planning and inadequate supervision result in phenomena such as “digging up hills to build houses,” leading to intermittent damage to the ecological environment.
The areas of stable and controllable, mild, moderate, and serious conflicts in other lands for construction–ecological space conflict are 767, 842, 413, and 179 km2, respectively, of which the proportion of serious and moderate conflict is much lower than that of urban construction land and rural settlements.
The areas of stable and controllable, mild, moderate, and serious conflicts in the construction land–ecological space conflict are 10,095, 8406, 4041, and 1676 km2, respectively. Mild conflict and stable and controllable areas are mainly located in the Lucian Plain and the built-up areas of cities. The main reason is that these areas are relatively flat, densely populated, and less important in terms of ecosystem service functions, and are more suitable for urban construction. Serious and more-serious conflict areas are mainly located in Jinan, Linyi, and the coastal areas of the Jiaodong Peninsula, where urban development space is close to ecological space. For example, due to topography and other factors, the built-up area of Jinan is distributed in an east–west strip pattern, while its southern mountainous area is an important ecological barrier.

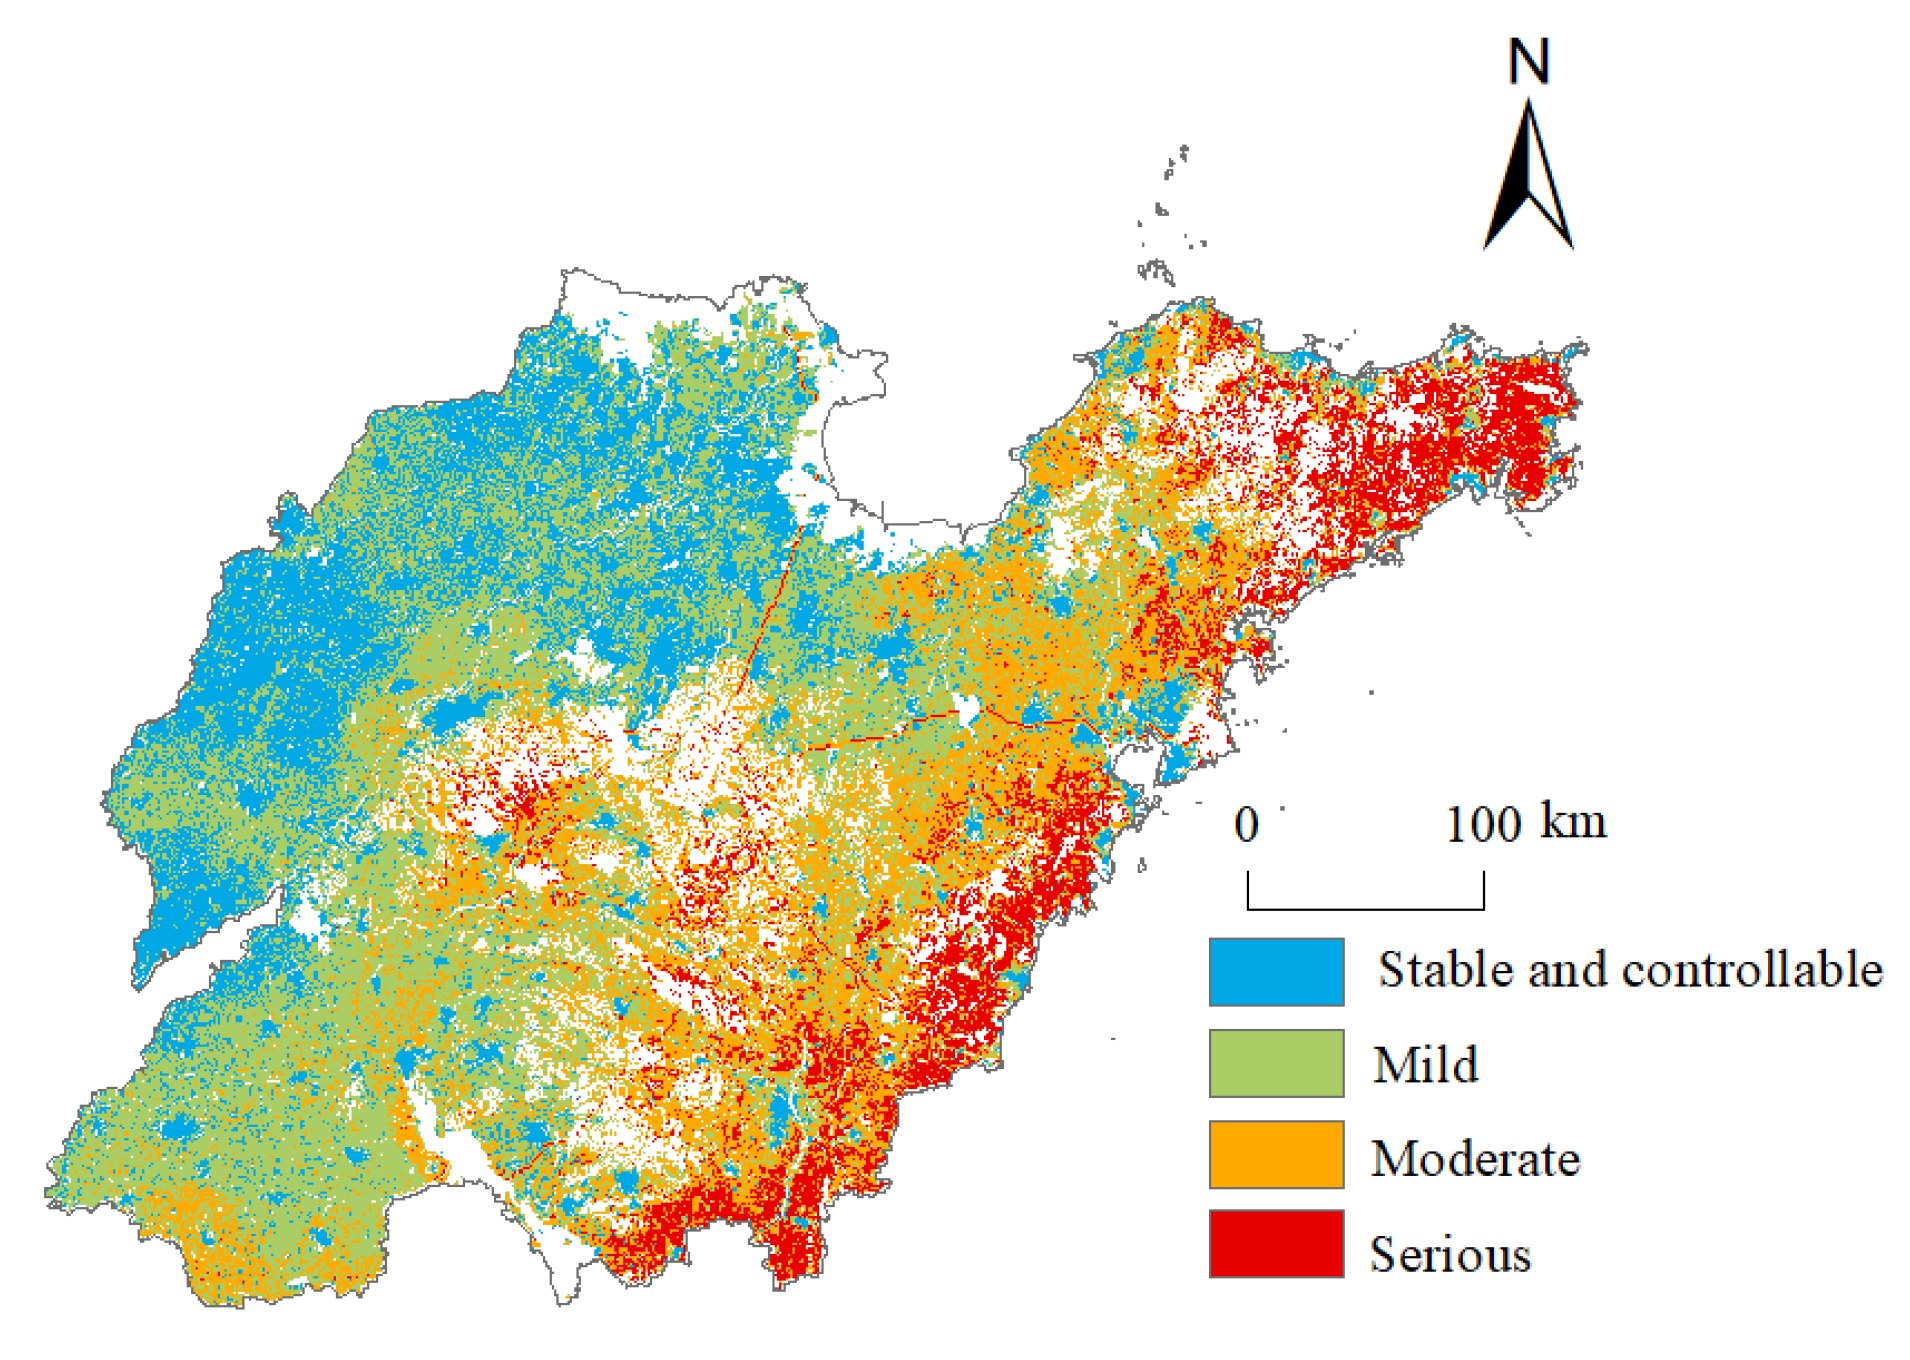
4.5.3. Integrated Land Use Conflict

As Figure 8 shows, the problems of arable land, construction land, and ecological space conflict are relatively serious in Shandong Province, with an overall spatial distribution pattern of high in the east and low in the west. Among them, the area of serious conflict zone is 15,342 km2, accounting for 9.71%, mainly in Yantai, Weihai, Qingdao, Rizhao, and Linyi, in the low hills of eastern Shandong. These areas have a high level of urbanization, a developed economy, and a dense population. The arable land and construction land in these areas are close to forest land, water, and other ecological space, and land use conflicts are significant and concentrated. The comprehensive moderate land use conflict area is 31,608 km2, accounting for 20.01%, mainly located in the mountainous hills of central Shandong and the western part of the low hills of eastern Shandong. The most serious areas of soil erosion are in Shandong Province, a highly ecologically sensitive area, leading to serious land use conflict. The area of land use conflict that is mild, stable, and controllable is 45,625 km2, accounting for 50.30%, mainly distributed in the simple land use type and less economically developed western and northern plains of Shandong. The area of forest land in this region is 84 km2, only 0.15% of the total area of the two regions, due to the lack of forest land resources, resulting in poor ecological background conditions in this region. Ecological functions are not pronounced, making land use conflict less obvious.

5. Discussion

5.1. Arable Land–Ecological Space Conflict Management

The management of arable land–ecological space conflict is a matter of food security and ecological protection. At present, the world is in the midst of the greatest change in a century, with the Russia–Ukraine conflict and the global COVID-19 pandemic not only exacerbating regional tensions but also highlighting the importance of food security. China has also elevated the issue of food security to an unprecedented level, requiring strict protection of arable land with stringent measures and strict adherence to the red-line of 1.8 billion mu of arable land protection. However, ecological protection is an inevitable requirement for achieving sustainable development and has been incorporated into the significant strategy of the Five-in-One as an important part of the construction of ecological civilization. The western and northern plains of Shandong are important food production areas in Shandong Province and in China. The arable land–ecological space conflict is mainly stable and controllable with mild conflict, and the pressure of conflict management is low. However, it is noteworthy that Shandong Province is a region with serious water shortages. Therefore, in the process of arable land–ecological space conflict management, in addition to the principle of suitability, it is also necessary to consider water resource constraints, to reasonably determine the scale of arable land according to the water resource carrying capacity, and to guarantee ecological water. The Jiaodong Peninsula and the low hills in the eastern part of Shandong Province are the main areas of serious and moderate conflict between farmland and ecology. In this area, small, fragmented, noncontiguous, low-quality, and inconvenient farmland should be transferred out of the scope of basic farmland. High-quality, concentrated, and contiguous farmland should be added to the scope of permanent basic farmland. At the same time, the area, as the richest area in Shandong Province in terms of forest resources, includes the mountain area of Daze Mountain, Aishan Mountain, Asan Mountain, Kunbeishan Mountain, and Lushan Mountain, covering the Jiaonan Hills, the water-conserving area of the Jiaowei Plain, and the biodiversity-maintaining area of the Jiaodong Hills, along with various nature reserves and other areas in need of protection. Ecological protection of important areas, to strengthen the basic framework of multi–species, multi–functional, multi–benefit protective forests. The construction of ecological protection forest systems should be improved. Forest nurturing, replanting of sparse forest land, and transformation of inefficient forests should be carried out comprehensively. The structure of tree species should be improved; the quality of forests should be enhanced; the forest landscape should be upgraded; the capacity of forest carbon sinks should be improved; the ecological stability in the region should be reinforced.

5.2. Construction Land–Ecological Space Conflict Management

On the whole, the conflict between construction land and ecological space in Shandong Province is not serious, and the proportion of serious conflict is only 6.92%, mainly in the cities of Yantai, Weihai, Qingdao, Linyi, and Jinan, which are mostly close to the ecological protection red-line area of Shandong Province and are potential threats to the ecological environment. Yantai, Weihai, and Qingdao cities are located around the low hills of the eastern part of Shandong Province, and the area is large and the intensity of conflict between construction land and ecological space is high. The city of Linyi is characterized by “three major areas.” Linyi City presents an ecological pattern of “three mountains and three lakes,” strictly prohibiting the construction of disorderly encroachment on Mount Ni, Mount Meng, and Mount Yi, engaging in the environmental management in the watersheds of the Altar, Wen, and Yi rivers, implementing projects such as the protection of wetlands in the upper reaches, restoring polluted sites, improving the rural water environment, preventing and controlling urban water pollution, and monitoring and protecting coastal groundwater to improve the quality of the water. The quality of the environment has been improved. Jinan City has an ecological pattern of “multiple points in the north and south of the mountains,” and as the capital city of Shandong Province, it is an important transportation hub and economic development center. The development and construction of urbanized areas should be transformed, the scale and structure of urban construction should be reasonably determined with an intensive and green orientation, and key industries should be guided to optimize their layout in areas with sufficient environmental capacity and good diffusion conditions. Key controls should be implemented in areas with dense populations, high intensity of resource development, and high intensity of pollutant emissions. Environmental governance and risk prevention and control need to be strengthened, and resilient, green, and low-carbon development should be promoted.
It should also be noted that, compared to urban construction land, rural settlements pose a greater threat to ecological space due to their wide area, scattered distribution, and direct proximity to ecological space. Therefore, attention should be given to the optimal reconfiguration of the three rural living spaces.

5.3. Limitations and Research Prospective

The construction of an ecological security pattern is the key to accurately identify land use conflicts. This paper uses a classical and highly recognized model to construct the ecological security pattern for Shandong Province [53]. Various methods such as circuit theory can be used to construct ecological security patterns [54,55]. However, this paper does not compare the differences among ecological security patterns constructed by different methods, which is worthy of further study.
In addition, this paper quantitatively identifies the scale, intensity, and spatial distribution of land use conflicts from the perspective of geography, and discusses some possible solutions. However, the connotation of land use conflict is rich, so future research can try to include land ownership and stakeholders in the research from more perspectives, such as political geography.

6. Conclusions

Ecological security is an important foundation for achieving green and sustainable development. Against the background of the current tensions and increasing conflict between people and land, the identification of land use conflict based on ecological security evaluation is a feasible path with important practical significance. The results indicate that in 2020, Shandong Province shows an obvious spatial mismatch between arable land, construction land, and ecological space. The areas of serious, moderate, mild conflict, and stable and controllable are 13,465, 27,113, 39,895, and 19,544 km2, respectively, and the overall distribution is relatively concentrated, with serious and moderate conflict concentrated in the low hills of eastern Shandong, and mild conflict and stable and controllable areas concentrated in the plains of western and northern Shandong. The areas of mild conflict and stability are concentrated in the eastern and northern plains of Shandong. The area of the construction land–ecological space serious conflict, moderate conflict, mild conflict, and stable and controllable areas are 1877, 4495, 9274, and 10,766 km2, respectively, with an overall scattered distribution. Mild conflict and stable and controllable areas are widely distributed around the urban construction land. Serious and moderate conflict is concentrated in the eastern coastal areas. The land use types are mainly rural settlements. In general, the spatial distribution of land use conflict in Shandong Province shows obvious regional differences, with the coast being higher than the interior and the south higher than the north.
This paper evaluates the ecological security of Shandong Province based on the “serviceability importance” factor, which is not sufficiently comprehensive in the selection of ecosystem serviceability and ecological sensitivity factors. The identification of land use conflict between arable land and construction land is based on ecological security. However, only the conflict between arable land and construction land and ecological space is considered, not the conflict between the two, nor the conflict with other land use types. In future research, the evaluation system of ecological safety should be gradually improved, not only limited to the perspective of ecological priority, but also considering the identification of land use conflict from the perspective of sustainable development and carbon neutrality, and comprehensively considering the intensity of land use conflict among various categories.

Author Contributions

Conceptualization, G.D. and W.J.; methodology, Z.L., G.D., and Y.N.; formal analysis, G.D. and Z.L.; writing—original draft preparation, G.D. and Z.L.; writing—review and editing, G.D. and W.J.; funding acquisition, G.D. All authors have read and agreed to the published version of the manuscript.

Funding

This research was funded by the National Natural Science Foundation of China, grant number 41801173, Youth Innovation Science and Technology Support Plan of Colleges and Universities in Shandong Province, grant number 2021RW039, and Doctor Foundation of Shandong Jianzhu University, grant number XNBS 1803.

Data Availability Statement

The data presented in this study are available on request from the author.

Acknowledgments

Thanks to anonymous experts for their suggestions.

Conflicts of Interest

The authors declare no conflict of interest.

References

  1. Zou, L.; Liu, Y.; Wang, J.; Yang, Y.; Wang, Y. Land use conflict identification and sustainable development scenario simulation on China’s southeast coast. J. Clean. Prod. 2019, 238, 117899. [Google Scholar] [CrossRef]
  2. Reuveny, R.; Maxwell, J.W.; Davis, J. On conflict over natural resources. Ecol. Econ. 2011, 70, 698–712. [Google Scholar] [CrossRef]
  3. Hui, E.C.M.; Bao, H. The logic behind conflicts in land acquisitions in contemporary China: A framework based upon game theory. Land Use Pol. 2013, 30, 373–380. [Google Scholar] [CrossRef]
  4. Campbell, D.J.; Gichohi, H.; Mwangi, A.; Chege, L. Land use conflict in Kajiado District, Kenya. Land Use Pol. 2000, 17, 337–348. [Google Scholar] [CrossRef]
  5. Li, S.; Zhu, C.; Lin, Y.; Dong, B.; Chen, B.; Si, B.; Li, Y.; Deng, X.; Gan, M.; Zhang, J.; et al. Conflicts between agricultural and ecological functions and their driving mechanisms in agroforestry ecotone areas from the perspective of land use functions. J. Clean. Prod. 2021, 317, 128453. [Google Scholar] [CrossRef]
  6. Steinhäußer, R.; Siebert, R.; Steinführer, A.; Hellmich, M. National and regional land-use conflicts in Germany from the perspective of stakeholders. Land Use Pol. 2015, 49, 183–194. [Google Scholar] [CrossRef]
  7. Dong, G.; Ge, Y.; Jia, H.; Sun, C.; Pan, S. Land Use Multi-Suitability, Land Resource Scarcity and Diversity of Human Needs: A New Framework for Land Use Conflict Identification. Land 2021, 10, 1003. [Google Scholar] [CrossRef]
  8. Zong, S.; Hu, Y.; Zhang, Y.; Wang, W. Identification of land use conflicts in China’s coastal zones: From the perspective of ecological security. Ocean Coast. Manag. 2021, 213, 105841. [Google Scholar] [CrossRef]
  9. Adam, Y.O.; Pretzsch, J.; Darr, D. Land use conflicts in central Sudan: Perception and local coping mechanisms. Land Use Pol. 2015, 42, 1–6. [Google Scholar] [CrossRef]
  10. Andrew, J.S. Potential application of mediation to land use conflicts in small-scale mining. J. Clean. Prod. 2003, 11, 117–130. [Google Scholar] [CrossRef]
  11. Milczarek-Andrzejewska, D.; Zawalińska, K.; Czarnecki, A. Land-use conflicts and the Common Agricultural Policy: Evidence from Poland. Land Use Pol. 2018, 73, 423–433. [Google Scholar] [CrossRef] [Green Version]
  12. Henderson, S.R. Managing land-use conflict around urban centres: Australian poultry farmer attitudes towards relocation. Appl. Geogr. 2005, 25, 97–119. [Google Scholar] [CrossRef]
  13. Orr, A.; Mwale, B. Adapting to Adjustment: Smallholder Livelihood Strategies in Southern Malawi. World Dev. 2001, 29, 1325–1343. [Google Scholar] [CrossRef]
  14. Brown, G.; Raymond, C.M. Methods for identifying land use conflict potential using participatory mapping. Landsc. Urban Plan. 2014, 122, 196–208. [Google Scholar] [CrossRef]
  15. Kim, I.; Arnhold, S. Mapping environmental land use conflict potentials and ecosystem services in agricultural watersheds. Sci. Total Environ. 2018, 630, 827–838. [Google Scholar] [CrossRef] [PubMed]
  16. Cieślak, I. Identification of areas exposed to land use conflict with the use of multiple-criteria decision-making methods. Land Use Pol. 2019, 89, 104225. [Google Scholar] [CrossRef]
  17. Karimi, A.; Brown, G. Assessing multiple approaches for modelling land-use conflict potential from participatory mapping data. Land Use Pol. 2017, 67, 253–267. [Google Scholar] [CrossRef]
  18. Zhou, D.; Xu, J.; Lin, Z. Conflict or coordination? Assessing land use multi-functionalization using production-living-ecology analysis. Sci. Total Environ. 2017, 577, 136–147. [Google Scholar] [CrossRef]
  19. Gao, Y.; Wang, J.; Zhang, M.; Li, S. Measurement and prediction of land use conflict in an opencast mining area. Resour. Policy 2021, 71, 101999. [Google Scholar] [CrossRef]
  20. Iojă, C.I.; Niţă, M.R.; Vânău, G.O.; Onose, D.A.; Gavrilidis, A.A. Using multi-criteria analysis for the identification of spatial land-use conflicts in the Bucharest Metropolitan Area. Ecol. Indic. 2014, 42, 112–121. [Google Scholar] [CrossRef]
  21. Jiang, S.; Meng, J.; Zhu, L. Spatial and temporal analyses of potential land use conflict under the constraints of water resources in the middle reaches of the Heihe River. Land Use Pol. 2020, 97, 104773. [Google Scholar] [CrossRef]
  22. Jing, W.; Yu, K.; Wu, L.; Luo, P. Potential Land Use Conflict Identification Based on Improved Multi-Objective Suitability Evaluation. Remote Sens. 2021, 13, 2416. [Google Scholar] [CrossRef]
  23. Lin, G.; Fu, J.; Jiang, D. Production–Living–Ecological Conflict Identification Using a Multiscale Integration Model Based on Spatial Suitability Analysis and Sustainable Development Evaluation: A Case Study of Ningbo, China. Land 2021, 10, 383. [Google Scholar] [CrossRef]
  24. Wang, C.Y.; Delu, P. Zoning of Hangzhou Bay ecological red line using GIS-based multi-criteria decision analysis. Ocean Coast. Manag. 2017, 139, 42–50. [Google Scholar] [CrossRef]
  25. Chen, Y.; Yue, W.; Zhang, L.J.A.E.S. Mapping of wetland reserve boundary in coastal zone utilizing spatial constraints assessment. Acta Ecol. Sin. 2018, 38, 900–908. [Google Scholar]
  26. Gao, J.B.; Jiang, Y.; Wang, H.; Zuo, L.Y. Identification of Dominant Factors Affecting Soil Erosion and Water Yield within Ecological Red Line Areas. Remote Sens. 2020, 12, 399. [Google Scholar] [CrossRef] [Green Version]
  27. Yang, Y.Q.; Ren, P.; Hong, B.T.J.R.; Basin, E.i.t.Y. The Study of Land Use Conflict Based on Ecological Security of the Chongqing Section of Three Gores Reservoir Area. 2019, 28, 322–332. [Google Scholar]
  28. Li, Z.J.; Liu, Y.M.; Zeng, H. Application of the MaxEnt model in improving the accuracy of ecological red line identification: A case study of Zhanjiang, China. Ecol. Indic. 2022, 137, 108767. [Google Scholar] [CrossRef]
  29. Yu, D.D.; Han, S.J. Ecosystem service status and changes of degraded natural reserves—A study from the Changbai Mountain Natural Reserve, China. Ecosyst. Serv. 2016, 20, 56–65. [Google Scholar] [CrossRef]
  30. Sun, J.Q.; Huang, J.J.; Wang, Q.; Zhou, H. A method of delineating ecological red lines based on gray relational analysis and the minimum cumulative resistance model: A case study of Shawan District, China. Environ. Res. Commun. 2022, 4, 045009. [Google Scholar] [CrossRef]
  31. Li, Y.; Shi, Y.; Qureshi, S.; Bruns, A.; Zhu, X.J.E.i. Applying the concept of spatial resilience to socio-ecological systems in the urban wetland interface. Ecol. Indic. 2014, 42, 135–146. [Google Scholar] [CrossRef]
  32. Pan, F.; Tian, C.Y.; Shao, F.; Zhou, W.; Chen, F. Evaluation of ecological sensitivity in Karamay, Xinjiang, China. J. Geogr. Sci. 2012, 22, 329–345. [Google Scholar] [CrossRef]
  33. Chi, Y.; Zhang, Z.W.; Gao, J.H.; Xie, Z.L.; Zhao, M.W.; Wang, E.K. Evaluating landscape ecological sensitivity of an estuarine island based on landscape pattern across temporal and spatial scales. Ecol. Indic. 2019, 101, 221–237. [Google Scholar] [CrossRef]
  34. Jin, X.X.; Wei, L.Y.; Wang, Y.; Lu, Y.Q. Construction of ecological security pattern based on the importance of ecosystem service functions and ecological sensitivity assessment: A case study in Fengxian County of Jiangsu Province, China. Environ. Dev. Sustain. 2021, 23, 563–590. [Google Scholar] [CrossRef] [Green Version]
  35. Cui, H.L.; Liu, M.; Chen, C. Ecological Restoration Strategies for the Topography of Loess Plateau Based on Adaptive Ecological Sensitivity Evaluation: A Case Study in Lanzhou, China. Sustainability 2022, 14, 17. [Google Scholar] [CrossRef]
  36. Zhang, H.J.; Pang, Q.; Hua, Y.W.; Li, X.X.; Liu, K. Linking ecological red lines and public perceptions of ecosystem services to manage the ecological environment: A case study in the Fenghe River watershed of Xi’an. Ecol. Indic. 2020, 113, 106218. [Google Scholar] [CrossRef]
  37. Luji, H.J.J.o.S.; Conservation, W. A Study on Rainfall in South China from the View of Soil Erosion. J. Soil Water Conserv. 1993, 7, 53–60. [Google Scholar] [CrossRef]
  38. Wang, C.S.; Sun, G.Y.; Dang, L.J. Identifying Ecological Red Lines: A Case Study of the Coast in Liaoning Province. Sustainability 2015, 7, 9461–9477. [Google Scholar] [CrossRef] [Green Version]
  39. Ding, M.M.; Liu, W.; Xiao, L.; Zhong, F.X.; Lu, N.; Zhang, J.; Zhang, Z.H.; Xu, X.L.; Wang, K.L. Construction and optimization strategy of ecological security pattern in a rapidly urbanizing region: A case study in central-south China. Ecol. Indic. 2022, 136, 13. [Google Scholar] [CrossRef]
  40. Yang, Y.; Zhou, Y.R.; Feng, Z.; Wu, K.N. Making the Case for Parks: Construction of an Ecological Network of Urban Parks Based on Birds. Land 2022, 11, 1144. [Google Scholar] [CrossRef]
  41. Dai, L.; Liu, Y.B.; Luo, X.Y. Integrating the MCR and DOI models to construct an ecological security network for the urban agglomeration around Poyang Lake, China. Sci. Total Environ. 2021, 754, 15. [Google Scholar] [CrossRef] [PubMed]
  42. Li, F.; Ye, Y.P.; Song, B.W.; Wang, R.S. Evaluation of urban suitable ecological land based on the minimum cumulative resistance model: A case study from Changzhou, China. Ecol. Model. 2015, 318, 194–203. [Google Scholar] [CrossRef]
  43. Hu, C.G.; Wang, Z.Y.; Wang, Y.; Sun, D.Q.; Zhang, J.X. Combining MSPA-MCR Model to Evaluate the Ecological Network in Wuhan, China. Land 2022, 11, 213. [Google Scholar] [CrossRef]
  44. Yi, S.Q.; Zhou, Y.; Li, Q. A New Perspective for Urban Development Boundary Delineation Based on the MCR Model and CA-Markov Model. Land 2022, 11, 401. [Google Scholar] [CrossRef]
  45. Xiao, S.C.; Wu, W.J.; Guo, J.; Ou, M.H.; Pueppke, S.G.; Ou, W.X.; Tao, Y. An evaluation framework for designing ecological security patterns and prioritizing ecological corridors: Application in Jiangsu Province, China. Landsc. Ecol. 2020, 35, 2517–2534. [Google Scholar] [CrossRef]
  46. Popescu, O.C.; Tache, A.V.; Petrisor, A.I. Methodology for Identifying Ecological Corridors: A Spatial Planning Perspective. Land 2022, 11, 1013. [Google Scholar] [CrossRef]
  47. Wanghe, K.Y.; Guo, X.L.; Wang, M.; Zhuang, H.F.; Ahmad, S.; Khan, T.U.; Xiao, Y.Q.; Luan, X.F.; Li, K. Gravity model toolbox: An automated and open-source ArcGIS tool to build and prioritize ecological corridors in urban landscapes. Glob. Ecol. Conserv. 2020, 22, 14. [Google Scholar] [CrossRef]
  48. Wei, Q.Q.; Halike, A.; Yao, K.X.; Chen, L.M.; Balati, M. Construction and optimization of ecological security pattern in Ebinur Lake Basin based on MSPA-MCR models. Ecol. Indic. 2022, 138, 108857. [Google Scholar] [CrossRef]
  49. Yu, K. Security patterns and surface model in landscape ecological planning. Landsc. Urban Plan. 1996, 36, 1–17. [Google Scholar] [CrossRef]
  50. Peng, J.; Pan, Y.; Liu, Y.; Zhao, H.; Wang, Y. Linking ecological degradation risk to identify ecological security patterns in a rapidly urbanizing landscape. Habitat Int. 2018, 71, 110–124. [Google Scholar] [CrossRef]
  51. Zhang, J.; Chen, Y.; Zhu, C.M.; Huang, B.B.; Gan, M.Y. Identification of Potential Land-Use Conflicts between Agricultural and Ecological Space in an Ecologically Fragile Area of Southeastern China. Land 2021, 10, 1011. [Google Scholar] [CrossRef]
  52. Zou, L.L.; Liu, Y.S.; Wang, J.Y.; Yang, Y.Y. An analysis of land use conflict potentials based on ecological-production-living function in the southeast coastal area of China. Ecol. Indic. 2021, 122, 12. [Google Scholar] [CrossRef]
  53. Chen, J.; Wang, S.; Zou, Y. Construction of an ecological security pattern based on ecosystem sensitivity and the importance of ecological services: A case study of the Guanzhong Plain urban agglomeration, China. Ecol. Indic. 2022, 136, 108688. [Google Scholar] [CrossRef]
  54. Li, Y.; Liu, W.; Feng, Q.; Zhu, M.; Yang, L.; Zhang, J.; Yin, X. The role of land use change in affecting ecosystem services and the ecological security pattern of the Hexi Regions, Northwest China. Sci. Total Environ. 2023, 855, 158940. [Google Scholar] [CrossRef]
  55. Li, Q.; Zhou, Y.; Yi, S. An integrated approach to constructing ecological security patterns and identifying ecological restoration and protection areas: A case study of Jingmen, China. Ecol. Indic. 2022, 137, 108723. [Google Scholar] [CrossRef]
Figure 1. Location of study area.
Land 11 02196 g001
Figure 2. Spatial patterns of the importance of ecosystem service functions.
Land 11 02196 g002
Figure 3. Spatial patterns of ecological sensitivity.
Land 11 02196 g003
Figure 4. Ecological sources (a), ecological resistance surface (b), and ecological corridors (c).
Land 11 02196 g004
Figure 5. Ecological security pattern.
Land 11 02196 g005
Figure 6. The conflict between arable land and ecological space.
Land 11 02196 g006
Figure 7. Construction land–ecological space conflict.
Land 11 02196 g007
Figure 8. Integrated land use conflict in the study area.
Land 11 02196 g008
Table 1. Ecosystem service functions evaluation index system.
Ecosystem Service FunctionsCalculation FormulasFormula Parameters and Data-Related Notes
water conservation [24,25] W R = N P P m e a n × F s i c × F p r e × 1 F s l o W R is the ecosystem water-support service capacity index, N P P m e a n is the mean multiyear vegetation net primary productivity, F s i c is the soil infiltration factor, F p r e is a multiyear average precipitation factor, F s l o is the slope factor
soil and water conservation [26,27,28] S p r o = N P P m e a n × 1 k × 1 F s l o S p r o is the soil and water conservation service capability index, N P P m e a n is the mean multiyear vegetation net primary productivity, F s l o is the slope factor, K is the soil erodibility factor
carbon fixation and oxygen release [29] Q t c o 2 = M c o 2 M c × A × C c × A G B T 2 A G B T 1 Q t c o 2 is the amount of CO2 fixed by the ecosystem, M c o 2 is the coefficient of conversion of C to CO2, A is the area of the ecosystem, C c is the carbon conversion factor, A G B T 2 for year 𝑇2 Biomass, A G B T 1 for year 𝑇1 Biomass
biodiversity conservation [28,30] S b i o = N P P m e a n × F p r e × F t e m × 1 F a l t S b i o indicates the capacity index for biodiversity conservation services; N P P m e a n ,   F p r e parameters are calculated as given above, F t e m indicates temperature factor, F a l t indicates elevation factor
Table 2. Ecological sensitivity evaluation index system.
Ecological SensitivitiesEvaluation IndicatorsSensitivity Levels
Insensitive (1)Generally Sensitive (3)Moderately Sensitive (5)Highly Sensitive (7)
Soil erosion [24,36,37]rainfall erosivity (J·cm/m2·h)<100100–400400–600>600
soil erodibilitygravel, sand, coarse sandy soil, fine sandy soil, claytop sandy soil, loamy soil, loamy clay soilsandy loam, chalky claysandy chalk, chalky soil
relief amplitude(°)0–5050–300300–500>500
vegetation coverage(%)>6040–6020–40<20
Salinization [38]groundwater mineralization (g/L)<55–1818–25>25
depth of groundwater burial (m)>53–51–3<1
soil texturescoarse sandy soil, fine sandy soil, clayclay, loamy soilsloamy clay, chalky claysandy loam
Table 3. Resistance factors.
TypeEvaluation Factors (Weight)Drag Coefficient
1357
Ecological propertiesElevation (0.12)<100 m250–100 m250–400 m>400 m
Slope (0.12)<7°7–15°15–25°>25°
Land-cover types (0.2)Wooded land, river water, lake water, scenic spots, and special sitesGarden, pond water, orchard, paddy field, other grassland, marshland, and drylandWatered land, ditches, agricultural land for facilities, waterworks, fields, and canalsRailway land, road land, rural roads, established towns, villages, ports, and harbors
Vegetation coverage (0.14)>80%60–80%40–60%<40%
Ecological disturbancesDistance from roads (0.1)>800 m400–800 m200–400 m<200 m
Distance from railways (0.1)>800 m400–800 m200–400 m<200 m
Distance from rural settlements (0.1)>600 m400–600 m200–400 m<200 m
Distance from chemical plants, mines (0.12)>800 m400–800 m200–400 m<200 m
Publisher’s Note: MDPI stays neutral with regard to jurisdictional claims in published maps and institutional affiliations.

