1. Introduction
Tourism is an economic activity that, like major cities around the world, has attracted the attention of countries in Latin America, including Mexico and Peru. The generation of employment, the foreign exchange it generates and the need to attract foreign investment have been one of the reasons why Mexico City and Lima have made efforts to attract an increasing flow of domestic and foreign tourists.
Theories that examine the competitiveness of tourist destinations indicate that the destination is competitive based on the added value that they can offer to tourists for basic services and tourist experiences [
1,
2], but there is little empirical data on urban tourism attractiveness in the literature on important cities in Latin America, such as Mexico City and Lima.
According to motivation theory, tourist attractions can be considered pull factors, and, in recent years, several studies have explained the impact of urban attractiveness variables such as monuments, historical sites, conventions, festivals, infrastructure, restaurants, hotels, etc. [
1,
2]; however, little has been written on the perceptions of tourists to Latin American cities of the levels or factors that these urban tourism attractiveness variables can be grouped into. An understanding of tourists’ perceptions, however, is necessary for these cities to be competitive as tourist destinations.
Previous research has indicated that different urban tourism attractiveness variables could be grouped into levels or factors that represent tourists’ perceptions. Among the various models that represent urban tourism, the theoretical model created by Gunn [
3] stands out, establishing three levels: the nucleus, the inviolate belt, and the zone of closure. Boivin and Tanguay [
4] modified this model, establishing that urban tourism could be represented in a four-factor model consisting of the nucleus, complementary attractions, the tourism belt, and the urban context. This model is especially used in UNESCO World Heritage Cities, but, given the different quantities and types of attractions that may exist in cities, this model might not be generalizable for other cities that are not World Heritage Cities [
4]. What is certain is that there is a gap in the literature regarding tourists’ perceptions of which factors or levels that urban attractions and tourism attractiveness variables can be grouped into the cities of Latin America.
This research aims to contribute to the literature by presenting empirical evidence of the perceptions of foreign tourists to Mexico City and Lima about the levels or factors into which the tourism attractiveness variables can be grouped. These cities are important in Latin America in terms of tourism and are recognized for their top-notch cuisine and diversity of restaurants, elite hotel services, distinctive historical urban architecture, and museums, as well as their festivals, conventions, and general tourist attractions.
This study on tourists’ perceptions of the factors into which the tourism attractiveness variables of Latin American cities can be grouped contributes to the understanding of their competitiveness as tourist destinations [
2]. It also helps clarify whether these cities have specialized or diversified their urban attractiveness variables [
5].
This article is structured as follows:
Section 2 reviews the relevant literature,
Section 3 explains the research methodology,
Section 4 presents the results obtained,
Section 5 analyzes the results obtained,
Section 6 presents the discussion of the results obtained, and
Section 7 shows the conclusions of the research and the existing limitations.
2. Literature Review
According to the theories of the competitiveness of tourist destinations, the destination is competitive based on the added value through the products and services offered to tourists [
1,
2,
6,
7,
8]. The destinations’ competitiveness relates urban tourist attractions to the competitiveness of the destinations where they are located [
9,
10] and allows those destinations to host long-stay tourists [
11]: revenues from visits to tourist attractions help the make infrastructure improvements to the tourist destination [
12].
Among the basic tourist attractions of a destination are its climate and geography, as well as the resources related to its infrastructure, entertainment and culture, all of which are present in cities [
2]. Several authors have mentioned various tourism attractiveness variables that cause tourists to flock to certain cities, such as history and culture [
1], monuments and museums [
13], cultural attractions [
14,
15], natural attractions [
16], entertainment facilities [
17], transportation [
18], tourist information, signage and public spaces [
9,
19], destination sustainability [
20], nightlife [
21], festivals [
22], lifestyle [
23], climate and weather [
24], heritage tourism [
25], hotels [
26], and gastronomy [
27].
These urban attractiveness variables are related to tourists’ motivations to travel to certain destinations. Motivation theory states that there are push and pull factors [
28,
29,
30,
31]. Push factors are psychological factors that motivate tourists to travel [
32,
33], such as the desire to discover new places, the desire to learn, and the desire to escape from daily pressures [
34,
35], while the pull factors are related to the tourist attractions that cities have, for example, monuments [
13,
36], historical attractions [
35], entertainment facilities [
17], interest in conserving the urban landscape [
37], and sustainable tourism [
38].
In the literature there are some models to represent touristic attractions in urban tourism: a matrix designed by Pearce [
39] that relates places and tourist demand; Gunn’s model [
3], which groups touristic attractions into three levels, according to the priority assigned by the visitor; Lew’s model [
40], which describes urban tourism in three perspectives: ideographic, cognitive and organizational; and the Leiper model [
41], that draws on a set of interconnected elements to describe urban tourism.
Gunn’s model [
3] explains the attractiveness variables of urban tourism from the perspective of the visitor; grouping these variables into three levels or concentric circles called nucleus, inviolate belt and closure zone. The nucleus is formed by the main tourist attractions of the destination, such as monuments and historical or cultural sites, natural areas [
19,
42]; the inviolate belt is the tourist environment that surrounds the nucleus such as physical and social facilities, public spaces, architecture and urban environment [
19] and the closure zone is the general environment that surrounds the destination, such as restaurants, hotels [
43] and stores or shops [
44].
When extending Gunn’s model [
3], Boivin and Tanguay [
4] found that in two World Heritage Cities (Quebec City and Bordeaux), tourism attractiveness variables are recognized at four different levels: the nucleus, complementary attractions, the tourism belt, and the urban context. In this model, the nucleus is identical to what it is in Gunn’s model [
3], including the main attractions that draw tourists to the urban destination, which can be monuments, historical sites, museums, and art galleries. Complementary attractions may include concerts, festivals, conventions, and nightlife, while the tourism belt is composed of architecture and public spaces, and the urban context includes shops and commercial services.
Sirkis et al. [
45], using Gunn’s model [
3], examined the tourism attractiveness variables of four Latin American cities (Mexico City, Lima, Buenos Aires, and Bogota) and found four factors that tourists could group tourism attractiveness variables into: the nucleus, tourist ecosystem, MICE & shows, and related services; this model differs from that of Boivin and Tanguay [
4].
Indeed, the different configurations of factors or levels that tourists group urban tourism attractiveness variables into cannot be generalized to other cities, due to differences in the number and type of attractions [
4]. More empirical evidence is needed to determine what the levels or groupings of tourism attractiveness variables are in different cities, which all have different numbers and types of attractions [
46], but because there is a gap in the literature for Latin American cities.
The following research question was formulated to contribute to the gap in the existing literature: RQ1: What are the factors of tourist attraction that tourists from Mexico and Lima perceive and what variables make them up?
Due to the differences in the type and number of tourist attractions in Mexico City and in Lima, the following research question was formulated: RQ2: What is the difference in tourist attractions between tourists from Lima and Mexico City?
Considering the need to determine if these “tourism attractiveness” variables can predict if a touristic destination is recommended, the following research question was formulated: RQ3: Can the tourism attractiveness variables of Mexico City and Lima predict if the city is recommended as a tourism destination?
3. Study Area
3.1. Mexico City
Mexico City has around 9.2 million inhabitants [
47]. It has an area of 1485 km
2 divided into 16 delegations. It has an average temperature of 16 °C, although temperatures throughout the year can vary between 25 °C in summer to 5 °C in winter, as it has a humid subtropical climate [
48].
Mexico City stands out on the World Travel & Tourism Council (WTTC) Global Urban Tourism Index due to the volume of tourists it receives, its infrastructure, and its connectivity. This city in 2019 received 13,905,083 tourists, of whom 73% were foreigners [
49].
Figure 1 shows the location of Mexico City.
3.1.1. Tourist Ecosystem
Mexico City’s Collective Transport System (STC Metro) is the largest in Latin America. It has 12 lines that are 226 km long and a total of 195 stations [
49]. The STC Metro is also the most used means of transportation for travel inside the city, followed by taxis (Secretaría de Turismo de la Ciudad de Mexico, 2017) [
50].
According to the Statistical Tourism Yearbook [
49], in 2019, Mexico City was home to 625 hotels, of which the majority have 3 stars and an average occupancy rate of 68%. The number of hotel rooms in the city was 51,601, with an average occupancy rate of 67.68%.
3.1.2. Nucleus
Mexico City is an exceptional urban settlement. The historic center has urban structural elements of the pre-Hispanic city, similar to Xochimilco, both consist of the fusion of two cultures and have been on the World Heritage List since 1987 [
51]. Mexico City is the oldest city in the Americas, founded in 1325, and possesses the Bosque de Chapultepec, the largest urban park in the Western Hemisphere, more than 647 hectares in area. The TripAdvisor platform shows that the favorite sites for travelers in Mexico City include the Castillo de Chapultepec (the only royal castle in the Americas)
Figure 2, the Basilica of the Virgin of Guadalupe (the second most visited sanctuary in the world), Coyoacán, the Frida Kahlo museum, the Zócalo, the Templo Mayor museum, the murals of Diego Rivera in the Public Education Secretariate, the National Palace, Arena México, and the Paseo de la Reforma [
52].
Within the city can be found pre-Hispanic, colonial, and modern buildings. The TripAdvisor platform describes Mexico City as a combination of contemporary life and ancient history that can be traced back to the Aztecs. This history is present on every street corner, from the street food vendors’ stalls to the music and the eye-catching murals, and it significantly impacts daily life [
52]. In addition, Mexico City is known as a mural-painting country. Urban art is common in this city, which tries to provide spaces where young urban artists can express themselves [
51].
3.1.3. MICE & Shows
The International Congress and Convention Association (ICCA) calculated that, of the 197 forums carried out in Mexico in 2019, 64 took place in Mexico City [
53]. Music festivals like Pa’l Norte, cultural activities like the Day of the Dead celebration, and sporting events like boxing competitions have been key to the growth and acceptance of urban tourism in the Mexican capital [
54].
On the Day of the Dead, more than seven million people attended the event, which was organized by the City of Mexico government in 2019. It is considered one of the most important Mexican traditions nationwide, where deceased loved ones are honored, and Mexican culture and cuisine are celebrated. It takes place on 1 and 2 November every year. Another very important annual event is the Festival of the Virgin of Guadalupe, which around 10 million pilgrims attend every year [
49]. According to Time Out magazine, Mexico City is the capital of the best events in Mexico, including Art Week in February, the International Historic Center Festival, and many different fairs and festivals [
55]. Foro Sol (
Figure 3) is a stadium for massive events, it has a capacity for 37,500 people and a large esplanade for 25,000 more.
3.1.4. Related Services
The main activities that tourists participate in when they come to Mexico City are visiting tourist sites and visiting family and friends, which allows them to be in touch with the local population. According to Fernández Poncela [
56], the activities that tourists like the most include visiting historic sites and cultural sites, appreciating the architecture and urban spaces, enjoying the cuisine, and, especially, enjoying the Mexican people’s hospitality, while the crowds, pollution, traffic, bad driving, and unsafe conditions are aspects that visitors dislike.
Tourism information can be found on many different webpages and the official City of Mexico government website created by the Tourism Secretariate, but tourism service providers also possess rich websites that provide content and recommendations for visitors. In the same way, information about visits and excursions can also be found on other public and private organizations’ websites.
3.2. Lima
Lima, located on the central Pacific coast, is the capital of Peru. According to the National Census in 2020, the most heavily populated department was Lima, with a population of 9.6 million inhabitants, which is about 29.5% of the Peruvian population. It was founded in 1535 under the name “The City of Kings” and was the capital of the Viceroyalty of Peru [
57] (Municipalidad de Lima, n.d.). It has a subtropical climate with an average annual temperature of 19 °C; with a maximum of 30 °C in summer and 13 °C in winter; Lima has a temperate climate with little rainfall, ideal for urban tourism [
58].
In 2019, according to the National Superintendency of Migration, 4.4 million foreign tourists came to Peru, of whom 63.5% arrived by way of Jorge Chávez International Airport. In 2020, tourism was hit hard by the COVID-19 pandemic, and there was a decrease in travel: Lima received only 896,523 international arrivals, of whom 65% were from Latin America, arriving mainly by air since land borders were shut once the pandemic hit [
59].
Figure 4 shows the location of the city of Lima.
3.2.1. Tourist Ecosystem
According to figures published by PromPerú [
60], before the pandemic, around 70% of foreign tourists arrived via Jorge Chávez National Airport, which acted as an airport hub, promoting incoming tourism in the city of Lima, which occupied first place in the country in terms of international arrivals [
60].
The transportation supply in Lima is varied, with options like the electric train, buses, taxis, private vehicles, and the Metropolitano, which is a mass urban transportation system composed of rapid transit bus routes [
61]. Several districts also possess public bike rental and parking services.
In the World Travel Awards 2021, Peru was named Best Culinary Destination and Best Cultural Destination. Lima is one of the culinary capitals of the world and is a main tourist destination in Latin America, occupying 5th place in the Latin America and Caribbean Top Ten Destination Cities in 2018, according to Mastercard’s Global Destination Cities Index 2019 [
62].
These consecutive awards have better positioned Peruvian gastronomy and directly benefited the industry in general: restaurants of all sizes, suppliers of related products and services, the supply chain, and the production chain, among others. In this way, there is an appreciation of Peruvian products and an increase in the flow of tourists to the city of Lima and other parts of the country.
Lima’s tourism offers center around the reputation of its hotels, its sizable number of restaurants, museums, entertainment options, etc., as well as the diffusion of Peruvian cuisine and culture [
63]. In 2019, Lima’s hotel infrastructure was able to accommodate 137,304 guests, and, in the central region of the country, 74% of categorized hotels possessed 2 or 3 stars; only 8% of hotels possessed 4 or 5 stars [
64].
3.2.2. Nucleus
Lima has outstanding urban attractions, monuments and colonial architectural elements, such as the covered balconies of the historic center, where you can see more than 1600 colonial-style buildings can be seen. Similarly, in modern Lima you can visit other tourist destinations, including the city’s parks and gardens, and the beaches that bathe the coastline [
65].
Lima has urban art circuits that are highly developed in terms of aesthetic and meaning [
66]. Many murals that have been painted in luxury hotels, malls, and galleries are now an essential part of the urban landscape of Lima, some of the most visited being those located along the streets of Barranco [
67]. According to PromPerú [
59], the most commonly carried out tourist activities were cultural activities; strolls through the city; visits to Lima’s many parks and squares; visits to churches, cathedrals, convents, museums, and historic sites; and guided city tours.
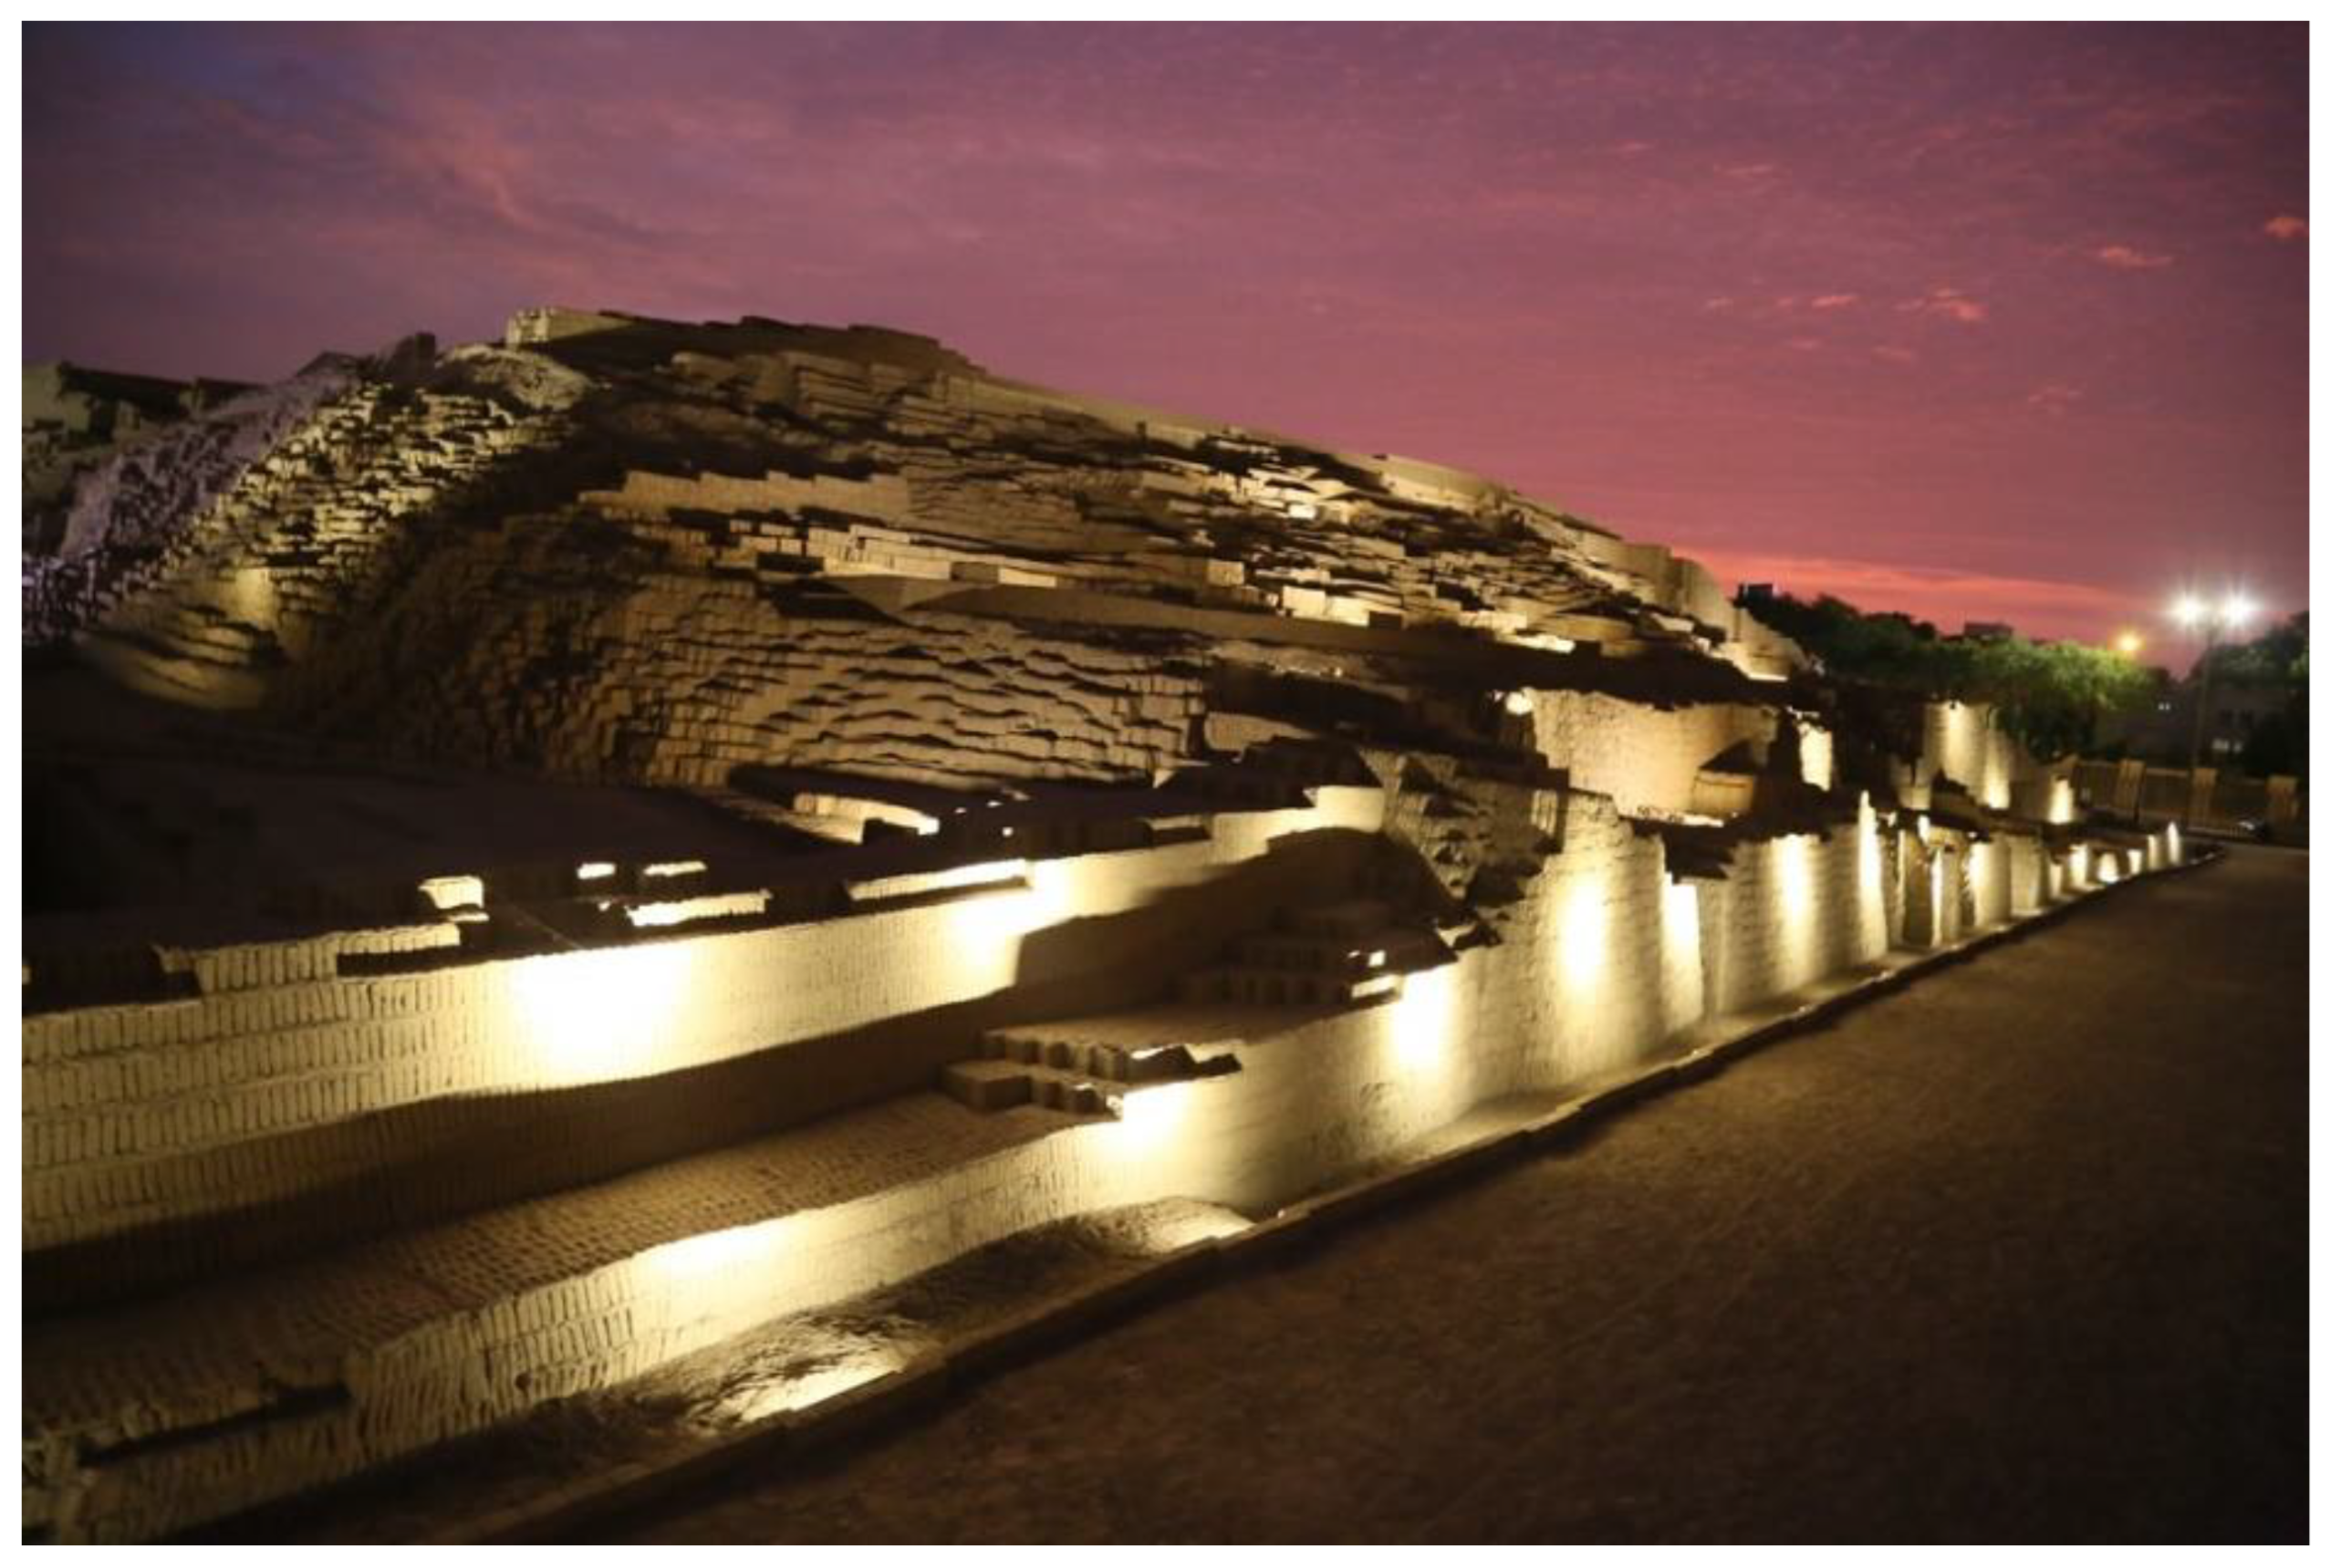
Among the best sites to visit in Lima, according to TripAdvisor [
68], are historic sites like Huaca Pucllana (
Figure 5), Inca ruins in the heart of the Miraflores district; the Pachacamac archaeological site, which was the Inca empire’s main ceremonial center in the central coastal region of Peru, and the San Francisco Convent and Catacombs Museum, with its Baroque architecture and famous catacombs, where thousands of skeletons can be found, as well as many works of European art and one of the most complete libraries in the world [
69].
3.2.3. MICE & Shows
According to the 2019 ICCA Latin American ratings, Lima was in second place, having been the site of 78 meetings, which were carried out in Lima’s convention center (
Figure 6), in the conference rooms of 5-star hotels, and in the gardens of different museums, which had been prepared for each occasion. Religious festivities are also celebrated, one of the most famous being the Lord of Miracles procession every October. In the same way, other religious and civic festivals are carried out, like the military parade during the Peruvian National Holidays.
Another aspect of urban tourism in Lima is the city’s many fairs and artistic expositions, like the Lima Book Fair. In the district of Miraflores, multiple well-attended fairs were held in 2021, like the 8th International Flower Fair; the Entrepreneur Fair; the Design Fair, where sustainable, organic, and artisanal products were presented; the Turrón and Sweets Fair, and the Gastronomic Festival of Chancho al palo (marinated pork) in Huaral [
70].
3.2.4. Related Services
According to information provided by PromPerú [
59], among the most influential sources of information for the selection of a tourist destination for those who visited Lima was the Internet, with 54%, followed by friends’ recommendations, with 24%. Tourism information can be found on the Internet on websites and official apps, from transportation service providers and hotels, as well as on specialized sites, like TripAdvisor. Along the same lines, iPerú offices can be found in airports and tourist information centers; these offices are able to provide information about tourist trails, attractions, destinations, and service providers, as well as orientation and advice regarding any complaint or problem.
4. Methodology
An online survey was filled out by tourists over 18 years of age who had visited Mexico City and Lima between January 2018 and March 2020. Non-probabilistic and convenience sampling was used, as it facilitated the tourists’ ease of access in answering the survey. It was requested to not answer about the city where they reside, only the visited ones.
The questionnaire applied as variables a group of statements that come from previous studies of urban tourism [
4,
33,
71]. The twenty-four questions asked were about sociodemographic characteristics (four), the motivations and preparations for the trip (three) and the variables used by the Gunn scale to measure the tourist attractiveness of a city (sixteen). The last ones used a Likert-type scale of five points to evaluate the results. The survey was conducted between September and December 2020.
The survey results contain 354 valid responses: 198 from visitors to Mexico City and 156 from visitors to Lima. To calculate the sample, an equation was used for an infinite population with a margin of error of +/− 5%, a confidence level of 95% and a variance of 50%. In addition, the internal consistency of the measurement scale was evaluated using Cronbach’s alpha, which was 0.923, resulting in an acceptable level of consistency [
72,
73].
An exploratory factor analysis was used to group the variables and four urban attractiveness factors (RQ1) were detected. Two tests were carried out to check if a factorial analysis can be carried out: (a) Bartlett’s Sphericity Test to contrast the null hypothesis of the analyzed variables (without correlation) and that the diagonal of the correlation matrix is equal to one; and (b) the Kaiser–Meyer–Olkin Test, to ensure that the sample is suitable for performing a factor analysis (values between 0.5 and 0.7).
A comparison was made between Mexico City and Lima in terms of tourists’ perceptions of the factors into which tourism attractiveness variables are grouped in order to identify any differences (RQ2). The Kruskal–Wallis test was used to determine the significant differences between the variables (tourist attractions and other aspects that draw tourists to a particular destination) of the two cities and between the factors (grouped variables). The Kruskal–Wallis test shows the differences and similarities between Mexico City and Lima.
In order to verify if the identified variables predict whether or not the city is recommended as a touristic destination (RQ3), a multivariate regression was carried out in which the independent variables were those that had been identified and the dependent variable was whether the touristic destination was recommended. An F-test was used to determine if there was a real relationship between the significant predictors and the intention to recommend the destination, considering it significant if p > 0.05. The Durbin–Watson test, in which the measurement d = 2 is used, helped determine that there was no autocorrelation with the error.
Figure 7 shows a diagram of the research process.
5. Results
5.1. Descriptive Results
Data processing was carried out with 354 surveys.
Table 1 shows the descriptive results of the sociodemographic characteristics of the tourists surveyed. It is shown in terms of age that the largest segment was that of tourists between 46 and 60 years old, the country of origin of the tourists is also shown.
At a descriptive level, a comparison of the means of all of the tourism attractiveness variables was carried out to evaluate their relevance to those surveyed. The tourism attractiveness variables were measured on a Likert scale (1 to 5).
Table 2 shows the comparative analysis of variables, ordered by level of importance.
5.2. Exploratory Factor Analysis
To group into factors, exploratory factor analysis was performed on the variables of urban tourist attractions. A Pearson correlation matrix was created on the variables to check their dependency and the correlations of the variables were less than 0.65. Bartlett’s sphericity test verified that the significance is at the 0.00 level. The Kaiser–Meyer–Olkin test gave a result of 0.929, indicating that the variables are sufficiently correlated to perform factor analysis. The results in
Table 3 show the factorial analysis to obtain the variance in each factor. Four factors explained 68.99% of the variance.
5.3. Differences between the Cities Studied
Comparisons were made between the means for Mexico City and Lima. Most of the variables were assigned statistically higher values in Mexico City than they were in Lima. The test shows that there is no significant difference between the two cities for the majority of variables, with the exception of the following variables: monuments and historic sites, museums and art galleries, and shops and commercial services, where there is a significant difference between the variables for the two cities (
p ≤ 0.05); this indicates that tourists perceive these attractiveness variables differently in the two cities.
Table 4 shows the means and rankings of the importance of the different tourism attractiveness variables.
5.4. Regression
The multiple regression method was used to analyze the predictors of the intention to recommend the destination, the factors that were significant for the model were included as dependent variables. The F test was significant (
p < 0.05), which means that there is a real relationship between the significant predictors and the intention to recommend the destination. The Nucleus factors (beta = 0.524 and
p < 0.05) and Tourist Ecosystem (beta = 0.198 and
p < 0.05) were the most significant variables (
Table 5). The Durbin–Watson factor = 2.11 indicates that it could be assumed that there was no autocorrelation with the error.
6. Discussion
This research examined the perceptions of tourists about the urban attractiveness variables of Mexico City and Lima, two important cities in Latin America, in order to identify how tourists, perceive the factors that group these variables, with three research questions.
When observing the results of those who travel from other countries to Mexico City and Lima to answer to RQ1, the factors found are four: Nucleus (28.53% of the explained internal variance), Tourist Ecosystem (31.90%), Mice & Shows (21.56%) and Related Services (18.01%). The most relevant factor for both cities is the tourism ecosystem, this result agrees with Romão et al. [
74] who found that the built social environment of a city has a great impact on its attractiveness to tourists (hotels, infrastructure, restaurants).
The second factor is the Nucleus, this coincides with García-Hernández et al. [
36], who found that historic city centers attract tourists because they are heritage sites and urban landscapes, and also agree with Moreno Gil and Ritchie [
75] and Plaza [
76] who found that museums attract urban tourists.
In third place is the MICE & Shows factor, which coincides with Andreu et al. [
35], Roman et al. [
17] and Lim and Giouvris [
36], who find that festivals, fairs, conventions and concerts are factors of attraction for urban tourists. The last factor is related services that refers to tourist information and excursions.
The order of relevance of the factors differs from that of Romão et al. [
74], who find culture to be the most determining factor in attracting tourists (nucleus), and also differ with Kourtit et al. [
77], which mentions the cultural identity and history of the city as the primary reason for attracting international and national visitors.
The four factors identified differ from the results of Gunn [
3], who identified three levels: the nucleus, the tourist belt and the closure zone or context, and differ from Boivin and Tanguay [
4] who found four factors: the nucleus, complementary attractions, the urban context and the tourist belt, with differences in the variables contained in each factor. The results are in agreement with Sirkis et al. [
45] who found four factors that tourists group a city’s tourism attractiveness variables into: The Nucleus, the Tourist Ecosystem, MICE & Shows, and Related Services.
The difference between the factors in this study and those mentioned in the three-level model of Gunn [
3] or in the four-level model of Boivin and Tanguay [
4] is explained by the motivations of the theory of the pull factors considered that those are the forces that attract tourists to visit those cities. There is a difference because of the fact that Mexico City and Lima attract tourists for different reasons than those that led tourists to visit Quebec City and Bordeaux. In Mexico City and Lima, the variables of the Tourist Ecosystem are more attractive to international tourists and are complemented by the variables of the “Nucleus”, urban architecture and historical sites, gastronomy and hotel infrastructure. In addition, in Mexico City and Lima, the organization of events and conventions is promoted in order to attract tourists.
To respond to RQ2, the means of the variables were compared. The null hypothesis was tested to determine the relationship between them, and they were ranked according to the values provided by both groups (
Table 5). Most of the variables were rated statistically higher in Mexico City than they were in Lima, which indicates that tourists to Mexico City perceived the tourism attractiveness variables available in that city to be more important than tourists to Lima perceived that city’s tourism attractiveness variables; significant differences were found in terms of three variables: monuments and historic sites, museums and art galleries, and shops and commercial services (
Table 5). These results can be interpreted as evidence that tourists perceive Mexico City’s monuments and historical sites and museums and galleries to be better than Lima’s monuments and historical sites and museums and galleries. This could be due to the breadth of historical sites and well-known museums and galleries that Mexico City is home to. In contrast, tourists perceive Lima to be better than Mexico City in terms of stores and commercial services; this could be due to the commercial development that Lima has experienced in terms of its stores and commercial services, a fact that is widely recognized by tourists.
The results are similar to the Boivin and Tanguay [
4], which finds in these three variables: monuments and historic sites, museums and galleries, and shops and commercial services, that there are significant differences in the evaluation of tourist attractions between Québec City and Bordeaux that are heritage cities.
Regarding RQ3, the recommendations are important for the destination, in this analysis, it was found that tourists who visit Latin American cities choose their destination based mainly on the Tourist Ecosystem but make recommendations based mainly on the Nucleus (0.524) and Tourist Ecosystem (0.198) factors.
The results of this research contribute to the literature with the evidence of four factors Nucleus, Tourist Ecosystem, Mice & Shows and Related Services that group the variables of urban tourism in the cities examined by the characteristics of the attractions they have. In addition, they contribute by determining significant differences in the two cities in the nucleus the variables of monuments and historical sites, galleries and museums, and in the tourist ecosystem the variable stores and commercial services, and in establishing the relationship between the nucleus and the tourist ecosystem with the recommendation to visit the destination. The research also has practical implications because the factors found are useful for urban tourism planning.
7. Conclusions
This research determines that the perception of tourists about the factors that group the variables of tourist attractions in Mexico City and Lima are: (1) the Nucleus; (2) the Tourist Ecosystem; (3) MICE & Shows; and (4) Services Related. These factors are not the same as those observed in European and Canadian cities, it is assumed that the Latin American region has its own characteristics that produce the variables of tourist attractions being grouped differently.
The study also concludes that, according to the perception of tourists, there is a significant difference between the two cities in the nucleus in the variables of monuments and historical sites, museums and art galleries, and in the tourist ecosystem in the variable shops and services. due to the characteristics and types of attractions that exist in each city.
The investigation concludes that the Tourist Ecosystem and Nucleus urban tourism attractiveness helped predict the intention to recommend the tourism destination. The discoveries take into account that the motivations to visit a city are not the same as those that inspire a recommendation. In the first case, the Tourist Ecosystem predominates and is related to visitors’ experiences using the tourism infrastructure. If these findings are interpreted through the lens of motivation theory, it can be said that push factors, which take into account psychological factors, impact this finding. However, in the second case, at the time a destination is being recommended, pull factors are more relevant (Nucleus), which means that the tangible characteristics of the product are more important when justifying a travel recommendation.
Stated differently, the motivation to travel is the expectation that the trip will be enjoyed (symbolic aspects). There is no direct relationship with the objective benefit; instead, motivation springs from a subjective expectation of the experience. Recommendations, however, spring from a rational consumer mindset that tries to identify concrete reasons to justify the trip.
This study contributes to the little literature on urban tourism in Latin American cities by conducting a study on two important cities in terms of tourism with special characteristics. Adds a new framework to the theoretical analysis of urban tourism in Latin America. It is complementary to previous theories, such as the theory of motivations or the pull and push factors of attraction.
This research has theoretical implications since it determines for Mexico City and Lima, the four factors found: The Nucleus, the Tourist Ecosystem, MICE & Shows and Related Services, which are explained by the characteristics that these cities have in terms of number and type of attractions, such as historical sites, urban environment, accommodation and restaurants, museums, galleries, festivals and other attractions that they have and are different from other cities that had previously studied characteristics. We also contribute to the literature by establishing significant differences in the perceptions of tourists from Mexico City and Lima, which are explained by the motivations of tourists since urban attractions are pull factors that attract tourists to visit destinations, and in Mexico City, tourists are more inclined to value the nucleus in the monuments and historical sites, museums and galleries, while in Lima they are more inclined to value the tourist ecosystem in shops and commerce. We also contribute to determining that the Nucleus and the Tourist Ecosystem are related to the recommendation of tourists to visit destinations, which is an essential ingredient for creating a value proposition in cities that are tourism products.
This research has practical implications since public organizations, operators and tourism companies could use this knowledge about the factors that group the variables of urban tourist attractions, in the management and planning of the urban destination and in the generation of urban policies. The research has limitations because the data collection corresponds to the year 2020.
It is suggested to carry out future research on tourist attractions in other Latin American cities to confirm the results found in this research results and increase knowledge about the tourist attractions that cities have and the differences and similarities between the attractions that exist between cities.
Author Contributions
Conceptualization, O.R.-P., G.S., O.C.-F., M.C.-F. and W.C.-F.; methodology, O.R.-P., G.S. and O.C.-F.; software, O.R.-P., G.S. and O.C.-F.; validation, O.R.-P., G.S. and O.C.-F.; formal analysis, O.R.-P., G.S. and O.R.-P.; investigation, O.R.-P., G.S., O.C.-F., M.C-F. and W.C.-F.; resources, O.R.-P., G.S., O.C.-F., M.C.-F. and W.C.-F.; data curation, O.R.-P., G.S., O.C.-F., M.C.-F. and W.C.-F.; writing—original draft preparation, O.R.-P., G.S., O.C.-F., M.C.-F. and W.C-F.; writing—review and editing, O.R.-P., G.S., O.C.-F., M.C.-F. and W.C.-F.; visualization, G.S., O.R.-P. and O.C.-F. All authors have read and agreed to the published version of the manuscript.
Funding
This research received no external funding.
Institutional Review Board Statement
Not applicable.
Informed Consent Statement
Not applicable.
Data Availability Statement
Not applicable.
Acknowledgments
The authors would like to thank CLADEA, who contribute to scientific research by forming study circles among colleagues in the Latin American region.
Conflicts of Interest
The authors declare no conflict of interest.
Appendix A
Table A1.
Survey and Frequency Table.
Table A1.
Survey and Frequency Table.
Survey
Answers | Frequencies |
|---|
| 1 | 2 | 3 | 4 | 5 |
|---|
| How important did you consider accommodation and restaurant attractions before choosing to travel to Mexico City and Lima? | 12 | 8 | 25 | 94 | 221 |
| How important did you consider the attractions of monuments and historical sites before choosing to travel to Mexico City and Lima? | 21 | 20 | 48 | 90 | 181 |
| How important did you consider tourist information attractions before choosing to travel to Mexico City and Lima? | 28 | 22 | 62 | 116 | 132 |
| How important did you consider the attractions of public spaces, parks, and gardens before choosing to travel to Mexico City and Lima? | 22 | 24 | 73 | 118 | 123 |
| How important did you consider the urban atmosphere attractions before choosing to travel to Mexico City and Lima? | 21 | 27 | 71 | 126 | 115 |
| How important did you consider the urban architecture attractions before choosing to travel to Mexico City and Lima? | 25 | 27 | 76 | 117 | 115 |
| How important did you consider museum and art gallery attractions before choosing to travel to Mexico City and Lima? | 37 | 33 | 59 | 108 | 123 |
| How important did you consider shops and commercial services attractions before choosing to travel to Mexico City and Lima? | 28 | 31 | 91 | 110 | 100 |
| How important did you consider excursion attractions before choosing to travel to Mexico City and Lima? | 45 | 31 | 59 | 104 | 121 |
| How important did you consider the attractions of pedestrian-friendly places before choosing to travel to Mexico City and Lima? | 43 | 26 | 70 | 117 | 104 |
| How important did you consider the attractions of fairs, conventions, and exhibitions before choosing to travel to Mexico City and Lima? | 40 | 35 | 82 | 92 | 111 |
| How important did you consider access and signage attractions before choosing to travel to Mexico City and Lima? | 39 | 41 | 59 | 104 | 121 |
| How important did you consider public services attractions before choosing to travel to Mexico City and Lima? | 38 | 40 | 96 | 102 | 84 |
| How important did you consider the attractions of theaters, concerts, and nightlife before choosing to travel to Mexico City and Lima? | 37 | 47 | 89 | 100 | 87 |
| How important did you consider festival and event attractions before choosing to travel to Mexico City and Lima? | 41 | 40 | 97 | 97 | 85 |
References
- Ritchie, J.R.B.; Crouch, G.I. The Competitive Destination: A Sustainable Tourism Perspective; CABI: Wallingford, UK, 2003. [Google Scholar]
- Crouch, G. Destination competitiveness: An analysis of determinant attributes. J. Travel Res. 2011, 50, 27. [Google Scholar] [CrossRef]
- Gunn, C.A. Vacationscape: Developing Tourist Areas, 3rd ed.; Taylor & Francis: Washington, DC, USA, 1997. [Google Scholar]
- Boivin, M.; Tanguay, G.A. Analysis of the determinants of urban tourism attractiveness: The case of Québec City and Bordeaux. J. Destin. Mark. Manag. 2019, 11, 67–79. [Google Scholar] [CrossRef]
- Gu, X.; Sheng, L.; Lei, C. Specialization or diversification: A theoretical analysis for tourist cities. Cities 2022, 122, 103517. [Google Scholar] [CrossRef]
- Brent, J.R.; Ritchie, J.R.B.; Crouch, G.I. The competitive destination: A sustainability perspective. Tour. Manag. 2000, 21, 1–7. [Google Scholar]
- Dwyer., L.; Mellor, R.; Livaic, Z.; Edwards, D.; Kim, C. Attributes of destination competitiveness: A factor analysis. Tour. Anal. 2004, 9, 91–101. [Google Scholar] [CrossRef]
- Enright, M.J.; Newton, J. Tourism destination competitiveness: A quantitative approach. Tour. Manag. 2004, 25, 777–788. [Google Scholar] [CrossRef]
- Mikulić, J.; Krešić, D.; Prebežac, D.; Miličević, K.; Šerić, M. Identifying drivers of destination attractiveness in a competitive environment: A comparison of approaches. J. Destin. Mark. Manag. 2016, 5, 154–163. [Google Scholar] [CrossRef]
- Zehrer, A.; Hallmann, K. A stakeholder perspective on policy indicators of destination competitiveness. J. Destin. Mark. Manag. 2015, 4, 120–126. [Google Scholar] [CrossRef]
- Tugcu, C.T. Tourism and economic growth nexus revisited: A panel causality analysis for the case of the Mediterranean region. Tour. Manag. 2014, 42, 207–212. [Google Scholar] [CrossRef]
- Efendi, M.N.; Paturusi, S.A.; Wiranatha, A.S.; Suryawardani, I.G.A.O. Assessment and prioritization of urban tourist attractions in Kota Lama Tourism Area Surabaya, Indonesia. J. Hosp. Tour. Manag. 2019, 7, 212–218. [Google Scholar] [CrossRef] [Green Version]
- Ashworth, G.; Page., S.J. Urban tourism research: Recent progress and current paradoxes. Tour. Manag. 2011, 32, 1–15. [Google Scholar] [CrossRef]
- Brida, J.G.; Meleddu, M.; Pulina, M. Understanding urban tourism attractiveness: The case of the archaeological Otzi museum in Bolzano. J. Travel Res. 2012, 51, 730–741. [Google Scholar] [CrossRef]
- Kourtit, K.; Nijkamp, P. Creative actors and historical–cultural assets in urban regions. Reg. Stud. 2019, 53, 977–990. [Google Scholar] [CrossRef]
- Chan, C.S.; Yuen, S.K.; Duan, X.; Marafa, L.M. An analysis of push–pull motivations of visitors to Country Parks in Hong Kong. World Leis. J. 2018, 60, 191–208. [Google Scholar] [CrossRef]
- Romão, J.; Neuts, B.; Nijkamp, P.; van Leeuwen, E.S. Culture, product differentiation and market segmentation: A structural analysis of the motivation and satisfaction of tourists in Amsterdam. Tour. Econ. 2015, 21, 455–474. [Google Scholar] [CrossRef]
- Romão, J.; Bi, Y. Determinants of collective transport mode choice and its impacts on trip satisfaction in urban tourism. J. Transp. Geogr. 2021, 94, 103094. [Google Scholar] [CrossRef]
- Jansen-Verbeke, M. Inner-city tourism: Resources, tourists and promoters. Ann. Tour. Res. 1986, 13, 79–100. [Google Scholar] [CrossRef]
- Lespinasse-Taraba, C.; Leonhardt, C. En ville aussi, les clients sont sensibles a une offre touristique durable. Cah. Espaces 2011, 110, 70–72. [Google Scholar]
- Fraiz, J.A.; de Carlos, P.; Araújo, N. Disclosing homogeneity within heterogeneity: A segmentation of Spanish active tourism based on motivational pull factors. J. Outdoor Recreat. Tour. 2020, 30, 100294. [Google Scholar] [CrossRef]
- Borges, A.P.; Cunha, C.; Lopes, J. The main factors that determine the intention to revisit a music festival. J. Policy Res. Tour. Leis. Events 2021, 13, 314–335. [Google Scholar] [CrossRef]
- Montezuma, J.; McGarrigle, J. What motivates international homebuyers? Investor to lifestyle ‘migrants’ in a tourist city. Tour. Geogr. 2019, 21, 214–234. [Google Scholar] [CrossRef]
- Wang, L.; Fang, B.; Law, R. Effect of air quality in the place of origin on outbound tourism demand: Disposable income as a moderator. Tour. Manag. 2018, 68, 152–161. [Google Scholar] [CrossRef]
- Tu, H.M. Sustainable heritage management: Exploring dimensions of pull and push factors. Sustainability 2020, 12, 8219. [Google Scholar] [CrossRef]
- Latinopoulos, D. Analysing the role of urban hotel location in guests’ satisfaction. Anatolia 2020, 31, 636–650. [Google Scholar] [CrossRef]
- Mariani, M.; Okumus, B. Guest editorial: Features, drivers, and outcomes of food tourism. Br. Food J. 2022, 124, 401–405. [Google Scholar] [CrossRef]
- Dann, G.M.S. Tourist motivation an appraisal. Ann. Tour. Res. 1981, 8, 187–219. [Google Scholar] [CrossRef]
- Gnoth, J. Tourism motivation and expectation formation. Ann. Tour. Res. 1997, 24, 283–304. [Google Scholar] [CrossRef]
- Prayag, G.; Hosany, S. When Middle East meets West: Understanding the motives and perceptions of young tourists from United Arab Emirates. Tour. Manag. 2014, 40, 35–45. [Google Scholar] [CrossRef]
- Zhang, Y.; Peng, Y. Understanding travel motivations of Chinese tourists visiting Cairns, Australia. J. Hosp. Tour. Manag. 2014, 21, 44–53. [Google Scholar] [CrossRef]
- Kim, S.; Lee, C. Push and pull relationships. Ann. Tour. Res. 2002, 29, 257–260. [Google Scholar] [CrossRef]
- Van der Merwe, P.; Slabbert, E.; Saayman, M. Travel motivations of tourists to selected marine destinations. Int. J. Tour. Res. 2011, 13, 457–467. [Google Scholar] [CrossRef]
- Botha, C.; Crompton, J.L.; Kim, S.S. Developing a revised competitive position for Sun/Lost city, South Africa. J. Travel Res. 1999, 37, 341–352. [Google Scholar] [CrossRef]
- Andreu, L.; Bigne, J.E.; Cooper, C. Projected and perceived image of Spain as a tourist destination for British travellers. J. Travel Tour. Mark. 2001, 9, 47–67. [Google Scholar] [CrossRef]
- Lim, S.; Giouvris, E. Tourist arrivals in Korea: Hallyu as a pull factor. Curr. Issues Tour. 2020, 23, 99–130. [Google Scholar] [CrossRef]
- García-Hernández, M.; la Calle-Vaquero, D.; Yubero, C. Cultural heritage and urban tourism: Historic city centres under pressure. Sustainability 2017, 9, 1346. [Google Scholar] [CrossRef] [Green Version]
- Miller, D.; Merrilees, B.; Coghlan, A. Sustainable urban tourism: Understanding and developing visitor pro-environmental behaviours. J. Sustain. Tour. 2015, 23, 26–46. [Google Scholar] [CrossRef]
- Pearce, D.G. An integrative framework for urban tourism research. Ann. Tour. Res. 2001, 28, 926–946. [Google Scholar] [CrossRef]
- Lew, A.A. A framework of tourist attraction research. Ann. Tour. Res. 1987, 14, 553–575. [Google Scholar] [CrossRef]
- Leiper, N. Tourist attraction systems. Ann. Tour. Res. 1990, 17, 367–384. [Google Scholar] [CrossRef]
- Kozak, M. Comparative analysis of tourist motivations by nationality and destinations. Tour. Manag. 2002, 23, 221–232. [Google Scholar] [CrossRef]
- Balint, C.; Pop, C. Romanian hotel industry profile through the traded hotel companies. Procedia Econ. Financ. 2015, 25, 332–343. [Google Scholar] [CrossRef] [Green Version]
- Hurst, J.L.; Niehm, L.S. Tourism shopping in rural markets: A case study in rural Iowa. Int. J. Cult. Tour. Hosp. Res. 2012, 6, 194–208. [Google Scholar] [CrossRef]
- Sirkis, G.; Regalado-Pezúa, O.; Carvache-Franco, O.; Carvache-Franco, W. The determining factors of attractiveness in urban tourism: A study in Mexico City, Buenos Aires, Bogota, and Lima. Sustainability 2022, 14, 6900. [Google Scholar] [CrossRef]
- Lee, C.F.; Chen, K.Y. Exploring factors determining the attractiveness of railway tourism. J. Travel Tour. Mark. 2017, 34, 461–474. [Google Scholar] [CrossRef]
- INEGI. In Mexico City We Are 9’209,944 Inhabitants: Population and Housing Census 2020. National Institute of Statistics and Geography. 2021. Available online: https://www.inegi.org.mx/contenidos/saladeprensa/boletines/2021/EstSociodemo/ResultCenso2020_CdMx.pdf (accessed on 25 January 2022).
- Weather, Spark. El Clima y el Tiempo Promedio en Todo el Año en Ciudad de México. Weather Spark. Available online: https://es.weatherspark.com/y/5674/Clima-promedio-en-Ciudad-de-M%C3%A9xico-M%C3%A9xico-durante-todo-el-a%C3%B1o (accessed on 25 January 2022).
- Gobierno de la Ciudad de México. Tourism Statistical Yearbook 2020; Gobierno de la Ciudad de México: Mexico City, Mexico, 2020. [Google Scholar]
- Secretaría de Turismo de la Ciudad de Mexico. Perfil del Turista que Visita Ciudad de Mexico, 2017. Available online: https://turismo.cdmx.gob.mx/storage/app/media/Estadisticas/Perfil%20del%20Turista%202017/EST%20IPN-SECTUR%20DF%20Perfil%20del%20Turista%202017%20Reporte%20Ejecutivo.pdf (accessed on 16 December 2021).
- Gobierno de la Ciudad de México. Urban Art. Historic Center of Mexico City. n.d. Available online: https://www.centrohistorico.cdmx.gob.mx/proyectos/arte-urbano (accessed on 16 January 2021).
- TripAdvisor. Discover Mexico City. TripAdvisor. n.d. Available online: https://www.tripadvisor.es/Tourism-g150800-Mexico_City_Central_Mexico_and_Gulf_Coast-Vacations.html (accessed on 25 January 2021).
- Roldán, N. Number of Congresses Broke Record: Ranking ICCA 2019. Factor Meetings. 12 May 2020. Available online: https://factormeetings.com/numero-congresos-rompio-record-ranking-icca-2019/ (accessed on 16 June 2021).
- Lopez, M. Studies: Urban Tourism, the Preferred by Mexicans in 2019. America Retail. 12 December 2019. Available online: https://www.america-retail.com/estudios/estudios-turismo-urbano-el-preferido-por-los-mexicanos-en-2019/ (accessed on 16 January 2021).
- Time Out México. The Best Festivals and Events in CDMX. TimeOut. 16 July 2017. Available online: https://www.timeoutmexico.mx/ciudad-de-mexico/que-hacer/los-mejores-festivales-y-eventos-en-la-cdmx (accessed on 16 December 2021).
- Fernández Poncela, A. Who Are They, What Do They Think and What Do They Value: Tourism in CDMX. Kalpana 2019, 17, 61–82. Available online: https://www.academia.edu/42246045/Qui%C3%A9nes_son_qu%C3%A9_opinan_y_qu%C3%A9_valoran_turismo_en_la_CDMX (accessed on 16 January 2021).
- Municipalidad de Lima. Lima. n.d. Available online: https://www.munlima.gob.pe/lima/ (accessed on 12 May 2022).
- Estaciones del Año. n.d. In: Seasons of the Year in Lima. Available online: https://www.estacionesdelano.com/lima/ (accessed on 16 December 2021).
- PromPerú. Profile of the Foreign Tourist Visiting Lima 2019. 2020. Available online: https://www.promperu.gob.pe/TurismoIN/sitio/VisorDocumentos?titulo=Lugar%20visitado%20-%20Lima&url=~/Uploads/perfiles_extranjeros/43/tips/2677/PTE%202019%20-%20Visita%20Lima.pdf&nombObjeto=PerfTuristaExt&back=/TurismoIN/sitio/PerfTuristaExt&peso=204556 (accessed on 16 December 2021).
- Mincetur. Tourist Movement in Lima. Ministerio de Comercio Exterior y Turismo. 2018. Available online: https://www.mincetur.gob.pe/wp-content/uploads/documentos/turismo/estadisticas/ReporteTurismoRegional/RTR_Lima_2018.pdf (accessed on 20 January 2022).
- Gobierno del Perú. Coronavirus: Measures for Public Transport during the National Emergency. Government of Peru. 15 December 2021. Available online: https://www.gob.pe/12514-coronavirus-medidas-para-el-transporte-publico-durante-la-emergencia-nacional (accessed on 16 December 2021).
- BBC News Mundo. The Latin American Destinations Awarded at the World Tourism Awards. BBC News. 17 December 2021. Available online: https://www.bbc.com/mundo/noticias-59701741 (accessed on 16 June 2022).
- Andina. Lima 2019: Peru Will Lead Hotel Occupancy in South America. Andina. 10 July 2019. Available online: https://andina.pe/agencia/noticia-lima-2019-peru-liderara-ocupacion-hotelera-sudamerica-758287.aspx (accessed on 16 June 2022).
- Mincetur. Peru: Supply and Demand of Lodging Establishments, 2019; Dirección de Investigación y Estudios para el Turismo y Artesanía Viceministerio de Turismo: Lima, Peru, 2020; Available online: https://cdn.www.gob.pe/uploads/document/file/1466816/Per%C3%BA%3A%20Oferta%20y%20Demanda%20de%20Establecimientos%20de%20Hospedaje%202019.pdf (accessed on 16 June 2022).
- Gonzáles, A. The 12 Tourist Places of Peru Most Visited by Foreigners. Tips Para Tu Viaje. n.d. Available online: https://tipsparatuviaje.com/lugares-turisticos-del-peru-mas-visitados-por-los-extranjeros/ (accessed on 16 June 2022).
- Muro Doig, F.A. Cultural Center of Urban Art as an Integrating Public Space in the District of Barranco. Bachelor’s Thesis, The Universidad Peruana de Ciencias Aplicadas, Lima, Peru, 2021. [Google Scholar]
- Redacción ContentLab. Urban Art in Lima: A Tour of His Works. Gestión. 30 September 2019. Available online: https://gestion.pe/especial/zonalounge/arte-y-diseno/fotos-arte-urbano-lima-conozca-sus-obras-emblematicas-noticia-1994643 (accessed on 16 June 2022).
- TripAdvisor. Things to Do in Lima. TripAdvisor. n.d. Available online: https://www.tripadvisor.com.pe/Attractions-g294316-Activities-Lima_Lima_Region.html (accessed on 25 February 2022).
- Museo Convento San Francisco y Catacumbas. Museo Catacumbas: Historia. n.d. Available online: http://museocatacumbas.com/shortcodes/ (accessed on 15 December 2021).
- Municipalidad de Miraflores. Fair Information. Municipalidad de Miraflores. n.d. Available online: https://www.miraflores.gob.pe/diadelcomprador/informacion-ferias/ (accessed on 25 January 2022).
- Yoon, Y.; Uysal, M. An examination of the effects of motivation and satisfaction on destination loyalty: A structural model. Tour. Manag. 2005, 26, 45–56. [Google Scholar] [CrossRef]
- DeVellis, R.F. Scale Development: Theory and Applications, 3rd ed.; Sage: Los Angeles, CA, USA, 2012. [Google Scholar]
- Perrien, J.; Cheron, E.J.; Zins, M. Recherche en Marketing Methodes et Decisions; G Morin: Chicoutimi, QC, Canada, 1983. [Google Scholar]
- Romão, J.; Kourtit, K.; Neuts, B.; Nijkamp, P. The smart city as a common place for tourists and residents: A structural analysis of the determinants of urban attractiveness. Cities 2018, 78, 67–75. [Google Scholar] [CrossRef]
- Moreno Gil, S.; Ritchie, J.R.B. Understanding the museum image formation process. J. Travel Res. 2008, 47, 480–493. [Google Scholar] [CrossRef]
- Plaza, B. Guggenheim museum’s effectiveness to attract tourism. Ann. Tour. Res. 2000, 27, 1055–1058. [Google Scholar] [CrossRef]
- Kourtit, K.; Nijkamp, P.; Wahlström, M.H. How to make cities the home of people–A ‘soul and body’ analysis of urban attractiveness. Land Use Policy 2020, 111, 104734. [Google Scholar] [CrossRef]
| Publisher’s Note: MDPI stays neutral with regard to jurisdictional claims in published maps and institutional affiliations. |
© 2022 by the authors. Licensee MDPI, Basel, Switzerland. This article is an open access article distributed under the terms and conditions of the Creative Commons Attribution (CC BY) license (https://creativecommons.org/licenses/by/4.0/).


 ,
, 


