Article

Digital Economy Development and the Urban–Rural Income Gap: Intensifying or Reducing

School of Public Administration, Shandong University of Finance and Economics, Jinan 250014, China
*
Author to whom correspondence should be addressed.
Land 2022, 11(11), 1980; https://doi.org/10.3390/land11111980
Submission received: 7 October 2022 / Revised: 2 November 2022 / Accepted: 2 November 2022 / Published: 4 November 2022

Abstract

:
Based on theoretical analysis, this study examines the relationship between the development of China’s digital economy and the urban–rural income gap by using an empirical model to test panel data for 30 provinces in China from 2009 to 2019. The results of the study reveal that (1) there is a “U-shaped” relationship between the digital economy and the urban–rural income gap, with the gap narrowing in the early stages of development and widening in the medium-to-long term. (2) The development of the digital economy in peripheral regions will have an impact on the urban–rural income gap in the region through spatial spillover. (3) The heterogeneity tests reveal that the digital economy has a stronger impact on the urban–rural income gap in western China and a weaker impact in the east. (4) A double difference test using “Broadband Rural” construction as a policy shock variable reveals that the pilot project helped reduce the urban–rural income gap. This study deepens our understanding of the digital economy for integrated urban–rural development. It provides a theoretical basis and practical experience for enhancing the living standard of rural residents and promoting the integrated development of urban and rural areas.

1. Introduction

The 2030 Agenda for Sustainable Development issued by the United Nations proposes to eliminate all forms of poverty worldwide. Therefore, governments are paying more attention to the issue of poverty eradication and making a lot of efforts to overcome the series of challenges encountered in the process of poverty eradication [1,2,3]. Nowadays, some developing countries are facing the problems of backward rural economic development and unbalanced urban and rural development. The most prominent issue is that the urban–rural income gap is too large [4,5,6]. This urban–rural gap is now recognized as one of the important criteria that distinguishes developing from developed countries [7]. With the rapid development of digital technology, the digital economy has become an important force for economic development, which will have a profound impact on reshaping the new urban–rural relationship, achieving balanced development in urban and rural areas, and changing the income distribution pattern between urban and rural areas [8]. In particular, the interconnected nature of digital technology can help drive a steady increase in a country’s economic development level by connecting different sectors to achieve sustainable development. However, the different degrees of digital infrastructure construction and application and mastery of digital technology by different groups can easily lead to social differentiation, resulting in a prominent digital divide [9,10]. As the world’s largest developing country, China has begun to increase its efforts to support the development of rural areas to achieve the goal of poverty eradication and promote the integrated development of urban and rural areas [11]. Looking back on China’s development history, for a long time, the urban–rural dual structure in China has led to the imbalance of urban and rural development and the serious problem of urban–rural digital divide. Based on the above considerations, it is of great theoretical and practical significance to explore how to narrow the urban–rural income gap, reduce the digital divide for poverty eradication and integrate urban and rural development.
With the rapid development of digital technology, many scholars have begun to pay attention to its impact on the urban–rural income gap, and the existing studies are broadly divided into the following two types. The first view is that it will reduce the income gap between urban and rural areas. Parker pointed out that the lack of economies of scale and distance are important barriers to rural development in the U.S., and the widespread use of the Internet can largely break down the barriers and ensure balanced development between rural and urban areas [12]. Zheng et al. pointed out that the use of the Internet can significantly improve the literacy and knowledge reserve of rural residents, resulting in a higher level of rural human capital. This helps to increase the overall income in rural areas and reduce their income gap with urban residents [13]. In addition, Khan et al. also believed that Internet technology can reshape rural economic conditions, promote the upgrading of agricultural industries and farmers’ income levels, and thus reduce the urban–rural income gap [14]. Ahvenniemi et al. argued that the interconnected nature of information technology can enhance inter-industry linkages, thereby increasing overall rural income levels and reducing the urban–rural income gap [15].
The second view is that digital technology will exacerbate the urban–rural income gap. Prieger argued that there are significant urban–rural gaps in network coverage in developing countries, and urban residents have greater employment opportunities than rural residents, leading to an increased urban–rural income gap [16]. From an industry chain perspective, the development of smart technologies will result in significantly higher wage growth rates for high-skilled workers than low-skilled workers [17]. However, most of China’s high-skilled workers are concentrated in urban areas, and most of the low-skilled workers are in rural areas. Su et al. and Wang et al. pointed out that intelligent technology has increased unemployment and decreased wages of low-skilled workers, and the income level of both high- and low-skilled workers has been increasing [18,19].
There are three main contributions of this study. First, on the part of a theoretical mechanism, the paper discusses the influence mechanism of the digital economy on rural residents’ income from the perspective of wage income and household operating income. At the same time, taking the transfer of rural labor into account, this paper discusses the specific impact of the digital economy on the urban–rural income gap. Second, based on the analysis of the real situation of digital economy development and the urban–rural income gap in China, we empirically test the “U-shaped” relationship between the digital economy and urban–rural income gap. Third, a double difference test using China’s “Broadband Rural” pilot project as a policy shock variable reveals that the urban–rural income gap is still larger in pilot provinces than in non-pilot provinces. The results of the study indicate that the overall trend of the urban–rural income gap in the pilot provinces is decreasing, and the change is larger than that in the non-pilot provinces. This implies that the “Broadband Rural” pilot project plays an important role in promoting digital inclusive development in urban and rural areas.

2. Theoretical Mechanisms and Research Hypotheses

Following the agricultural and industrial technology revolutions, a wave of technological revolution represented by digital technology is now taking place worldwide. The digital economy is gradually becoming a new driving force, providing good opportunities for economic development. However, the development of digital technology is also a “double-edged sword” [20,21]. On the one hand, the emergence of the digital economy has improved market dynamics, helping to promote the economic development of rural areas, thereby bridging the gap in economic development [22]. On the other hand, the development of digital technology can deepen inequities. Since the reform and opening up of China, urban areas have been favored by various policies [23,24], thereby accelerating their development rate significantly. The gap between urban and rural areas has always existed because of the poor economic and infrastructure development in rural areas, and the “Matthew effect” brought by the digital divide is also deepening this gap. Therefore, bridging the digital divide and breaking the imbalance of information development is the only way to enable digital technology to have a spillover effect and better utilize the information dividend to achieve the goal of poverty eradication and inclusive development in urban and rural areas.

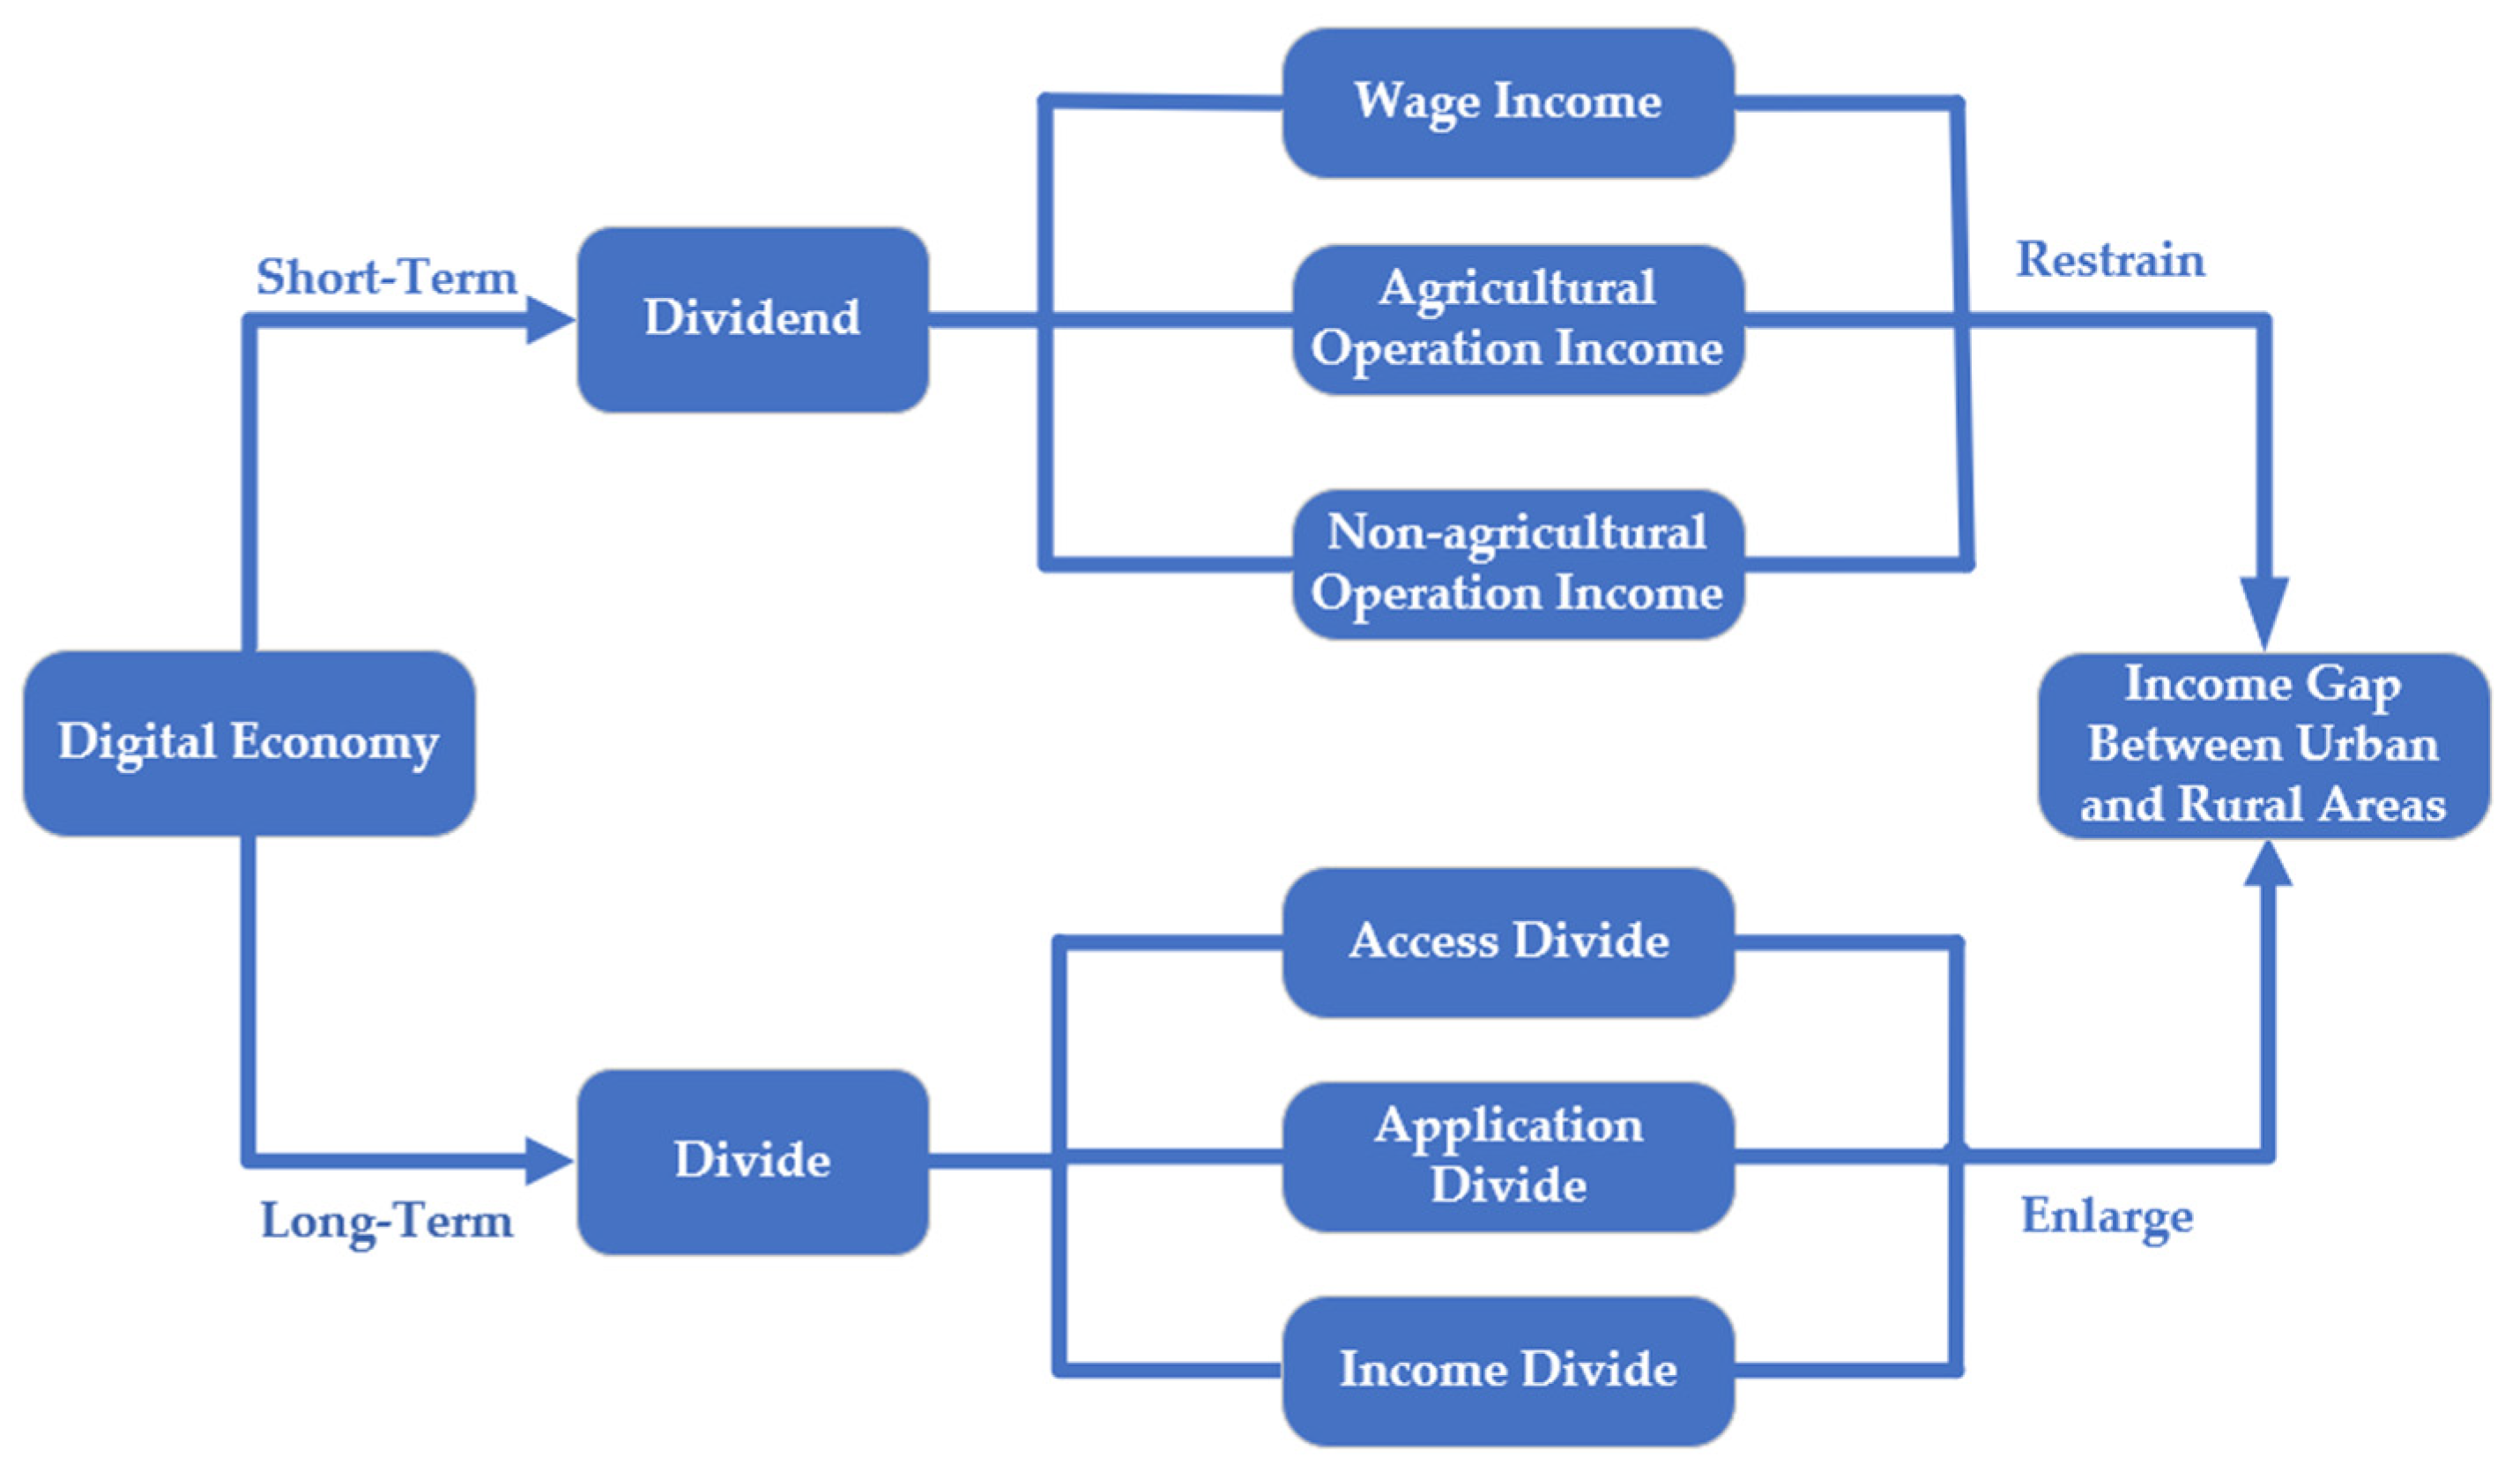
2.1. Mechanisms of Digital Economy Development on Urban–Rural Income Gap

2.1.1. Analysis of the Effect of Digital Economy Development Dividend on Urban–Rural Income Gap

According to China Rural Revitalization Survey (CRRS), the main sources of income of rural residents are wage income and household operating income. In terms of the income composition of rural residents in China in 2019, the share of wage income was as high as 45.72%, and the share of household operating income was 41.05%. Among them, agricultural net operating income accounted for 27.18% of the total income, while non- agricultural operating income accounted for 13.87%. The development of the digital economy can have an impact on reducing the rural–urban income gap by affecting the three types of rural incomes mentioned above.
The wage income of rural residents roughly includes three aspects. The first is the wage income of migrant workers in flexible employment. The second is the income from wages earned by working in local enterprises. The third is income from the employment of rural migrant labor. The development of the digital economy provides more jobs and promotes the rapid development of flexible employment by creating new business types and new business models [25]. For example, digital technology has given rise to takeaway delivery workers, online taxi drivers, and couriers, which play a role in absorbing labor in rural areas, thereby boosting the wage income of rural labor and helping to narrow the income gap between urban and rural areas. It has to be mentioned that the development of the digital economy provides more opportunities for employment development, and the wage level of the new sector is higher than that of the traditional agricultural sector, so it will attract rural residents to move to urban areas to seek better development. Especially with higher levels of education in urban areas, the rural young adult workforce is more interested in moving to give their children access to higher levels of educational resources, and the new types of jobs created by the digital economy certainly provide a good opportunity for them. The wage income obtained by rural migrant labor has thus become an important source of income for rural residents.
In terms of agricultural operating income, digital economy development can improve agricultural production efficiency and increase farmers’ income. Farmers can obtain factor information, screen useful information, and transmit information at a lower cost, which greatly reduces the degree of asymmetry of rural labor in seeking agricultural product market information, and significantly reduces the possibility of resource mismatch [26]. In addition, digital technology applied to the agricultural industry can not only reduce the cost of agricultural production, but also provide specialized guidance, making production decisions more scientific and efficient, and significantly increasing the efficiency of agricultural production [27]. At the same time, in the digital economy, rural residents have more access to information and can use the Internet platform to acquire more knowledge and change their way of thinking, which can greatly help to improve their production and living conditions and, to a certain extent, increase the overall income level of rural residents [28,29].
From the perspective of non-agricultural operating income, the development of the digital economy helps to promote rural residents’ entrepreneurship, thus increasing the non-agricultural economic income of rural residents. On the one hand, rural residents are based on their own advantageous industries and start their own businesses with the help of e-commerce platforms to drive the joint development of upstream and downstream of the industrial chain. This has led to the gradual increase in non-agricultural employment of rural residents, the increase in per capita income of farmers, and the gradual increase in the willingness of rural residents to start their own businesses. At the same time, it also attracts young migrant workers to return to their hometown for entrepreneurship, which will have a positive impact on narrowing the urban–rural income gap. On the other hand, while promoting the development of the whole industrial chain of production, processing, and marketing of agricultural products, the application of digital technology can also drive the development of tourism, logistics, and other related industries. It provides a multi-channel source of income for rural areas and increases the non-agricultural economic income of rural residents.

2.1.2. Analysis of the Effect of the “Digital Divide” on the Urban–Rural Income Gap

In terms of overall development, the development of China’s urban and rural digital economy has shown continuous growth, but in general, rural areas lag behind urban areas. Due to the different economic development levels in urban and rural areas, the degree of the promotion of digital construction is also different. This imbalance in the level of development of the digital economy between regions has caused the phenomenon of digital divide. The digital divide can be divided into a first-class divide with significant differences in infrastructure development and a second-class divide with significant differences in data and information acquisition, screening, processing, and utilization [30]. In China, the overall education level of rural residents is low, and there is a lack of learning about digital technology such as the Internet, so rural residents are vulnerable to greater restrictions in the use of the Internet. The low level of farmers’ use of digital technology has led to a more serious problem of “digital divide,” which hinders the improvement of labor skills and wealth acquisition of rural residents and prevents them from effectively expanding their benefit channels [31].
As depicted in Figure 1, the per capita disposable income of residents in urban and rural areas has been on an upward trend as the level of socio-economic development increases. This may be because the first-class digital divide, mainly characterized by the “access gap,” and the second-class digital divide, typically symbolized by the “application gap,” are gradually inducing a third-class digital divide characterized by the “income gap” [32]. Although the digitalization of rural areas has been significantly accelerated [33], due to the low level of education and literacy of the rural population, digital technology, as an innovative science and technology, is under-utilized by the rural population. In addition, the long-term population transfer in rural areas leads to a large proportion of the elderly population in rural areas, and farmers are relatively weak in applying digital technologies and utilizing various information resources. The above reasons lead to a low input–output ratio in rural areas, so it is difficult for various social capital to continue to invest, and the digital divide becomes more and more prominent, resulting in the situation of “the poor getting poorer and the rich getting richer.”
In summary, in the short term, the “creative destruction effect” brought by the digital economy is significant [34]. When some jobs are replaced, it also brings a lot of new employment opportunities. It can not only attract rural migrant labor to work outside, thus improving the wage income of rural residents, but also increase non-agricultural employment in rural areas, promoting the increase of non-agricultural business income in rural areas. In the long term, the accelerated development of digital technology is likely to deepen the “digital divide” between urban and rural areas. Urban areas have better educational resources, digital infrastructure, and economic development than rural areas, and people with higher education levels are more likely to enjoy development dividends in the process of digital development and can solve problems more quickly with digital technology, which is full of complexity, so their income returns will be higher. In addition, the transfer of the rural labor force is also a key factor affecting the urban–rural income gap. On the one hand, the accelerated development of the digital economy has been accompanied by a gradual acceleration in the rate of population transfer, which generally manifests itself as an exodus of young and middle-aged labor from rural areas to urban areas [35], resulting in a significant increase in the proportion of elderly people left behind in rural areas. The younger age group clearly has a greater advantage in the use of digital technology, and therefore the use of digital technology is lower in rural areas, leading to a widening income gap between urban and rural areas. On the other hand, for the rural migrant labor force, along with the deep development of the digital economy, digital technology has started to replace manual labor in many fields, which, to a certain extent, has impacted the employment needs of the rural migrant labor force. This has led to the instability of employment and the decline of salary levels. At this time, the urban–rural income gap will also gradually widen. Figure 2 depicts the corresponding mechanism pathway diagram. Based on this, the following research hypotheses are proposed:
H1: 
The impact of digital economy development on the urban–rural income gap has a “U-shaped” trend of “falling first, then rising.”

2.2. The Spillover Effect of Digital Economy Development on the Urban–Rural Income Gap

The digital economy is a form of economic development that uses a network as a carrier and data as an important component. The data elements are different from the static characteristics of early information production elements. It has the characteristics of reproducibility, mobility, and easy storage. With its fast dissemination speed and low diffusion cost, it can overcome the limitations of space and time to a large extent and have strong geospatial spillover effects. This spatial utility is mainly used to measure the impact of a certain change in a region on other regions. Moore’s law specifies that the rapid flow of data elements and the wide range of dissemination channels make information extremely easy to be copied, and its dissemination cost is extremely low. Therefore, multiple subjects can share information and realize the transmission of information elements across space and time at low costs.
The digital economy breaks through the geographical distance limitation in space by virtue of the mobility characteristics of data, improves the depth and breadth of economic activities among regions, and makes the economic activities among regions have significant spatial correlation. In addition, the externalities and scale effects of the digital economy have a spatial interaction effect on the urban–rural income gap. From the perspective of development history and characteristics, the digital economy is different from traditional labor-intensive industries in that its development requires a good external environment, mainly including the external economic environment and infrastructure environment. The higher level of economic development and better policy and institutional environment in urban areas provide good hardware configuration and software infrastructure for the development of the digital economy. Rural areas have limited access to information and higher costs of information acquisition, so it is difficult to achieve sufficient development of the digital economy. However, the borderless nature of the digital economy leads to the phenomenon of “some of the first rich drive the rich later.” Urban areas gather a large number of production factors and resources, thus bringing economies of scale. This efficient development model will also spillover to the surrounding areas, expanding the scope of digital technology services, and rural areas can better enjoy the dividends of digital economic development under the demonstration role of urban areas.
Considering the variability in the level of urbanization development in different regions, this study divides 30 Chinese provinces into eastern, central, and western to examine the impact of digital economy development on the urban–rural income gap in different regions in the context of urbanization. The division is based on the fact that the eastern region of China has a higher level of urbanization because of policy preferences and resource endowments, whereas the western region has the lowest level of urbanization. According to relevant data, the urbanization rate in the eastern region reached 68.31% in 2017, 53.08% in the central region, and 51.64% in the western region. Therefore, based on the different levels of urbanization, this study intends to test the regional heterogeneity of the eastern, central, and western regions in China. The following research hypotheses are proposed:
H2: 
The impact of digital economy development on the urban–rural income gap has spatial spillover properties.
H3: 
The impact of the level of digital economy development in different regions on the urban–rural income gap has significant variability.

3. Study Design

3.1. Model Construction

To test the above research hypothesis and make the theoretical analysis more reasonable, the following benchmark regression model is set to test the impact of digital economy development on the urban–rural income gap:
Thei l i , t = α 0 + α 1 I E i , t + α 2 I E i , t 2 + α 3 I n s t r i , t + α 4 H c i , t + α 5 G f i i , t + α 6 U r i , t + μ i + ϑ t + ε i , t
In the above equation, Theili,t is the explanatory variable, which denotes the urban–rural income gap. IEi,t denotes the digital economy development index, which is the core explanatory variable. μi and ϑt are the regional and time fixed effects, respectively, which are used to control the influence of the factors that do not change with time and the time trend on the urban–rural income gap. εi,t is the random error term. In the above formula, if α1 > 0 and α2 < 0, it indicates that there is an “inverted U-shape” relationship between Theili,t and IEi,t. If α1 < 0 and α2 > 0, it indicates that there is a “U-shaped” relationship between Theili,t and IEi,t. When α2 = 0, α1 < 0 implies convergence of the rural–urban income gap, whereas α1 > 0 implies a deepening of the rural–urban income gap.
The cross space–time and borderless characteristics of the digital economy make it possible for factors to spread. The factor spillover strengthens the correlation between urban and rural areas. For example, the development of the digital economy in a province may have an impact on the urban and rural incomes of neighboring provinces. Therefore, this study uses a spatial panel model to investigate the role of digital economy development in the urban–rural income gap. Prior to this, a global Moran test is performed, setting the formula as follows:
M o r a n I = [ a = 1 m b = 1 m W a b ( Y a Y ¯ ) ( Y b Y ¯ ) ] / [ λ 2 a = 1 m b = 1 m W a b ]
In the above equation, m refers to the number of regions; Ya is the observed value of region a, Yb is the observed value of region b; Y ¯ is the mean of Y in 30 provinces; λ2 represents the variance of Y in the 30 provinces, and Wab is the spatial weight. A positive value of the Moran index indicates that there is a spatial positive correlation; a negative value indicates that there is a spatial negative correlation, and an index value of 0 indicates that there is no spatial correlation.
To explore the spillover effect of the digital economy on the urban–rural income gap, this study uses the spatial Durbin model, spatial error model, and spatial lag model to test them, and the specific models are as follows:
T h e i l i , t = β 0 + ρ W T h e i l i , t + β 1 I E i , t + β 2 I E i , t 2 + β 3 X i , t + φ W I E i , t + μ i + ϑ t + ε i , t
T h e i l i , t = β 0 + β 1 I E i , t + β 2 I E i , t 2 + β 3 X i , t + ε i , t , ε i , t = λ W ε i , t + μ i , t
T h e i l i , t = β 0 + β 1 I E i , t + β 2 I E i , t 2 + β 3 X i , t + ρ W T h e i l i , t + μ i + ϑ t + ε i , t
In the above, β is the spatial autoregressive coefficient, ρ represents the spatial lag term for the urban–rural income gap, φ is the lag term for the level of development of the digital economy, W represents the spatial weight matrix, X represents the control variable, and the rest of the variables have the same connotation as those in Equations (1) and (2).

3.2. Selection of Variable Indicators and Descriptive Statistics

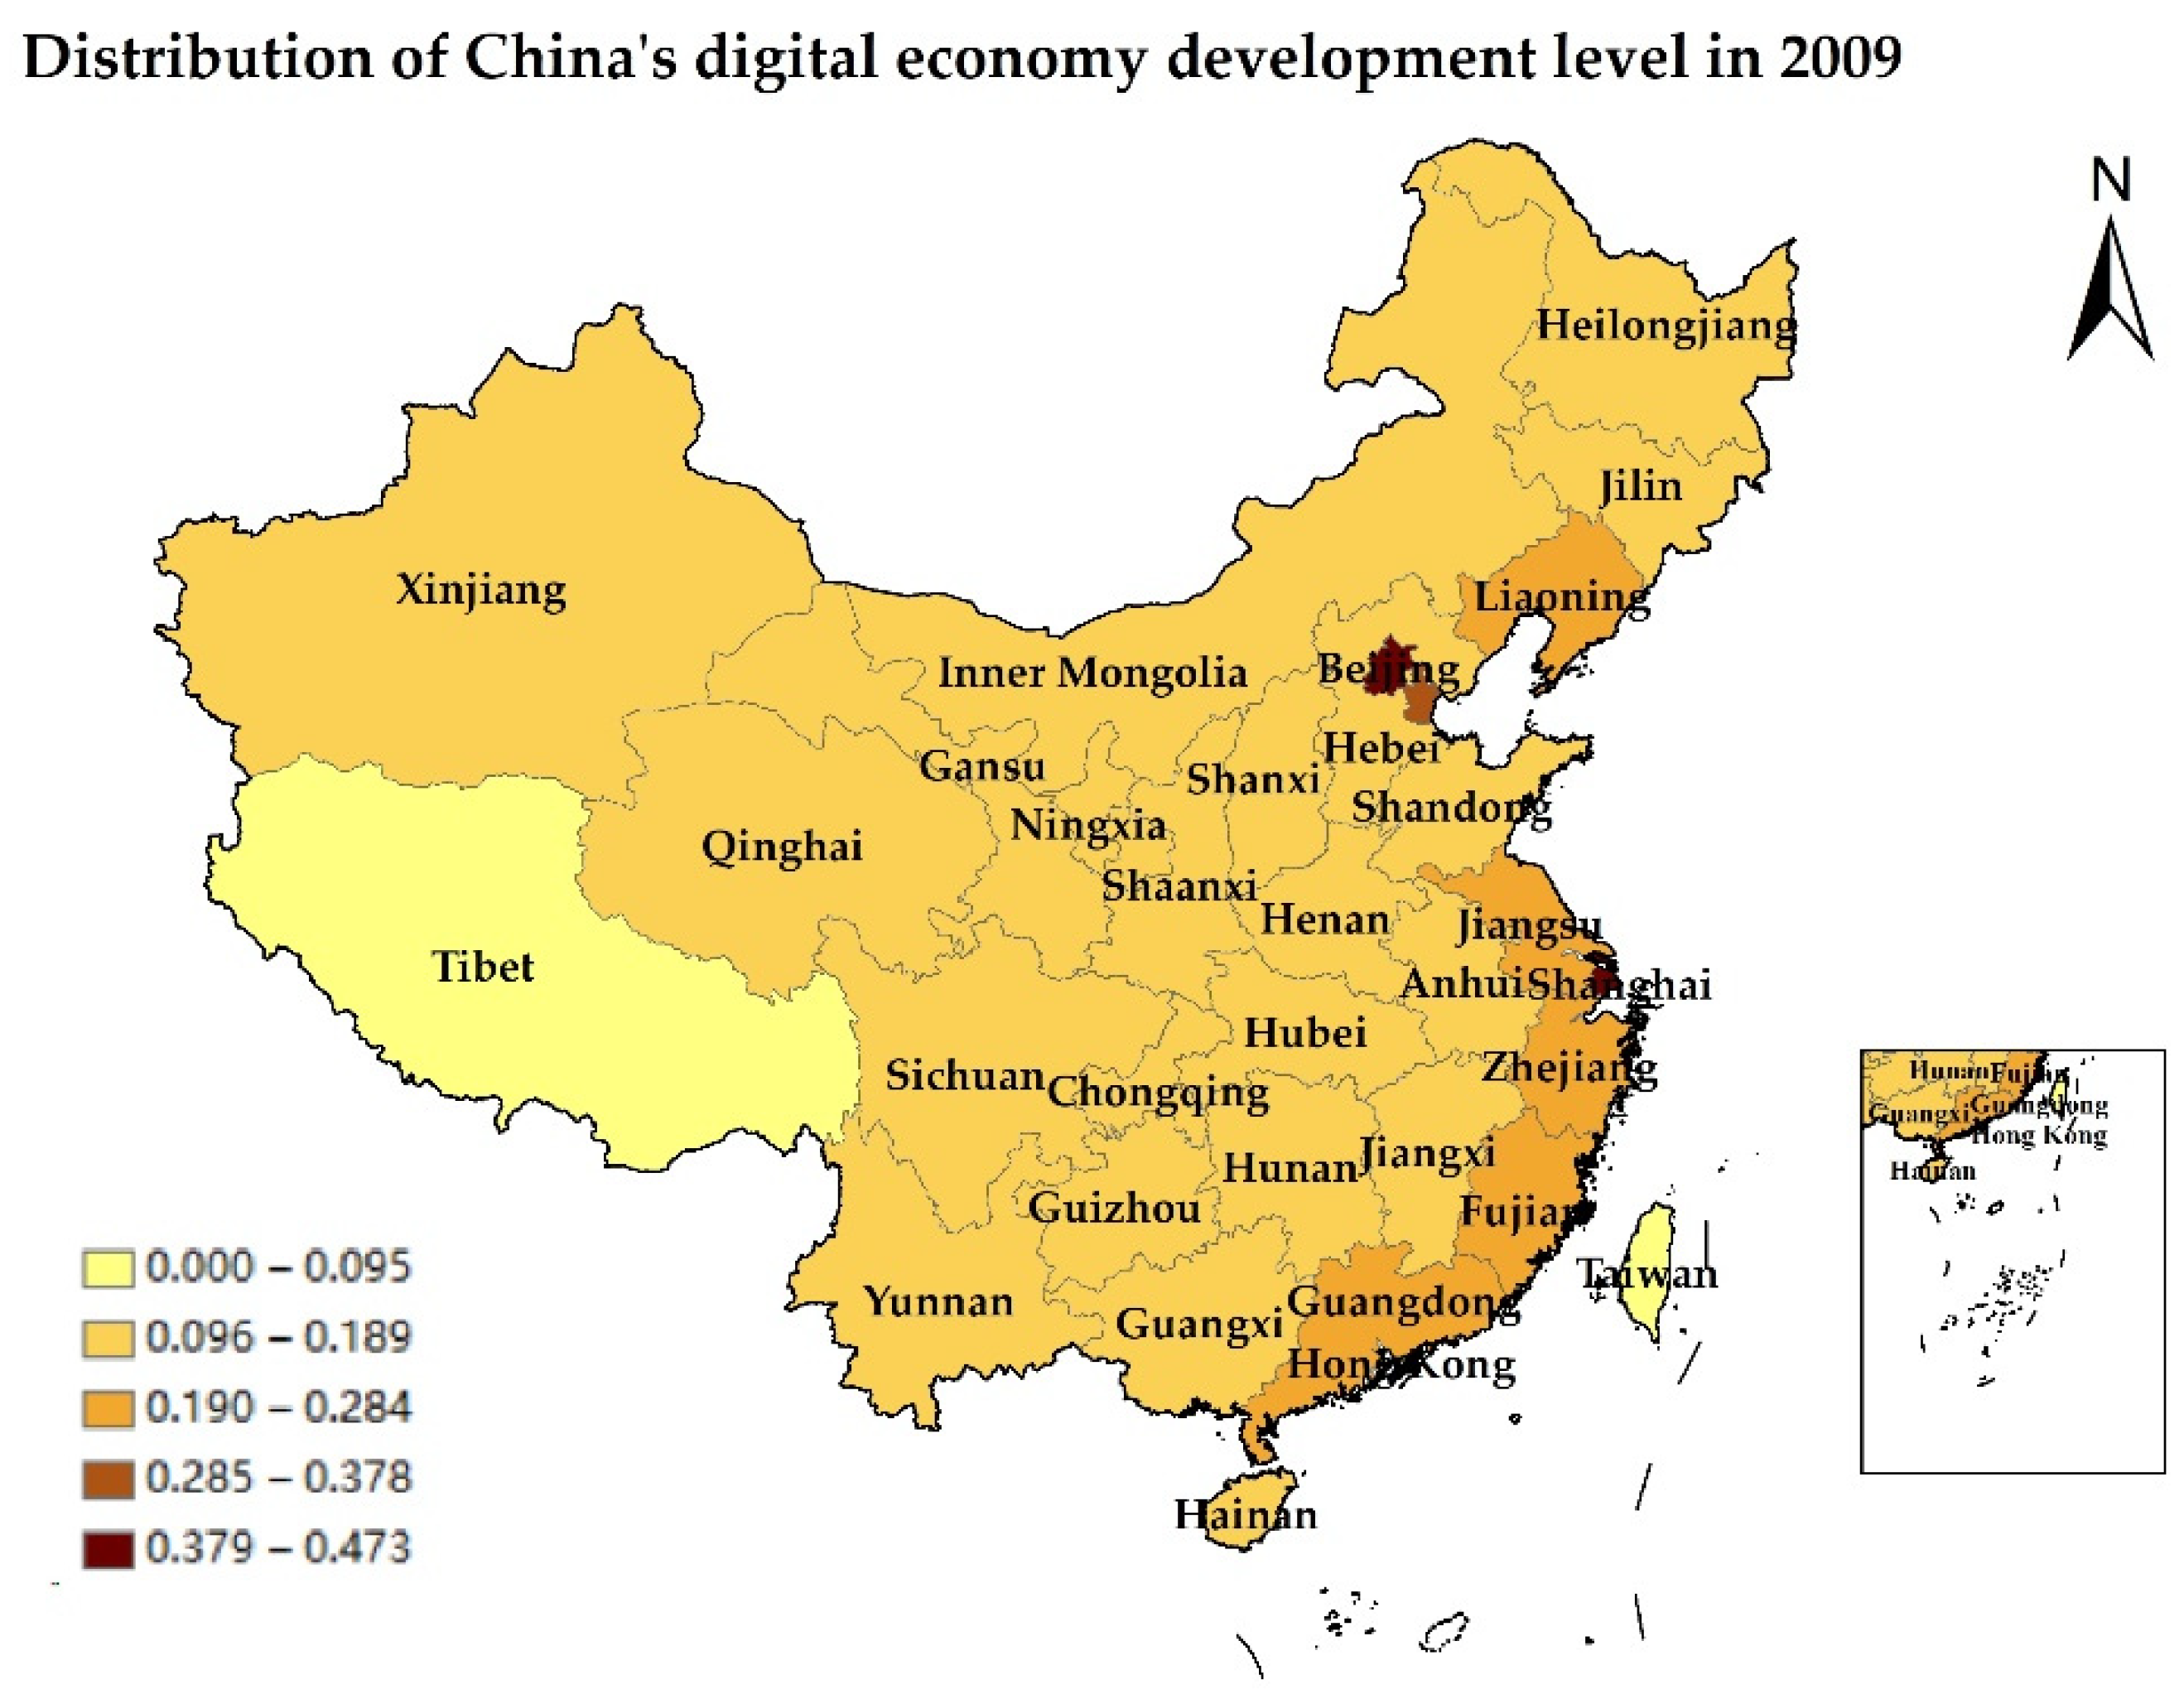
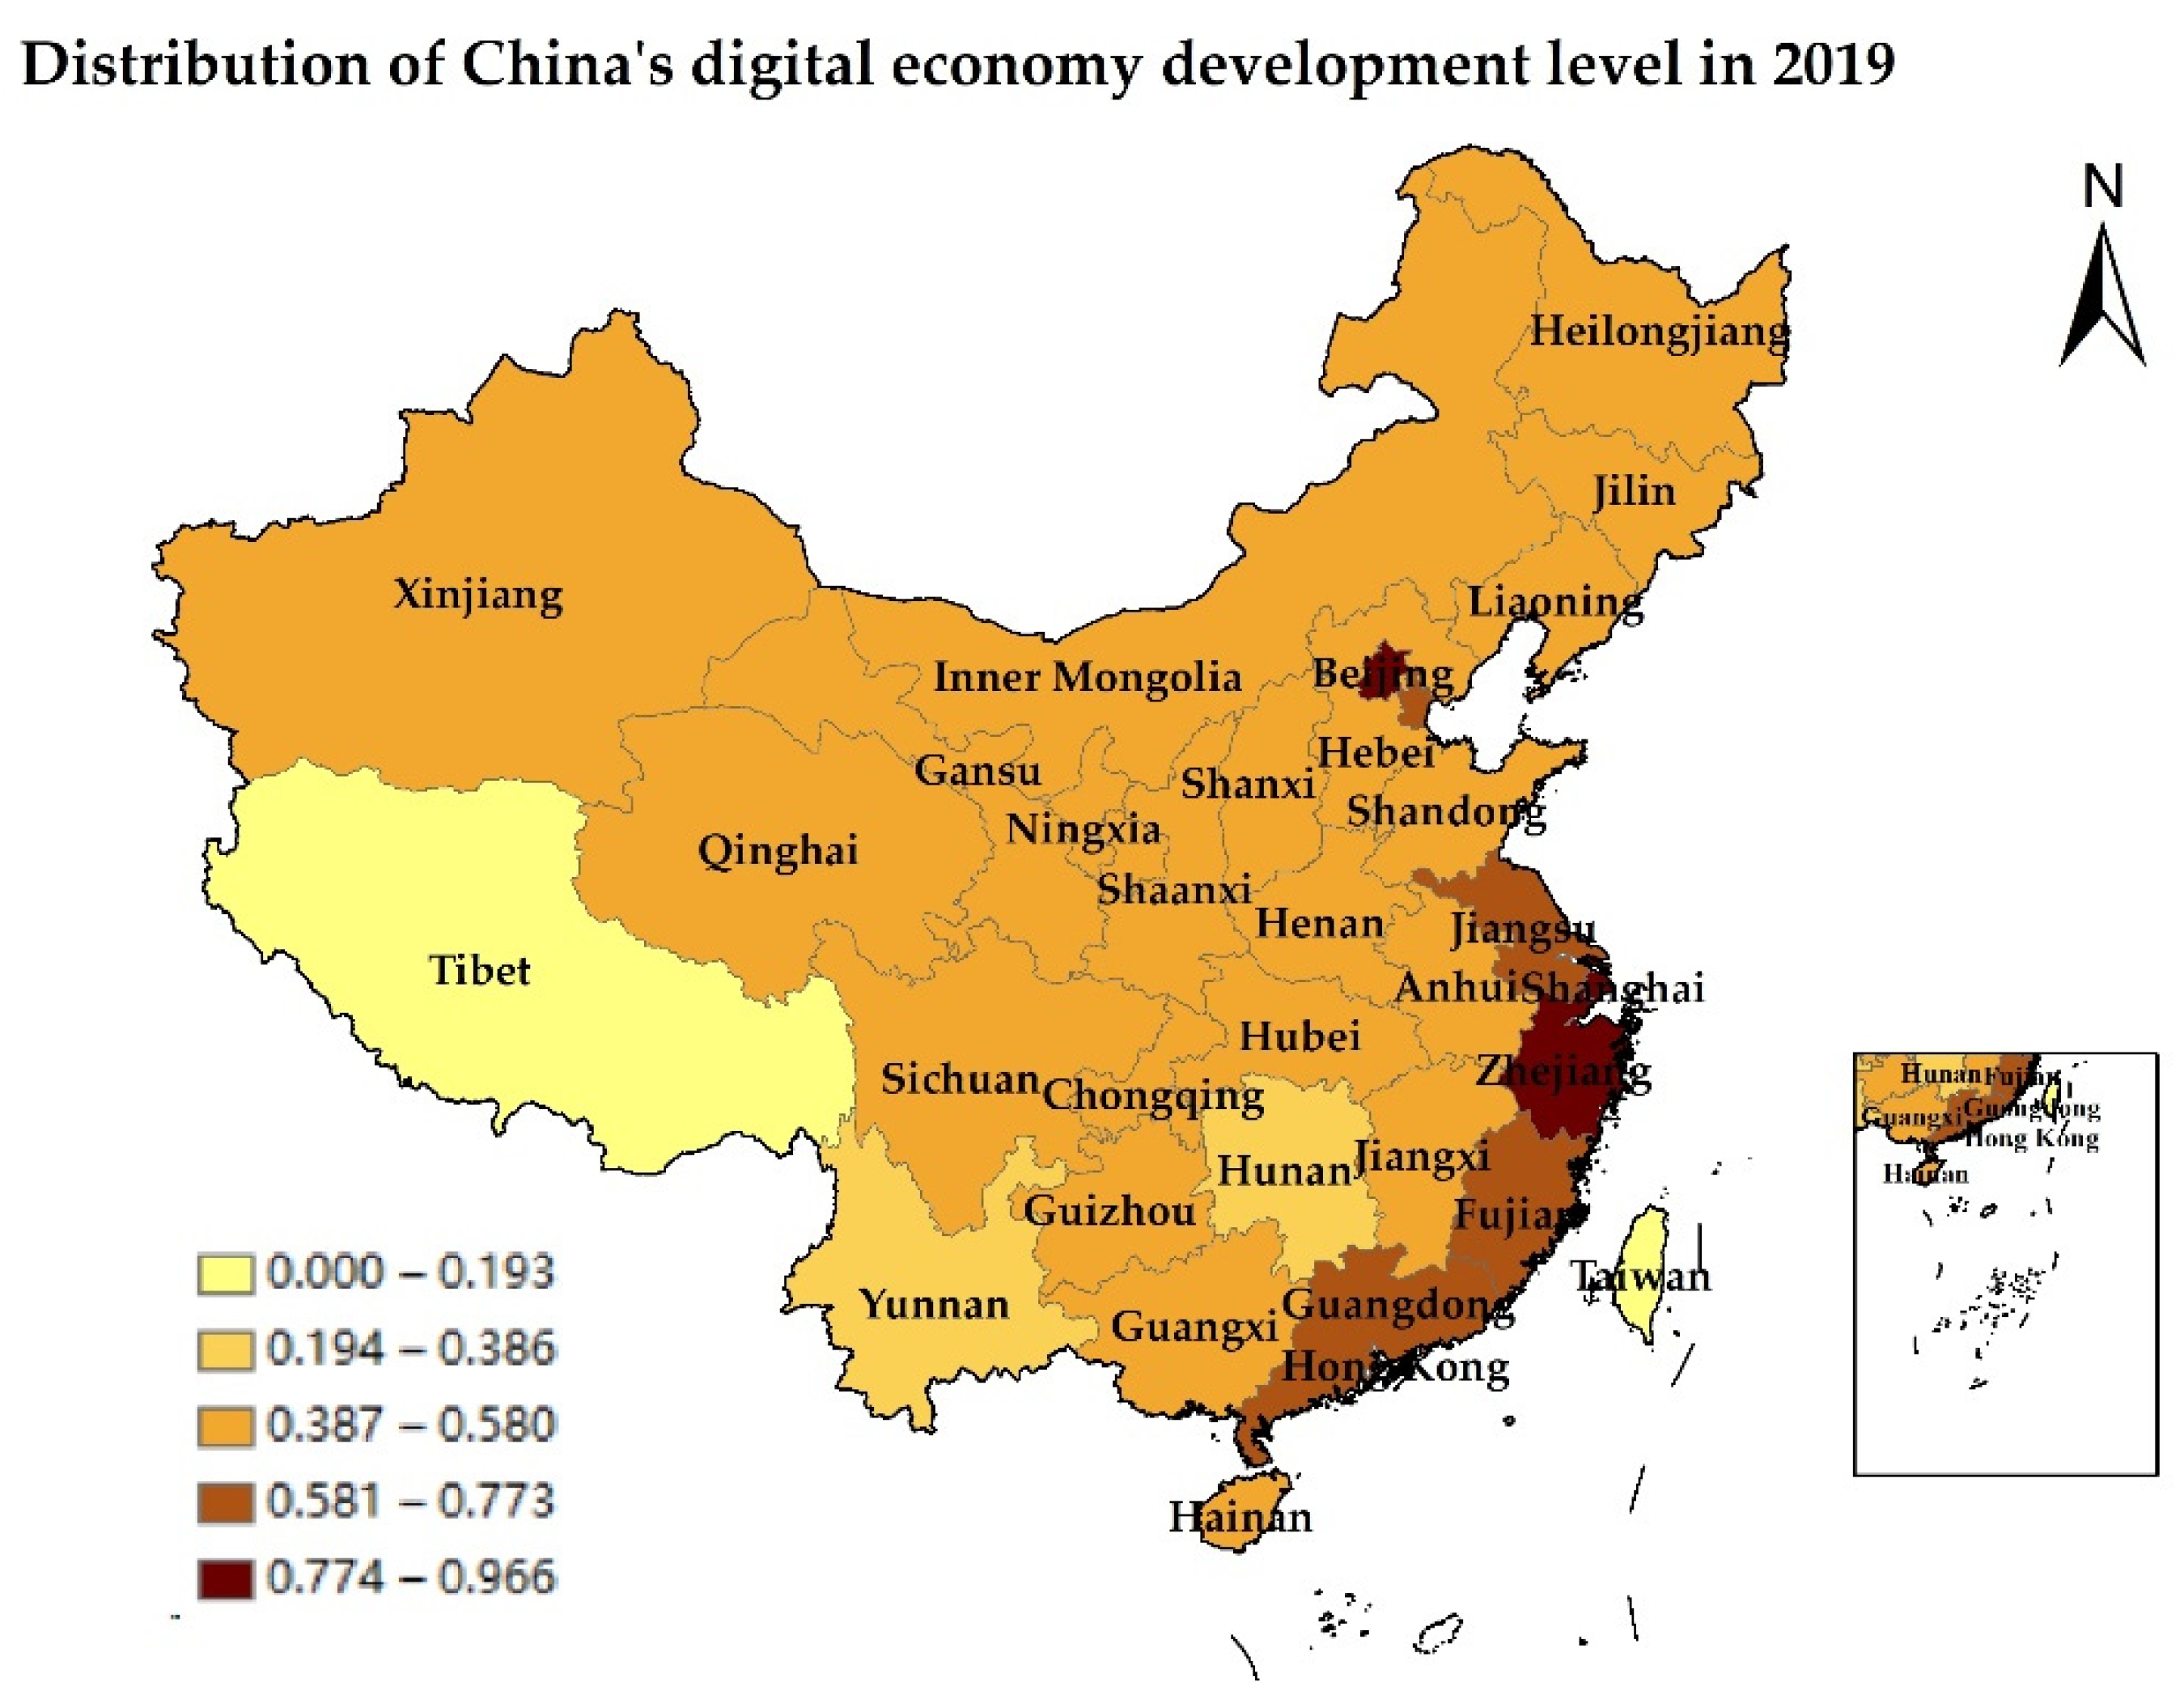
3.2.1. Measurement of the Level of Development of the Digital Economy

At the current stage, the measurement of digital economy development indicators is not yet perfect, and different scholars have used different measurement systems for the digital economy. For example, in terms of infrastructure and digital industrialization, ten indicators, including the number of urban broadband access users and the per capita access flow of mobile Internet, are selected to build the digital economy indicator system. We construct China’s provincial-level digital economy indicator system from three dimensions of information development, Internet, and digital transactions and use digital inclusive finance as an important indicator to measure the development of the digital economy [36,37]. Due to the richness and comprehensiveness of the index construction system, this study uses the measurement method of Li (2021) for reference [38]. The relevant indicators are mainly selected from four aspects—four first-class indicators of digital foundation, application capacity, industrial support, and development capacity. There are 14 secondary indicators, including the number of Internet broadband access ports per capita, the number of websites per 100 people, the length of long-distance optical cables per unit area, the proportion of digital TV users, the penetration rate of mobile phones, the Internet penetration rate, the online government index, the digital life index, the proportion of urban unit employees in information transmission and software and information technology services, the profit rate of the main business of the electronic information industry, information economy industrial structure index, R&D intensity, information economy development mode index, and network society index. Figure 3 mainly depicts the spatial distribution of digital economy levels by province in China in 2009 and 2019.

3.2.2. Measurement of the Urban–Rural Income Gap

Figure 4 depicts the distribution of urban–rural income disparities by province in China in 2009 and 2019. The current domestic measures of urban–rural income gap are mainly the Gini coefficient, the Theil index, and the disposable income ratio between urban and rural residents. The Gini coefficient is the common indicator used internationally to measure the income gap between residents of a country or region, but this method often makes it difficult to distinguish the urban–rural income gap from the overall income gap. The disadvantage of using the urban–rural income ratio to measure the urban–rural income gap is that it may lead to ignoring demographic aspects. In contrast, when the Theil index method is used, the urban–rural income gap can be divided into intra- and inter-group gaps. It can change from a static perspective to a dynamic perspective and consider both the overall income gap and the urban–rural population structure. Therefore, it can better measure the changes in the income gap. Because of this, this study uses the Theil index to measure the income gap between urban and rural areas [39,40,41]. The calculation formula is as follows:
T h e i l i t = i = 1 2 ( y i t y t ) × l n [ y i t y t / x i t x t ]
In the above equation, if i = 1, it represents the urban area, and if i = 2, it represents rural areas. y1t refers to the total disposable income of urban areas in year t, and y2t refers to the total disposable income of rural areas in year t. xt represents the total population in year t.

3.2.3. Selection of Control Variables

This study mainly selects industrial structure, human capital, government fiscal expenditure, and urbanization rate as control variables for empirical testing. As a developing country, China is mainly a labor-intensive industry country. Thus, the higher the share of the tertiary industry, the more employment opportunities for the remaining rural labor force can be increased, making the income gap between urban and rural areas smaller. Moreover, the high proportion of the output value of the primary industry indicates that the income gap between urban and rural areas is small, which can have a huge absorption effect on the rural labor force, thereby increasing the income of farmers and the urban–rural income gap. Therefore, the industrial structure development level is calculated using the following formula:
I n s t r = ( p r i m a r y   i n d u s t r y   v a l u e   a d d e d / G D P   +   v a l u e   a d d e d   o f   t e r t i a r y   i n d u s t r y / G D P ) ×   100 %
Some studies have demonstrated that the level of education increases the stock of human capital [42,43]. In reality, residents in rural areas have a lower level of education, whereas urban areas tend to have more highly skilled workers, and workers with higher skills have higher wages [44,45], leading to an income gap between urban and rural areas. The method used to measure human capital level is based on the China Statistical Yearbook. The specific measurement formula is as follows:
H c = ( n u m b e r   o f   e l e m e n t a r y   s c h o o l s   ×   6   +   n u m b e r   o f   j u n i o r   h i g h   s c h o o l s   ×   9   + n u m b e r   o f   s e n i o r   h i g h   s c h o o l s   ×   12   +   s e c o n d a r y   s c h o o l s   ×   12   +   s p e c i a l i s t s ×   15   +   b a c h e l o r s   d e g r e e s   ×   16   +   g r a d u a t e   s t u d e n t s   ×   19 ) t o t a l   p o p u l a t i o n   o v e r   6   y e a r s   o l d
Regarding government fiscal spending, different scholars’ findings on the gap between fiscal spending and urban and rural income differ. After reviewing the existing literature, this study argues that government fiscal spending has an impact on the urban–rural income gap to a certain extent. Therefore, it uses the fiscal spending/regional GDP of each province to measure government fiscal spending.
When the rural population is transported to urban areas, the scale of cities significantly expands, urban and rural resources integrate, and the local industrial structure adjusts and upgrades, which in turn has a certain degree of impact on urban and rural incomes. This study uses the number of permanent urban residents/total population to measure the level of urbanization.
Table 1 shows mainly the names of the variables and their abbreviations. All data used in this article are from the website of the National Bureau of Statistics, China Statistical Yearbook, and China Statistical Abstract.

3.2.4. Descriptive Statistics of Variables

Table 2 presents the results of the descriptive statistics of the variables used in this study. The results indicate that 330 observations are made for each variable, and the explained variable (Theil) has a mean value of approximately 0.10 and minimum and maximum values of approximately 0.02 and 0.26, respectively. The mean value of the core explanatory variable (IE) is approximately 0.37, a minimum value of approximately 0.10, and a maximum value of approximately 0.97. After analyzing the data, it is found that the level of digital economy development and the urban–rural income gap has a large variability in the degree of development in different geographical regions.

4. Empirical Test: Analysis of the Impact of Digital Economy on Urban–Rural Income Gap

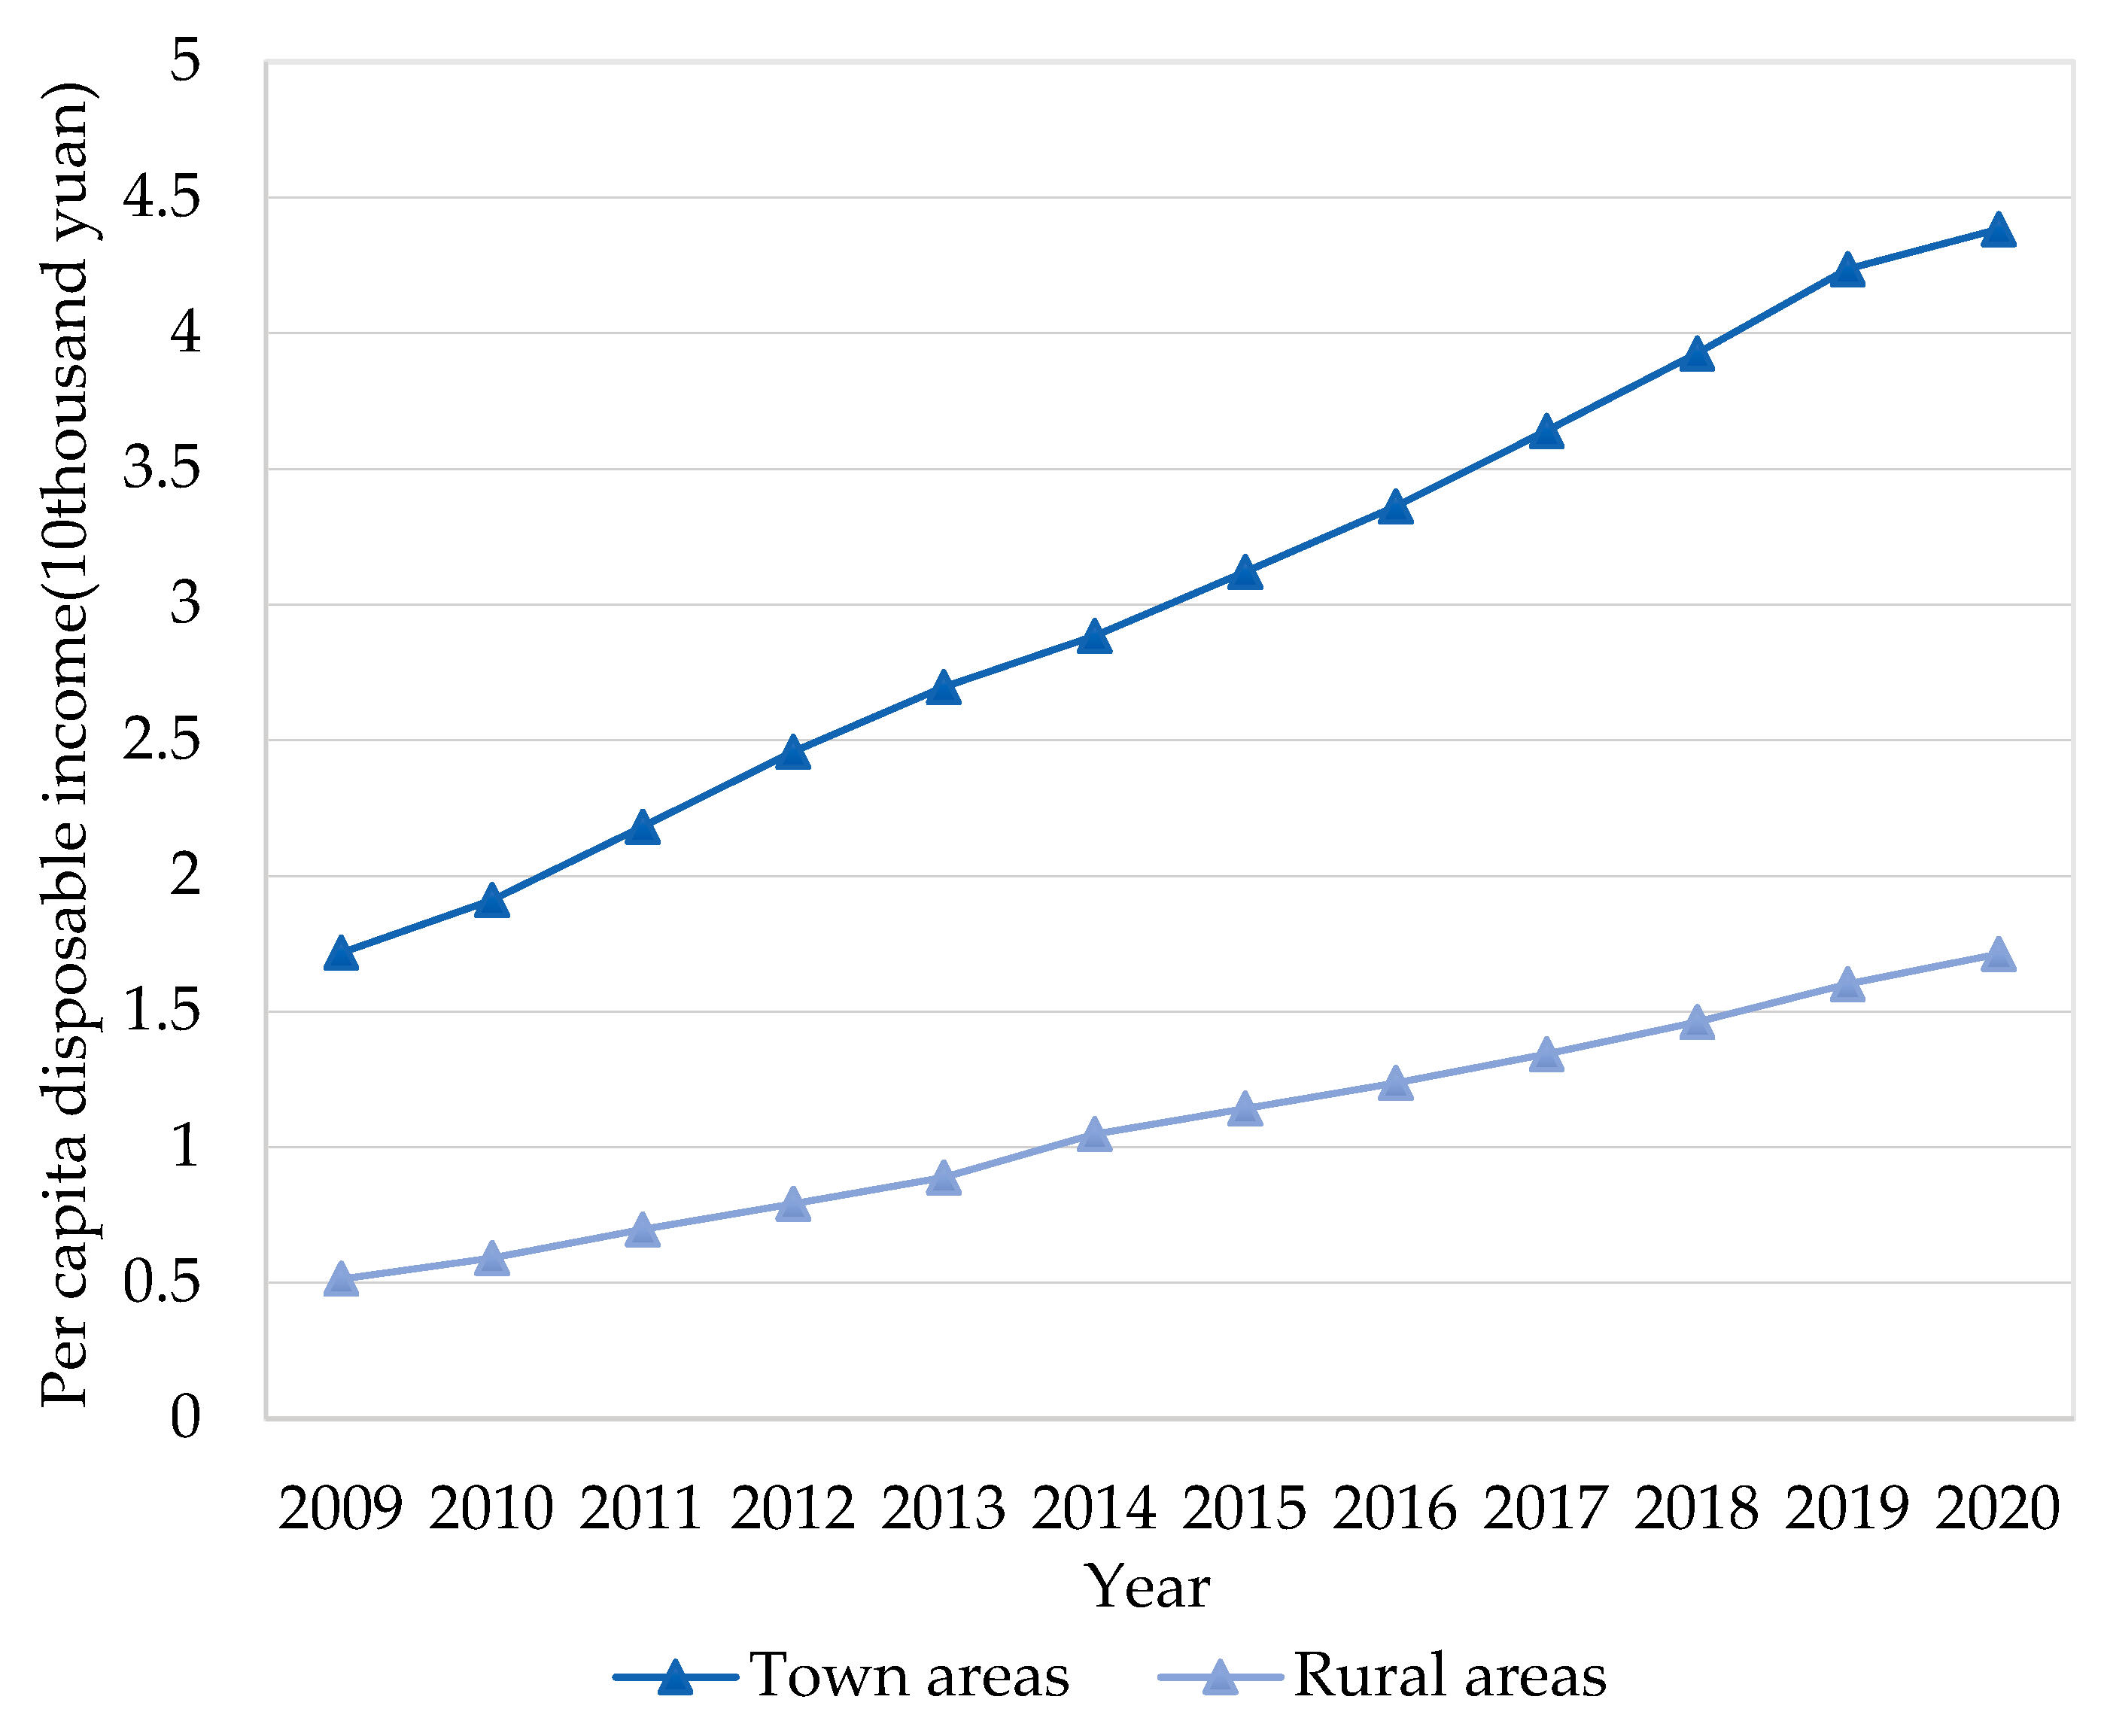
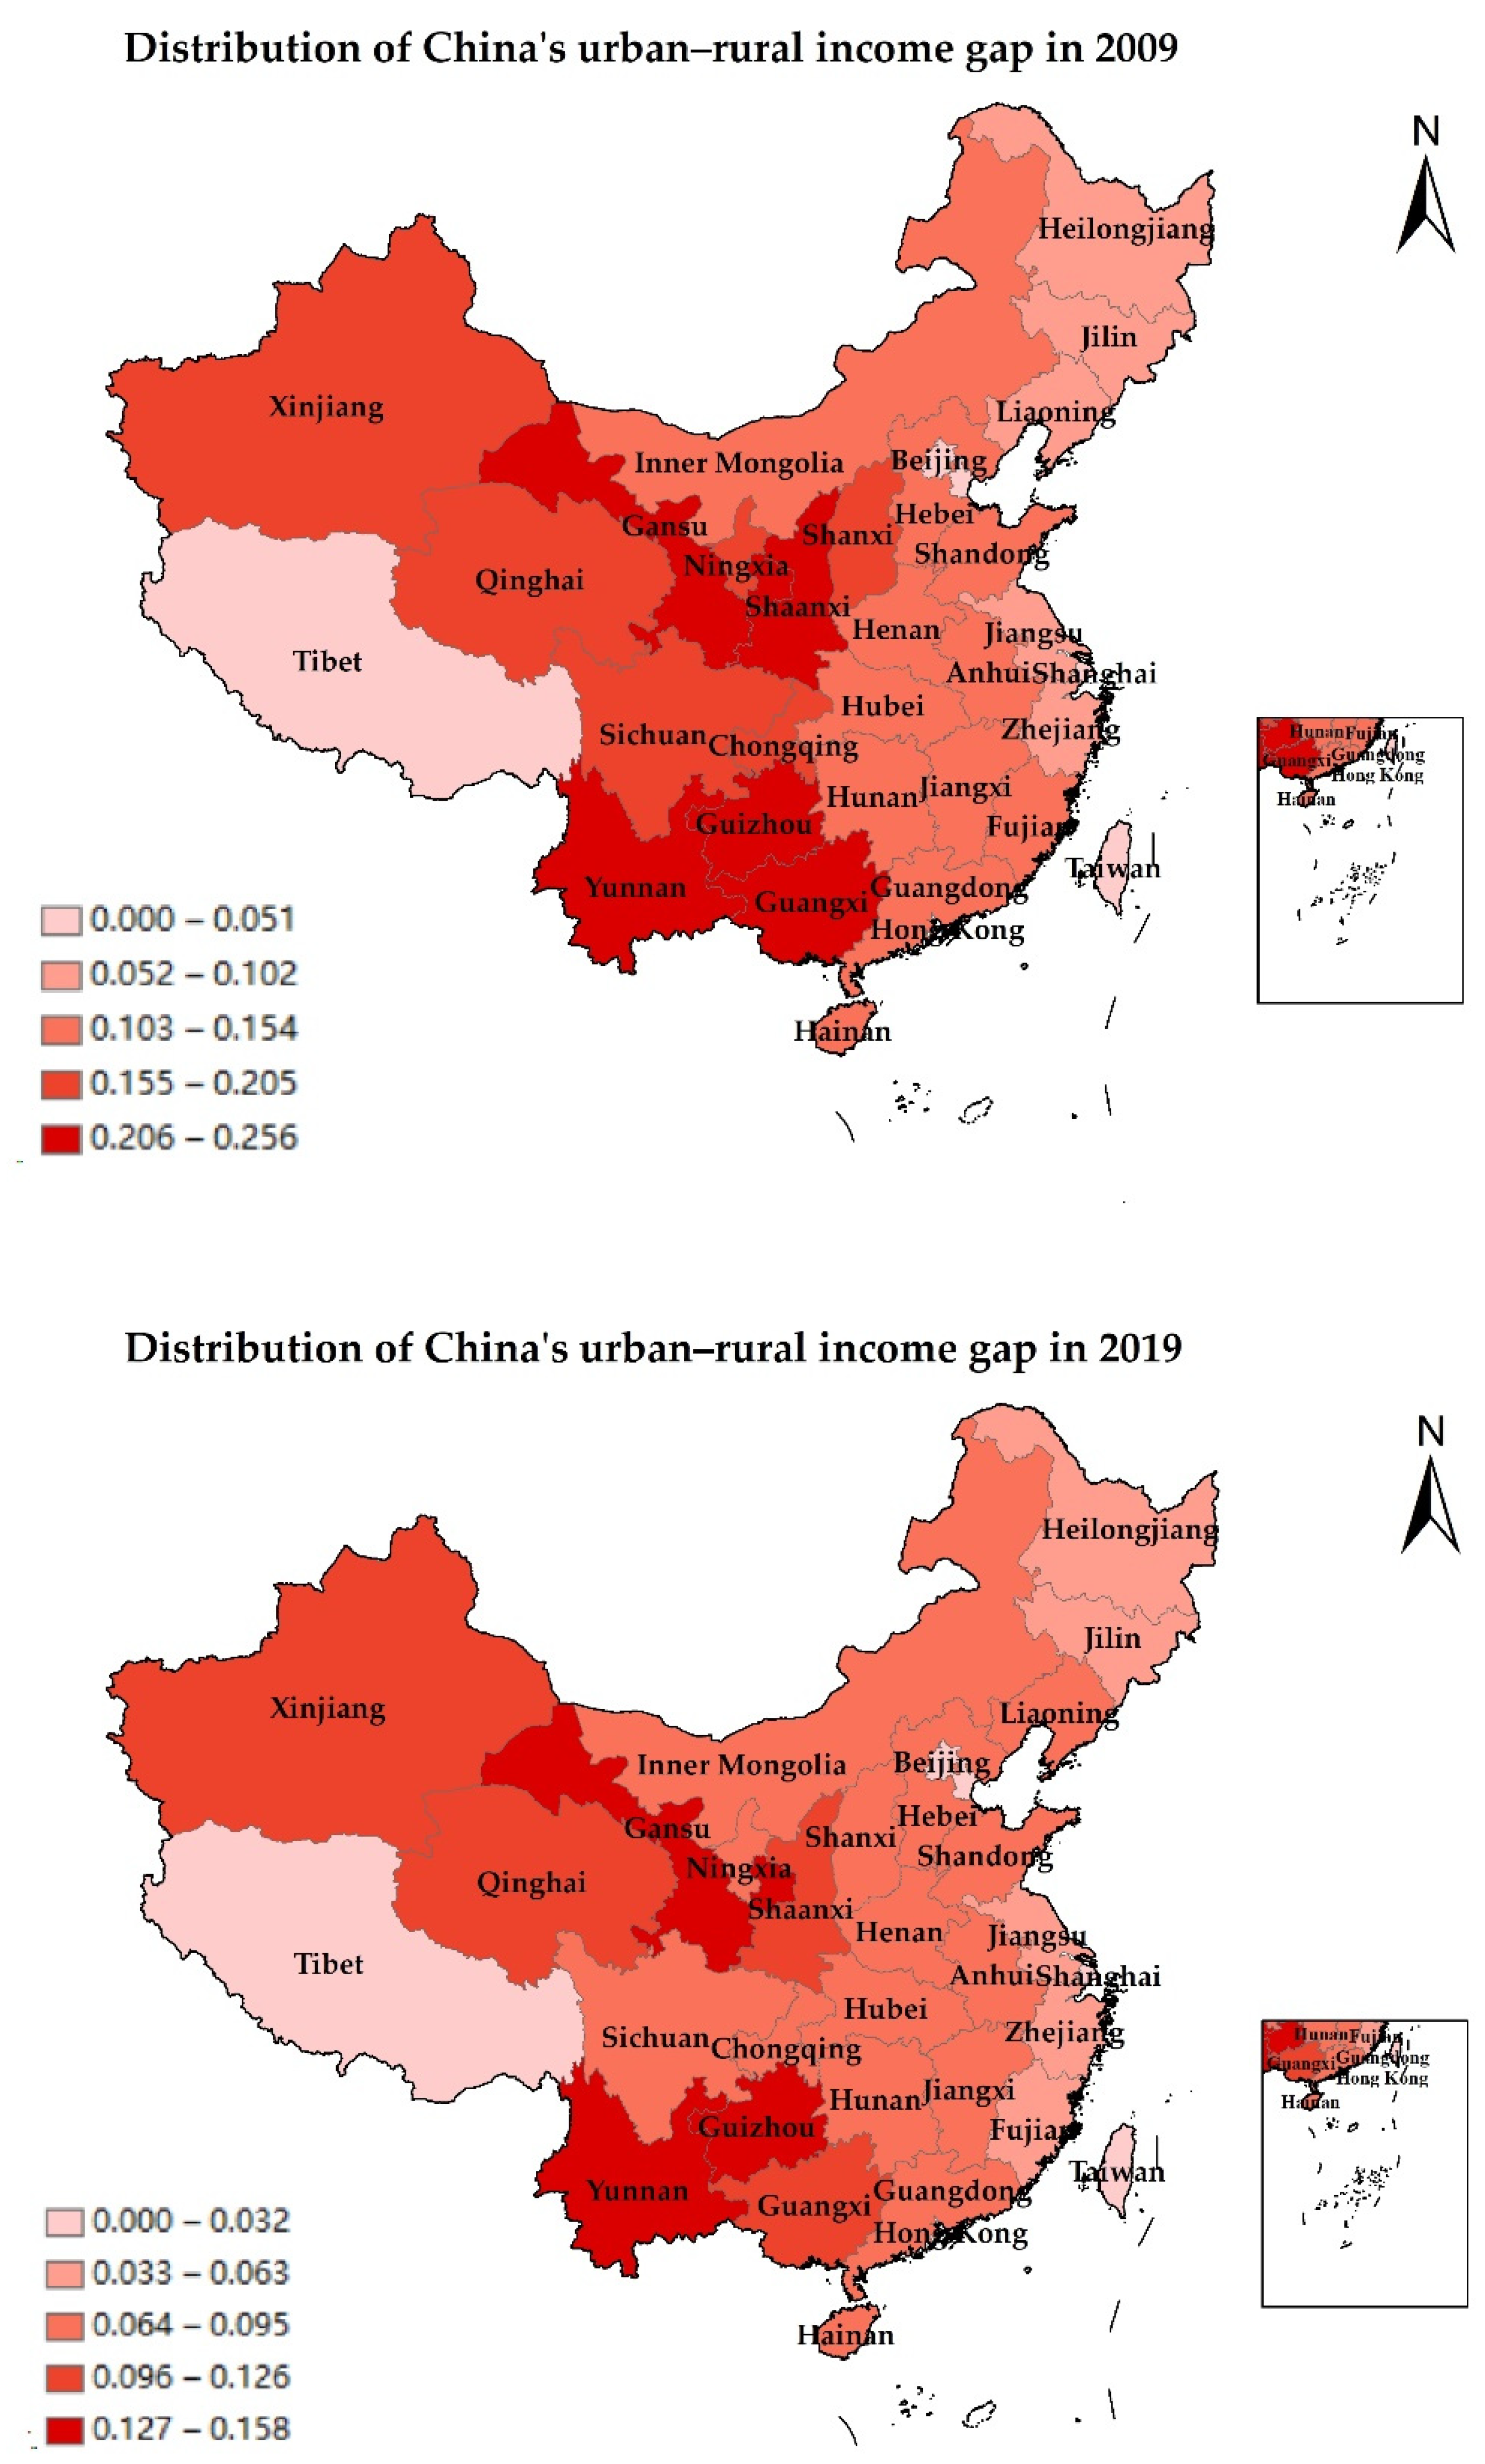
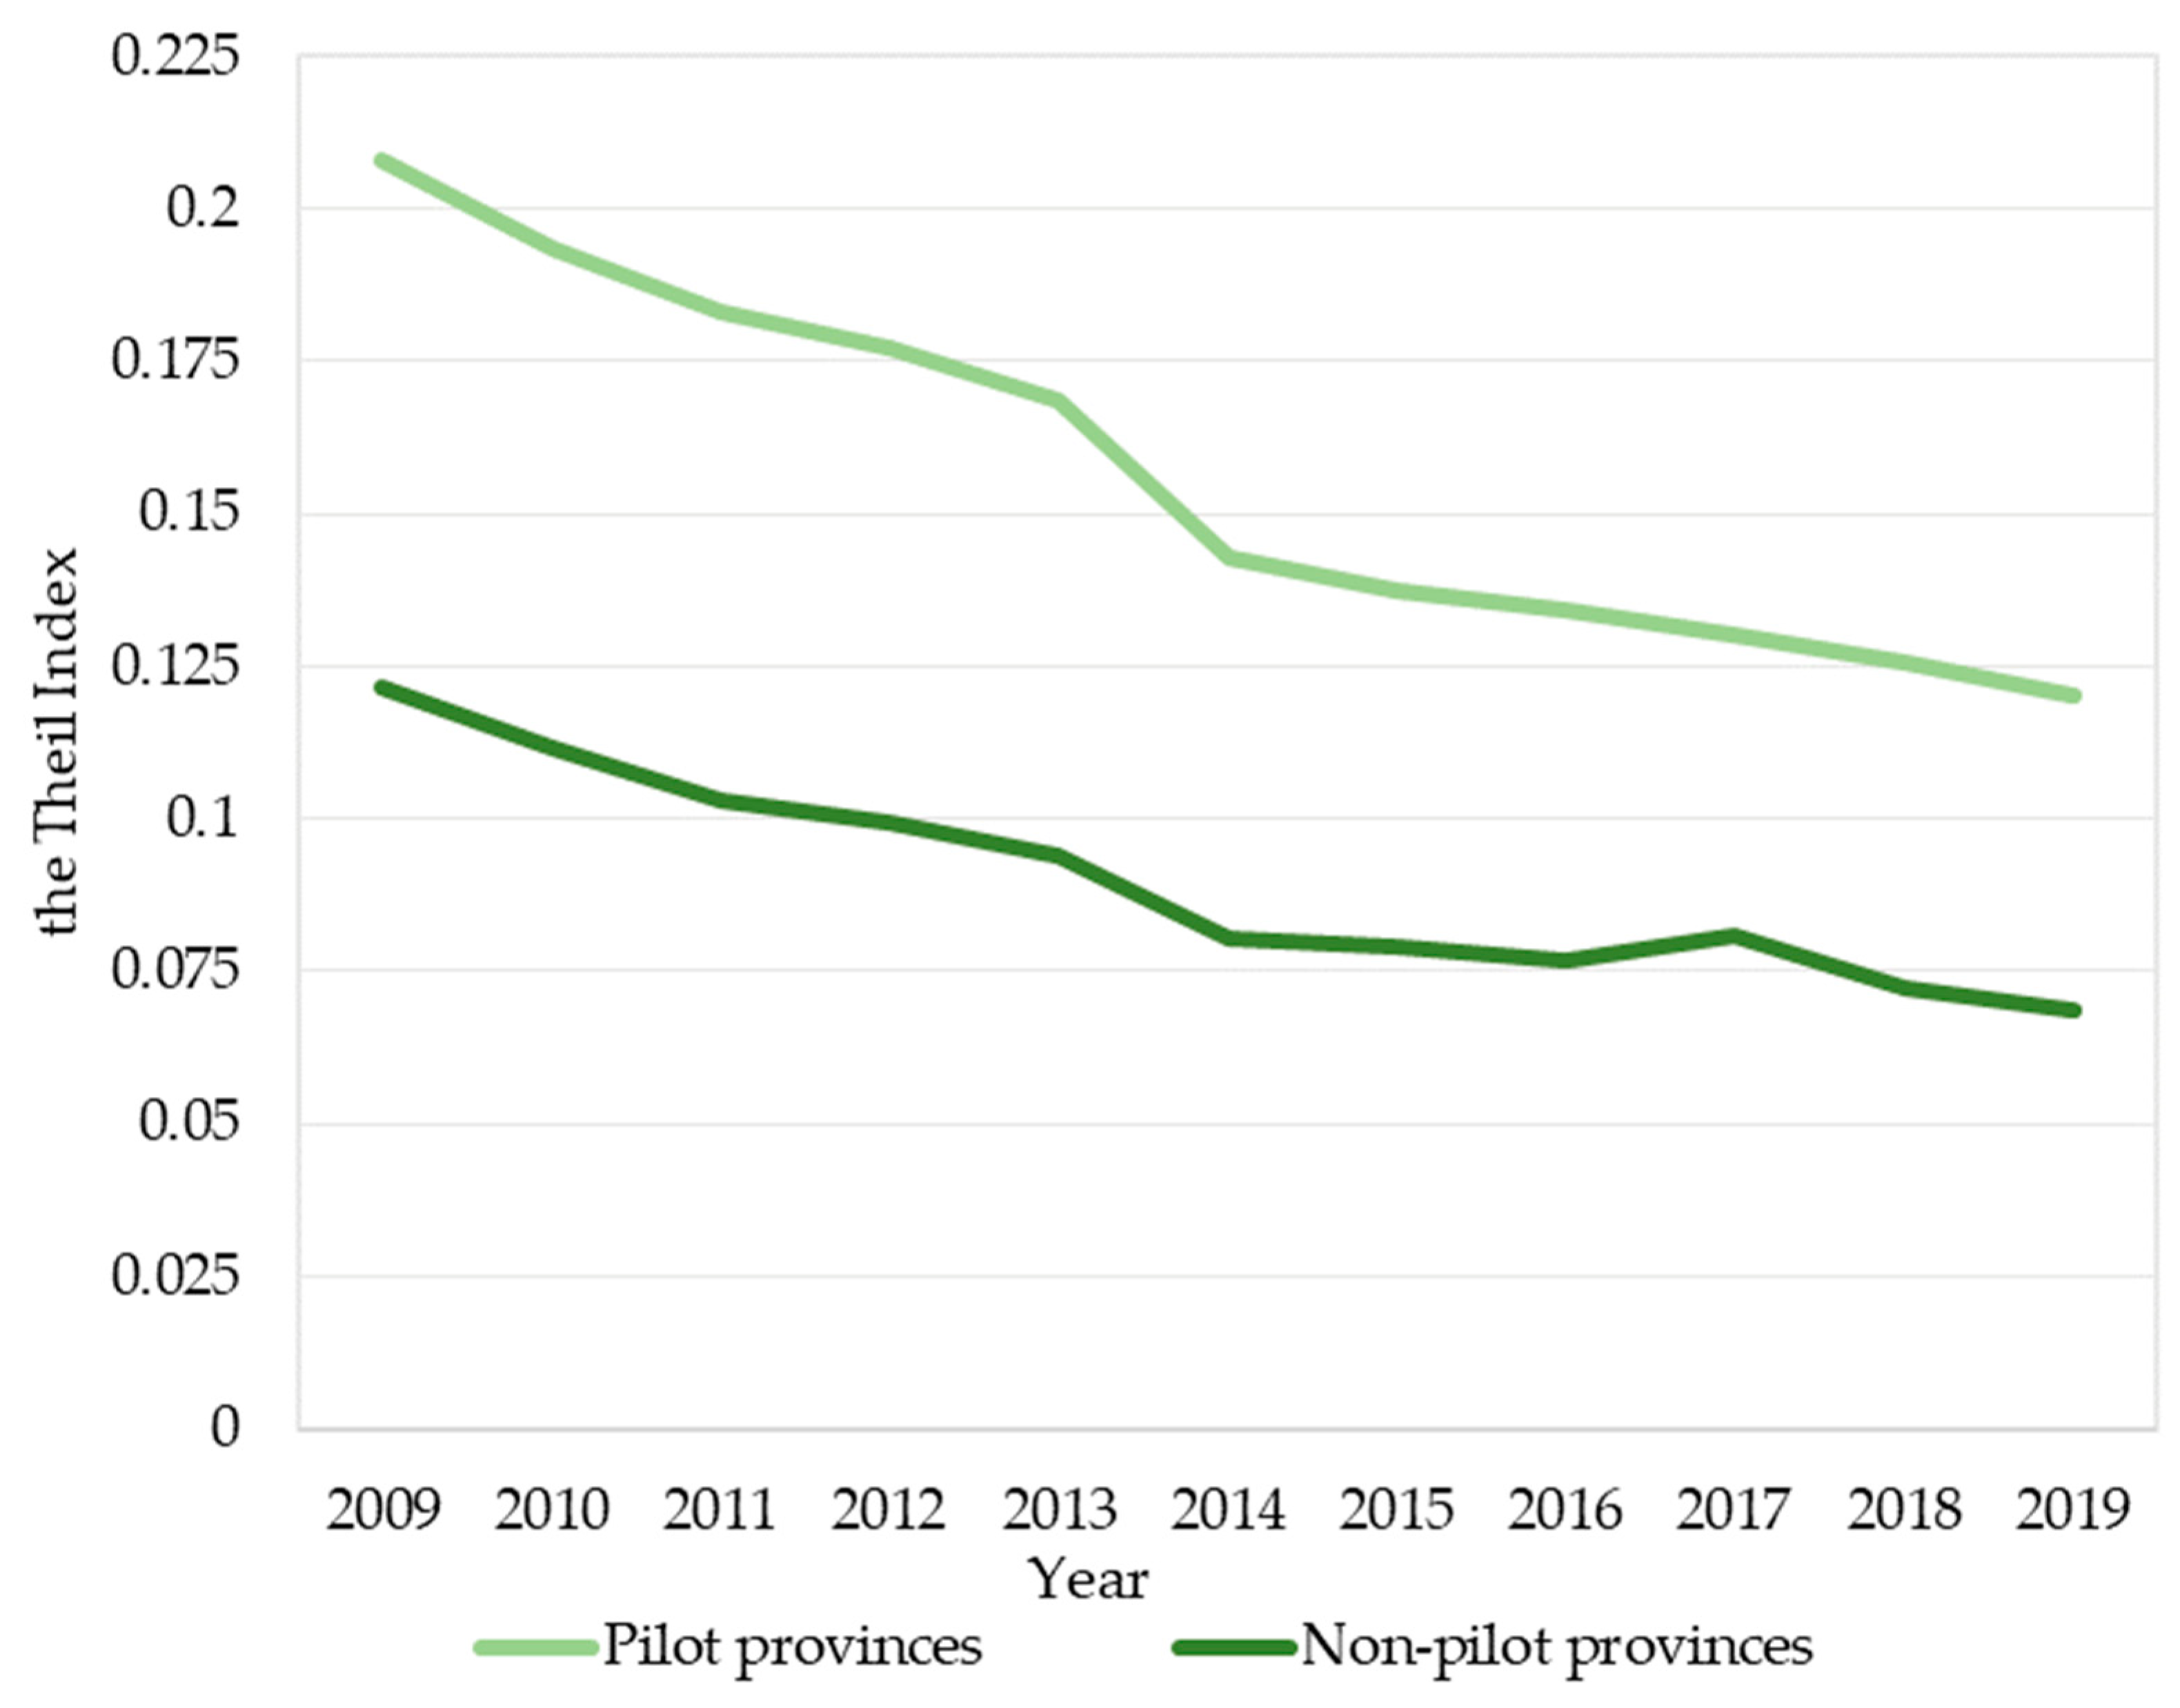
4.1. Reality-Based Analysis

Relevant data indicate that China’s rural per capita disposable income grew at a rate of approximately 7.17% from 2014 to 2019, which was 0.33% faster than GDP growth in the same years, whereas urban per capita disposable income grew at only 6.02% in the same period. This result is largely due to the fact that the initial development of digital technology has had a beneficial effect on the economic acceleration of rural areas. Regarding the popularity and application of the Internet in rural areas, by the end of December 2020, the number of Internet users in rural areas in China had reached 309 million, accounting for 31.3% of the total Internet users in China. The Internet penetration rate has also risen to 55.9%, which indicates that digital technology has been further popularized and applied in rural areas.
To make the empirical analysis closer to reality, this study depicts the changes in the urban–rural income gap between pilot and non-pilot provinces from 2009 to 2019 based on the pilot policy of the “Broadband Rural” strategy in 2014. Since the reform and opening up, the eastern part of China has been developing well under the support of various policy conditions and the advantages of the external environment, whereas the central and western regions have been developing slowly. To strengthen the development of the central and western regions and narrow the development imbalance, many policy documents have been issued in recent years to support the development of the western regions.
The pilot provinces of “Broadband Rural” are concentrated in the central and western regions, and two conclusions can be drawn from Figure 5. First, whether before or after the pilot, the income gap between urban and rural areas in the pilot provinces is still larger than that in the non-pilot provinces. The reason may be that the pilot provinces are all located in the central and western regions. Based on historical and geographical factors, the western region lags behind the eastern region in many aspects such as economy, politics, culture, science, and technology. The inherent gap between the rich and the poor is large, and it is difficult to bridge it in the short term, leading to the above phenomenon. Second, by observing the changing trend of urban and rural incomes of the pilot and non-pilot provinces, after the implementation of the pilot policy in 2014, the change in the urban–rural income gap in the pilot provinces is greater than that in the non-pilot provinces. It is speculated that at the current stage in China, the “Broadband Rural” pilot project can drive rural economic development and alleviate the imbalance between urban and rural development.

4.2. Analysis of the Benchmark Estimation Results

To verify whether the digital economy has a “U-shaped” relationship of “first suppressing and then expanding” with the income gap between urban and rural areas, this study conducts an empirical test, and the results are presented in Table 3. Model (1) is the regression result without adding control variables. The digital economy development coefficient is negative at the 0.1% significance level, indicating that the development of the digital economy plays an inhibitory role in the urban–rural income gap. After the control variable is added, the benchmark regression result is still significantly negative, as presented in column (2). Models (3) and (4) present the results of adding no control variable and adding control variables after adding the square term of the digital economic development index, respectively. According to the data in the table, the digital economy development index in both cases is significantly negative at the 0.1% level, whereas the square term is significantly positive at the 0.1% level, which means that in the primary stage of digital economy development, the income gap between urban and rural areas is significantly narrow. This is because the cross-space–time communication characteristic of the digital economy bridges the physical barrier between urban and rural areas, and production factors can be transferred between urban and rural areas. It has promoted coordinated development among regions and injected new vitality into rural economic development. The “digital dividend” has brought remarkable results. When the digital economy develops to a higher stage, due to the inherent “urban–rural dual structure,” the development of urban–rural integration is restricted, which easily aggravates the unbalanced development between agriculture and non-agricultural industries. The “digital gap” problem then becomes more prominent, resulting in the widening of the urban–rural income gap. This study calculates the inflection point of the “U-shaped” curve according to the regression results of Model (4) and finds that the digital economy development index at the inflection point is approximately 0.540. At the current stage of development, the impact of the “digital dividend” is greater than that of the “digital divide,” that is, the digital economy is still at the initial stage of development and has a significant inhibitory effect on the urban–rural income gap. Thus, H1 is supported.

4.3. Spatial Spillover Effects and Regional Heterogeneity Analysis

In this study, the spatial autocorrelation test is first conducted before analyzing the spatial effects by using the Moran index method to measure the spatial effects that exist under the geographic weight matrix, and the results are presented in Table 4. The table indicates that under the geographical weight matrix, Moran’s I of the digital economy development index (IE) and the urban–rural income gap (Theil) are greater than 0 and pass the significance test of 0.1% and 1%. This indicates that the digital economy and the urban–rural income gap in all provinces of China have significant spatial autocorrelation characteristics.
In Table 4, this study takes 2009 and 2019 as examples to measure the Moran index. The results reveal that the Moran index of the digital economy development level is significantly positive, verifying the spatial interaction characteristics of digital economy development. The Moran index of urban–rural income gap in 2009 and 2019 is also significantly positive at the level of 0.1%, and the performance characteristics of spatial agglomeration are similar to those of the digital economy.
This study uses the spatial Dobbin model, spatial lag model, and spatial error model to explore the spatial spillover effect of digital economic development on the urban–rural income gap. The specific results are shown in Table 5. Under the three spatial panel models, measured based on the geographical matrix, the digital economic development level coefficient is negative and significant at the 0.1% level, whereas the quadratic coefficient of the digital economic development level is significantly positive, which again verifies the “U-shaped” relationship between the digital economy and the urban–rural income gap. To further verify this, after LM and LR tests, this study chooses the spatial Dobbin model to interpret the results. From the direct impact effect, the regression coefficient of the digital economic development index is −0.546, which is significant at the 0.1% level, and the secondary term coefficient is significantly positive, indicating that the “U-shaped” relationship between the two is significant in the region. From the indirect effect, the regression coefficient of the digital economic development index is −2.503, and the square term coefficient is 1.399, which is significantly positive at the 0.1% level. From the perspective of the spillover effect, the W*IE coefficient is −1.393 and passes the significance test of 0.1%, whereas the W*IE2 coefficient is 0.773, which is also significant at the 0.1% level. This dataset fully validates H2 that there is a significant spatial spillover effect between the digital economy and the urban–rural income gap. The reason for this is that the digital economy as an emerging technology has a typical demonstration role, and its strong diffusion characteristics can easily lead to spatial spillovers.
All the above analyses are based on the national level. With the wide application of the digital economy, the qualities of digital technology have changed the traditional urban–rural gap. The factor mobility between urban and rural areas has strengthened the division of labor and collaboration between regions, which has significantly accelerated the urbanization process. However, the level of urbanization development varies greatly from region to region. The eastern coastal areas are economically developed—the industrial base, geographical infrastructure, and marketization level are all high, so their urbanization level is also better than that of the central and western regions. This has led to differences in the “technology dividend” brought by the digital economy in different regions, and the impact of the digital economy on the urban–rural income gap is also heterogeneous. Based on this consideration, the 30 provinces in China, other than Tibet, are divided into three regions according to different urbanization development levels. The analysis results are presented in Table 6. In Models (3) and (9), the east and west regions are significantly negative at the 0.1% and 5% levels, respectively. By comparing the absolute value of the coefficient, we find that the impact on the west region is more obvious. In terms of the squared term of the digital economy development index, only the eastern region passes the significance test, whereas both the central and western regions are insignificant. This result indicates that in areas with the highest level of economic development and the most perfect digital infrastructure construction, there is an obvious “U-shaped” relationship between digital economic development and the urban–rural income gap, whereas in central and western regions, there is no nonlinear relationship. In Models (1), (4), and (7), only the influence relationship between the primary term of the digital economic development index and the urban–rural income gap is explored. It is found that the coefficients are all significantly negative at the 0.1% level, and the absolute magnitude of the coefficients is characterized as “the largest in the west, the second largest in the center, and the smallest in the east.” This is because the eastern region has a higher level of digital technology development and faster development, so it crosses the “U-shaped” curve inflection point early, and the more developed the economy is, the smaller the inherent urban–rural income gap is. Conversely, the less developed regions have their own large urban–rural income gap, and thus, the inhibitory effect of digital economy development on the urban–rural income gap in the western region is even stronger, supporting H3.

4.4. Robustness Tests

To make the results more robust, it is necessary to consider the endogenous problem of the model. Therefore, this study performs robustness tests in two ways:
Hysteresis test: Based on the benchmark regression results in Table 3, the initial stage of digital economy development is conducive to narrowing the urban–rural income gap, while entering the medium- and long-term stage will lead to widening the urban–rural income gap. However, the emergence of this result cannot exclude the impact of endogenous problems. Therefore, this paper chooses to analyze the lag of the digital economy development level in one period and two periods. The results are shown in Column (1) and Column (2) of Table 7. Whether the development level of digital economy lags one or two periods, it is significantly negative at the level of 0.1%, and its quadratic coefficient is significantly positive at the level of 0.1%, which fully indicates that the development level of the digital economy has a U-shaped impact on the urban–rural income gap. Therefore, after considering the endogenous problem, the above regression results are still robust.
Add control variables: As the rapid development of non-agricultural industries in urban areas requires more labor input, and the increase in agricultural labor productivity continues to force a large amount of surplus labor from rural areas to urban non-agricultural industries, this transfer of rural labor between urban and rural areas can provide favorable conditions for narrowing the urban–rural income gap in a short period of time. In addition, the construction of highway infrastructure can reduce the time and space distance between urban and rural areas, reduce the circulation cost, thus contributing to the equalization of factor returns and narrowing the urban–rural income gap. Therefore, this paper adds rural labor transfer (Lm) and road infrastructure construction (Inf) as control variables. The rural labor transfer index is measured by the rural population mobility rate, and the highway infrastructure construction index is measured by the proportion of the area of each province in the highway mileage. The specific inspection results are shown in column (3) of Table 7. The results show that the development level of the digital economy is significantly negative at the level of 0.1%, and its quadratic coefficient is significantly positive at the level of 0.1%, which again verifies the robustness of the benchmark regression results in Table 3.

5. Further Analysis

To alleviate the “digital divide” between urban and rural areas and strengthen the digital infrastructure in rural areas, China has issued a series of relevant policy documents to support the digital development of rural areas. The purpose of the series of policies is to improve the ability of rural residents to apply digital technology and expand the coverage of digital networks for all residents to enjoy the “digital dividend.” This study takes the “Broadband Rural” pilot policy as an exogenous quasi-natural experiment and uses the double difference method to identify the specific mechanism of its effect on the urban–rural income gap. The digital economy is an economic development form with data as the main production factor, and the “Broadband Rural” policy is closely related to it. The content of the “Broadband Rural” policy highlights the advantages of Internet technology. Because of this, the pilot provinces of “Broadband Rural” is used as the experimental group and the remaining provinces as the control group, the specific classification is shown in Table 8. The following difference-in-differences (DID) model is established to further test the impact mechanism:
T h e i l i , t = α 0 + α 1 T r e a t e d i × P o s t t + α 2 X i , t + μ i + ϑ i + ε i , t
In the above equation, treated is the policy dummy variable, that is, the pilot province is 1, and the province without the pilot policy is 0. As a time-virtual variable, post is 0 before 2014 and 1 after 2014. X represents the series control variable. The rest of the variables have the same connotation as those in the equations above.

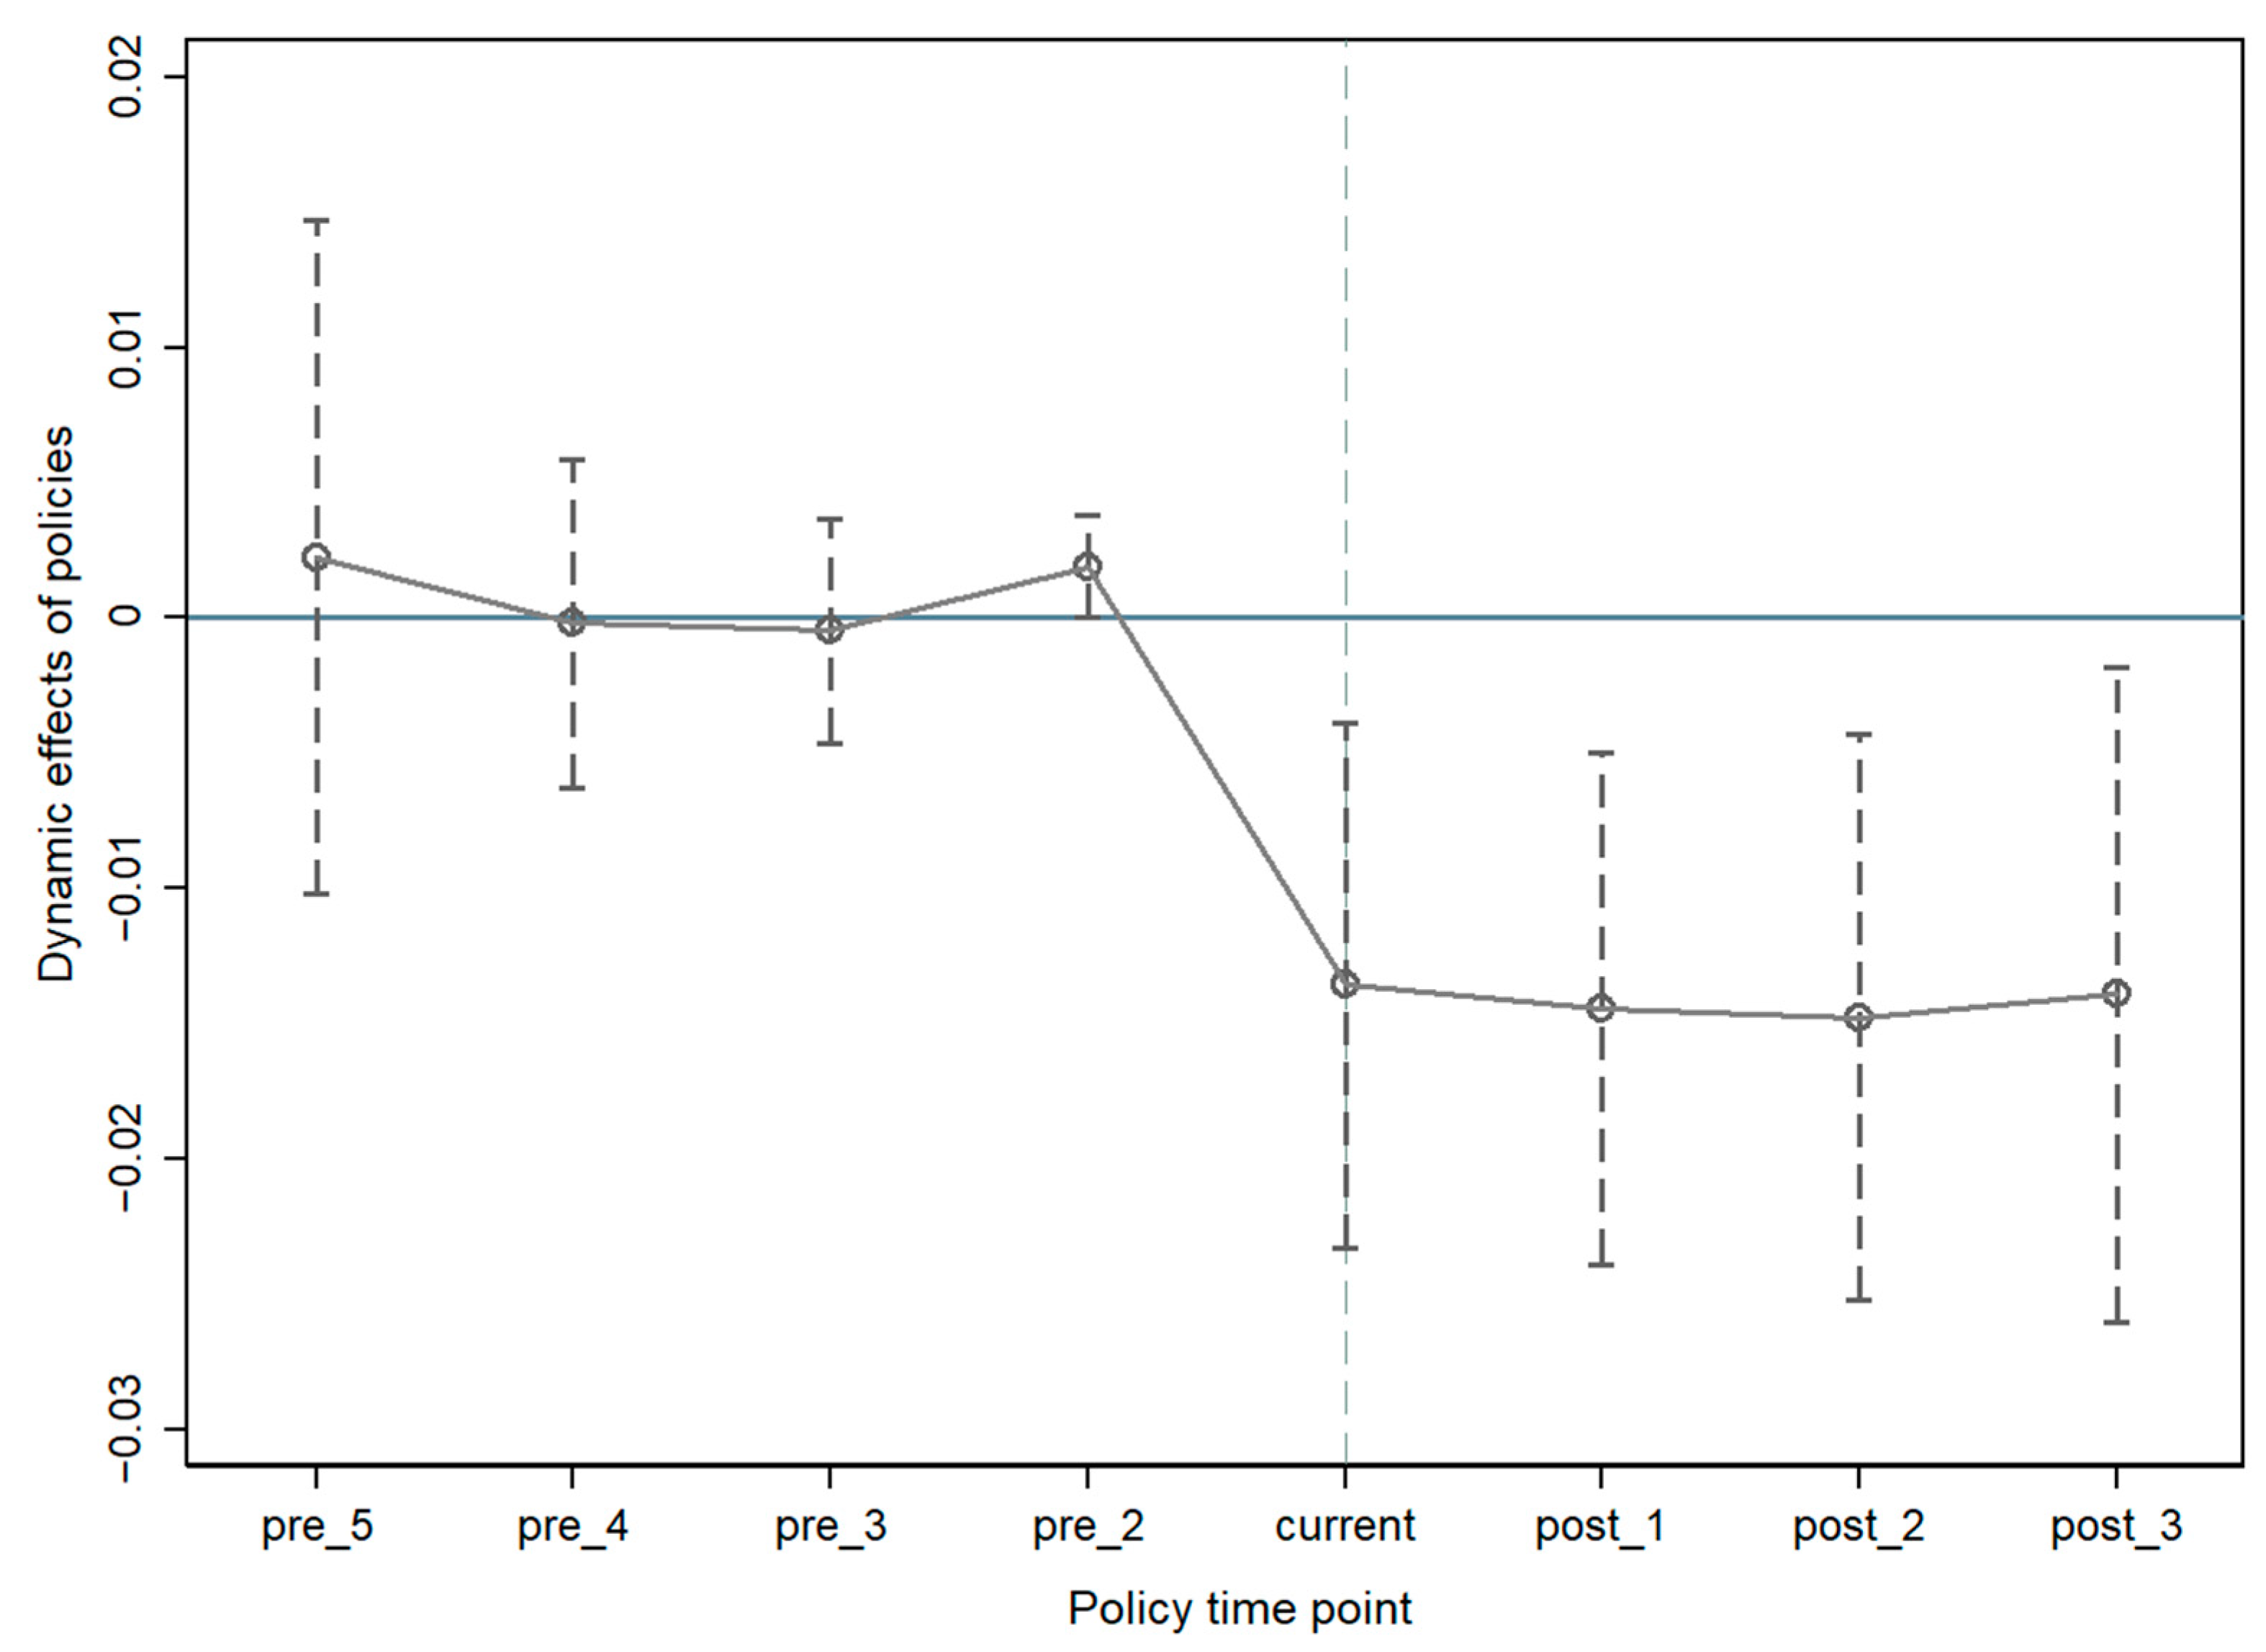
5.1. Parallel Trend Test

The effective use of the double difference method presupposes that the experimental group and the control group have a common trend before the implementation of the policy. Therefore, before conducting the DID test, this study conducted a parallel trend test to verify the effectiveness of the DID method. As shown in Figure 6, the test results showed that before the implementation of the policy in 2014, there was no significant difference between the control group and the experimental group in terms of dependent variables after excluding other control variables from the policy. After the implementation of the policy, there is no intersection between the dotted line and the 0 axis, which means that the experimental group and the control group exclude other control variables other than the policy and have a significant difference to the dependent variable. It is the pilot policy factors that cause this significant difference change. From the perspective of the policy’s dynamic effect, after the implementation of the pilot policy of “Broadband Rural”, the estimated value is significantly negative, which fully shows that the pilot policy has a significant impact on narrowing the urban–rural income gap. Therefore, it satisfies the parallel trend test and can be followed up using the DID method.

5.2. Baseline Return

Table 9 reports the results of the benchmark regression between the “Broadband Rural” policy and the urban–rural income gap. Model (1) does not include control variables, and Model (2) is the test result after adding control variables. The results in the table indicate that the pilot policy dummy variables all pass the 0.1% significance test, which fully proves that the “Broadband Rural” policy pilot helps to narrow the urban–rural digital divide and bridges the widening urban–rural income gap. The reason may be that the network infrastructure with broadband construction as the core enables the rapid dissemination of information, and the digital gap with access as its typical feature is occurring. Further, the cost of information exchange has significantly reduced, and data resources can be shared and exchanged among different regions. Rural areas make production decisions with the help of data transmission, which greatly reduces production costs and improves the overall income level of rural areas. The application and income gaps have been gradually bridged, and the income gap between urban and rural areas has been narrowed, alleviating the unbalanced development between regions.

5.3. Placebo Test

Whether the impact of the “Broadband Rural” pilot project is caused by some random factors is yet to be confirmed, and this study analyzes it through counterfactual tests. As a commonly used method of policy evaluation, the mechanism of action is that estimating a counterfactual policy variable does not produce a corresponding policy effect. In this study, data from 2009 to 2014 are used for the estimation. It is assumed that the pilot policies were implemented in 2010, 2011, and 2012. The results are presented in Table 10. According to the counterfactual test results, whether the policy advanced to 2010, 2011, or 2012, the results are not significant. This means that the pilot policy in 2014 has not been affected by the non-pilot policy in reducing the urban–rural income gap, which further confirms that the pilot policy of “Broadband Rural” can gradually bridge the digital gap between urban and rural areas.

6. Conclusions and Policy Recommendations

6.1. Research Findings

Based on the theoretical mechanism analysis, this study uses the provincial panel data of China from 2009 to 2019 to conduct an empirical test and fully discusses the impact of the development of the digital economy on the income gap between urban and rural areas in China. The results of the study reveal that, first, there is a significant “U-shaped” relationship between the digital economy and the urban–rural income gap. Second, there are obvious spatial correlation and spatial spillover between the digital economy and the urban–rural income gap. The development of the digital economy in adjacent areas has an impact on the urban–rural income gap in a region. Third, considering the different urbanization levels of different regions in China, the degree of the promotion of digital construction is also different. Therefore, regional heterogeneity is included in the model for testing. The results of the study reveal that the impact of digital economy development on the urban–rural income gap is stronger in the western region, and the intensity of the impact is generally characterized by a trapezoidal distribution of “strongest in the west, second strongest in the center, and weakest in the east.” Fourth, we employ the construction of “Broadband Rural” as an exogenous impact variable to build a DID model to explore its impact on the urban–rural income gap. The results indicate that it has a significant inhibitory effect on the urban–rural income gap. The “Broadband Rural” pilot project enables rural areas to achieve a leapfrog development of information and communication facilities, improve the application ability of digital technology in rural areas, and effectively reduce the digital divide between urban and rural areas. After promoting the pilot policy, the urban–rural income gap in the pilot provinces changed significantly more than that in the non-pilot provinces. This means that the construction of “Broadband Rural” has helped to narrow the income gap between urban and rural areas.

6.2. Policy Recommendations

By analyzing the above theoretical mechanism and empirical results, the following countermeasures are proposed to achieve the goal of poverty eradication, narrowing the urban–rural gap and achieving integrated development.
First, the government should strengthen agricultural technology innovation and promote the digital transformation of the agricultural sector. The existence of the digital divide has seriously hindered the process of urban–rural integration, so it is urgent to strengthen technological innovation and create new demand. For example, rural residents should be encouraged to start businesses through e-commerce, integrate agricultural production and digital technology, and conduct digital transformation of the primary industry. The government should increase technological research and development in the agricultural sector, enhance the innovation vitality of the agricultural sector, accurately connect intelligent technologies, and cultivate new production chains. Furthermore, it should vigorously develop rural education and enhance the competitiveness of human capital in rural areas.
Second, government departments should introduce appropriate policies to break down the obstacles to labor mobility. For example, they should promote the reform of the registered residence system and make the rural population transfer more citizens to eliminate the inequality between urban and rural employees caused by the difference in registered residence. To solve the problem of urban orientation, the government should provide medical, education, and other public welfare projects to enable the transferred population to enjoy the same treatment as urban residents and protect their basic rights. Lower the threshold for population settlement and guide the orderly transformation of the rural migrant population living in urban areas into urban residents.
Third, the government should pay attention to regional development differences and promote digital construction according to local conditions. When promoting the digital development process, it is necessary to promote the construction project according to the development status and existing conditions of various places. The eastern region of China has a large number of high-tech talents and advanced infrastructure, and its economic development level is ahead of that of the central and western regions. The region should make full use of its advantages to give play to the radiation and demonstration effects. Compared with the eastern region, the central and western regions have backward development of emerging industries, a large proportion of traditional industries, and too weak market players. Therefore, for the central and western regions, the government should reasonably use relevant policies to guide the inflow of resource elements to alleviate the gap in resource allocation.
Fourth, it should strengthen the construction of digital infrastructure in rural areas and promote the pilot project of “Broadband Rural.” The government can reduce the cost of broadband construction in rural areas by providing financial subsidies and introducing tax preferential policies. The Internet penetration rate, the ratio of township-to-township optical cables, and the broadband coverage rate should be turned into important indicators of government performance assessment and included in the assessment scope of grassroots government department leaders.
Fifth, improve the digital skills of rural residents and eliminate the “urban-rural use difference” of the digital divide. The government should strengthen the inclusiveness of digital economy development and strengthen the training of rural residents’ digital skills and digital thinking. At the same time, the government encourages entrepreneurship in rural areas based on digital technology through subsidies, tax incentives, attract young and middle-aged rural labor to return, thus bridging the digital divide between urban and rural areas, and promoting the sustainable improvement of rural residents’ income from digital economy development.

6.3. Limitations

This study discusses the “U-shaped” impact of the digital economy on the urban–rural income gap and tests the heterogeneity of eastern, central, and western regions of China based on the different urbanization processes. Through analysis and summary, it provides countermeasures and suggestions for narrowing the urban–rural income gap and promoting the development of urban–rural integration. However, there are still three limitations of the study.
First, the measurement of the development level of the digital economy in this study may not be perfect. At present, there is no perfect and mature system to measure the development level of the digital economy, and the indicators adopted by various scholars are also different. This study mainly draws on existing literature to measure four dimensions—digital foundation, application capability, industrial support, and development capability—which may not contain sufficiently refined indicators. Second, the sample data used in this study are at the provincial level. However, the data at the prefecture level are more detailed and representative. The data at the prefecture level can be further analyzed as samples in the future. Third, many factors affect the urban–rural income gap, but this study cannot explain all the influencing factors. The selection of control variables cannot be comprehensive, and some influencing factors may be omitted. For example, considering the possible influence of government behavior, the next step of research can try to test the government fiscal expenditure as a control variable.

Author Contributions

Conceptualization, Q.J.; data curation, Q.J. and Y.L.; formal analysis, Y.L.; investigation, Y.L. and H.S.; writing—original draft, Y.L.; writing—review and editing, H.S. All authors have read and agreed to the published version of the manuscript.

Funding

This work was sponsored by the Natural Science Foundation of Shandong Province, China (Grant number: ZR2021MG004) and the Youth Entrepreneurship Talent Introduction and Education Team of Colleges and Universities in Shandong Province, China.

Data Availability Statement

All supporting data can be found on the NBS website (http://www.stats.gov.cn/tjsj/ (accessed on 15 June 2022)), the China Statistical Yearbook, and the China Statistical Abstract.

Acknowledgments

The authors are grateful to the National Statistics Office for providing the data and the editors and anonymous reviewers for their comments and suggestions.

Conflicts of Interest

The authors declare no conflict of interest.

References

  1. Deng, Q.; Li, E.; Yang, Y. Politics, policies and rural poverty alleviation outcomes: Evidence from Lankao County, China. Habitat Int. 2022, 127, 102631. [Google Scholar] [CrossRef]
  2. Khan, A.A.; Khan, S.U.; Fahad, S.; Ali, M.A.S.; Khan, A.; Luo, J. Microfinance and poverty reduction: New evidence from Pakistan. Int. J. Financ. Econ. 2021, 26, 4723–4733. [Google Scholar] [CrossRef]
  3. Xiao, H.; Zheng, X.; Xie, L. Promoting pro-poor growth through infrastructure investment: Evidence from the targeted poverty alleviation program in China. China Econ. 2022, 71, 101729. [Google Scholar] [CrossRef]
  4. Tang, L.; Sun, S. Fiscal incentives, financial support for agriculture, and urban-rural inequality. Int. Rev. Financ. Anal. 2022, 80, 102057. [Google Scholar] [CrossRef]
  5. Yao, Y.; Li, J. Urbanization forces driving rural urban income disparity: Evidence from metropolitan areas in China. J. Clean. Prod. 2021, 8, 312. [Google Scholar] [CrossRef]
  6. Zhao, H.; Zheng, X.; Yang, L. Does Digital Inclusive Finance Narrow the Urban-Rural Income Gap through Primary Distribution and Redistribution? Sustainability 2022, 14, 2120. [Google Scholar] [CrossRef]
  7. Zhong, S.; Wang, M.; Zhu, Y.; Chen, Z.; Huang, X. Urban expansion and the urban–rural income gap: Empirical evidence from China. Cities 2022, 129, 103831. [Google Scholar] [CrossRef]
  8. Leng, X. Digital revolution and rural family income: Evidence from China. J. Rural Stud. 2022, 94, 336–343. [Google Scholar] [CrossRef]
  9. Liao, S.C.; Chou, T.C.; Huang, C.H. Revisiting the development trajectory of the digital divide: A main path analysis approach. Technol. Forecast. Soc. Chang. 2022, 179, 121607. [Google Scholar] [CrossRef]
  10. Robinson, L.; Schulz, J.; Dodel, M.; Correa, T.; Villanueva-Mansilla, E.; Leal, S.; Magallanes-Blanco, C.; Rodriguez-Medina, L.; Dunn, H.; Levine, L.; et al. Digital Inequalities 2.0: Legacy Inequalities in the Information Age; University of Illinois at Chicago Library: Chicago, IL, USA, 2020. [Google Scholar]
  11. Yang, Y.; de Sherbinin, A.; Liu, Y. China’s poverty alleviation resettlement: Progress, problems and solutions. Habitat Int. 2020, 98, 102135. [Google Scholar] [CrossRef]
  12. Parker, E.B. Closing the digital divide in rural America. Telecommun. Policy 2011, 24, 281–290. [Google Scholar] [CrossRef] [Green Version]
  13. Zheng, Y.; Zhu, T.; Wei, J.I.A. Does Internet use promote the adoption of agricultural technology? Evidence from 1 449 farm households in 14 Chinese provinces. J. Integr. Agric. 2022, 21, 282–292. [Google Scholar] [CrossRef]
  14. Khan, N.; Ray, R.L.; Zhang, S.; Osabuohien, E.; Ihtisham, M. Influence of mobile phone and internet technology on income of rural farmers: Evidence from Khyber Pakhtunkhwa Province, Pakistan. Technol. Soc. 2022, 68, 101866. [Google Scholar] [CrossRef]
  15. Ahvenniemi, H.; Huovila, A.; Pinto-Sepp, I.; Airaksinen, M. What are the differences between sustainable and smart cities? Cities 2017, 60, 234–245. [Google Scholar] [CrossRef]
  16. Prieger, J.E. The Brzadband Digital Divide and the Economic Benefits of Mobile Broadband for Rural Areas. Telecommun. Policy 2013, 37, 483–502. [Google Scholar] [CrossRef] [Green Version]
  17. Jackson, M.O.; Kanik, Z. How Automation That Substitutes for Labor Affects Production Networks, Growth, and Income Inequality; Social Science Electronic Publishing: New York, NY, USA, 2019. [Google Scholar]
  18. Su, C.W.; Yuan, X.; Umar, M.; Lobonţ, O.R. Does technological innovation bring destruction or creation to the labor market? Technol. Soc. 2022, 68, 101905. [Google Scholar] [CrossRef]
  19. Wang, J.; Hu, Y.; Zhang, Z. Skill-biased technological change and labor market polarization in China. Econ. Model. 2021, 100, 105507. [Google Scholar] [CrossRef]
  20. Wu, B.; Yang, W. Empirical Test of the Impact of the Digital Economy on China’s Employment Structure. Financ. Res. Lett. 2022, 49, 103047. [Google Scholar] [CrossRef]
  21. Huaping, G.; Binhua, G. Digital Economy and Demand Structure of Skilled Talents—Analysis based on the perspective of vertical technological innovation. Telemat. Inform. Rep. 2022, 7, 100010. [Google Scholar] [CrossRef]
  22. Yang, Q.; Ma, H.; Wang, Y.; Lin, L. Research on the influence mechanism of the digital economy on regional sustainable development. Procedia Comput. Sci. 2022, 202, 178–183. [Google Scholar] [CrossRef]
  23. Guan, X.; Wei, H.; Lu, S.; Dai, Q.; Su, H. Assessment on the urbanization strategy in China: Achievements, challenges and reflections. Habitat Int. 2018, 71, 97–109. [Google Scholar] [CrossRef]
  24. Wang, X.; Shao, S.; Li, L. Agricultural inputs, urbanization, and urban-rural income disparity: Evidence from China. China Econ. 2019, 55, 67–84. [Google Scholar] [CrossRef]
  25. Kolade, O.; Owoseni, A. Employment 5.0: The work of the future and the future of work. Technol. Soc. 2022, 71, 102086. [Google Scholar] [CrossRef]
  26. Soldatos, J.; Kefalakis, N.; Despotopoulou, A.M.; Bodin, U.; Musumeci, A.; Scandura, A.; Aliprandi, C.; Arabsolgar, D.; Colledani, M. A digital platform for cross-sector collaborative value networks in the circular economy. Procedia Manuf. 2021, 54, 64–69. [Google Scholar] [CrossRef]
  27. Shen, Z.; Wang, S.; Boussemart, J.P.; Hao, Y. Digital transition and green growth in Chinese agriculture. Technol. Forecast. Soc. Chang. 2022, 181, 121742. [Google Scholar] [CrossRef]
  28. Couture, V.; Faber, B.; Gu, Y.; Liu, L. Connecting the Countryside via E-Commerce: Evidence from China. Am. Econ. Rev. Insights 2021, 3, 35–50. [Google Scholar] [CrossRef]
  29. Tang, W.; Zhu, J. Informality and rural industry: Rethinking the impacts of E-Commerce on rural development in China. J. Rural Stud. 2020, 75, 20–29. [Google Scholar] [CrossRef]
  30. Buchi, M.; Just, N.; Latzer, M. Modeling the second-level digital divide: A five-country study of social differences in Internet use. New Media Soc. 2015, 18, 2703–2722. [Google Scholar] [CrossRef]
  31. Morris, J.; Morris, W.; Bowen, R. Implications of the digital divide on rural SME resilience. J. Rural Stud. 2022, 89, 369–377. [Google Scholar] [CrossRef]
  32. Deursen, A.V.; Helsper, E.J. The Third-Level Digital Divide: Who Benefits Most from Being Online? Stud. Media Commun. 2015, 10, 30–52. [Google Scholar]
  33. Chao, P.; Biao, M.A.; Zhang, C. Poverty alleviation through e-commerce: Village involvement and demonstration policies in rural China. J. Integr. Agric. 2021, 20, 998–1011. [Google Scholar]
  34. Ghazy, N.; Ghoneim, H.; Lang, G. Entrepreneurship, productivity and digitalization: Evidence from the EU. Technol. Soc. 2022, 70, 102052. [Google Scholar] [CrossRef]
  35. Jiang, S.; Zhou, J.; Qiu, S. Digital Agriculture and Urbanization: Mechanism and Empirical Research. Technol. Forecast. Soc. Chang. 2022, 180, 121724. [Google Scholar] [CrossRef]
  36. Liu, Z.; Liu, J.; Osmani, M. Integration of Digital Economy and Circular Economy: Current Status and Future Directions. Sustainability 2021, 13, 7217. [Google Scholar] [CrossRef]
  37. Zhang, X.; Wan, G.H.; Zhang, J.J.; He, Z.Y. Digital economy, financial inclusion, and inclusive growth. Econ. Res. 2019, 8, 72–85. [Google Scholar]
  38. Li, X.; Li, J. Research on the impact of digital economy development on urban-rural income gap. Agric. Technol. Econ. 2022, 2, 17. [Google Scholar]
  39. Yuan, Y.A.; Mw, B.; Yi, Z.A.; Huang, X.; Xiong, X. Urbanization’s effects on the urban-rural income gap in China: A meta-regression analysis. Land Use Policy 2020, 99, 104995. [Google Scholar] [CrossRef]
  40. Li, X.; Guo, H.; Jin, S.; Ma, W.; Zeng, Y. Do farmers gain internet dividends from E-commerce adoption? Evidence from China. Food Policy 2021, 3, 102024. [Google Scholar] [CrossRef]
  41. Tang, J.; Gong, J.; Ma, W.; Rahut, D.B. Narrowing urban–rural income gap in China: The role of the targeted poverty alleviation program. Econ. Anal. Policy 2022, 75, 74–90. [Google Scholar] [CrossRef]
  42. Wang, M.; Xu, M.; Ma, S. The effect of the spatial heterogeneity of human capital structure on regional green total factor productivity. Struct. Change Econ. Dyn. 2021, 59, 427–441. [Google Scholar] [CrossRef]
  43. Bai, Y.; Zhang, L.; Sun, M.; Xu, X.-B. Status and path of intergenerational transmission of poverty in rural China: A human capital investment perspective. J. Integr. Agric. 2021, 20, 1080–1091. [Google Scholar] [CrossRef]
  44. Lee, N.; Clarke, S. Do low-skilled workers gain from high-tech employment growth? High-technology multipliers, employment and wages in Britain. Res. Policy 2019, 48, 103803. [Google Scholar] [CrossRef]
  45. Wolcott, E.L. Employment inequality: Why do the low-skilled work less now? J. Monet. Econ. 2021, 118, 161–177. [Google Scholar] [CrossRef]
Figure 1. Per capita disposable income in urban and rural areas of China from 2009 to 2020. Note: Data from China Statistical Yearbook.
Land 11 01980 g001
Figure 2. The path of the impact of the digital economy on the income gap between urban and rural areas.
Land 11 01980 g002
Figure 3. Comprehensive Index of the Level of Digital Economy Development of China’s Provinces in 2009 and 2019. Note: The original data was obtained from China Statistical Yearbook, China Information Yearbook, China Information Society Development Report, China Electronic Information Industry Yearbook, and China Science and Technology Statistical Yearbook and later measured.
Land 11 01980 g003aLand 11 01980 g003b
Figure 4. Composite Index of Urban–Rural Income Gap between Provinces in China for 2009 and 2019.
Land 11 01980 g004
Figure 5. The trend of the urban–rural income gap between pilot and non-pilot provinces. Note: Derived from independent calculations.
Land 11 01980 g005
Figure 6. Parallel Trend Charts.
Land 11 01980 g006
Table 1. Variable selection.
Variable TypeVariable NameVariable Symbols
Explained VariablesUrban and Rural Income Theil IndexTheil
Core Explanatory VariablesDigital Economy Development IndexIE
Control VariablesIndustrial Structure Development LevelInstr
Human Capital LevelHc
Government Financial SpendingGfi
Urbanization LevelUr
Table 2. Descriptive statistics of the variables.
VariablesSample SizeAverage ValueStandard DeviationMinimum ValueMaximum Value
Explained VariablesTheil3300.10307340.04874460.01952860.2559128
Core Explanatory VariablesIE3300.36507020.16505250.10.9659019
Control VariablesInstr33055.315268.60874940.9545783.84265
Hc3309.0347380.94343256.76394612.68113
Gfi3302427.9861011.165964.01026283.552
Ur3300.56414420.12763940.29890.896
Table 3. Baseline regression results.
(1)(2)(3)(4)
VariablesTheilTheilTheilTheil
IE−0.207 ***
(0.0120)
−0.0504 ***
(0.0122)
−0.393 ***
(0.0444)
−0.242 ***
(0.0326)
IE2 0.216 ***
(0.0418)
0.224 ***
(0.0310)
Instr 0.000237
(0.000249)
0.0000898
(0.000225)
Hc −0.00708 *
(0.00342)
−0.00943 **
(0.00304)
Gfi 0.00000900 ***
(0.00000120)
0.00001000 ***
(0.00000122)
Ur −0.210 ***
(0.0234)
−0.189 ***
(0.0221)
_cons0.179 ***
(0.00531)
0.269 ***
(0.0182)
0.212 ***
(0.0102)
0.318 ***
(0.0178)
ProvinceYESYESYESYES
YearYESYESYESYES
N330330330330
R20.4920.7670.5210.797
Note: *, **, *** mean significant at the 5%, 1%, and 0.1% levels, and the values in parentheses are clustering robust standard errors.
Table 4. Digital economy and the urban–rural income gap Moran index (2009–2019).
YearIETheil
Moran’s IZ ValueMoran’s IZ Value
20090.115 ***3.8110.210 ***5.851
20100.116 ***3.7160.210 ***5.851
20110.119 ***3.8260.202 ***5.650
20120.114 ***3.6890.202 ***5.649
20130.084 **2.9670.201 ***5.635
20140.081 **2.8490.205 ***5.766
20150.101 ***3.3110.205 ***5.758
20160.093 ***3.1330.202 ***5.679
20170.085 **2.9510.105 ***3.399
20180.074 **2.6820.197 ***5.574
20190.061 **2.3530.195 ***5.539
Note: **, *** mean significant at the 1%, and 0.1% levels.
Table 5. Regression results of the spatial model.
Matrix TypeGeographic Matrix
Model SettingSDMSARSEM
Variables(1)(2)(3)
IE−0.502 ***
(0.000)
−0.596 ***
(0.000)
−0.612 ***
(0.000)
IE20.324 ***
(0.000)
0.385 ***
(0.000)
0.398 ***
(0.000)
W*IE−1.393 ***
(0.000)
W*IE20.773 ***
(0.001)
IE_Direct−0.546 ***
(0.000)
−0.666 ***
(0.000)
IE_Indirect−2.503 ***
(0.000)
−2.288 **
(0.030)
IE_Total−3.049 ***
(0.000)
−2.954 ***
(0.007)
IE2_Direct0.347 ***
(0.000)
0.429 ***
(0.000)
IE2_Indirect1.399 ***
(0.002)
1.474 **
(0.036)
IE2_Total1.746 ***
(0.000)
1.903 ***
(0.010)
rho0.353 **
(0.016)
0.774 ***
(0.000)
lambda 0.657 ***
(0.000)
Obs330330330
R20.2710.2680.517
Note: **, *** mean significant at the 1%, and 0.1% levels, and the values in parentheses are clustering robust standard errors.
Table 6. Regional heterogeneity.
Region

Variables
Theil
EastMiddleWest
(1)(2)(3)(4)(5)(6)(7)(8)(9)
IE−0.121 ***
(0.0109)
−0.290 ***
(0.0487)
−0.135 ***
(0.0249)
−0.175 ***
(0.0243)
−0.495***
(0.139)
−0.264
(0.141)
−0.275 ***
(0.0239)
−0.560 ***
(0.130)
−0.272 *
(0.129)
IE2 0.167 ***
(0.0469)
0.0883***
(0.0241)
0.538 *
(0.231)
0.348
(0.221)
0.446 *
(0.201)
0.284
(0.172)
ControlsNONOYESNONOYESNONOYES
_cons0.124 ***
(0.00551)
0.161 ***
(0.0118)
0.230 ***
(0.0131)
0.156 ***
(0.00775)
0.197 ***
(0.0192)
0.288 ***
(0.0616)
0.231 ***
(0.00780)
0.270 ***
(0.0191)
0.409 ***
(0.0605)
F 124.9474.86198.9451.8129.6816.48132.5371.4353.32
N121121121110110110999999
R20.5120.5590.9130.3240.3570.4900.5770.5980.777
Note: *, *** mean significant at the 5%, and 0.1% levels, and the values in parentheses are clustering robust standard errors.
Table 7. Robustness Tests.
VariableTheil
(1)(2)(3)
IE−0.156 ***
(0.030)
−0.109 ***
(0.000)
−0.242 ***
(0.000)
IE20.138 ***
(0.030)
0.095 ***
(0.000)
0.224 ***
(0.000)
Instr0.000
(0.000)
−0.000
(0.582)
0.000
(0.714)
Hc−0.007 *
(0.003)
−0.002
(0.523)
−0.009 ***
(0.002)
Gfi0.000 ***
(0.000)
0.000 ***
(0.000)
0.000 ***
(0.000)
Ur−0.212 ***
(0.024)
−0.236 ***
(0.000)
−0.190 ***
(0.000)
Lm -0.000
(0.960)
Inf 0.001
(0.765)
_cons0.284 ***
(0.019)
0.252 ***
(0.000)
0.316 ***
(0.000)
N300270330
R20.7740.7610.797
Note: *, *** mean significant at the 5%, and 0.1% levels, and the values in parentheses are clustering robust standard errors.
Table 8. Study sample.
Experimental GroupInner Mongolia; Sichuan; Guizhou; Yunnan; Shaanxi; Gansu
Control GroupBeijing; Tianjin; Hebei; Shanxi; Liaoning; Jilin; Heilongjiang; Shanghai; Jiangsu; Zhejiang; Anhui; Fujian; Jiangxi; Shandong; Henan; Hubei; Hunan; Guangdong; Guangxi; Hainan; Chongqing; Qinghai; Ningxia; Xinjiang
Table 9. Baseline regression.
Variable(1)(2)
Treat×time−1.525 ***
(0.214)
−0.587 ***
(0.182)
Instr −0.479 ***
(0.103)
Hc −0.889 ***
(0.226)
Gfi 0.163 ***
(0.0370)
Ur −1.645 ***
(0.108)
Treat −0.323 **
(0.141)
Post 0.00156
(0.0378)
_cons−2.377 ***
(0.0289)
−1.093
(0.838)
Time FixedYESYES
Area FixedYESYES
N330330
R20.1340.869
Note: **, *** mean significant at the 1%, and 0.1% levels, and the values in parentheses are clustering robust standard errors.
Table 10. Counterfactual test.
Variables2010 2011 2012
DID−0.459
(0.586)
−0.495
(0.463)
−0.469
(0.436)
Treat−0.810
(0.537)
−0.863 **
(0.380)
−0.959 ***
(0.311)
_cons−2.238 ***
(0.0406)
−2.238 ***
(0.0405)
−2.238 ***
(0.0405)
Time FixedYESYESYES
Area FixedYESYESYES
N180180180
R20.1430.1450.145
Note: **, *** mean significant at the 1%, and 0.1% levels, and the values in parentheses are clustering robust standard errors.
Publisher’s Note: MDPI stays neutral with regard to jurisdictional claims in published maps and institutional affiliations.

