Article

The Spatio-Temporal Pattern and Transition Mode of Recessive Cultivated Land Use Morphology in the Huaibei Region of the Jiangsu Province

1
College of Earth Sciences, Jilin University, Changchun 130061, China
2
Institute of Geographic Sciences and Natural Resources Research, Chinese Academy of Sciences, Beijing 100101, China
3
Department of Forestry and Natural Resources, Purdue University, West Lafayette, IN 47906, USA
4
Urban Development and Mobility Department, Luxembourg Institute of Socio-Economic Research, University of Luxembourg, 4366 Eschsur-Alzette, Luxembourg
5
School of Geography, Geomatics and Planning, Jiangsu Normal University, Xuzhou 221116, China
*
Author to whom correspondence should be addressed.
Land 2022, 11(11), 1978; https://doi.org/10.3390/land11111978
Submission received: 14 October 2022 / Revised: 28 October 2022 / Accepted: 31 October 2022 / Published: 4 November 2022
(This article belongs to the Collection Land Use Transitions and Land System Science)

Abstract

:
Examining land use transition is a new way of building on the comprehensive research on Land Use/Cover Change (LUCC). Research on transition law and characteristics is important for improving the theory of land use transition and the practice of land resource management, and for being able to provide a basis and reference for promoting socio-economic transformation. Based on the relevant statistical data concerning cultivated land use in the Huaibei area of the Jiangsu Province from 1995 to 2020, and by understanding the county as a unit to be measured, this paper constructed a multi-dimensional (economic–social–ecological) functional index system of recessive morphology, analyzed the spatio-temporal pattern of the transition of cultivated land use, identified transition point mutations, and established the transition mode by adopting multi-dimensional time series point mutation detection and the piecewise linear regression method. The findings suggest that the index of recessive cultivated land use morphology in the Huaibei region of the Jiangsu Province presents a trend of “slow decline to significant growth to stable growth”. Moreover, the index presented evolutionary characteristics such as “high in the middle and east while low in the west”, as well as “the relatively balanced distribution between counties”, thus indicating that the degree of transition deepened, it showed a homogeneous development trend, and the transition process presented obvious “ladder” stage characteristics; therefore, the authors suggest making scientific use of cultivated land resources, in accordance with local conditions, in order to make the land use transition of cultivated land efficient, green, and sustainable.

1. Introduction

Land use transition, that is, the change of land use morphology over a long period of time, is made apparent by the changes to the land’s attributes, which are caused by human activities. These attributes are affected by surface factors such as land use type changes and deep driving factors, such as policy, culture, and economy [1,2,3,4]. The research on land use transition is committed to clarifying the spatio-temporal background and exploring the process and connotations that are associated with land use change. The discussion concerning the process, driving factors, and regulatory mechanisms of land use change, from a spatio-temporal perspective, is a central topic in the study of geographical systems and human interactions with the environment [5]. Land use transition takes place within a framework of three interrelated systems: the natural system, economic system, and management system. These systems usually correspond with the stage of regional socio-economic development [6,7]. Against the background of rapid urbanization, land use transition has caused the excessive expansion of construction land, the fragmentation and degradation of arable land, and massive deforestation [8,9]. These problems have an important impact on biodiversity, global environmental changes, and resource sustainability [10]. Research on land use transition has become a principal frontier for international land change science [11]. Land use transition was first proposed by Walker, Mather, and Grainger, and it was used to study the land use of countries dominated by forests [12,13,14,15]. Since then, the object of research in this field has been expanded from forests to grasslands, poverty-stricken mountainous lands, peri-urban lands, residential lands, and so on [16,17,18,19]. Moreover, the research scale has been extended from national and global scales [20,21,22] to micro, single scales (province, county, economic belt, river basin, urban etc.) and multiple scales [23,24,25]. In order to reveal the meaning of the concept of land use morphology, the Chinese scholar, Long, proposed two forms of land use transition: dominant transition and recessive transition [26]. A recessive land use transition mainly involves changes in the land’s properties, including its quality, property rights, and management methods and functions. These changes can only be ascertained through analysis, testing, and investigation, which thus characterizes the land’s morphology [27,28]. In recent years, scholars have carried out a wealth of research on the transition of recessive land use morphology, from macro-economic, agricultural development, rapid-urbanization, exploitation, and output perspectives, among others [29,30,31,32]. This research was conducted using research methods such as correspondence analysis, spatio-temporal comparative analysis, statistical analysis, horizontal comparison, and gradient transformation [33,34,35], with a focus on the research framework, transition path, effect measurement, transition pattern, driving mechanism, and influencing factors [36,37,38,39].
Examining cultivated land use transition is an important part of the study of land use transition and an important tool with which to implement the multi-functional management of cultivated land [40]. In essence, cultivated land use transition involves a change in trend, a shift from one morphology of cultivated land use to another over a long period, which is driven by complex social problems and realistic needs. Cultivated land is an important material basis for ensuring the sustainable development of agriculture [41]. As a natural resource with multiple attributes, the functional evolution of cultivated land is related to the socio-economic environment; hence, the research on the transition of cultivated land use is of great strategic significance to ensuring food production security and maintaining social and economic stability [42,43]. The single production function, utilization mode, is dominated by the neoclassical economic theory that leads to the degradation and marginalization of cultivated land, which, in turn, has affected grain output, working-class incomes, and the ecological environment of cultivated land [44,45]. With improvements in human living standards and the enhancement of land protection awareness, the functional requirements of cultivated land have changed from being uni-functional to multi-functional in terms of production, ecology, and life [46,47]. At present, the research on the transition of cultivated land use mostly focuses on the dominant morphology. Recessive transition involves changes in land attributes. Compared with dominant transition, which only focuses on the number of changes and the spatial structure of land use, recessive transition can reveal the transition rules and characteristics of cultivated land use at the functional level [48,49,50,51].
Since its reformation, and since it ‘opened up’, the rapid development of China’s social economy has accelerated the recessive transition of cultivated land use [52]. The Huaibei region of the Jiangsu Province is an important grain production base in China. It is a typical region with a large area of cultivated land, a high grain output, and a large population density, with obvious “three high” characteristics and significant activity in terms of land use transition. In 2020, the cultivated land area in this area was 274.59 × 10⁴ hm2, which accounts for 50% of the total cultivated land area in the Jiangsu Province. Due to the limited water storage capacity in the region, drought and flood disasters pose a serious threat to local agricultural production, especially to grain production on dry land. In order to promote the sustainable and stable growth of grain production, the Huaibei region of the Jiangsu Province was selected as the research area. This is because cultivated land use transition in the Huaibei region of the Jiangsu Province, especially the transition degree from dry land to paddy fields, has been obvious in recent years (the area of dry land that has transitioned to paddy fields accounted for 79.06% of the total area of cultivated land that has transitioned over the past 25 years). Moreover, using the Huaibei region of the Jiangsu Province, the measurement system for assessing the recessive cultivated land use transition and the land’s morphology was constructed. In addition, the temporal and spatial pattern and the evolutionary law of the transition (with the assistance of the hot/cold point analysis method) was described, multi-dimensional time series point mutation detection and the piecewise linear regression method was used to identify the point of mutation in the transition over a long period of time, and the transition mode for recessive cultivated land use morphology was established. The research results can provide a theoretical basis for an in-depth understanding of the evolutionary law and transition mode concerning recessive cultivated land use, and they can improve the theory of land use transition. In addition, they can provide a basis for local decision-makers in terms of optimizing the use and management of regional cultivated land when practicing land resource management, and they can promote a social and economic transition given that they provide information pertaining to land resource advantages [5,11].

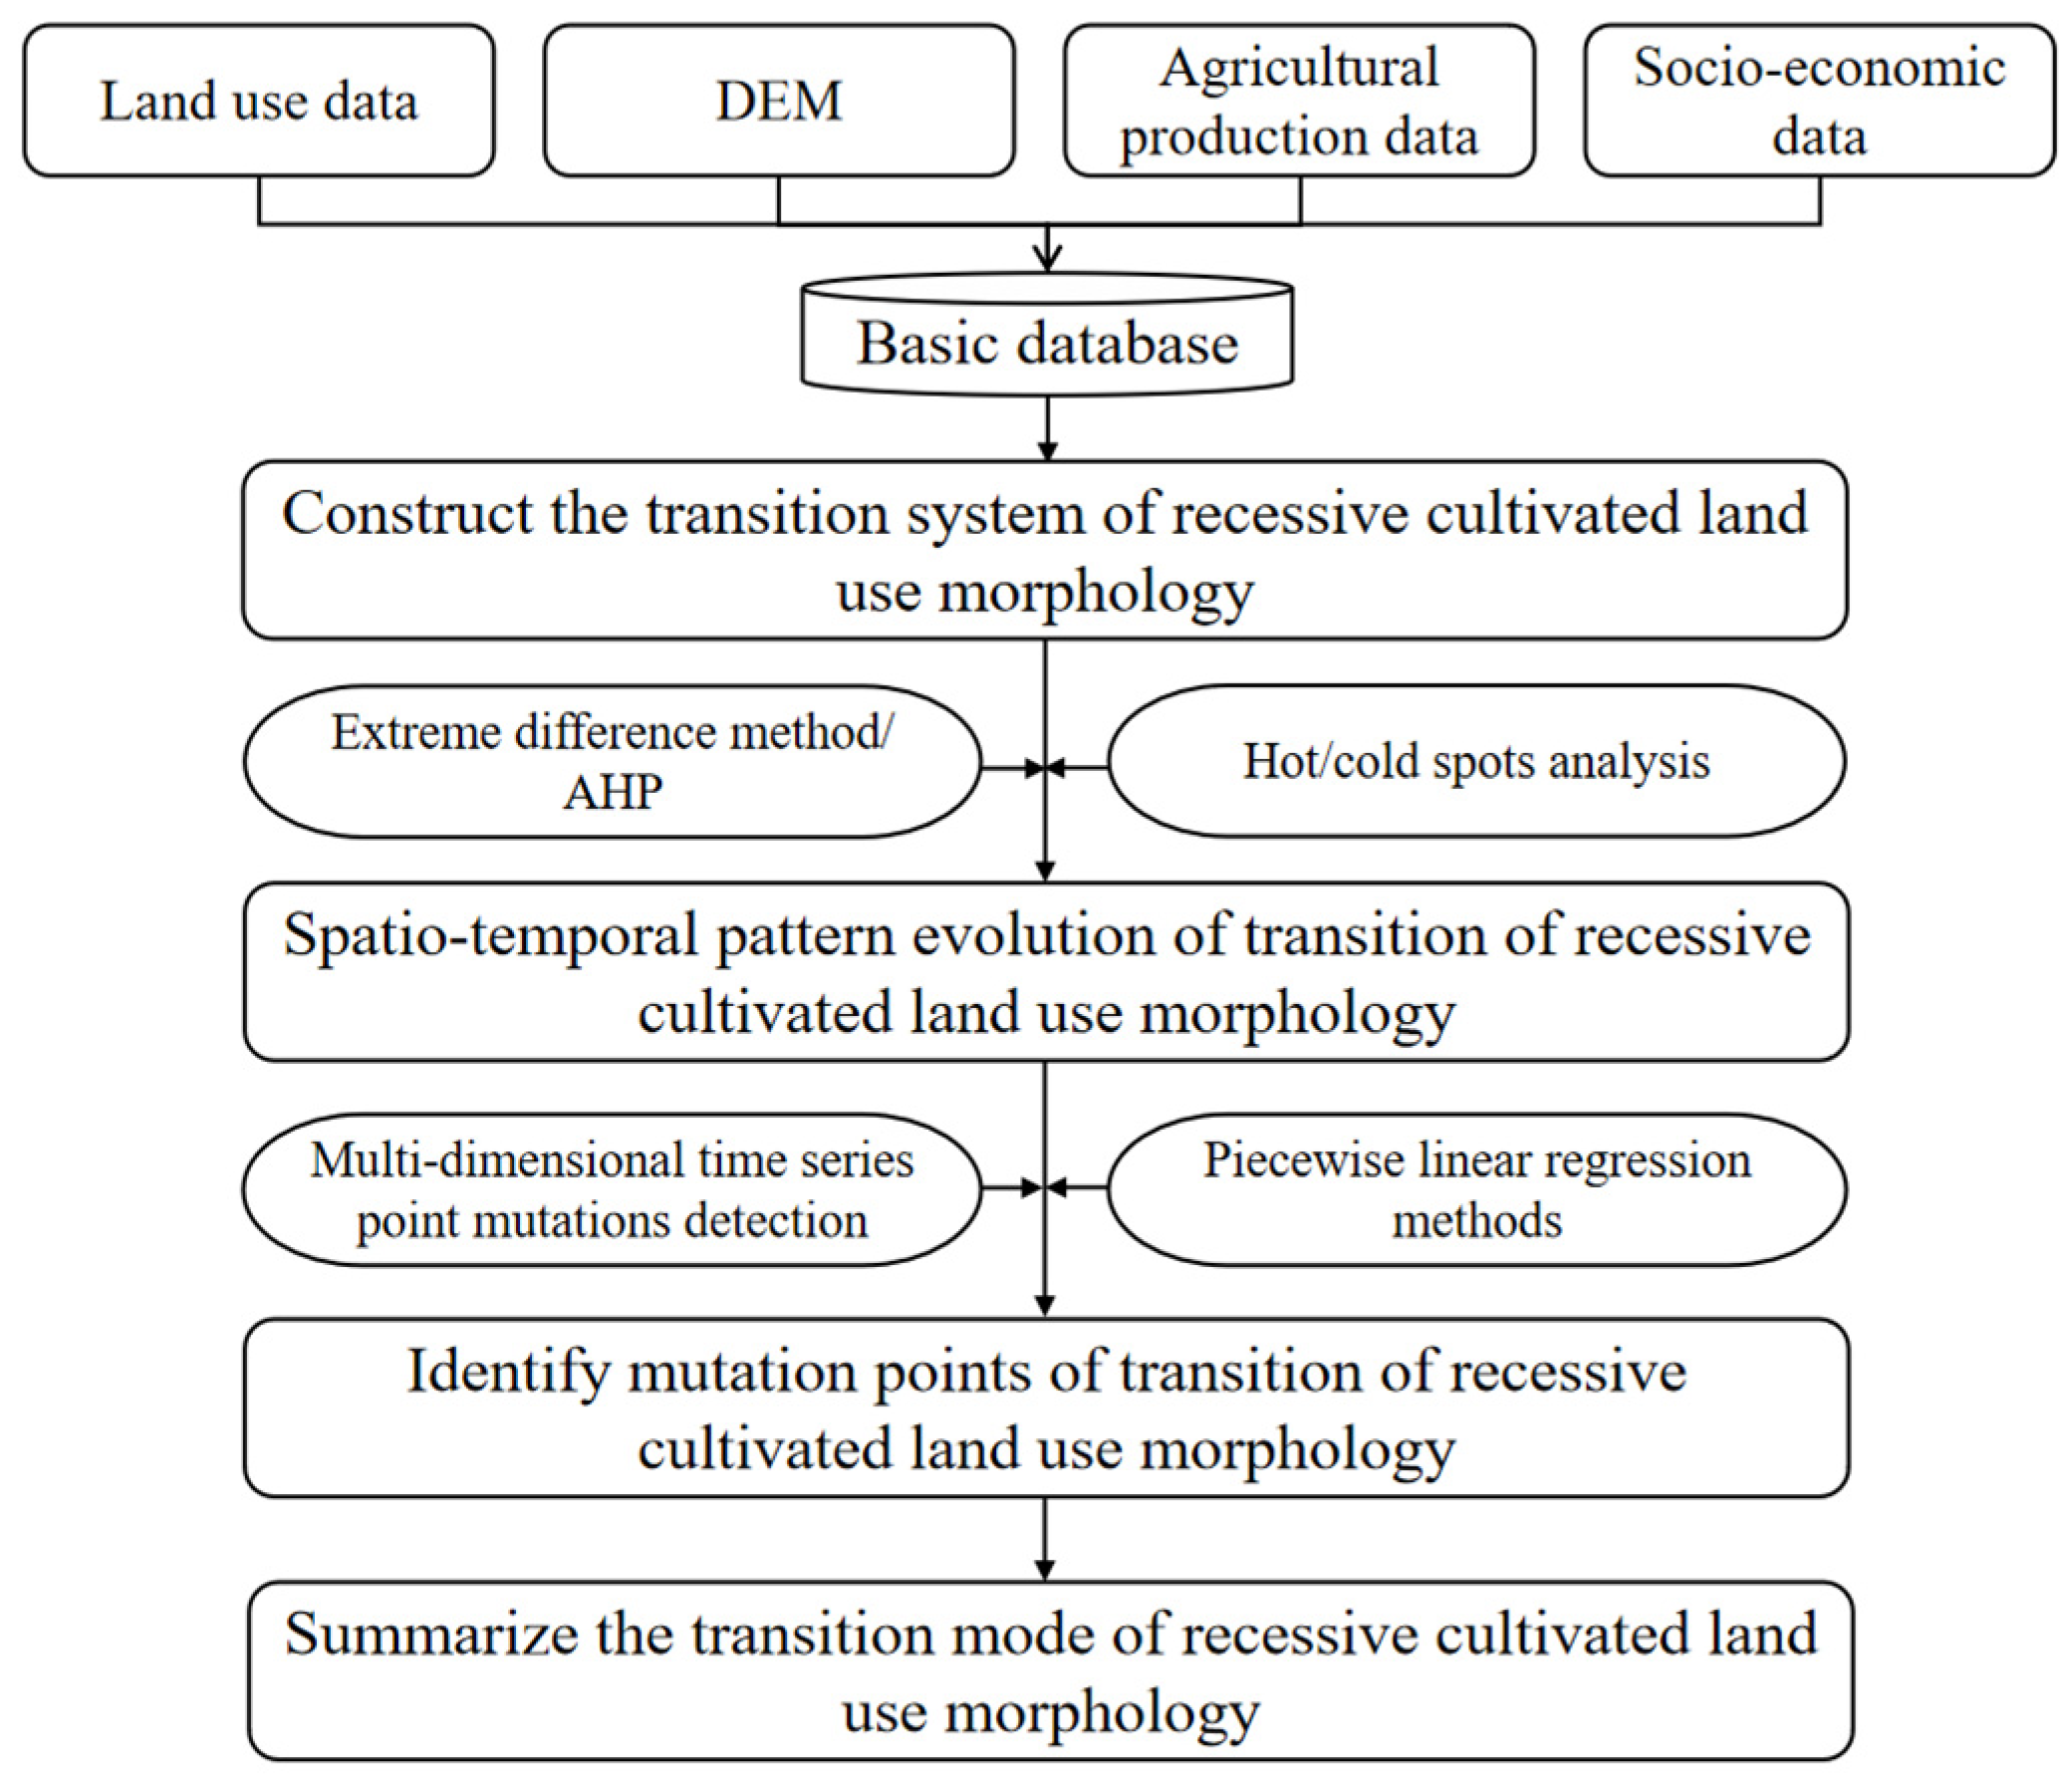
2. Materials and Methods
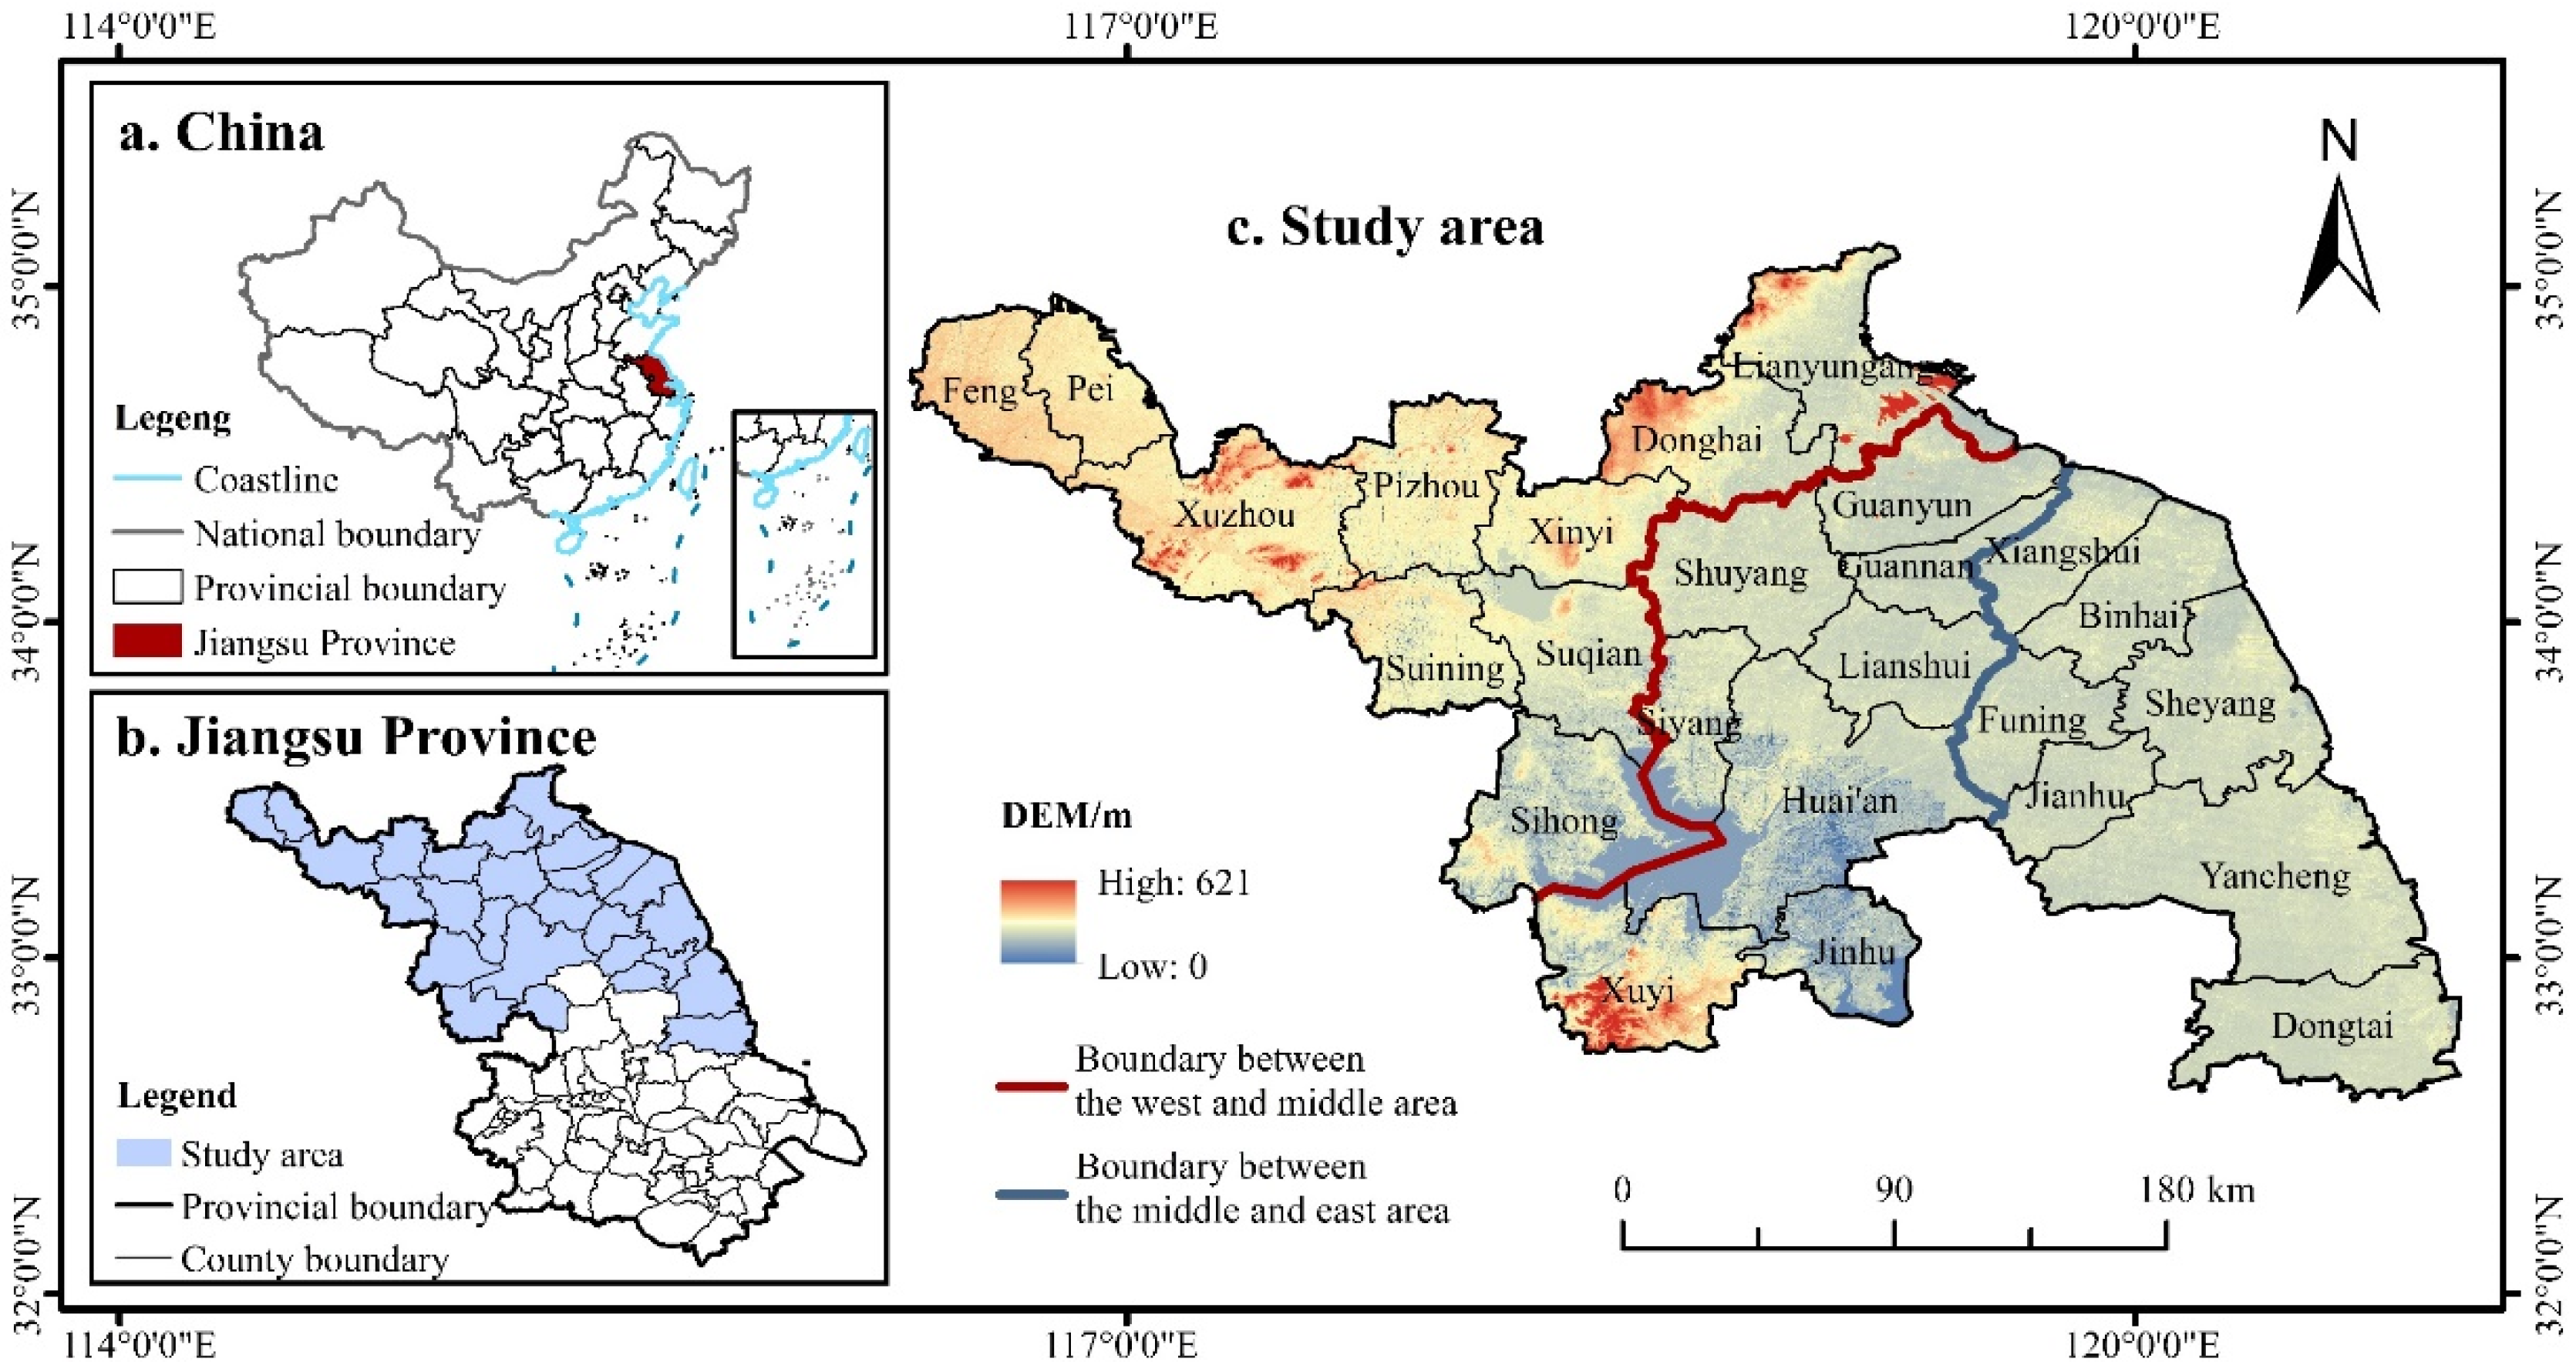
2.1. Study Area

The Huaibei region of the Jiangsu Province (which will henceforth be referred to as the study area) is located in southeastern China. Five prefecture-level cities are located within the study area, including Xuzhou, Lianyungang, Huai’an, Yancheng, and Suqian (Figure 1), and it is an important part of the Huang-Huai-Hai Plain and the Huaihai Economic Zone. The study area is located in a transitory zone that is subject to subtropical and temperate monsoon climates, with an average annual temperature of 14.4 °C and average annual precipitation of 1000 mm. The study area is a major agricultural production area in China, which borders the Yellow Sea and contains the Hongze Lake. It also contains numerous tidal flats and rich resources. The highest point of altitude in the study area is only 621 m. There are many mountains and hills in the west, with a relatively high terrain, and the middle part of the east of the region is relatively flat. In 2020, the total area was 548.66 × 10⁴ ha, of which the cultivated land area was 274.59 × 10⁴ ha, and thus it accounted for 50% of the total area. The grain output was 2484.57 × 107 kg, which accounted for 66.6% of the grain output in the Jiangsu Province. Between 1995 and 2020, the size of the area that was transferred from dry land to paddy fields reached 2.13 × 10⁵ hm2.

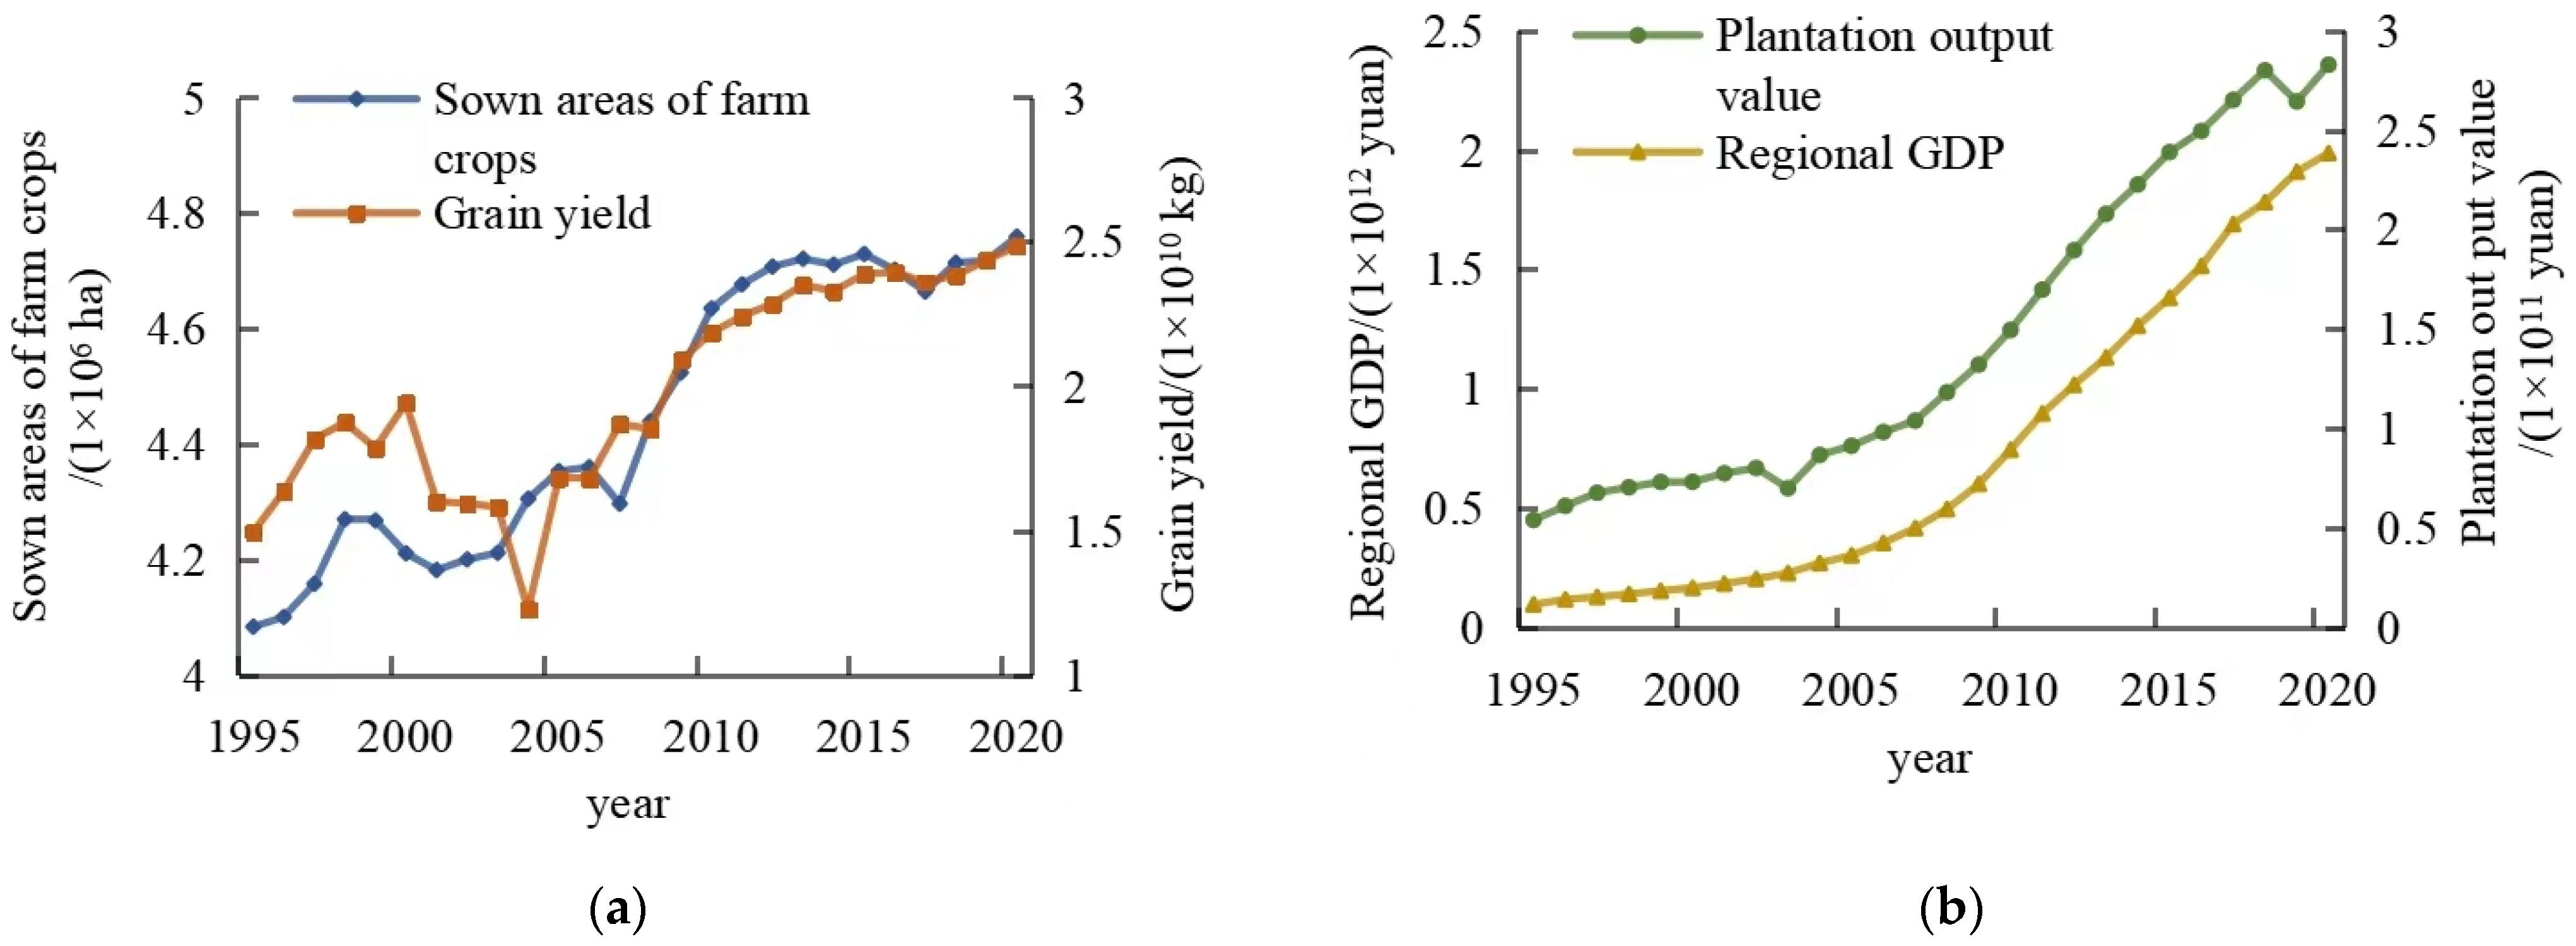
2.2. Data Collection

Between 1995 and 2020, the area that transitioned from dry land to paddy fields in the Huaibei region of the Jiangsu Province reached 2.13 × 10⁵ hm; therefore, the data between 1995 and 2020 were selected. Based on administrative divisions in 2020, the regions were merged, and 25 counties (municipal districts, county-level cities, counties) were identified as research units. Administrative boundaries were downloaded from the National Geographic Information Public Service Center; land use data and DEM were obtained from the Data Center for Resources and Environmental Sciences, Chinese Academy of Sciences (RESDC); and statistical data were acquired and collated from the Jiangsu Statistical Yearbook, Outline of Socio-economic Statistics of China’s Counties (Cities) (this is but one of the Statistical Yearbooks which comprise data on various cities, and they can be found on the official website of the government) (Figure 2).

2.3. Construction of Indicator System

According to the concept and connotations associated with recessive cultivated land use transition [26], combined with previous research experience and the resource characteristics of the research area [53,54,55], a multi-dimensional functional index system was constructed. This index system concerned recessive cultivated land use morphology, and it covered the economy, society, and ecology by noting the quality, carrying capacity, input level, landscape value, and economic benefits of the cultivated land, as well as the level to which the cultivated land could guarantee employment, income, and food security. The specific indicators and implications are shown in Table 1.

2.4. Calculation of Index of Recessive Cultivated Land Use Morphology

The extreme difference method was used to standardize the data. The positive and negative indicators were standardized accordingly [56,57]. The data from 1995 to 2020 were selected for calculation. Index weights were determined by combining the subjective analytic hierarchy process (AHP) and the objective overall entropy method [58,59,60]. The AHP regards the research object as a system and thus decomposes the objective into multiple levels for decision-making. The overall entropy method effectively avoids the interference of human factors that are present in the subjective weighting method, and the processing defects that are present in the general entropy method. Combined with the standardized values and the weights of each index, the weighted summation method was used to measure the index of recessive cultivated land use morphology (hereinafter referred to as the recessive index). The higher the recessive index value, the higher the degree of transition of the recessive cultivated land use morphology. The recessive index values of 25 county units in each year were ranked, and their 26 year average index values were calculated, in accordance with the calculation results of the recessive index. The numerator of the average value ratio was the sum of the annual recessive index values of each county unit, and the denominator was the total number of years, which was 26. the dynamic change characteristics of the recessive transition degree of cultivated land use among county units in the study period were discussed. Moreover, the dynamic change characteristics were the basis for the division of the sample area.
The calculation formula is as follows:
I = i = 1 M x ij t w ij 1 t T , 1 i M , 1 j N .
In Formula (1), I is the recessive morphological index of cultivated land use. t, i, and j are the variables that represent the year, indicator, and county unit, respectively. T, M, and N represent the total number of years (T = 26), the indicator (M = 12), and county unit (N = 25), respectively. X ij t is the standardized value of the indicator, j, with regard to county unit i in the year t. W ij   is the weight of indicator j with regard to county unit i.

2.5. Hot/Cold Spots Analysis

Based on the recessive index calculation results, and with the assistance of the spatial hot-spot analysis tool in ArcGIS, the Getis Ord Gi* statistical information of each element in the data set was calculated. The Z score and p value obtained were used to determine the location of clustering for the high or low value elements in space. The higher the Z score, the closer the clustering of the high value elements (hotspot). According to the results, the study area shifted from cold to hot, and a spatial distribution diagram was drawn. Low value cluster areas (cold-spot) and high value cluster areas (hotspot) were used to characterize the spatial clustering characteristics of the recessive transition of cultivated land use. The darker the color of the area in the diagram, the closer the clustering.

2.6. Point Mutations Detection

Point mutations were determined by multidimensional time series point mutation detection and piecewise linear regression methods. To avoid the interference of false or weak point mutations on the single-dimensional time series, the average and maximum values of statistics in the same year, in the area to be identified, were linearly weighted (taking into account other scholars’ relevant studies, so that the weighted factor was taken α = 0.5). The one-dimensional comprehensive statistical series, and the area to be identified were obtained, respectively. The area that needed to be identified was divided according to the change rule of recessive index. Employing R Studio software, the piecewise linear regression method of the sequence was used to fit the scatters of the series and the point mutations were calculated separately. It also generated the graph according to the fitting results. The coefficient of determination (R2) was used to reflect the goodness of fit between the data and the model. The larger the R was, the better the fitting effect. The p value was selected for the statistical hypothesis test. When the p value < 0.05, it was assumed that the point mutations were present to a significant degree through the F-statistic test [61]. The “k” represented the slope of the polyline of each linear regression equation. The larger the value of k, the greater the degree of regional recessive transition in the corresponding period.

3. Results

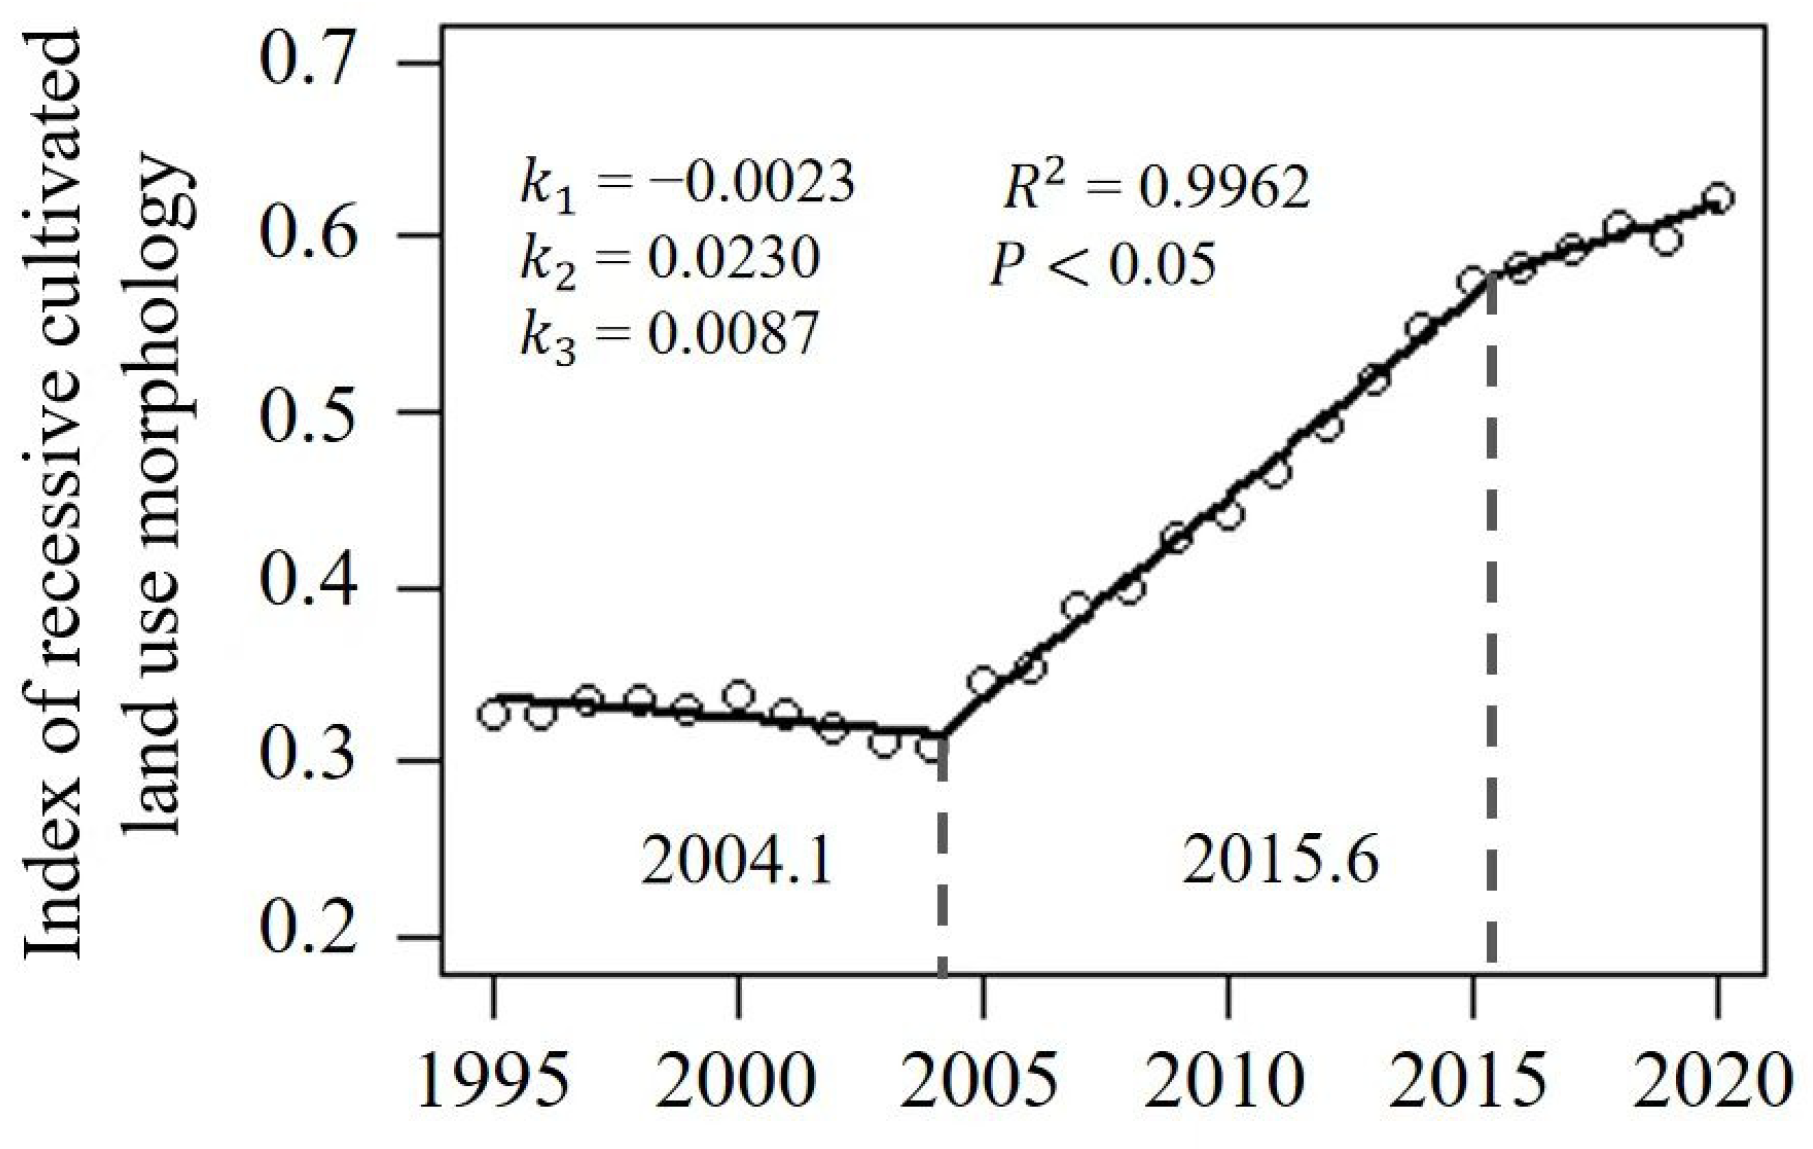
3.1. The Temporal Pattern of the Transition of Recessive Cultivated Land Use Morphology

Between 1995 and 2020, the recessive index of the study area presented a trend of slow decline, followed by significant growth, then stable growth. The average of the recessive index increased from 0.281 to 0.513, with an increase of 82.56% (Table 2), thus indicating that the degree of recessive transition with regard to cultivated land use in the study area, has increased during the 25 years. Overall, the ranking of the county recessive index had changed greatly. Among them, Jinhu County and Xuyi county, which are located in the middle of the region, comfortably ranked at the top (the mean index ranking the top two), and the recessive index was always higher than the average recessive index of the study area, thus indicating that the recessive transition degree of the two counties was at a high level. The index ranking of Fengxian County, Peixian County, Suining County, and Pizhou City in the west fluctuated by more than 10 places, and the index increased by more than 100%, which meant that the recessive transition speed of these county units was relatively quick. The index ranking fluctuations of the Yancheng District, Xiangshui County, and Sheyang County in the east had fallen by more than eight places and the index growth rate was less than 50%, thus indicating that their recessive transition power was insufficient. Guanyun County and Lianshui County were ranked in the middle, although they fluctuated in a disorderly manner; overall, they achieved a middle position in the recessive index, thus indicating that the two counties had not yet formed a stable recessive transition system. The Xuzhou municipal district, Lianyungang municipal district, Suqian municipal district, and the other municipal districts comfortably ranked at the bottom (according to the mean index that ranked the bottom three), and the recessive index was lower than the average of the study area, thus indicating that compared with counties and county-level cities, the cultivated land resources in the urban area were mostly positioned as backup resources, and the utilization potential was not fully realized; therefore, the overall level of recessive transition in the urban area was low.

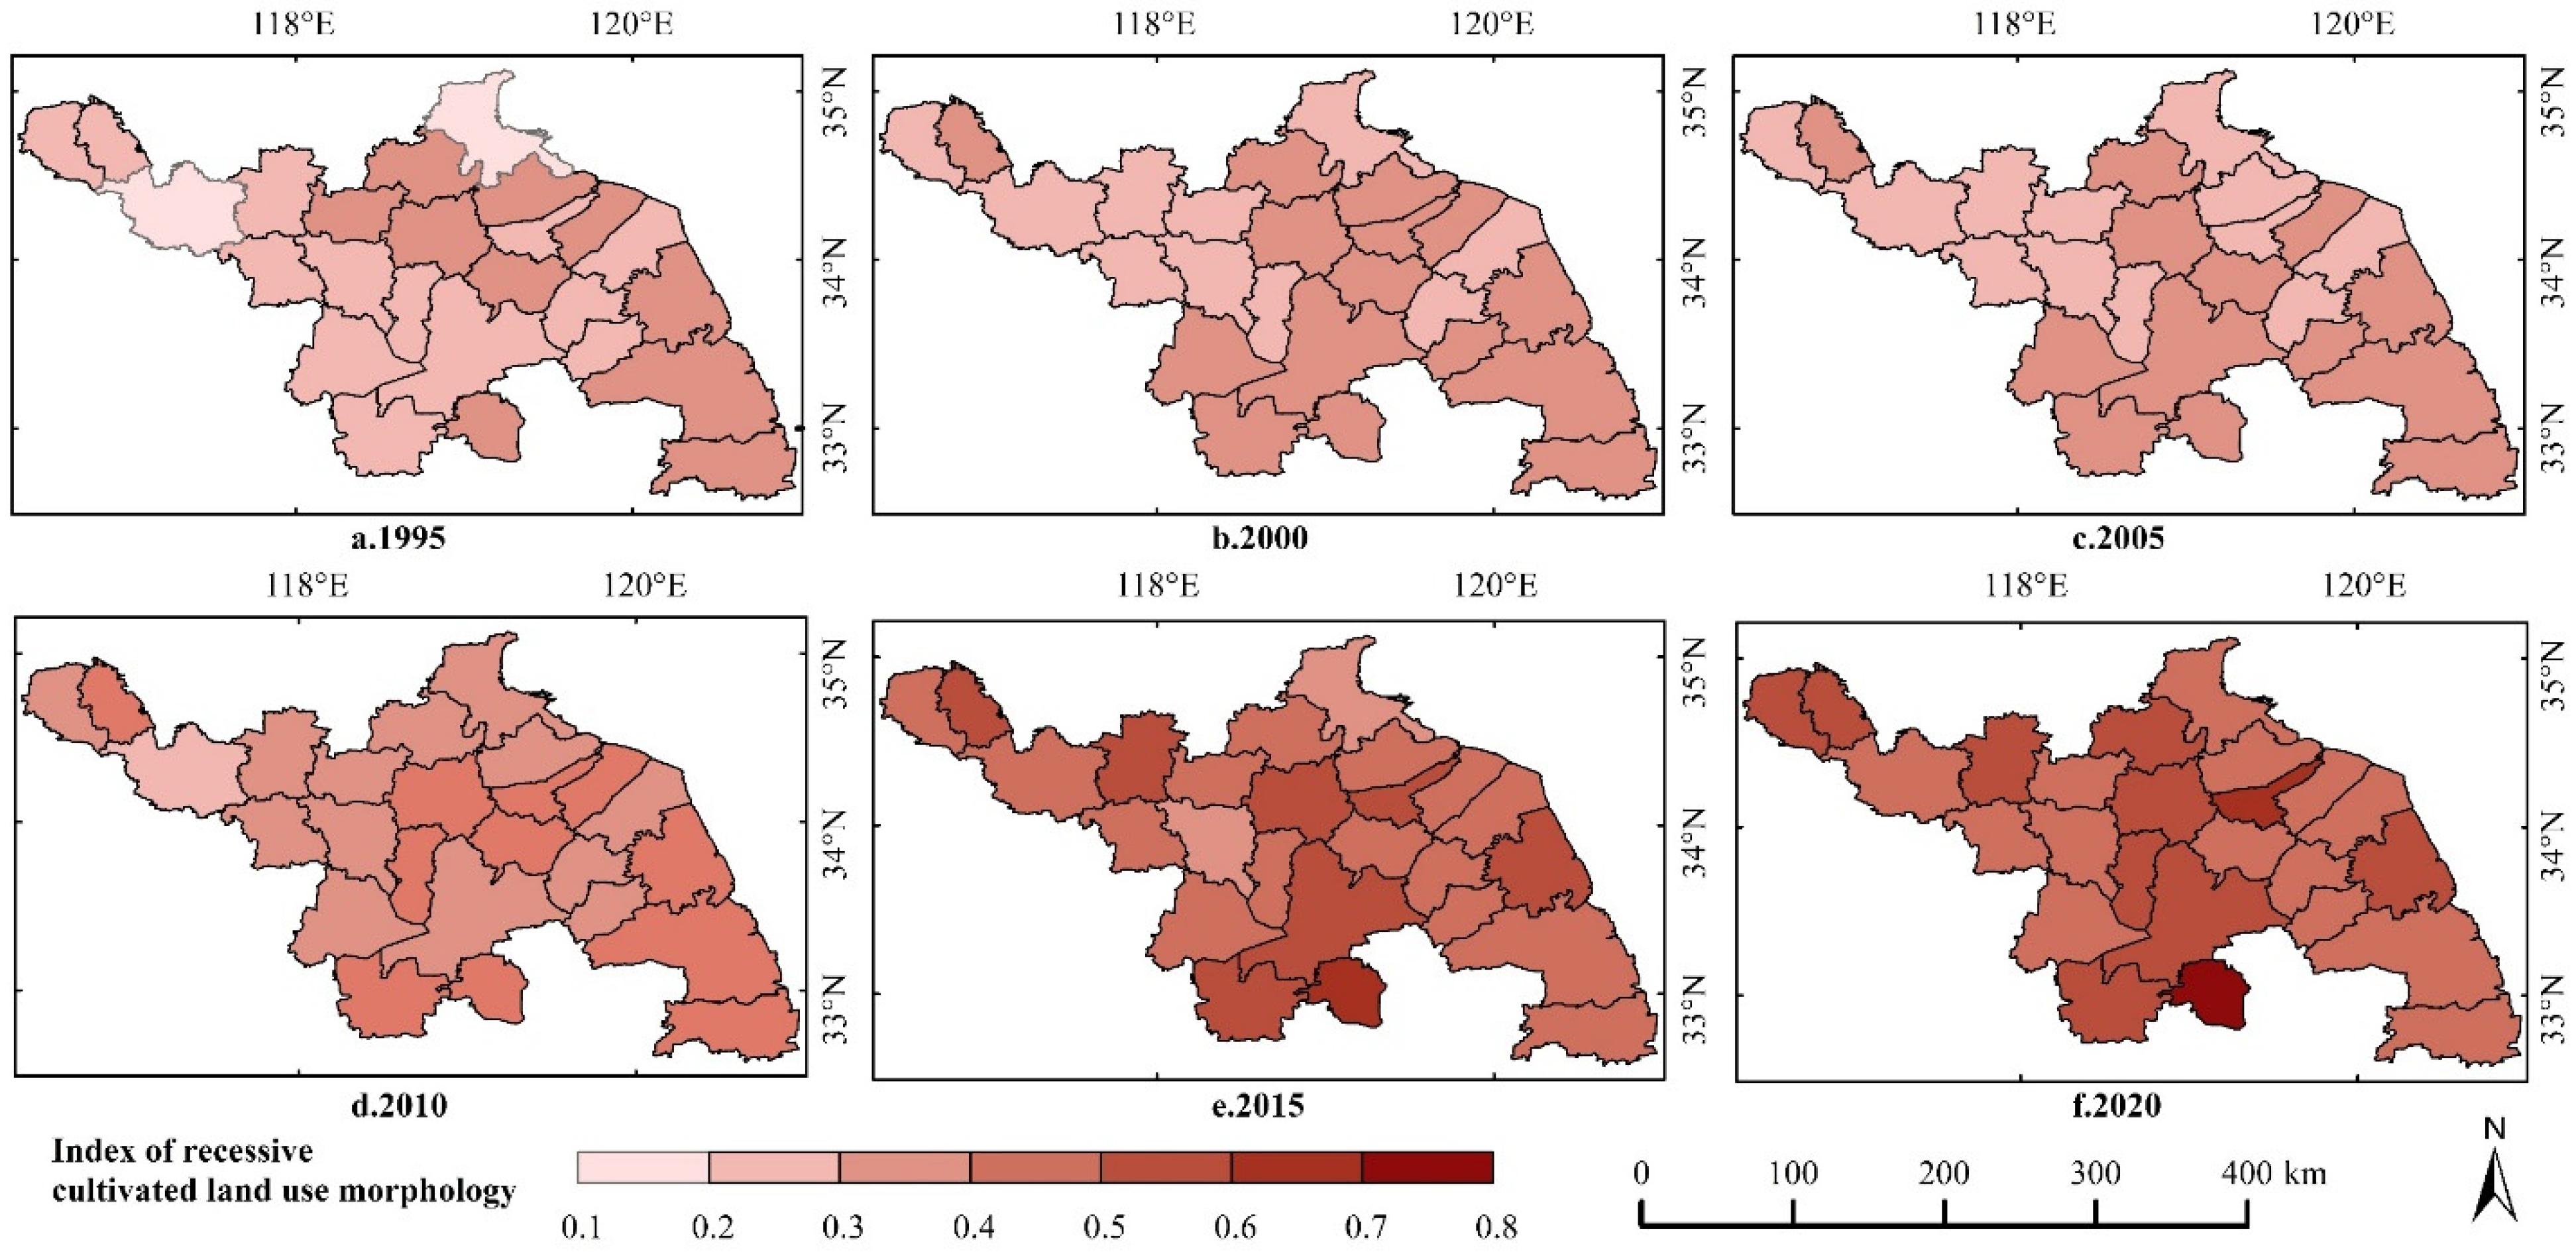
3.2. The Spatial Pattern Concerning the Transition of Recessive Cultivated Land Use Morphology

The change in the recessive index of the study area indicates dynamic regional characteristics. According to the spatial distribution results of recessive cultivated land use transition in the study area, in 1995, 2000, 2005, 2010, 2015, and 2020, the spatial characteristics of transition can be obtained (Figure 3). The overall level of regularity can be shown through the index mean value and the results are displayed in five year intervals. The index of the mean value reflects the general level of recessive transformation between counties. Overall, the recessive index of the study area shows the evolutionary characteristics from high in the middle and east of the region, whereas low in the west, to relative balanced distribution between counties. Between 1995 and 2010, the spatial characteristics of the recessive index in the study area were correlated with the topographic height; that is to say, the change in the recessive index value coincided with the high topographic characteristics in the middle and eastern parts of the region, whereas they remained low in the west. The middle and eastern parts of the study area mainly comprise plains, which are suitable for large-scale and intensive agricultural development; therefore, the counties with a higher degree of recessive transition are mostly distributed in the middle and eastern parts of the region, as they have a flat terrain. For instance,, Sheyang County, Donghai County, and Xiangshui County are located in the southeastern coastal area, with a relatively developed economy, and Jinhu County and Xuyi County arelocated in the middle of the southern part of the study area, near to Hongze Lake, and thus it is easy to maintain water and soil levels and preserve ecology. In the western part of the region lies the remnants of the Luzhong hills and the Jianghuai hills. As they are affected by the terrain, the recessive indices of Feng County, Suining County, and Pizhou City, in the western part of the region, are low, and the municipal district of Xuzhou, Suining County, and Pizhou City in the western part of the region are significant cold spots, with a limited degree of transition. The recessive transition pattern of the study area during this period was affected by natural background factors. From 2015 to 2020, the spatial distribution of the recessive index was relatively balanced and scattered, the degree of spatial agglomeration was weakened, the cold point area was distributed in Funing County and Sheyang County in the east, and there was no distinct high-value cluster area. Jinhu County, Guannan County, Pei County, and Pizhou City, which each had a high degree of recessive transition, were sporadically distributed in the study area. With the development of socio-economic factors, as well as scientific and technological progress, the influence of natural factors, such as terrain, on the recessive transition of cultivated land use in the study area was weakened. Regional socio-economic development, and the agricultural production stage, have become important factors affecting recessive transition.

3.3. Transition Mode of Recessive Cultivated Land Use Morphology

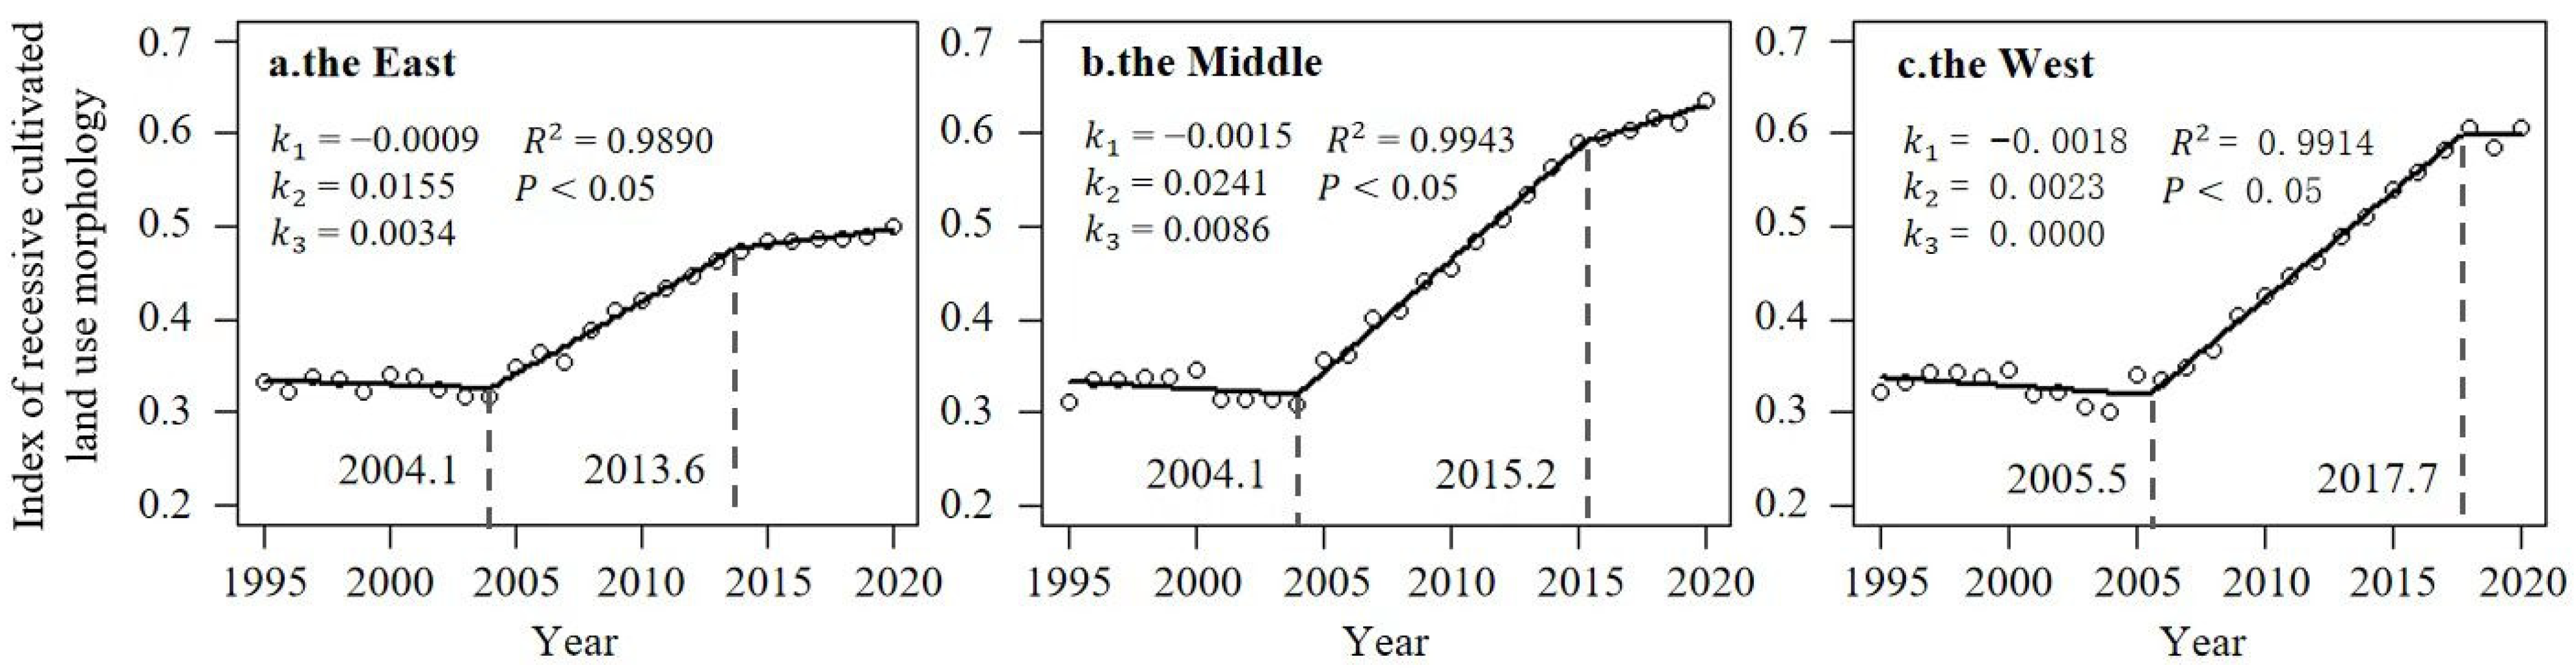
3.3.1. Point Mutation Detection Results

In accordance with the law of recessive index change (results of county level’s horizontal comparison in terms of index mean ranking), the study area was divided into three sample areas: the east (including seven counties, such as Xiangshui County and Binhai County), the middle (including eight counties, such as Lianshui County and Siyang County), and the west (including ten counties, such as Feng County and Pei County). Point mutation detection was carried out on each area, respectively. In Figure 4, the positive and negative values of k represent the fluctuations of the recessive index. The larger the value of k, the greater the degree of regional recessive transition in the corresponding period. When k1 equals −0.0023, it means that the value of the index, which concerns the recessive cultivated land use methodology in the study area, decreased by 0.0023, every year between 1995 and 2004. Conversely, k2 (0.0230) means that the value of the index, which concerns the recessive cultivated land use methodology in the study area, increased by 0.0230, every year between 2005 and 2015. Similarly, k3 indicates that the value of this index increased by 0.0087 every year between 2016 and 2020. In addition, point mutations in the recessive index occurred in 2004 and between 2015 and 2016.
The first recessive transition mutation occurred in 2004. From 1995 to 2004, the recessive index showed a downward trend, which was consistent with the process of social and economic transformation; that is to say, the recessive index mutation occurred when the crop sown area and grain yield decreased, which was affected by SARS (severe acute respiratory syndrome) and flooding. SARS refers to the global epidemic of an infectious disease that affected the agricultural activities of the labor force in China. In addition, the water storage capacity of the study area was insufficient, and drought and flood disasters posed a serious threat to local agricultural production, especially to food production in cultivated land areas that were dominated by dry land. As shown in Figure 5a, the crop sown area and grain yield in the study area showed a fluctuating, but growing, trend from 1995 to 2020; however, between 1999 and 2002, the crop sown area decreased by 6.73 × 10⁴ hm2, and thus, the grain yield in 2004 fell by 3.55 × 10⁹ kg. The two instances where there is a reduced level of growth are related to the SARS epidemic in 2003 and the flooding disaster in the Huaihe River basin, which occurred during the same year. Since then, the food subsidy policy, which was fully implemented in 2004, and the rapid development of the economy have promoted agricultural development. The plantation output value and regional GDP increased rapidly between 2005 and 2015 (Figure 5b), which effectively promoted the transition of recessive cultivated land use morphology, thus causing the recessive transition of the study area to enter a growth stage between 2005 and 2015; however, as it was limited by the bearing capacity of regional resources, the environment, and the goal to adjust industrial structures, the momentum of recessive transition was relatively reduced. Therefore, the second mutation of recessive transition occurred between 2015 and 2016.
The linear piecewise function in the figure is fitted according to the scatter plot of the time (the independent variable) and the recessive index (the dependent variable) (Figure 6). The fitting result shows the location of the mutation point and the turning trend of the recessive index in the three sample areas. The steeper the broken line, the stronger the transition. According to the spatial characteristics of the point mutations of the recessive transition, the first point mutation of the index occurs in the eastern region (Figure 6a), and it occurred in 2004, whereas the second point mutation occurred earlier, between 2013 and 2014. The transition in the eastern region was mainly affected by limitations pertaining to regional resources, the environmental carrying capacity, and adjustments to industrial structures. Part of the cultivated land in this area was developed as a result of coastal beach reclamation; this caused serious loss, degradation and pollution, and it is now difficult to improve the soil fertility level. Moreover, driven by “export-oriented” economy, agricultural development in the eastern coastal area was gradually weakened by the occupation of secondary and tertiary industries [62]; therefore, Yancheng City in the eastern region was subject to a lack of transition power, and its transition speed was slow, meaning that it entered a stable state at the earliest point. The mutations in the recessive index in the middle of the region (Figure 6b) occurred in 2004 and 2015, respectively; these aligned most closely with the recessive transition characteristics of the study area. Most of the county units in the middle of the region were traditional grain-producing areas, and the recessive transition was more vulnerable to macro policy regulation and agricultural development planning. The first point mutation of the recessive index in the west (Figure 6c) occurred between 2005 and 2006, and the second mutation point occurred between 2017 and 2018. As the central city in the Huaihai Economic Zone, the development of the secondary and tertiary industries in the west of Xuzhou City far exceeded that of the other four cities, and the focus of development was the revitalization of the old industrial base; therefore, the response to agricultural policies in the western part of the region was relatively slow, and the point mutations lagged behind other regions. However, the economic foundation laid by industrialization provides an impetus for recessive transition, which ensured the rapid growth of the recessive morphological index in the western region.

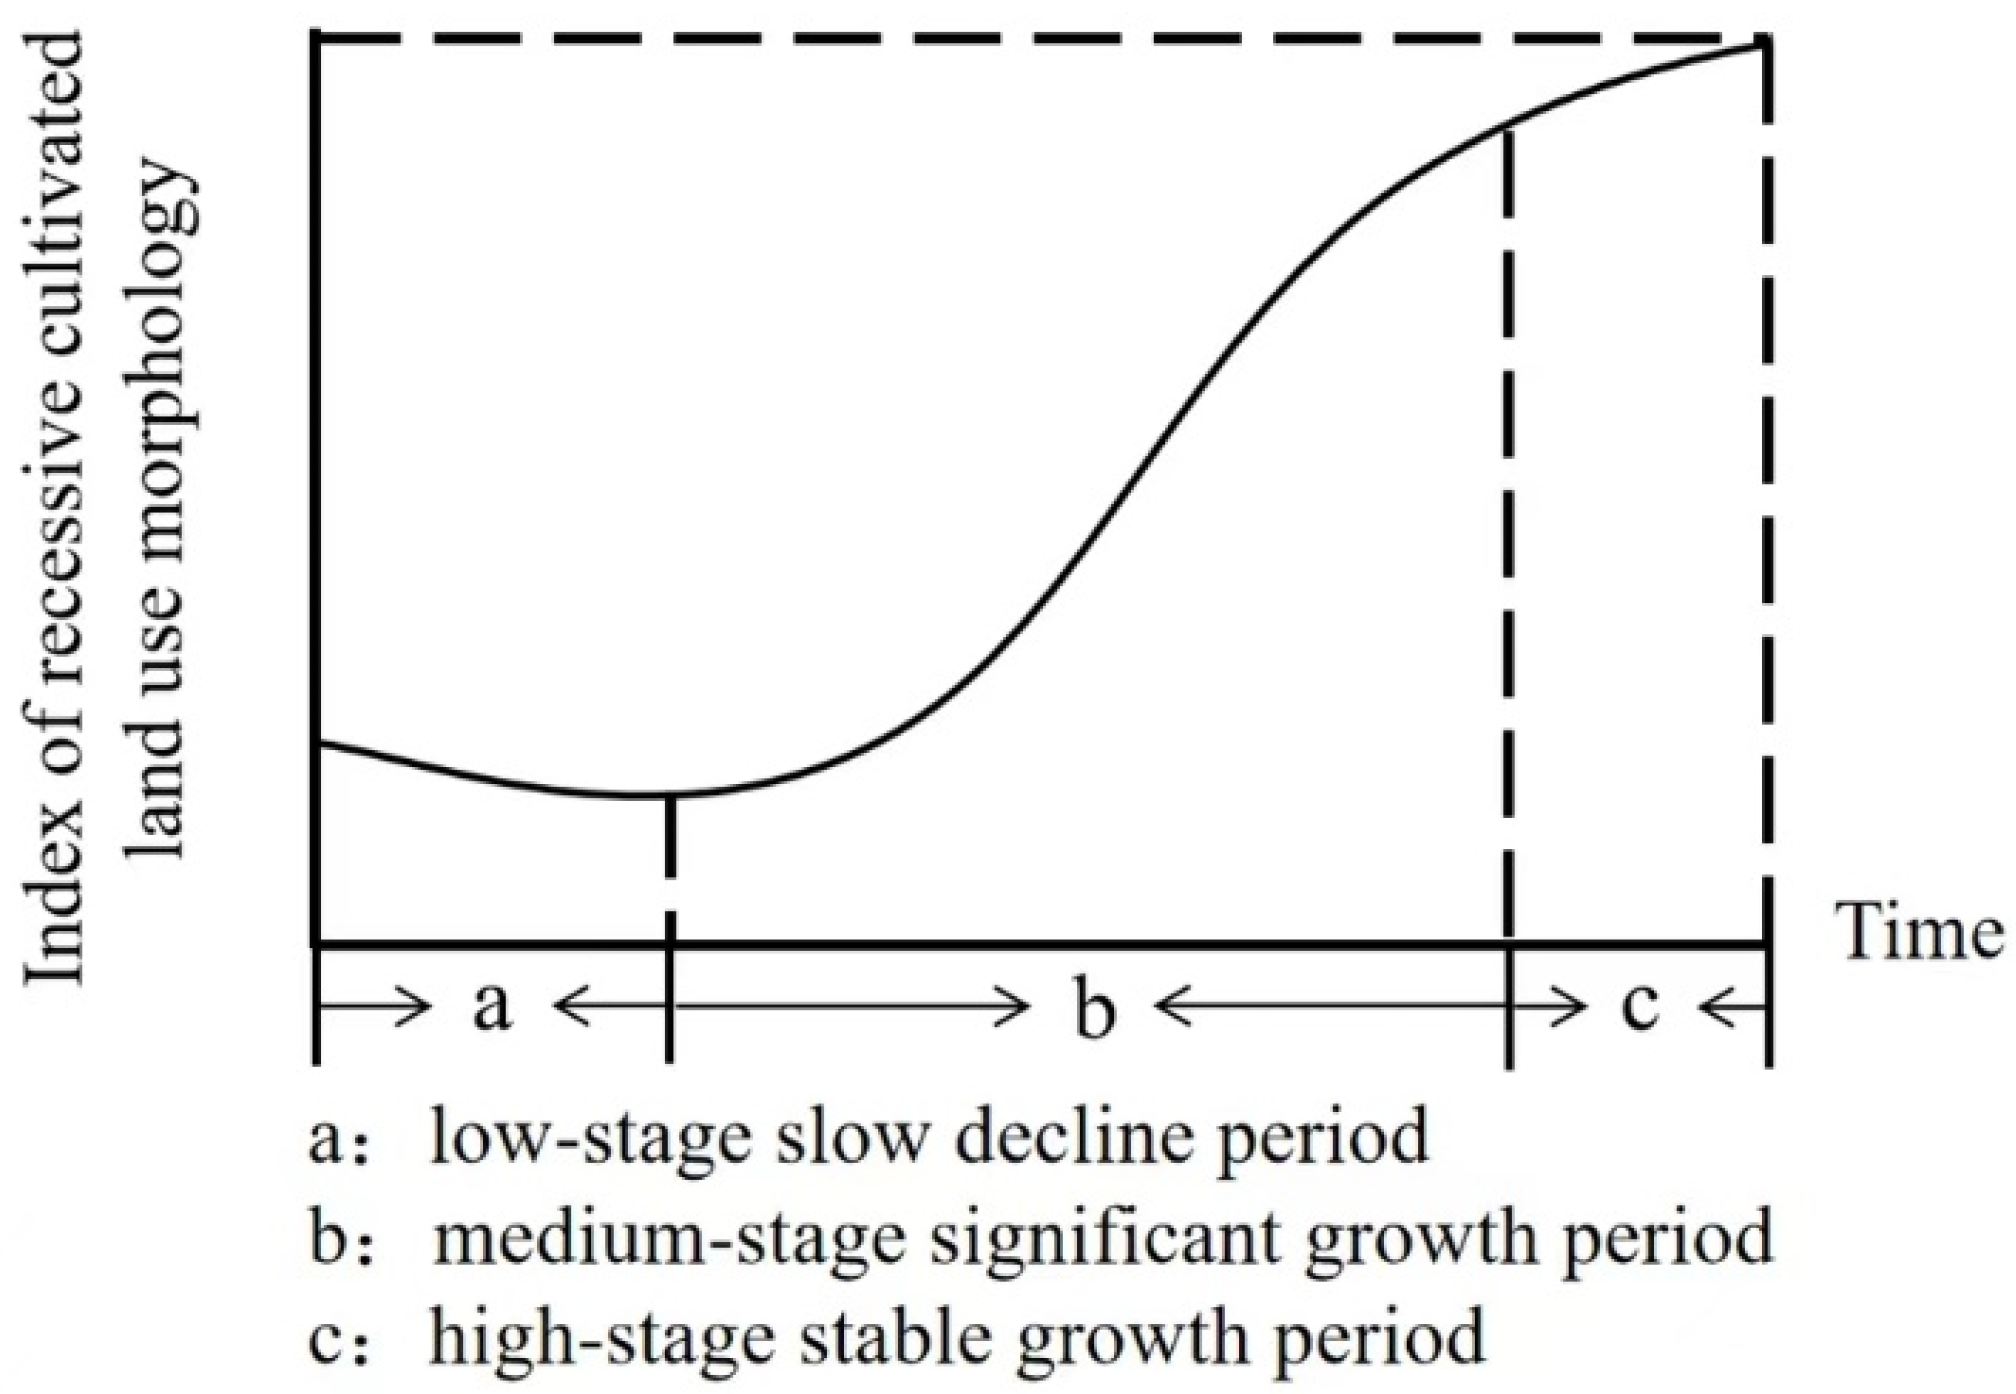
3.3.2. Transition Mode of Recessive Cultivated Land Use Morphology

Combined with the spatio-temporal evolutionary characteristics of cultivated land use and trend law, which are presented as long-term changes in the study area, the authors found that the annual curve trend of the study area and each county showed a “nearly S-shaped curve” and an apparent “ladder-type” stage characteristic. According to the regularity of the curve and the position of the trend point mutations on the long-term series, the recessive transition of cultivated land use in the study area is divided into three stages in our article: the “low-stage slow decline period”, the “medium-stage significant growth period”, and the “high-stage stable growth period” (Figure 7). Restricted by socio-economic development and the lack of scientific and technological advances, the transition of recessive cultivated land use morphology made slow progress, and it even underwent a slight regression in the early stages. With the transformation and development of socio-economic factors, the transition rapidly progressed after entering the growth stage, before entering the stable and slow advancement stage.
The transformation mode, regarding cultivated land use, is a conceptual transformation mode. Since the transformation mode in each stage is adapted to the regional economic, social, and agricultural development stages, economic and social development, policy intervention, external interference, and so on, are all reasons for the corresponding changes in the stages and rates of cultivated land transformation. The influence of natural background resources, industrial structures, cultivated land development planning, and management methods, with regard to transformation power, were also important factors that promoted the gradual increase of transformation differences between counties. The impact of cultivated land development planning and management methods on the transformation dynamics gradually increased the number of transformation differences between counties. Importantly, although the three sample areas in the study area conform to the proposed “S” type three-stage transition mode, the periods at which the sample areas entered the high-stage period were inconsistent, and the length of transition experienced by each county within the same transition stage also varied. For example, Xiangshui County experienced a six-year period of medium-stage significant growth, and it entered a period of high-stage stable growth in 2010. The period of medium-stage significant growth in Xinyi City lasted for 13 years, and it entered a period of high-stage stable growth in 2017. In addition, not all of the research units in this paper underwent the transition of recessive cultivated land use morphology following this mode, and some regions did not experience the first stage (Donghai County), nor did they reach the third stage (Funing County, Huai’an municipal district) during the study period; therefore, the transition of cultivated land use cannot be considered an established model [63].

4. Discussion

Based on the analysis of the vertical time series and horizontal spatial patterns, this paper jointly assessed the spatio-temporal evolution law and trend characteristics of the transition of recessive cultivated land use morphology in the Huaibei region of the Jiangsu Province, and the transition mode was thus established. The temporal and spatial pattern of the recessive transition in the study area was related to the terrain and socio-economic development. The transition model in each stage was adapted to the regional economic, social and agricultural development stages. The recessive transition process presented an obvious “ladder type” stage characteristic due to different dominant factors (socio-economic development, policy intervention, external interference). The recessive transition process showed obvious “ladder” stage characteristics due to different leading factors. The research results have similarities and differences with those of other scholars who assessed other regions. On the one hand, the cultivated land recessive transition model we obtained was similar to the model of other scholars, which is an abstract S-shape [64,65]. In addition, our conclusions also somewhat correspond with the research results of other scholars [66,67,68] in that the characteristics of the recessive transition of cultivated land correspond with the terrain and the stages of socio-economic development; however, due to the particularity of the study area, caused by the fact that the flood disaster was serious, the area of paddy fields converted to dry land was large, and the impact of SARS was significant, the first stage of transformation was different from other studies. During the period of low-stage slow decline, which was subject to the level of socio-economic development, the level of cultivated land use in the study area was low, or even slightly decreased, which was closely related to the transformation of the local industrial structure. During this period, the study area was transitioning from an agricultural society to an industrial society, and of the three industries, the greatest share of land was apportioned to the secondary industry in 1993. In 2003, the total industrial added value was 101.00 billion yuan, breaking the 100 billion yuan threshold for the first time. The sharp increase in the proportion of secondary and tertiary industries led to the dual constraints of resources and markets on agricultural development. Industrial structural adjustments led to the reverse transition of recessive cultivated land use morphology in the study area. In the process of transitioning to the period of middle-stage significant growth, macro-control policies were the determinants affecting the occurrence of turning mutations. Policies such as food subsidies, introduced in 2004, had a direct impact on the study area [69]. From 1995 to 2004, grain output decreased by 29.83 × 10⁷ kg annually, on average, with an average annual increase of 105.59 × 10⁷ kg between 2004 and 2015. In addition, from 2001 to 2006, the Jiangsu Province successively established and implemented policies and measures, such as the “North–South linkage”, “Four transfers”, and the “co-construction of Industrial Parks” (Several Policy Opinions of the Provincial Government on Promoting the Accelerated Development of Northern Jiangsu Region. Released by the Jiangsu Provincial Government (2004). No. 13; Notice of the Provincial Government on Policies and Measures to Support the North–South Linkage to Jointly Build the Northern Jiangsu Development Zone. Released by the Jiangsu Provincial Government (2006) No. 119); as a result, the study area rapidly ‘caught-up’ economically through the provincial assistance mechanism. Economic growth and agricultural development were regulated with policies and systems that effectively promoted the process and trend of recessive transition during this period. Due to limitations concerning resources and the environmental carrying capacity, the degree of transition cannot be increased indefinitely. The transition speed slowed down after entering the period of high-stage stable growth. The protected use of cultivated land, improving the quality of cultivated land, and tapping the potential of cultivated land had become an effective way of releasing the transition potential of recessive cultivated land use morphology.
Based on the above research on the recessive transition of cultivated land use, the following relevant suggestions on the sustainable utilization of cultivated land resources are proposed: (1) regarding the utilization of cultivated land resources in Huaibei, Jiangsu Province, we should fully consider the relationship between regional natural geographical characteristics, socio-economic transformations, and the recessive transition of cultivated land use, to guide the cultivated land to achieve efficient, coordinated, and green transformations, in accordance with local conditions [66]; (2) based on the characteristics of regional physical geography, combined with the goals of local economic development, food production security, and ecological environment protection, agricultural production should be developed, in accordance with local conditions [69]. For regions that have a significant demand on the land, and serious pollution due to urbanization and industrialization, it is necessary to focus on ensuring the quantity of cultivated land areas and strengthening ways in which to control the degradation and pollution of cultivated land to ensure the production and ecological functions of the cultivated land. For traditional grain producing areas, we should fully tap into the potential of cultivated land, speed up the popularization and application of fine varieties and high-yield cultivation techniques, improve the level of agricultural modernization, improve the efficiency of cultivated land output, ensure the high quality and high yield of grain, increase farmers’ incomes, and promote the social function of cultivated land so that the area can enter a stable stage and reap economic benefits; (3) regarding the future management of cultivated land use, when formulating policies related to cultivated land use, in addition to strengthening investments, and the management, technology, and talent for agricultural production, we should also fully consider the regional differentiation characteristics of the recessive transition of cultivated land use. Moreover, differential and diversified management for cultivated land use should be implemented, in accordance with its stage of economic development. This should gradually promote the transformation of the management of cultivated land resources, so that a comprehensive management mode focusing on quantity, quality, and ecology is realized, in order to ensure the optimal allocation and efficient utilization of cultivated land resources [70].
The recessive form of cultivated land use is rich in nuance, with comprehensive, multi-dimensional, and dynamic characteristics [27]. Limited by the availability of data, the influence of cultivated land property rights, management methods, and policies were not quantified in the text, and thus it renders this paper slightly deficient in that the recessive form of cultivated land use could not be completely systematically and comprehensively assessed. In addition, as the basic unit in the utilization of cultivated land resources, villages and farmers can more accurately present the micro characteristics of recessive transition of cultivated land use [5]; therefore, in the future, we should pay attention to the changes in the ownership system and policies related to cultivated land. At the same time, we should seek to depict the recessive transition of cultivated land on a micro scale and study the spatio-temporal dynamic simulation, in order to better understand the use and management of land resources [43,48,71].

5. Conclusions

This paper constructed a measurement system for the transition of recessive cultivated land use morphology, it describes the temporal and spatial pattern and evolutionary law of the transition, with the help of methods such as hot/cold spot analysis, it uses multi-dimensional time series point mutation detection and piecewise linear regression to identify the point mutations of transition in a long-time series, and it established the transition mode of recessive cultivated land use morphology in the Huaibei region of the Jiangsu Province.
(1) Between 1995 and 2020, the recessive index of cultivated land use in the Huaibei region of the Jiangsu Province presented a trend of slow decline, followed by significant growth, and then stable growth. Moreover, high evolutionary characteristics in the middle and east parts of the region while low in the western were present, which was followed by a relatively balanced distribution between counties, which indicates that the degree of transition increased and showed a homogeneous development trend.
(2) The comprehensive application of the multi-dimensional time series point mutation detection method and piecewise linear regression method can satisfactorily identify the transition trend and the location of the transition point mutation. The transition process is found to have distinct “ladder” stage characteristics; therefore, the transition of recessive cultivated land use morphology in the study area is divided into the “low-stage slow decline period”, “medium-stage significant growth period”, and “high-stage stable growth period”. There were dissimilarities in terms of resource background characteristics, socio-economic development level and policy intervention intensity, and the period and duration of each transition stage between the counties. Despite the fact that there were differences between counties in terms of the period and duration of each transition stage, overall, the law of transition conformed to this model.
(3) The utilization and management of cultivated land ought to consider the regional differentiation characteristics of cultivated land transition, conform to the law of regional cultivated land use transition, and clarify the transition mode. Cultivated land resources should be protected, managed, and utilized scientifically, in accordance with local conditions. Capital investment in agricultural development should be increased, relevant policies should be actively implemented, and the transition of cultivated land use should be intensive, efficient, and green.

Author Contributions

Conceptualization, X.L. and L.W.; methodology, X.L., L.W. and B.P.; software, X.L. and L.P.; validation, H.O. and A.L.; formal analysis, L.W., L.P. and H.O.; investigation, X.L. and B.P.; resources, A.L.; writing—original draft preparation, X.L.; writing—review and editing, L.W. and B.P.; visualization, X.L., L.P. and Y.Q.; supervision, L.W.; project administration, X.L. and L.W.; funding acquisition, L.W. and Y.Q. All authors have read and agreed to the published version of the manuscript.

Funding

This research was funded by the National Natural Science Foundation of China (Grant Nos. 42101252 and 41731286); Jiangsu Provincial Science Foundation (Grant No. BK20191104).

Institutional Review Board Statement

Not applicable.

Informed Consent Statement

Not applicable.

Data Availability Statement

Data available in a publicly accessible repository that does not issue DOIs. Publicly available datasets were analyzed in this study. This data can be found here: http://www.stats.gov.cn (accessed on 5 June 2022).

Acknowledgments

The authors extend great gratitude to the anonymous reviewers and editors for their helpful reviews and critical comments.

Conflicts of Interest

The authors declare no conflict of interest.

References

  1. Taylor, C.A.; Rising, J. Tipping point dynamics in global land use. Environ. Res. Lett. 2021, 16, 125012. [Google Scholar] [CrossRef]
  2. Quintero-Angel, M.; Coles, A.; Duque-Nivia, A.A. A historical perspective of landscape appropriation and land use transitions in the Colombian South Pacific. Ecol. Econ. 2021, 181, 106901. [Google Scholar] [CrossRef]
  3. Nghiem, T.; Kono, Y.; Leisz, S.J. Crop Boom as a Trigger of Smallholder Livelihood and Land Use Transformations: The Case of Coffee Production in the Northern Mountain Region of Vietnam. Land 2020, 9, 56. [Google Scholar] [CrossRef] [Green Version]
  4. Chen, K.; Long, H.; Liao, L.; Tu, S.; Li, T. Land use transitions and urban-rural integrated development: Theoretical framework and China’s evidence. Land Use Policy 2020, 92, 104465. [Google Scholar] [CrossRef]
  5. Long, H. Theorizing land use transitions: A human geography perspective. Habitat Int. 2022, 128, 102669. [Google Scholar] [CrossRef]
  6. Ma, L.; Long, H.; Tu, S.; Zhang, Y.; Zheng, Y. Farmland transition in China and its policy implications. Land Use Policy 2020, 92, 104470. [Google Scholar] [CrossRef]
  7. Long, H.; Qu, Y.; Tu, S.; Zhang, Y.; Jiang, Y. Development of land use transitions research in China. J. Geogr. Sci. 2020, 30, 1195–1214. [Google Scholar] [CrossRef]
  8. Zhu, C.; Zhang, X.; Wang, K.; Yuan, S.; Yang, L.; Skitmore, M. Urban–rural construction land transition and its coupling relationship with population flow in China’s urban agglomeration region. Cities 2020, 101, 102701. [Google Scholar] [CrossRef]
  9. Nkeki, F.N. Spatio-temporal analysis of land use transition and urban growth characterization in Benin metropolitan region, Nigeria. Remote Sens. Appl. Soc. Environ. 2016, 4, 119–137. [Google Scholar] [CrossRef]
  10. Meyfroidt, P.; Chowdhury, R.R.; de Bremond, A.; Ellis, E.C.; Erb, K.-H.; Filatova, T.; Garrett, R.D.; Grove, J.M.; Heinimann, A.; Kuemmerle, T.; et al. Middle-range theories of land system change. Glob. Environ. Chang. 2018, 53, 52–67. [Google Scholar] [CrossRef]
  11. Turner, B.L.; Lambin, E.F.; Reenberg, A. The emergence of land change science for global environmental change and sustainability. Proc. Natl. Acad. Sci. USA 2007, 104, 20666–20671. [Google Scholar] [CrossRef] [Green Version]
  12. Walker, R.T. Land use transition and deforestation in developing countries. Geog. Anal. 1987, 19, 18–30. [Google Scholar] [CrossRef]
  13. Mather, A.S. The forest transition. Area 1992, 24, 367–379. [Google Scholar]
  14. Grainger, A. The forest transition: An alternative approach. Area 1995, 27, 242–251. [Google Scholar]
  15. Grainger, A. National land use morphology: Patterns and possibilities. Geography 1995, 80, 235–245. [Google Scholar]
  16. Biggs, N.B. Drivers and constraints of land use transitions on Western grasslands: Insights from a California mountain ranching community. Landsc. Ecol. 2022, 37, 1185–1205. [Google Scholar] [CrossRef]
  17. Xiang, J.; Li, X.; Xiao, R.; Wang, Y. Effects of land use transition on ecological vulnerability in poverty-stricken mountainous areas of China: A complex network approach. J. Environ. Manag. 2021, 297, 113206. [Google Scholar] [CrossRef]
  18. Czekajlo, A.; Coops, N.C.; Wulder, M.A.; Hermosilla, T.; White, J.C.; van den Bosch, M. Mapping dynamic peri-urban land use transitions across Canada using Landsat time series: Spatial and temporal trends and associations with socio-demographic factors. Comput. Environ. Urban Syst. 2021, 88, 101653. [Google Scholar] [CrossRef]
  19. Wen, Y.; Zhang, Z.; Liang, D.; Xua, Z. Rural Residential Land Transition in the Beijing-Tianjin-Hebei Region: Spatial-Temporal Patterns and Policy Implications. Land Use Policy 2020, 96, 104700. [Google Scholar] [CrossRef]
  20. Meyroidt, P.; Lambin, E.F. Forest transition in Vietnam and its environmental impacts. Glob. Chang. Biol. 2008, 14, 1319–1336. [Google Scholar] [CrossRef]
  21. Mather, A.S.; Fairbairn, J.; Needle, C.L. The course and drivers of the forest transition: The case of France. J. Rural. Stud. 1999, 15, 65–90. [Google Scholar] [CrossRef]
  22. Rudel, T.K.; Coomes, O.T.; Moran, E.; Achard, F.; Angelsen, A.; Xu, J.; Lambin, E. Forest transitions: Towards a global understanding of land use change. Glob. Environ. Chang. 2005, 15, 23–31. [Google Scholar] [CrossRef]
  23. Liang, X.; Jin, X.; Ren, J.; Gu, Z.; Zhou, Y. A research framework of land use transition in Suzhou City coupled with land use structure and landscape multifunctionality. Sci. Total Environ. 2020, 737, 139932. [Google Scholar] [CrossRef] [PubMed]
  24. Yang, Y.; Yang, X.; Li, E.; Huang, W. Transitions in land use and cover and their dynamic mechanisms in the Haihe River Basin, China. Environ Earth Sci 2021, 80, 50. [Google Scholar] [CrossRef]
  25. Tian, J.; Wang, B.; Zhang, C.; Li, W.; Wang, S. Mechanism of regional land use transition in underdeveloped areas of China: A case study of northeast China. Sci. Land Use Policy 2020, 94, 104538. [Google Scholar] [CrossRef]
  26. Long, H.; Li, T. The coupling characteristics and mechanism of farmland and rural housing land transition in China. J. Geogr. Sci. 2012, 22, 548–562. [Google Scholar] [CrossRef]
  27. Long, H.; Zhang, Y.; Ma, L.; Tu, S. Land use transitions: Progress, challenges and prospects. Land 2021, 10, 903. [Google Scholar] [CrossRef]
  28. Zheng, H.; Zhang, Z. Analyzing Characteristics and Implications of the Mortgage Default of Agricultural Land Management Rights in Recent China Based on 724 Court Decisions. Land 2021, 10, 729. [Google Scholar] [CrossRef]
  29. Tang, Y.; Yang, Y.; Xu, H. The Impact of China Carbon Emission Trading System on Land Use Transition: A Macroscopic Economic Perspective. Land 2022, 11, 41. [Google Scholar] [CrossRef]
  30. Lu, X.; Li, Z.; Wang, H.; Tang, Y.; Hu, B.; Gong, M.; Li, Y. Evaluating Impact of Farmland Recessive Morphology Transition on High-Quality Agricultural Development in China. Land 2022, 11, 435. [Google Scholar] [CrossRef]
  31. Cai, E.; Liu, Y.; Chen, W. Spatiotemporal characteristics of urban-rural construction land transition and rural-urban migrants in rapid-urbanization areas of central China. J. Urban Plan. Dev. 2020, 146, 05019023. [Google Scholar] [CrossRef]
  32. Qu, Y.; Long, H. The integrated research on regional land use recessive morphology from the perspectives of exploitation and output: The case of the Huang-Huai-Hai Region. Geogr. Res. 2017, 36, 61–73. [Google Scholar]
  33. Liu, Y.; Long, H. Land use transitions and their dynamic mechanism: The case of the Huang-Huai-Hai Plain. J. Geogr. Sci. 2016, 26, 515–530. [Google Scholar] [CrossRef] [Green Version]
  34. Wang, T.; Kazak, J.; Han, Q.; de Vries, B. A framework for path-dependent industrial land transition analysis using vector data. Eur. Plan. Stud. 2019, 27, 1391–1412. [Google Scholar] [CrossRef]
  35. Li, T.; Long, H.; Liu, Y.; Tu, S. Multi-scale analysis of rural housing land transition under China’s rapid urbanization: The case of Bohai Rim. Habitat Int. 2015, 48, 227–238. [Google Scholar] [CrossRef]
  36. Ke, S.; Wu, Y.; Cui, H.; Lu, X.; Ge, K.; Chen, D. The Temporal-Spatial Pattern and Coupling Coordination of the Green Transition of Farmland Use: Evidence from Hubei Province. Sustainability 2021, 13, 11892. [Google Scholar] [CrossRef]
  37. Wang, M.; Qin, K.; Jia, Y.; Yuan, X.; Yang, S. Land Use Transition and Eco-Environmental Effects in Karst Mountain Area Based on Production-Living-Ecological Space: A Case Study of Longlin Multinational Autonomous County, Southwest China. Int. J. Environ. Res. Public Health 2022, 19, 7587. [Google Scholar] [CrossRef]
  38. Niu, S.; Lyu, X.; Gu, G. A New Framework of Green Transition of Cultivated Land-Use for the Coordination among the Water-Land-Food-Carbon Nexus in China. Land 2022, 11, 933. [Google Scholar] [CrossRef]
  39. Zhang, B.; Sun, P.; Jiang, G.; Zhang, R.; Gao, J. Rural land use transition of mountainous areas and policy implications for land consolidation in China. J. Geogr. Sci. 2019, 29, 1713–1730. [Google Scholar] [CrossRef] [Green Version]
  40. Long, H. Explanation of Land Use Transition. China Land Sci. 2022, 36, 1–7. [Google Scholar]
  41. Chen, A.; He, H.; Wang, J.; Li, M.; Guan, Q.; Hao, J. A Study on the Arable Land Demand for Food Security in China. Sustainability 2019, 11, 4769. [Google Scholar] [CrossRef] [Green Version]
  42. Lambin, E.F.; Meyfroidt, P. Land use transitions: Socio-ecological feedback versus socio-economic change. Land Use Policy 2009, 27, 108–118. [Google Scholar] [CrossRef]
  43. Long, H. Land use transition and land management. Geogr. Res. 2015, 34, 1607–1618. [Google Scholar]
  44. Furgala-Selezniow, G.; Jankun-Woznicka, M.; Mika, M. Lake regionsregions under human pressure in the context of socio-economic transition in Central-Eastern Europe: The case study of Olsztyn Lakeland, Poland. Land Use Policy 2020, 90, 104350. [Google Scholar] [CrossRef]
  45. Ollinaho, O.I.; Kroger, M. Agroforestry transitions: The good, the bad and the ugly. J. Rural. Stud. 2021, 82, 210–221. [Google Scholar] [CrossRef]
  46. Huang, H.; Zhou, Y.; Qian, M.; Zeng, Z. Land Use Transition and Driving Forces in Chinese Loess Plateau: A Case Study from Pu County, Shanxi Province. Land 2021, 10, 67. [Google Scholar] [CrossRef]
  47. Ge, D.; Long, H.; Zhang, Y.; Ma, L.; Lie, T. Farmland transition and its influences on grain production in China. Land Use Policy 2018, 70, 94–105. [Google Scholar] [CrossRef]
  48. Long, H.; Ma, L.; Zhang, Y.; Qu, L. Multifunctional rural development in China: Pattern, process and mechanism. Habitat Int. 2022, 121, 102530. [Google Scholar] [CrossRef]
  49. Zhang, Y.; Long, H.; Ge, D.; Tu, S.; Qu, Y. Spatio -temporal characteristics and dynamic mechanism of farmland functions evolution in the Huang-Huai-Hai Plain. Acta Geogr. Sin. 2018, 73, 518–534. [Google Scholar]
  50. Han, D.; Qiao, J.; Zhu, Q. Rural-Spatial Restructuring Promoted by Land-Use Transitions: A Case Study of Zhulin Town in Central China. Land 2021, 10, 234. [Google Scholar] [CrossRef]
  51. Lyu, L.; Gao, Z.; Long, H.; Wang, X.; Fan, Y. Farmland Use Transition in a Typical Farming Area: The Case of Sihong County in the Huang-Huai-Hai Plain of China. Land 2021, 10, 347. [Google Scholar] [CrossRef]
  52. Zhang, Y.; Dai, Y.; Chen, Y.; Ke, X. The Study on Spatial Correlation of Recessive Land Use Transformation and Land Use Carbon Emission. China Land Sci. 2022, 36, 100–112. [Google Scholar]
  53. Long, H. Land Use Transitions and Rural Restructuring in China; Springer: Singapore, 2020. [Google Scholar]
  54. Niu, S.; Fang, B.; Cui, C.; Huang, S. The spatial-temporal pattern and path of cultivated lanf use transition from the perspective of rural revitalization: Taking Huaihai Economic Zone as an example. J. Nat. Resour. 2020, 35, 1908–1925. [Google Scholar]
  55. Du, G.; Guo, K.; Yu, F. Suggestions on the transition and regulation of farmland utilization function in Heilongjiang Province. Res. Agric. Mod. 2021, 42, 589–599. [Google Scholar]
  56. Zhu, W.; Wei, Y.; Tong, X. Research on the Coupling Development of Land Use Trans formation and Grain Production in Guangxi Province. J. Green Sci. Technol. 2021, 23, 229–232. [Google Scholar]
  57. Zambon, I.; Colantoni, A.; Carlucci, M.; Morrow, N.; Sateriano, A.; Salvati, L. Land quality, sustainable development and environmental degradation in agricultural districts: A computational approach based on entropy indexes. Environ. Impact Assess. Rev 2017, 64, 37–46. [Google Scholar] [CrossRef]
  58. Zahedi, F. The Analytic Hierarchy Process—A Survey of the Method and its Applications. Interfaces 1986, 16, 96–108. [Google Scholar] [CrossRef]
  59. Sun, Y.; Liu, F.; Li, B. A comparison of national innovation capacity and develop mode between China and Europe based on patent. Stud. Sci. Sci. 2009, 27, 439–444. [Google Scholar]
  60. Cunha-Zeri, G.; Guidolini, J.F.; Branco, E.A.; Ometto, J.P. How sustainable is the nitrogen management in Brazil? A sustainability assessment using the entropy weight method. J. Environ. Manag. 2022, 316, 115330. [Google Scholar] [CrossRef]
  61. Ying, L.; Shen, Z.; Piao, S. The recent hiatus in global warming of the land surface: Scale-dependent breakpoint occurrences in space and time. Geophys. Res. Lett. 2015, 42, 6471–6478. [Google Scholar] [CrossRef] [Green Version]
  62. Hu, Y.; Qiao, W.; Wan, Y.; He, T.; Chai, Y.; Bi, Y. Comprehensive Evaluation and Spatial Distinction of Land Use Efficiency in County Area of Jiangsu Province. Econ. Geogr. 2020, 40, 11. [Google Scholar]
  63. Huang, J.; Wang, X.; Rozelle, S. The subsidization of farming households in China’s agriculture. Food Policy 2013, 41, 124–132. [Google Scholar] [CrossRef]
  64. Song, J.; Chen, S. Coupling Relationship and Coordination Between Recessive Land Use Morphology and Land Eco-security in Fujian Province. Res. Soil Water Conserv. 2020, 27, 4. [Google Scholar]
  65. Cheng, J.; Cheng, J. The Spatio-Temporal Pattern, Driving Forces and Transformation Mode of Inter-provincial Recessive Land Use Morphology in China. China Land Sci. 2017, 31, 60–68. [Google Scholar]
  66. Jiang, M.; Li, Z.; Li, J.; Liu, X. Mutation Point Detection of Cultivated Land Use Transition and Its Spatial-Temporal Characteristics: Taking Dongchuan District of Kunming City as an Example China Land. China Land Sci. 2022, 36, 86–95. [Google Scholar]
  67. Ke, S.; Cui, H.; Lu, X.; Hou, J.; Wu, Y. Research on the Spatial-Temporal Pattern and Mechanisms of Green Transition of Farmland Use: A Case of Hubei Province. China Land Sci. 2021, 35, 64–74. [Google Scholar]
  68. Fu, H.; Liu, Y.; Sun, H.; Zhou, G. Spatiotemporal characteristics and dynamic mechanism of cultivated land use transition in the Beijing-Tianjin-Hebei region. Prog. Geogr. 2020, 39, 1985–1998. [Google Scholar] [CrossRef]
  69. Rignall, K.; Kusunose, Y. Governing livelihood and land use transitions: The role of customary tenure in southeastern Morocco. Land Use Policy 2018, 78, 91–103. [Google Scholar] [CrossRef]
  70. Romo-Leon, J.R.; van Leeuwen, W.J.D.; Castellanos-Villegas, A. Using remote sensing tools to assess land use transitions in unsustainable arid agro-ecosystems. J. Arid Environ. 2014, 106, 27–35. [Google Scholar] [CrossRef]
  71. Meyfroidt, P.; Lambin, E.F.; Erb, K.-H.; Hertel, T.W. Globalization of land use: Distant drivers of land change and geographic displacement of land use. Curr. Opin. Environ. Sustain. 2013, 5, 438–444. [Google Scholar] [CrossRef]
Figure 1. Location of the study area.
Land 11 01978 g001
Figure 2. Flow chart of the research process and method.
Land 11 01978 g002
Figure 3. Spatial distribution of the index of recessive cultivated land use morphology.
Land 11 01978 g003
Figure 4. Point mutation detection of the recessive index in the Huaibei region of the Jiangsu province between 1995 and 2020.
Land 11 01978 g004
Figure 5. (a) Changes in agriculture development data in the Huaibei region of the Jiangsu province between 1995 and 2020, and (b) changes in economic data in the Huaibei region of the Jiangsu province between 1995 and 2020.
Land 11 01978 g005
Figure 6. Mutant point detection of the recessive index concerning the eastern, middle, and western parts of the Huaibei region of the Jiangsu province between 1995 and 2020.
Land 11 01978 g006
Figure 7. Transition mode of recessive cultivated land use morphology.
Land 11 01978 g007
Table 1. The evaluation index system of recessive cultivated land use morphology.
Criterion LayerIndicator LayerIndex InterpretationWeight
Economic FunctionFood production indexGrain yield/Sown area of grain crops (kg/ha)0.021
Cultivated land productivityPlantation output value/Cultivated land (yuan/ha)0.296
Contribution to the national economyPlantation output value/Regional GDP (%)0.075
Average agricultural machinery power on cultivated landTotal power of agricultural machinery/Cultivated land area (J/ha)0.119
Social
Function
Cultivated land per laborerCultivated land/Number of agricultural laborers (ha/person)0.070
Grain security rateGrain yield/Resident population (kg/person)0.171
Income contribution from cultivated landRural per capita agricultural income/Rural per capita disposable income (%)0.033
Cultivated land per capitaCultivated land/total population (ha/person)0.056
Ecological FunctionAgricultural environmental impact indexFertilizer application amount/Cultivated land (kg/ha)0.043
Average crop yield on cultivated landCrop yield/Cultivated land (kg/ha)0.059
Diversity of crop speciesThe sum of the product of the proportion of crops sown area and its respective natural logarithm (include food crops, oil crops, cotton crops) (/)0.046
Proportion of cultivated land landscape areaCultivated land/Total land area (%)0.011
Table 2. Index and ranking of recessive cultivated land use morphology.
County Units1995 Index1995 Rank2020 Index2020 RankMeanMean RankCounty Units1995 Index1995 Rank2020 Index2020 RankMeanMean Rank
Yancheng0.35220.447220.3899Xuyi0.284120.57450.4402
Xiangshui0.33640.463200.38012Jinhu0.304100.73210.4761
Binhai0.277150.421230.33718Suqian0.262190.403250.31323
Funing0.279130.467190.33420Muyang0.31180.54580.4035
Sheyang0.37510.53290.4283Siyang0.267180.513110.35916
Jianhu0.248210.469180.35817Sihong0.278140.458210.36015
Dongtai0.30590.499120.38510Xuzhou0.170240.471170.30524
Lianyungang0.124250.410240.29025Fengxian0.258200.56260.34518
Donghai0.34730.521100.4036Pei0.268170.59640.3947
Guanyun0.31270.493150.36314Suining0.246220.495140.33022
Guannan0.286110.63520.4044Xinyi0.32360.481160.33021
Huai’an0.271160.55170.38111Pizhou0.222230.60030.37113
Lianshui0.33050.497130.3938
Publisher’s Note: MDPI stays neutral with regard to jurisdictional claims in published maps and institutional affiliations.

