
Sulphur Contents in Arable Soils from Four Agro-Ecological Zones of Ghana

1
Department of Soil Science, School of Agriculture, College of Basic and Applied Sciences, University of Ghana, Legon, Accra P.O. Box LG 245, Ghana
2
International Institute for Environment and Development, London WC1V 7DN, UK
*
Author to whom correspondence should be addressed.
Land 2022, 11(10), 1866; https://doi.org/10.3390/land11101866
Submission received: 2 October 2022
/
Revised: 16 October 2022
/
Accepted: 17 October 2022
/
Published: 21 October 2022
(This article belongs to the Special Issue Social and Environmental Trade-Offs in African Agriculture: Achieving Sustainable Development Goals)
Abstract
:There is limited data on Sulphur (S) contents in arable soils for appropriate fertilizer recommendations in Ghana. Five study areas in a reconnaissance survey (RS), followed by an in-depth study of two areas comprising farms of different durations of cultivation, were investigated for the current total S and sulphate contents. Basic soil properties were measured using standard laboratory procedures. Total S and sulphate contents were determined using LECO instrument dry combustion and HPLC, respectively. The results showed wide variations in total S contents from 31 to 603 mg kg−1 in the Guinea Savannah (GS) zone. The mean trend was Forest > Forest-Transition (F-S) > north Guinea Savannah (nGS) > Deciduous Forest (DF) > south Guinea Savannah (sGS) in the RS sites, with a similar trend in the main study sites. Sulphate contents ranged from 5 to 25 mg kg−1, constituting 0.8 to 37% of the total S. The mean percent trend was sGS = DF > Forest > nGS > F-S. Soil organic carbon (SOC) was the major predictor of total S along with pedogenic minerals. Total S and crystalline pedogenic minerals predicted the sulphate contents. The results highlight the need for ecologically-based S fertilizer programmes to boost crop yields.
Keywords:
crop yields; duration of cultivation; HPLC; native vegetation; pedogenic minerals; sulphate; total S1. Introduction
Low soil fertility, leading to yield reduction and increasing yield gaps [1,2], is recognized as a driver of farmland expansion in Sub-Saharan Africa [3,4]. Integrated soil fertility, using a combination of inorganic and organic soil amendments, is considered to be the most appropriate approach in a smallholder farming context [5]. However, major nutrient combinations in the form of nitrogen (N), phosphorus (P) and potassium (K) dominate the Sub-Saharan African fertilizer market in NPK compound fertilizers without added sulphur (S), calcium (Ca) or magnesium (Mg). The continuous use of these fertilizers creates a nutritional imbalance, as observed in the widespread soil S deficiency [6,7]. The imbalances have implications for soil microbial community structure and activity [8,9], crop yields [10], ecosystem health [10,11], and agricultural sustainability [11]. The S deficit has been widely attributed to reduced atmospheric S deposition, increased use of low S mineral fertilizers, low utilization of animal manure, continuous cultivation with low nutrient inputs and high crop residue removal, intense use of high-yielding crop cultivars, etc. [6,12]. Sulphur and N define crop productivity [13] because of the close N-S functions in cellular processes and secondary metabolism [14]. This makes S the fourth important plant nutrient [6,15,16]. A review of the effects of secondary nutrients and micronutrients in sub-Saharan Africa [17] revealed that the application of S achieved agronomic efficiencies in many countries. They, therefore, concluded that soil S deficit is a setback to crop productivity due to the current low yields compared to those obtained through S application. Thus, the inclusion of S fertilizers (inorganic and organic) could boost crop yields and food security [15] for the following reasons: (1) Crops have similar requirements for S and P [16]; (2) S deficiency affects N uptake [12,18] since S and N play synergistic roles in the biosynthesis of protein and Vitamin B1 [19,20]; (3) Sulphur is essential because it is a component of some amino acids (i.e., cysteine, cystine and methionine), vitamins, coenzymes, glucoside oils and is indispensable for their synthesis [14,21]; (4) Sulphur is also a component of several compounds that are responsible for aroma, taste and flavour of foods and beverages [22]. This implies that low soil S contents may affect not only yield but also the quality of crops and food nutrition.
Sulphur deficiency could be one of the drivers of the existing large yield gaps in West Africa [23] because the application of S and micronutrients increased maize yield by 25% [17] and 29% [24] compared to regular NPK compound fertilizers. Specifically, the inclusion of S fertilizer increased rice grain in the Guinea Savannah zone by 65% [23]. A study conducted in lowland soils of the Equatorial forest, Guinea savanna, Sudan savanna, and Sahel savanna zones of West Africa found limited but highly variable quantities of sulphate [25]. According to the 2017 annual report of the Ghana Ministry of Food and Agriculture (MoFA) (i.e., “Facts and Figures”), the actual yields of major cereals, legumes and root crops in Ghana range between 32.6 and 55% of potential yields [26]. This implies that yield gaps of 45 to 67.4% in Ghana remain to be closed. The current flagship programme (Planting For Food and Jobs), which aim to boost agriculture in Ghana, promote the increased use of fertilizers through subsidies. Over the years, there has been an enormous focus on fertilizers such as urea, NPK compound fertilizers of varying ratios, and ammonium sulphate (the only S-supplying, but acidifying, fertilizer) [26]; personal communication with farmers at the study sites). Moreso, the MoFA annual Facts and Figures report does not report S data as part of the information on soil properties relevant for crop production.
Sulphur research in Ghana dates back over four decades [25,27,28,29]. Safo and Sekou [29] focused only on available S (sulphate) in soils of cocoa plantations and cassava farms in the Deciduous Forest zone and found varied amounts of 3.3 to 23.4 mg kg−1. Acquaye and Beringer [27] studied S forms and distributions in soil profiles, whereas Acquaye and Kang [28] studied S status in surface soils of the Forest, Deciduous Forest and Guinea Savannah zones of Ghana. They found total S in the range of 9 to 347 mg kg−1 in both cases with sulphate contents of 3 to 39 mg kg−1, where the Forest zone had consistently higher S contents than the Guinea Savannah zone. The study by Buri et al. [25] covered lowland areas of the West African sub-region. They also found variations across the flood plains, where the sulphate contents were 3.4 and 4.9 mg kg−1 for river flood plains and inland valley swamps, respectively. Currently, it is uncertain what the S contents in Ghanaian soils are. The only other recent S data are from Tsujimoto et al. [23], who investigated the effects of S on rice yields on cultivated and non-cultivated White Volta floodplain soils of the Guinea Savannah zone. Given the existing yield gaps, the adoption of appropriate S fertilizers could contribute to closing the yield gaps. If S fertilization (applied as elemental S, gypsum, ZnS, (NH4)2SO4 at 5 to 68 kg ha−1) increased maize yields by >20% and rice yields by >60%, a conscious S countrywide fertilizer programme (an integration of both inorganic and organic sources) could contribute to closing the current yield gaps of maize and rice under recommended growing conditions. To achieve this, adequate data on current soil S contents in Ghanaian soils will be required. It also calls for a drastic shift from the continuous use of only NPK fertilizers to the inclusion of suitable S fertilizers to enhance yields from the already degraded soils.
Consequently, this study was conducted to investigate S contents in selected arable soils from four agro-ecological zones of Ghana involving over one hundred farms of different durations of continuous cultivation. It was hypothesized that S levels in the arable soils will vary due to continuous crop production with limited fertilizer use, farming systems, and types of fertilizers used. The research questions considered are: What are the current total S and sulphate levels in soils of farms of different duration of cultivation and wealth categories? What factors drive these S contents? How could these contents influence crop yields and yield gaps? Which S fertilizers could address the gaps?
2. Materials and Methods
2.1. Study Sites
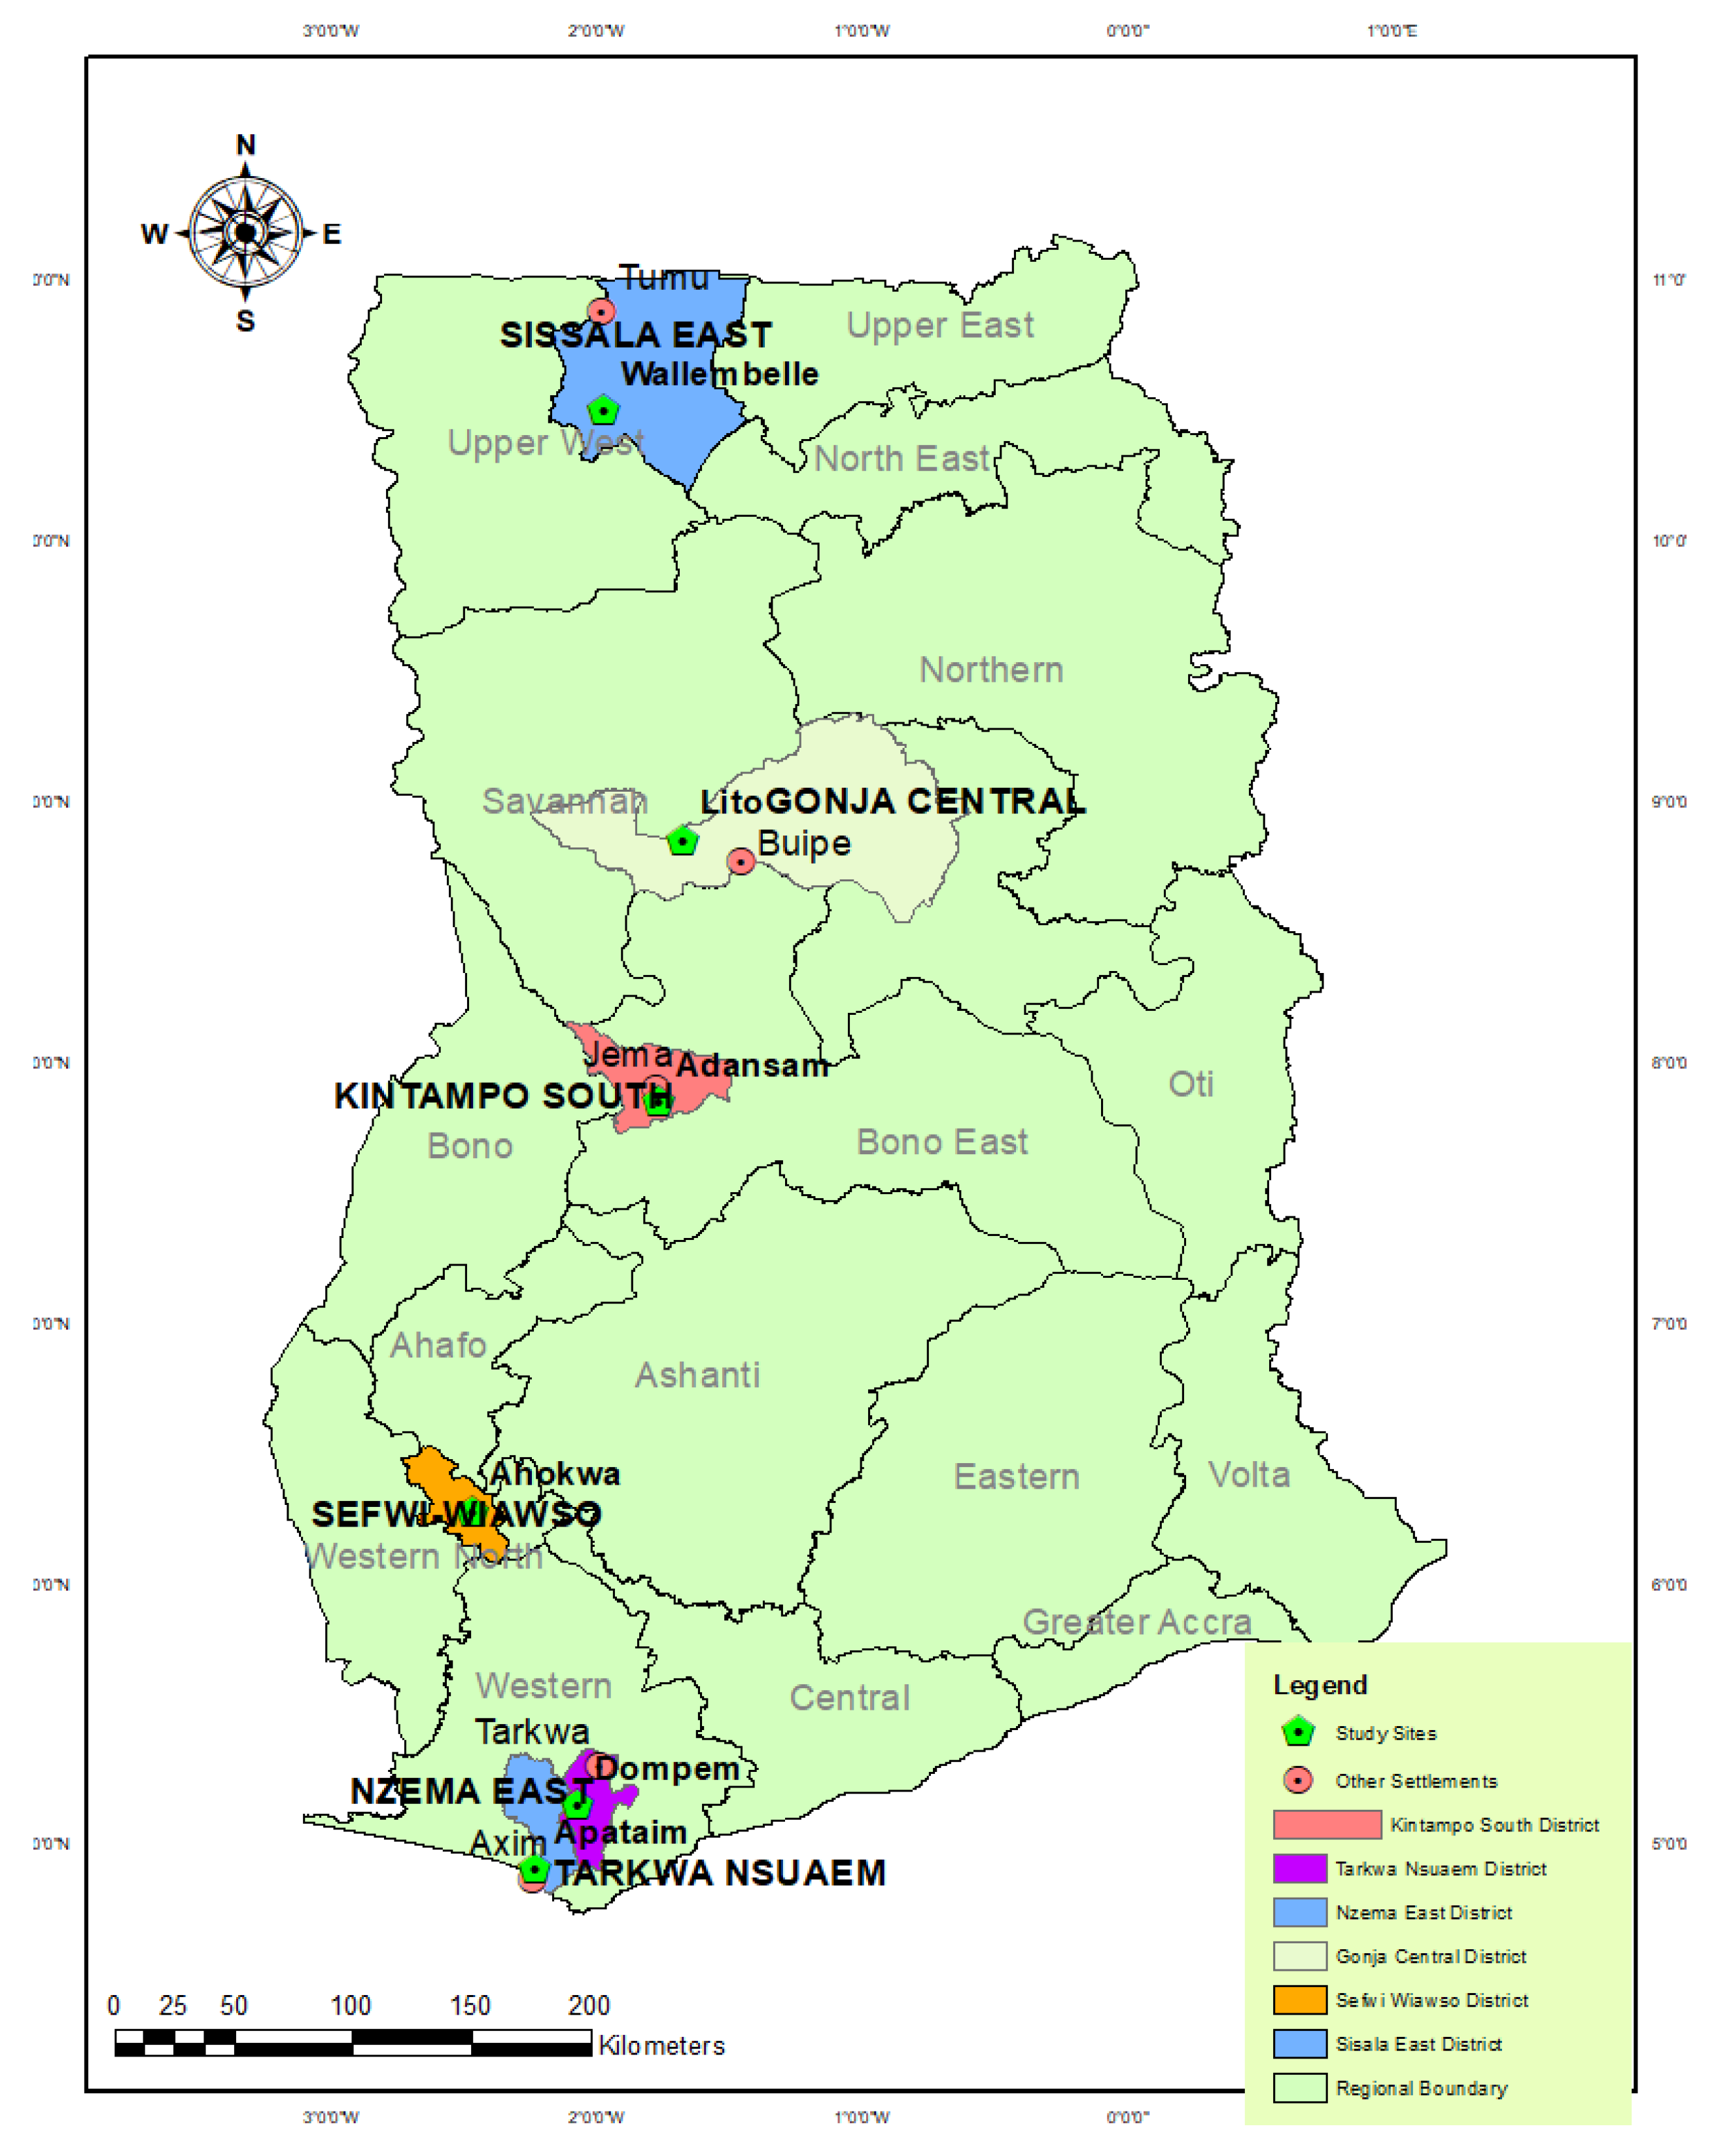
The study was conducted in two stages, as part of the Sentinel Project (Social and Environmental Trade-offs in African Agriculture—https://www.sentinel-gcrf.org/, accessed on 20 October 2022). The first stage was conducted in five out of six areas located in different agro-ecological zones of Ghana selected for a reconnaissance survey of the Sentinel Project (Figure 1). The ecological zones are listed from the wet to relatively dry zones below (except for Apataim, which had similarities with the Dompem area):
- Dompem, Forest zone: native vegetation, a mature cocoa (Theobroma cacao L.) plantation, a young cocoa plantation and a mixed farm comprising plantain (Musa paradisiaca L.), banana (Musa sp. L.), cassava (Manihot esculenta Crantz), and pineapple (Ananas comosus (L.) Merr.) with one-year old cocoa seedlings. The geology of the Dompem site is dominantly Birrimian formation comprising argillaceous sediments, volcanic and calcareous materials that metamorphosed into folded granite, and Tarkwaian formation comprising sandstones, phyllites and conglomerates.
- Sefwi-Ahokwa, Deciduous Forest zone: native vegetation under the Taungya agroforestry system, mature cocoa and oil palm plantations. The geology is Birrimian with argillaceous sediments, volcanic and calcareous materials that metamorphosed into folded granite or intruded by granite.
- Adansam, Forest -Savannah Transition zone: native vegetation, a mango plantation and two yam (Dioscorea sp.) farms located on two different soil types. The geology is located on the Voltaian system comprising mudstone, sandstone, conglomerates, tillites and limestone.
- Lito, Guinea Savannah zone: native vegetation and two yam farms. The geology is located on the Voltaian system comprising mudstone, sandstone, conglomerates, tillites and limestone.
- Wallembelle, Guinea Savannah zone: native vegetation, maize (Zea mays L.) and soybean (Glycine max (L.) Merr.) farms. The geology is dominantly granite.
Random sampling was employed at the reconnaissance survey sites to observe the variability across the fields. Five independent samples were taken to 20 cm depth at different spots at about 5–10 m apart, depending on the size and nature of the site.
The second stage of the study focused on two locations: the Dompem-Pepesa area located in the Tarkwa-Nsuaem Municipality in the Forest zone and the Adansam-Kokuma area within the Kintampo South District in the Forest-Savannah Transition zone of Ghana (Figure 1). Whereas the reconnaissance survey farms and native vegetation were selected based on site and farmer availability, the farms for the final study were selected based on wealth categories and duration of cultivation (farm types) [30]. The basis for selecting the sites, description of the two sites and sampling have already been described by Neina and Agyarko-Mintah [30].
2.2. Laboratory Procedures
The basic properties of the soil such as pH, exchangeable bases, effective cation exchange capacity (ECEC), pedogenic minerals (Al and Fe), total carbon (C) (i.e., SOC since no carbonates were present in the soil) and total S have already been described in Neina and Agyarko-Mintah [30]. The available S (sulphate) contents in the soils were determined by Ion Chromatography (Shimadzu HPLC IC 20A System), after extracting air-dried soil (<2 mm) using 500 ppm P of Monocalcium Phosphate (Ca(H2PO4)2) at 2.5:1 extractant to soil ratio [31].
2.3. Statistical Analyses
Some samples were below detection for total S both in the reconnaissance survey and the main study samples. Therefore, only farms containing total S were used to identify the farms for statistical analyses. This defeated the aim of including wealth rank as a factor along with farm types in the main study. Consequently, nine farm replicates were obtained for Dompem, whereas five were obtained for Adansam. All the data were checked for conformity to Analysis of Variance (ANOVA), bivariate correlation and multiple linear regression using SPSS Version 20 (IBM, New York, NY, USA). Where necessary, non-normal data were log- or square root transformed. The data were assessed to examine whether the duration of cultivation had significant impacts on the soil properties using One-Way ANOVA and the means were compared using Tukey HSD tests at a 5% level of significance. In the case of non-normal data, non-parametric statistics such as Kruskal-Wallis/Mann-Whitney U Tests were applied. Multiple regression was run to identify the predictors of the total S and sulphate contents, using the stepwise forward method in SPSS version 20. All regression models were tested for normality, constancy of variance, absence of correlation between the residuals (Durban–Watson statistics) and absence of multi-collinearity, calculating the variance inflation factor (VIF). Pearson’s and Spearman’s correlations were conducted for normal and non-normal data to test relationships among the soil properties. The graphs were created using Sigma Plot 12.
3. Results
3.1. Basic Properties of the Soils
The texture of the reconnaissance survey sites were dominantly clayey textures for the Forest, sandy clay for the Deciduous Forest, sands for the Forest-Savannah Transition and sandy loams for soils of the Guinea Savannah zones (Table 1). Further, the Forest, Deciduous Forest and Forest-Savannah Transition zones had lower bulk densities (<1.3 g cm−3) than the Guinea Savannah zone (≤1.5 g cm−3). The soil organic carbon (SOC) contents in the reconnaissance survey soil decreased by about 70% as one traverses from the Forest zone and Deciduous Forest zones towards the Forest-Savannah Transition zone, but increased by 20 to 30% towards the Guinea Savannah zone (Table 2). For the main study, the basic properties of the soils have already been described in Neina and Agyarko-Mintah [30]—although the data overlaps because of differences in the S contents.
3.2. Total S Contents and Trends
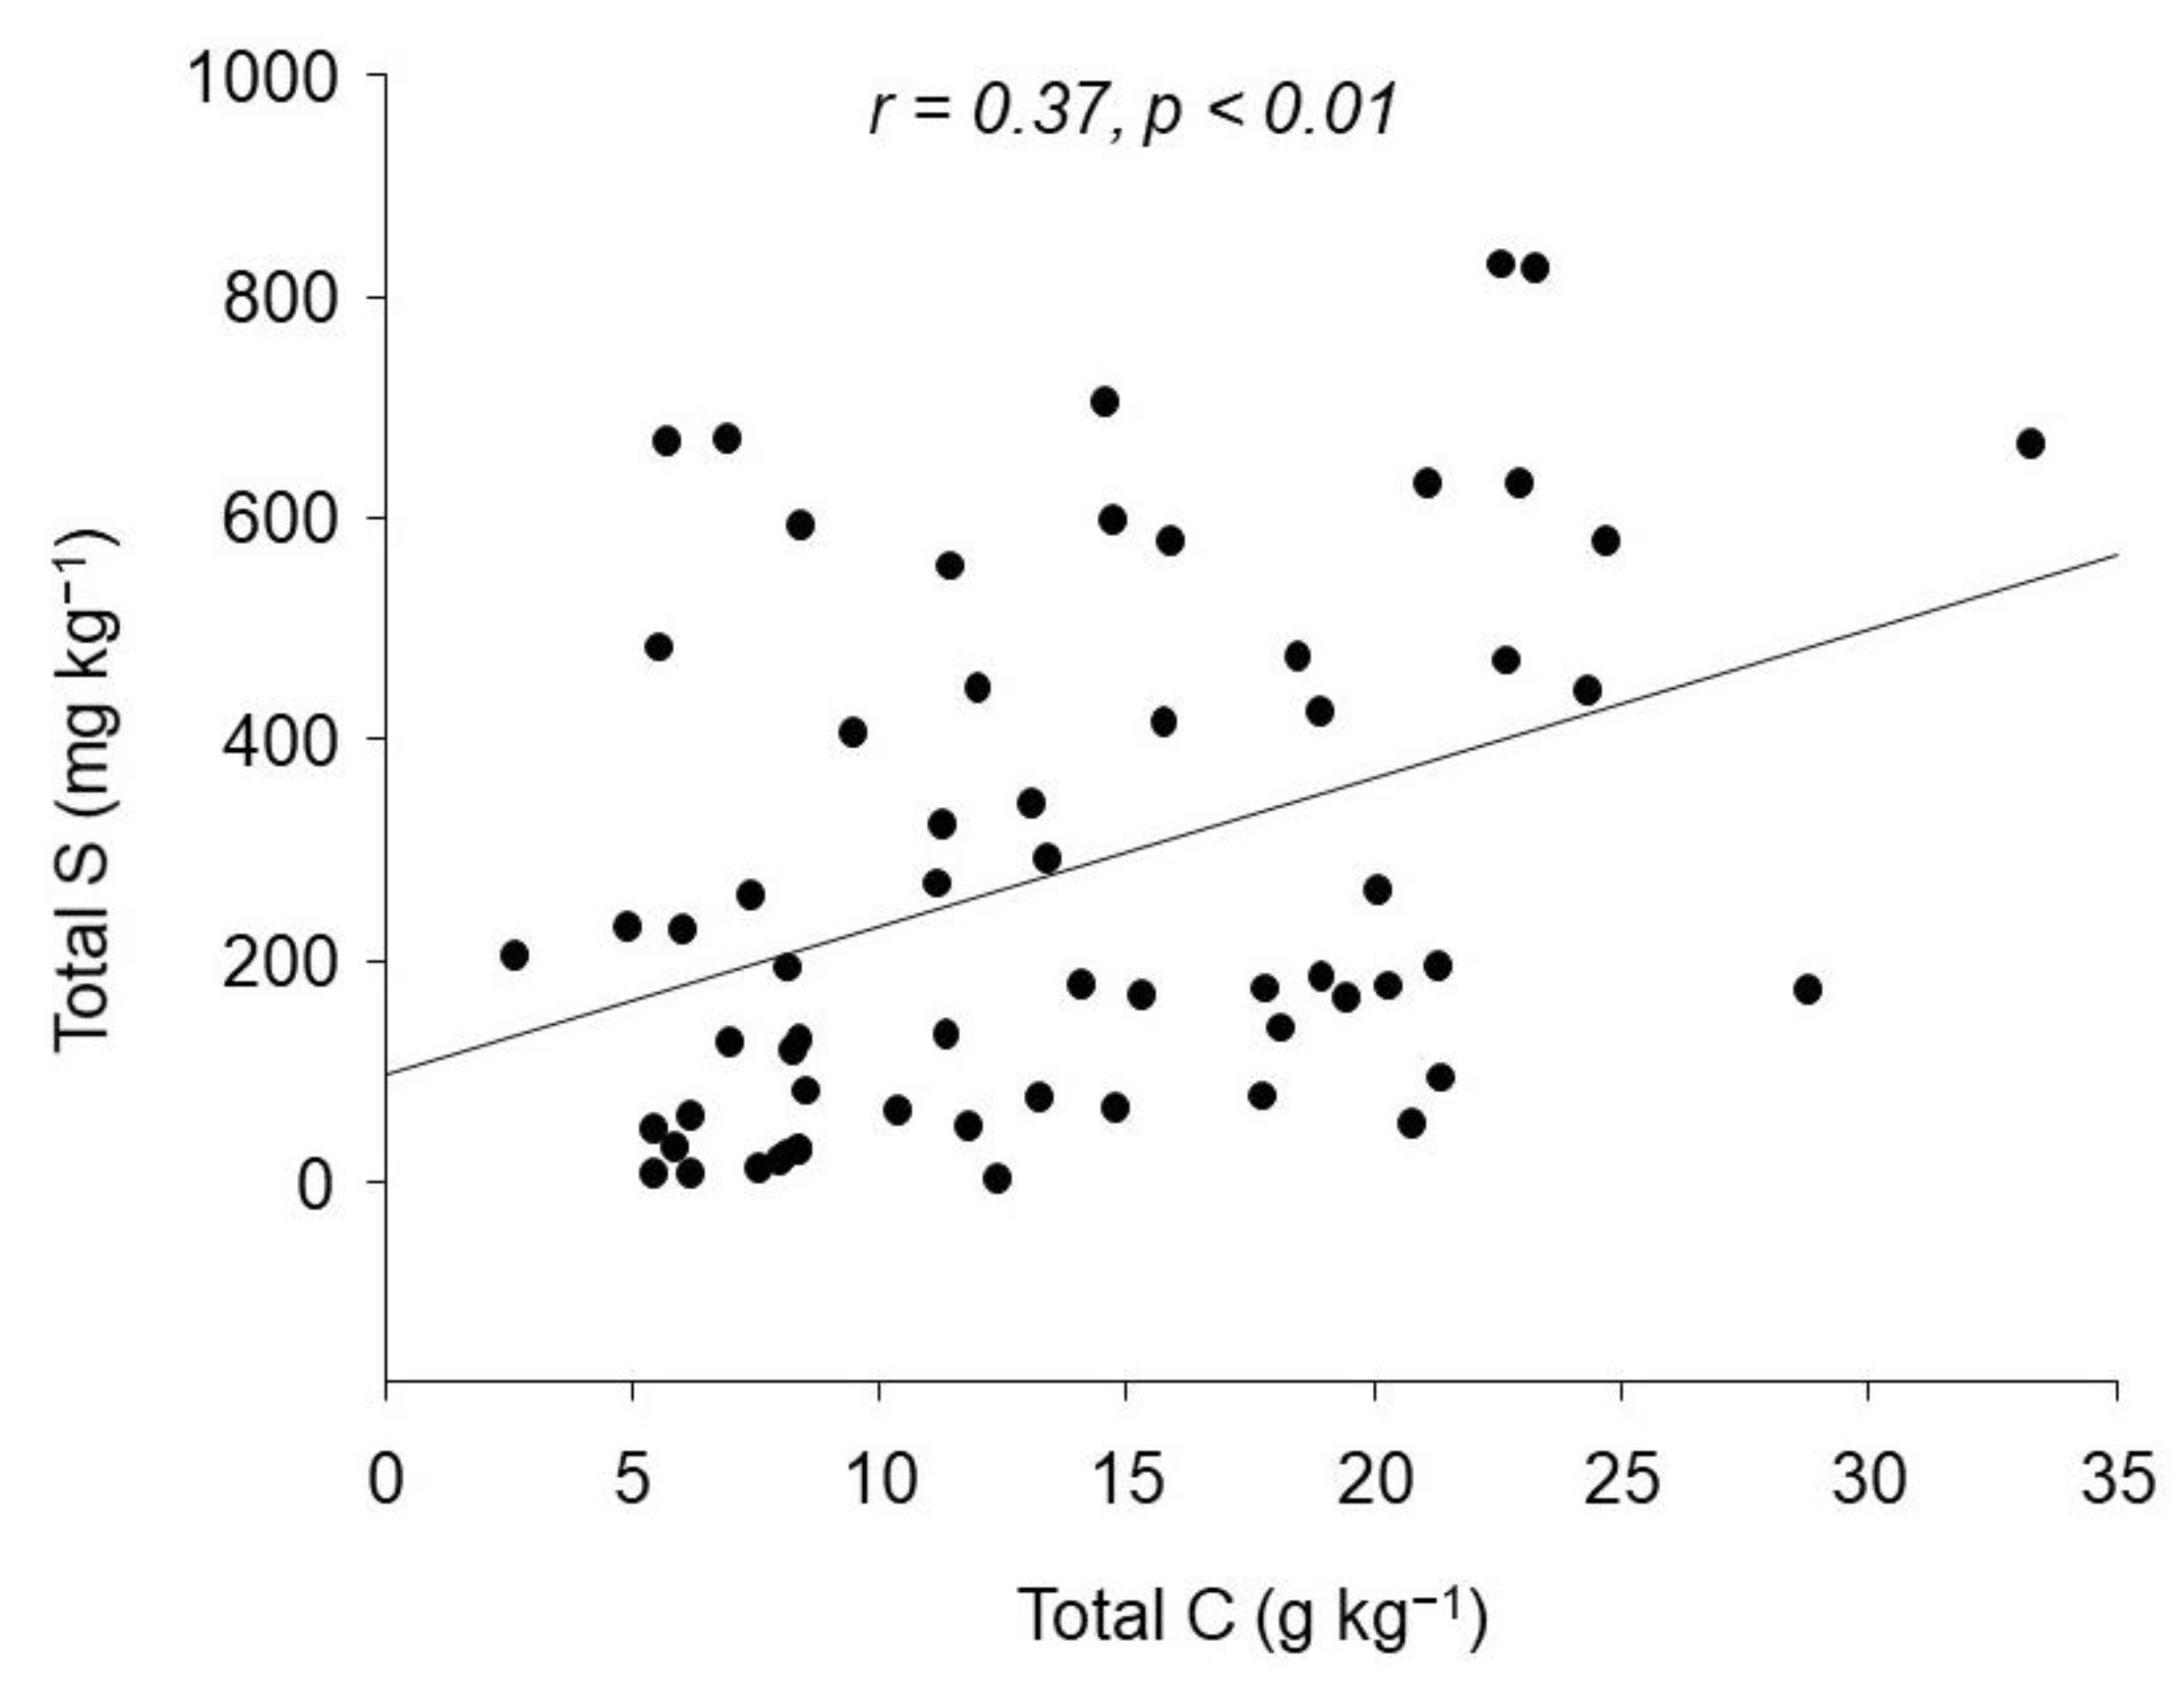
The results of the reconnaissance survey showed a wide variation in the total S contents among the croplands and native vegetation in the ecological zones. The mean total S content ranged from 31 mg kg−1 in the native vegetation of Lito to 603 mg kg−1 in the maize farm of Wallembelle, both in the Guinea Savannah zone (Table 2). A wavy trend in the total S content is observed from the Forest zone in the south toward the Guinea Savannah zone in northern Ghana. For instance, the total S contents decreased by about 75% as one traverses from the Forest zone to the Deciduous Forest zones, increased by 52% in the Forest-Savannah Transition zone, decreased again by 60% in the Forest-Savannah Transition zone followed by another increase by 62% in the Guinea Savannah zone (Table 2). The total S content was detected in all independent replicates and sites of the Rain Forest and Deciduous Forest agro-ecological zones of Ghana, i.e., Dompem and Sefwi- Ahokwa (Table 2). The mean total S trend was Dompem > Adansam > Wallembelle > Sefwi- Ahokwa > Lito. In the Guinea Savannah zone, total S was detected in all independent replicates and sites of Lito. For Wallembelle, in the same agro-ecological zone, S was detected in all three sites but not in all samples (i.e., one replicate for forest, three for maize and two for soybean farms). In the soils of the Forest-Savannah Transition the total S was generally below detection. For instance, the total S contents of most of the croplands from Adansam were below detection. Sulphur was detected in only two of the four sites sampled, i.e., only one replicate of the yam farm and three replicates of the mango farm (Table 2). As a result, ANOVA was only performed on the total S contents of the Dompem and Sefwi-Ahokwa soils because of missing data points. However, no significant differences were observed in the total S contents of the two sites (Table 2). A Spearman correlation revealed a weak positive correlation (r = 0.37, p < 0.01) between the total S and SOC of all the sites (Figure 2).
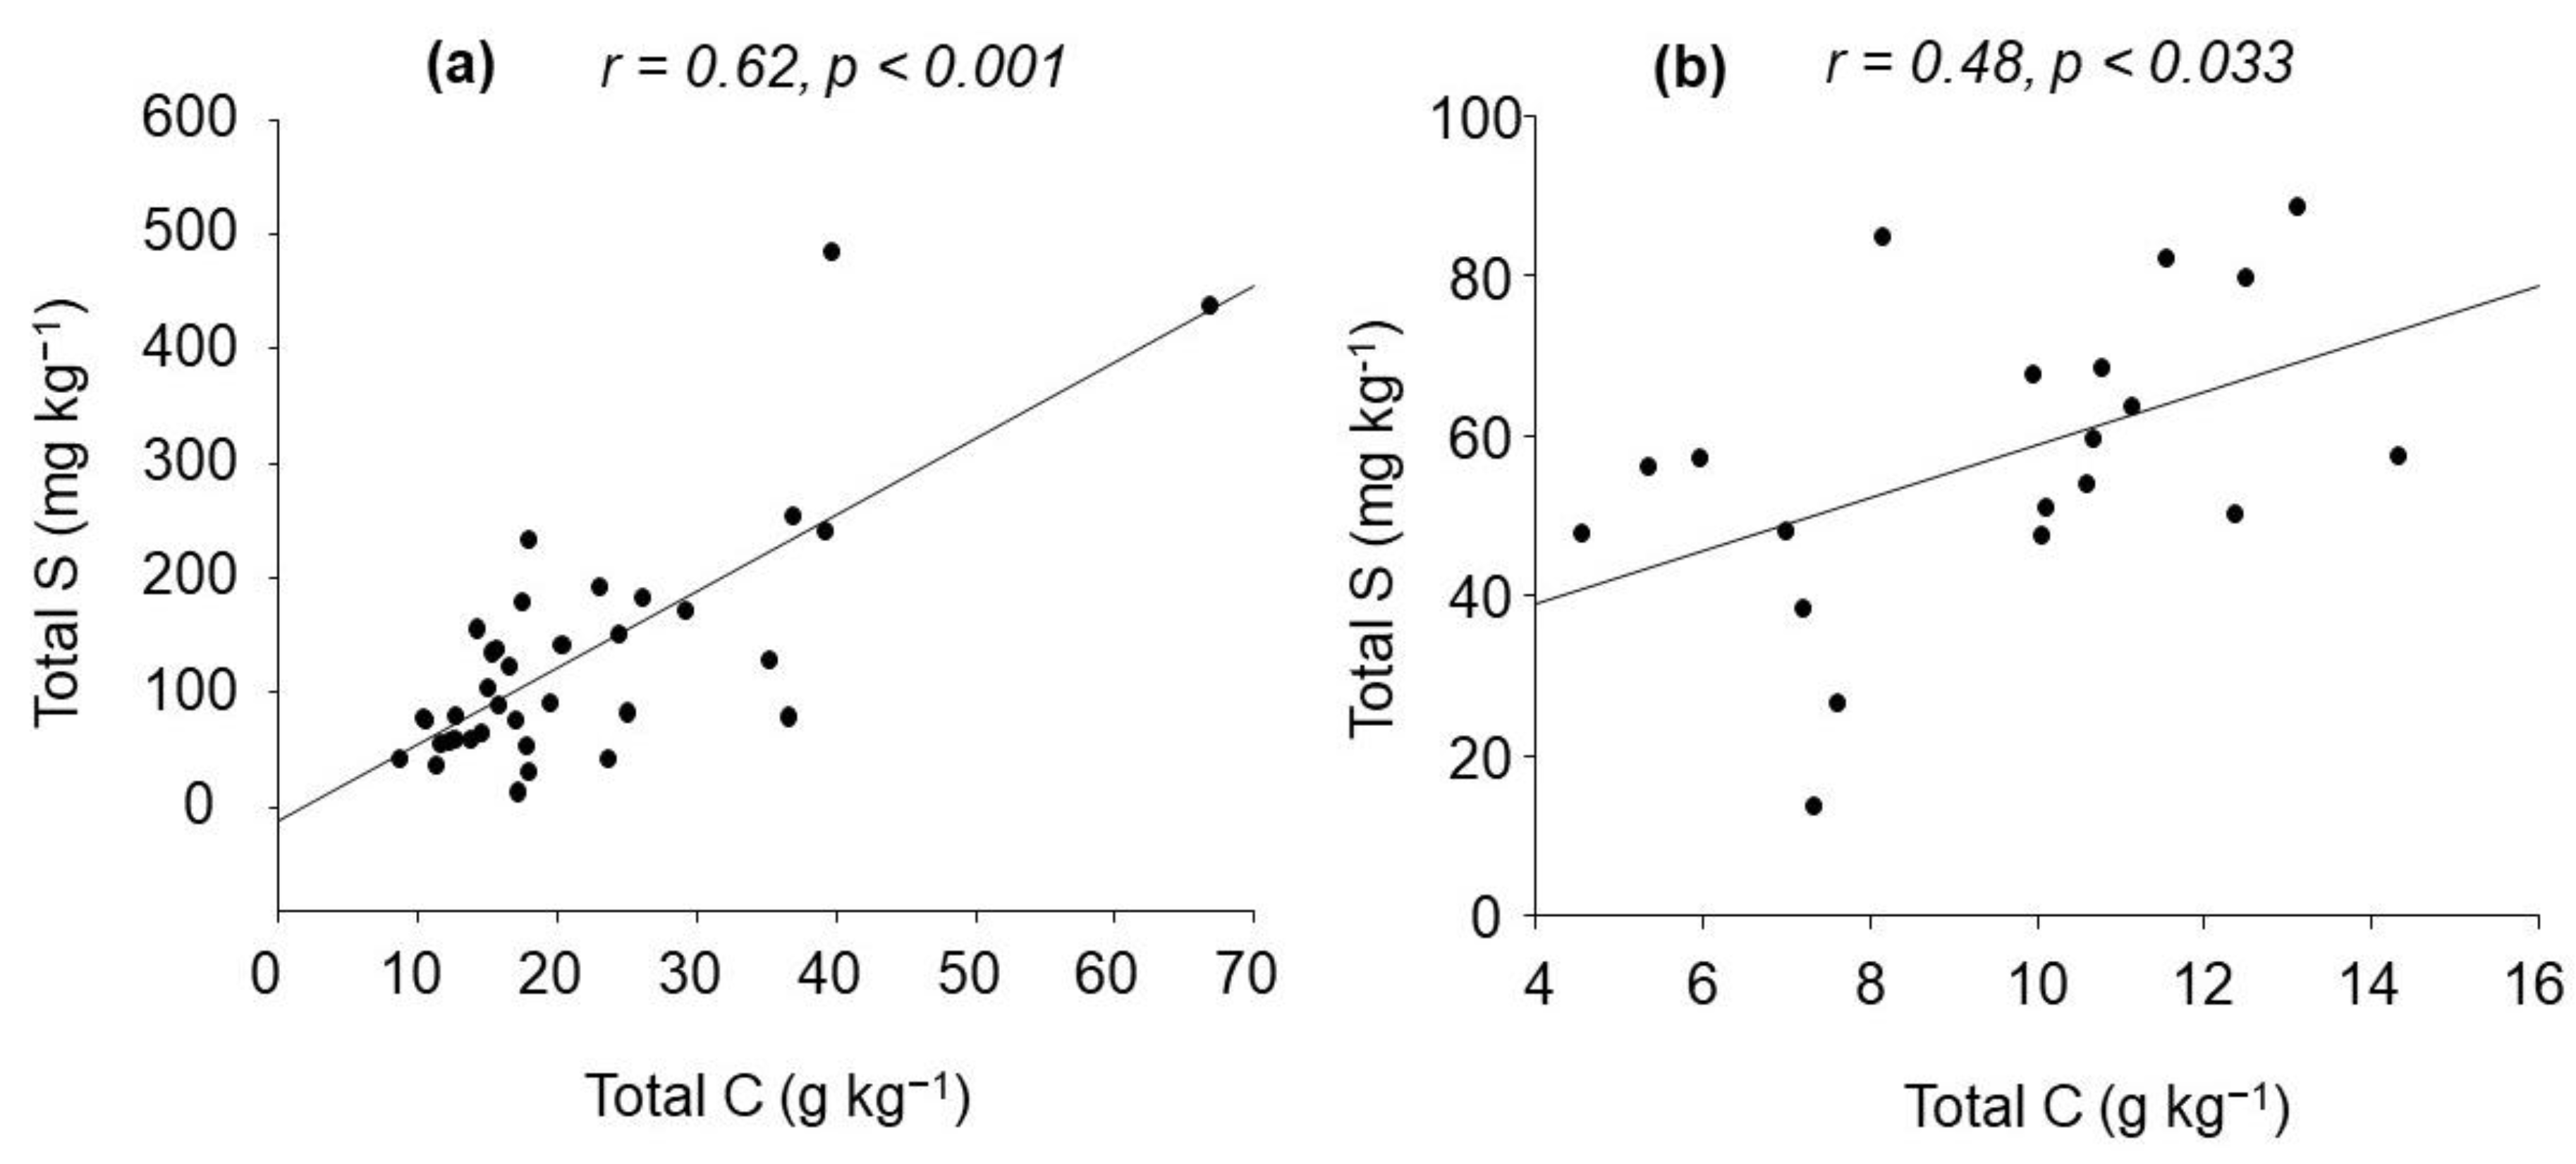
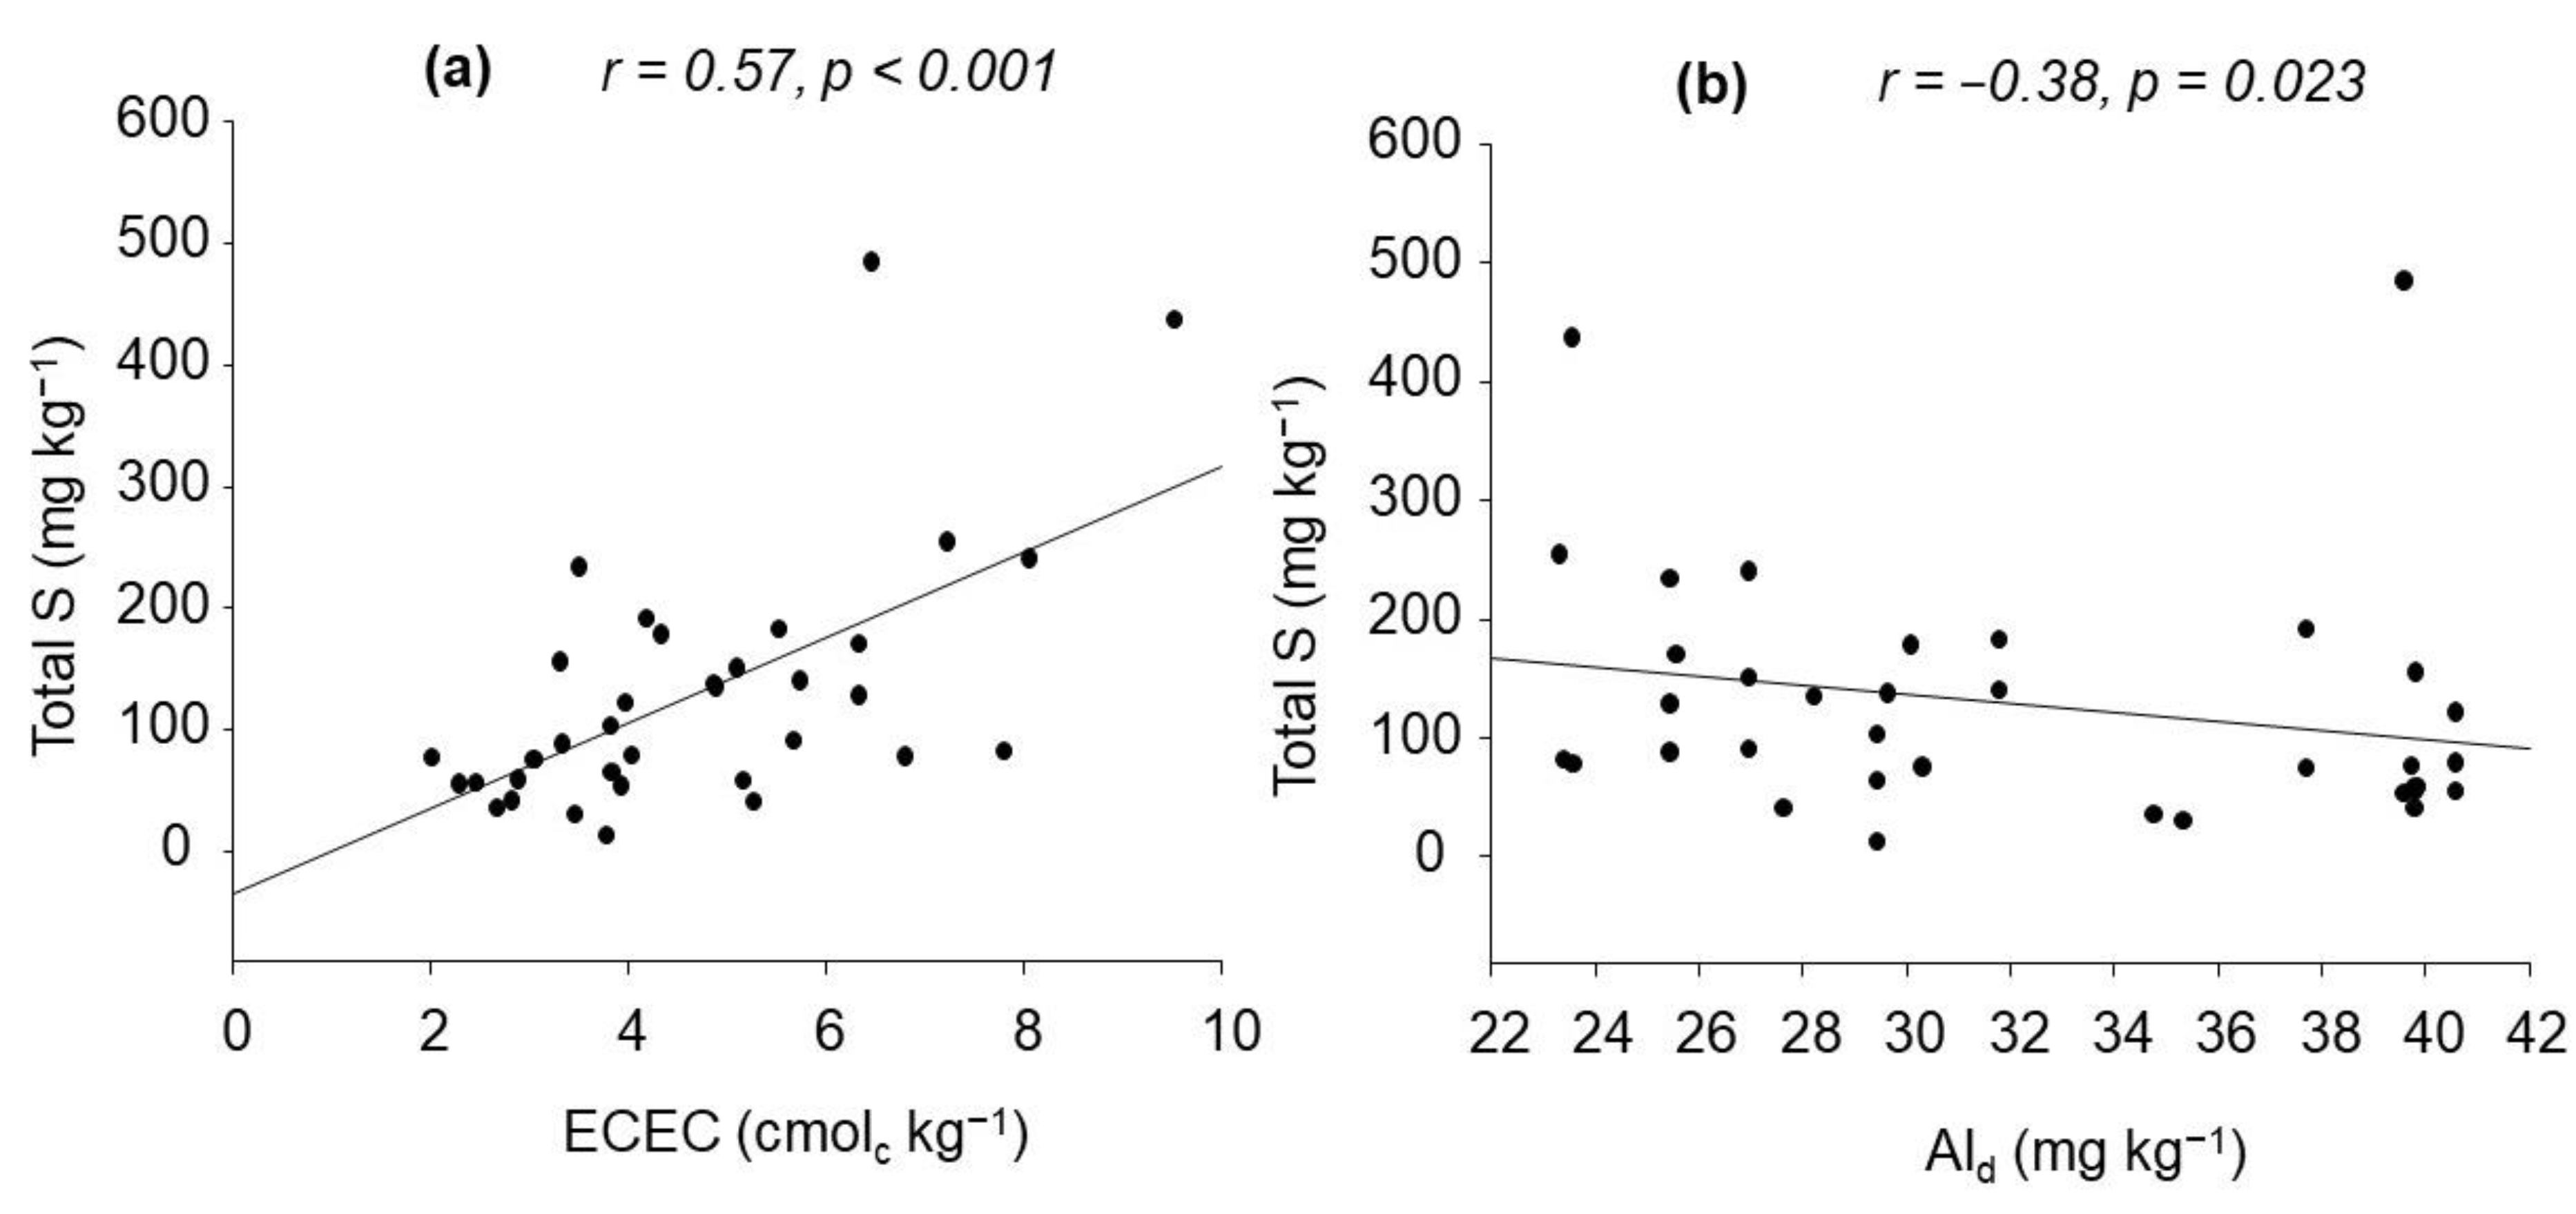
For the main research at the final two sites, total S was below detection in 21% of the 51 farms sampled from Adansam. The mean S contents of the Dompem soils ranges from 98.5 to 236.2 mg kg−1 and differed (p = 0.043) among the farm types. The total S contents of the Dompem soils decreased with the duration of cultivation by 28, 91 and 19 mg kg−1 in years three, five and ten, respectively. It was almost three-fold (Table 3) those of Adansam, which also differed among farm types with the highest and lowest total S contents in the ten and five years farms, respectively. A Pearson correlation revealed strong positive correlations (r = 0.62, p < 0.001) between the Dompem total S and total C (Figure 3a) and ECEC (r = 0.57, p < 0.001) (Figure 4a). A non-parametric Spearman correlation also showed a moderate correlation between the Dompem total S and Ald (r = −0.38, p < 0.05) (Figure 4b). The regression model showed that SOC alone accounted for 38.1% of total S in the Dompem soils, while Feox contributed 7.1%, giving a coefficient of determination (R2) of 45.2% (p < 0.001). A Pearson correlation revealed a moderate positive correlation between the Adansam total C and total S (r = 0.48, p < 0.033) (Figure 3b). Again, the regression model revealed that the clay content accounted for 35.2% (p < 0.01) of the total S in the Adansam soils.
3.3. Sulphate Contents and Trends
Unlike the total S, sulphate was detected in all five replicates of all the reconnaissance sites from all the agro-ecological zones, ranging from 5 to 25 mg kg−1 for the Dompem sites. The sulphate contents constituted 0.8 to 7.5% of the total S for Dompem, 8.2 to 12.7% for Sefwi, 1.5 to 2.7% in Adansam, 4.5 to 37% in Lito and 1.5 to 3.4% in Wallembelle soils. The mean percent trend was Lito = Sefwi- Ahokwa > Dompem > Wallembelle > Adansam. For the main study in Dompem and Adansam, the mean sulphate contents of both study sites were similar (i.e., 10.4 and 10.3 mg kg−1), but differed among the farms (p < 0.05) (Table 3). There was no clear trend in the sulphate contents in both study areas with regards to the duration of cultivation. However, they appeared to mirror each other, where the sulphate content in the Dompem soils decreased by almost half in year ten, whereas those of Adansam more than doubled in years five and ten (Table 3). The Dompem sulphate contents ranged from 4.8 to 10.2% of total S, whereas those of Adansam ranged from 10.4 to 41% of total S. A Pearson correlation between the Dompem total S and sulphate showed a weak positive correlation (r = 0.39, p < 0.05). For the Adansam soils, Spearman correlations showed strong negative relations between sulphate and Ald (r = −0.73, p < 0.001) and sulphate and Fed (r = −0.70, p < 0.01). The regression model showed that Fed alone accounted for 72% of the sulphate content, whereas Ald contributed 14.5%, yielding a coefficient of determination (R2) of 86.5% (p < 0.001) for the Adansam soils.
4. Discussion
The basic properties of the study areas are a reflection of the interactions between the geology and agro-ecological zone. Consequently, the textural classes, along with the SOC contents, produced increasing trends in bulk densities as one moves from the wet ecological zones of southern Ghana to the relatively drier and low biomass ecological zones of northern Ghana. Generally, cultivation increases bulk density [32] depending on the tillage method and crops grown [33], as observed in most of the cultivated soils (Table 1). In the reconnaissance survey soils, specific differences can be observed at the different locations due to effects of particle size distributions and SOC contents. For instance, the bulk densities of the Dompem cocoa plantations were higher than that of the native vegetation, except for the vegetable farm. The observation is attributed to small scale differences in the particle size distributions and SOC contents. The vegetable farm had 17, 9.0 and 7.3% less sand, silt and clay in addition to 1.5 g kg−1 less SOC compared to the native vegetation (Table 1). The Sefwi-Ahokwa soils showed increased bulk densities in the croplands. There was no particular trend in bulk densities of the Adansam croplands. However, the bulk densities of the yam farms were almost similar to those of the native vegetation because mounding reduces soil bulk density to enhance yam tube expansion [34]. The difference between the two yam farms is caused by soil type, particle size distribution and SOC contents (Table 1 and Table 2). The SOC content of the Adansam native vegetation is due to the nature of the site, which affected the C turnover. The vegetation was thick and had a turf of root network, which limits rainwater flow through the canopy and subsequent infiltration into the deeper soil layers. Such conditions affect microbial activities and organic matter decomposition. Generally, most of the soils have been exposed to prolonged leaching, resulting in a loss of the original nutrients in the parent materials [35]. This has fashioned out soil types with the soil pH, δpH ECEC, SEB and pedogenic Al and Fe of the soils [30]. The properties presented have both direct and indirect effects on soil S and its dynamics in each agro-ecological zone.
The study confirmed a wide variability in total S contents in both reconnaissance survey sites and the main study farm types (Table 2 and Table 3). These may be attributed to the different crops grown either in sole or mixed patterns. Interviews conducted with the farmers revealed that 71% of the farms sampled in Dompem were mixed crop systems, dominated by heavy-feeding crops such as cassava, maize and rice. For the Adansam soils, only 16% of the farms were a mixed crop system, but the sole crops were mostly heavy-feeding yam. The differences in the cropping patterns tend to produce differences in SOC contents and turnover as well as crop nutrient uptake [36,37], leading to different residual effects. The positive correlations between total S and SOC (Figure 2 and Figure 3) confirm that over 90% of total S is bound in organic matter [6,16,38]. The correlations also corroborate previous findings [25,27,39,40]. There seem to be variations in the fraction of total S that is bound in the organic fraction. For instance, Acquaye and Beringer [27] and Acquaye and Kang [28] discovered that organic S constituted 56 to over 95% of the total S in soil profiles of the same agro-ecological zones of Ghana, although the land uses of the profiles locations were not indicated. This observation is attributed to the various factors that influence S status in soils. Apart from SOC, the other drivers of total S in this study are pedogenic minerals for the Dompem soils and clay content for the Adansam soils. Based on their results, Acquaye and Beringer [27] and Acquaye and Kang [28] concluded that the total S contents of the Ghanaian soils depend on the agro-ecological zone, the topographic position, parent material, SOC content, vegetation cover and soil pH (with a limited effect). The findings of this study depict the same trends, starting from the reconnaissance survey sites. Similar to our study, Acquaye and Beringer [27] and Acquaye and Kang [28] observed that soils formed over Birrimian rocks and phyllite and basic rocks in the Forest and Deciduous Forests zones had higher total S than soils formed over acidic rocks, alluvium, and shales or sandstones and tertiary sands [28]. It was expected that the native vegetation will contain more total S than the arable soils, as seen in those of the Forest and Deciduous Forest zones (Table 2). However, the native vegetation of the Forest-Transition and Guinea Savannah zones showed a different trend with relatively low total S contents compared to the croplands. This may be attributed partially to the nature of the vegetation and partly to the geology, as suggested earlier. Unlike the native vegetation, the total S contents of the croplands were substantial for the Forest-Transition and Guinea Savannah zones. This may be due to the use of ammonium sulphate, the only prevalent S-containing N fertilizer used in Ghana, and cattle manure in the case of the Lito Pasture. Generally, the total S contents are influenced by fertilizer type (e.g., manure, mineral fertilizer) used [20,41], climatic conditions, soil type, atmospheric S depositions, and crop type [41], and agronomic practices such as conservation agriculture and cover cropping [13,39]. More applications of ammonium sulphate fertilizer, animal manure, S-rich crop residues [42], crucifer-legume cover crop mixtures [43], cover cropping crop fertilization [13], conservation agriculture with high residue retention [39] tend to increase S contents.
Although SOC is the main source of S, the type and quality are of great importance. In SOC, the organic S exists in two essential forms including (i) Ester organic S bonded to O or N [7,38] and (ii) Carbon-bonded S comprising of direct C-S bond) [38]. Organic ester sulphate-S constitute a reserve form of S for microbes, notably fungi [7,44]. Because the total soil S fraction is mostly organically-bound, it is not readily available to plants and must mineralize into inorganic or available S form (sulphate, SO42−), which affects crop yields [45]. Sulphate is the most satisfactory index of S availability for plants [46], although thiosulfate (S2O32−) uptake is possible [14]. The range of sulphate values (5 to 25 mg kg−1) found in this study is slightly similar to those (3 to 22 mg kg−1) obtained by Acquaye and Kang [28] in Ghanaian soils and those (7.9 to 21.6 mg kg−1) of Kumar et al. [39] in soils of Bangladesh, much higher than those (2.7 to 8.1 mg kg−1) found in the White Volta floodplain soils of Ghana [23] and those (<5 mg kg−1) of Safo and Sekou [29] in selected forest soils of the Deciduous Forest zone of Ghana, but lower than values found by Acquaye and Beringer [27] in the Forest zone of Ghana. Despite these variations, the mean sulphate contents for each agro-ecological zone were in the order Dompem > Sefwi- Ahokwa > Lito > Wallembelle > Adansam for reconnaissance survey and Dompem = Adansam.
Studies show that a small fraction of sulphate (<5% of total S) is present in soils during the growing season [19,20]. However, in this study, the fraction of total S that constituted the available S varied widely from <1 to >30% for the reconnaissance survey samples and 4.8 to 41% for the two study areas. The trend did not follow that of total S for the latter, but Adansam had a higher fraction of sulphate in total S. Acquaye and Kang [28] found a mean value of 6% in the different agro-ecological zones. The variations in the sulphate fraction of total S are attributed to total S for the Dompem and the crystalline pedogenic minerals (Ald and Fed) for the Adansam soils, according to the correlations and regression models. These findings corroborate those of Zhang et al. [47], Amberger [48] and Tanikawa et al. [49]. The pedogenic minerals contribute to the net positive surface charges which retain sulphate in soil, particularly in warm and wet climates [47]. Further, S availability is also controlled by soil pH [19,50] and soil texture, and is particularly low in light-textured soils [41,51]. Owing to these factors, Zhang et al. [47] have proposed a conceptual model of S dynamics in soil of different climates.
How could these sulphate levels influence crop yields and yield gaps? Saito et al. [52] already called for the need to close yield gaps in various agro-ecological zones. Research shows that the threshold soil sulphate content for a definite effect on crop yields is 10 mg kg−1, according to Grobler et al. [45] and Cate and Nelson [53]. This implies that 67% of the reconnaissance survey sites, ten years farms of Dompem and years one and three of Adansam all contain sulphate contents below the 10 mg kg−1 threshold, based on the mean values presented in Table 2 and Table 3. For the individual farms in the main study, only 36% of farms Dompem and 40% Adansam meet the proposed threshold (same or above). However, the sulphate contents, which fall below the 10 mg kg−1, do exceed the range of 4–5 mg kg−1 which are characteristic of S-responsive sites observed by Zhao et al. [22] after S fertilizer application in malting barley. The proposed threshold sulphate content seems to be crop-specific, as Meyer et al. [54] found a higher threshold of 20 mg kg−1 for sugarcane.
To overcome these crop-specific S requirements, previous researchers categorised crops into those with high S (e.g., oil rapeseed, mustard, cruciferous vegetables, alfalfa, etc.), medium S (e.g., cotton, grasses, sugarcane, coffee, etc.) and low S (cereals, groundnut, sugar beet, etc.) requirements [6]. Sadly, no specific rate of S fertilizer application has been recommended for these categories of S requiring crops, although 10 to 75 kg ha−1 [22,41,48,55,56] have been proposed for different crops and conditions. Despite the recommendations, crop yield responses also depend on the initial sulphate and SOC contents in the soil [57], crop response, type of inorganic and organic S fertilizer [41,48,58] and whether S-containing agrochemicals are used or not [55,56,59]. Therefore, it is essential to adopt inorganic fertilizer such as elemental or bentonite S, gypsum, Kieserite, Epsom salt, sulphate of potash, single super Phosphate [48]; and organic S sources such as legume cover [43,60,61], cattle manure, poultry manure, pig manure [62], composted agro-processing wastes [58,63], tithonia (Tithonia diversifolia (Hemsl.) A. Gray) biomass [61], in addition to agroforestry, conservation agriculture, and other integrated aspects of integrated soil fertility management. It is important to note that the application of elemental S fertilizer and ammonium sulphate could reduce soil pH, depending on the type used [41], and are not recommended for acidic soil conditions.
5. Conclusions
The study confirmed variations in total S and sulphate contents in all the soils, which showed a wavy trend across the ecological spectrum. This was pronounced in the reconnaissance survey sites, starting from the Forest zone in the south towards the Guinea Savannah zone in the north. The SOC content was the main factor controlling the total S contents in the soils, in addition to the pedogenic minerals. Unlike the total S contents, which were below detection in some samples after dry combustion, sulphate was present in all the soils. The contents ranged from 5 to 25 mg kg−1 and constituted 0.8 to 37% of total S, where the Lito soils of southern Guinea Savannah had the highest fraction. Total S and crystalline pedogenic minerals were the main predictors of the sulphate contents. The results suggest that climatic conditions, geology, crop type grown and cropping pattern and the types of fertilizers used possibly influenced the S levels in the soils. Finally, the results highlight the need for ecologically-based S fertilizer programmes and an intense promotion of integrated soil fertility management to augment the current crop yields. Soil pH and texture, particularly in the Forest-Savannah, should be a guide to the choice of S fertilizers applied.
6. Patents
There are no patents related to this manuscript.
Author Contributions
Conceptualization, Introduction, Methodology, and Sample analysis, Soil sampling, Data analysis, Original Draft Preparation, D.N.; Project Administration, Review & Editing, Validation, D.N. and B.A. All authors have read and agreed to the published version of the manuscript.
Funding
This research was funded by UK Research and Innovation through the Global Challenges Research Fund programme, “Growing research capability to meet the challenges faced by developing countries” (“Grow”), through the Sentinel Project (Social and Environmental Trade-offs in African Agriculture with grant number ES/P011306/1.
Data Availability Statement
Data available on request due to privacy restrictions. The data presented in this study are available on request from the corresponding author. The data are not publicly available due to continuity of the study.
Acknowledgments
We thank the technical staff of the Nuclear Research Institute of Ghana Atomic Energy Commission for their support in the sample analyses. We also appreciate the time spent by the unknown reviewers to improve the quality of this manuscript.
Conflicts of Interest
The authors have no conflict of interest to declare.
References
- Lobell, D.B.; Cassman, K.G.; Field, C.B. Crop yield gaps: Their Importance, magnitudes, and causes. Annu. Rev. Environ. Resour. 2009, 34, 179–204. [Google Scholar] [CrossRef] [Green Version]
- van Ittersum, M.K.; van Bussel, L.G.J.; Wolf, J.; Grassini, P.; van Wart, J.; Guilpart, N.; Claessens, L.; de Groot, H.; Wiebe, K.; Mason-D’Croz, D.; et al. Can sub-Saharan Africa feed itself? Proc. Natl. Acad. Sci. USA 2016, 113, 14964–14969. [Google Scholar] [CrossRef] [PubMed] [Green Version]
- Gibbs, H.K.; Ruesch, A.S.; Achard, F.; Clayton, M.K.; Holmgren, P.; Ramankutty, N.; Foley, J.A. Tropical forests were the primary sources of new agricultural land in the 1980s and 1990s. Proc. Natl. Acad. Sci. USA 2010, 107, 16732–16737. [Google Scholar] [CrossRef] [PubMed] [Green Version]
- Jellason, N.P.; Robinson, E.J.Z.; Chapman, A.S.A.; Neina, D.; Devenish, A.J.M.; Po, J.Y.T.; Adolph, B. A systematic review of drivers and constraints on agricultural expansion in Sub-Saharan Africa. Land 2021, 10, 332. [Google Scholar] [CrossRef]
- Bekunda, M.; Chikowo, R.; Claessens, L.; Hoeschle-Zeledon, I.; Kihara, J.; Kizito, F.; Okori, P.; Sognigbé, N.; Thierfelder, N. Combining Multiple Technologies: Integrated Soil Fertility Management, CABI Books; CABI International: Oxon, UK, 2022. [Google Scholar]
- Zenda, T.; Liu, S.; Dong, A.; Duan, H. Revisiting sulphur—The once neglected nutrient: Its roles in plant growth, metabolism, stress tolerance and crop production. Agriculture 2021, 11, 626. [Google Scholar] [CrossRef]
- Ma, Q.; Wen, Y.; Pan, W.; Macdonald, A.; Hill, P.W.; Chadwick, D.R.; Wu, L.; Jones, D.L. Soil carbon, nitrogen, and sulphur status affects the metabolism of organic S but not its uptake by microorganisms. Soil Biol. Biochem. 2020, 149, 107943. [Google Scholar] [CrossRef]
- Huang, Y.; Wang, Q.; Zhang, W.; Zhu, P.; Xiao, Q.; Wang, C.; Wu, L.; Tian, Y.; Xu, M.; Gunina, A. Stoichiometric imbalance of soil carbon and nutrients drives microbial community structure under long-term fertilization. Appl. Soil Ecol. 2021, 168, 104119. [Google Scholar] [CrossRef]
- Yuan, X.; Niu, D.; Gherardi, L.A.; Liu, Y.; Wang, Y.; Elser, J.J.; Fu, H. Linkages of stoichiometric imbalances to soil microbial respiration with increasing nitrogen addition: Evidence from a long-term grassland experiment. Soil Biol. Biochem. 2019, 138, 107580. [Google Scholar] [CrossRef]
- Peñuelas, J.; Poulter, B.; Sardans, J.; Ciais, P.; van der Velde, M.; Bopp, L.; Boucher, O.; Godderis, Y.; Hinsinger, P.; Llusia, J.; et al. Human-induced nitrogen–phosphorus imbalances alter natural and managed ecosystems across the globe. Nat. Commun. 2013, 4, 2934. [Google Scholar] [CrossRef] [Green Version]
- Vitousek, P.M.; Naylor, R.; Crews, T.; David, M.B.; Drinkwater, L.E.; Holland, E.; Johnes, P.J.; Katzenberger, J.; Martinelli, L.A.; Matson, P.A.; et al. Agriculture. Nutrient imbalances in agricultural development. Science 2009, 324, 1519–1520. [Google Scholar] [CrossRef]
- Habtegebrial, K.; Singh, B.R. Response of wheat cultivars to nitrogen and sulfur for crop yield, nitrogen use efficiency, and protein quality in the semiarid region. J. Plant Nutr. 2009, 32, 1768–1787. [Google Scholar] [CrossRef]
- Crespo, C.; Wyngaard, N.; Sainz Rozas, H.; Barbagelata, P.; Barraco, M.; Gudelj, V.; Barbieri, P. Improving soil organic nitrogen and sulfur pools by cover cropping and crop fertilization in soybean-based cropping systems. Soil Tillage Res. 2021, 213, 105138. [Google Scholar] [CrossRef]
- Santana, M.M.; Dias, T.; Gonzalez, J.M.; Cruz, C. Transformation of organic and inorganic sulfur—Adding perspectives to new players in soil and rhizosphere. Soil Biol. Biochem. 2021, 160, 108306. [Google Scholar] [CrossRef]
- TSI. Sulphur—The Fourth Major Plant Nutrient—The Sulphur Institute. Available online: https://www.sulphurinstitute.org/about-sulphur/sulphur-construction-materials/ (accessed on 19 January 2022).
- Tabatabai, M.A. Importance of sulphur in crop production. Biogeochemistry 1984, 1, 45–62. [Google Scholar] [CrossRef]
- Kihara, J.; Sileshi, G.W.; Nziguheba, G.; Kinyua, M.; Zingore, S.; Sommer, R. Application of secondary nutrients and micronutrients increases crop yields in sub-Saharan Africa. Agron. Sustain. Dev. 2017, 37, 25. [Google Scholar] [CrossRef] [Green Version]
- Jamal, A.; Moon, Y.S.; Zainul Abdin, M. Sulphur—A general overview and interaction with nitrogen. Aust. J. Crop Sci. 2010, 4, 523–529. [Google Scholar]
- Prasad, R.; Shivay, Y.S. Sulphur in soil, plant and human nutrition. Proc. Natl. Acad. Sci. USA 2018, 88, 429–434. [Google Scholar] [CrossRef]
- Scherer, H.W. Sulphur in crop production—Invited paper. Eur. J. Agron. 2001, 14, 81–111. [Google Scholar] [CrossRef]
- Koprivova, A.; Kopriva, S. Role of plant sulfur metabolism in human nutrition and food security. In Plant Nutrition and Food Security in the Era of Climate Change, 1st ed.; Kumar, V., Srivastava, A., Suprasanna, P., Eds.; Elsevier Inc.: Amsterdam, The Netherlands, 2022; pp. 73–95. [Google Scholar] [CrossRef]
- Zhao, F.J.; Fortune, S.; Barbosa, V.L.; McGrath, S.P.; Stobart, R.; Bilsborrow, P.E.; Booth, E.J.; Brown, A.; Robson, P. Effects of sulphur on yield and malting quality of barley. J. Cereal. Sci. 2006, 43, 369–377. [Google Scholar] [CrossRef]
- Tsujimoto, Y.; Inusah, B.; Katsura, K.; Fuseini, A.; Dogbe, W.; Zakaria, A.I.; Fujihara, Y.; Oda, M.; Sakagami, J.-I. The effect of sulfur fertilization on rice yields and nitrogen use efficiency in a floodplain ecosystem of northern Ghana. Field Crops Res. 2017, 211, 155–164. [Google Scholar] [CrossRef]
- Kugbe, J.X.; Kombat, R.; Atakora, W. Secondary and micronutrient inclusion in fertilizer formulation impact on maize growth and yield across northern Ghana. Cogent Food Agric. 2019, 5, 1700030. [Google Scholar] [CrossRef]
- Buri, M.M.; Masunaga, T.; Wakatsuki, T. Sulfur and zinc levels as limiting factors to rice production in West Africa lowlands. Geoderma 2000, 94, 23–42. [Google Scholar] [CrossRef]
- MOFA. Facts and Figures 2016. Statistics, Research and Information Directorate (SRID); Ministry of Food and Agriculture (MoFA): Accra, Ghana, 2017.
- Acquaye, D.K.; Beringer, H. Sulfur in Ghanaian soils. Plant Soil 1989, 113, 197–203. [Google Scholar] [CrossRef]
- Acquaye, D.K.; Kang, B.T. Sulfur status and forms in some surface soils of Ghana. Soil Sci. 1987, 144, 43–52. [Google Scholar] [CrossRef]
- Safo, E.Y.; Sekou, E.T. Soluble sulphate status of some forest soil of Ghana. Ghana J. Agric. Sci. 1976, 9, 189–192. [Google Scholar]
- Neina, D.; Agyarko-Mintah, E. Duration of cultivation has varied impacts on soil charge properties in different agro-ecological zones. Land 2022, 11, 1633. [Google Scholar] [CrossRef]
- Fox, R.L.; Olson, R.A.; Rhoades, H.F. Evaluating the sulfur status of soils by plant and soil tests. Soil Sci. Soc. Am. J. 1964, 28, 243–246. [Google Scholar] [CrossRef]
- Osunbitan, J.A.; Oyedele, D.J.; Adekalu, K.O. Tillage effects on bulk density, hydraulic conductivity and strength of a loamy sand soil in southwestern Nigeria. Soil Tillage Res. 2005, 82, 57–64. [Google Scholar] [CrossRef]
- Romaneckas, K.; Kimbirauskienė, R.; Sinkevičienė, A. Impact of Tillage Intensity on Planosol Bulk Density, Pore Size Distribution, and Water Capacity in Faba Bean Cultivation. Agronomy 2022, 12, 2311. [Google Scholar] [CrossRef]
- Neina, D. Ecological and Edaphic Drivers of Yam Production in West Africa. Appl. Environ. Soil Sci. 2021, 2021, 5019481. [Google Scholar] [CrossRef]
- Benneh, G.; Agyepong, G.T. Land Degradation in Ghana; Commonwealth Secretariat Marlborough House: London, UK, 1990. [Google Scholar]
- Hoyle, F.C.; Baldock, J.A.; Murphy, D.V. Soil Organic Carbon—Role in Rainfed Farming Systems. In Rainfed Farming Systems; Springer: Dordrecht, The Netherlands, 2011; pp. 339–361. [Google Scholar]
- Naeem, M.; Mehboob, N.; Farooq, M.; Farooq, S.; Hussain, S.; Ali, H.M.; Hussain, M. Impact of Different Barley-Based Cropping Systems on Soil Physicochemical Properties and Barley Growth under Conventional and Conservation Tillage Systems. Agronomy 2021, 11, 8. [Google Scholar] [CrossRef]
- Brown, K.A. Sulphur in the environment: A review. Environ. Pollut Ser. Chem. Phys. 1982, 3, 47–80. [Google Scholar] [CrossRef]
- Kumar, U.; Cheng, M.; Islam, M.J.; Maniruzzaman, M.; Nasreen, S.S.; Haque, M.E.; Rahman, M.T.; Jahiruddin, M.; Bell, R.W.; Jahangir, M. Long-term Conservation Agriculture increases sulfur pools in soils together with increased soil organic carbon compared to conventional practices. Soil Tillage Res. 2022, 223, 105474. [Google Scholar] [CrossRef]
- Nor, Y.M. Sulphur mineralization and adsorption in soils. Plant Soil 1981, 60, 451–459. [Google Scholar] [CrossRef]
- Kulczycki, G. The effect of elemental sulfur fertilization on plant yields and soil properties. Adv. Agron. 2021, 167, 105–181. [Google Scholar] [CrossRef]
- Eriksen, J. Gross sulphur mineralisation–immobilisation turnover in soil amended with plant residues. Soil Biol. Biochem. 2005, 37, 2216–2224. [Google Scholar] [CrossRef]
- Couëdel, A.; Alletto, L.; Justes, É. Crucifer-legume cover crop mixtures provide effective sulphate catch crop and sulphur green manure services. Plant Soil 2018, 426, 61–76. [Google Scholar] [CrossRef]
- Marzluf, G.A. Genetics and Molecular Genetics of Sulfur Assimilation in the Fungi. In Advances in Genetics; Hall, J.C., Dunlap, J.C., Eds.; Academic Press: Cambridge, MA, USA, 1994; pp. 187–206. ISBN 0065-2660. [Google Scholar]
- Grobler, L.; Bloem, A.A.; Claassens, A.S. A critical soil sulphur level for maize (Zea mays L.) grown in a glasshouse. S. Afr. J. Plant Soil 1999, 16, 204–206. [Google Scholar] [CrossRef]
- Scaife, A.; Burns, I.G. The sulphate-S/total S ratio in plants as an index of their sulphur status. Plant Soil 1986, 91, 61–71. [Google Scholar] [CrossRef]
- Zhang, Z.; Mao, H.; Zhao, Z.-Q.; Cui, L.; Wang, S.; Liu, C.-Q. Sulfur dynamics in forest soil profiles developed on granite under contrasting climate conditions. Sci. Total Environ. 2021, 797, 149025. [Google Scholar] [CrossRef] [PubMed]
- Amberger, A. Soil Fertility and Plant Nutrition in the Tropics and Subtropics; IFA, International Fertilizer Industry Association: Paris, France; International Potash Institute: Zug, Switzerland, 2006. [Google Scholar]
- Tanikawa, T.; Ishizuka, K.; Imaya, A. Extractable Sulfate Content in Japanese Forest Soils. J. For. Res. 1999, 4, 191–194. [Google Scholar] [CrossRef]
- Jaggi, A.C.; Aulakh, M.S.; Sharma, R. Temperature effects on soil organic sulphur mineralization and elemental sulphur oxidation in subtropical soils of varying pH. Nutr. Cycl. Agroecosyst. 1999, 54, 175–182. [Google Scholar] [CrossRef]
- Williams, C.H. Some factors affecting the mineralization of organic sulphur in soils. Plant Soil 1967, 26, 205–223. [Google Scholar] [CrossRef]
- Saito, K.; Nelson, A.; Zwart, S.J.; Niang, A.; Sow, A.; Yoshida, H.; Wopereis, M.C. Towards of Biophysical Determinants of Yield Gaps and the Potential for Expansion of the Rice Area in Africa. In Realizing Africa’s Rice Promise; Wopereis, M.C.S., Johnson, D.E., Ahmadi, N., Tollens, E., Jalloh, A., Eds.; CAB International: Wallingford, UK, 2013; pp. 188–203. [Google Scholar]
- Cate, R.B.; Nelson, L.A. A simple statistical procedure for partitioning soil test correlation data into two classes. Soil Sci. Soc. Am. J. 1971, 35, 658–660. [Google Scholar] [CrossRef]
- Meyer, J.H.; Wood, R.A.; Du Preez, P. A nutrient survey of sugarcane in the South African industry with special reference to trace elements. In Proceedings of the South African Sugar Technologists’ Association; Sasta: Durban, South Africa, 1971; pp. 196–203. [Google Scholar]
- Chowdhury, M.A.H.; Sultana, T.; Rahman, M.A.; Saha, B.K.; Chowdhury, T.; Tarafder, S. Sulphur fertilization enhanced yield, its uptake, use efficiency and economic returns of Aloe vera L. Heliyon 2020, 6, e05726. [Google Scholar] [CrossRef]
- Thangasamy, A.; Gorrepati, K.; Ghodke, P.H.; Tp, S.A.; Jadhav, M.; Banerjee, K.; Singh, M. Effects of sulfur fertilization on yield, biochemical quality, and thiosulfinate content of garlic. Sci. Hortic. 2021, 289, 110442. [Google Scholar] [CrossRef]
- de Borja Reis, A.F.; Rosso, L.H.M.; Davidson, D.; Kovács, P.; Purcell, L.C.; Below, F.E.; Casteel, S.N.; Knott, C.; Kandel, H.; Naeve, S.L.; et al. Sulfur fertilization in soybean: A meta-analysis on yield and seed composition. Eur. J. Agron. 2021, 127, 126285. [Google Scholar] [CrossRef]
- Kumar, S.; Meena, R.S.; Singh, R.K.; Munir, T.M.; Datta, R.; Danish, S.; Yadav, G.S.; Kumar, S. Soil microbial and nutrient dynamics under different sowings environment of Indian mustard (Brassica juncea L.) in rice based cropping system. Sci. Rep. 2021, 11, 5289. [Google Scholar] [CrossRef]
- Burkitbayev, M.; Bachilova, N.; Kurmanbayeva, M.; Tolenova, K.; Yerezhepova, N.; Zhumagul, M.; Mamurova, A.; Turysbek, B.; Demeu, G. Effect of sulfur-containing agrochemicals on growth, yield, and protein content of soybeans (Glycine max (L.) Merr). Saudi J. Biol. Sci. 2021, 28, 891–900. [Google Scholar] [CrossRef] [PubMed]
- Schumacher, H.; Paulsen, H.M.; Gau, A.E.; Link, W.; Jürgens, H.U.; Sass, O.; Dieterich, R. Seed protein amino acid composition of important local grain legumes Lupinus angustifolius L., Lupinus luteus L., Pisum sativum L. and Vicia faba L. Plant Breed 2011, 130, 156–164. [Google Scholar] [CrossRef]
- Neina, D.; Buerkert, A.; Joergensen, R.G. Potential mineralizable N and P mineralization of local organic materials in tantalite mine soils. Appl. Soil Ecol. 2016, 108, 211–220. [Google Scholar] [CrossRef]
- Bao, Y.; Guan, L.; Zhou, Q.; Wang, H.; Yan, L. Various sulphur fractions changes during different manure composting. Bioresour. Technol. 2010, 101, 7841–7848. [Google Scholar] [CrossRef] [PubMed]
- Muscolo, A.; Marra, F.; Canino, F.; Maffia, A.; Mallamaci, C.; Russo, M. Growth, nutritional quality and antioxidant capacity of lettuce grown on two different soils with sulphur-based fertilizer, organic and chemical fertilizers. Sci. Hortic. 2022, 305, 111421. [Google Scholar] [CrossRef]
Figure 1.
Location of the reconnaissance survey and the two main study areas.

Figure 2.
Spearman between reconnaissance survey total S and SOC.

Figure 3.
Pearson correlation between (a) Dompem total S and SOC and (b) Adansam total S and SOC.

Figure 4.
Spearman correlations, showing a positive correlation between Dompem total S and (a) ECEC and a negative correlation with (b) Ald.
Figure 4.
Spearman correlations, showing a positive correlation between Dompem total S and (a) ECEC and a negative correlation with (b) Ald.


Table 1.
Bulk density, particle size and textural classes of soils from native vegetation and croplands of each of the reconnaissance survey sites (n = 5 ± One standard error of means).
Table 1.
Bulk density, particle size and textural classes of soils from native vegetation and croplands of each of the reconnaissance survey sites (n = 5 ± One standard error of means).
| Site | Bulk Density | Sand | Silt | Clay | Textural Class |
|---|---|---|---|---|---|
| (g cm−3) | (%) | (%) | (%) | ||
| Dompem (Forest zone) | |||||
| Native vegetation | 1.0 ± 0.1 | 60.0 | 16.0 | 24.0 | Sandy clay loam |
| Old cocoa | 1.1 ± 0.2 | 38.4 | 36.6 | 25.0 | Loam |
| Young cocoa | 1.2 ± 0.1 | 44.6 | 26.7 | 28.8 | Clay loam |
| Vegetable farm | 0.9 ± 0.2 | 43.0 | 25.8 | 31.3 | Clay loam |
| Sefwi—Ahokwa (Semi-Deciduous Forest zone) | |||||
| Native vegetation | 0.9 ± 0.1 | 71.8 | 7.7 | 20.5 | Sandy clay loam |
| Oil palm | 1.2 ± 0.3 | 82.4 | 4.1 | 13.5 | Loamy sand |
| Cocoa | 1.3 ± 0.2 | 64.9 | 11.6 | 23.5 | Sandy clay loam |
| Adansam (Forest-Savannah Transition zone) | |||||
| Native vegetation | 1.2 ± 0.1 | 90.0 | 4.0 | 6.0 | Sand |
| Mango | 1.3 ± 0.1 | 88.0 | 6.0 | 6.0 | Sand |
| Yam (Ferric Luvisol) | 1.1 ± 0.1 | 90.0 | 4.0 | 6.0 | Sand |
| Yam (Fluvisol) | 1.2 ± 0.1 | 95.0 | 2.0 | 3.0 | Sand |
| Lito (Guinea Savannah zone) | |||||
| Native vegetation | 1.7 ± 0.0 | 69.2 | 11.8 | 19.0 | Sandy loam |
| Yam | 1.3 ± 0.2 | 70.0 | 17.5 | 12.5 | Sandy loam |
| Grassland | 1.7 ± 0.1 | 70.8 | 7.7 | 21.5 | Sandy clay loam |
| Mixed yam | 1.5 ± 0.1 | 79.5 | 7.0 | 13.5 | Sandy loam |
| Wallembelle (Guinea Savannah zone) | |||||
| Native vegetation | 1.4 ± 0.1 | 79.0 | 6.5 | 14.5 | Sandy loam |
| Maize | 1.5 ± 0.2 | 76.8 | 7.2 | 16.0 | Sandy loam |
| Soybean | 1.5 ± 0.1 | 86.2 | 4.8 | 9.0 | Loamy sand |
Table 2.
Soil pH, total C, N, S and sulphate contents of soils from native vegetation and croplands the reconnaissance survey sites (n = 5 ± One standard error of means).
Table 2.
Soil pH, total C, N, S and sulphate contents of soils from native vegetation and croplands the reconnaissance survey sites (n = 5 ± One standard error of means).
| Site | Soil pH | Total C | Total S | Sulphate |
|---|---|---|---|---|
| (g kg−1) | (mg kg−1) | (mg kg−1) | ||
| Dompem (Forest zone) | ||||
| Native vegetation | 4.5 ± 0.2 | 20.9 ± 9.4 | 597.2 ± 109.0 | 4.8 ± 0.2 a |
| Old cocoa | 5.2 ± 0.2 | 18.4 ± 8.3 | 456.0 ± 100.8 | 23.4 ± 2.7 b |
| Young cocoa | 4.9 ± 0.2 | 16.6 ± 7.4 | 398.0 ± 56.2 | 25.8 ± 2.7 b |
| Vegetable farm | 5.2 ± 0.1 | 19.4 ± 8.7 | 516.2 ± 48.3 | 6.9 ± 1.2 c |
| p-value | - | >0.05 | >0.05 | 0.024 |
| Sefwi—Ahokwa (Semi-Deciduous Forest zone) | ||||
| Native vegetation | 6.2 ± 0.4 | 22.0 ± 9.8 | 138.8 ± 27.6 | 14.8 ± 0.6 a |
| Oil palm | 6.4 ± 0.3 | 14.9 ± 6.7 | 106.8 ± 25.5 | 8.7 ± 0.2 b |
| Cocoa | 6.2 ± 0.2 | 14.2 ± 6.4 | 121.4 ± 36.2 | 15.4 ± 0.2 a |
| p-value | - | >0.05 | >0.05 | 0.05 |
| Adansam (Forest-Savannah Transition zone) | ||||
| Native vegetation | 5.9 ± 0.1 | 5.2 ± 2.3 a | BD | 7.5 ± 0.6 |
| Mango | 6.1 ± 0.1 | 6.5 ± 2.9 a | 498.7 ± 105.0 | 7.2 ± 0.2 |
| Yam (Ferric Luvisol) | 6.4 ± 0.1 | 7.4 ± 3.3 b | 259.0 ± 0.0 * | 7.1 ± 0.1 |
| Yam (Fluvisol) | 6.5 ± 0.2 | 4.4 ± 2.0 c | BD | 6.9 ± 0.6 |
| p-value | - | 0.001 | - | >0.05 |
| Lito (Guinea Savannah zone) | ||||
| Native vegetation | 5.4 ± 0.1 | 6.8 ± 3.0 | 31.4 ± 18.4 | 11.7± 0.6 a |
| Yam | 5.8 ± 0.1 | 8.1 ± 3.6 | 69.6 ± 40.8 | 11.6 ± 0.3 a |
| Grassland | 5.4 ± 0.3 | 11.8 ± 5.3 | 95.8 ± 25.2 | 6.9 ± 0.4 b |
| Mixed yam | 5.8 ± 0.3 | 8.8 ± 4.0 | 147.1 ± 72.6 | 7.2 ± 0.8 b |
| p-value | - | >0.05 | - | <0.001 |
| Wallembelle (Guinea Savannah zone) | ||||
| Native vegetation | 6.6 ± 0.1 | 7.8 ± 3.5 | 230.0 ± 0.0 * | 7.9 ± 0.2 |
| Maize | 6.5 ± 0.1 | 17.6 ± 7.9 | 603.3 ± 27.5 | 9.2 ± 0.3 |
| Soybean | 5.8 ± 0.1 | 7.0 ± 3.1 | 339.5 ± 91.4 | 8.1 ± 0.6 |
| p-value | - | >0.05 | - | >0.05 |
BD: Below detection; * Total S was detected in only one sample. No total S was detected in two of the Adansam sites; Data in columns followed by different letters depict significant differences at p –value < 0.05.
Table 3.
Soil and δpH, total C, N, S and sulphate contents of soils from different farms in Dompem (n = 9 ± One standard error of means) and Adansam (n = 5 ± One standard error of means).
Table 3.
Soil and δpH, total C, N, S and sulphate contents of soils from different farms in Dompem (n = 9 ± One standard error of means) and Adansam (n = 5 ± One standard error of means).
| Farm Type | 1 Soil pH | 2 δpH | 3 Total C | Total S | Sulphate |
|---|---|---|---|---|---|
| Water | g kg−1 | mg kg−1 | mg kg−1 | ||
| Dompem | |||||
| Year one | 4.1 ± 0.2 | −0.5 ± 0.1 | 33.2 ± 6.9 | 236.2 ± 40.2 a | 11.3 ± 1.3 a |
| Three years | 4.4 ± 0.2 | −0.4 ± 0.0 | 25.5 ± 4.7 | 208.4 ± 57.5 b | 12.4 ± 2.0 a |
| Five years | 4.5 ± 0.1 | −0.5 ± 0.1 | 18.2 ± 1.3 | 117.1 ± 17.0 c | 12.0 ± 1.8 a |
| Ten years | 4.5 ± 0.1 | −0.6 ± 0.0 | 19.9 ± 3.4 | 98.5 ± 13.1 d | 5.8 ± 1.1 b |
| p-value | - | >0.05 | >0.05 | 0.043 | 0.004 |
| Adansam | |||||
| Year one | 6.6 ± 0.3 | −0.2 ± 0.2 | 8.6 ± 1.7 | 54.6 ± 1.7 a | 5.7 ± 0.7 a |
| Three years | 6.3 ± 0.0 | −0.1 ± 0.2 | 10.4 ± 0.8 | 61.3 ± 9.1 a | 6.7 ± 0.7 a |
| Five years | 6.4 ± 0.1 | 0.0 ± 0.2 | 8.3 ± 1.3 | 39.7 ± 6.8 ab | 16.3 ± 1.9 b |
| Ten years | 6.0 ± 0.1 | 0.0 ± 0.1 | 10.7 ± 0.8 | 73.3 ± 7.5 ac | 12.4 ± 1.8 b |
| p-value | - | - | >0.05 | 0.023 | <0.001 |
1,2,3 Overlapping data with part published in Neina and Agyarko-Mintah [30]; Data in columns followed by different letters depict significant differences at p-value < 0.05.
Publisher’s Note: MDPI stays neutral with regard to jurisdictional claims in published maps and institutional affiliations. |
© 2022 by the authors. Licensee MDPI, Basel, Switzerland. This article is an open access article distributed under the terms and conditions of the Creative Commons Attribution (CC BY) license (https://creativecommons.org/licenses/by/4.0/).
Share and Cite
MDPI and ACS Style
Neina, D.; Adolph, B. Sulphur Contents in Arable Soils from Four Agro-Ecological Zones of Ghana. Land 2022, 11, 1866. https://doi.org/10.3390/land11101866
AMA Style
Neina D, Adolph B. Sulphur Contents in Arable Soils from Four Agro-Ecological Zones of Ghana. Land. 2022; 11(10):1866. https://doi.org/10.3390/land11101866
Chicago/Turabian StyleNeina, Dora, and Barbara Adolph. 2022. "Sulphur Contents in Arable Soils from Four Agro-Ecological Zones of Ghana" Land 11, no. 10: 1866. https://doi.org/10.3390/land11101866
Note that from the first issue of 2016, this journal uses article numbers instead of page numbers. See further details here.