
Interconnectedness of Ecosystem Services Potential with Land Use/Land Cover Change Dynamics in Western Uganda
 , and
, and
Abstract
:1. Introduction
2. Materials and Methods
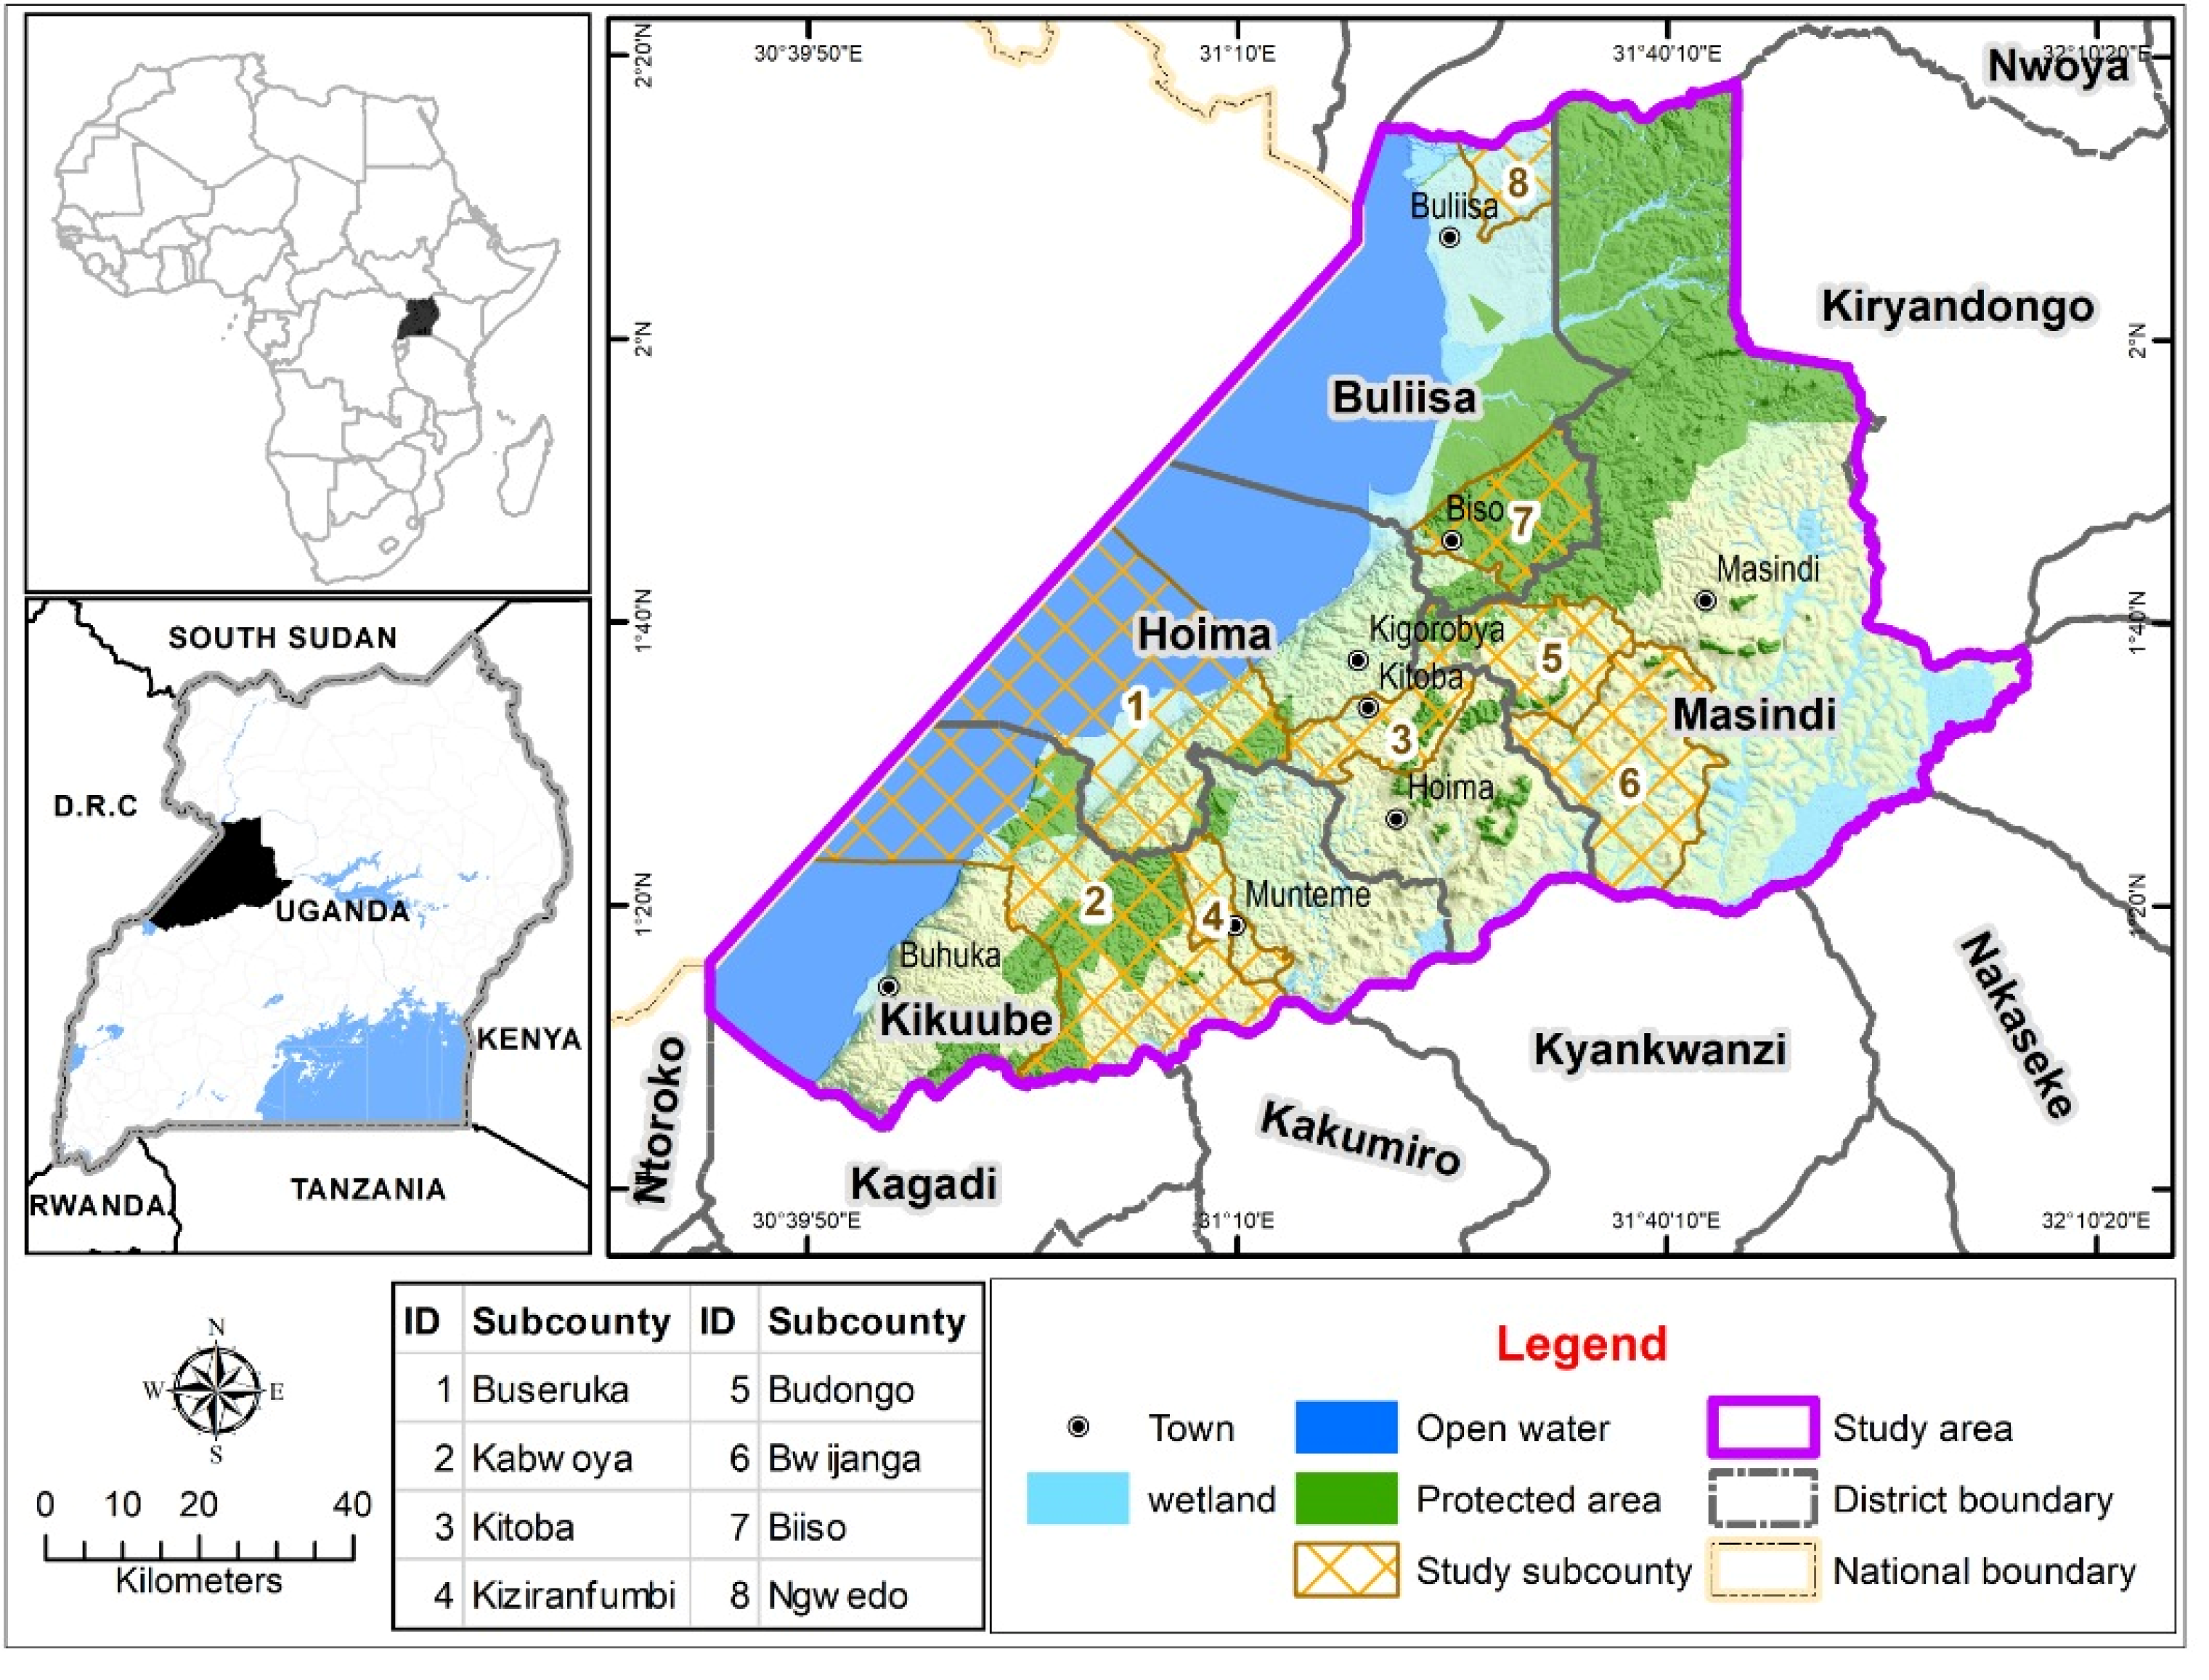
2.1. Study Area
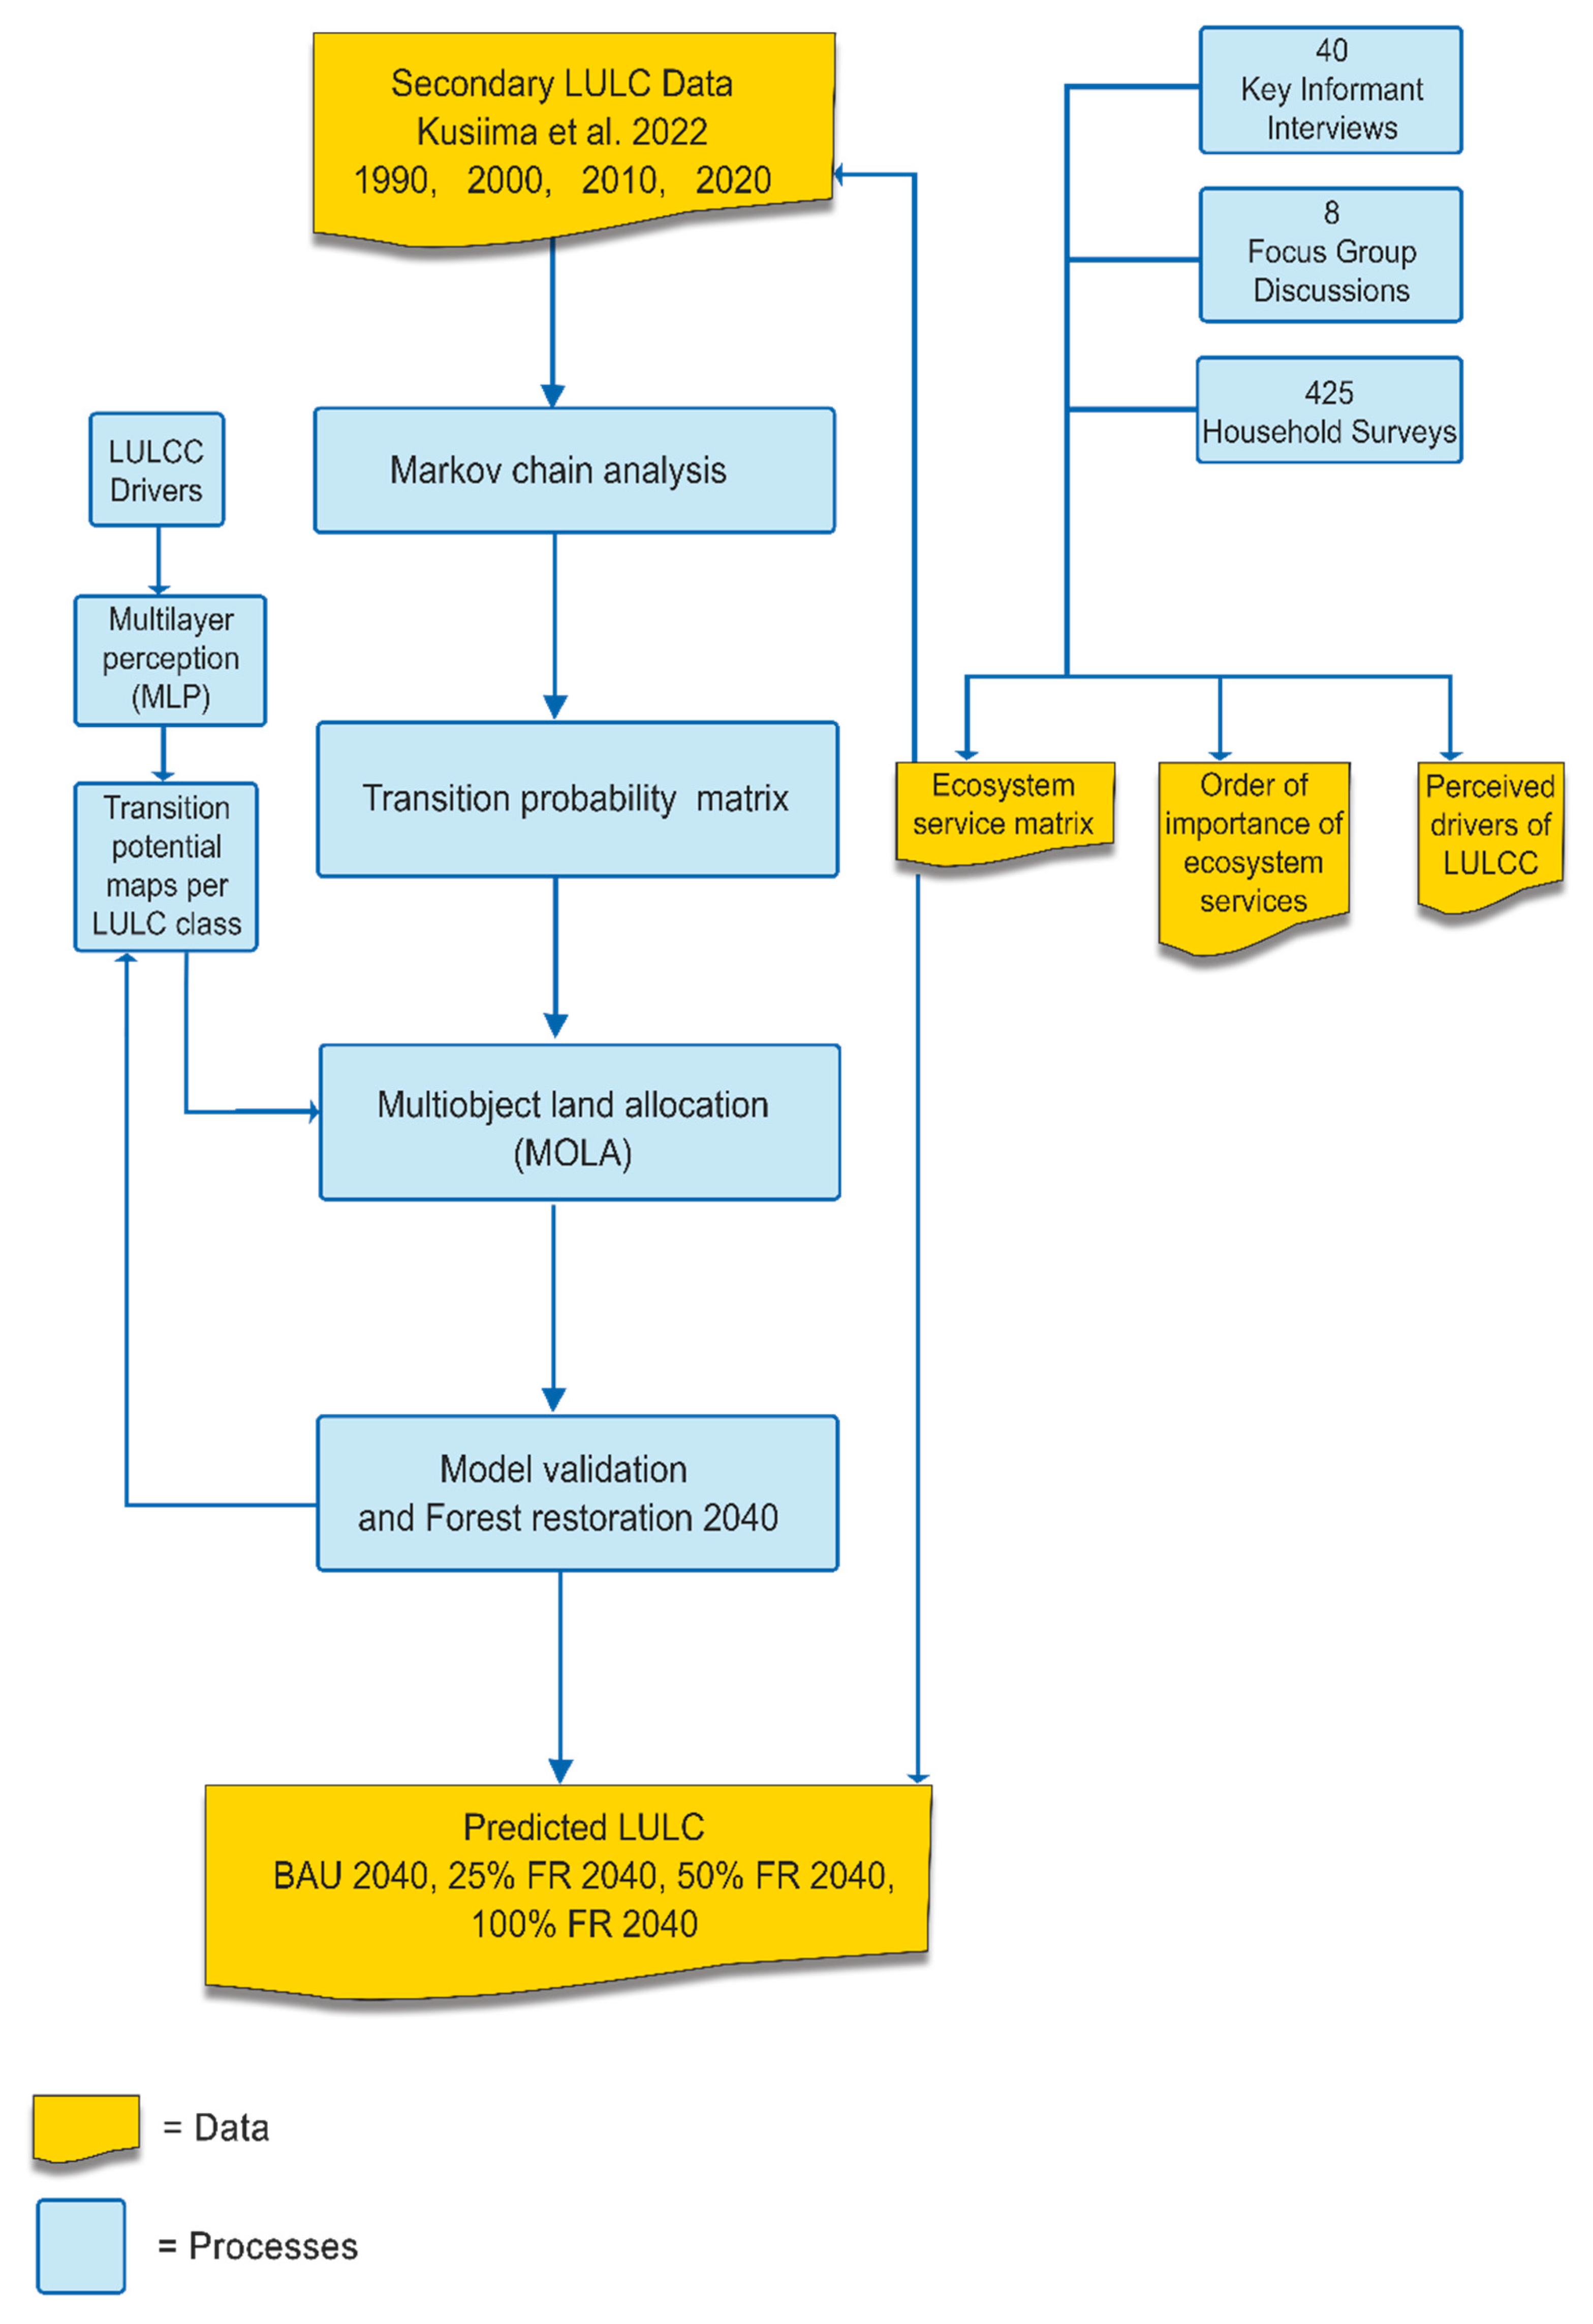
2.2. Prediction of Land Use Land Cover Change Using Secondary Data
2.3. Key Informant Interviews and Focus Group Discussios
2.4. Household Survey
2.5. Data Analysis
2.5.1. Perceived Land Use/Land Cover Change and Important Ecosystem Services
2.5.2. Perceived Land Use/Land Cover Change Drivers
2.5.3. Validation of Prediction Model
2.5.4. Implication of Historic and Predicted LULCC on Ecosystem Services
- i = land use/land cover ;
- n = ecosystem service ;
- = level of production of the ecosystem services n by the land cover i
- PPi = potential production of either provisioning, regulating, or cultural ES by the land use/land cover I;
- A = total area of Budongo–Bugoma landscape in hectares.
2.5.5. Relationship between Ecosystem Services
3. Results
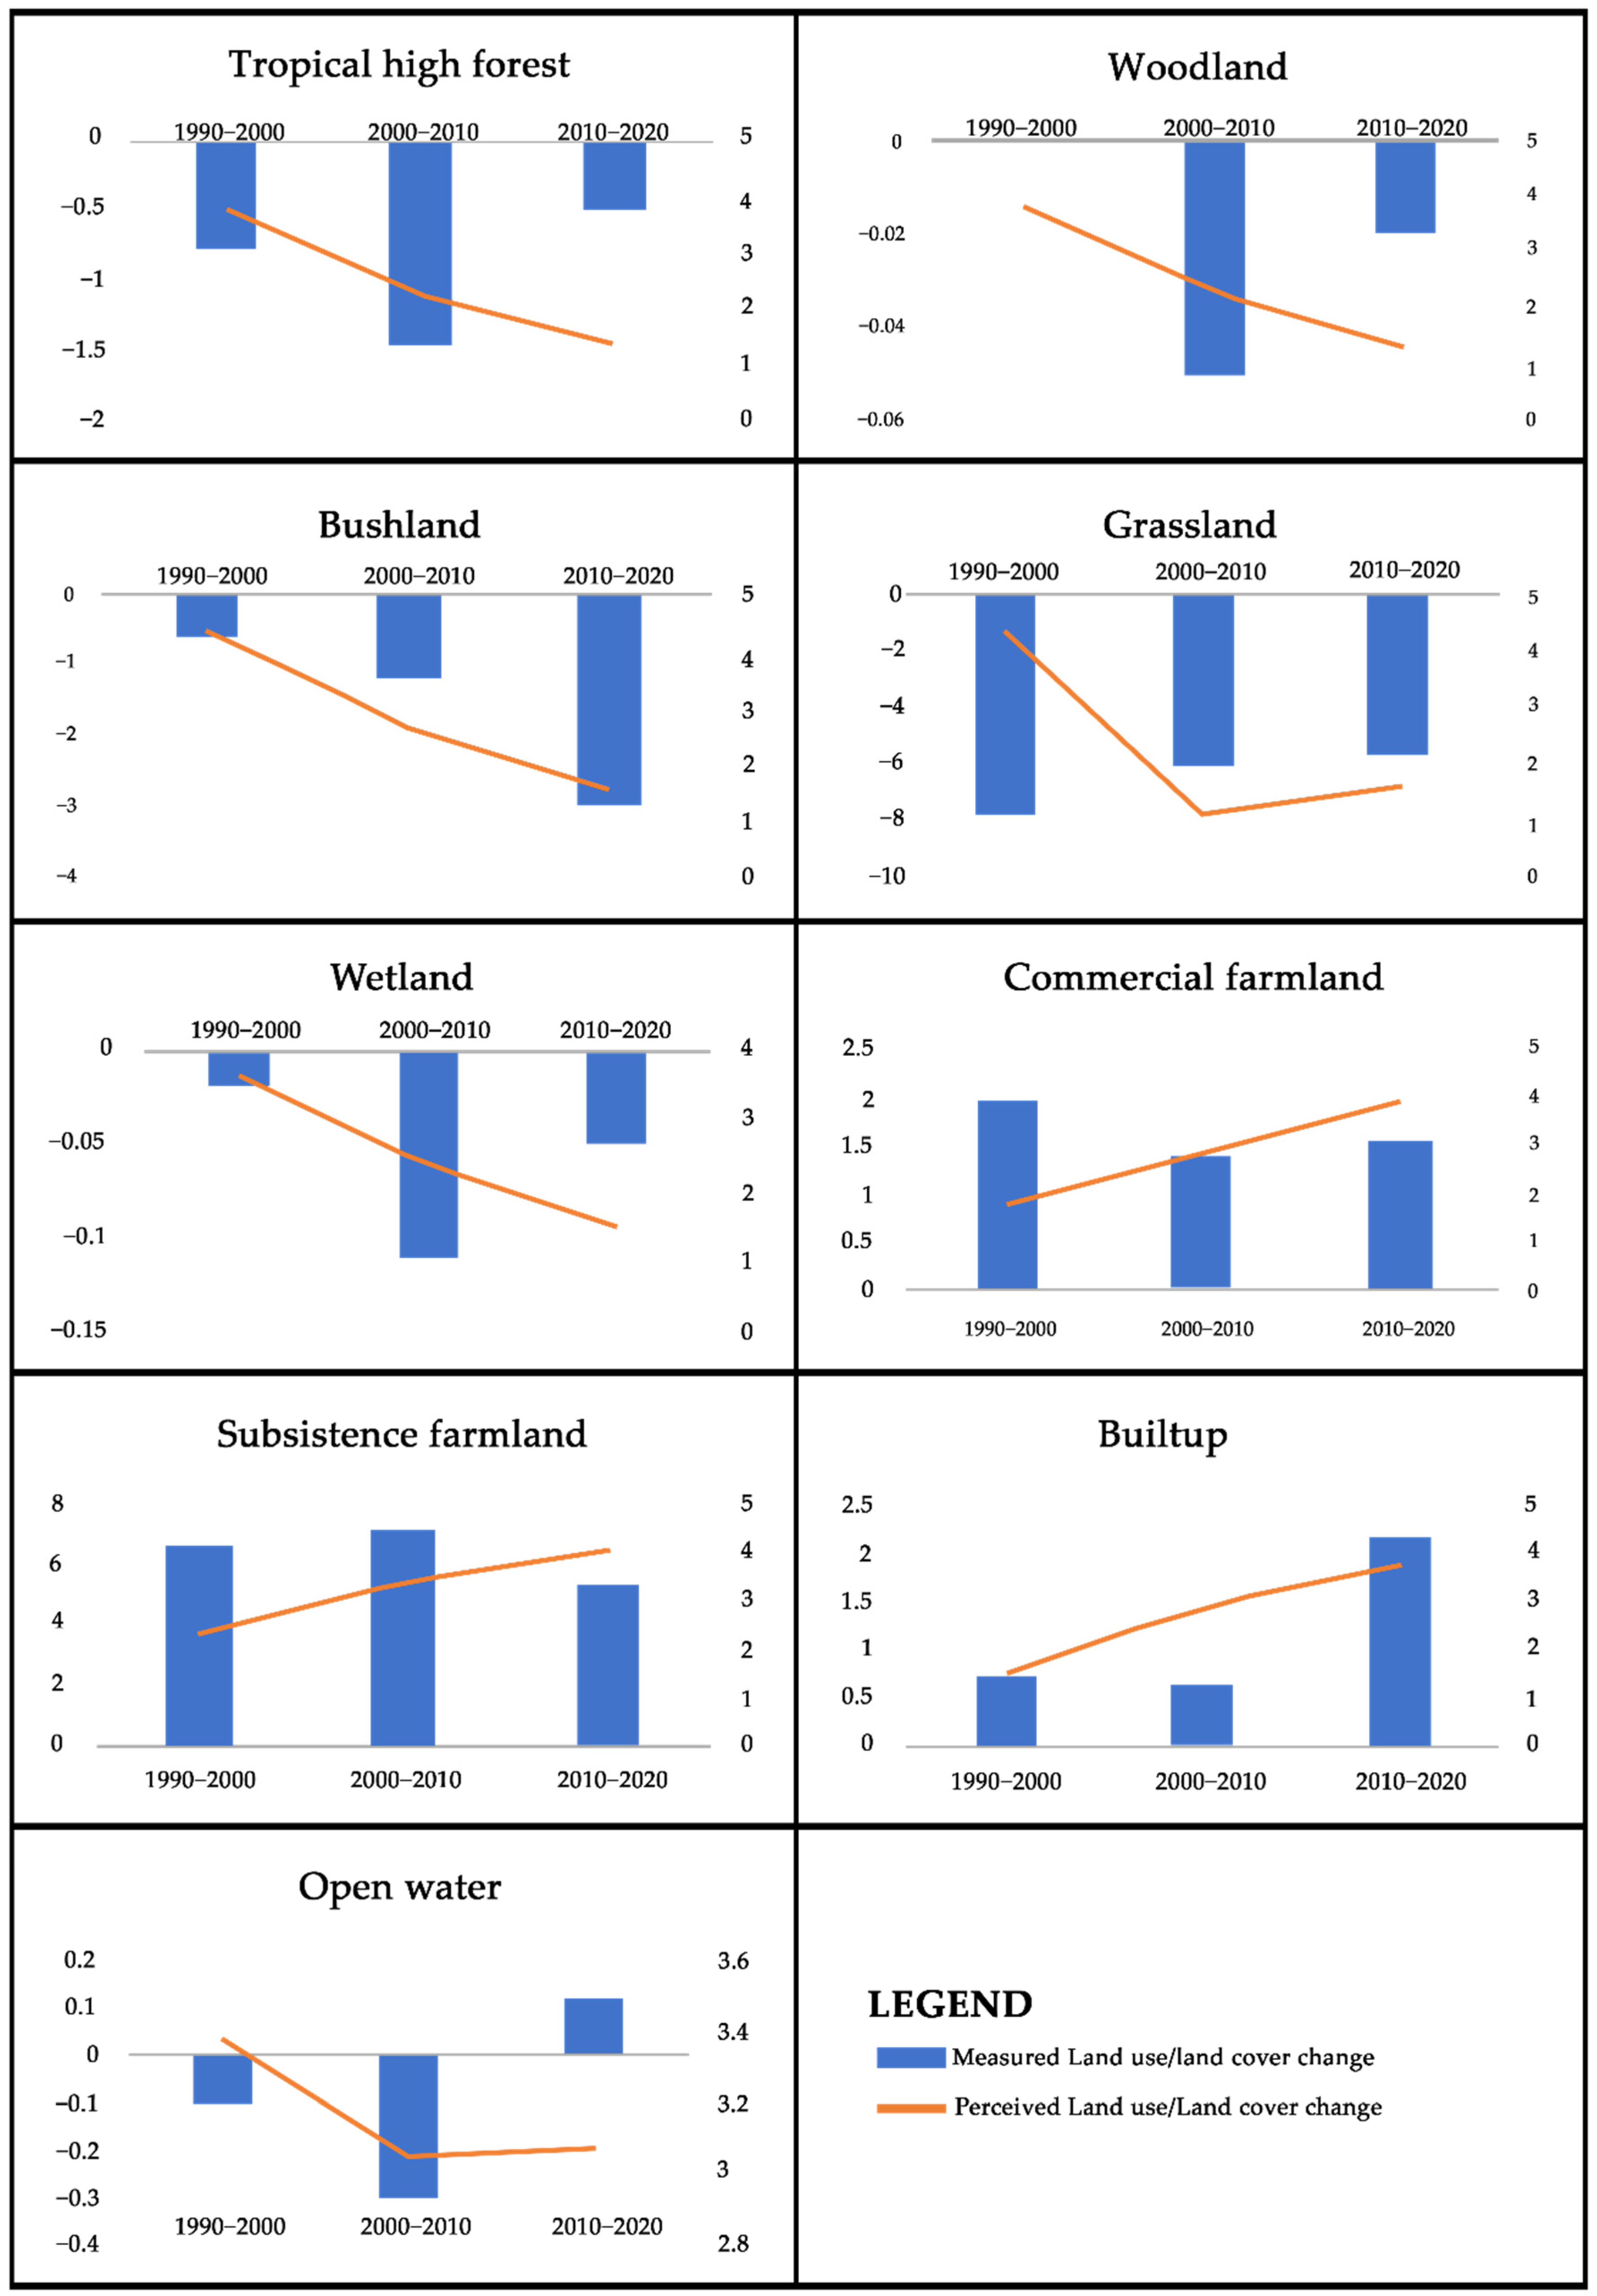
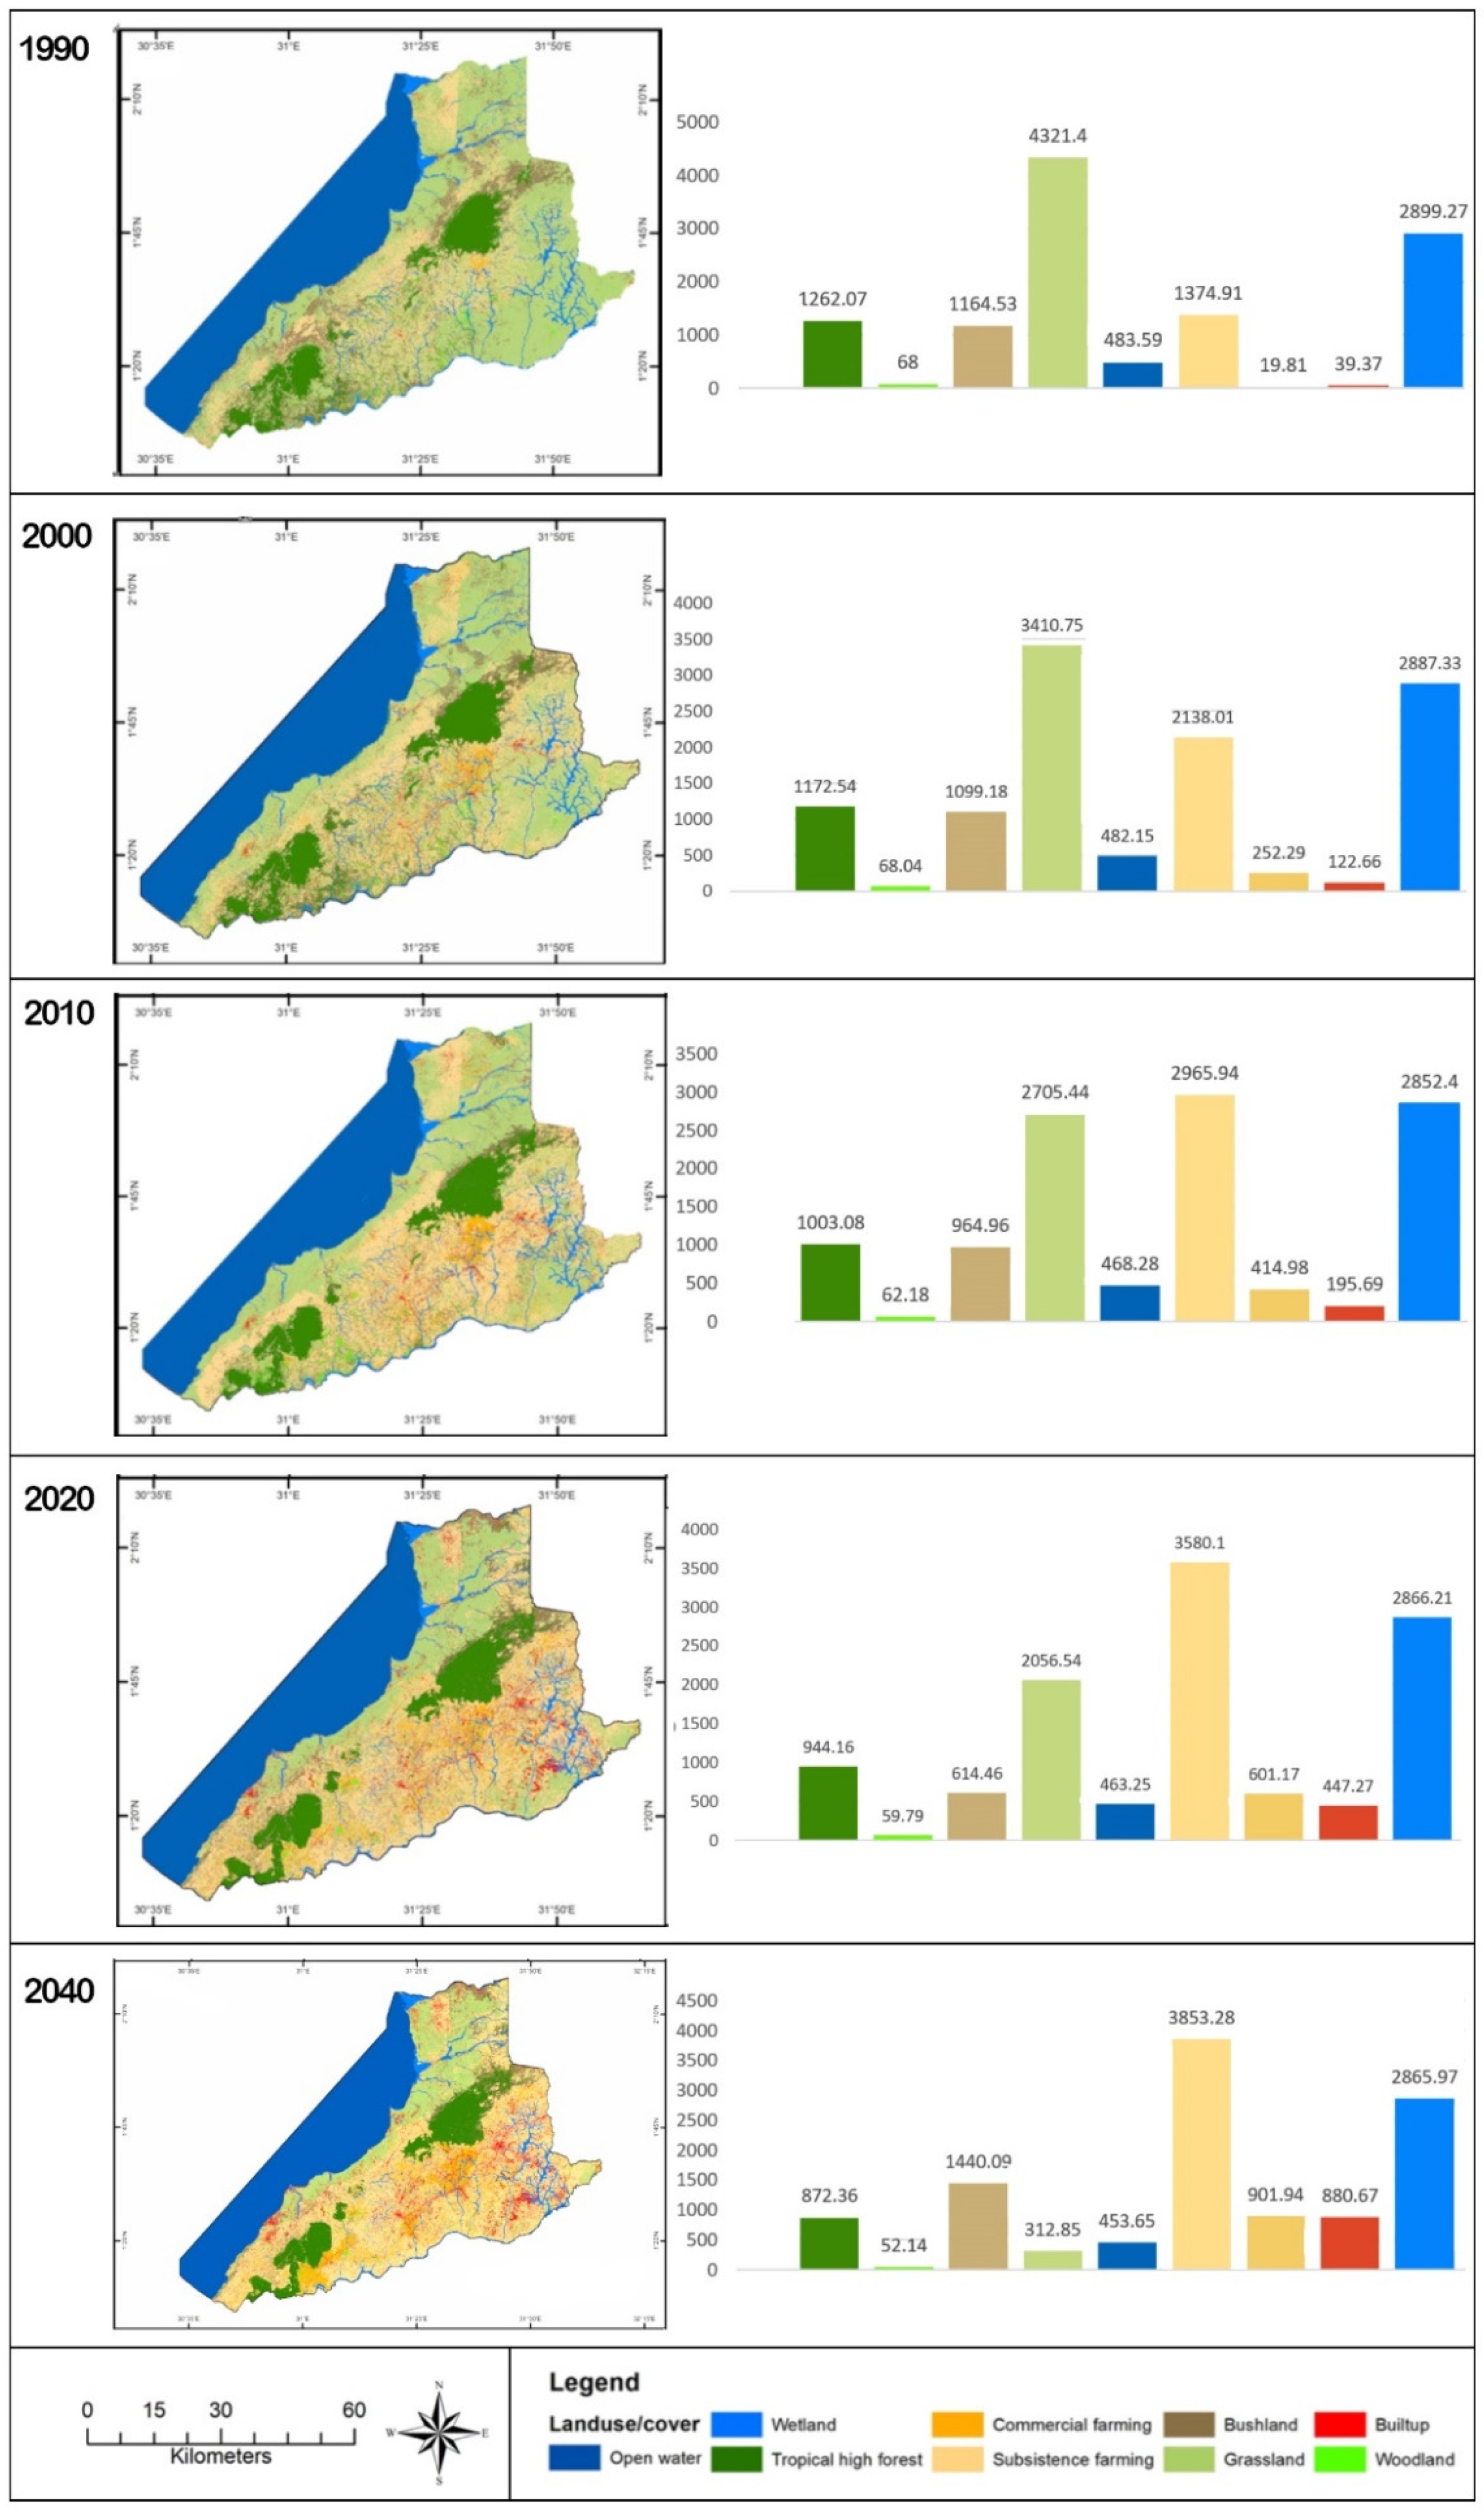
3.1. Perceived Land Use/Land Cover Change
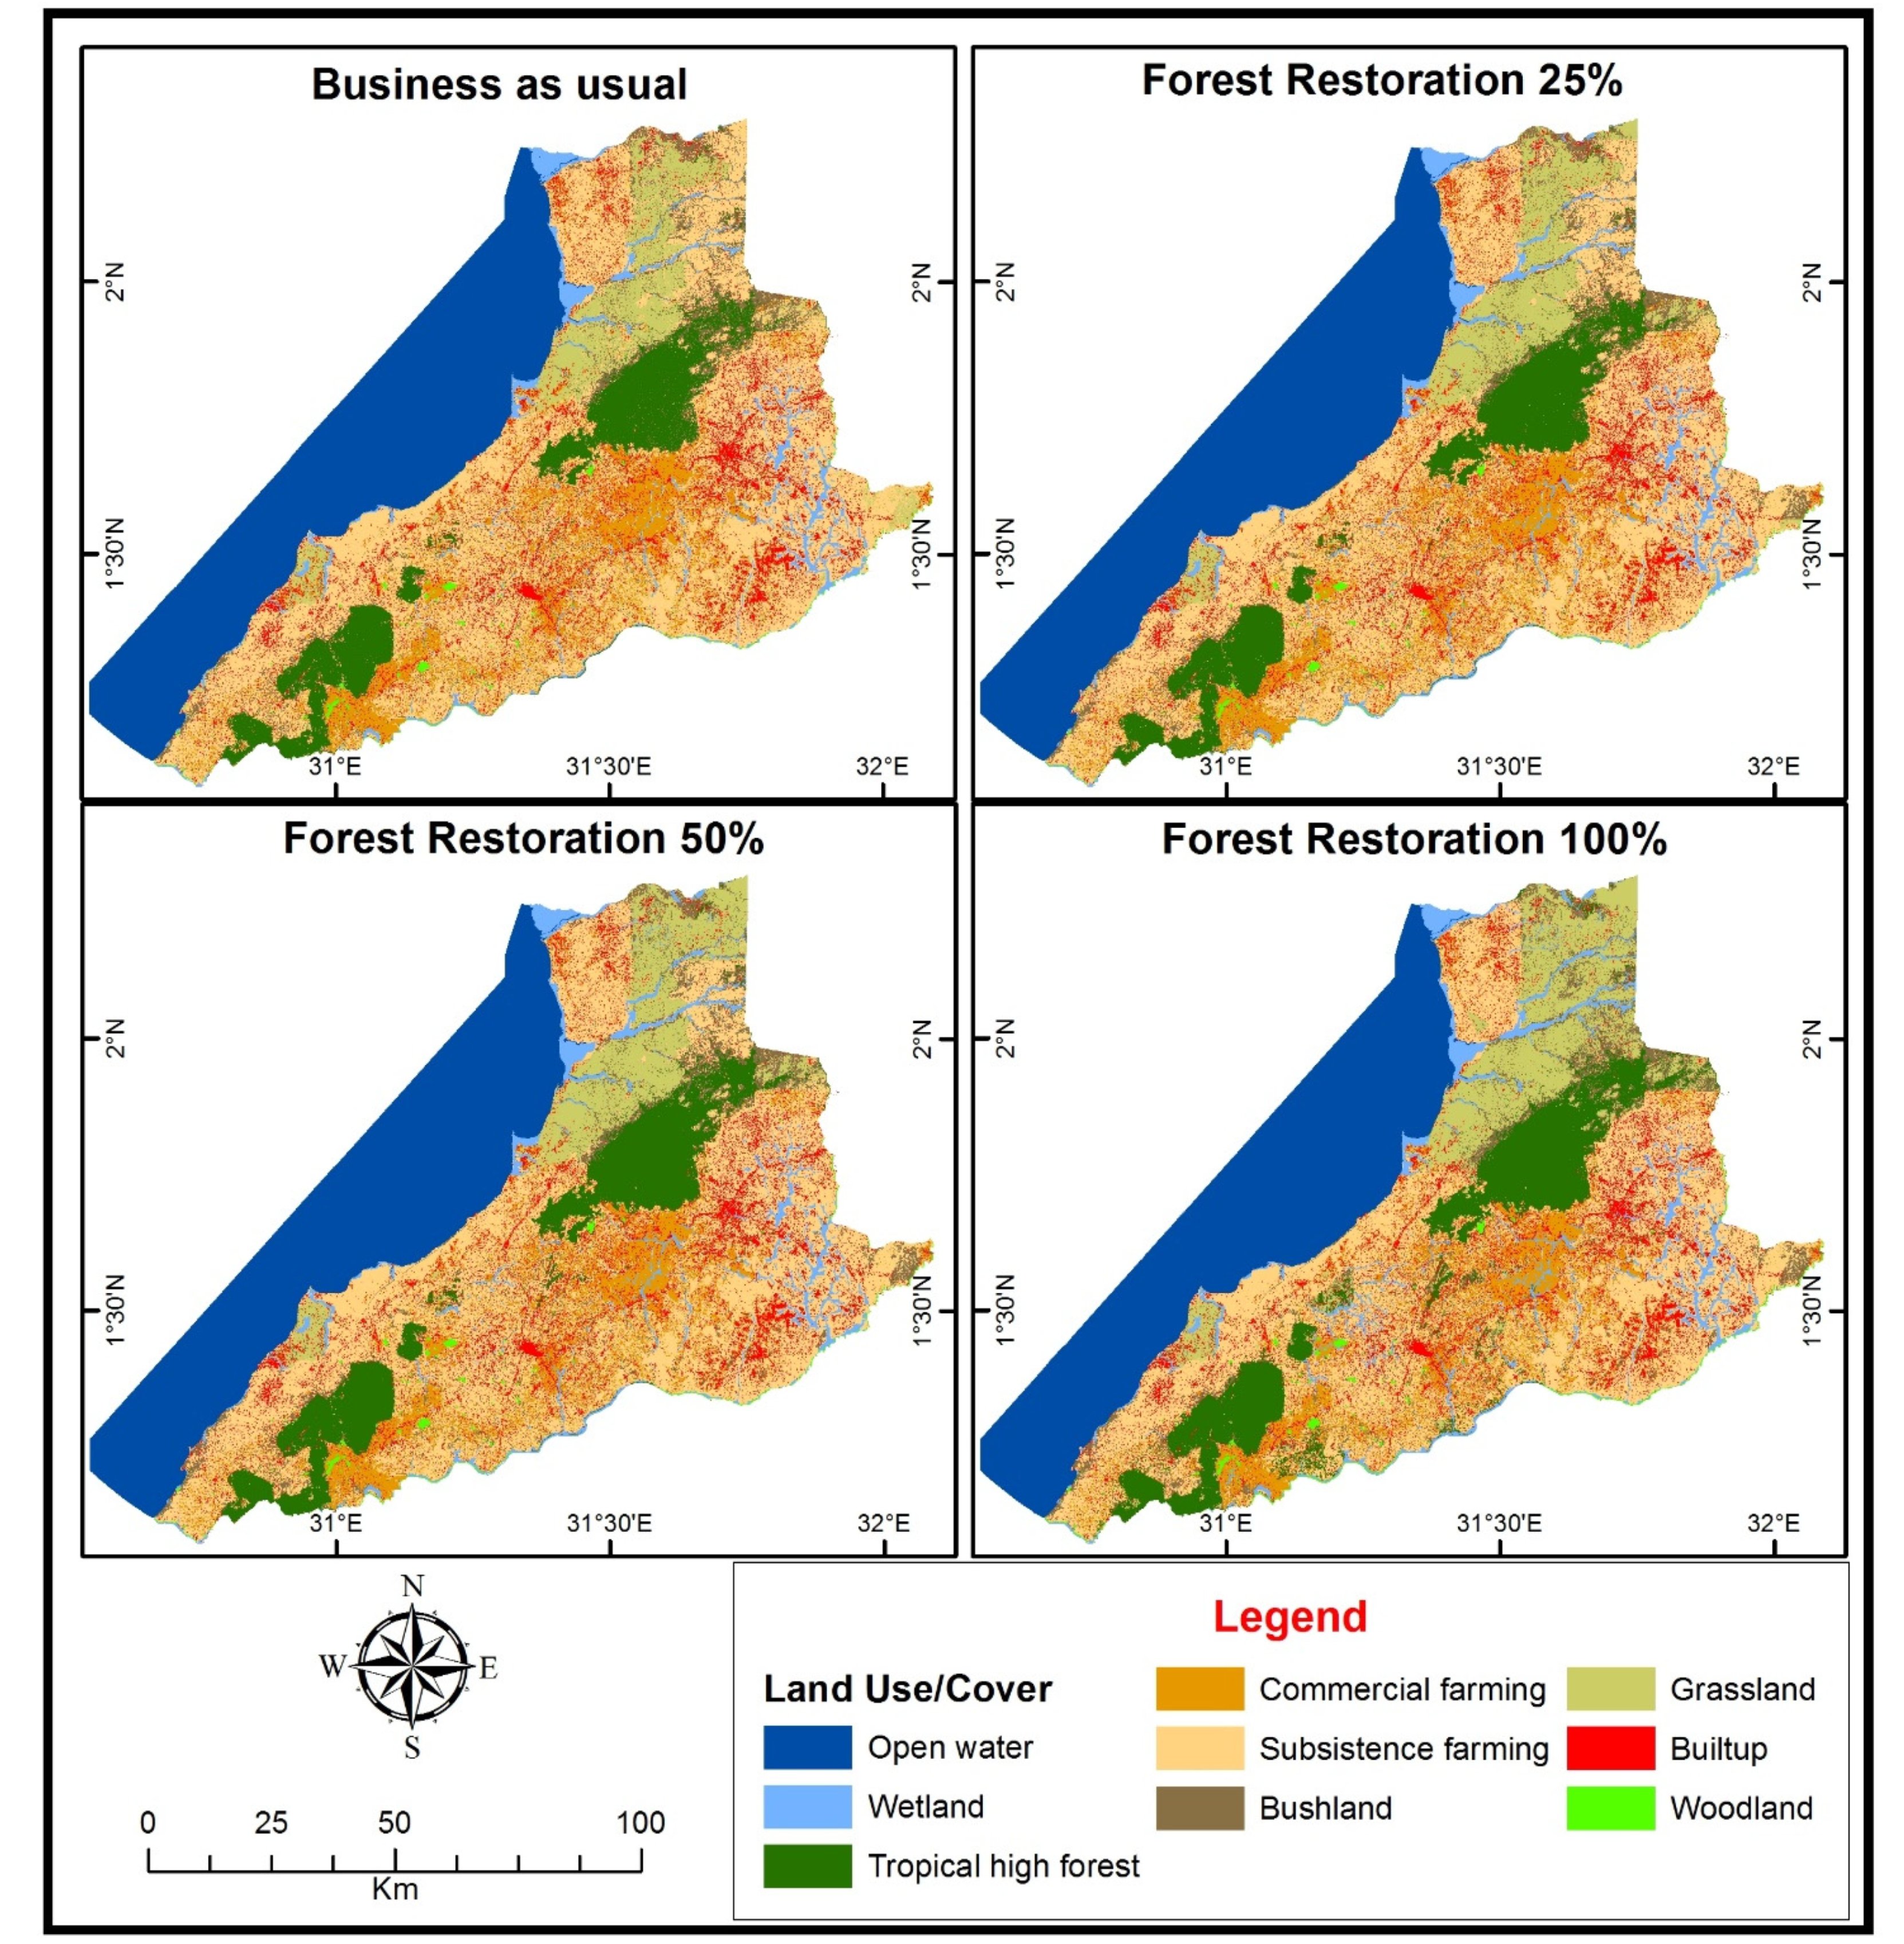
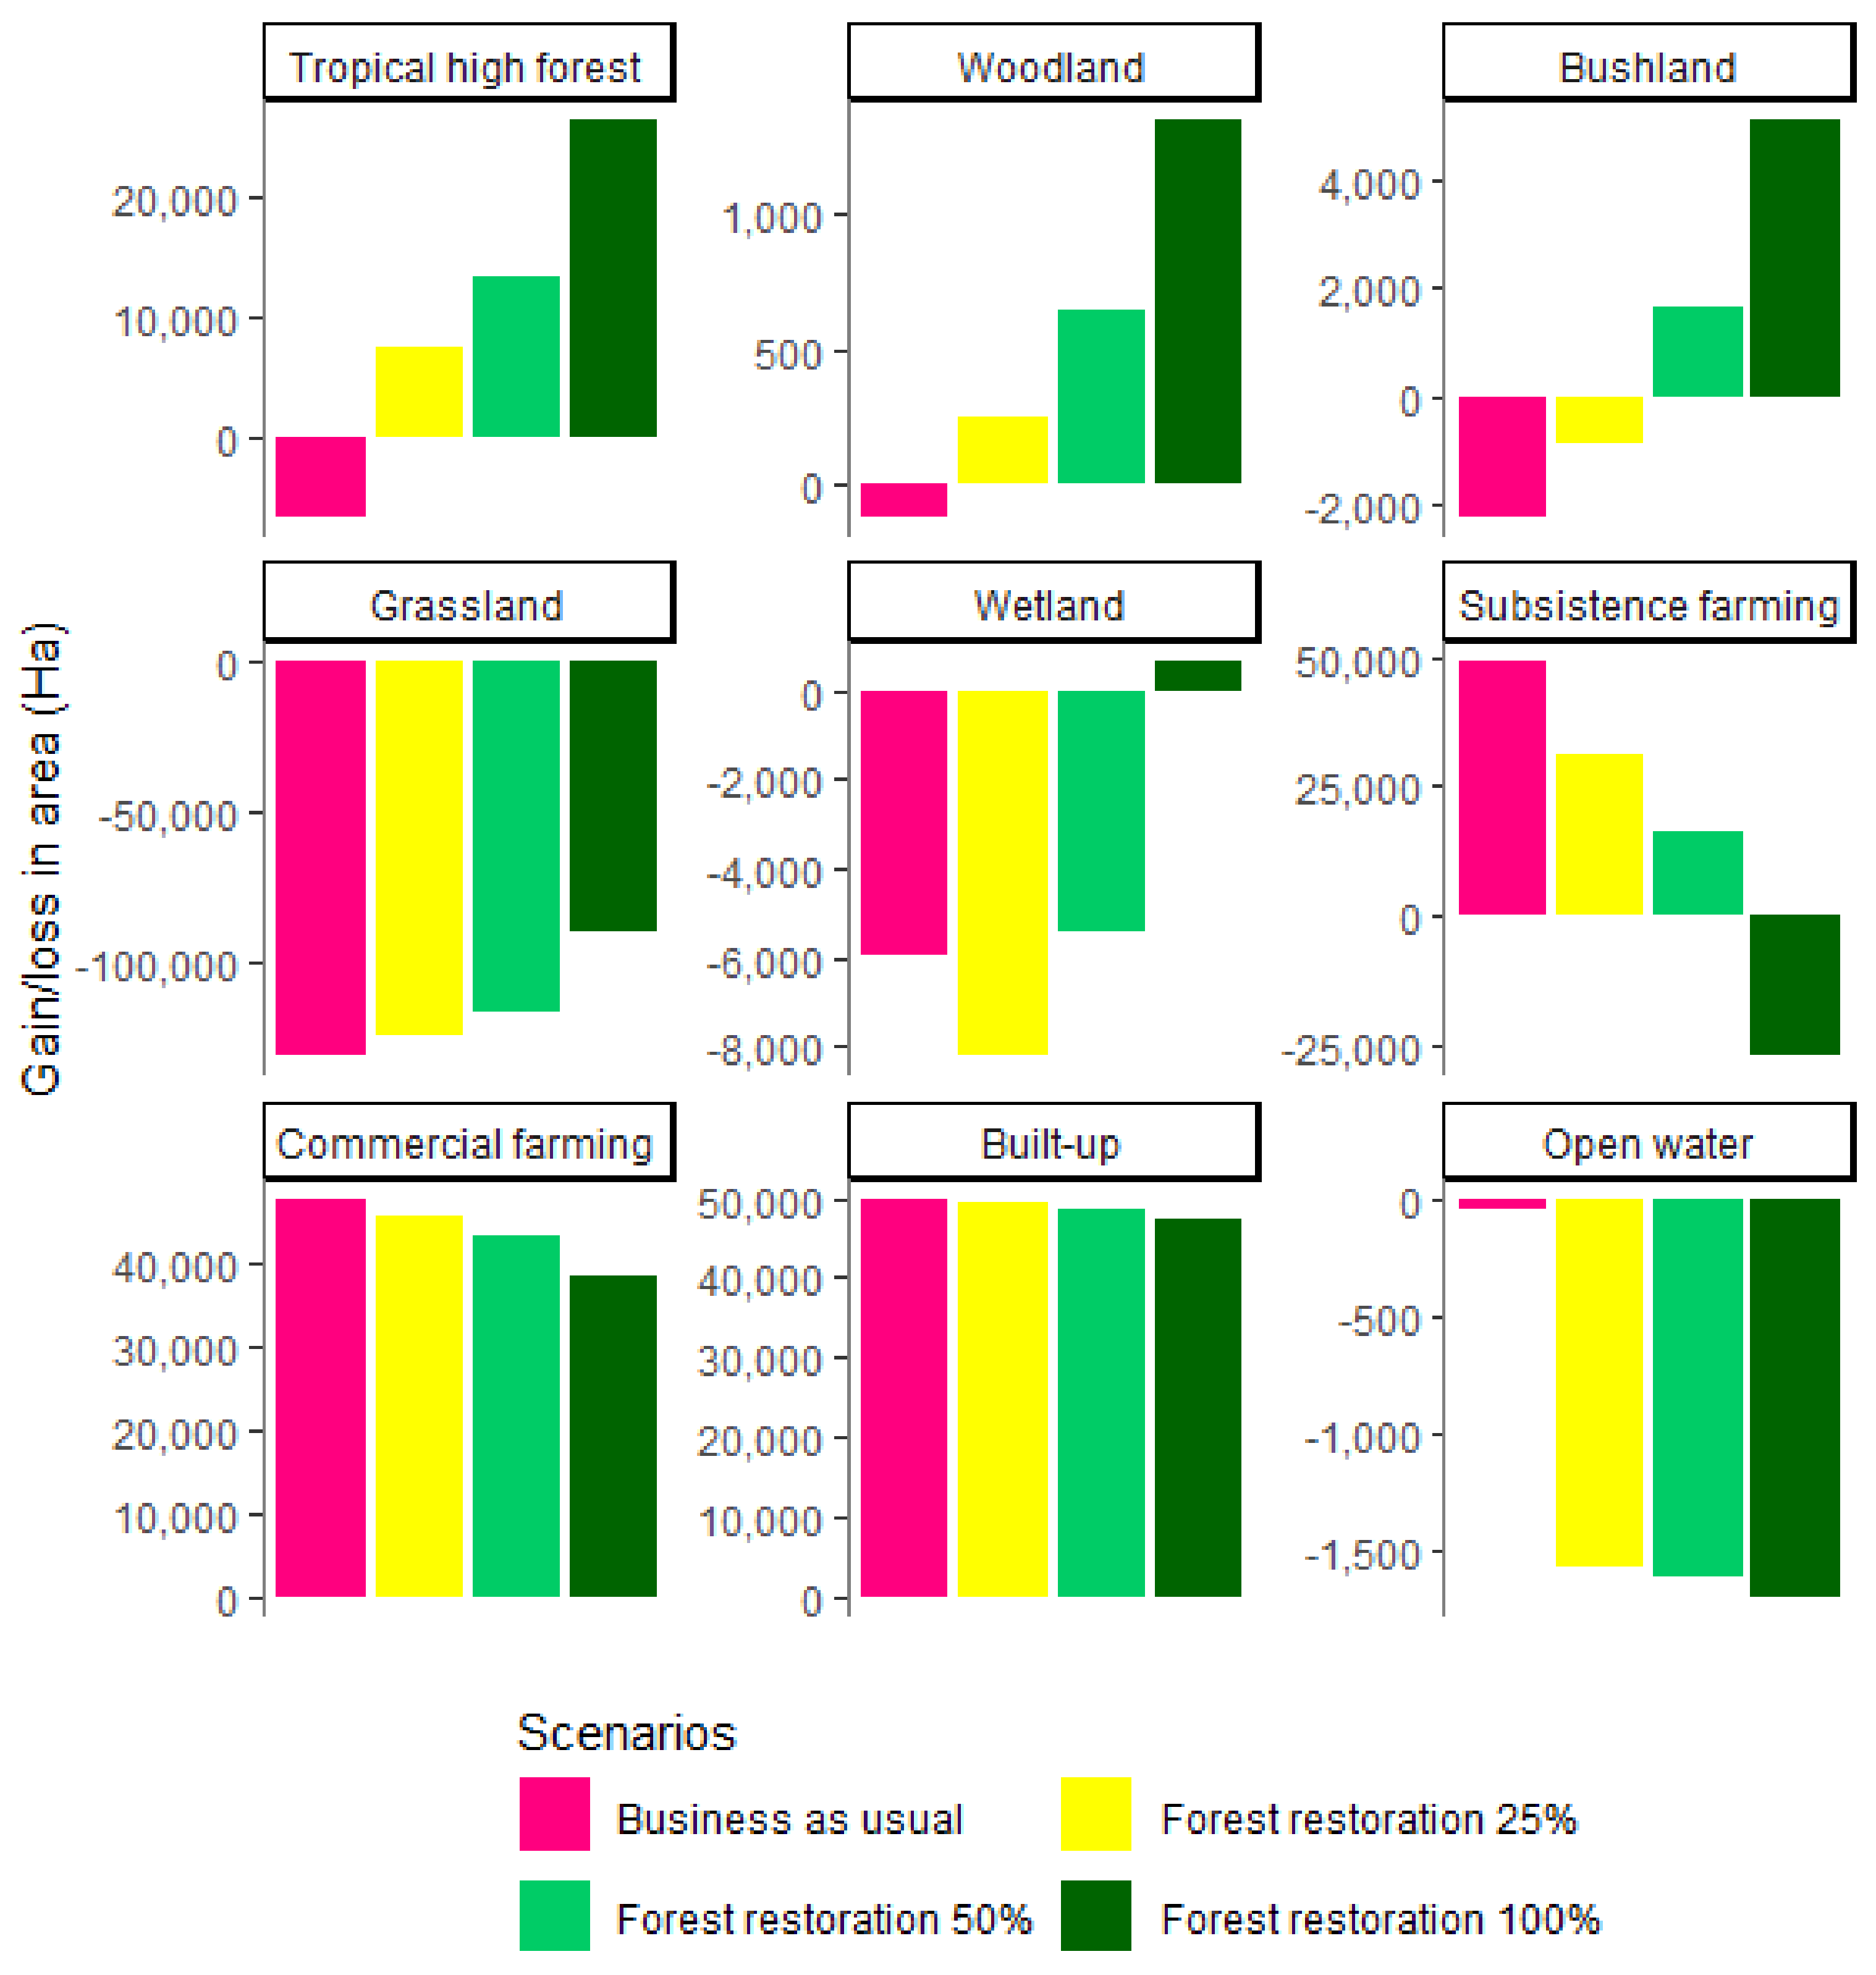
3.2. Predicted Land Use/Land Cover in 2040
3.3. Perceived Drivers of Land Use/Land Cover Change
3.4. Ecosystem Services
3.4.1. Importance of Ecosystem Services
3.4.2. Landscape Ecosystem Service Matrix
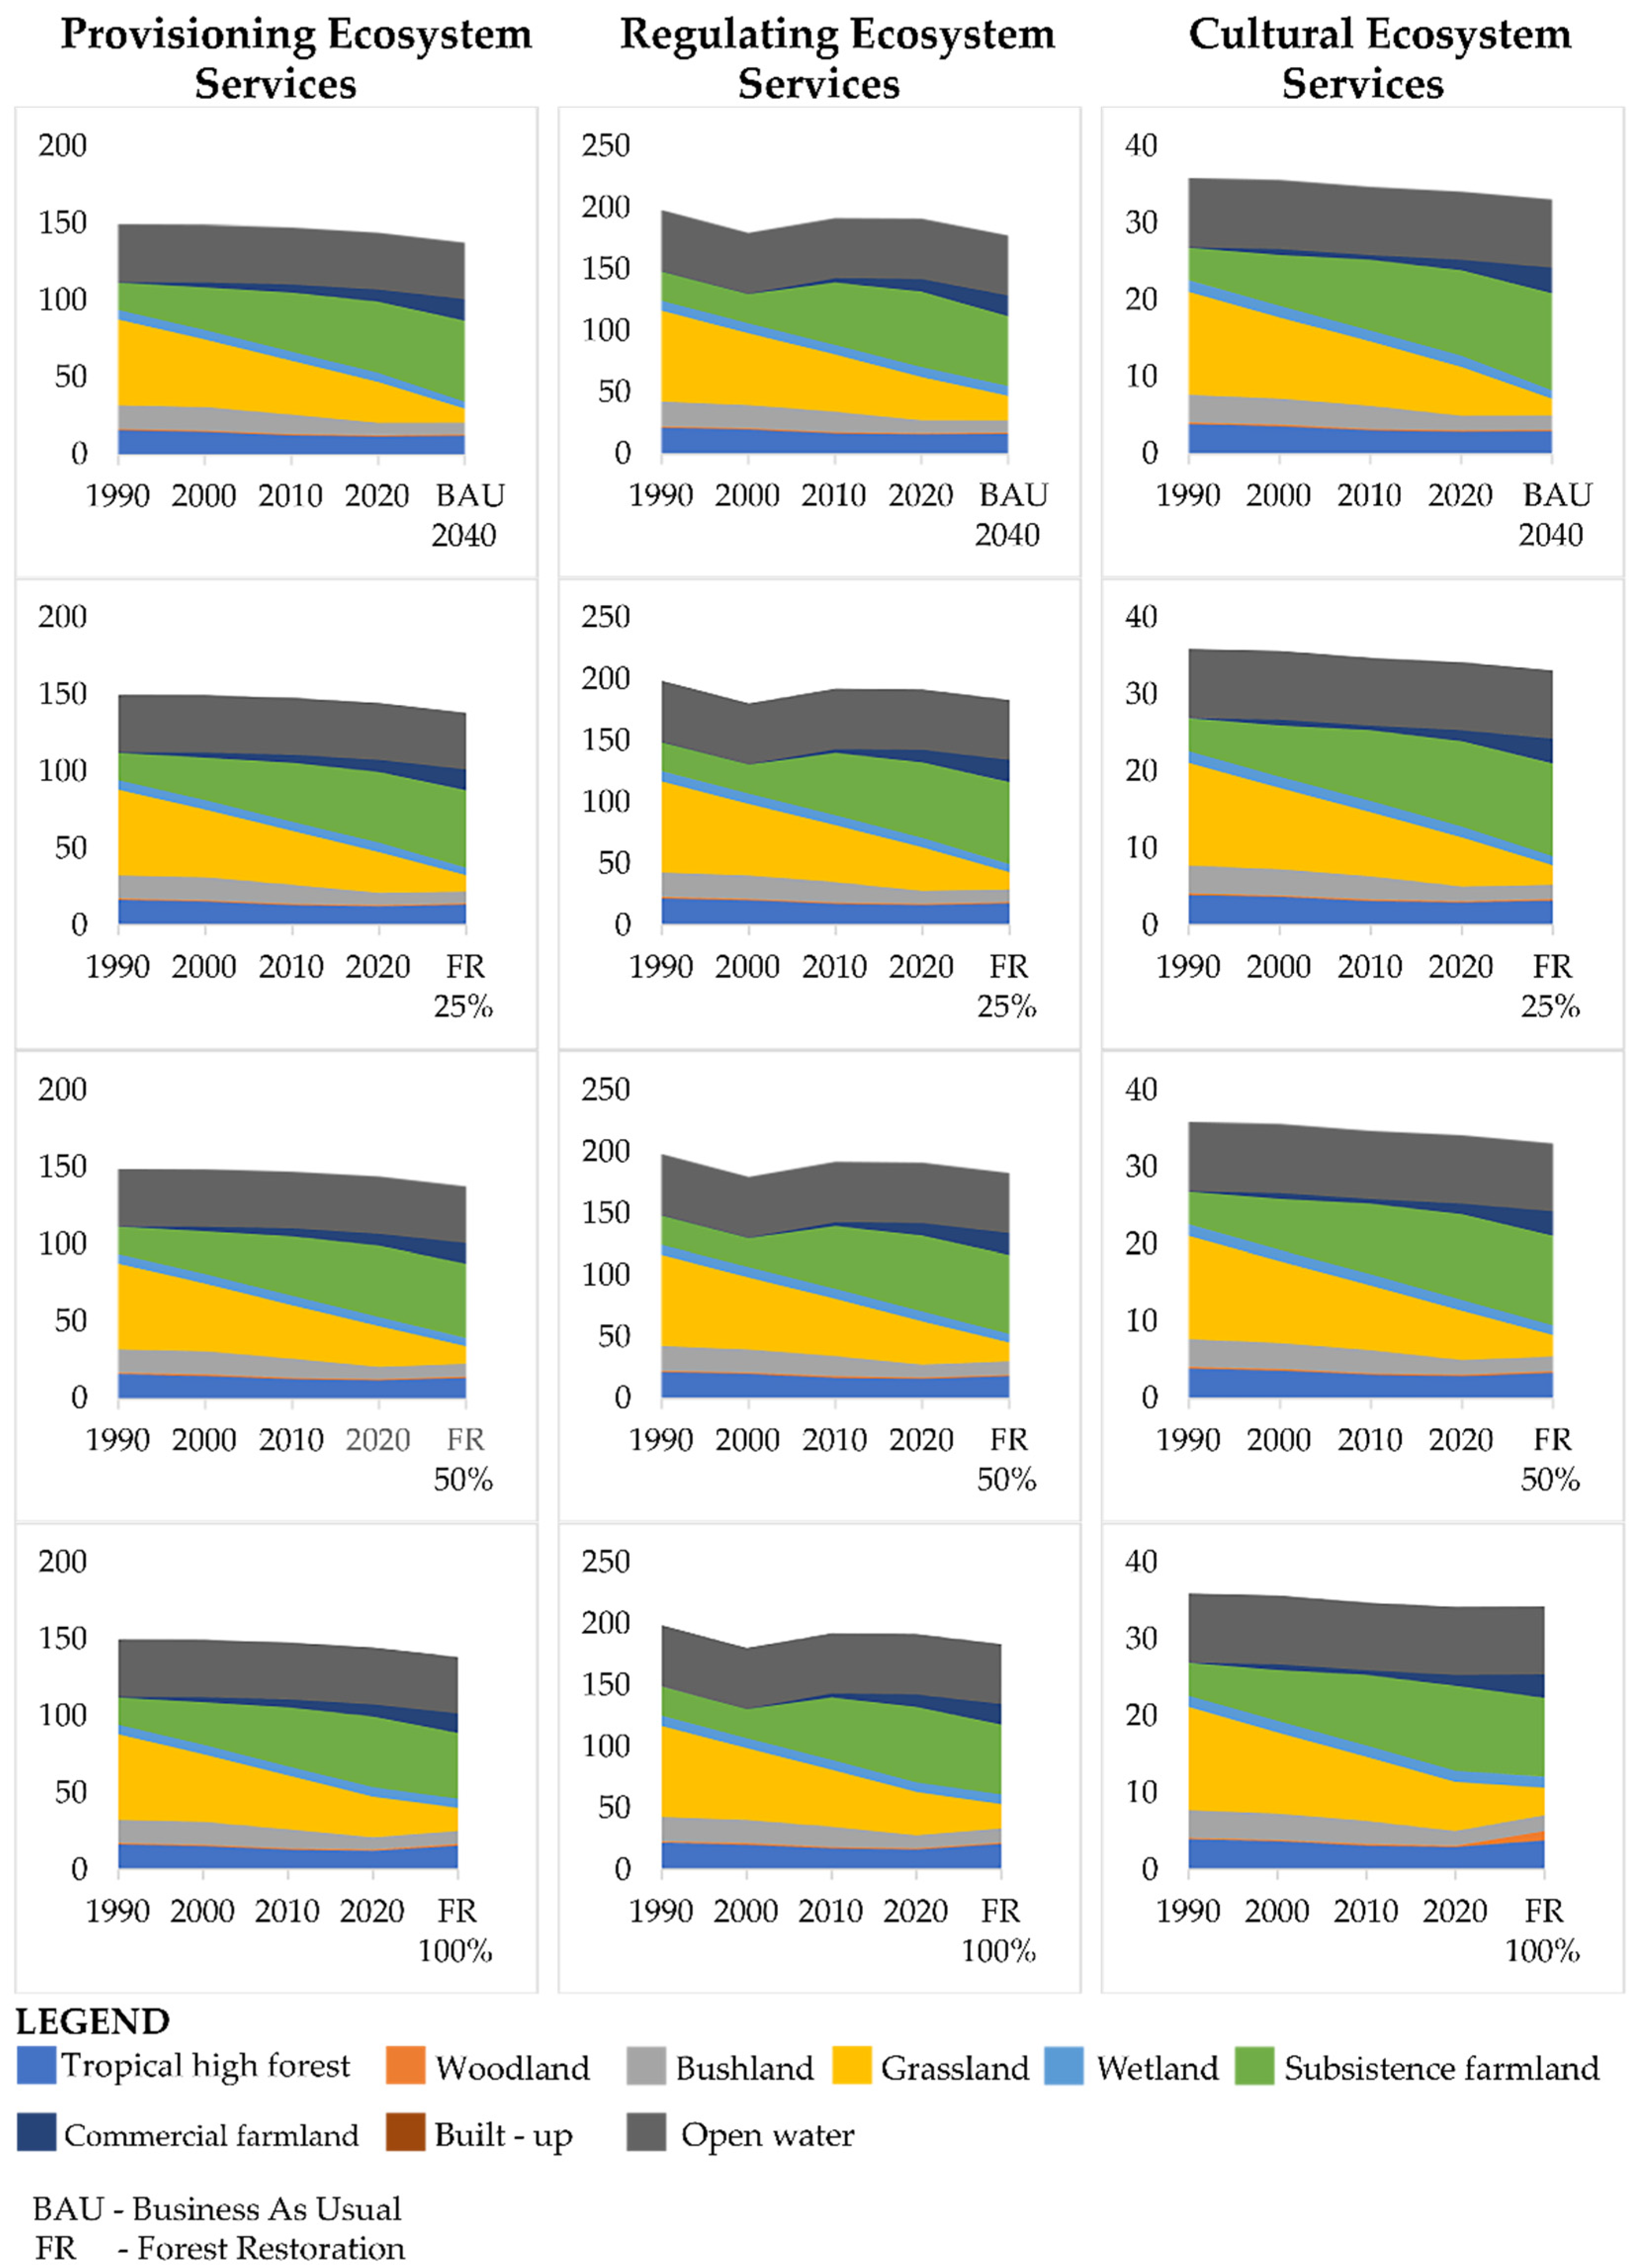
3.4.3. Ecosystem Services Potential
3.4.4. Relationship between Ecosystem Services
3.5. Summary Content from KIIs and FGDs
“There has been remarkable conversion of forests, grasslands, and wetlands to agricultural fields and settlement areas in the past three decades. This trend is expected to increase exponentially in the years ahead because of population growth, poverty, the oil/gas activities, and the exponential increase in sugarcane growing in this area. We are now witnessing low agricultural productivity, drying of wetlands, long dry spells, and hazards in form of heavy storm”.
4. Discussion
4.1. Land Use/Land Cover Change Dynamics
4.2. Relationship between LULCC Dynamics and Ecosystem Services Potential
4.3. Limitations to the Study
5. Conclusions
Author Contributions
Funding
Institutional Review Board Statement
Informed Consent Statement
Data Availability Statement
Acknowledgments
Conflicts of Interest
Appendix A

| Year | Acquisition Date | Image | Satellite | Bands Combination |
|---|---|---|---|---|
| 2020 | 15/01/2020 | LC08_L1TP_172059_20200115_20200127_01_T1 | Landsat 8 | 432 |
| 2010 | 17/01/2012 | LE07_L1TP_172059_20120117_20161204_01_T1 | Landsat 7 | 321 |
| 2000 | 06/01/2002 | LE07_L1TP_172059_20020206_20170201_01_T1 | Landsat 7 | 321 |
| 1990 | 22/01/1990 | LT04_L1TP_172059_19901222_20170127_01_T1 | Landsat 4 | 321 |
| LULC Class | Description |
|---|---|
| Tropical high forest | Fully stocked with trees (natural and planted) forming closed canopies preventing sunlight penetration |
| Woodlands | Open trees and woody areas |
| Bush lands | Closed, open or very open shrubs |
| Grasslands | Graminoids, herbaceous area, may include scattered shrubs and thickets |
| Wetlands | Swampy and marshy areas |
| Subsistence farmlands | Mixed farmland, shrub and herbaceous crops on small fields |
| Commercial farmlands | Mono-cropped, both seasonal and non-seasonal farmland, e.g, sugarcane, tea of medium to large acreage |
| Built-up | Urban or rural built-up areas, roads, industrial parks |
| Open water | Lakes, rivers, ponds (stagnant and flowing water) |
| LULC | 1990 | 2000 | 2010 | 2020 | ||||
|---|---|---|---|---|---|---|---|---|
| P * | U * | P | U | P | U | P | U | |
| Open Water | 90 | 90 | 90 | 100 | 90 | 90 | 100 | 90.91 |
| Wetland | 70.00 | 70 | 71.43 | 65.22 | 76.19 | 69.57 | 85.71 | 78.26 |
| Tropical High Forest | 83 | 86.36 | 83 | 82.61 | 78 | 90 | 91 | 95.45 |
| Commercial Farming | 83.33 | 92.11 | 80.65 | 80.65 | 83.87 | 78.79 | 93.55 | 87.88 |
| Subsistence Farming | 89.47 | 91.07 | 84.38 | 93.1 | 87.50 | 88.89 | 90.63 | 90.63 |
| Bushland | 78.26 | 78.26 | 78.26 | 75 | 78.26 | 81.82 | 86.96 | 86.96 |
| Grassland | 95.65 | 86.27 | 87.50 | 79.25 | 87.50 | 84 | 85.42 | 85.42 |
| Built-up | 96.77 | 96.77 | 90.63 | 96.67 | 84.38 | 96.43 | 84.38 | 100 |
| Woodland | 89.29 | 86.21 | 85.71 | 82.76 | 85.71 | 77.42 | 85.71 | 82.76 |
| Overall Accuracy | 87.50 | 83.93 | 84.29 | 88.5 | ||||
| Kappa | 0.857 | 0.815 | 0.819 | 0.869 | ||||
| Land Use/Cover | 1990 | 2000 | 2010 | 2020 | ||||
|---|---|---|---|---|---|---|---|---|
| Area (Ha2) | Area (%) | Area (Ha2) | Area (%) | Area (Ha2) | Area (%) | Area (Ha2) | Area (%) | |
| Tropical high forest | 126207 | 10.85 | 117254 | 10.08 | 100308 | 8.62 | 94416 | 8.12 |
| Woodland | 6800 | 0.58 | 6804 | 0.58 | 6218 | 0.53 | 5979 | 0.51 |
| Bushland | 116453 | 10.01 | 109918 | 9.45 | 96496 | 8.30 | 61446 | 5.28 |
| Grassland | 43214 | 37.15 | 341075 | 29.32 | 270544 | 23.26 | 205654 | 17.68 |
| Wetland | 48359 | 4.16 | 48215 | 4.14 | 46828 | 4.03 | 46325 | 3.98 |
| Subsistence farmland | 137491 | 11.82 | 213801 | 18.38 | 296594 | 25.50 | 358010 | 30.78 |
| Commercial farmland | 1981 | 0.17 | 25229 | 2.17 | 41498 | 3.57 | 60117 | 5.17 |
| Built-up | 3937 | 0.34 | 12266 | 1.05 | 19569 | 1.68 | 44727 | 3.84 |
| Open water | 289927 | 24.92 | 288733 | 24.82 | 285240 | 24.52 | 286621 | 24.64 |
| Total | 1,163,295 | 100 | 1,163,295 | 100 | 1,163,295 | 100 | 1,163,295 | 100 |

| Information of Allocation | Classification Agreement/Disagreement | ||
|---|---|---|---|
| Information of Quantity | |||
| No [n] | Medium [m] | Perfect [p] | |
| Perfect [P(x)] | P (n) = 0.5245 | P (m) = 0.9929 | P (p) = 1.0000 |
| PerfectStratum [K(x)] | K (n) = 0.5245 | K (m) = 0.9929 | K (p) = 1.0000 |
| MediumGrid [M(x)] | M (n) = 0.5211 | M (m) = 0.9842 | M (p) = 0.9786 |
| MediumStratum [H(x)] | H (n) = 0.1000 | H (m) = 0.3003 | H (p) = 0.3010 |
| No [N(x)] | N (n) = 0.1000 | N (m) = 0.3003 | N (p) = 0.3010 |
| Chance Agreement | 0.1 | ||
| Quantity Agreement | 0.2003 | ||
| Strata Agreement | 0 | ||
| Gridcell Agreement | 0.6838 | ||
| Gridcell Disagreement | 0.0087 | ||
| Strata Disagreement | 0 | ||
| Quantity Disagreement | 0.0071 | ||
| Kappa No Information | 0.9824 | ||
| Kappa Location | 0.9875 | ||
| Kappa Location Strata | 0.9875 | ||
| Kappa Standard | 0.9774 | ||
| 1 | 1 | 2 | 3 | 4 | 5 | 6 | 7 | 8 | 9 | 10 | 11 | 12 | 13 | 14 | 15 | 16 | 17 | 18 | 19 | 20 | 21 | |
|---|---|---|---|---|---|---|---|---|---|---|---|---|---|---|---|---|---|---|---|---|---|---|
| Food crop | 1 | |||||||||||||||||||||
| 1.Food crop | −0.0199 | 1 | ||||||||||||||||||||
| 0.6817 | ||||||||||||||||||||||
| 2.Cash crop | −0.1047 | 0.5428 | 1 | |||||||||||||||||||
| 0.0309 | 0 | |||||||||||||||||||||
| 3. Hunting bushmeat | −0.2066 | 0.0192 | 0.1225 | 1 | ||||||||||||||||||
| 0 | 0.6937 | 0.0115 | ||||||||||||||||||||
| 4. Grazing pasture | −0.2232 | 0.2 | 0.3385 | 0.1878 | 1 | |||||||||||||||||
| 0 | 0 | 0 | 0.0001 | |||||||||||||||||||
| 5. Fire wood/chacoal | −0.3504 | 0.2791 | 0.2571 | 0.2093 | 0.3989 | 1 | ||||||||||||||||
| 0 | 0 | 0 | 0 | 0 | ||||||||||||||||||
| 6. Water supply | 0.019 | 0.0972 | 0.002 | 0.1183 | 0.3364 | 0.2946 | 1 | |||||||||||||||
| 0.6962 | 0.0452 | 0.9665 | 0.0147 | 0 | 0 | |||||||||||||||||
| 7. Water quality purification | −0.1543 | 0.1024 | 0.1054 | 0.0944 | 0.3332 | 0.2896 | 0.5763 | 1 | ||||||||||||||
| 0.0014 | 0.0348 | 0.0298 | 0.0517 | 0 | 0 | 0 | ||||||||||||||||
| 8. Flood control | 0.0406 | 0.0727 | 0.2429 | 0.0744 | 0.153 | −0.1852 | 0.0834 | 0.2331 | 1 | |||||||||||||
| 0.4034 | 0.1346 | 0 | 0.1257 | 0.0016 | 0.0001 | 0.0861 | 0 | |||||||||||||||
| 9. Air quality regulation | −0.0791 | 0.1246 | 0.0242 | 0.2389 | 0.1988 | 0.5187 | 0.4496 | 0.3717 | −0.1055 | 1 | ||||||||||||
| 0.1036 | 0.0101 | 0.6194 | 0 | 0 | 0 | 0 | 0 | 0.0296 | ||||||||||||||
| 10. Rainfall formation | −0.2231 | 0.166 | 0.1427 | 0.2196 | 0.4051 | 0.547 | 0.3734 | 0.4121 | 0.0375 | 0.5618 | 1 | |||||||||||
| 0 | 0.0006 | 0.0032 | 0 | 0 | 0 | 0 | 0 | 0.4407 | 0 | |||||||||||||
| 11. Soil erosion control | −0.2101 | 0.0561 | 0.0894 | 0.1304 | 0.462 | 0.4682 | 0.4272 | 0.4173 | 0.0416 | 0.4556 | 0.6248 | 1 | ||||||||||
| 0 | 0.2483 | 0.0657 | 0.0071 | 0 | 0 | 0 | 0 | 0.3922 | 0 | 0 | ||||||||||||
| 12. Soil fertility improvement | −0.3304 | 0.1632 | 0.1426 | 0.1127 | 0.4477 | 0.6265 | 0.3655 | 0.3887 | −0.0778 | 0.5287 | 0.6919 | 0.6817 | 1 | |||||||||
| 0 | 0.0007 | 0.0032 | 0.0201 | 0 | 0 | 0 | 0 | 0.1094 | 0 | 0 | 0 | |||||||||||
| 13. Cooling temperature | −0.242 | 0.1514 | 0.0935 | 0.2178 | 0.3175 | 0.5357 | 0.3758 | 0.3683 | −0.0634 | 0.6792 | 0.6368 | 0.5371 | 0.6645 | 1 | ||||||||
| 0 | 0.0017 | 0.0541 | 0 | 0 | 0 | 0 | 0 | 0.1918 | 0 | 0 | 0 | 0 | ||||||||||
| 14. Crop pollination | −0.1547 | 0.2075 | 0.2537 | 0.0913 | 0.2063 | 0.3163 | 0.0526 | 0.2652 | 0.1066 | 0.278 | 0.3544 | 0.3578 | 0.3976 | 0.4585 | 1 | |||||||
| 0.0014 | 0 | 0 | 0.0601 | 0 | 0 | 0.2795 | 0 | 0.028 | 0 | 0 | 0 | 0 | 0 | |||||||||
| 15. Pest and disease control | −0.5056 | 0.116 | 0.2288 | 0.2095 | 0.3328 | 0.5327 | 0.0166 | 0.2575 | −0.0617 | 0.2941 | 0.4687 | 0.4243 | 0.531 | 0.4574 | 0.4403 | 1 | ||||||
| 0 | 0.0167 | 0 | 0 | 0 | 0 | 0.7336 | 0 | 0.2043 | 0 | 0 | 0 | 0 | 0 | 0 | ||||||||
| 16. Ecotourism | 0.1771 | 0.1142 | 0.1783 | 0.1684 | 0.0599 | −0.0662 | 0.1705 | 0.1199 | 0.2039 | −0.0207 | −0.0199 | 0.0824 | −0.0466 | 0.0468 | 0.0932 | −0.114 | 1 | |||||
| 0.0002 | 0.0185 | 0.0002 | 0.0005 | 0.2175 | 0.1733 | 0.0004 | 0.0134 | 0 | 0.6707 | 0.6822 | 0.0898 | 0.3376 | 0.3358 | 0.0548 | 0.0187 | |||||||
| 17. Herbal medicine | −0.1772 | 0.0786 | 0.0752 | 0.3002 | 0.3342 | 0.5103 | 0.2626 | 0.1936 | −0.206 | 0.4591 | 0.5094 | 0.4918 | 0.5594 | 0.5008 | 0.2761 | 0.4259 | 0.0904 | 1 | ||||
| 0.0002 | 0.1056 | 0.1218 | 0 | 0 | 0 | 0 | 0.0001 | 0 | 0 | 0 | 0 | 0 | 0 | 0 | 0 | 0.0627 | ||||||
| 18. Education sites | 0.2047 | 0.1132 | 0.1424 | 0.2251 | 0.0266 | −0.1296 | 0.1552 | 0.0604 | 0.2202 | −0.0512 | −0.0372 | 0.0348 | −0.1189 | −0.0163 | 0.0478 | −0.1733 | 0.8964 | 0.0483 | 1 | |||
| 0 | 0.0196 | 0.0033 | 0 | 0.5849 | 0.0075 | 0.0013 | 0.214 | 0 | 0.2919 | 0.4437 | 0.4744 | 0.0142 | 0.7377 | 0.3254 | 0.0003 | 0 | 0.3201 | |||||
| 19. Wild foods | −0.2519 | −0.0141 | 0.0642 | 0.2812 | 0.3399 | 0.4569 | 0.3115 | 0.2513 | −0.1807 | 0.4447 | 0.4699 | 0.5187 | 0.5585 | 0.4887 | 0.2971 | 0.4286 | 0.0528 | 0.6993 | −0.005 | 1 | ||
| 0 | 0.772 | 0.1863 | 0 | 0 | 0 | 0 | 0 | 0.0002 | 0 | 0 | 0 | 0 | 0 | 0 | 0 | 0.2775 | 0 | 0.9186 | ||||
| 20. Fish capture | −0.3548 | −0.0478 | 0.1555 | 0.3324 | 0.4388 | 0.2788 | 0.2354 | 0.3328 | 0.0876 | 0.1673 | 0.357 | 0.3854 | 0.3963 | 0.2985 | 0.2582 | 0.4696 | 0.227 | 0.3827 | 0.1697 | 0.4866 | 1 | |
| 0 | 0.3251 | 0.0013 | 0 | 0 | 0 | 0 | 0 | 0.0713 | 0.0005 | 0 | 0 | 0 | 0 | 0 | 0 | 0 | 0 | 0.0004 | 0 | |||
| 21. Building materials/timber | −0.3168 | 0.2644 | 0.2477 | 0.261 | 0.377 | 0.4733 | 0.2442 | 0.3392 | 0.0399 | 0.3069 | 0.3936 | 0.3195 | 0.4158 | 0.3964 | 0.2973 | 0.4839 | 0.1348 | 0.4113 | 0.0872 | 0.385 | 0.4551 | 1 |
| 0 | 0 | 0 | 0 | 0 | 0 | 0 | 0 | 0.4121 | 0 | 0 | 0 | 0 | 0 | 0 | 0 | 0.0054 | 0 | 0.0725 | 0 | 0 |
References
- Hassan, Z.; Shabbir, R.; Ahmad, S.S.; Malik, A.H.; Aziz, N.; Butt, A.; Erum, S. Dynamics of land use and land cover change (LULCC) using geospatial techniques: A case study of Islamabad Pakistan. SpringerPlus 2016, 5, 1–11. [Google Scholar] [CrossRef] [Green Version]
- DiGiano, M.; Ellis, E.; Keys, E. Changing Landscapes for Forest Commons: Linking Land Tenure with Forest Cover Change Following Mexico’s 1992 Agrarian Counter-Reforms. Hum. Ecol. 2013, 41, 707–723. [Google Scholar] [CrossRef]
- Guida Johnson, B.; Zuleta, G.A. Land-Use Land-Cover Change and Ecosystem Loss in the Espinal Ecoregion, Argentina. Agric. Ecosyst. Environ. 2013, 181, 31–40. [Google Scholar] [CrossRef]
- Bufebo, B.; Elias, E. Land Use/Land Cover Change and Its Driving Forces in Shenkolla Watershed, South Central Ethiopia. Sci. World J. 2021, 2021, 1–13. [Google Scholar] [CrossRef]
- Lambin, E.F.; Turner, B.L.; Geist, H.J.; Agbola, S.B.; Angelsen, A.; Bruce, J.W.; Coomes, O.T.; Dirzo, R.; Fischer, G.; Folke, C.; et al. The Causes of Land-Use and Land-Cover Change: Moving beyond the Myths. Glob. Environ. Change 2001, 11, 261–269. [Google Scholar] [CrossRef]
- Munthali, M.G.; Davis, N.; Adeola, A.M.; Botai, J.O.; Kamwi, J.M.; Chisale, H.L.W.; Orimoogunje, O.O.I. Local Perception of Drivers of Land-Use and Land-Cover Change Dynamics across Dedza District, Central Malawi Region. Sustainability 2019, 11, 832. [Google Scholar] [CrossRef] [Green Version]
- Kamwi, J.M.; Cho, M.A.; Kaetsch, C.; Manda, S.O.; Graz, F.P.; Chirwa, P.W. Assessing the Spatial Drivers of Land Use and Land Cover Change in the Protected and Communal Areas of the Zambezi Region, Namibia. Land 2018, 7, 131. [Google Scholar] [CrossRef] [Green Version]
- Kindu, M.; Schneider, T.; Teketay, D.; Knoke, T. Changes of ecosystem service values in response to land use/land cover dynamics in Munessa–Shashemene landscape of the Ethiopian highlands. Sci. Total Environ. 2016, 547, 137–147. [Google Scholar] [CrossRef]
- Roy Chowdhury, R. Household Land Management and Biodiversity: Secondary Succession in a Forest-Agriculture Mosaic in Southern Mexico. Ecol. Soc. 2007, 12, 31. [Google Scholar] [CrossRef] [Green Version]
- Beilin, R.; Lindborg, R.; Stenseke, M.; Pereira, H.M.; Llausàs, A.; Slätmo, E.; Cerqueira, Y.; Navarro, L.; Rodrigues, P.; Reichelt, N.; et al. Analysing How Drivers of Agricultural Land Abandonment Affect Biodiversity and Cultural Landscapes Using Case Studies from Scandinavia, Iberia and Oceania. Land Use Policy 2014, 36, 60–72. [Google Scholar] [CrossRef]
- Gashaw, T.; Tulu, T.; Argaw, M. Erosion risk assessment for prioritization of conservation measures in Geleda watershed, Blue Nile basin, Ethiopia. Environ. Syst. Res. 2018, 6, 1–14. [Google Scholar] [CrossRef] [Green Version]
- Tadese, S.; Soromessa, T.; Bekele, T. Analysis of the Current and Future Prediction of Land Use/Land Cover Change Using Remote Sensing and the CA-Markov Model in Majang Forest Biosphere Reserves of Gambella, Southwestern Ethiopia. Sci. World J. 2021, 2021, 1–18. [Google Scholar] [CrossRef] [PubMed]
- Zhang, P.; He, L.; Fan, X.; Huo, P.; Liu, Y.; Zhang, T.; Pan, Y.; Yu, Z. Ecosystem Service Value Assessment and Contribution Factor Analysis of Land Use Change in Miyun County, China. Sustainability 2015, 7, 7333–7356. [Google Scholar] [CrossRef] [Green Version]
- Akinyemi, F.O. Land Change in the Central Albertine Rift: Insights from Analysis and Mapping of Land Use-Land Cover Change in North-Western Rwanda. Appl. Geogr. 2017, 87, 127–138. [Google Scholar] [CrossRef]
- Wangai, P.W.; Burkhard, B.; Müller, F.; Wangai, P.W.; Burkhard, B.; Müller, F.; Wangai, P.W.; Burkhard, B.; Müller, F.; Wangai, P.W.; et al. Quantifying and mapping land use changes and regulating ecosystem service potentials in a data-scarce peri-urban region in Kenya. Ecosyst. People 2019, 15, 11–32. [Google Scholar] [CrossRef] [Green Version]
- MEA. MEA—Millenium Ecosystem Assessment, 2005. Ecosystem and Human Well-being: Biodiversity Synthesis; World Resources Institute: Washington, DC, USA, 2005. [Google Scholar]
- Costanza, R.; de Groot, R.; Sutton, P.; van der Ploeg, S.; Anderson, S.J.; Kubiszewski, I.; Farber, S.; Turner, R.K. Changes in the global value of ecosystem services. Glob. Environ. Chang. 2014, 26, 152–158. [Google Scholar] [CrossRef]
- Kubiszewski, I.; Costanza, R.; Anderson, S.; Sutton, P. The future value of ecosystem services: Global scenarios and national implications. Ecosyst. Serv. 2017, 26, 289–301. [Google Scholar] [CrossRef]
- Mensah, S.; Veldtman, R.; Assogbadjo, A.E.; Ham, C.; Glèlè Kakaï, R.; Seifert, T. Ecosystem Service Importance and Use Vary with Socio-Environmental Factors: A Study from Household-Surveys in Local Communities of South Africa. Ecosyst. Serv. 2017, 23, 1–8. [Google Scholar] [CrossRef]
- Rodríguez, J.P.; Beard, T.D., Jr.; Bennett, E.M.; Cumming, G.S.; Cork, S.J.; Agard, J.; Dobson, A.P.; Peterson, G.D. Trade-offs across Space, Time, and Ecosystem Services. Ecol. Soc. 2006, 11, 28. [Google Scholar] [CrossRef] [Green Version]
- Peña, L.; Onaindia, M.; Fernández de Manuel, B.; Ametzaga-Arregi, I.; Casado-Arzuaga, I. Analysing the Synergies and Trade-Offs between Ecosystem Services to Reorient Land Use Planning in Metropolitan Bilbao (Northern Spain). Sustainability 2018, 10, 4376. [Google Scholar] [CrossRef]
- Sil, Â.; Rodrigues, A.P.; Carvalho-Santos, C.; Nunes, J.P.; Honrado, J.; Alonso, J.; Marta-Pedroso, C.; Azevedo, J.C. Trade-Offs and Synergies between Provisioning and Regulating Ecosystem Services in a Mountain Area in Portugal Affected by Landscape Change. Mt. Res. Dev. 2016, 36, 452–464. [Google Scholar] [CrossRef] [Green Version]
- Washbourne, C.L.; Goddard, M.A.; Le Provost, G.; Manning, D.A.C.; Manning, P. Trade-Offs and Synergies in the Ecosystem Service Demand of Urban Brownfield Stakeholders. Ecosyst. Serv. 2020, 42, 101074. [Google Scholar] [CrossRef]
- Hasan, S.; Shi, W.; Zhu, X. Impact of land use land cover changes on ecosystem service value—A case study of Guangdong, Hong Kong, and Macao in South China. PLoS ONE 2020, 15, e0231259. [Google Scholar] [CrossRef] [Green Version]
- Kandziora, M.; Burkhard, B.; Müller, F. Interactions of ecosystem properties, ecosystem integrity and ecosystem service indicators—A theoretical matrix exercise. Ecol. Indic. 2013, 28, 54–78. [Google Scholar] [CrossRef]
- Karki, S.; Thandar, A.M.; Uddin, K.; Tun, S.; Aye, W.M.; Aryal, K.; Kandel, P.; Chettri, N. Impact of land use land cover change on ecosystem services: A comparative analysis on observed data and people’s perception in Inle Lake, Myanmar. Environ. Syst. Res. 2018, 7, 25. [Google Scholar] [CrossRef] [Green Version]
- Aynekulu, E.; Wubneh, W.; Birhane, E.; Begashaw, N. Monitoring and Evaluating Land Use/Land Cover Change Using Participatory Geographic Information System (PGIS) Tools: A Case Study of Begasheka Watershed, Tigray, Ethiopia. Electron. J. Inf. Syst. Dev. Ctries. 2006, 25, 1–10. [Google Scholar] [CrossRef] [Green Version]
- Mialhe, F.; Gunnell, Y.; Ignacio, J.A.F.; Delbart, N.; Ogania, J.L.; Henry, S. Monitoring Land-Use Change by Combining Participatory Land-Use Maps with Standard Remote Sensing Techniques: Showcase from a Remote Forest Catchment on Mindanao, Philippines. Int. J. Appl. Earth Obs. Geoinf. 2015, 36, 69–82. [Google Scholar] [CrossRef]
- Hoover, J.D.; Leisz, S.J.; Laituri, M.E. Comparing and Combining Landsat Satellite Imagery and Participatory Data to Assess Land-Use and Land-Cover Changes in a Coastal Village in Papua New Guinea. Hum. Ecol. 2017, 45, 251–264. [Google Scholar] [CrossRef]
- Bunyangha, J.; Majaliwa, M.J.G.; Muthumbi, A.W.; Gichuki, N.N.; Egeru, A. Past and Future Land Use/Land Cover Changes from Multi-Temporal Landsat Imagery in Mpologoma Catchment, Eastern Uganda. Egypt. J. Remote Sens. Sp. Sci. 2021, 24, 675–685. [Google Scholar] [CrossRef]
- Mwanjalolo, M.G.J.; Bernard, B.; Paul, M.I.; Joshua, W.; Sophie, K.; Cotilda, N.; Bob, N.; John, D.; Edward, S.; Barbara, N. Assessing the Extent of Historical, Current, and Future Land Use Systems in Uganda. Land 2018, 7, 132. [Google Scholar] [CrossRef]
- Mas, J.-F.; Kolb, M.; Paegelow, M.; Olmedo, M.T.C.; Houet, T. Inductive pattern-based land use/cover change models: A comparison of four software packages. Environ. Model. Softw. 2014, 51, 94–111. [Google Scholar] [CrossRef] [Green Version]
- Munthali, M.G.; Botai, J.O.; Davis, N.; Adeola, A.M. Multi-Temporal Analysis of Land Use and Land Cover Change Detection for Dedza District of Malawi Using Geospatial Techniques. Int. J. Appl. Eng. Res. 2019, 14, 1151–1162. [Google Scholar]
- Van der Ploeg, S.; De Groot, D.; Wang, Y. The TEEB Valuation Database: Overview of Structure, Data and Results; Foundation for Sustainable Development: Wageningen, The Netherlands, 2010. [Google Scholar]
- Christie, M.; Fazey, I.; Cooper, R.; Hyde, T.; Kenter, J.O. An Evaluation of Monetary and Non-Monetary Techniques for Assessing the Importance of Biodiversity and Ecosystem Services to People in Countries with Developing Economies. Ecol. Econ. 2012, 83, 67–78. [Google Scholar] [CrossRef]
- Eigenbrod, F.; Armsworth, P.R.; Anderson, B.J.; Heinemeyer, A.; Gillings, S.; Roy, D.B.; Thomas, C.D.; Gaston, K.J. The impact of proxy-based methods on mapping the distribution of ecosystem services. J. Appl. Ecol. 2010, 47, 377–385. [Google Scholar] [CrossRef]
- Martinez-Harms, M.J.; Bryan, B.A.; Figueroa, E.; Pliscoff, P.; Runting, R.K.; Wilson, K.A. Scenarios for land use and ecosystem services under global change. Ecosyst. Serv. 2017, 25, 56–68. [Google Scholar] [CrossRef] [Green Version]
- Costanza, R. The value of ecosystem services. Ecol. Econ. 1998, 25, 1–2. [Google Scholar] [CrossRef]
- Campagne, C.S.; Roche, P.; Gosselin, F.; Tschanz, L.; Tatoni, T. Expert-based ecosystem services capacity matrices: Dealing with scoring variability. Ecol. Indic. 2017, 79, 63–72. [Google Scholar] [CrossRef] [Green Version]
- Vrebos, D.; Staes, J.; Vandenbroucke, T.; D׳haeyer, T.; Johnston, R.; Muhumuza, M.; Kasabeke, C.; Meire, P. Mapping ecosystem service flows with land cover scoring maps for data-scarce regions. Ecosyst. Serv. 2015, 13, 28–40. [Google Scholar] [CrossRef]
- Roche, P.K.; Campagne, C.S. Are expert-based ecosystem services scores related to biophysical quantitative estimates? Ecol. Indic. 2019, 106, 105421. [Google Scholar] [CrossRef]
- Haines-Young, R.; Potschin, M. Common International Classification of Ecosystem Services (CICES): Consultation on Version 4, August-December 2012; Centre for Environmental Management, School of Geography, University of Nottingham: Nottingham, UK, 2013. [Google Scholar]
- Haines-Young, R.; Potschin, M. Common International Classification of Ecosystem Services (CICES) V5. 1. Guidance on the Application of the Revised Structure; Centre for Environmental Management, School of Geography, University of Nottingham: Nottingham, UK, 2018. [Google Scholar]
- La Notte, A.; D’Amato, D.; Mäkinen, H.; Paracchini, M.L.; Liquete, C.; Egoh, B.; Geneletti, D.; Crossman, N. Ecosystem services classification: A systems ecology perspective of the cascade framework. Ecol. Indic. 2017, 74, 392–402. [Google Scholar] [CrossRef]
- Speziale, L.; Geneletti, D. Applying an Ecosystem Services Approach to Support Land-Use Planning: A Case Study in Koboko District, Uganda. Ecol. Process. 2014, 3, 1–13. [Google Scholar] [CrossRef]
- Kusiima, S.K.; Egeru, A.; Namaalwa, J.; Byakagaba, P.; Nfitumukiza, D.; Mukwaya, P. Anthropogenic Induced Land Use/Cover Change Dynamics of Budongo-Bugoma Landscape in the Albertine Region, Uganda. Egypt. J. Remote Sens. Sp. Sci. 2022, 25, 639–649. [Google Scholar] [CrossRef]
- McLennan, M.R.; Hill, C.M. Troublesome neighbours: Changing attitudes towards chimpanzees (Pan troglodytes) in a human-dominated landscape in Uganda. J. Nat. Conserv. 2012, 20, 219–227. [Google Scholar] [CrossRef] [Green Version]
- Eilu, G.; Hafashimana, D.L.N.; Kasenene, J.M. Density and species diversity of trees in four tropical forests of the Albertine rift, western Uganda. Divers. Distrib. 2004, 10, 303–312. [Google Scholar] [CrossRef]
- Plumptre, A.J.; Davenport, T.R.B.; Behangana, M.; Kityo, R.; Eilu, G.; Ssegawa, P.; Ewango, C.; Meirte, D.; Kahindo, C.; Herremans, M.; et al. The Biodiversity of the Albertine Rift. Biol. Conserv. 2007, 134, 178–194. [Google Scholar] [CrossRef]
- Uganda Bureau of Statistics (UBOS). The National Population and Housing Census 2014; Uganda Bureau of Statistics: Kampala, Uganda, 2016.
- Uganda Bureau of Statistics (UBOS). Annual Agricultural Survey 2018 Statistical Release; Uganda Bureau of Statistics: Kampala, Uganda, 2020; p. 4.
- Byakagaba, P.; Mugagga, F.; Nnakayima, D. The socio-economic and environmental implications of oil and gas exploration: Perspectives at the micro level in the Albertine region of Uganda. Extr. Ind. Soc. 2019, 6, 358–366. [Google Scholar] [CrossRef]
- Congalton, R.G. A review of assessing the accuracy of classifications of remotely sensed data. Remote Sens. Environ. 1991, 37, 35–46. [Google Scholar] [CrossRef]
- Eastman, J.R. IDRISI Selva Manual—Guide to GIS and Image Processing; Clark University: Worcester, MA, USA, 2012. [Google Scholar] [CrossRef]
- Samie, A.; Deng, X.; Jia, S.; Chen, D. Scenario-Based Simulation on Dynamics of Land-Use-Land-Cover Change in Punjab Province, Pakistan. Sustainability 2017, 9, 1285. [Google Scholar] [CrossRef] [Green Version]
- Li, X.; Wang, Y.; Li, J.; Lei, B. Physical and socioeconomic driving forces of land-use and land-cover changes: A Case Study of Wuhan City, China. Discret. Dyn. Nat. Soc. 2016, 2016, 8061069. [Google Scholar] [CrossRef] [Green Version]
- Berihun, M.L.; Tsunekawa, A.; Haregeweyn, N.; Meshesha, D.T.; Adgo, E.; Tsubo, M.; Masunaga, T.; Fenta, A.A.; Sultan, D.; Yibeltal, M. Exploring Land Use/Land Cover Changes, Drivers and Their Implications in Contrasting Agro-Ecological Environments of Ethiopia. Ecosyst. Serv. 2019, 87, 104052. [Google Scholar] [CrossRef]
- Ogunbameru, O.A. Focus Groups: Issues and Approaches. Anthropology 2003, 5, 1–8. [Google Scholar] [CrossRef]
- Chaudhary, S.; Tshering, D.; Phuntsho, T.; Uddin, K.; Shakya, B.; Chettri, N. Impact of Land Cover Change on a Mountain Ecosystem and Its Services: Case Study from the Phobjikha Valley, Bhutan. Ecosyst. Health Sustain. 2017, 3, 1–12. [Google Scholar] [CrossRef] [Green Version]
- Hattam, C.; Broszeit, S.; Langmead, O.; Praptiwi, R.A.; Lim, V.C.; Creencia, L.A.; Tran, D.H.; Maharja, C.; Mitra Setia, T.; Wulandari, P.; et al. A Matrix Approach to Tropical Marine Ecosystem Service Assessments in South East Asia. Ecosyst. Serv. 2021, 51, 101346. [Google Scholar] [CrossRef]
- Campagne, C.S.; Roche, P. May the matrix be with you! Guidelines for the application of expert-based matrix approach for ecosystem services assessment and mapping. One Ecosyst. 2018, 3, e24134. [Google Scholar] [CrossRef]
- Lesschen, J.P.; Verburg, P.H.; Staal, S.J. Statistical Methods for Analysing the Spatial Dimension of Changes in Land Use and Farming Systems; The International Livestock Research Institute: Nairobi, Kenya, 2005; Volume 7. [Google Scholar]
- Geist, H.J.; Lambin, E.F. Proximate Causes and Underlying Driving Forces of Tropical Deforestation: Tropical forests are disappearing as the result of many pressures, both local and regional, acting in various combinations in different geographical locations. Bioscience 2002, 52, 143–150. [Google Scholar] [CrossRef] [Green Version]
- Schwarz, N. Autobiographical Memory and the Validity of Retrospective Reports; Springer: New York, NY, USA, 1994. [Google Scholar] [CrossRef] [Green Version]
- Gouwakinnou, G.N.; Biaou, S.; Vodouhe, F.G.; Tovihessi, M.S.; Awessou, B.K.; Biaou, H.S.S. Local Perceptions and Factors Determining Ecosystem Services Identification around Two Forest Reserves in Northern Benin. J. Ethnobiol. Ethnomed. 2019, 15, 1–12. [Google Scholar] [CrossRef]
- Maimaiti, A.; Wang, L.M.; Yan, F.; Zhang, J.; Ma, Y.X. Quantitative Analysis of Land Use and Land Cover Changes from the Multi-Temporal Remote Sensing Data in the Bosten Lake Basin, Chinese Tian Shan. IOP Conf. Ser. Earth Environ. Sci. 2017, 74, 012011. [Google Scholar] [CrossRef]
- Du, X.; Jin, X.; Yang, X.; Yang, X.; Zhou, Y. Spatial Pattern of Land Use Change and Its Driving Force in Jiangsu Province. Int. J. Environ. Res. Public Health 2014, 11, 3215–3232. [Google Scholar] [CrossRef] [Green Version]
- Singh, S.K.; Mustak, S.; Srivastava, P.K.; Szabó, S.; Islam, T. Predicting Spatial and Decadal LULC Changes Through Cellular Automata Markov Chain Models Using Earth Observation Datasets and Geo-Information. Environ. Process. 2015, 2, 61–78. [Google Scholar] [CrossRef]
- Chaudhary, S.; Chettri, N.; Uddin, K.; Khatri, T.B.; Dhakal, M.; Bajracharya, B.; Ning, W. Implications of land cover change on ecosystems services and people’s dependency: A case study from the Koshi Tappu Wildlife Reserve, Nepal. Ecol. Complex. 2016, 28, 200–211. [Google Scholar] [CrossRef]
- Yohannes, H.; Soromessa, T.; Argaw, M.; Warkineh, B. Spatio-Temporal Changes in Ecosystem Service Bundles and Hotspots in Beressa Watershed of the Ethiopian Highlands: Implications for Landscape Management. Environ. Challenges 2021, 5, 100324. [Google Scholar] [CrossRef]
- Davey, T.M.; Selvey, L.A. Relationship between Land Use/Land-Use Change and Human Health in Australia: A Scoping Study. Int. J. Environ. Res. Public Health 2020, 17, 8992. [Google Scholar] [CrossRef] [PubMed]
- Wang, Z.; Cao, J.; Zhu, C.; Yang, H. The Impact of Land Use Change on Ecosystem Service Value in the Upstream of Xiong’an New Area. Sustainability 2020, 12, 5707. [Google Scholar] [CrossRef]
- Mwavu, E.N.; Witkowski, E.T.F. Land-Use and Cover Changes (1988-2002) around Budongo Forest Reserve, NW Uganda: Implications for Forest and Woodland Sustainability. L. Degrad. Dev. 2008, 19, 606–622. [Google Scholar] [CrossRef]
- Twongyirwe, R.; Bithell, M.; Richards, K.S.; Rees, W.G. Three Decades of Forest Cover Change in Uganda’s Northern Albertine Rift Landscape. Land use policy 2015, 49, 236–251. [Google Scholar] [CrossRef]
- Ceddia, M.G.; Sedlacek, S.; Bardsley, N.O.; Gomez-y-Paloma, S. Sustainable Agricultural Intensification or Jevons Paradox? The Role of Public Governance in Tropical South America. Glob. Environ. Chang. 2013, 23, 1052–1063. [Google Scholar] [CrossRef]
- Jevons, W.S.; Flux, A.W. The Coal Question: An Inquiry Concerning the Progress of the Nation, and the Probable Exhaustion of Our Coal Mines. J. R. Stat. Soc. 1906, 69, 770. [Google Scholar] [CrossRef]
- Luwa, J.K.; Bamutaze, Y.; Mwanjalolo, J.-G.M.; Waiswa, D.; Pilesjö, P.; Mukengere, E.B. Impacts of land use and land cover change in response to different driving forces in Uganda: Evidence from a review. Afr. Geogr. Rev. 2020, 40, 378–394. [Google Scholar] [CrossRef]
- Twongyirwe, R.; Bithell, M.; Richards, K.S. Revisiting the Drivers of Deforestation in the Tropics: Insights from Local and Key Informant Perceptions in Western Uganda. J. Rural Stud. 2018, 63, 105–119. [Google Scholar] [CrossRef]
- World Bank; FAO. Assessment of Forest Resource Degradation and Intervention Options in Refugee-Hosting Areas of Western and Southwestern Uganda; FAO: Rome, Italy, 2020. [Google Scholar]
- Martiniello, G. Bitter Sugarification: Sugar Frontier and Contract Farming in Uganda. Globalizations 2021, 18, 355–371. [Google Scholar] [CrossRef]
- White, B.; Borras, S.M.; Hall, R.; Scoones, I.; Wolford, W. The New Enclosures: Critical Perspectives on Corporate Land Deals. J. Peasant Stud. 2012, 39, 619–647. [Google Scholar] [CrossRef] [Green Version]
- Rausch, L.L.; Gibbs, H.K.; Schelly, I.; Brandão, A.; Morton, D.C.; Filho, A.C.; Strassburg, B.; Walker, N.; Noojipady, P.; Barreto, P.; et al. Soy Expansion in Brazil’s Cerrado. Conserv. Lett. 2019, 12, e12671. [Google Scholar] [CrossRef]
- Maeda, E.E.; Abera, T.A.; Siljander, M.; Aragão, L.E.O.C.; de Moura, Y.M.; Heiskanen, J. Large-Scale Commodity Agriculture Exacerbates the Climatic Impacts of Amazonian Deforestation. Proc. Natl. Acad. Sci. USA 2021, 118, e2023787118. [Google Scholar] [CrossRef] [PubMed]
- McCallister, M.; Krasovskiy, A.; Platov, A.; Pietracci, B.; Golub, A.; Lubowski, R.; Leslie, G. Forest Protection and Permanence of Reduced Emissions. Front. For. Glob. Chang. 2022, 5, 1–17. [Google Scholar] [CrossRef]
- Mccullough, E.B. Labor Productivity and Employment Gaps in Sub-Saharan Africa. Food Policy 2017, 67, 133–152. [Google Scholar] [CrossRef] [Green Version]
- Kandziora, M.; Dörnhöfer, K.; Oppelt, N.M.; Müller, F. Detecting land use and land cover changes in Northern German agricultural landscapes to assess ecosystem service dynamics. Landsc. Online 2014, 35, 1–24. [Google Scholar] [CrossRef]
- Quintas-Soriano, C.; Castro, A.J.; Castro, H.; García-Llorente, M. Impacts of land use change on ecosystem services and implications for human well-being in Spanish drylands. Land Use Policy 2016, 54, 534–548. [Google Scholar] [CrossRef]
- Gaglio, M.; Aschonitis, V.G.; Mancuso, M.M.; Puig, J.P.R.; Moscoso, F.; Castaldelli, G.; Fano, E.A. Changes in Land Use and Ecosystem Services in Tropical Forest Areas: A Case Study in Andes Mountains of Ecuador. Int. J. Biodivers. Sci. Ecosyst. Serv. Manag. 2017, 13, 264–279. [Google Scholar] [CrossRef] [Green Version]
- Rockström, J.; Steffen, W.; Noone, K.; Persson, Å.; Chapin, F.S.; Lambin, E.F.; Lenton, T.M.; Scheffer, M.; Folke, C.; Schellnhuber, H.J.; et al. A Safe Operating Space for Humanity. Nature. 2009, 461, 472–475. [Google Scholar] [CrossRef]
- Fedele, G.; Locatelli, B.; Djoudi, H.; Colloff, M.J. Reducing Risks by Transforming Landscapes: Cross-Scale Effects of Land-Use Changes on Ecosystem Services. PLoS ONE 2018, 13, 1–21. [Google Scholar] [CrossRef]
- Moutouama, F.T.; Biaou, S.S.H.; Kyereh, B.; Asante, W.A.; Natta, A.K. Factors Shaping Local People’s Perception of Ecosystem Services in the Atacora Chain of Mountains, a Biodiversity Hotspot in Northern Benin. J. Ethnobiol. Ethnomed. 2019, 15, 1–10. [Google Scholar] [CrossRef] [PubMed] [Green Version]
- Zhang, W.; Kato, E.; Bhandary, P.; Nkonya, E.M.; Ibrahim, H.I.; Agbonlahor, M.U.; Ibrahim, H.Y. Communities’ Perceptions and Knowledge of Ecosystem Services: Evidence from Rural Communities in Nigeria; IFPRI: Washington, DC, USA, 2015. [Google Scholar]
- MAAIF. The Republic of Uganda, Agriculture Sector Strategic Plan 2015/2016-2019/2020; Ministry of Agriculture, Animal Industry and Fisheries (MAAIF): Entebbe, Uganda, 2016.
- Funk, C.; Rowland, J.; Eilerts, G.; White, L. A Climate Trend Analysis of Uganda. Famine Early Warning Systems Network—Informing Climate Change Adaptation Series; USAID: Amman, Jordan, 2012; pp. 1–4.
- Karamage, F.; Zhang, C.; Liu, T.; Maganda, A.; Isabwe, A. Soil Erosion Risk Assessment in Uganda. Forests 2017, 8, 52. [Google Scholar] [CrossRef]
- Jose, S. Agroforestry for Ecosystem Services and Environmental Benefits: An Overview. Agrofor. Syst. 2009, 76, 1–10. [Google Scholar] [CrossRef]
- Sileshi, G.; Akinnifesi, F.K.; Ajayi, O.; Chakeredza, S.; Kaonga, M.; Matakala, P.W. Contributions of Agroforestry to Ecosystem Services in the Miombo Eco-Region of Eastern and Southern Africa. Afr. J. Environ. Sci. Technol. 2007, 1, 68–80. [Google Scholar]


| Proximate Drivers | ||||
|---|---|---|---|---|
| Variable | Comp1 | Comp2 | Comp3 | Unexplained |
| Infrastructure | 0.5101 | 0.5723 | ||
| Subsistence farming | 0.4938 | 0.5287 | ||
| Commercial agriculture | 0.4559 | 0.6611 | ||
| Livestock keeping | 0.4405 | 0.4889 | ||
| Soil infertility | 0.5809 | 0.372 | ||
| Drought | 0.4673 | 0.3964 | ||
| Pests and diseases | 0.4196 | 0.4844 | ||
| Tree planting | 0.781 | 0.2663 | ||
| Underlying drivers | ||||
| Variable | Comp1 | Comp2 | Unexplained | |
| Population growth | 0.5727 | |||
| Technology adoption | 0.4294 | 0.4448 | ||
| Corruption of stewards | 0.4247 | 0.4649 | ||
| Urbanizatization | 0.5043 | |||
| Cultural factors | 0.78 | 0.2251 | ||
| Policy gaps | 0.4333 | 0.3819 | ||
| Industrialization | −0.4222 | 0.5204 |
| Ecosystem Services (ES) | Use | Rank | ES Type |
|---|---|---|---|
| Food crops | Crops for food meant hh consumption | 1 | Provisioning |
| Cash crops | Crops for revenue e.g sugarcane, tea, coffee | 2 | Provisioning |
| Fire wood/charcoal | Wood and charcoal for cooking, distilling, burning bricks | 3 | Provisioning |
| Clean air regulation | Maintaining air quality | 4 | Regulating |
| Rainfall formation | Good and reliable rainfall seasons | 5 | Regulating |
| Water supply | Water for domestic use, livestock, and watering crops | 6 | Provisioning |
| Cooling temperature | Making the ambient temperature conducive for man | 7 | Regulating |
| Soil fertility maintenance | Soils supporting crops optimally | 8 | Regulating |
| Herbal medicines | Treatment of common ailments | 9 | Provisioning |
| Soil erosion control | Holding soil/no runoff/no sedimentation | 10 | Regulating |
| Water quality control | Having clean and safe drinking water | 11 | Regulating |
| Wild foods | Mushrooms, berries, wild yams, vegetables etc | 12 | Provisioning |
| Crop pollination | Plants fruiting well and better harvest | 13 | Regulating |
| Pest Disease control | Minimal crop pest and diseases, and less use of chemicals | 14 | Regulating |
| Building materials | Poles, reeds, thatching grass, strings etc | 15 | Provisioning |
| Grazing pasture | Cattle and shoats grazing extensively | 16 | Provisioning |
| Flood control | Stopping stream/river banks from bursting | 17 | Regulating |
| Hunting Bushmeat | Edible rats, wild birds, small animals for bush meat | 18 | Provisioning |
| Wild fish capture | Fish from the lake, ponds, rivers, and swamps | 19 | Provisioning |
| Recreation & tourism | Tour to parks, wildlife reserves, cultural sites, esthetic views | 20 | Cultural |
| Education sites | Students going for study tours | 21 | Cultural |
| LULC Classes | Provisioning | Regulating | Cultural | |||||||||||||||||||||
|---|---|---|---|---|---|---|---|---|---|---|---|---|---|---|---|---|---|---|---|---|---|---|---|---|
| Food Crops | Cash Crops | Fish Capture | Wildlife Population for Hunting | Open Access Grazing/Fodder | Woody Biomass for Firewood/Charcoal | Water Supply for Home & Livestock | Wild Foods | Building Materials | Herbal Medicines | Total Provisioning Ecosystem Services Potential | Clean Water (Quality) Regulation | Flood Control | Cooling Hot Temperatures | Rainfall Formation (Good Planting Seasons) | Soil Erosion Control | Soil Fertility Maintenance/Improvement | Non-Irritating Air for Breathing | Pollination of Crops | Absence of Crop Pests and Diseases | Total Regulating Ecosystem Services Potential | Recreation and Tourism | Environmental Education Sites for Students | Total Cultural Ecosystem Services Potential | |
| Tropical High Forest | 0 | 0 | 0 | 5 | 2 | 5 | 4 | 3 | 5 | 5 | 29 | 4 | 4 | 5 | 5 | 4 | 4 | 5 | 4 | 5 | 40 | 5 | 5 | 10 |
| Woodland | 0 | 0 | 0 | 3 | 2 | 5 | 2 | 3 | 4 | 3 | 22 | 4 | 3 | 4 | 4 | 4 | 4 | 4 | 4 | 3 | 34 | 2 | 2 | 4 |
| Bushland | 0 | 0 | 0 | 3 | 2 | 2 | 3 | 3 | 4 | 3 | 20 | 3 | 3 | 3 | 3 | 3 | 3 | 3 | 4 | 3 | 28 | 2 | 2 | 4 |
| Grassland | 0 | 0 | 0 | 2 | 5 | 1 | 2 | 2 | 3 | 1 | 16 | 2 | 2 | 2 | 2 | 3 | 2 | 2 | 2 | 2 | 19 | 1 | 1 | 2 |
| Wetland | 2 | 0 | 5 | 2 | 4 | 2 | 5 | 1 | 3 | 2 | 26 | 5 | 5 | 4 | 5 | 3 | 2 | 3 | 3 | 2 | 32 | 3 | 3 | 6 |
| Subsistence Farmland | 5 | 3 | 1 | 0 | 2 | 2 | 2 | 1 | 1 | 1 | 18 | 1 | 1 | 2 | 2 | 3 | 3 | 3 | 3 | 3 | 21 | 1 | 1 | 2 |
| Commercial Farm land | 3 | 5 | 0 | 0 | 1 | 0 | 0 | 0 | 0 | 0 | 9 | 0 | 0 | 1 | 1 | 0 | 0 | 1 | 1 | 1 | 5 | 0 | 1 | 1 |
| Built-up | 0 | 0 | 0 | 0 | 0 | 0 | 0 | 0 | 0 | 0 | 0 | 0 | 0 | 0 | 0 | 0 | 0 | 0 | 0 | 0 | 0 | 0 | 0 | 0 |
| Open Water | 0 | 0 | 5 | 0 | 0 | 0 | 5 | 0 | 0 | 0 | 10 | 4 | 4 | 4 | 5 | 2 | 0 | 1 | 0 | 0 | 20 | 4 | 3 | 7 |
| 10 | 8 | 11 | 15 | 18 | 17 | 23 | 13 | 20 | 15 | 150 | 23 | 22 | 25 | 27 | 22 | 18 | 22 | 21 | 19 | 199 | 18 | 18 | 36 | |
| Other Ecosystem Services | Food Crop |
|---|---|
| Cash crop | −0.1047 |
| Hunting bushmeat | −0.2066 |
| Grazing pasture | −0.2232 |
| Fire wood/charcoal | −0.3504 |
| Water supply | 0.019 |
| Water quality purification | −0.1543 |
| Flood control | 0.0406 |
| Air quality regulation | −0.0791 |
| Rainfall formation | −0.2231 |
| Soil erosion control | −0.2101 |
| Soil fertility improvement | −0.3304 |
| Cooling temperature | −0.242 |
| Crop pollination | −0.1547 |
| Pest and disease control | −0.5056 |
| Ecotourism | 0.1771 |
| Herbal medicine | −0.1772 |
| Education sites | 0.2047 |
| Wild foods | −0.2519 |
| Fish capture | −0.3548 |
| Building materials/timber | −0.3168 |
Publisher’s Note: MDPI stays neutral with regard to jurisdictional claims in published maps and institutional affiliations. |
© 2022 by the authors. Licensee MDPI, Basel, Switzerland. This article is an open access article distributed under the terms and conditions of the Creative Commons Attribution (CC BY) license (https://creativecommons.org/licenses/by/4.0/).
Share and Cite
Kusiima, S.K.; Egeru, A.; Namaalwa, J.; Byakagaba, P.; Mfitumukiza, D.; Mukwaya, P.; Mensah, S.; Asiimwe, R. Interconnectedness of Ecosystem Services Potential with Land Use/Land Cover Change Dynamics in Western Uganda. Land 2022, 11, 2056. https://doi.org/10.3390/land11112056
Kusiima SK, Egeru A, Namaalwa J, Byakagaba P, Mfitumukiza D, Mukwaya P, Mensah S, Asiimwe R. Interconnectedness of Ecosystem Services Potential with Land Use/Land Cover Change Dynamics in Western Uganda. Land. 2022; 11(11):2056. https://doi.org/10.3390/land11112056
Chicago/Turabian StyleKusiima, Samuel Kaheesi, Anthony Egeru, Justine Namaalwa, Patrick Byakagaba, David Mfitumukiza, Paul Mukwaya, Sylvanus Mensah, and Robert Asiimwe. 2022. "Interconnectedness of Ecosystem Services Potential with Land Use/Land Cover Change Dynamics in Western Uganda" Land 11, no. 11: 2056. https://doi.org/10.3390/land11112056