Article

Changes in Mangrove Cover and Exposure to Coastal Hazards in Kenya

by
Amina Juma Hamza
1,2,
Luciana S. Esteves
1 and
Marin Cvitanović
1,*
1
Department of Life and Environmental Sciences, Bournemouth University, Talbot Campus, Poole BH12 5BB, UK
2
Department of Oceanography and Hydrography, Kenya Marine and Fisheries Research Institute, Mombasa P.O. Box 81651-80100, Kenya
*
Author to whom correspondence should be addressed.
Land 2022, 11(10), 1714; https://doi.org/10.3390/land11101714
Submission received: 1 September 2022 / Revised: 28 September 2022 / Accepted: 28 September 2022 / Published: 2 October 2022
(This article belongs to the Special Issue Feature Papers for Soil-Sediment-Water Systems Section)

Abstract

:
Mangroves are effective carbon sinks, support coastal fisheries and provide wood and non-wood resources to coastal communities. They are threatened by natural and human-induced stresses including over-exploitation, conversion pressures, pollution and climate change. Understanding changes in this important ecosystem is essential to inform the sustainable management of mangroves and assess the implications related to the loss of ecosystem services. This study used global remote sensing mangrove forest data to quantify changes in mangrove cover in Kenya between 2010 and 2016 and applied the InVEST coastal vulnerability model to assess the implications concerning the provision of natural coastal protection services in Kenya. The results indicate that the annual rates of mangrove cover loss in Kenya were 0.15% between 2010 and 2016. Currently, 16% of the Kenyan coastline is at higher levels of exposure to coastal hazards but this could increase to 41% if coastal ecosystems (mangroves, corals and seagrasses) are lost. The study further identified that higher rates of mangrove loss are observed in areas at higher risk of exposure in the southern and northern counties of Kwale and Lamu, where monitoring and management efforts should be prioritized.

1. Introduction

Mangroves are trees and shrubs that grow in the intertidal area of tropical and subtropical coasts [1,2]. There are about 136,000 km2 of mangroves in 108 countries [3]. Mangrove distribution is strongly influenced by geomorphic and climatic drivers (e.g., temperature and moisture) [4,5]. Asia has the largest extent of the world’s mangroves (42%), followed by Africa (20%), North and Central America (15%), Oceania (12%) and South America (11%) [6]. The largest contiguous mangrove forests include the Sundarbans (Bangladesh), the Niger Delta (Nigeria), the coastlines of Northern Brazil and the Southern Papua, which together comprise 16.5% of the world’s mangrove forests [2].
Mangroves provide a wide range of ecosystem services important to people and nature. They regulate climate through capturing and storing large amounts of carbons above and below ground [7]. Mangroves provide nurseries for important commercial fish species generating income for people around the world [8]. They offer shoreline protection against storms surges and waves, even during major storms [9]. Mangroves are important sources of wood and non-wood resources to coastal communities around the world [10] and are at the same time threatened by both climate and human-induced stresses [6,11,12]. Human-induced factors accounted for 62% of the mangrove loss observed between 2000 to 2016 [13]. Over-exploitation of resources, conversion to agriculture or aquaculture, pollution and climate change are major drivers of mangrove loss and degradation globally [2,4,13]. Climate change impacts, such as sea-level rise, also pose a significant threat to mangroves [14].
Changes in mangroves can have a direct effect on the provision of ecosystem services [7,15,16]. Loss and degradation of mangroves affect local and national economies as indicated by shortages of firewood and building poles [17], reduction in fisheries [9,18], increased shoreline erosion [16,19] and enhanced greenhouse emissions [7]. Mapping mangrove cover over time gives us valuable information on the extent and the rate of mangrove cover change and the location of change [20]. As mangroves provide a range of ecosystem services [21,22], mapping changes in mangrove cover can also help us understand the likely effect of these changes on the provision of ecosystem services [7,10] and plan for sustainable management [23].
Remote sensing (RS) has been instrumental in monitoring states and changes in different ecosystems of spatial and temporal scales across the planet [24,25,26]. Due to the increased availability of global, freely available remotely sensed images, there has been a rapid development of global datasets of mangrove extent and analysis of change since 1996 [27]. The Continuous Global Mangrove Forest Cover for the 21st Century (CGMFC-21) by Hamilton and Casey [28] was the first consistent RS dataset on mangrove cover globally. Hamilton and Casey [28] synthesized three global databases: the Global Forest Cover [29], Terrestrial Ecosystems of the World [30], and Mangrove Forest of the World [6] to quantify changes in mangrove forest cover globally between 2000 and 2012. Their results showed an average global loss of 137 km2 of mangrove forest per year (or 0.16% per year) between 2000 and 2012, with Southeast Asia having the highest deforestation rate of 8.08% per year. More recently, Bunting et al. [31] produced the Global Mangrove Watch (GMW) by compiling datasets of small-scale studies conducted at regional and local scales. The GMW assessed mangrove cover changes between 1996 and 2016 and provided a baseline of the global extent of mangroves for 2010 of 137,600 km2. Bunting et al. [31] have also identified an overall loss in mangrove cover, estimated at 6057 km2 (0.3%) between 1996 and 2016.
The East Africa coast is characterized by a variety of ecosystem including terrestrial coastal forests, mangroves, seagrass beds, and coral reefs. These ecosystems are critical for biodiversity conservation and support the wellbeing of the people [32]. The importance of coastal habitats in protecting the coast and, in particular, the potential of mangroves to provide effective coastal defense is well established [16,33]. Ballesteros and Esteves [34], focusing on coastal vulnerability in Eastern Africa, found that Kenya benefits the most from its coastal ecosystems and is likely to experience the greatest impacts if mangroves and coral reefs are lost. Other research has also identified coastal protection as one of the key ecosystem services of mangroves in Kenya [35,36].
However, mangrove loss varies in magnitude both globally [13] and locally. Areas closer to human settlement have been identified as hotspots of mangrove cover change in Kenya [37,38,39], with, e.g., urban areas recording higher loss in mangroves than rural areas [38]. This means that loss of mangroves can affect areas differently and can have a varying effect on the provision of ecosystem services [7,15,16]. Accordingly, it is important to understand how and where the changes in mangrove forest cover can expose coastal communities to erosion and flooding. Therefore, the main aim of this paper is to assesses changes in mangrove cover in Kenya between 2010 and 2016 and its implications to the provision of natural coastal protection. The assessment quantifies the proportion of the shoreline ranked as having higher exposure to coastal hazards at country and county levels and identifies the areas benefiting the most from the natural coastal protection offered by mangroves.

2. Materials and Methods
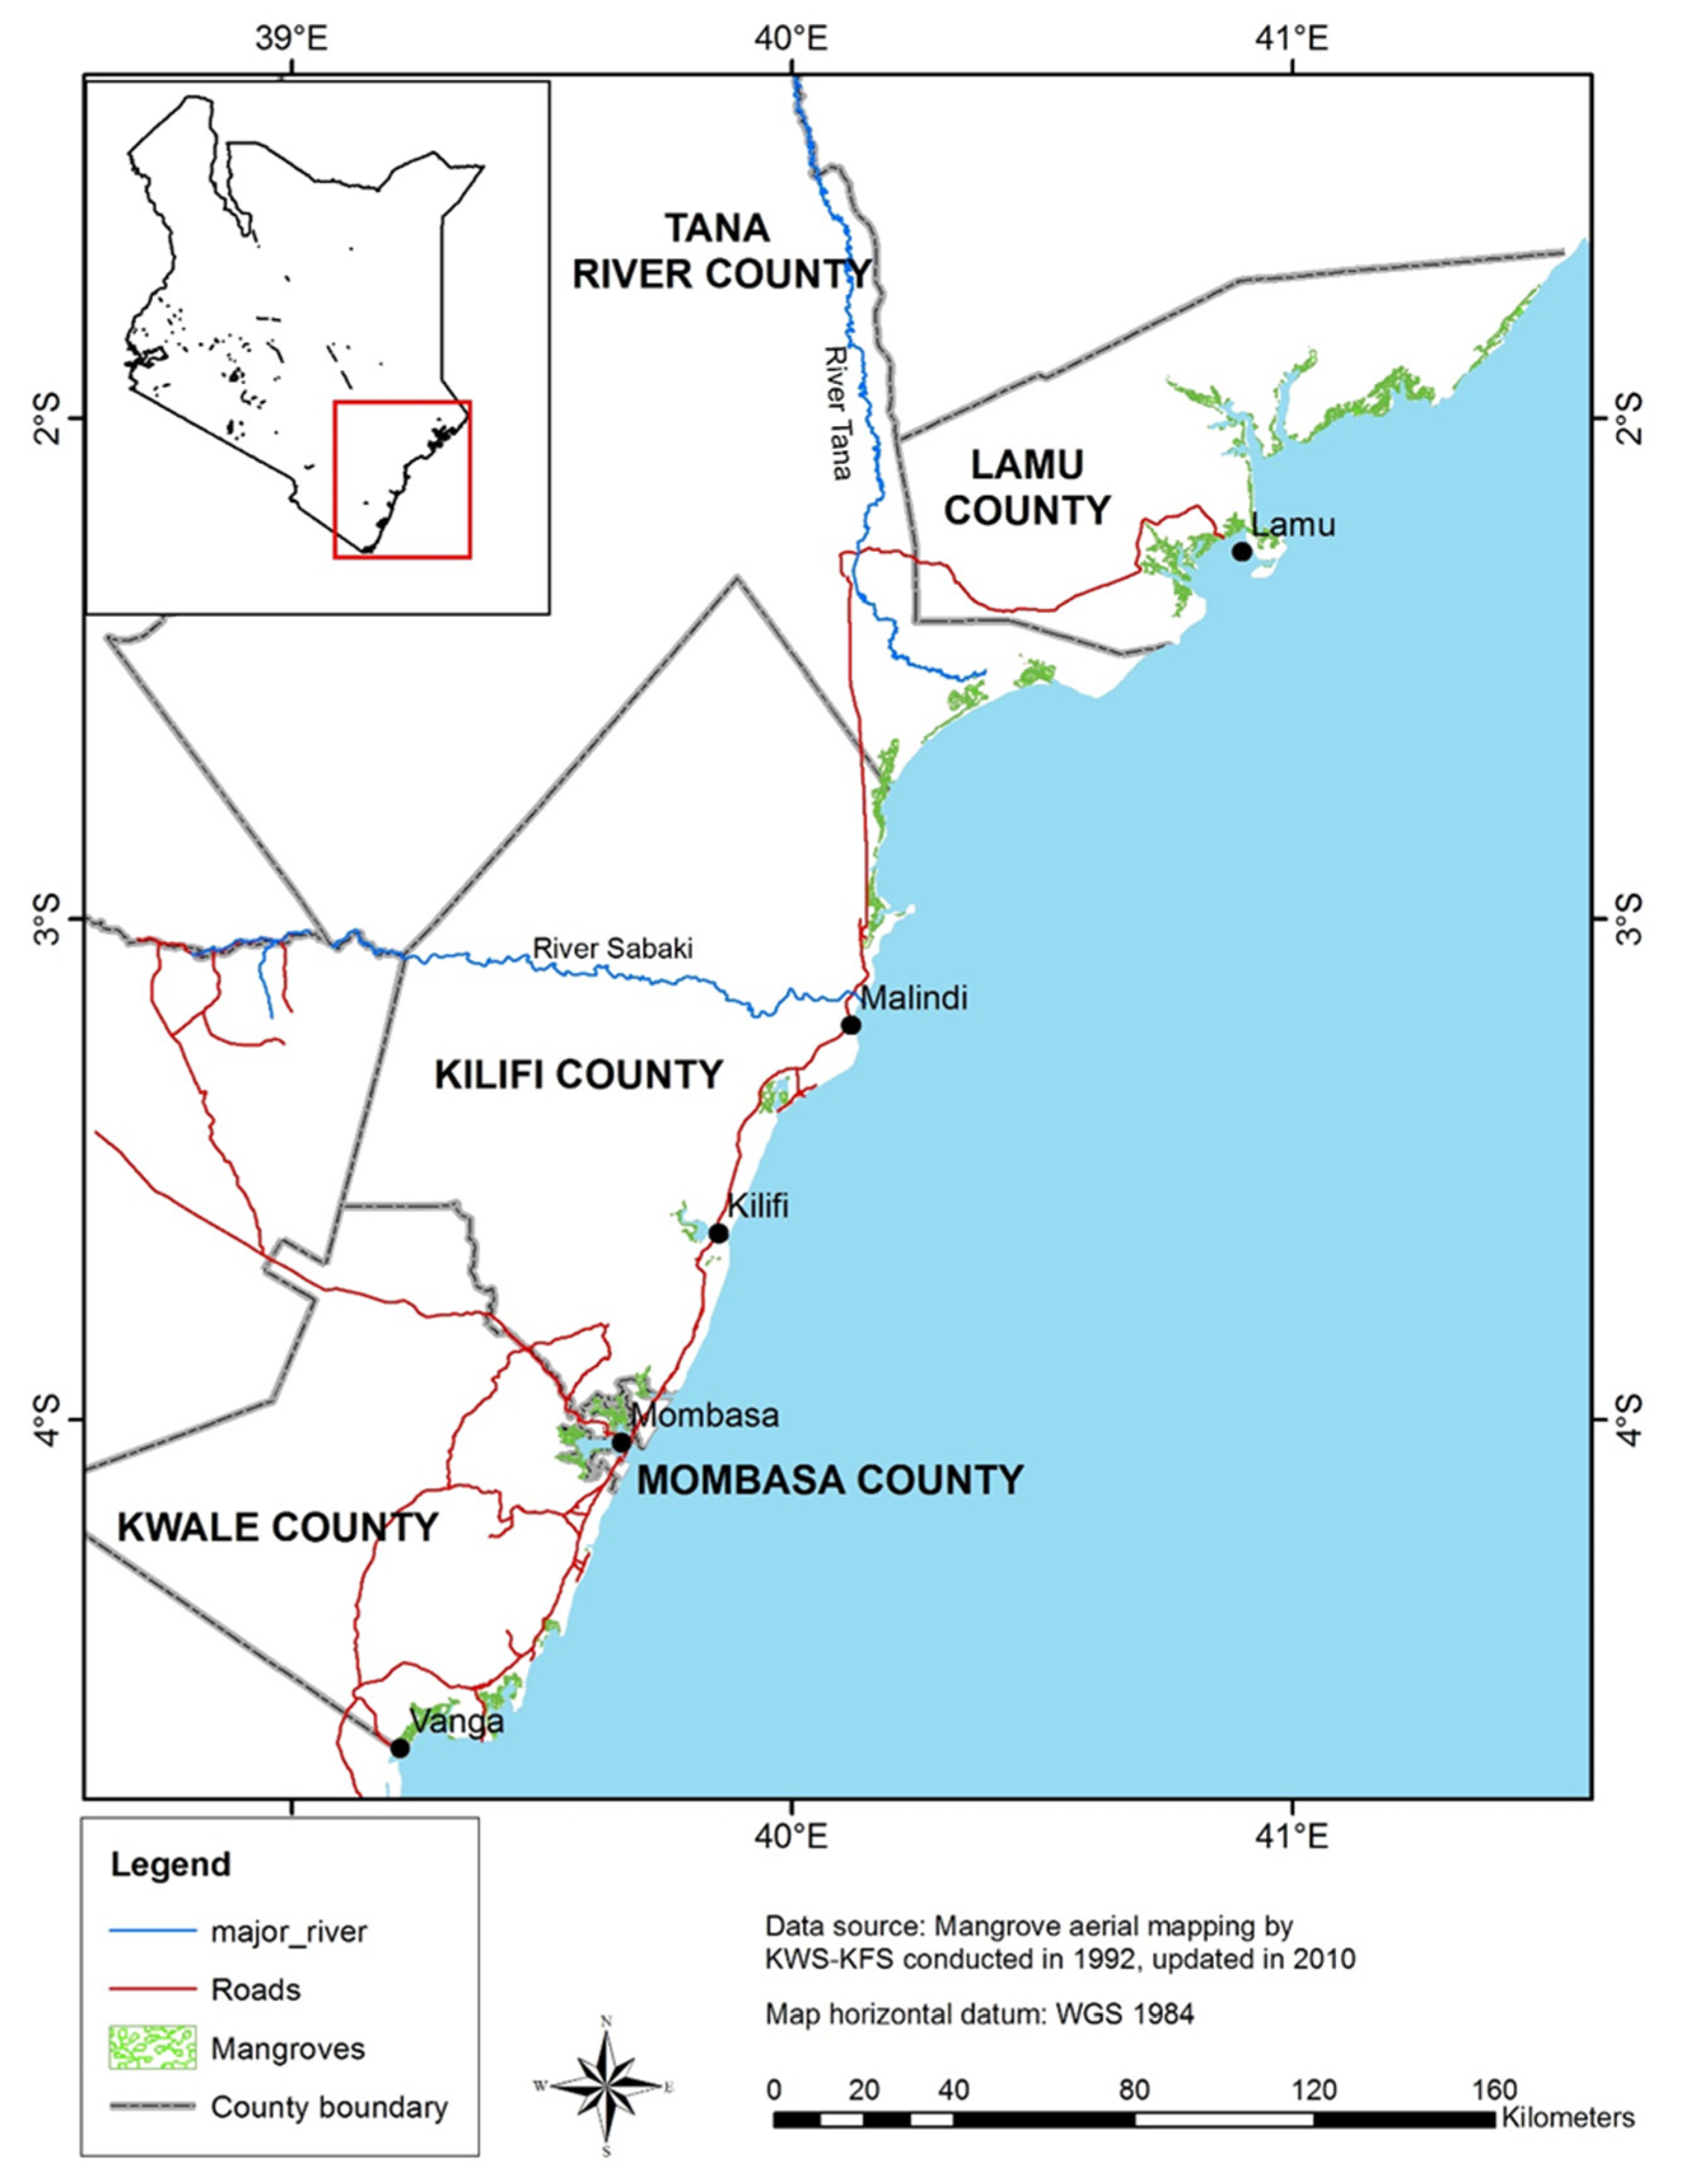
2.1. Study Site

The Kenyan coastline is about 600 km long, extending from Somalia’s border in the north to Tanzania’s border in the South [40]. Coastal Kenya is generally a dry area with an average temperature between 24 °C to 30 °C. North Kenya has lower annual average rainfall (500–900 mm) and higher annual average evaporation (1650–2300 mm) than the South (1000–1600 mm of rainfall and 1300–2200 of evaporation). The rainfall seasons are strongly influenced by Monsoon winds. The long rain season (March to May) occurs during the southeast monsoon while the short rains occur during the northeast monsoon (October to December) [41]. Two longest rivers in Kenya (Tana and Sabaki) originate from the highlands and drain into the Indian Ocean [40]. The presence of creeks, deltas, sheltered bays and lagoons favor the development of mangroves. Mangroves are found in five coastal counties in Kenya (Figure 1) covering an area of 61,000 ha representing 3% of gazetted forest and 1% of state land [42]. Nine mangrove species are found in Kenya, Rhizophora mucronata, Ceriops tagal and Avicennia marina are dominant, while Bruguera gymnorrhiza, Heritiera littoralis, Lumnitzera racemose, Sonneratia alba, Xylorcarpus granatum and Xylocarpus mollucensis are also present.

2.2. Mangrove Land Cover Change Analysis and InVEST Model Run

Mangrove cover data from Global Mangrove Watch (GMW) was used to calculate changes in mangroves in the study site. The GMW data was developed using globally consistent and automated methods for mapping mangroves. Its spatial resolution is 30 m, with an accuracy of 94%, using 53,878 accuracy points across 20 sites distributed globally [31]. To extract mangrove land cover changes for Kenya from the global data source, a shapefile from the United Nations Office for the Coordination of Humanitarian Affairs (OCHA, 2022) (https://data.humdata.org/dataset/cod-ab-ken, accessed on 12 October 2021), containing the political borders of Kenya was used. Changes through time were quantified using the post-classification overlay detection method, which involved overlaying maps from two different years (2010 and 2016) and identifying areas of gain, loss, and no change. The changes in mangrove cover were then aggregated to a county level.
Subsequently, to quantify the impact on the coastal protection service of the potential loss of mangroves, the Integrated Valuation for Ecosystem Services and Tradeoffs (InVEST) version 3.9.2 coastal vulnerability model, Natural Capital Project of Stanford University, Stanford, CA, USA [43] was used. This model has been used to assess levels of exposure to coastal hazards at different spatial scales around the world [33,34,44,45,46,47]. Exposure here refers to the susceptibility of an area to be affected by coastal hazards, more specifically erosion and flooding.
InVEST was run using scenarios to assess the contribution of coastal habitats in reducing coastal exposure [33,34,48]. Besides mangroves, coral reefs and seagrasses were also included in the assessment to provide a more comprehensive estimate of natural coastal protection and the relative importance of mangroves. First, to assess the current level of exposure, all habitats (mangroves, corals, and seagrasses) were incorporated into the model run (with habitats scenario). Then, the model was run excluding one of the habitats to assess the contribution of that particular habitat to coastal protection (no mangroves, no corals and no seagrasses scenarios). The model was run a fifth time excluding all habitats (without habitats scenario) to determine where and how habitats are contributing the most to reduce exposure to coastal hazards. Therefore, the provision of natural coastal protection is assessed based on the differences in the relative level of exposure calculated by the model when it is run with and without the presence of coastal habitats. The scenarios should not be interpreted as projections of future conditions. It is not implied here that all habitats or specific habitats will be completely lost. The exclusion of habitats is a way of assessing the overall and individual contribution of habitats to coastal protection by assessing how exposure would increase if they were lost.
InVEST calculates a relative ranking of coastal exposure to erosion and flooding from six bio-geophysical variables (Table 1) in the form of an exposure index. The model ranks the value of each indicator into 5 classes—from 1 (very low exposure) to 5 (very high exposure)—to determine the level of exposure of a point along the coast in relation to other points in the study area. Following the approach used by Ballesteros and Esteves [34], the model default was used to rank wind and surge exposure values and the natural protection offered by natural habitats, while the other variables were classified based on absolute values to provide a more realistic reflection of differences between levels of exposure (Table 1). For example, as low-lying areas are more prone to flooding, relief classes were based on the mean land elevation within the model grid, rather than quartiles to ensure that the categories are meaningful independently on the range of land elevation within the study area. The exposure index was then calculated as the geometric mean of the ranks of each indicator (Ri). The resulting value was rounded to the nearest integer and assigned to the respective class (1—very low exposure, to 5—very high exposure).
Coastal Exposure Index (IE) = (RRelief × Rwaves × Rwind × Rsurge × Rhabitats × Rerosion)1/6
Furthermore, the shoreline points ranked 4 and 5 (high and very high exposure levels) by the InVEST were extracted and 1 km and 2 km buffer zones were created around them. This was done to assess the magnitude of mangrove change in these high-exposure areas and to compare them with average rates of mangrove change in all Kenyan coastal counties. Changes in mangroves through time in these buffer areas were quantified using ArcGIS 10.6, Environment System Research Institute (ESRI), Redlands, CA, USA.

3. Results

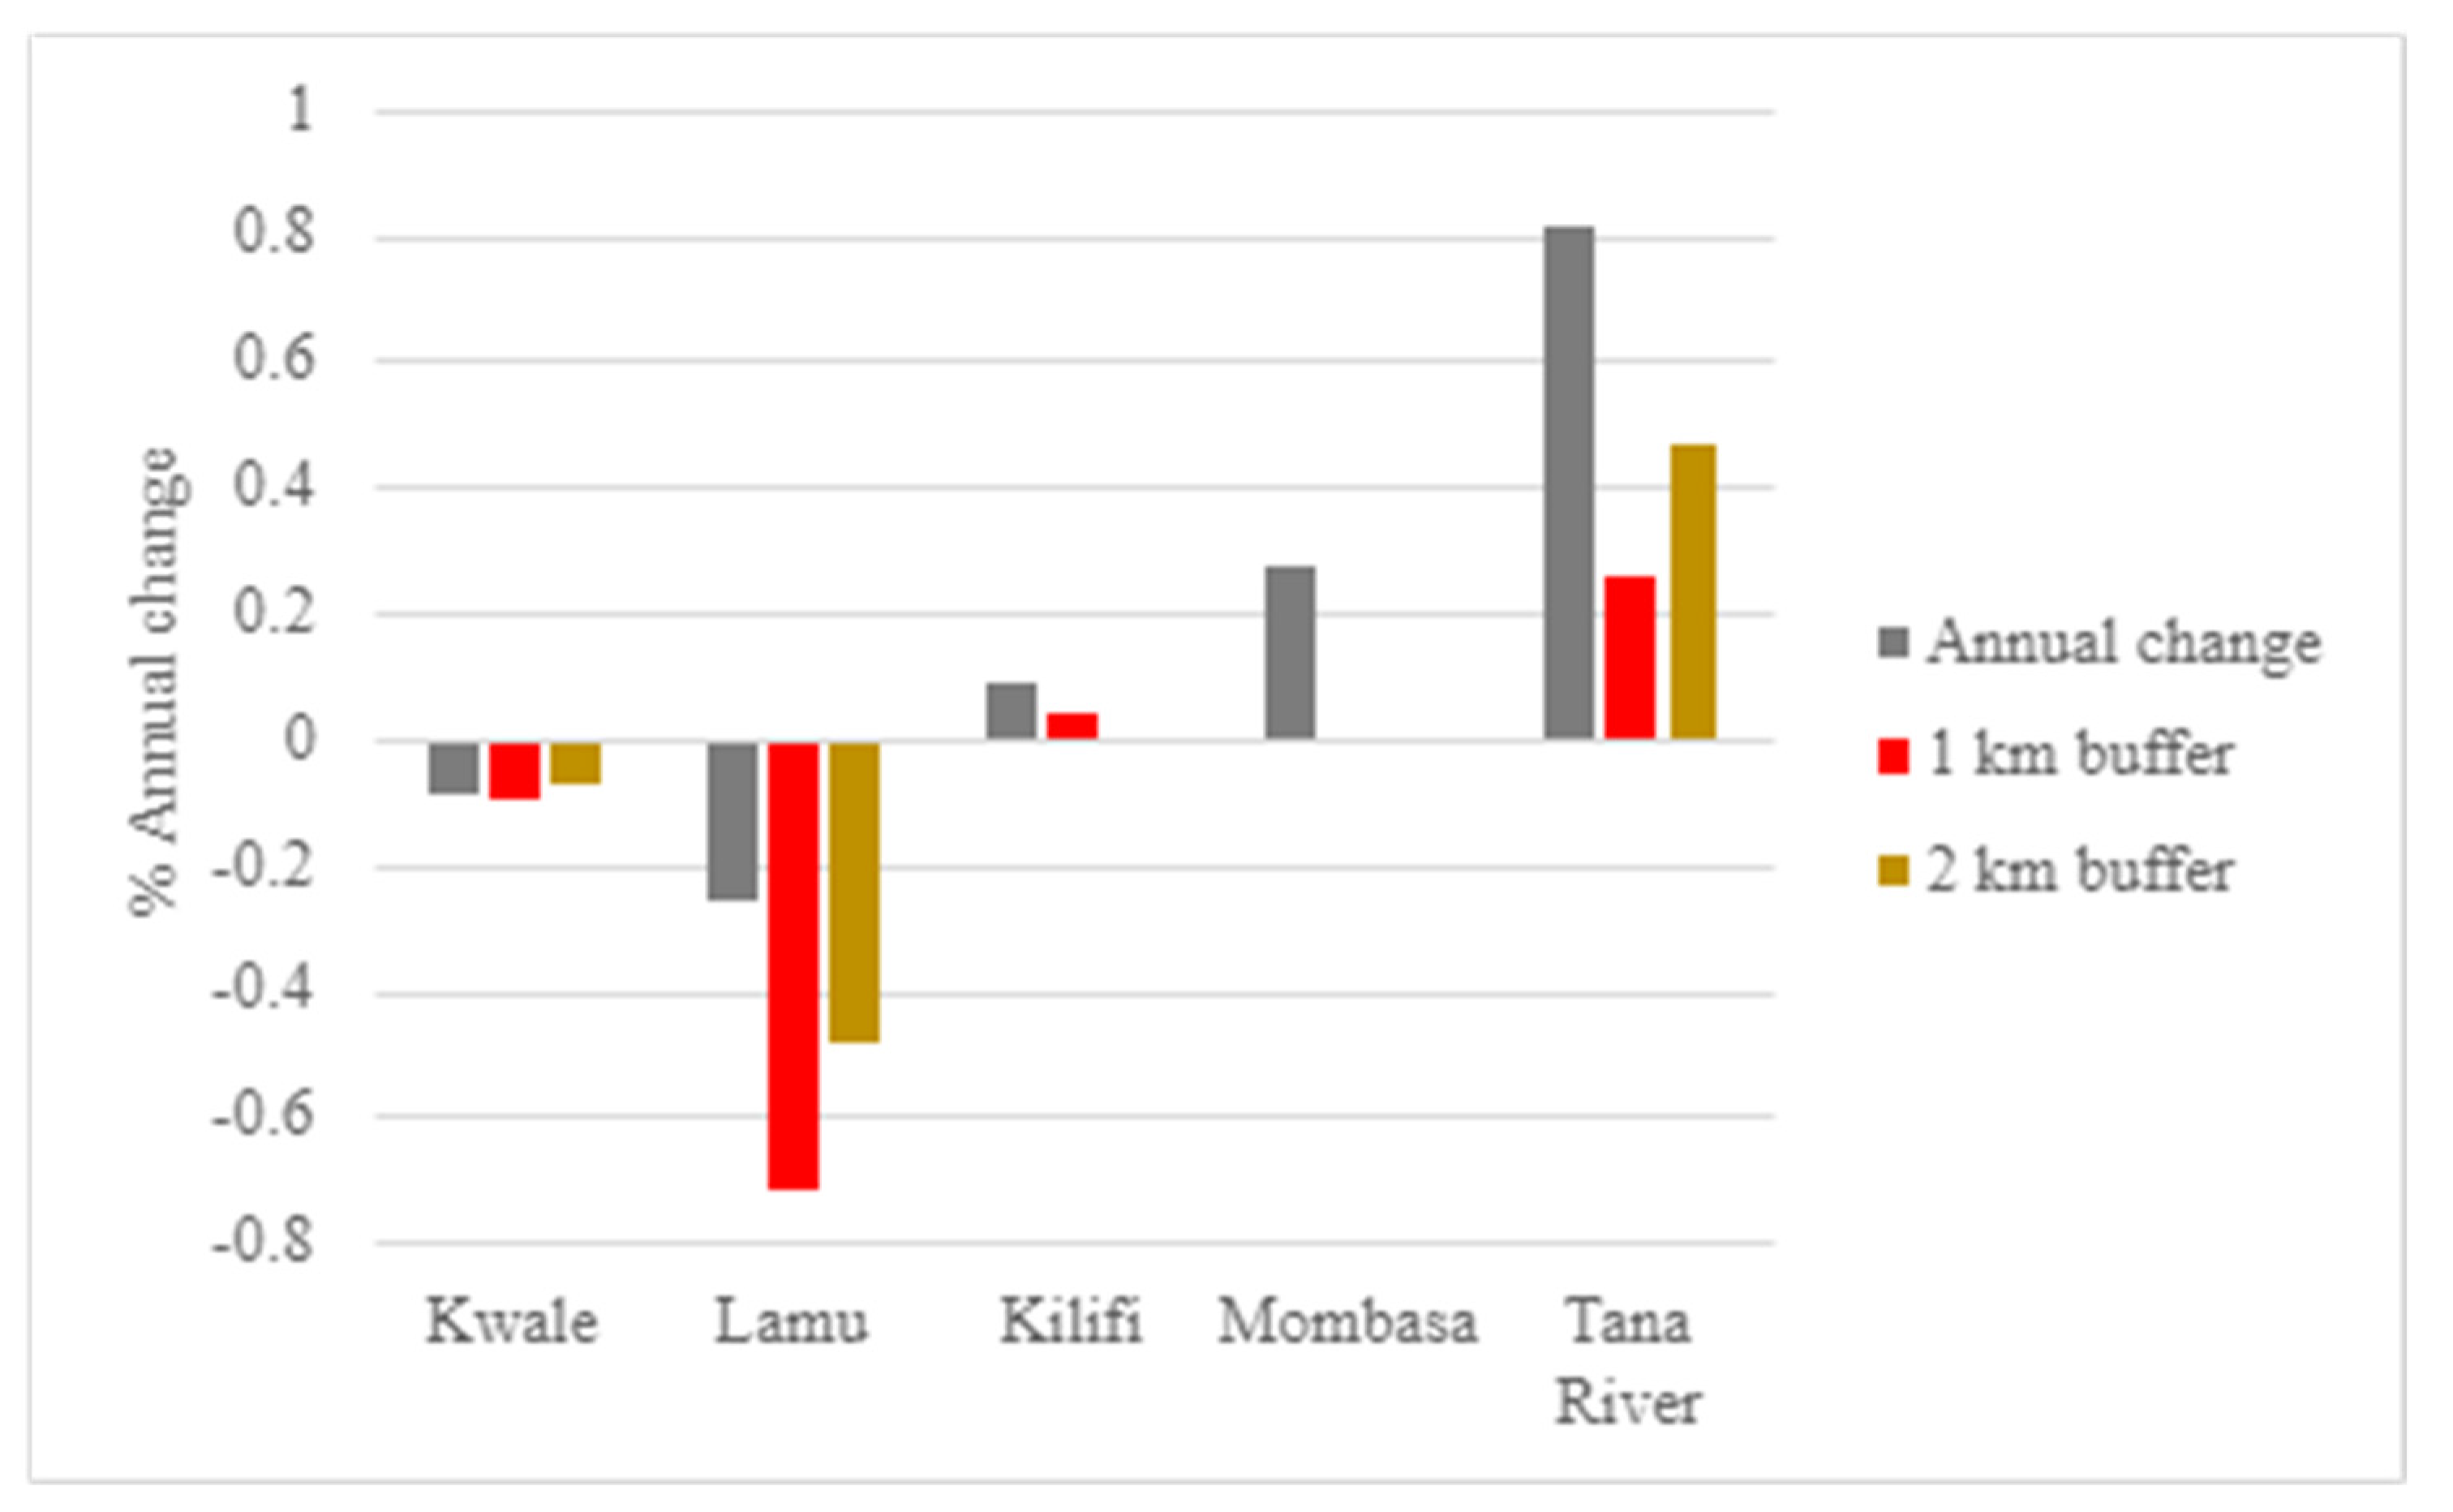
3.1. Changes in Mangrove Cover

According to the analysis of GMW data, rates and directions of changes in mangrove cover vary across coastal counties in Kenya. Kwale and Lamu counties are experiencing net loss of mangrove areas, while mangrove cover has increased in Kilifi, Mombasa and Tana River between 2010 and 2016 (Table 2). The relative gain in mangrove cover was largest in Tana River (0.81% per year) and the relative loss in mangrove cover was largest in Lamu (−0.26% per year).

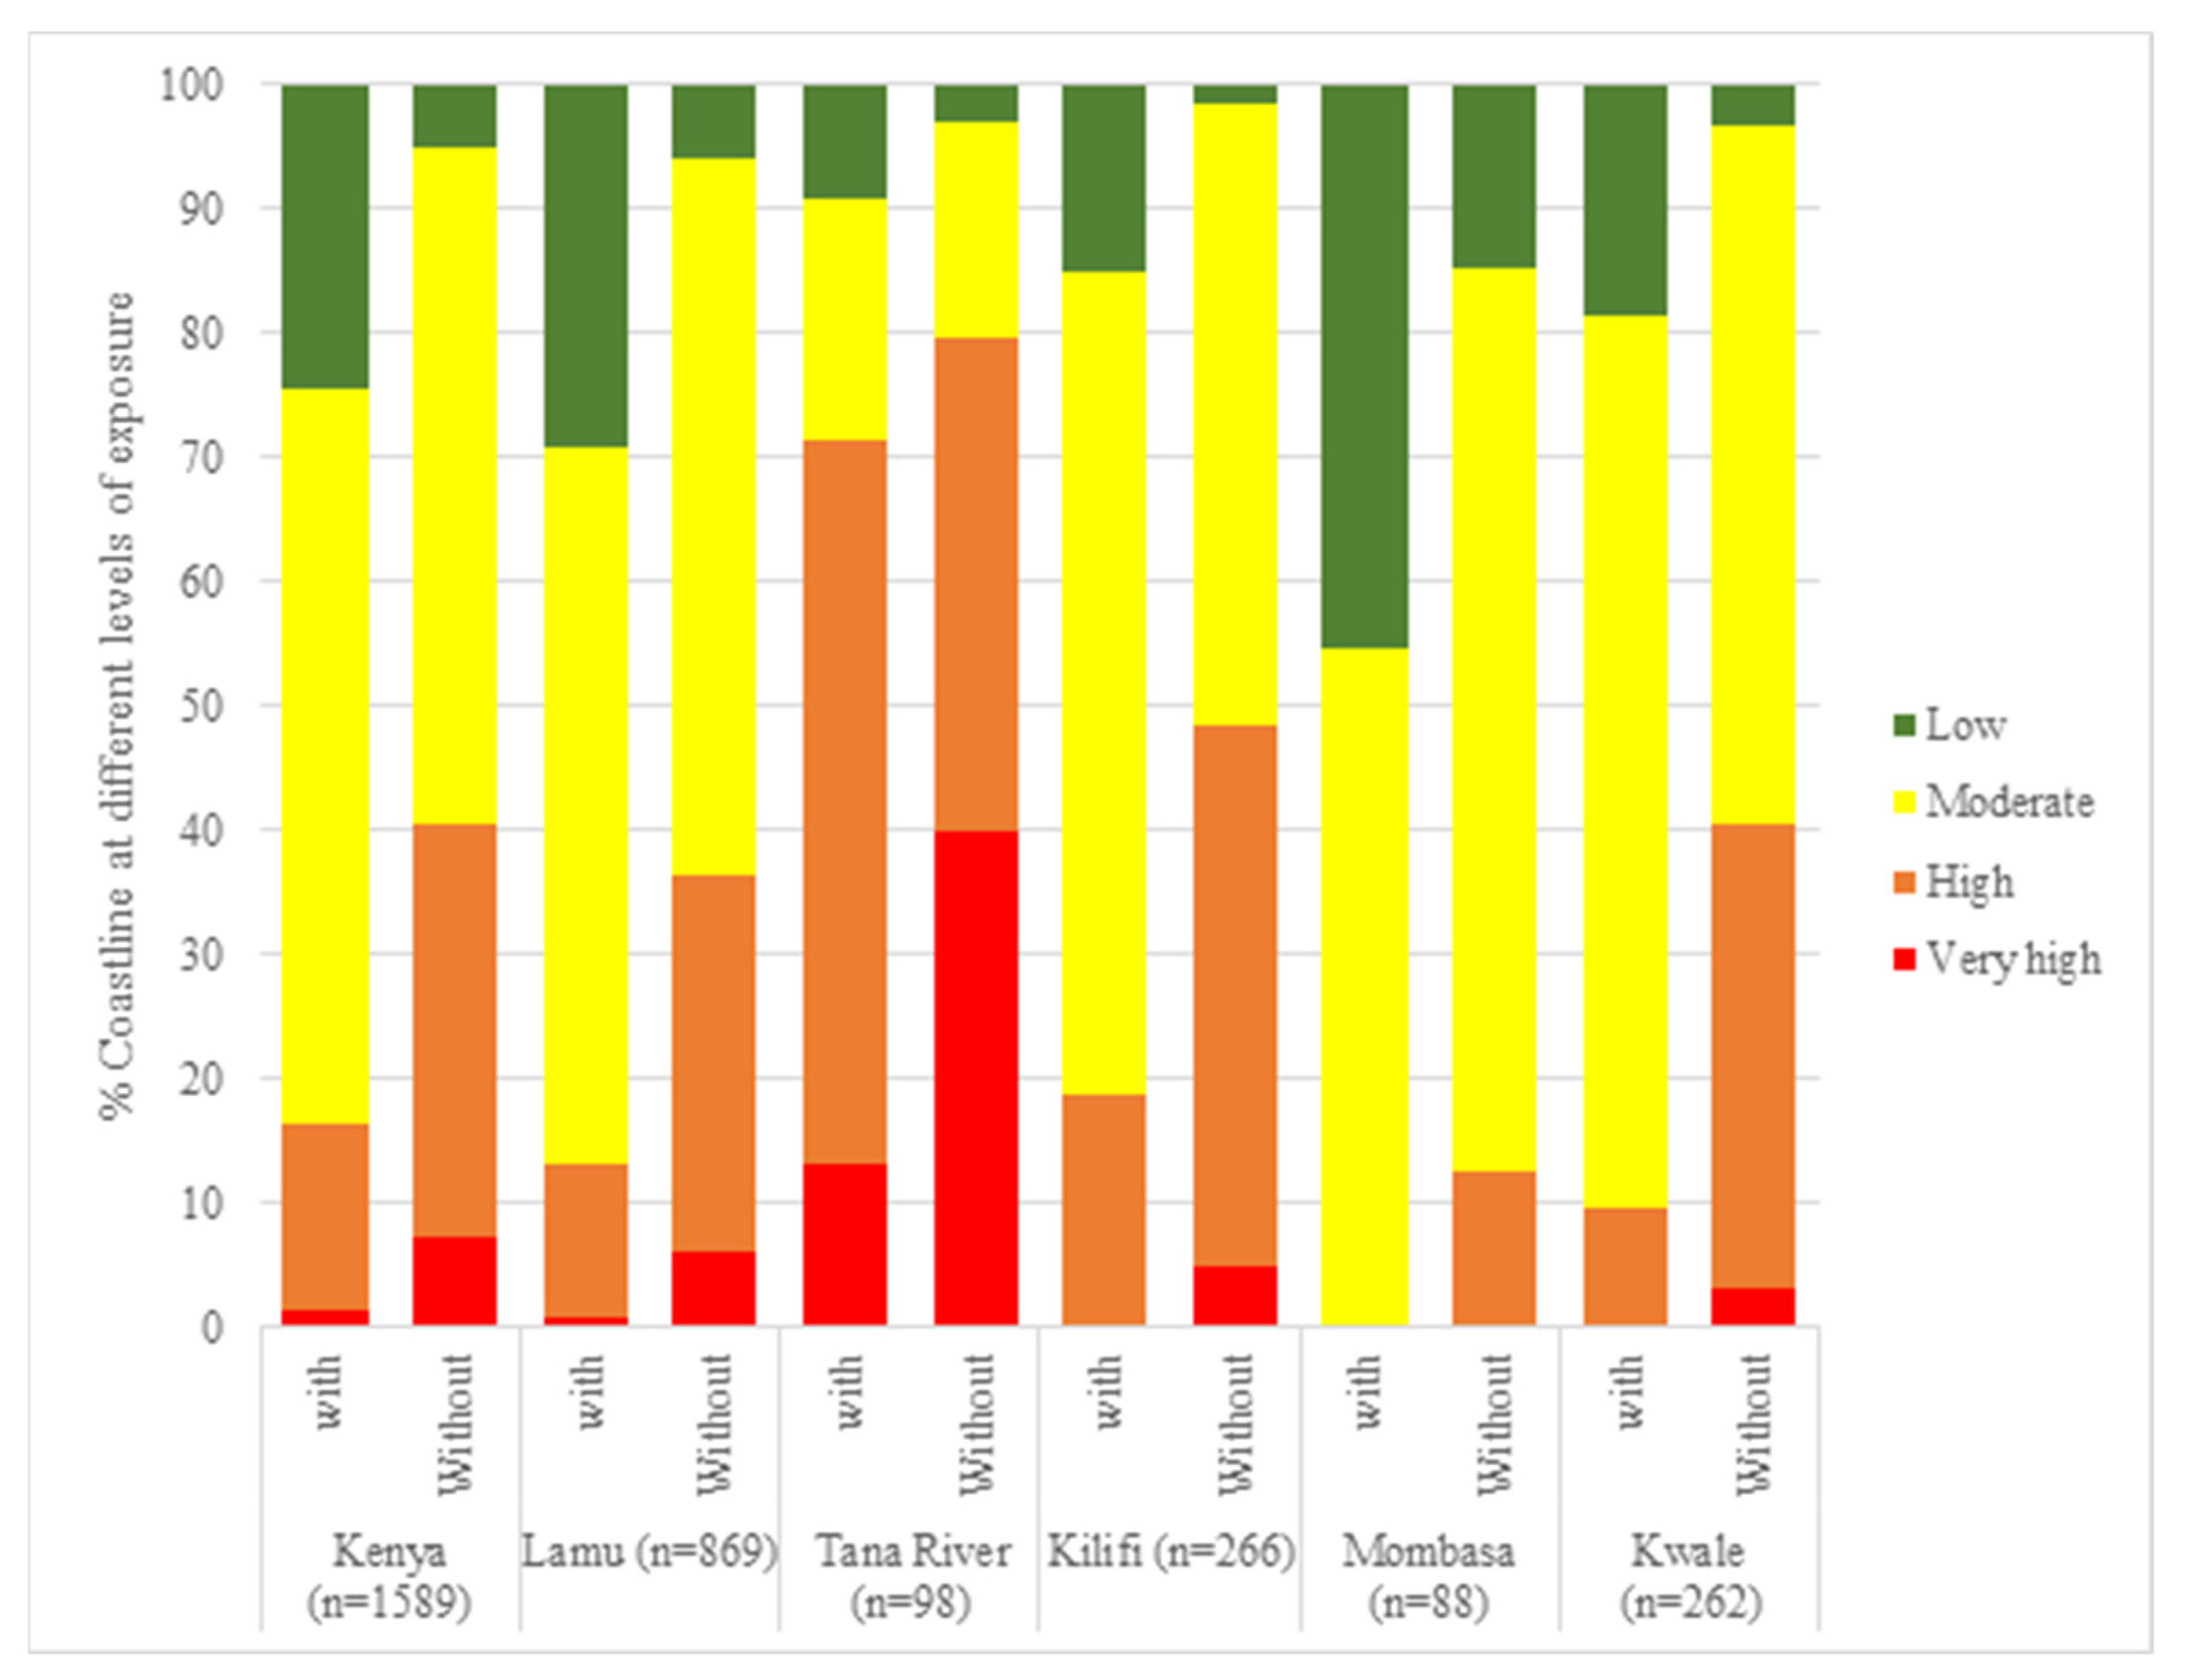
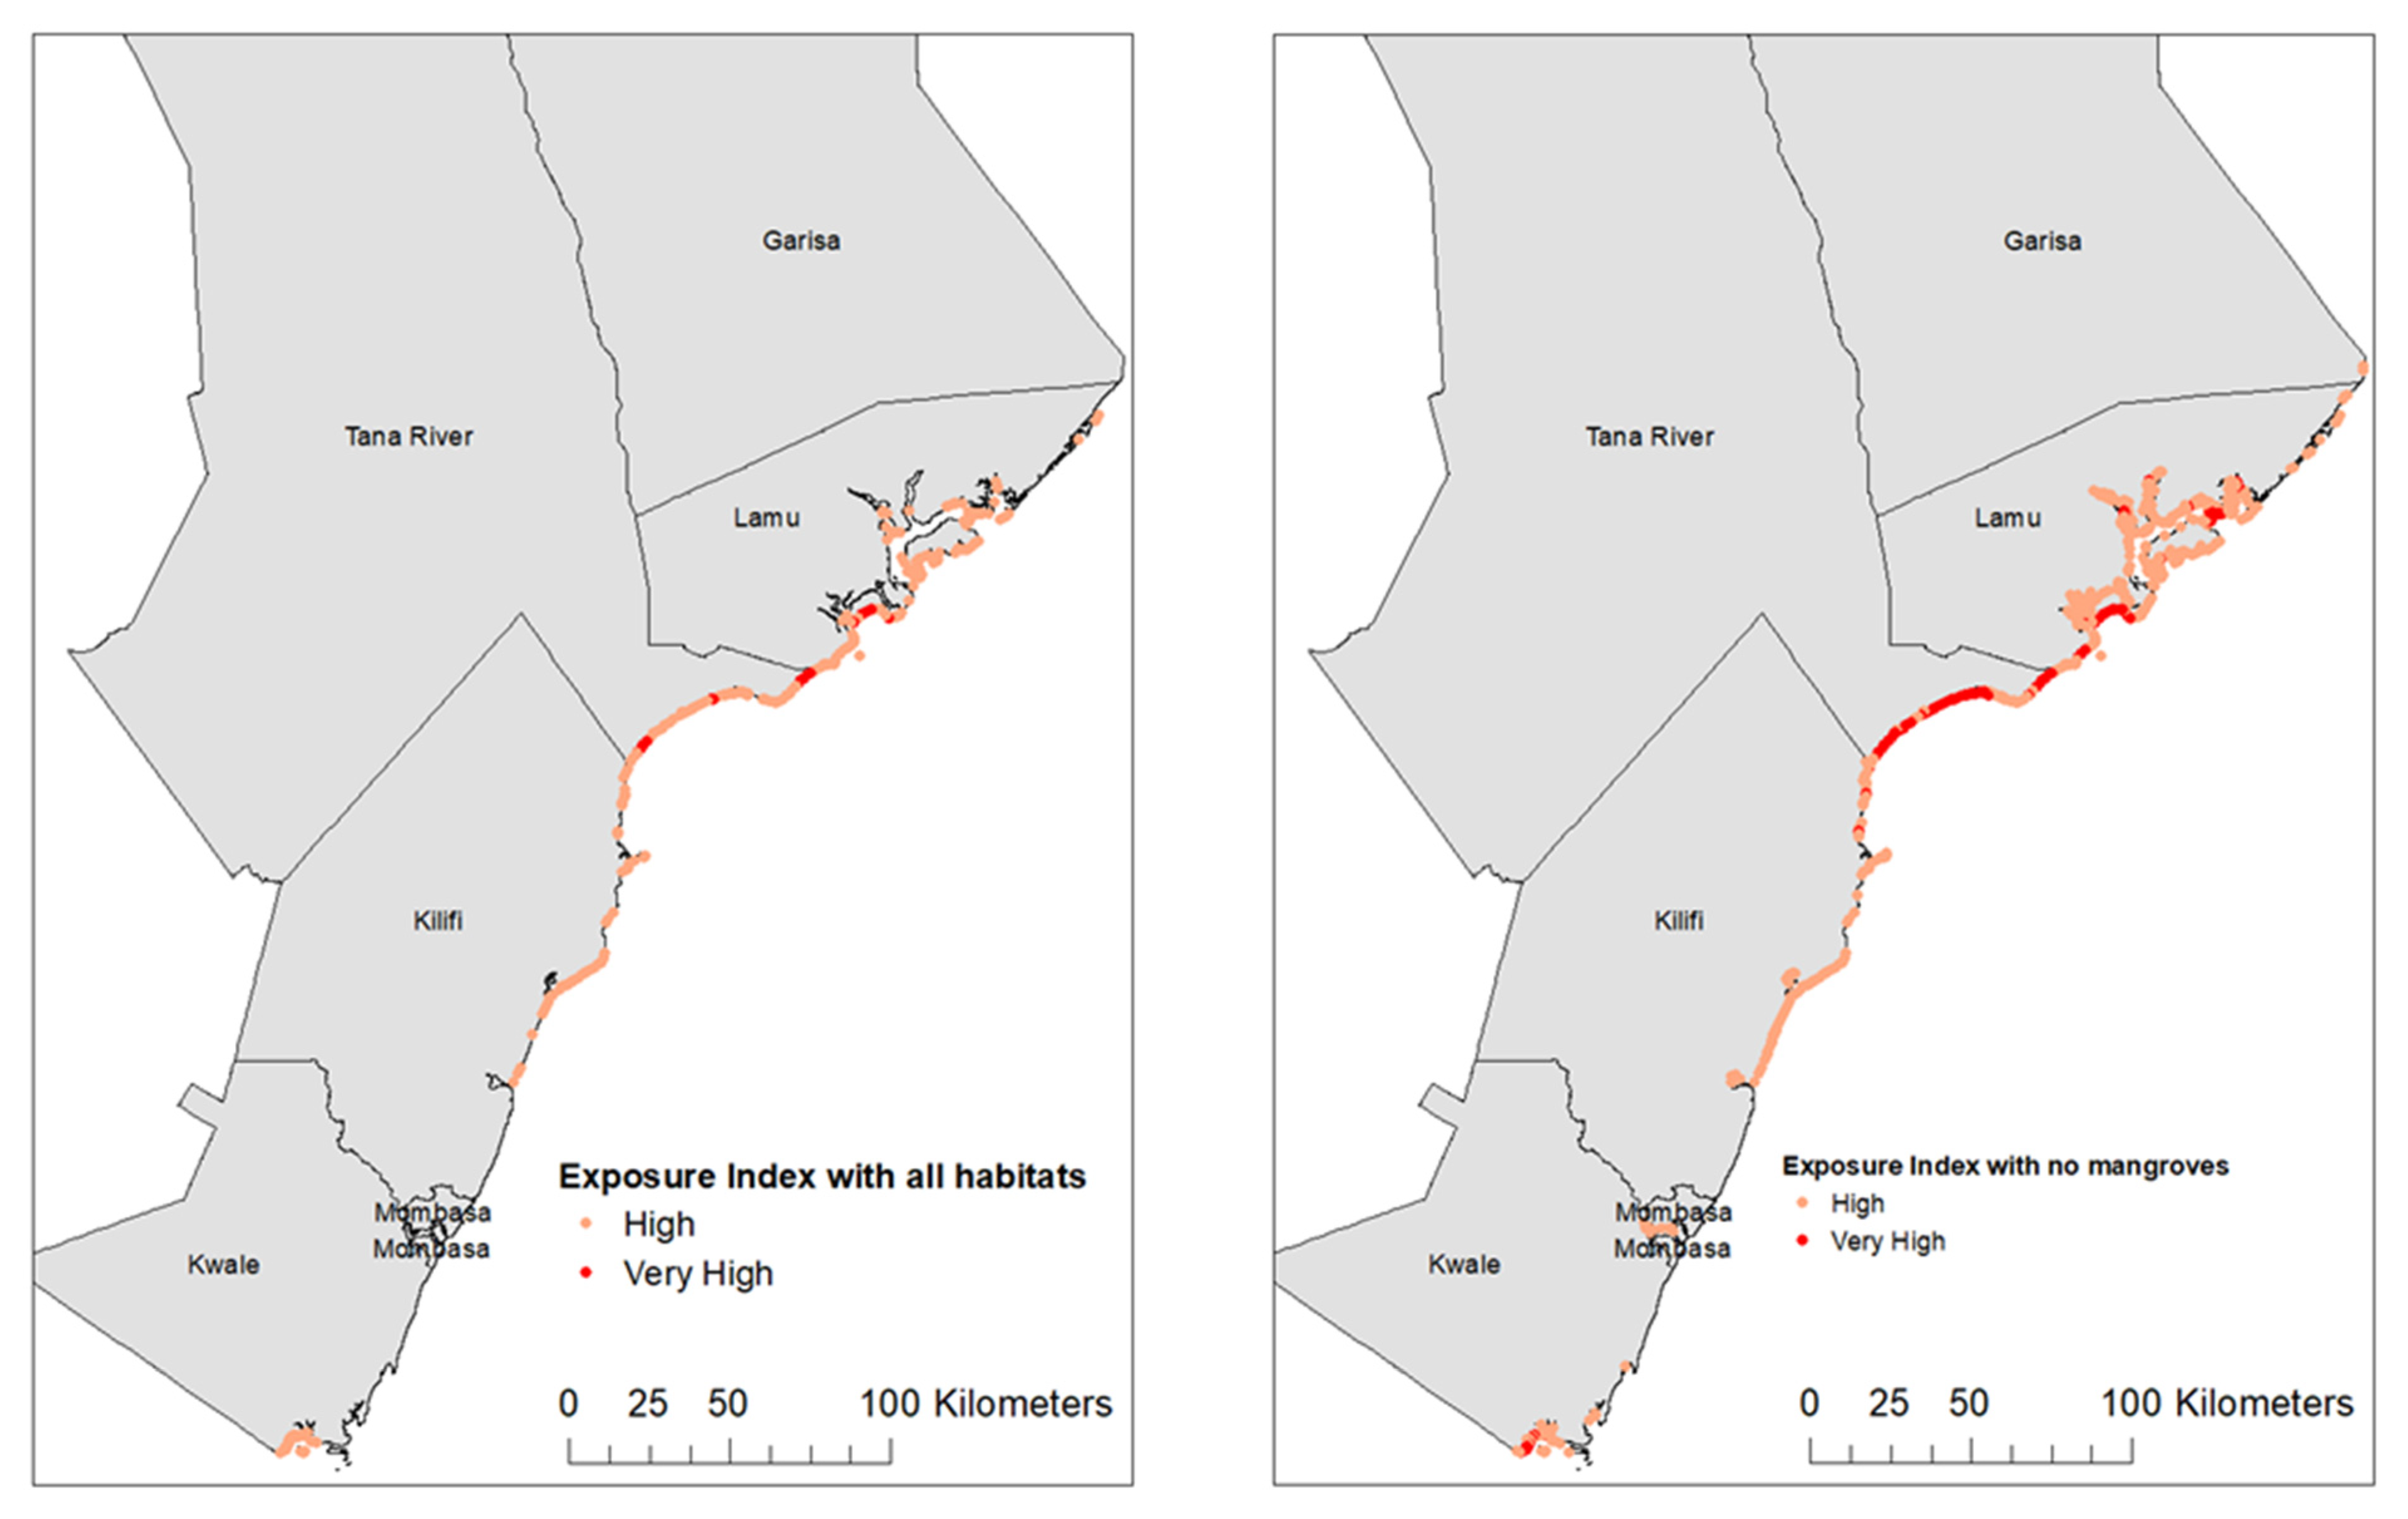
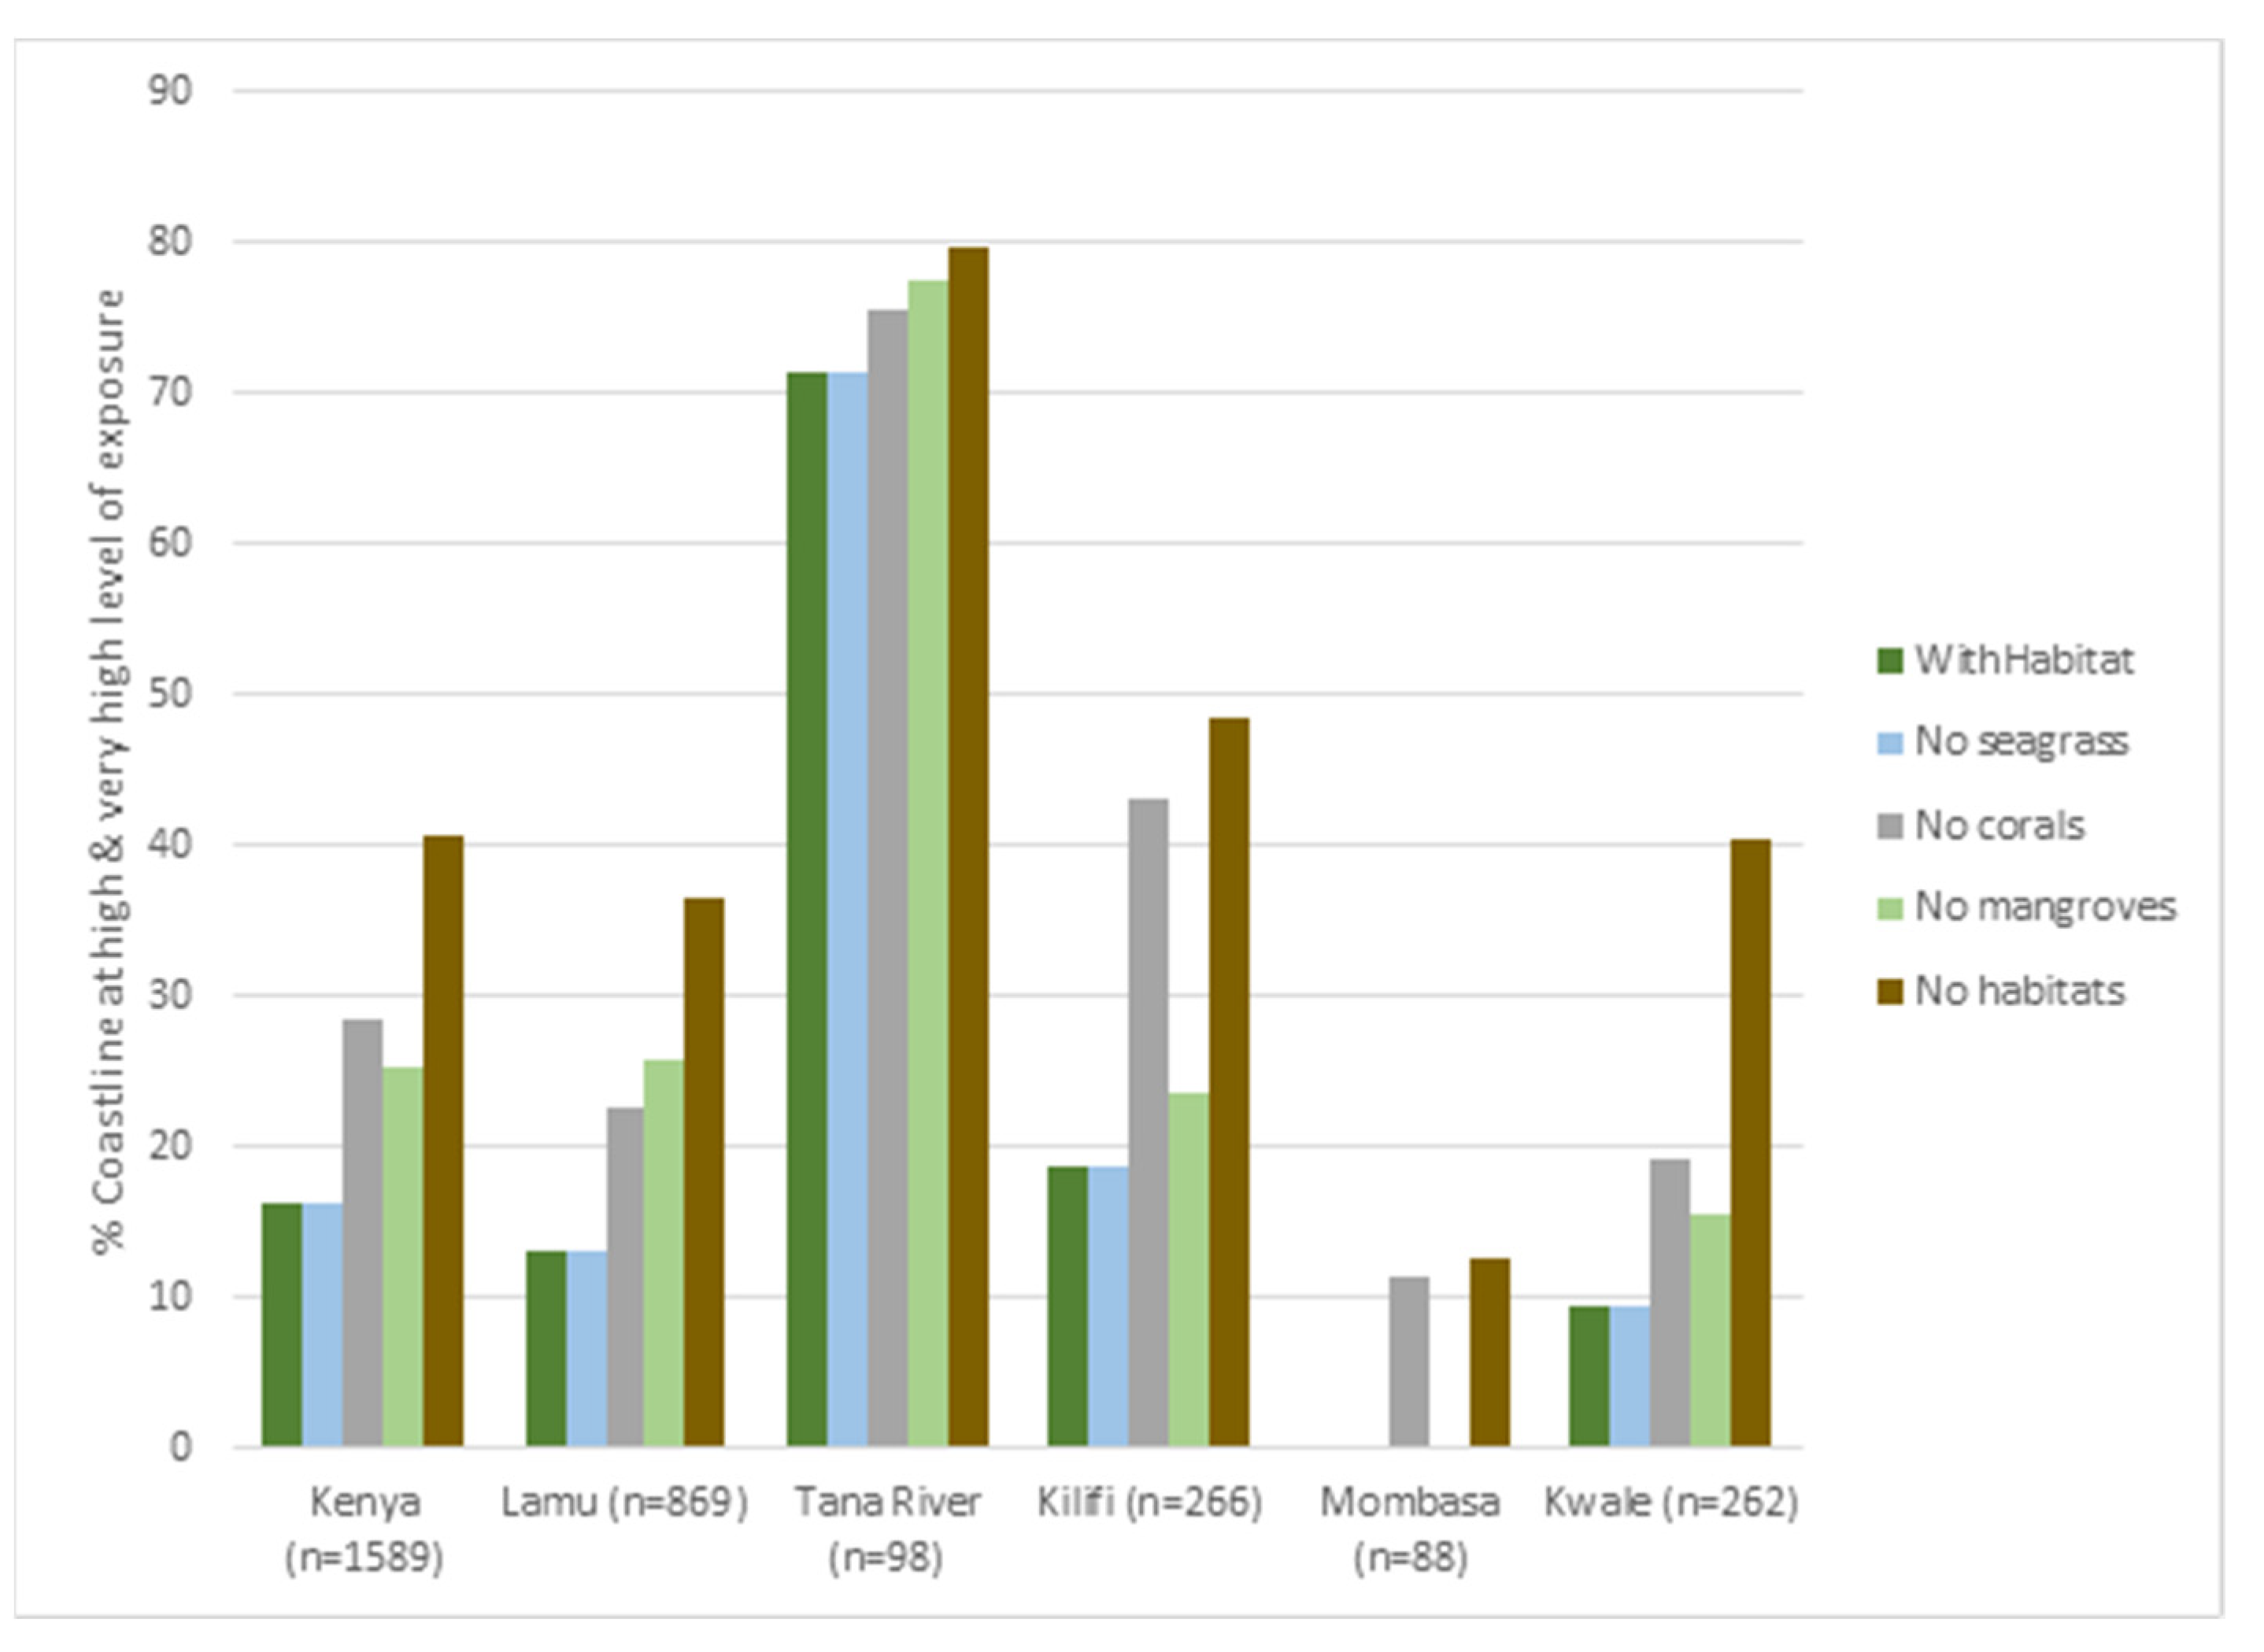
3.2. Exposure to Coastal Hazards

Currently, 16% of the country’s shoreline is at a higher (high and very high) level of exposure with the presence of all habitats. Tana River is the most exposed county with 71% of its coastline at higher levels of exposure. All other counties have less than 50% of their shoreline at higher levels of exposure—Lamu (13%), Kilifi (18%), Kwale (10%) and Mombasa (0%) (Figure 2).
The loss of habitats increases the proportion of the country’s coastline at a higher level of exposure from 16% to 41% (Figure 3). Tana River would still be the most exposed county, as the proportion of the shoreline with higher levels of exposure would increase from 71% to 80%. Kwale and Kilifi benefit from the natural coastal protection the most, as the loss of mangroves, coral reefs and seagrasses would increase the proportion of the coastline with higher exposure from 10% to 41% and from 19% to 49%, respectively (Figure 4).
Results of the different scenarios indicate that corals contribute the most to reducing the proportion of the Kenyan coastline that is at a higher level of exposure, followed by mangroves (Figure 4). The contribution of seagrass beds to the provision of coastal protection is not impacting on the proportion of coastline under higher levels of exposure, as it is usually associated with the presence of mangroves or coral reefs. In Lamu and Tana River counties, mangroves contribute the most to reduce the proportion of shoreline at higher exposure levels, while coral reefs contribute the most in Kilifi and Kwale. The dataset does not show seagrasses or mangroves in Mombasa County, where coral reefs offer protection to about 1 km of shoreline.
In total, 1589 points of exposure were created by InVEST along the coast of Kenya, 258 of which (16%) are in the higher levels of exposure (Figure 3). The 1 km and 2 km buffer analysis around high-exposure points has shown that these exposed areas tend to experience above-average rates of mangrove loss (in case of Kwale and Lamu) or below-average rates of mangrove gain (in case of Kilifi and Tana River), while there were no high-exposure points recorded in Mombasa (Figure 5).

4. Discussion

Information on the extent of habitat cover and its dynamics is important in understanding the ability of an ecosystem to provide essential services [7,8]. Currently, a relatively small proportion of the Kenyan coastline is at a higher level of exposure to coastal hazards when compared with other countries in the Western Indian Ocean region, such as Mozambique and Madagascar [34]. However, based on the results of our study, the loss of coastal ecosystems in Kenya would increase the proportion of the shoreline at a higher level of exposure to natural hazards from 16% to 41%, similar to the findings of Ballesteros and Esteves [34]. These authors indicated that Kenya benefits the most from the natural coastal protection offered by coastal ecosystems compared to other countries in East Africa. Results presented here indicate that corals and mangroves combined prevent higher levels of exposure to coastal hazards to around 35% of Kenya’s coastline. The proportion of Kenyan coastline at a higher level of exposure would increase from 16% to 28% with the loss of corals, and to 25% with the loss of mangroves. At the County level, coral reefs are most significant in protecting the coastline from erosion in Kilifi and Mombasa County, and mangroves are the most important in Lamu and Tana River County. This study includes the shorelines around islands and some sheltered areas and thus relatively underestimates the proportion of open coasts that benefit from the protection offered by mangroves and coral reefs.
Using GMW global datasets, this study estimated an annual net mangrove loss of 0.15% in Kenya between 2010 and 2016. This is a slower rate than the 0.7% per year loss reported by Kirui et al. [49] between 1985 and 2010. However, Kirui et al. [49] also reported that rates of mangrove loss were higher in the period 1985–2000, and then decreased to 0.28% between 2000 and 2010, suggesting that the rates of mangrove loss in Kenya might be continuing to decrease over time. The rates of mangrove loss in Kenya are lower compared to many other areas of the world [28,50,51]. For example, the annual rate of mangrove loss in Indonesia was reported to be 0.3% between 2000 to 2012 [28] and in Madagascar an annual loss of 1% was recorded between 1990 to 2010 [51]. The causes of these higher rates of mangrove loss in most areas in Asia are often linked to land cover conversion to commercial aquaculture/agriculture, introduced to enhance food security in this part of the world [52]. Aquaculture activities in mangrove areas are not practiced at a large scale in Kenya. Past studies have identified overharvesting being the cause of changes in most counties in Kenya [37,38,39]. Mangroves are reportedly (over)harvested for several reasons, such as agricultural expansion, charcoal production, pole production, and mining, etc., and their loss contributes to soil erosion and degradation, and water resource loss [42,53]. In our study, the highest rates of mangrove loss were recorded in Lamu county, where most of Kenya’s mangroves are located, and where mangroves contribute the most to reducing exposure to coastal hazards. These results indicate the importance of prioritizing the conservation of coastal habitats as a cost-effective natural protection against the impact of storms and climate change [33,34].
Results also highlight that areas at highest exposure to costal hazards are either experiencing above-average rates of mangrove loss (in case of Kwale and Lamu) or below-average rates of mangrove gain (in case of Kilifi and Tana River). Identifying such areas at higher exposure can inform policy and decision-making regarding planning and designing future development along the coastline [34,45]. The natural coastal protection offered by coastal habitats is most needed in these highly exposed areas to reduce the impacts of both anthropogenic and natural drivers of mangrove loss. Some of the ways to prevent mangrove loss and degradation in Kenya include licensing procedure to control mangrove harvesting, as well as introduction of periodic ban on mangrove logging by the Kenya Forest Services 1 (KFS) in order to regulate the removal of wood products. A national ban to reduce the loss and degradation of mangroves executed in 1997 [42] coincided with decreasing rates of mangrove loss in Kenya [49]. Another national ban was put in place in 2018 but was lifted in 2019 for Lamu County only, after petition and community outcry due to impact of the ban on the local economy.
Successful examples of mangrove conservation and restoration in Asia emphasize the need for multi-stakeholder participation, noting that most successful efforts were based on community-based mangrove management (CBMM) such as those in India [54], Thailand [55] and Indonesia [56]. In Kenya, CBMM is recognized in the 2010 constitution and in the Forest Conservation and Management Act 2016, which allows for the participatory forest management approach geared to promote co-management of forest resources with Kenya Forest Services. An example of a successful community mangrove management project in Kenya is the Mikoko Pamoja project, a carbon offset project involving restoration and conservation of mangrove forest and sale of carbon credits to the voluntary carbon markets [57]. Despite the benefits Mikoko Pamoja project delivered to the local community, issues such as contested goals and motivations for conservation between different stakeholders have been identified, as well as problems of shortage of funding and capacity of some stakeholders [58]. Similarly, strong support from NGOs in the early phases of CBMM in Thailand [55] was needed to overcome the issues related to insufficient skills and financial resources available to local communities to communicate effectively with external organizations (e.g., to raise funds for community activities). The issues of lack of financial and other resources to enhance community participation have also been recognized in an inshore marine community management project in Kenya [53]. In Indonesia poverty alleviation was highlighted as important part of strengthening the local community’s capacity to undertake successful mangrove management [56].
Although conservation areas have limited effect over natural causes of mangrove loss, any effort to reduce the direct human pressures can give mangroves and other natural habitats a better chance of survival. Due to impacts of climate change and more frequent extreme weather events, mangroves may face unfavorable conditions in areas where they currently develop. Tropical cyclones and extreme climatic events (e.g., droughts associated with El Niño Southern Oscillation effects) were identified as major drivers of natural mangrove loss globally [59], and they are expected to increase in the future due to climate change. Sea level is expected to rise in the 21st century with extreme sea level events projected to occur annually, increasing the severity and frequency of coastal flooding in low lying areas [60]. Therefore, it is also important to assess whether conservation and restoration efforts are being made in areas where conditions are more likely to be favorable for mangroves in the longer term. In Indonesia, an important factor of success in mangrove management included additional hydro-physical protection to reduce wave action in erosion-prone areas [56].

Limitations and Implications

Accurate monitoring of land cover change can better inform policy on habitat loss and contribute to better management decisions to conserve valuable ecosystems [61]. At the moment, few available global mangrove change datasets report any evaluation of classification accuracy, and the reported extent of mangroves and their change varies significantly between them. The inconsistencies observed when using global land cover data for local studies have been recognized elsewhere [6,62,63] and are due to the use of different remote sensing devices, or different methods of image classification [63]. As such, global datasets of land cover were not designed to be comparable and should be used and observed as independent datasets [64]. Furthermore, global datasets do not offer insights into the health of mangroves [28,65] and this limitation is not addrssed in the assessment produced using the InVEST model. Mangrove extent is important for the level of protection offered by mangroves but it is not the only factor—considering the health of mangroves is important to better inform planning and decision making [66,67]. Addressing the scarcity of data on the state of mangroves worldwide is needed to better inform management, policy making and the public about the rate of mangrove loss and degradation and the associated consequences to the provision of ecosystem services.

5. Conclusions

This paper quantifies changes in mangrove cover in Kenya between 2010 and 2016 and assesses implications to the provision of the ecosystem service of natural coastal protection. Mangrove forests in Kenya are being lost a rate of 0.15% per annum during the studied period. Mangrove net losses are recorded in Kwale and Lamu County while Mombasa, Kilifi and Tana River are recording gain in mangrove extent. Importantly, stronger (mostly negative) changes are observed in areas that are at higher exposure to coastal hazards. Results also show that 16% of the Kenyan coastline is currently at higher levels of exposure to coastal hazards, and this could increase to 41% if mangroves, seagrass, and coral reefs are lost. Coral reefs contribute to reducing exposure to coastal hazards in comparatively the largest section of the coast overall, but mangroves contribute the most in Tana River and Lamu County.
Careful consideration in the interpretation of the results is required as the InVEST model does not take into consideration the health state of the coastal ecosystems. Degraded ecosystems may be less able to provide natural coastal protection than healthy ecosystems. Additionally, there are uncertainties in the global datasets regarding the mangrove, coral reefs and seagrasses coverage. The information presented here points out where mangrove conservation is more likely to reduce exposure to coastal hazards in Kenya and these areas should be prioritized for monitoring and management measures. Community-based mangrove management can offer benefits for both the local communities and mangrove conservation, but it is important to take into consideration diverse goals, constraints and capabilities of all stakeholders taking part in such projects.

Author Contributions

A.J.H., L.S.E. and M.C. contributed to the study’s conception and design. Spatial analyses were performed by A.J.H. and M.C. The first draft of the manuscript was written by A.J.H. and all the other authors made major contributions to revising the manuscript. All authors have read and agreed to the published version of the manuscript.

Funding

This research received no external funding.

Data Availability Statement

Not applicable.

Acknowledgments

Amina Juma Hamza is grateful to Bournemouth University for the fully funded Ph.D. scholarship.

Conflicts of Interest

The authors declare no conflict of interest.

Note

1
A government department responsible for management of forests

References

  1. Duke, N.C. Mangrove Floristics and Biogeography. In Tropical Mangrove Ecosystems; Robertson, A.I., Alongi, D.M., Eds.; American Geophysical Union: Washington DC, USA, 1992; Volume 41, p. 329. [Google Scholar]
  2. Spalding, M.; Kainuma, M.; Collins, L. World Atlas of Mangroves; Earthscan, Routledge: London, UK, 2010; ISBN 9781844076574. [Google Scholar]
  3. Spalding, M.D.; Leal, M. (Eds.) The State of the World Mangroves; Global Mangrove Alliance, 2021; Available online: https://www.mangrovealliance.org/ (accessed on 15 September 2022).
  4. Alongi, D.M. Present State and Future of the World’s Mangrove Forests. Environ. Conserv. 2002, 29, 331–349. [Google Scholar] [CrossRef] [Green Version]
  5. Njiru, D.M.; Githaiga, M.N.; Nyaga, J.M.; Lang’at, K.S.; Kairo, J.G. Geomorphic and Climatic Drivers Are Key Determinants of Structural Variability of Mangrove Forests along the Kenyan Coast. Forests 2022, 13, 870. [Google Scholar] [CrossRef]
  6. Giri, C.; Ochieng, E.; Tieszen, L.L.; Zhu, Z.; Singh, A.; Loveland, T.; Masek, J.; Duke, N. Status and Distribution of Mangrove Forests of the World Using Earth Observation Satellite Data. Glob. Ecol. Biogeogr. 2011, 20, 154–159. [Google Scholar] [CrossRef]
  7. Donato, D.C.C.; Kauffman, J.B.; Murdiyarso, D.; Kurnianto, S.; Stidham, M.; Kanninen, M. Mangroves among the Most Carbon-Rich Forests in the Tropics. NatureGeoscience 2011, 4, 293–297. [Google Scholar] [CrossRef]
  8. zu Ermgassen, P.S.E.; Mukherjee, N.; Worthington, T.A.; Acosta, A.; da Rocha Araujo, A.R.; Beitl, C.M.; Castellanos-Galindo, G.A.; Cunha-Lignon, M.; Dahdouh-Guebas, F.; Diele, K.; et al. Fishers Who Rely on Mangroves: Modelling and Mapping the Global Intensity of Mangrove-Associated Fisheries. Estuar. Coast. Shelf Sci. 2020, 247, 106975. [Google Scholar] [CrossRef]
  9. Barbier, E.B.; Hacker, S.D.; Kennedy, C.; Koch, E.W.; Stier, A.C.; Silliman, B.R. The Value of Estuarine and Coastal Ecosystem Services. Ecol. Monogr. 2011, 81, 169–193. [Google Scholar] [CrossRef]
  10. Lee, S.Y.; Primavera, J.H.; Dahdouh-guebas, F.; Mckee, K.; Bosire, J.O.; Cannicci, S.; Diele, K.; Fromard, F.; Koedam, N.; Marchand, C.; et al. Ecological Role and Services of Tropical Mangrove Ecosystems: A Reassessment. Glob. Ecol. Biogeogr. 2014, 23, 726–743. [Google Scholar] [CrossRef]
  11. Valiela, I.; Bowen, J.L.; York, J.K. Mangrove Forests: One of the World’s Threatened Major Tropical Environments. At least 35% of the area of mangrove forests has been lost in the past two decades, losses that exceed those for tropical rain forests and coral reefs, two other well-known threatened environments. Bioscience 2001, 51, 807–815. [Google Scholar] [CrossRef] [Green Version]
  12. Feller, I.C.; Friess, D.A.; Krauss, K.W.; Lewis, R.R. The State of the World’s Mangroves in the 21st Century under Climate Change. Hydrobiologia 2017, 803, 1–12. [Google Scholar] [CrossRef] [Green Version]
  13. Goldberg, L.; Lagomasino, D.; Thomas, N.; Fatoyinbo, T. Global Declines in Human-Driven Mangrove Loss. Glob. Chang. Biol. 2020, 26, 5844–5855. [Google Scholar] [CrossRef] [PubMed]
  14. Nicholls, R.J.; Cazenave, A. Sea-Level Rise and Its Impact on Coastal Zones. Science 2010, 328, 1517–1520. [Google Scholar] [CrossRef] [PubMed]
  15. Tran, L.X.; Fischer, A.M. Spatiotemporal Changes and Fragmentation of Mangroves and Its Effects on Fish Diversity in Ca Mau Province (Vietnam). J. Coast. Conserv. 2017, 21, 355–368. [Google Scholar] [CrossRef]
  16. McIvor, A.; Spencer, T.; Spalding, M.; Lacambra, C.; Möller, I. Chapter 14—Mangroves, Tropical Cyclones, and Coastal Hazard Risk Reduction. In Coastal and Marine Hazards, Risks, and Disasters. Hazards and Disasters Series; Shroder, J.F., Ellis, J.T., Sherman, D.J.B.T., Eds.; Elsevier: Boston, MA, USA, 2015; pp. 403–429. ISBN 978-0-12-396483-0. [Google Scholar]
  17. Kairo, J.G.; Dahdouh-Guebas, F.; Gwada, P.O.; Ochieng, C.; Koedam, N. Regeneration Status of Mangrove Forests in Mida Creek, Kenya: A Compromised or Secured Future? Ambio 2002, 31, 562–568. [Google Scholar] [CrossRef]
  18. Hutchison, J.; Emurgassen, P.Z.; Spalding, M. The Current State of Knowledge on Mangrove Fishery Values. Am. Fish. Soc. Symp. 2015, 83, 3–15. [Google Scholar]
  19. Menéndez, P.; Losada, I.J.; Torres-Ortega, S.; Narayan, S.; Beck, M.W. The Global Flood Protection Benefits of Mangroves. Sci. Rep. 2020, 10, 4404. [Google Scholar] [CrossRef] [PubMed] [Green Version]
  20. Alongi, D.M. Mangrove Forests: Resilience, Protection from Tsunamis, and Responses to Global Climate Change. Estuar. Coast. Shelf Sci. 2008, 76, 1–13. [Google Scholar] [CrossRef]
  21. Mukherjee, N.; Sutherland, W.J.; Dicks, L.; Hugé, J.; Koedam, N.; Dahdouh-Guebas, F. Ecosystem Service Valuations of Mangrove Ecosystems to Inform Decision Making and Future Valuation Exercises. PLoS ONE 2014, 9, e107706. [Google Scholar] [CrossRef] [Green Version]
  22. Friess, D.A. Ecosystem Services and Disservices of Mangrove Forests: Insights from Historical Colonial Observations. Forests 2016, 7, 183. [Google Scholar] [CrossRef] [Green Version]
  23. Lewis, R.R. Ecological Engineering for Successful Management and Restoration of Mangrove Forests. Ecol. Eng. 2005, 24, 403–418. [Google Scholar] [CrossRef]
  24. Pettorelli, N.; Wegmann, M.; Skidmore, A.; Mücher, S.; Dawson, T.P.; Fernandez, M.; Lucas, R.; Schaepman, M.E.; Wang, T.; O’Connor, B.; et al. Framing the Concept of Satellite Remote Sensing Essential Biodiversity Variables: Challenges and Future Directions. Remote Sens. Ecol. Conserv. 2016, 2, 122–131. [Google Scholar] [CrossRef]
  25. Cohen, W.B.; Goward, S.N. Landsat’s Role in Ecological Applications of Remote Sensing. Bioscience 2004, 54, 535–545. [Google Scholar] [CrossRef]
  26. Yang, C.; Yu, M.; Hu, F.; Jiang, Y.; Li, Y. Utilizing Cloud Computing to Address Big Geospatial Data Challenges. Comput. Environ. Urban Syst. 2017, 61, 120–128. [Google Scholar] [CrossRef] [Green Version]
  27. Worthington, T.A.; Andradi-Brown, D.A.; Bhargava, R.; Buelow, C.; Bunting, P.; Duncan, C.; Fatoyinbo, L.; Friess, D.A.; Goldberg, L.; Hilarides, L.; et al. Harnessing Big Data to Support the Conservation and Rehabilitation of Mangrove Forests Globally. One Earth 2020, 2, 429–443. [Google Scholar] [CrossRef]
  28. Hamilton, S.E.; Casey, D. Creation of a High Spatio-Temporal Resolution Global Database of Continuous Mangrove Forest Cover for the 21st Century (CGMFC-21). Glob. Ecol. Biogeogr. 2016, 25, 729–738. [Google Scholar] [CrossRef]
  29. Hansen, M.C.; Potapov, P.V.; Moore, R.; Hancher, M.; Turubanova, S.A.; Tyukavina, A.; Thau, D.; Stehman, S.V.; Goetz, S.J.; Loveland, T.R.; et al. High-Resolution Global Maps of 21st-Century Forest Cover Change. Science 2013, 342, 850–853. [Google Scholar] [CrossRef] [Green Version]
  30. Olson, D.M.; Dinerstein, E.; Wikramanayake, E.D.; Burgess, N.D.; Powell, G.V.N.; Underwood, E.C.; D’amico, J.A.; Itoua, I.; Strand, H.E.; Morrison, J.C.; et al. Terrestrial Ecoregions of the World: A New Map of Life on Earth: A New Global Map of Terrestrial Ecoregions Provides an Innovative Tool for Conserving Biodiversity. Bioscience 2001, 51, 933–938. [Google Scholar] [CrossRef]
  31. Bunting, P.; Rosenqvist, A.; Lucas, R.M.; Rebelo, L.-M.M.; Hilarides, L.; Thomas, N.; Hardy, A.; Itoh, T.; Shimada, M.; Finlayson, C.M. The Global Mangrove Watch—A New 2010 Global Baseline of Mangrove Extent. Remote Sens. 2018, 10, 1669. [Google Scholar] [CrossRef] [Green Version]
  32. United Nations Environmenta Programme; Nairobi Convention Secretariat. Transboundary Diagnostic Analysis of Land-Based Sources and Activities Affecting the Western Indian Ocean Coastal and Marine Environment; UNEP: Nairobi, Kenya, 2009. [Google Scholar]
  33. Arkema, K.K.; Guannel, G.; Verutes, G.; Wood, S.A.; Guerry, A.; Ruckelshaus, M.; Kareiva, P.; Lacayo, M.; Silver, J.M. Coastal Habitats Shield People and Property from Sea-Level Rise and Storms. Nat. Clim. Chang. 2013, 3, 913–918. [Google Scholar] [CrossRef]
  34. Ballesteros, C.; Esteves, L.S. Integrated Assessment of Coastal Exposure and Social Vulnerability to Coastal Hazards in East Africa. Estuaries and Coasts 2021, 44, 2056–2072. [Google Scholar] [CrossRef]
  35. Owuor, M.A.; Mulwa, R.; Otieno, P.; Icely, J.; Newton, A. Valuing Mangrove Biodiversity and Ecosystem Services: A Deliberative Choice Experiment in Mida Creek, Kenya. Ecosyst. Serv. 2019, 40, 101040. [Google Scholar] [CrossRef]
  36. Hamza, A.J.; Esteves, L.S.; Cvitanovic, M.; Kairo, J. Past and Present Utilization of Mangrove Resources in Eastern Africa and Drivers of Change. J. Coast. Res. 2020, 95, 39. [Google Scholar] [CrossRef]
  37. Kairo, J.; Mbatha, A.; Murithi, M.M.; Mungai, F. Total Ecosystem Carbon Stocks of Mangroves in Lamu, Kenya; and Their Potential Contributions to the Climate Change Agenda in the Country. Front. For. Glob. Chang. 2021, 4, 1–19. [Google Scholar] [CrossRef]
  38. Bosire, J.O.; Kaino, J.J.; Olagoke, A.O.; Mwihaki, L.M.; Ogendi, G.M.; Kairo, J.G.; Berger, U.; Macharia, D. Mangroves in Peril: Unprecedented Degradation Rates of Peri-Urban Mangroves in Kenya. Biogeosciences 2014, 11, 2623–2634. [Google Scholar] [CrossRef] [Green Version]
  39. Mungai, F.; Kairo, J.; Mironga, J.; Kirui, B.; Mangora, M.; Koedam, N. Mangrove Cover and Cover Change Analysis in the Transboundary Area of Kenya and Tanzania during 1986-2016. J. Indian Ocean 2019, 15, 157–176. [Google Scholar] [CrossRef]
  40. Government of Kenya. State of the Coast Report II: Enhancing Integraed Management of Coastal and Marine Resources in Kenya; National Environment Management Authority: Nairobi, Kenya, 2018. [Google Scholar]
  41. Ferguson, W. A Land(Scape) Ecological Survey of the Mangrove Resource of Kenya—Draft Report. [Incomplete?]; Kenya Marine and Fisheries Research Institute: Mombasa, Kenya, 1993. [Google Scholar]
  42. Government of Kenya. National Mangrove Ecosystem Management Plan; Kenya Forest Service: Nairobi, Kenya, 2017. [Google Scholar]
  43. Sharp, R.; Douglass, J.; Wolny, S.; Arkema, K.; Bernhardt, J.; Bierbower, W.; Chaumont, N.; Denu, D.; Fisher, D.; Glowinski, K.; et al. InVEST 3.9 User Guide; The Natural Capital Project; Stanford University: Stanford, CA, USA; University of Minnesota: Minneapolis, MN, USA; The Nature Conservancy: Arlington County, VA, USA; World Wildlife Fund: Gland, Switzerland, 2020. [Google Scholar]
  44. Hopper, T.; Meixler, M.S. Modeling Coastal Vulnerability through Space and Time. PLoS ONE 2016, 11, e0163495. [Google Scholar] [CrossRef] [Green Version]
  45. Onat, Y.; Marchant, M.; Francis, O.P.; Kim, K. Coastal Exposure of the Hawaiian Islands Using GIS-Based Index Modeling. Ocean Coast. Manag. 2018, 163, 113–129. [Google Scholar] [CrossRef]
  46. Silver, J.M.; Arkema, K.K.; Griffin, R.M.; Lashley, B.; Lemay, M.; Maldonado, S.; Moultrie, S.H.; Ruckelshaus, M.; Schill, S.; Thomas, A.; et al. Advancing Coastal Risk Reduction Science and Implementation by Accounting for Climate, Ecosystems, and People. Front. Mar. Sci. 2019, 6, 556. [Google Scholar] [CrossRef] [Green Version]
  47. Zhang, Y.; Ruckelshaus, M.; Arkema, K.K.; Han, B.; Lu, F.; Zheng, H.; Ouyang, Z. Synthetic Vulnerability Assessment to Inform Climate-Change Adaptation along an Urbanized Coast of Shenzhen, China. J. Environ. Manage. 2020, 255, 109915. [Google Scholar] [CrossRef]
  48. Cabral, P.; Augusto, G.; Akande, A.; Costa, A.; Amade, N.; Niquisse, S.; Atumane, A.; Cuna, A.; Kazemi, K.; Mlucasse, R.; et al. Assessing Mozambique’s Exposure to Coastal Climate Hazards and Erosion. Int. J. Disaster Risk Reduct. 2017, 23, 45–52. [Google Scholar] [CrossRef]
  49. Kirui, K.B.; Kairo, J.G.; Bosire, J.; Viergever, K.M.; Rudra, S.; Huxham, M.; Briers, R.A. Mapping of Mangrove Forest Land Cover Change along the Kenya Coastline Using Landsat Imagery. Ocean Coast. Manag. 2013, 83, 19–24. [Google Scholar] [CrossRef]
  50. Giri, C.; Pengra, B.; Zhu, Z.; Singh, A.; Tieszen, L.L. Monitoring Mangrove Forest Dynamics of the Sundarbans in Bangladesh and India Using Multi-Temporal Satellite Data from 1973 to 2000. Estuar. Coast. Shelf Sci. 2007, 73, 91–100. [Google Scholar] [CrossRef]
  51. Jones, T.G.; Glass, L.; Gandhi, S.; Ravaoarinorotsihoarana, L.; Carro, A.; Benson, L.; Ratsimba, H.R.; Giri, C.; Randriamanatena, D.; Cripps, G. Madagascar’s Mangroves: Quantifying Nation-Wide and Ecosystem Specific Dynamics, and Detailed Contemporary Mapping of Distinct Ecosystems. Remote Sens. 2016, 8, 106. [Google Scholar] [CrossRef] [Green Version]
  52. Richards, D.R.; Friess, D.A. Rates and Drivers of Mangrove Deforestation in Southeast Asia, 2000-2012. Proc. Natl. Acad. Sci. USA 2016, 113, 344–349. [Google Scholar] [CrossRef] [PubMed] [Green Version]
  53. Ambrosino, C.; Hufton, B.; Nyawade, B.O.; Osimbo, H.; Owiti, P. Integrating Climate Adaptation, Poverty Reduction, and Environmental Conservation in Kwale County, Kenya BT—African Handbook of Climate Change Adaptation; Oguge, N., Ayal, D., Adeleke, L., da Silva, I., Eds.; Springer International Publishing: Cham, Switzerland, 2021; pp. 2713–2731. ISBN 978-3-030-45106-6. [Google Scholar]
  54. Shah, H.; Ramesh, R. Development-Aligned Mangrove Conservation Strategy for Enhanced Blue Economy: A Successful Model from Gujarat, India. Estuar. Coast. Shelf Sci. 2022, 274, 107929. [Google Scholar] [CrossRef]
  55. Kongkeaw, C.; Kittitornkool, J.; Vandergeest, P.; Kittiwatanawong, K. Explaining Success in Community Based Mangrove Management: Four Coastal Communities along the Andaman Sea, Thailand. Ocean Coast. Manag. 2019, 178, 104822. [Google Scholar] [CrossRef]
  56. Damastuti, E.; de Groot, R.; Debrot, A.O.; Silvius, M.J. Effectiveness of Community-Based Mangrove Management for Biodiversity Conservation: A Case Study from Central Java, Indonesia. Trees, For. People 2022, 7, 100202. [Google Scholar] [CrossRef]
  57. Kairo, J.G.; Hamza, A.J.; Wanjiru, C. Mikoko Pamoja: A Demonstrably Effective Community-Based Blue Carbon Project in Kenya. In A blue carbon Primer: The state of Coastal Wetland Carbon Science, Practice and Policy; Windham-Myers, L., Crooks, S., Troxler, T., Eds.; CRC Press Taylor & Francis: London, UK, 2019; pp. 341–351. [Google Scholar]
  58. Huff, A.; Tonui, C. Making “Mangroves Together”: Carbon, Conservation and Co-Management in Gazi Bay Kenya; STEPS Working Paper 95; STEPS Centre: Brighton, UK, 2017; Available online: https://opendocs.ids.ac.uk/opendocs/handle/20.500.12413/12970 (accessed on 20 September 2022).
  59. Sippo, J.Z.; Lovelock, C.E.; Santos, I.R.; Sanders, C.J.; Maher, D.T. Mangrove Mortality in a Changing Climate: An Overview. Estuar. Coast. Shelf Sci. 2018, 215, 241–249. [Google Scholar] [CrossRef]
  60. Masson-Delmotte, V.; Zhai, P.; Pirani, A.; Connors, S.; Péan, C.; Berger, S.; Caud, N.; Chen, Y.; Goldfarb, L.; Gomis, M.I. (Eds.) IPCC Summary for Policy Makers. In Climate Change 2021: The Physical Science Basis. Contribution of Working Group I to the Sixth Assessment Report of Intergovernmental Panel on Climate Change; Cambridge University Press: Cambridge, UK; New York, NY, USA, 2021; pp. 3–32. [Google Scholar]
  61. Friess, D.A.; Webb, E.L. Bad Data Equals Bad Policy: How to Trust Estimates of Ecosystem Loss When There Is so Much Uncertainty? Environ. Conserv. 2011, 38, 1–5. [Google Scholar] [CrossRef]
  62. Congalton, R.; Gu, J.; Yadav, K.; Thenkabail, P.; Ozdogan, M. Global Land Cover Mapping: A Review and Uncertainty Analysis. Remote Sens. 2014, 6, 12070–12093. [Google Scholar] [CrossRef] [Green Version]
  63. Xu, L.; Herold, M.; Tsendbazar, N.-E.; Masiliūnas, D.; Li, L.; Lesiv, M.; Fritz, S.; Verbesselt, J. Time Series Analysis for Global Land Cover Change Monitoring: A Comparison across Sensors. Remote Sens. Environ. 2022, 271, 112905. [Google Scholar] [CrossRef]
  64. Herold, M.; Mayaux, P.; Woodcock, C.E.; Baccini, A.; Schmullius, C. Some Challenges in Global Land Cover Mapping: An Assessment of Agreement and Accuracy in Existing 1 Km Datasets. Remote Sens. Environ. 2008, 112, 2538–2556. [Google Scholar] [CrossRef]
  65. Younes Cárdenas, N.; Joyce, K.E.; Maier, S.W. Monitoring Mangrove Forests: Are We Taking Full Advantage of Technology? Int. J. Appl. Earth Obs. Geoinf. 2017, 63, 1–14. [Google Scholar] [CrossRef] [Green Version]
  66. Bevacqua, A.; Yu, D.; Zhang, Y. Coastal Vulnerability: Evolving Concepts in Understanding Vulnerable People and Places. Environ. Sci. Policy 2018, 82, 19–29. [Google Scholar] [CrossRef]
  67. Maanan, M.; Maanan, M.; Rueff, H.; Adouk, N.; Zourarah, B.; Rhinane, H. Assess the Human and Environmental Vulnerability for Coastal Hazard by Using a Multi-Criteria Decision Analysis. Hum. Ecol. Risk Assess. Int. J. 2018, 24, 1642–1658. [Google Scholar] [CrossRef]
Figure 1. Kenyan coastline showing major mangrove areas in Lamu, Tana River, Kilifi, Mombasa, and Kwale Counties in 2010.
Land 11 01714 g001
Figure 2. Proportion of country and counties coastline length at the different relative levels of exposure (no points of very low exposure were recorded by the model).
Land 11 01714 g002
Figure 3. Location of high and very high exposure areas on the coast of Kenya resulting from InVEST model run with all habitats (left) and with no mangroves (right).
Land 11 01714 g003
Figure 4. Different habitat contributions in reducing exposure levels along the Kenyan Coast.
Land 11 01714 g004
Figure 5. Average annual change of mangrove cover in Kenya’s coastal counties (%) and rates of change within 1 km and 2 km buffer zones around shoreline points at high and very high exposure (with all habitats scenario).
Land 11 01714 g005
Table 1. Ranking and classification of indicators used.
Model Input1 (Very Low)2 (Low)3 (Moderate)4 (High)5 (Very High)
Relief12–30.628–124–8 2–40–2
Wave exposure0–0.10.1–2.002–2020–6565–74.71
Wind exposure0 to 20 pctl21 to 40 pctl41 to 60 pctl61 to 80 pctl80 to 100 pctl
Surge potential0 to 20 pctl21 to 40 pctl41 to 60 pctl61 to 80 pctl80 to 100 pctl
Natural habitatsCoral reef; Mangroves--SeagrassNo habitat
Shoreline change rates (m/yr)>+2+1 to +2−1 to +1−2 to −1<−2
Table 2. Changes in mangrove cover in Kenyan coastal counties (in ha) between 2010 and 2016.
CountyGainLossNo Change Cover in 2016% Annual Change
Kwale149.4202.09054.39203.8−0.09
Mombasa67.244.21391.31458.50.27
Kilifi83.754.653565439.70.09
Tana River128.529.61999.62128.10.81
Lamu626.31164.833,499.234,125.5−0.26
TOTAL1055.11495.251,300.452,355.6−0.15
Publisher’s Note: MDPI stays neutral with regard to jurisdictional claims in published maps and institutional affiliations.

