Article

Industrial Structure Optimization of Wuhan Urban Agglomeration Based on TFP and Industrial Spatial Linkages

1
School of Resources and Environmental Engineering, Wuhan University of Technology, Wuhan 430070, China
2
Xiangyang Urban Planning and Design Institute Co., Ltd., Xiangyang 441002, China
*
Author to whom correspondence should be addressed.
Land 2022, 11(10), 1703; https://doi.org/10.3390/land11101703
Submission received: 3 September 2022 / Revised: 26 September 2022 / Accepted: 28 September 2022 / Published: 30 September 2022
(This article belongs to the Special Issue Digital Landscape Architecture in Practice)

Abstract

:
As a complex symbiosis, a reasonable industrial structure of each symbiotic unit within an urban agglomeration (UA) is crucial to the sustainable development of the regional economy. In an urban agglomeration (UA), a reasonable industrial structure is crucial to the sustainable development of the regional economy. This paper comprehensively considers the industrial total factor productivity (TFP) and the industrial spatial linkages between cities to adjust the industrial structure. Malmquist index (MI) is introduced to assess the industry performance in this paper to judge the development status of the industry. The calculation method for identifying industrial structure similarity is improved by combining it with industrial spatial linkages, to accurately reflect the degree of industrial structure convergence in the UA and to recognize which cities need industrial adjustment. The results from a case study on Wuhan UA showed that the method proposed in this paper can provide objective and specific suggestions for every industrial sector in each member city of the UA on a regional scale, so that the city can give priority to the developing industry with a certain foundation on the premise of avoiding the low resource allocation efficiency.

1. Introduction

With the expansion of urbanization and the escalation of urban interactions, urban agglomeration (UA) has become a major spatial form of regional development and a new regional unit that can be represented at the national and even global level [1,2,3]. As a complex collection of cities and the main form of urbanization in developed countries [4], the coordinated symbiosis of industries in urban agglomerations plays an important role in improving the efficiency of regional economic cooperation and enhancing the overall competitive strength of the country. Promoting the upgrading of industrial structure is undoubtedly an effective way to achieve the harmonious symbiosis of industries and coordinated economic development [5,6,7]. Since the 1990s, with the dramatic increase in social productivity, industrial sectors have become more specialized and the industrial structure, more complex [4]. Optimizing UA’s industrial structure and thus promoting regional industrial synergy is the key to achieving sustainable development.
Current research on industrial optimization tends to focus on two areas: spatial interaction of symbiotic units and urban industrial structure within UA. The spatial interaction within the UA has been a hot topic in regional studies, and there are many research methods, such as Thünen’s agricultural location theory, Weber’s industrial location theory, the converse breaking points model, the growth-pole theory, the spatial interaction theory and spatial diffusion theory, and the radiation model etc., [8]. These theories and models provide a sufficient basis for the study of the spatial interaction within the UA. In the 1940s, Zipf applied the gravity model to the city system [9] and formally established a theoretical model of urban spatial interaction. Since then, the gravity model has become the most widely used model to study spatial interaction. For example, Sun et al. used the improved gravity model to study the economic network of the UA in the middle reaches of the Changjiang River [10]. Yu et al. studied the spatial and temporal evolution of urban spatial interaction in Wuhan UA using the gravity model [11]. Sun et al. analyzed the spatial pattern of the urban system in eight of the major UAs in China [12]. Fracasso applied the gravity model to study the virtual water trade flows between countries [13]. These studies revealed the spatial interaction and economic connection between regions, and have become important references for regional economic planning.
Studies on the urban industrial structure focus on the characteristics of the industrial structure of cities [14,15,16]. The industrial structure is often analyzed by industrial structure similarity, location quotient (LQ), industrial concentration, and Theil index [4,17,18,19,20,21,22,23,24]. For example, the industrial structure similarity coefficient was introduced by the United Nations Industrial Development Organization (UNIDO) to measure the similarity of industrial structures of countries. Wang et al. studied the integrated development of the energy chemical industry in Urumqi-Changji-Shihezi UA by calculating industrial structure similarity [20]. Qi et al. explored the industrial compactness of the UA by calculating the industrial concentration, and spatial efficiency of the industrial structure [21]. Ye et al. used LQ, industrial structure similarity, and other indexes to study the coordinated economic development in Yangtze River Delta [8]. In recent years, total factor productivity (TFP) has been applied to the analysis of industrial production efficiency, which brings a new way for the optimization of industrial structure. In traditional research, TFP is often used to study efficiency changes between regions or between firms. The emergence of industrial TFP in recent years enables us to analyze the performance of the industry itself, such as production efficiency, technological changes of an industry. This can be used as the basis for industrial structure adjustment, but at present, few scholars have applied TFP to industrial structure adjustment.
In a word, previous studies on the urban industrial symbiosis and industrial structure clearly revealed the status of industrial development in various cities, which provided a reference for the adjustment of the industrial structure within each city; however, there were also inadequacies. First, past studies have analyzed the ratio of industrial structures and industrial spatial linkages in urban agglomerations, but the proposed recommendations based on the current state of industrial development still suffer from subjectivity. There is a lack of quantitative indicators to measure whether the industrial structure should be adjusted or not [4,23]. Second, most studies focus on industrial relations, layout, and spatial distribution but ignore the performance of the industry itself [20,25,26], so much so that industries with greater potential do not receive enough attention.
Therefore, this paper uses total factor productivity to analyze the performance of the industry itself to identify the industries in the rapid development period. In order to quantitatively evaluate the rationality of urban industries and analyze whether urban industries need industrial restructuring, the article calculates the industrial structure similarity of cities within urban agglomeration based on industrial spatial linkages, and believes that cities with an industrial structure similarity greater than 0.9 must undergo industrial restructuring. Finally, the industrial development suggestions are given according to the development situation of the dominant industries in each city.

2. Materials and Methods
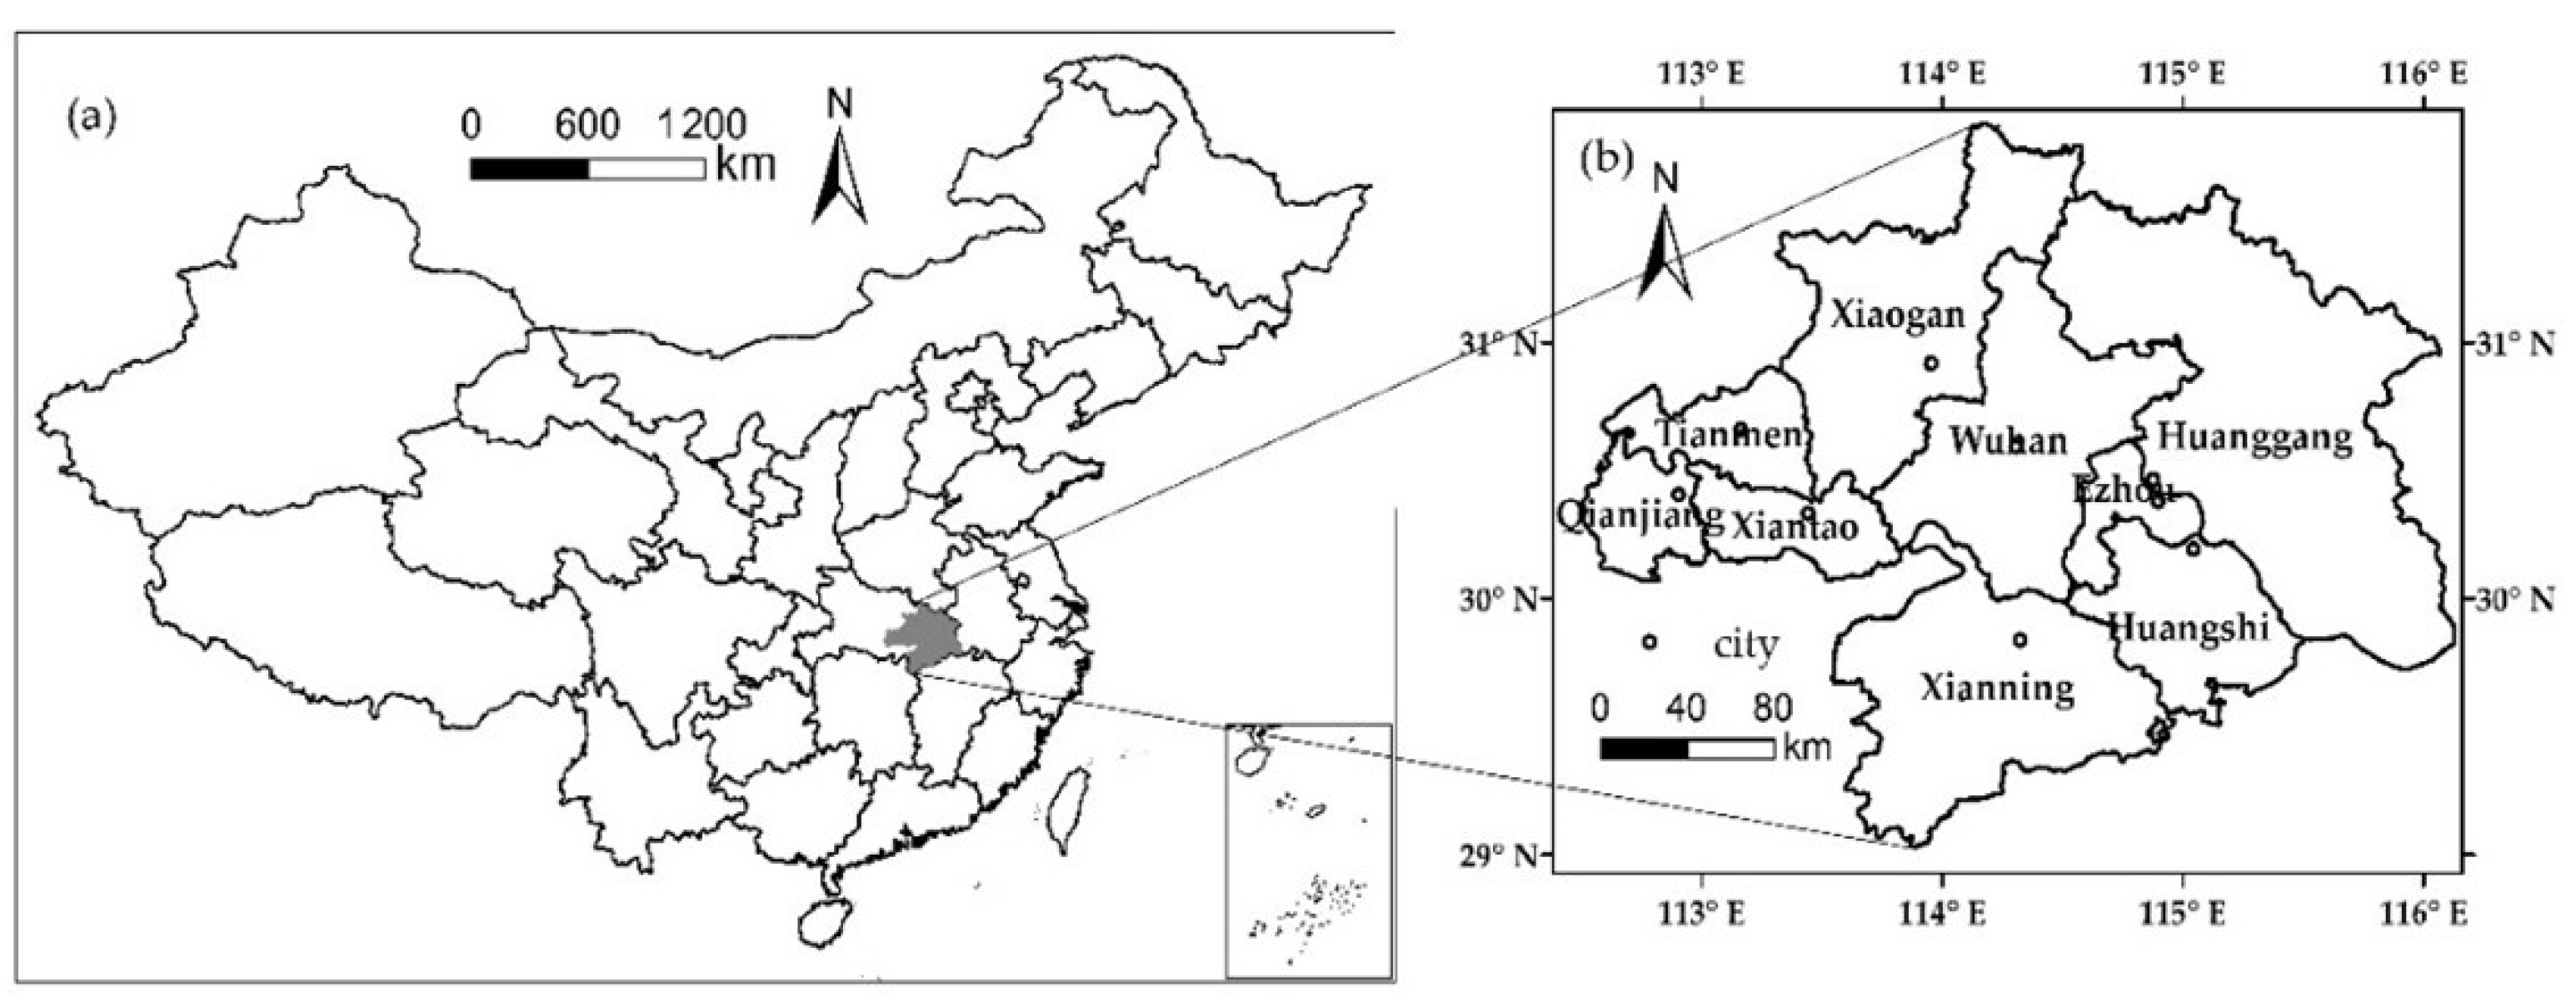
2.1. Study Area

In this era of rapid globalization and urbanization, it has become a new feature of economic and social development that developing central cities is critical to the development of a country. Wuhan is one of the nine national central cities in China identified by the Chinese government, and Wuhan urban agglomeration (WUA) is the most dynamic focal point of potential growth in the central region of China [27]. WUA is composed of nine cities with Wuhan as the center, as shown in Figure 1. In 2017, the GDP of WUA was 2.26 trillion RMB (accounting for 2.75% of the total GDP of mainland China), exhibiting an increase of 8.7% over the previous year, which is much higher than China’s average growth rate. Relying on the natural environment and modern transportation systems, WUA has formed a complete circular structure with Wuhan as the center, and the city’s industrial activities are closely related. WUA has a sound industrial system and has been an important base for advanced manufacturing and high-tech industries in China. WUA’s four traditional established industries (metallurgical industry, building materials manufacturing, petrochemical industry, and textiles) play an important role in China’s economic development, and WUA is striving to build notable enterprises with international influence in the fields of electronics, information technology, automobiles, equipment manufacturing, biomedicine, and food processing, which have developed rapidly in recent years. WUA is a typical urban agglomeration in China, which is in a stage of rapid integration and coordination, and in urgent need of scientific industrial optimization suggestions.

2.2. Methodology

A coordinated industrial structure is the basis for the mutual symbiosis of industries. Many factors need to be considered to optimize the industrial structure of urban agglomeration. The first is to consider the development of the industry itself. This paper uses TFP to measure the change of industrial efficiency, in order to analyze the development of the industry. In addition, it is necessary to analyze the industrial basis of urban agglomeration. First, it is necessary to analyze the reasonable degree of urban industrial structure. Second, it is necessary to understand the advantageous industries of each city. Based on the industrial spatial connection, this paper establishes the comprehensive similarity of industrial structure to judge whether the urban industrial structure is reasonable, and identifies the urban advantageous industries according to the location quotient. In view of the unreasonable industrial structure of the city, according to the development of its advantageous industries, this paper puts forward some suggestions on the optimization of industrial structure, and constructs the inter city industrial chain through the industrial spatial connection of urban agglomeration, so as to form a situation of coordinated symbiosis of industries and sustainable economic development in UA.

2.2.1. Total Factor Productivity

Cities should prioritize fast-developing industries because they can quickly incorporate the results of scientific research, reduce energy consumption and environmental impacts, and become the focal points of economic growth in urban development. In recent years, some scholars have applied Total factor productivity (TFP) to the study of industrial efficiency, which enables us to use it to analyze the performance of the industry itself. In the past few years, if the TFP of an industry has been improved, it means that the production technology of the industry has been updated and the production efficiency has been improved, so it is a developing industry.
Rapidly developing industries can quickly integrate the latest scientific research developments and become growth points of urban development; most of these industries are emerging with greater economic efficiency and lower environmental impact. Cities should prioritize these industries for long-term economic benefits and sustainable development. The TFP calculated by the MI can be used to measure industry performance. Increase in industrial TFP indicates that the industry was in a period of rapid development.
Here, industry performance is assessed to help decision-makers focus on rapidly developing industries. MI can measure the productivity of decision-making for multiple inputs and outputs while industrial TFP calculated by the index can reflect industry performance. The detailed process of calculating the index can be found in the literature [28,29]. MI can be defined as:
MI = D t + 1 x t + 1 , y t + 1 D t x t , y t D t x t + 1 , y t + 1 D t + 1 x t + 1 , y t + 1 × D t x t , y t D t + 1 x t , y t 1 / 2
where D t is a distance function measuring the efficiency of conversion from input x to output y in period t. MI > 1 indicates an increase in productivity; if MI = 1, it indicates no change; if MI < 1, it indicates a decrease in productivity. In this study, an industrial sector with MI ≥ 1.05 is considered a fast-developing industry, an industrial sector with MI ≥ 1 is considered a developing industry, and that with MI < 1 is considered a declining industry.

2.2.2. Industrial Spatial Linkages

Industrial spatial linkages are the basis of industrial cooperation and industrial chain formation among urban symbiotic units. The optimization of industrial structure based on industrial spatial linkages can better promote urban cooperation and coordinated regional development. The industrial spatial linkages in the UA can be calculated by combining a gravity model with an industrial wave-effect [23].
The industrial wave-effect is calculated based on the input-output table, and it includes the response gradient and influence gradient. The response gradient represents the forward push of the industrial sector in the industrial chain and reflects the total demand contribution from a certain sector to other sectors. In other words, it reflects the agglomeration effect of the economic development in the UA. The influence gradient indicates the backward pull of an industrial sector in the industrial chain, and reflects the total amount of services received by the sector. In other words, it reflects the diffusion effect of urban economic development [23]. The response and influence gradients can be expressed as follows:
S t i = 1 n j = 1 n b i j 1 n 2 i = 1 n j = 1 n b i j
T t j = 1 n i = 1 n b i j 1 n 2 i = 1 n j = 1 n b i j
where S t i represents the response gradient of the i-th industrial sector affected by other sectors, T t j represents the influence gradient of the j-th industrial sector impacting other industrial sectors, n indicates the number of industrial sectors, and b i j is the coefficient of the i-th row and the j-th column in the wave-effect gradient field (note that the wave-effect gradient field is calculated using the complete consumption coefficient matrix and direct consumption coefficient matrix, in the input–output table, based on the literature [23]).
The industrial spatial linkages are calculated by combining the gravity model with the industrial wave-effect. According to Yu Yan [23],
C I m n = C m · C n D m n 2
where
C m = i = 1 k M c m i S t i T t i
C I m n being the intensity of inter-city industrial spatial linkages between city m and city n considering all the industries, C m and C n are the industrial relation capacities of cities m and n, respectively; M c m i is the employment population of the i-th sector in city m; k is the total number of industrial sectors; and D m n is the distance between city m and city n.

2.2.3. Comprehensive Similarity Based on Industrial Spatial Linkages

The similarity of industrial structure refers to the degree of similarity of the industrial structure ratio between regions. If the similarity of industrial structure between regions is too high, it will lead to the formation of a competitive relationship between regions, thus hindering the coordinated development between regions. The traditional industrial structure similarity coefficient from previous studies only measures the industrial convergence between two cities [20,30,31], whereas this study improves the calculation method for industrial structure similarity based on industrial spatial linkages to reflect the comprehensive similarity of industrial structure between a certain city and all other cities in the UA. The comprehensive similarity coefficient S m of city m is represented as:
S m = n = 1 l α m n S m n
where,
α m n = C I m n n = 1 l C I m n
S m n = i = 1 k X m i X n i i = 1 k X m i 2 i = 1 k X n i 2
where l is the total number of cities in the UA ,   C I m n is the industrial spatial linkage between city m and city n calculated in step 3 and S m n is the traditional similarity coefficient—that is, the industrial structure similarity coefficient between city m and city n, X m i and X n i represent the proportion of the i-th industrial sector of city m and city n, respectively. The value range of the comprehensive similarity coefficient is 0 to 1.
The higher the comprehensive similarity, the more similar are the industrial structures of the city and its surrounding areas. Similarity in industrial structures of cities will lead to low resource allocation efficiency. According to previous studies [20,32,33], high similarity influences the development of the economy, and S i > 0.9 indicates that the city must optimize its industrial structure.

2.2.4. Industrial Location Quotient

Location quotient (LQ) reflects the degree of specialization of an industrial sector in a certain area. It can be used to identify a city’s superior industries. The LQ is represented as:
L Q m i = q m i q m q i q
where L Q m i is the LQ for the i-th industrial sector of city m, q m i is the number of employed population of the i-th industrial sector in city m. If the LQ of a certain industrial sector in a city is larger than 1, it indicates that the industrial sector of the city has a comparative advantage in urban agglomeration and is considered the city’s superior industry.
Cities that require industrial adjustment can be recognized by the comprehensive similarity of industrial structure; cities with a comprehensive similarity greater than 0.9 urgently need to adjust their industrial structure. The superior industries of these cities are identified using the LQ. The strategy for industrial structure optimization can be determined based on industrial TFP change in the cities’ superior industries. Cities should focus on developing superior industries that have rapid development.

3. Results

3.1. Industrial TFP

Using DEAP 2.1, the average TFP of 42 industrial sectors for the period 2013–2017 is calculated applying Equation (4). The inputs include fixed assets, employment population, and energy consumption of each industrial sector. The output index is derived from gross product of each industry deflated by price indexes in 2012. These data come from the China Statistical Yearbook (2013–2018) and China Industry Statistical Yearbook (2013–2018). The calculation results are recorded in the third column of Table 1.
Table 1 shows the results of the total factor productivity estimates for 42 industries from 2013 to 2017. The results show that there were 32 industries with their Malmquist index greater than 1, indicating that productivity in these 32 industries was growing steadily over the period 2013–2017. Nine industries have Malmquist indices less than 1, indicating that productivity in these 9 industries has declined from 2013 to 2017, and only one industry has a Malmquist index equal to 1, indicating that productivity in that industry remained unchanged during 2013–2017. The production efficiency of agriculture, forestry, animal husbandry, and fishery increased rapidly, which shows that it forms the solid foundation for urban development. TFP of manufacturing industry is generally high, among which the fastest changing is repair of metal products, machinery, and equipment, which reaches 1.155. Instrumentation, transportation equipment manufacturing, and other industries have also made progress in efficiency. Cities can focus on developing these industries in combination with their own industrial characteristics. The TFP of public management has made great progress. For example, the TFP of health and social work is 1.086, which indicates that these industries are still in the stage of rapid development.
The productivity of nine industrial sectors in China has declined from 2013 to 2017. The MI of building industry and real estate industry is lower than 1. This shows that the focus of national economic development should no longer be on the building industry and real estate industry, and should not continue to encourage their development. The MI of wholesale and retail, leasing and business services are also less than 1. The retail market has been saturated, and the rapid development of the national economy can no longer rely on these industries. Three of the four types of mining industry have MI lower than 1, which indicates that mining industry is in a declining stage, and the development of mining industry depends on urban natural resources very much. Cities should develop mining industry carefully, and cities with mining industry as the leading industry should speed up the pace of industrial adjustment and upgrading.

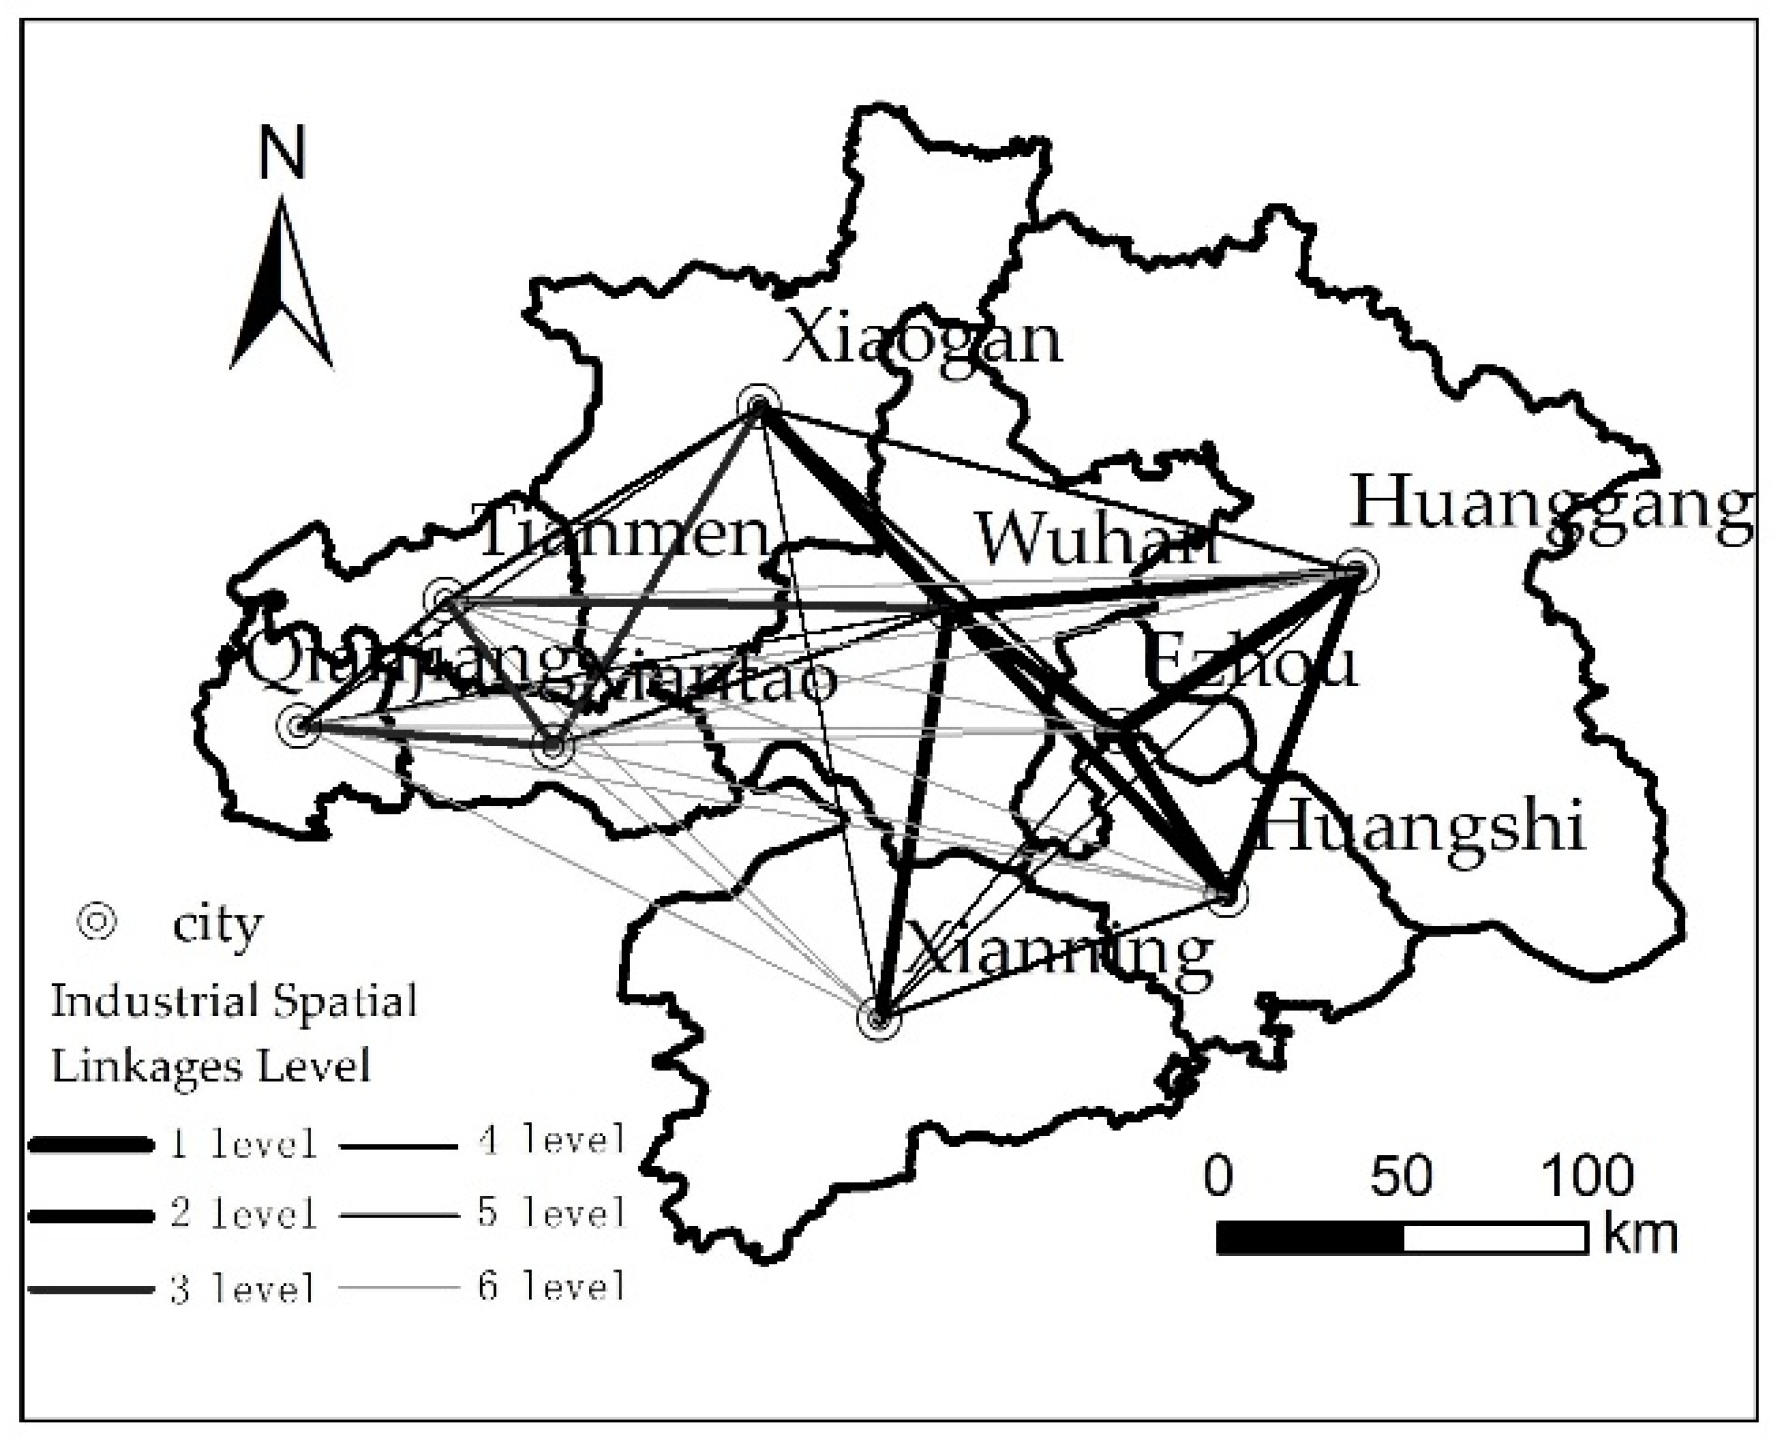
3.2. Industrial Spatial Linkages in UA

Industrial spatial linkages in the UA are the basis of urban industrial cooperation and industrial macro adjustment. Yu’s calculation method for industrial spatial linkages in the UA based on the industrial wave-effect is adopted in this paper [23] as shown in Equation (5). While in earlier studies the distances between cities were the Euclidean distance between the centroids of the cities, which ignored the heterogeneous distribution of regional traffic facilities, in this study, the shortest highway mileage between two cities is taken as the intercity distance to ensure that the calculation results reflect the relationship between cities accurately. The intercity distance data were obtained using the Baidu map API. In addition, employment data was taken from the Chinese City Statistical Yearbook (2017) and yearbooks of each city published by the China Statistics Bureau. The calculation results are shown in Figure 2.
The results show that the whole UA radiated out from Wuhan, which is not only the geographical center of WUA but also the industrial and economic center. It can be seen that within the UA, some small-scale circles with strong interactions within them were formed. Tianmen, Qianjiang, and Xiantao with adjacent geographical locations and comparable city sizes, were closely linked, while Huangshi, Ezhou, and Huanggang also formed an industrial circle. These small industrial circles are the links of the inter-city industrial chain. Urban industrial structure optimization should take full consideration of industrial spatial linkages in the whole UA to develop a harmonious symbiosis with reasonable division of labor and complementary cooperation in urban industries.

3.3. Industrial Structure Characteristics of Urban Agglomeration

The characteristics of the industrial structure of each city are the basis for the optimization of the industrial structure of the UA. This study uses comprehensive similarity and LQ to characterize the industrial structure of a single city. Using Equation (7), the comprehensive similarity coefficient between each city and its surrounding cities is calculated based on industrial spatial linkages calculated. Equation (9) calculates the industrial LQs to judge the superior industries of each city based on employment data.
Table 2 lists the calculation results of the framework for industrial structure optimization. The first column is the cities, the second column is the comprehensive similarity of each city, the third column is the superior industries of each city judged by the LQ, and the fourth column records the industrial TFP.
It must be noted that the coal mining sector is not listed in the table because the coal output of WUA is small, with only small outputs from Huangshi and Xianning. The high LQ for coal mining in Huangshi and Xianning does not prove that their coal mining sector has any advantages (the output value of coal mining industry in other cities is 0, so they get high LQ with a small output of coal mining). Owing to space limitations, only six superior industries with the highest LQ in each city are listed in the table.
The detailed industrial optimization plan can be prepared based on Table 2. As described in Section 2.2 and shown in Figure 2, cities that need industrial adjustment based on the comprehensive similarity of industrial structure are identified. Then, the strategy for industrial structure adjustment can be determined based on TFP of the cities’ superior industries. Therefore, based on Table 2, the specific industrial structure optimization schemes for each city are as follows.

3.4. Industrial Structure Optimization Suggestions

Based on the LQ, Wuhan, as the geographical, economic, and transportation center of the WUA, has obvious advantages in the science and technology sectors, terminal manufacturing sectors, and the financial sector. Wuhan’s comprehensive similarity stands at 0.9421, indicating that its industrial structure needs to be adjusted. It should continue to maintain the high-tech sectors as the forerunners, and continue to focus on developing transportation equipment manufacturing and financial resources sectors. As the TFP of the real estate sector declines, Wuhan should gradually reduce its proportion in the urban economy. In addition, it should gradually transfer upstream industries to other cities, take advantage of terminal manufacturing and other downstream industries to drive the development of the surrounding cities, and steadily establish urban industrial cooperation.
Huangshi, Ezhou, and Xiaogan have high comprehensive similarity, so there is an urgent need to optimize their industrial structure. Considering the LQ, Huangshi and Ezhou have similar industrial situations with metal mining and mineral processing sectors relatively developed. However, the development of metal mining and mineral processing sectors show a declining trend. These two cities need to speed up the pace of industrial upgrading. They should continue to maintain the advantages of mining sectors, relying on mining to extend the industrial chain to develop metal products manufacturing, and form industrial cooperation and complementary relationships with Wuhan transportation equipment manufacturing. Xiaogan should utilize its geographical advantages to the fullest, strengthen its linkages with Wuhan, undertake the upstream industries transferred from Wuhan, develop the machinery component and general equipment manufacturing sectors, and transfer the textile sector to Tianmen and Xiantao.
Qianjiang’s superior industries are mostly in a declining stage which lead to weak economic development, so it needs to find new breakthroughs. Not much has been achieved with regard to industrial upgrading and transformation in Qianjiang in recent years, and petrochemical engineering, which is in the declining stages is still the major industry. The foundation for Qianjiang’s agriculture sector has been laid, and the fisheries and animal husbandry sectors focusing on animal breeding can be promoted in the future.
The LQ for agriculture, forestry, animal husbandry, and fisheries in Huanggang is 2.9, which shows that Huanggang has a big advantage in these sectors. Huanggang has become the main source of agricultural products in WUA. It should take full advantage of the agriculture, forestry, animal husbandry, and fishery sectors, establish horticultural bases, promote modern animal breeding projects, and develop sectors such as agricultural product processing and food processing.
The low comprehensive similarity indicates that the industrial structures of Tianmen, Xiantao, and Xianning had formed their own unique industry system. According to the LQ and industrial TFP, Tianmen is the only city in the WUA with advantages in the sector that deals with repair of metal products, machinery, and equipment. In addition, this sector is in a period of rapid development, so Tianmen should maintain this advantage and continue to focus on the development of this industrial sector, reinforcing its irreplaceable position in this urban function. Xiantao’s traditional superior industry namely textile, had reached maximum potential, and there is not much scope for further breakthroughs in this sector. The future development of Xiantao needs new leading industries. Relying on strong textiles, Xiantao can promote the development of clothing manufacturing, chemical fiber weaving, and agriculture. In Xianning, some high-tech sectors such as the computer service and software sector, already have a base there; this can be supported by the Xianning high-tech industrial estate and orderly promoted by docking with the Wuhan industrial estate.

4. Discussion

From the perspective of methodology, this paper integrates the latest research results from various disciplines. Two innovations were introduced in research methods: using the MI to analyze the performance of industry and improving the calculation method for similarity of industrial structure.

4.1. Total Factor Productivity Calculation from the Perspective of Industry

The MI is often used to measure the change in TFP of decision-making units. In previous studies, decision-making units were generally different regions or enterprises [29,34,35]. Here, an index is used to measure the change in TFP of different industries, to reflect the performance of the industry, thereby compensating for the insufficient consideration of the development of the industry itself. In this way, fast-developing industries will receive more attention, which can bring greater economic benefits and reduce environmental impact.

4.2. Calculation Method for Comprehensive Similarity based on Industrial Spatial Linkages

The traditional industrial structure similarity coefficient can only measure the degree of industrial convergence between the two cities. With the development of the economy, transportation, and UA expansion, it is difficult to evaluate the degree of industrial convergence among multiple cities using traditional methods. This paper combines industrial spatial linkages with traditional industrial structure similarity and proposes a calculation method to evaluate the comprehensive similarity of industrial structures. It presents an evaluation of the similarity between one city and all other cities in the UA, which accurately reflects industrial competition and cooperation among the symbiotic units of the UA.
High industrial structure similarity will lead to low resource allocation efficiency, develop vicious competition, and hinder coordinated symbiotic development among regions [20,32,33,36]. Previous research shows that the similarity between cities is generally between 0.6 and 1 [20,31,37]. In view of the fact that most studies generally assume that high industrial structure similarity hinders coordinated development of cities, and no consensus has been reached regarding the range of similarity within which the scope for success is reasonable, this framework does not set the lower limit for similarity. Based on previous studies, it is assumed that cities with comprehensive similarity higher than 0.9 need industrial adjustment [36]; further studies on urban industrial structures may lead to conclusions in the future about the reasonable value range of the similarity that necessitates such adjustment. This framework can be modified further without changing its logical structure to improve industrial structure optimization.

5. Conclusions

A systematic framework to optimize the industrial symbiosis structure of the UA was established that can provide scientific and objective suggestions for regional industrial development. In contrast to previous studies based on the subjective analysis of calculation results, the framework can make full use of the theoretical calculation results in industrial structure optimization and ensure objectivity of suggestions for industrial structure optimization. The proposal for optimizing industrial structure is based on the characteristics of the performance of industry. Hence, the suggestions are tailored to each industrial sector in each city, with industrial sectors that have rapid development receiving more attention.
Due to the representative and sound industrial system of Wuhan urban agglomeration, it was considered as an example of using this framework to propose industrial structure optimization. The results show that Wuhan, Huangshi, Ezhou, and Xiaogan urgently need to optimize their industrial structures. They should accelerate industrial transformation and upgrade. Qianjiang’s superior industries are mostly in a declining stage which lead to weak economic development, so it needs to find new breakthroughs. Huanggang has become the main source of agricultural products in WUA. Tianmen, Xiantao, and Xianning have formed their own industry systems and should maintain their advantage and enhance their irreplaceable position in the UA Symbiosis System. In the case study, specific and objective industrial optimization suggestions for each industrial sector in each member city were provided, which proved that the framework is both scientific and practical.
Regional industrial structure optimization is a complex and long-term process that requires a multi-disciplinary perspective and quantitative calculation method. The framework integrates the methods of industrial economics, geography, macroeconomics, and other disciplines. It provides new ideas not only for the study of the performance of industry and the industrial structure of cities but also for the adjustment and optimization of industrial structure in other UAs, counties, and provinces.

Author Contributions

Conceptualization, Y.Y. and W.M.; methodology, Y.Y.; software, X.G. and W.M.; validation, X.G., Y.H., and C.Z.; formal analysis, X.G. and W.M.; investigation, X.G.; data curation, Y.H. and C.Z.; writing—original draft preparation, W.M.; writing—review and editing, Y.Y. and X.G.; visualization, Y.H. and C.Z. All authors have read and agreed to the published version of the manuscript.

Funding

This research was funded by the National Natural Science Foundation of China (No. 42171260, 52079101).

Conflicts of Interest

The authors declare no conflict of interest.

References

  1. Meijers, E. Polycentric Urban Regions and the Quest for Synergy: Is a Network of Cities More than the Sum of the Parts? Urban Stud. 2005, 42, 765–781. [Google Scholar]
  2. Margaret, C. Polycentric Regions: Comparing Complementarity and Institutional Governance in the San Francisco Bay Area, the Randstad and Emilia-Romagna. Urban Stud. 2010, 47, 945–965. [Google Scholar]
  3. Lin, A.Q.; Wu, H.; Liang, G.H.; Abraham, C.T.; Wu, X.; Zhao, C.; Li, D. A big data-driven dynamic estimation model of relief supplies demand in urban flood disaster. Int. J. Disaster Risk Reduct. 2020, 49, 101682. [Google Scholar]
  4. Ye, C.; Zhu, J.; Li, S.; Yang, S.; Chen, M. Assessment and analysis of regional economic collaborative development within an urban agglomeration: Yangtze River Delta as a case study. Habitat Int. 2019, 83, 20–29. [Google Scholar]
  5. Tian, Y.; Jiang, G.; Zhou, D.; Ding, K.; Su, S.; Zhou, T.; Chen, D. Regional industrial transfer in the Jingjinji urban agglomeration, China: An analysis based on a new “transferring area-undertaking area-dynamic process” model. J. Clean Prod. 2019, 235, 751–766. [Google Scholar]
  6. Herczeg, G.; Akkerman, R. Supply chain collaboration in industrial symbiosis networks. J. Clean. Prod. 2018, 171, 1058–1067. [Google Scholar]
  7. Marian, R. INDUSTRIAL SYMBIOSIS: Literature and Taxonomy. Annu. Rev. Environ. Resour. 2000, 25, 313–337. [Google Scholar]
  8. Simini, F.; González, M.C.; Maritan, A.; Barabási, A. A universal model for mobility and migration patterns. Nature 2012, 484, 96–100. [Google Scholar]
  9. Zipf, G.K. Human Behavior and the Principle of Least Effort; Addison-Wesley Press: Boston, MA, USA, 1994; pp. 157–190. [Google Scholar]
  10. Sun, Q.; Tang, F.; Tang, Y. An economic tie network-structure analysis of urban agglomeration in the middle reaches of Changjiang River based on SNA. J. Geogr. Sci. 2015, 25, 739–755. [Google Scholar]
  11. Yu, Y.; Tong, Y.; Hu, S.S.; Ke, Y.Y. Spatio-temporal evolution of spatial interaction among cities of Wuhan metropolitan area. Resour. Environ. Yangtze Basin. 2017, 26, 1784–1794. [Google Scholar]
  12. Sun, Q.; Wang, S.; Zhang, K.; Ma, F.; Guo, X.; Li, T. Spatial pattern of urban system based on gravity model and whole network analysis in eight urban agglomerations of China. Math. Probl. Eng. 2019, 2019, 6509726. [Google Scholar] [CrossRef]
  13. Fracasso, A. A gravity model of virtual water trade. Ecol. Econ. 2014, 108, 215–228. [Google Scholar] [CrossRef]
  14. Li, Y.; Zhang, Z.; Shi, M. What should be the future industrial structure of the Beijing-Tianjin-Hebei city region under water resource constraint? An inter-city input-output analysis. J. Clean. Prod. 2019, 239, 118117. [Google Scholar] [CrossRef]
  15. Yu, C.; Li, H.; Jia, X.; Li, Q. Improving resource utilization efficiency in China’s mineral resource-based cities: A case study of Chengde, Hebei province. Resour. Conserv. Recycl. 2015, 94, 1–10. [Google Scholar] [CrossRef]
  16. Peneder, M. Industrial structure and aggregate growth. Struct. Chang. Econ. Dyn. 2003, 14, 427–448. [Google Scholar] [CrossRef]
  17. Wang, M.; Kuang, Y.Q.; Huang, N.S. Sustainable urban external service function development for building the international megalopolis in the pearl river delta, China. Sustainability 2015, 7, 13029–13054. [Google Scholar] [CrossRef]
  18. Drucker, J. Regional industrial structure concentration in the United States: Trends and implications. Econ. Geogr. 2011, 87, 421–452. [Google Scholar] [CrossRef]
  19. Cheng, Z.; Li, L.; Liu, J. Industrial structure, technical progress and carbon intensity in China's provinces. Renew. Sustain. Energy Rev. 2018, 81, 2935–2946. [Google Scholar] [CrossRef]
  20. Wang, G.; Yang, D.; Xia, F.; Zhao, Y. Study on industrial integration development of the energy chemical industry in Urumqi-Changji-Shihezi urban agglomeration, Xinjiang, NW China. Sustainability 2016, 8, 683. [Google Scholar] [CrossRef]
  21. Qi, W.; Fang, C.; Song, J. Measurement and spatial distribution of urban agglomeration industrial compactness in China. Chin. Geogr. Sci. 2008, 18, 291–299. [Google Scholar] [CrossRef]
  22. Yang, Z.; Song, T.; Chahine, T. Spatial representations and policy implications of industrial co-agglomerations, a case study of Beijing. Habitat Int. 2016, 55, 32–45. [Google Scholar] [CrossRef]
  23. Yu, Y.; Han, Q.; Tang, W.; Yuan, Y.; Tong, Y. Exploration of the industrial spatial linkages in urban agglomerations: A case of urban agglomeration in the middle reaches of the Yangtze river, China. Sustainability 2018, 10, 1469. [Google Scholar] [CrossRef]
  24. Zhai, S.J.; Zhao, L. A Study on the influence of industrial structure adjustment on the export intensity based on the Theil index. Econ. Surv. 2016, 33, 92–97. [Google Scholar]
  25. Sohn, J. Industry classification considering spatial distribution of manufacturing activities. Area 2014, 46, 101–110. [Google Scholar] [CrossRef]
  26. Li, J.; Zhang, W.; Chen, H.; Yu, J. The spatial distribution of industries in transitional China: A study of Beijing. Habitat Int. 2015, 49, 33–44. [Google Scholar] [CrossRef]
  27. Wang, H.; Huang, J.J.; Zhou, H.; Deng, C.B.; Fang, C.L. Analysis of sustainable utilization of water resources based on the improved water resources ecological footprint model: A case study of Hubei Province, China. J. Environ. Manag. 2020, 262, 110331. [Google Scholar] [CrossRef]
  28. Färe, R.; Grosskopf, S.; Norris, M.; Zhang, Z. Productivity growth, technical progress, and efficiency change in industrialized countries. Am. Econ. Rev. 1994, 84, 66–83. [Google Scholar]
  29. Wang, W.K.; Lu, W.M.; Wang, S.W. The impact of environmental expenditures on performance in the U.S. chemical industry. J. Clean Prod. 2014, 64, 447–456. [Google Scholar] [CrossRef]
  30. He, C.F.; Zhu, S.J. Economic transition and industrial restructuring in China: Structural convergence or divergence? Post-Communist Econ. 2007, 19, 317–342. [Google Scholar]
  31. Luo, R.; Zhao, J. Analysis on the Convergence of industrial structure in Chengdu-Chongqing economic zone and its policy options. Areal Res. Dev. 2013, 5, 41–45. [Google Scholar]
  32. Zheng, D.; Kuroda, T. The impact of economic policy on industrial specialization and regional concentration of China’s high-tech industries. Ann. Reg. Sci. 2013, 50, 771–790. [Google Scholar] [CrossRef]
  33. Wang, L.M.; Deng, L. An Emprical research on the industrial structure of the Yangtze river economic belt. Econ. Probl. 2015, 5, 39–42. [Google Scholar]
  34. Fang, C.L.; Guan, X.L.; Lu, S.S.; Zhou, M.; Deng, Y. Input-output efficiency of urban agglomerations in China: An application of data envelopment analysis (DEA). Urban Stud. 2013, 50, 2766–2790. [Google Scholar] [CrossRef]
  35. Zhang, C.; Liu, H.; Bressers, H.T.A.; Buchanan, K.S. Productivity growth and environmental regulations-accounting for undesirable outputs: Analysis of China’s thirty provincial regions using the Malmquist-Luenberger index. Ecol. Econ. 2011, 70, 2369–2379. [Google Scholar] [CrossRef]
  36. Song, C.; Zheng, W.; Wang, S. Measuring green technology progress in large-scale thermoelectric enterprises based on Malmquist–Luenberger life cycle assessment. Resour. Conserv. Recycl. 2017, 122, 261–269. [Google Scholar] [CrossRef]
  37. Qin, C.; Pan, D. Industrial structure convergence and desirability in Guangdong-Hong Kong-Macao great bay area. Shandong Econ. 2018, 34, 15–25. [Google Scholar]
Figure 1. Location of study area: (a) geographic location in China; (b) Wuhan urban agglomeration.
Land 11 01703 g001
Figure 2. Industrial spatial linkages network of Wuhan urban agglomeration.The industrial spatial linkages are primarily theoretical references for the promotion of symbiotic development among regions and in the next step, the basis for calculating the comprehensive similarity among the industrial structures of the cities in the UA. The calculation results for industrial spatial linkages can provide a basis for not only the macro-industrial adjustment of UA but also for the optimization of industrial structure within each city.
Land 11 01703 g002
Table 1. Industry classification and average Malmquist index (MI) of the industrial sector.
NumberCategoriesMI
(1)Chemical products1.048
(2)Metal smelting and calendering products1.021
(3)Electricity and heat production and supply1.015
(4)Communications equipment, computers, and other electronic equipment1.000
(5)Leasing and business services0.981
(6)Oil, coking products, and nuclear fuel processing0.948
(7)Coal mining1.040
(8)Electrical machinery and equipment1.059
(9)General equipment1.005
(10)Textile0.982
(11)Metal mining0.926
(12)Agriculture, forestry, animal husbandry, and fishery products and services1.126
(13)Financial1.024
(14)Transportation, warehousing, and postal services1.105
(15)Food and tobacco1.020
(16)Wholesale and retail0.949
(17) Oil and gas extraction0.867
(18)Transportation equipment1.093
(19)Paper printing and cultural and educational sporting goods1.015
(20)Metal products1.052
(21)Non-metallic mineral products1.066
(22)Professional setting1.072
(23)Non-metallic minerals and other mining0.997
(24)Woodworking and furniture1.079
(25)Instruments and meters1.100
(26)Waste scrap1.023
(27)Building0.991
(28)Gas production and supply1.015
(29)Other manufacturing products1.028
(30)Repair of metal products, machinery, and equipment1.155
(31)Accommodation and dining1.055
(32)Real estate0.993
(33)Scientific research and technical services1.013
(34)Information transmission, software, and information technology services1.018
(35)Residents services, repairs and other services1.081
(36)Textile clothing footwear leather down and its products1.084
(37)Culture, sports and entertainment1.101
(38)Public administration, social security and social organization1.071
(39)Water, environment and public facilities management1.114
(40)Water production and supply1.015
(41)Education1.087
(42)Health and social work1.086
Table 2. Calculation results of the framework.
CityComprehensive SimilaritySuperior IndustriesIndustrial TFP
Wuhan0.9421(33)
(14)▲▲
(18)▲▲
(13)
(32)
(34)
Huangshi0.9732(11)
(23)
(6)
(21)▲▲
(22)▲▲
(2)
Ezhou0.9252(11)
(6)
(1)
(3)
(28)
(21)▲▲
Xiaogan0.9694(35)▲▲
(31)▲▲
(19)
(5)
(9)
(21)▲▲
Xianning0.8172(38)▲▲
(42)▲▲
(41)▲▲
(3)
(28)
(34)
Huanggang0.8918(12)▲▲
(40)
(38)▲▲
(24)▲▲
(26)
(41)▲▲
Tianmen0.6837(30)▲▲
(26)
(12)▲▲
(24)▲▲
(22)▲▲
(36)▲▲
Xiantao0.6064(10)
(12)▲▲
(42)▲▲
(8)▲▲
(15)
(38)
Qanjiang0.7499(17)
(23)
(6)
(12)
(36)▲▲
(10)
Note: ▲ represents developing industry (with 1.05 > MI ≥ 1); ▲▲ represents fast-developing industry (with MI ≥ 1.05). The industry number is shown in Table 1.
Publisher’s Note: MDPI stays neutral with regard to jurisdictional claims in published maps and institutional affiliations.

