
Spatio-Temporal Evolution Characteristics and Spatial Interaction Spillover Effects of New-Urbanization and Green Land Utilization Efficiency


Abstract
:1. Introduction
1.1. Research Motivation
1.2. Literature Review and Contribution
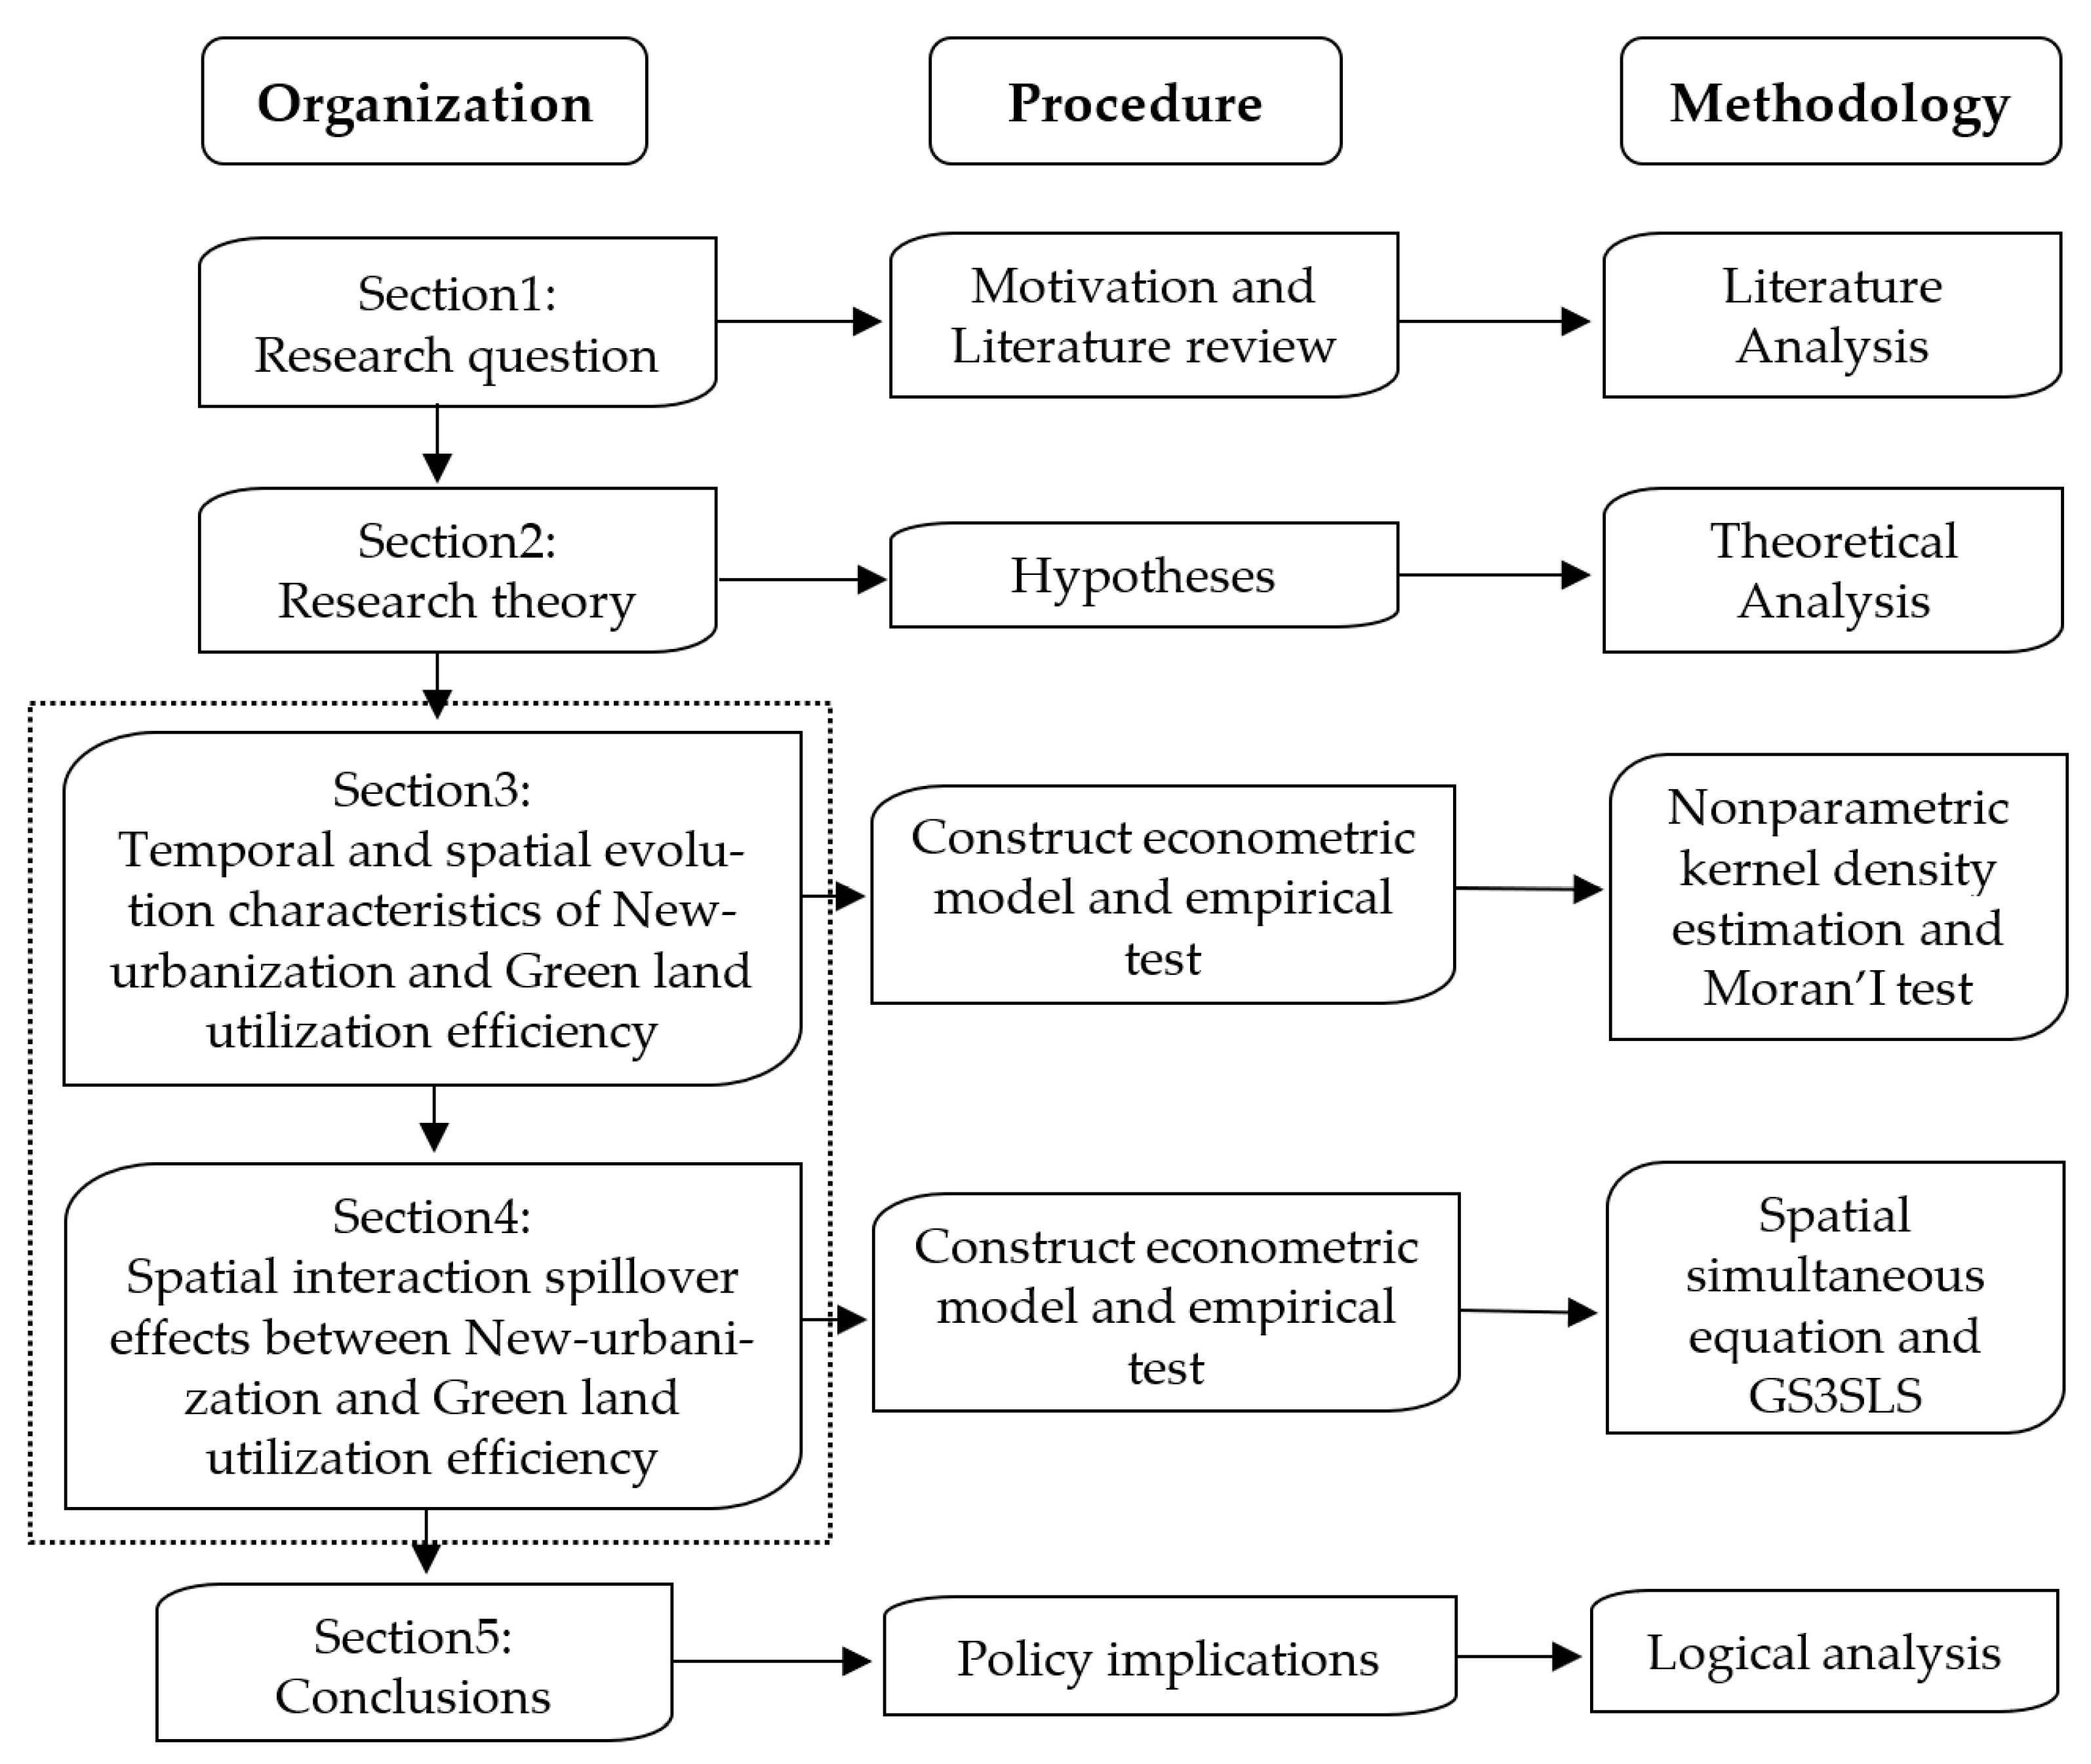
2. Research Design and Variable Preprocessing
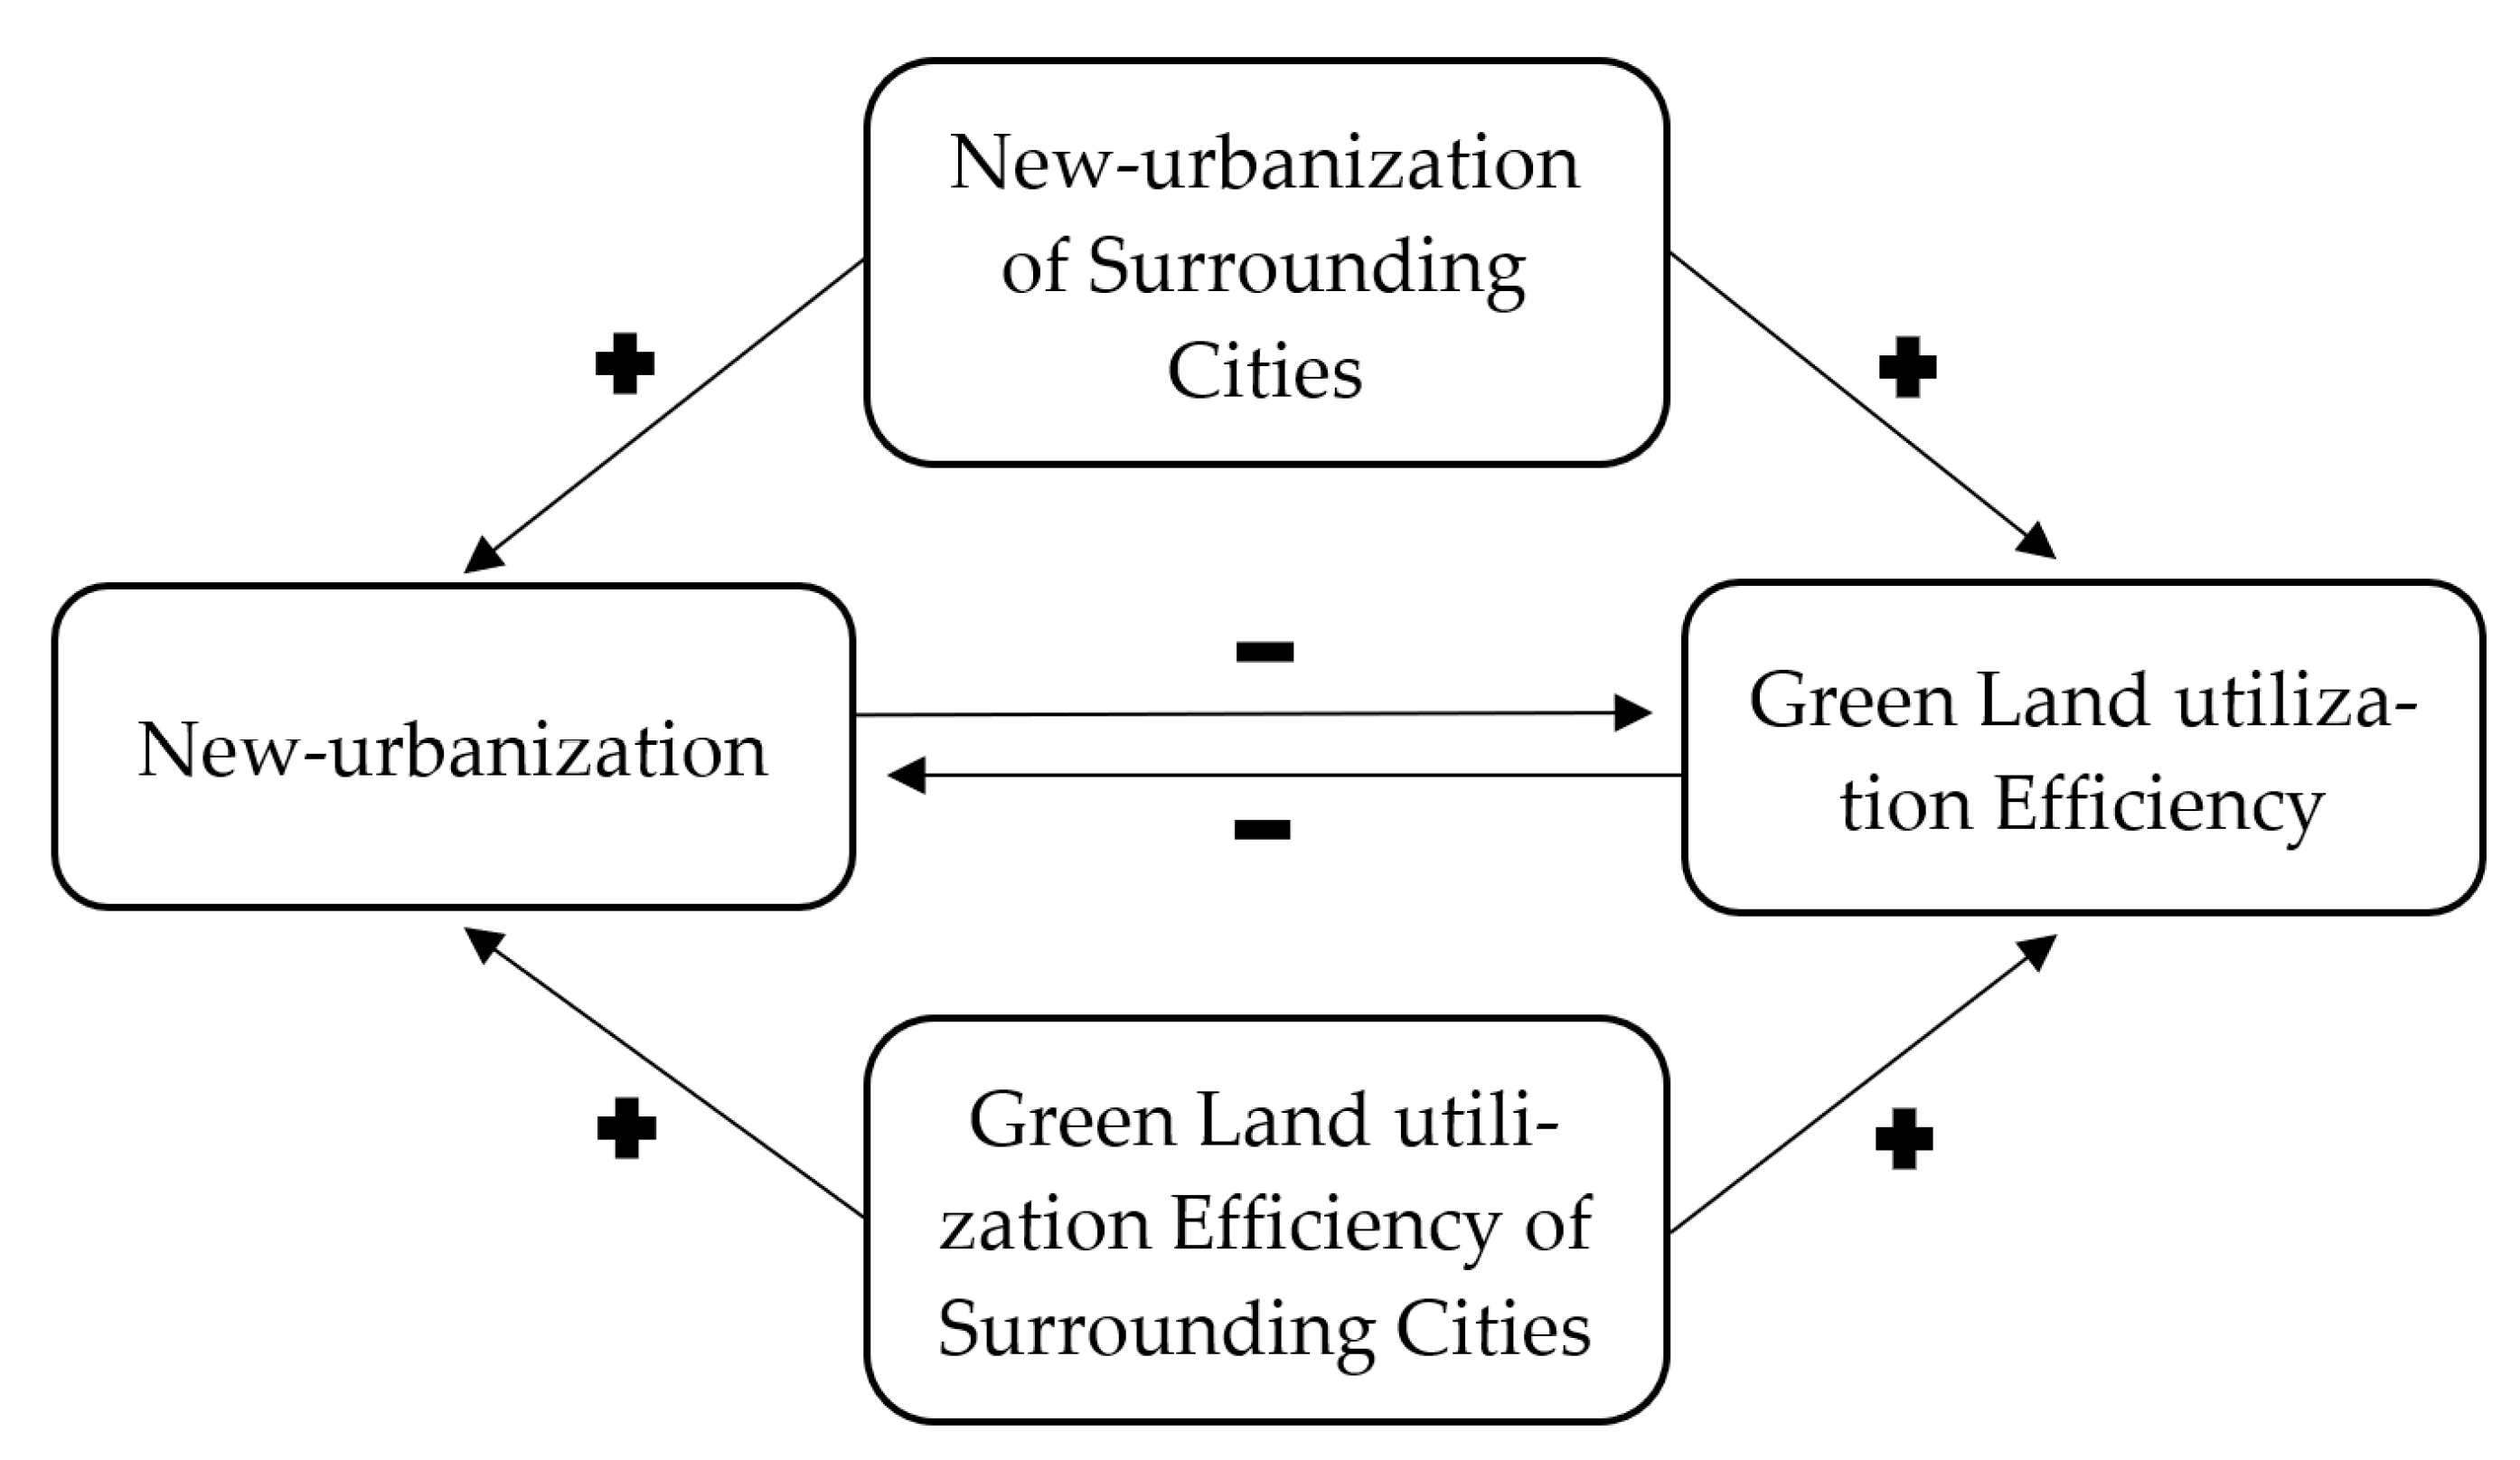
2.1. Theoretical Analysis and Research Hypothesis
2.2. Model Setting and Measurement Method
2.3. Variable Description and Data Source
2.3.1. Variable Description and Processing
2.3.2. Data Sources and Descriptive Statistics
3. Temporal and Spatial Evolution Characteristics of New-Urbanization and Green Land Utilization Efficiency
3.1. Characteristics of the Temporal Dynamic Evolution
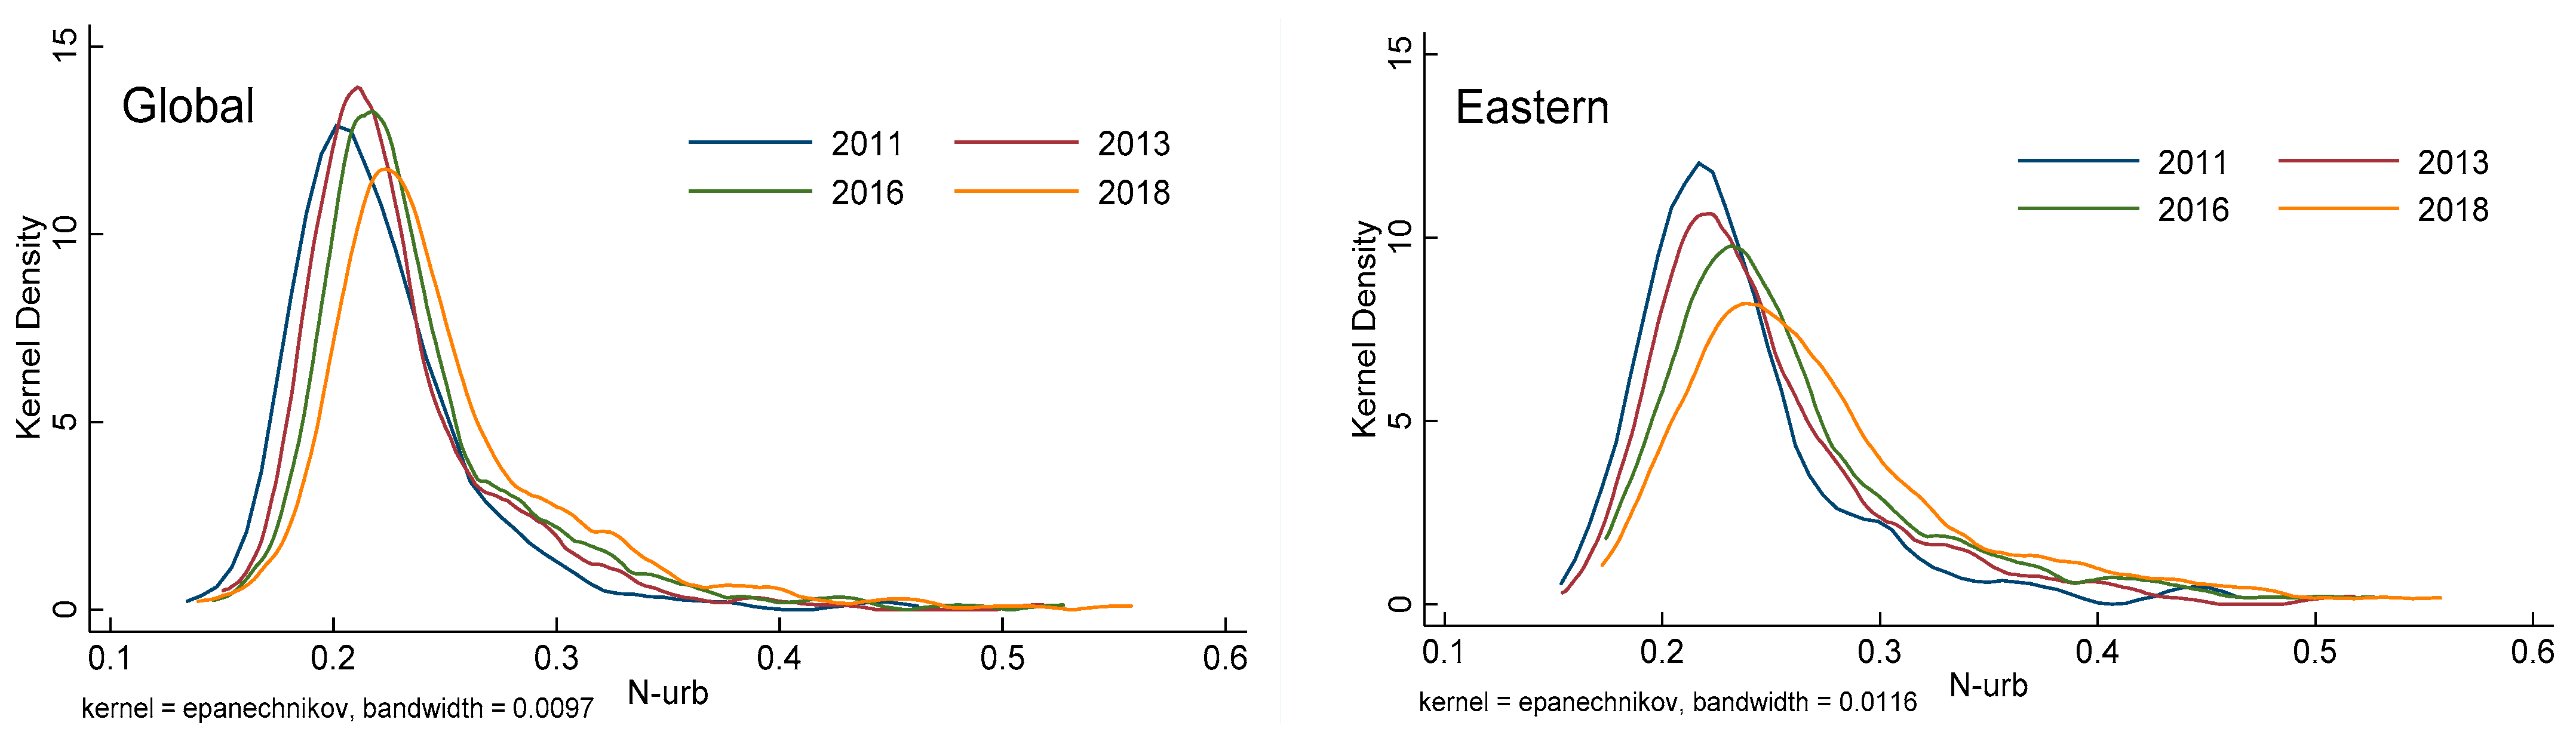
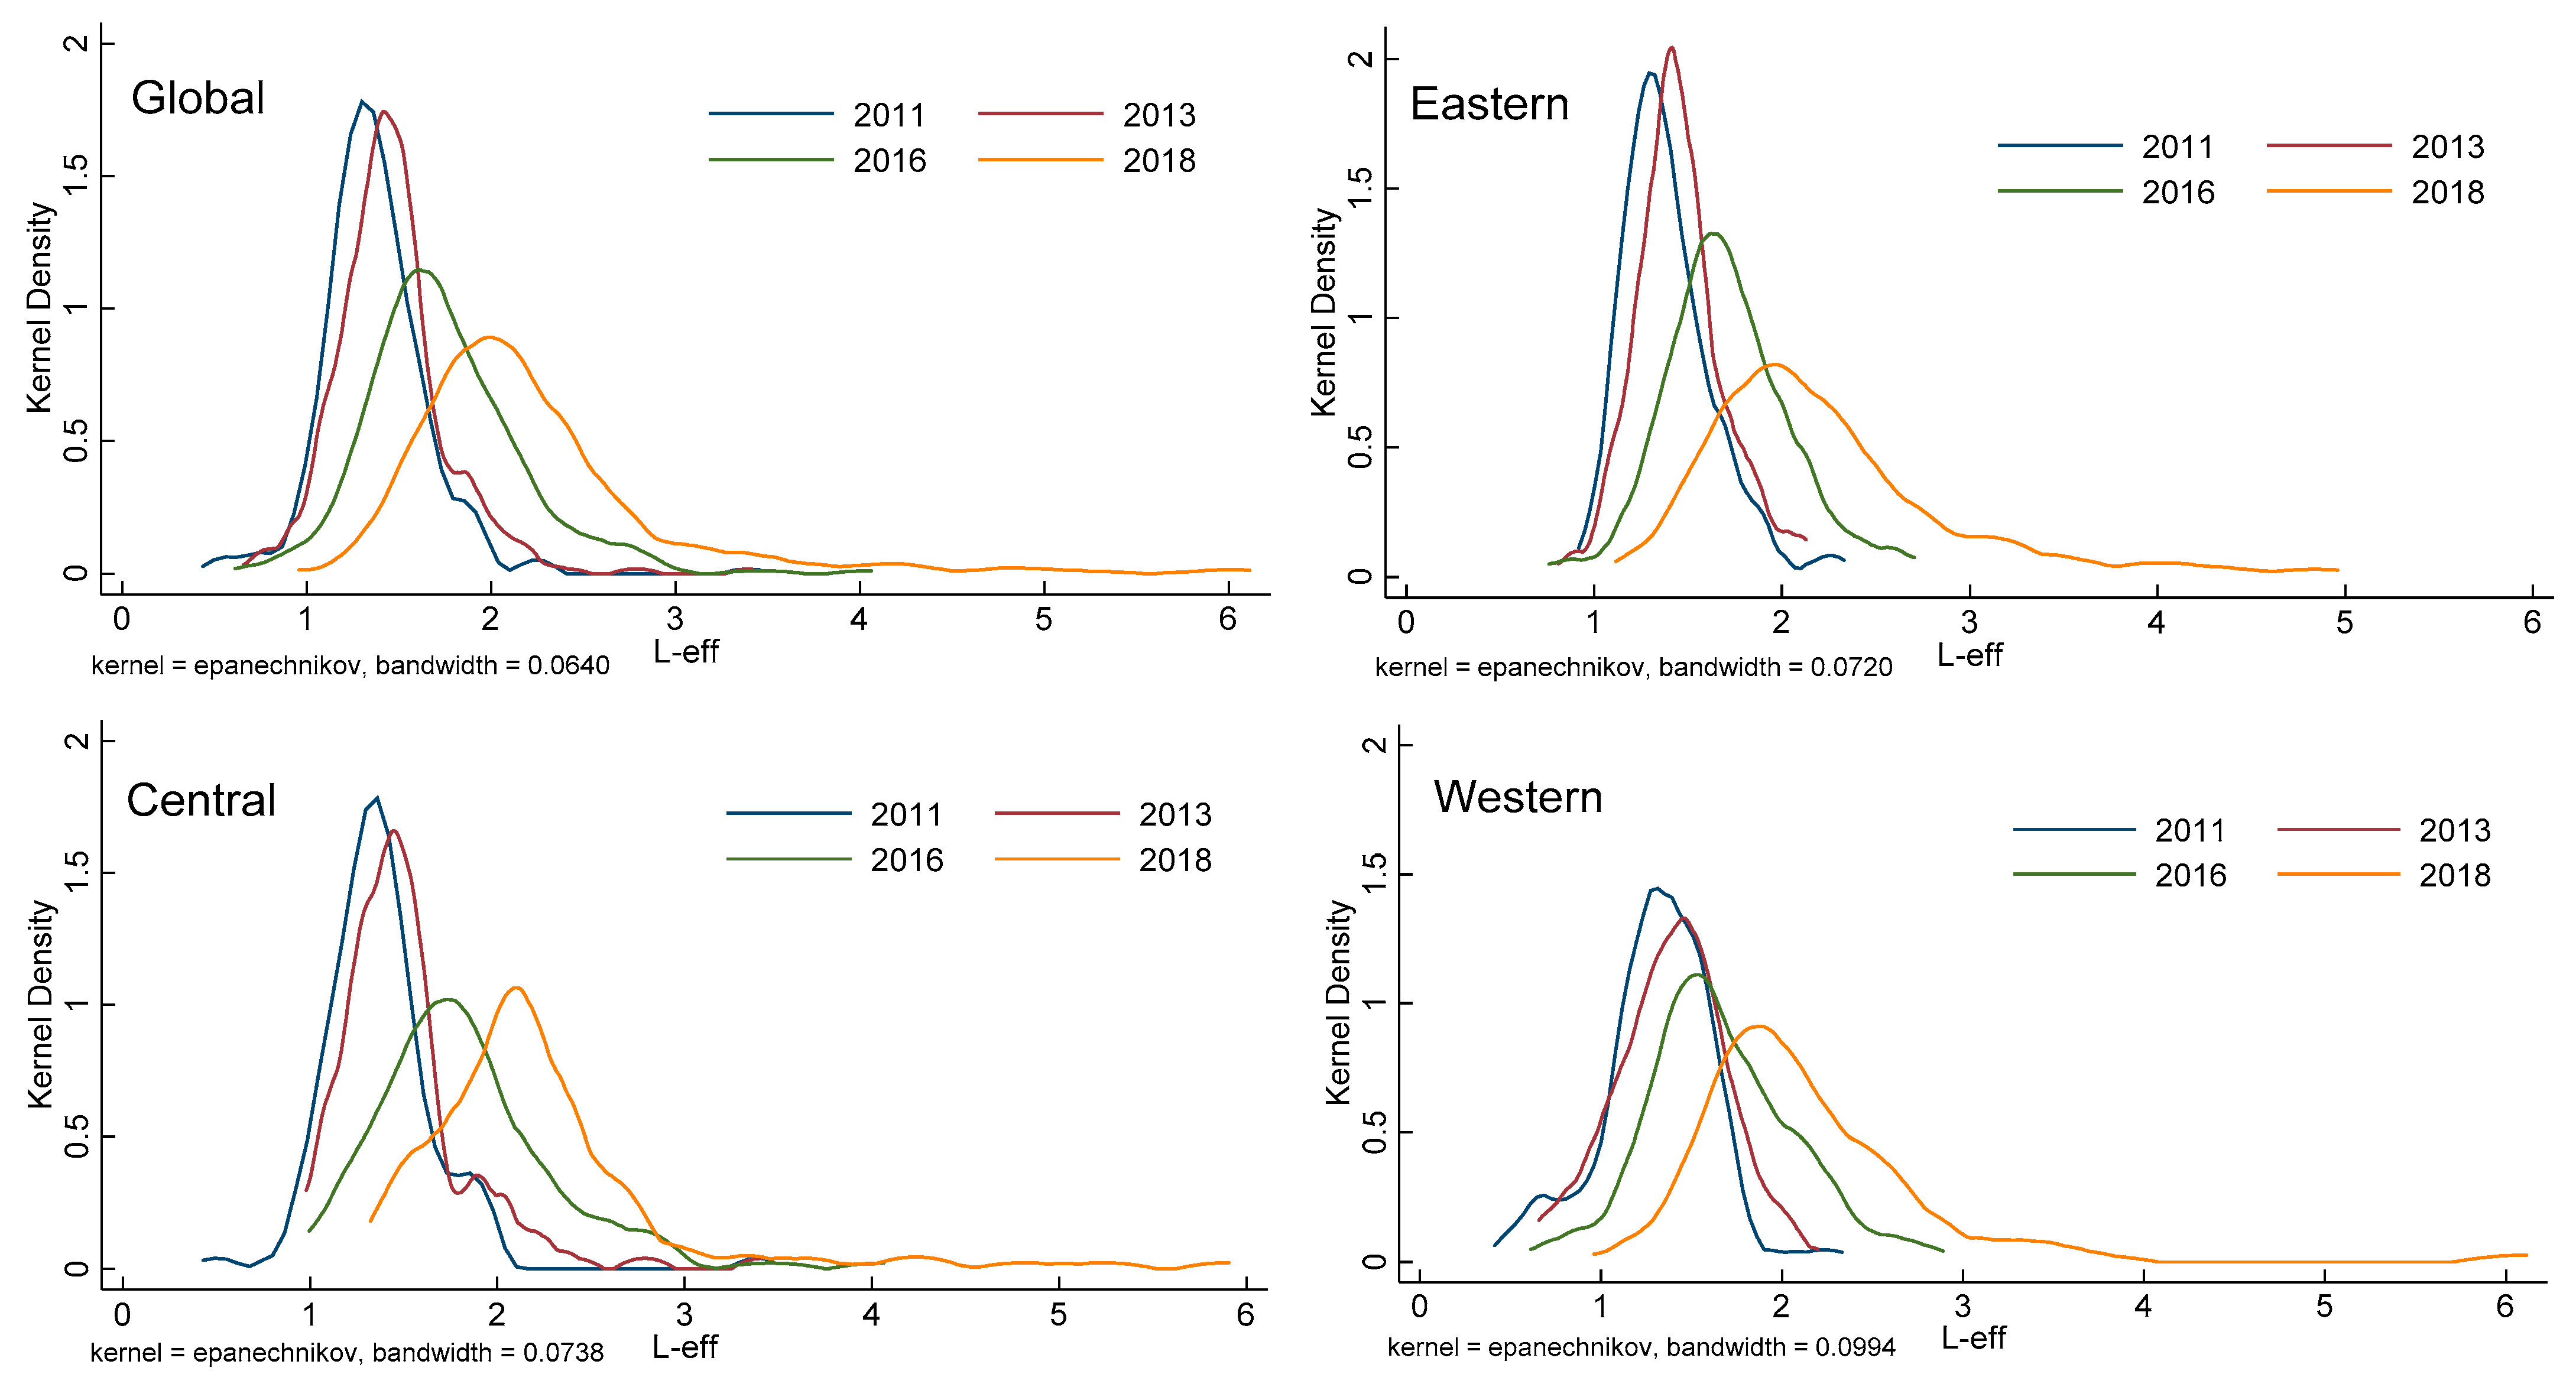
3.1.1. Global Temporal Dynamic Evolution Characteristics
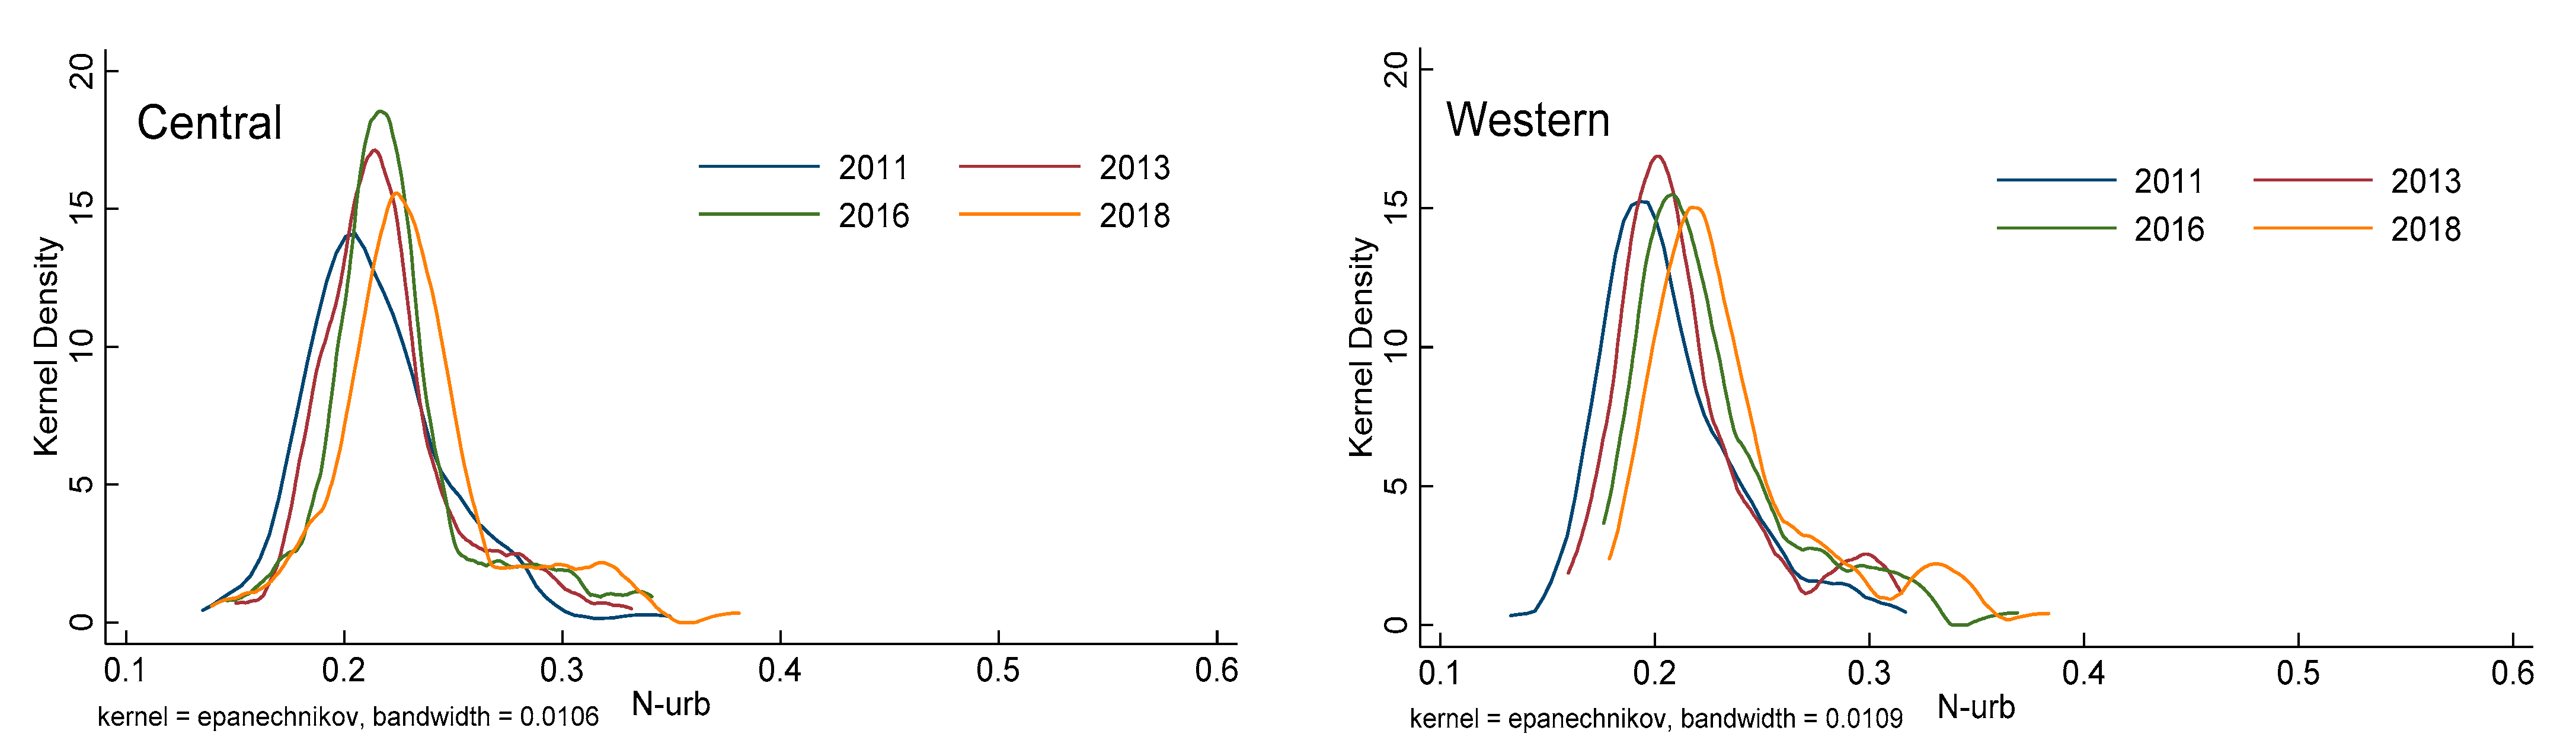
3.1.2. Regional Temporal Dynamic Evolution Characteristics
3.2. Spatial Evolution Characteristics
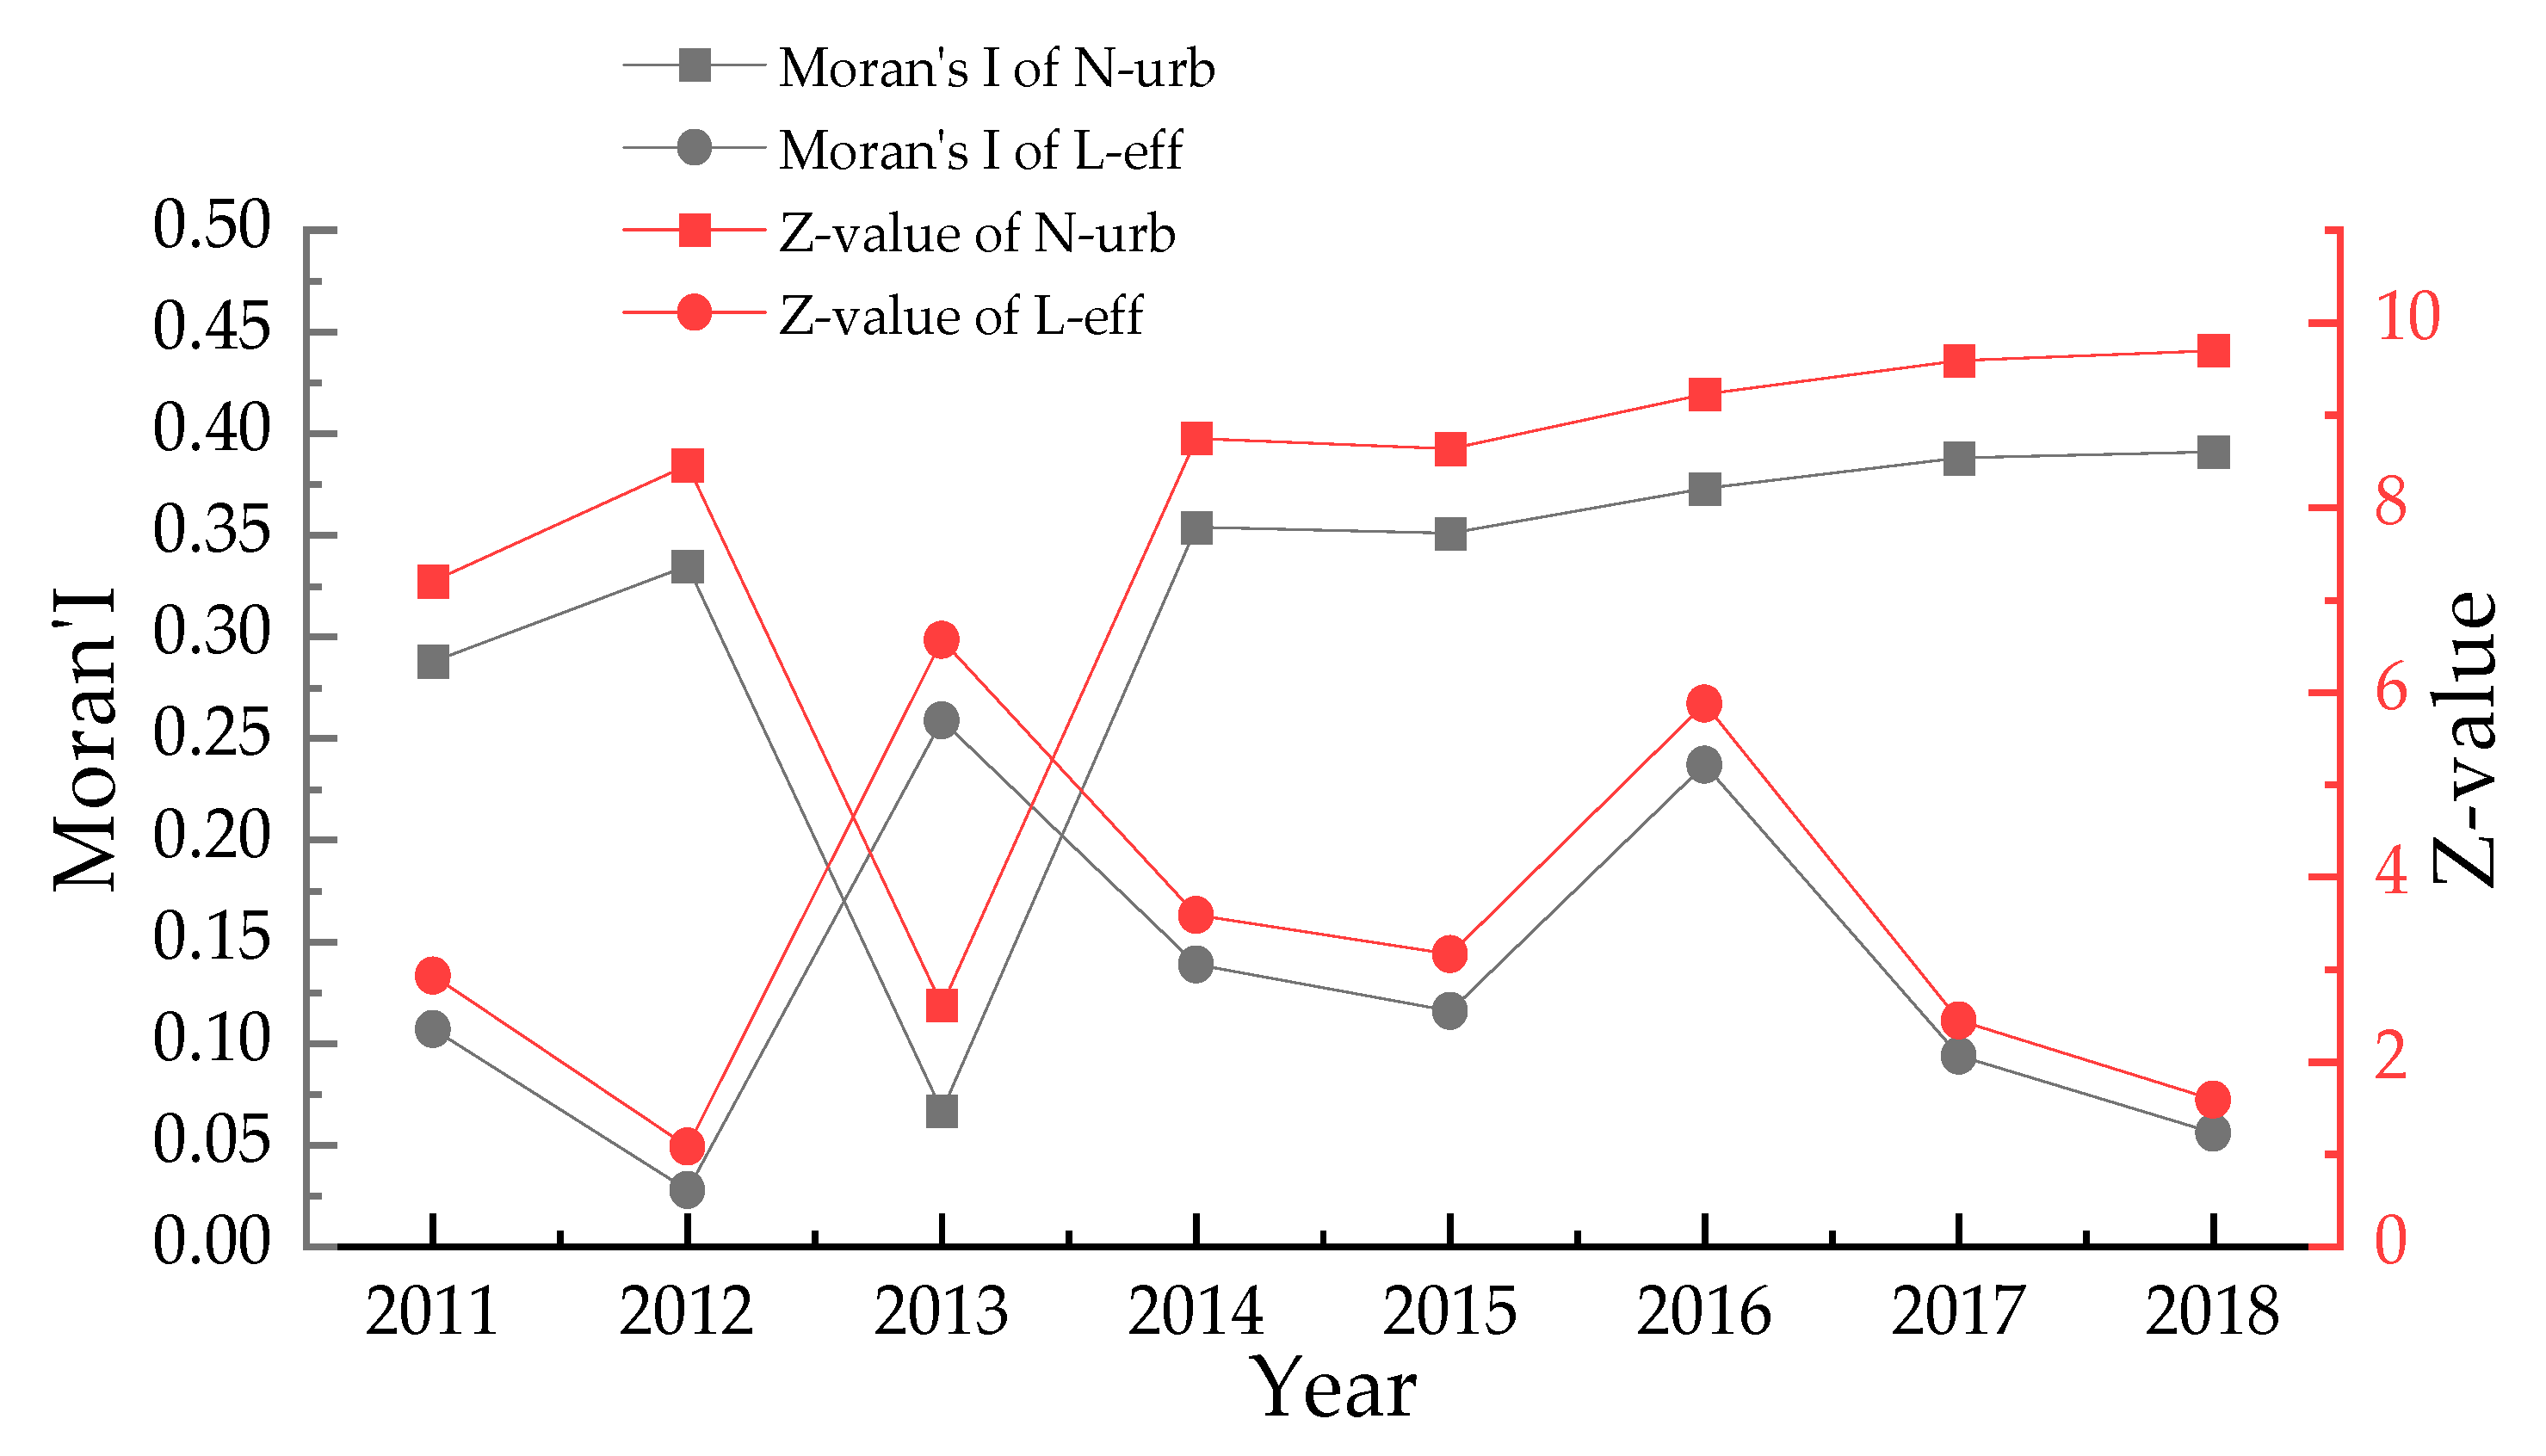
3.2.1. Global Spatial Evolution Characteristics
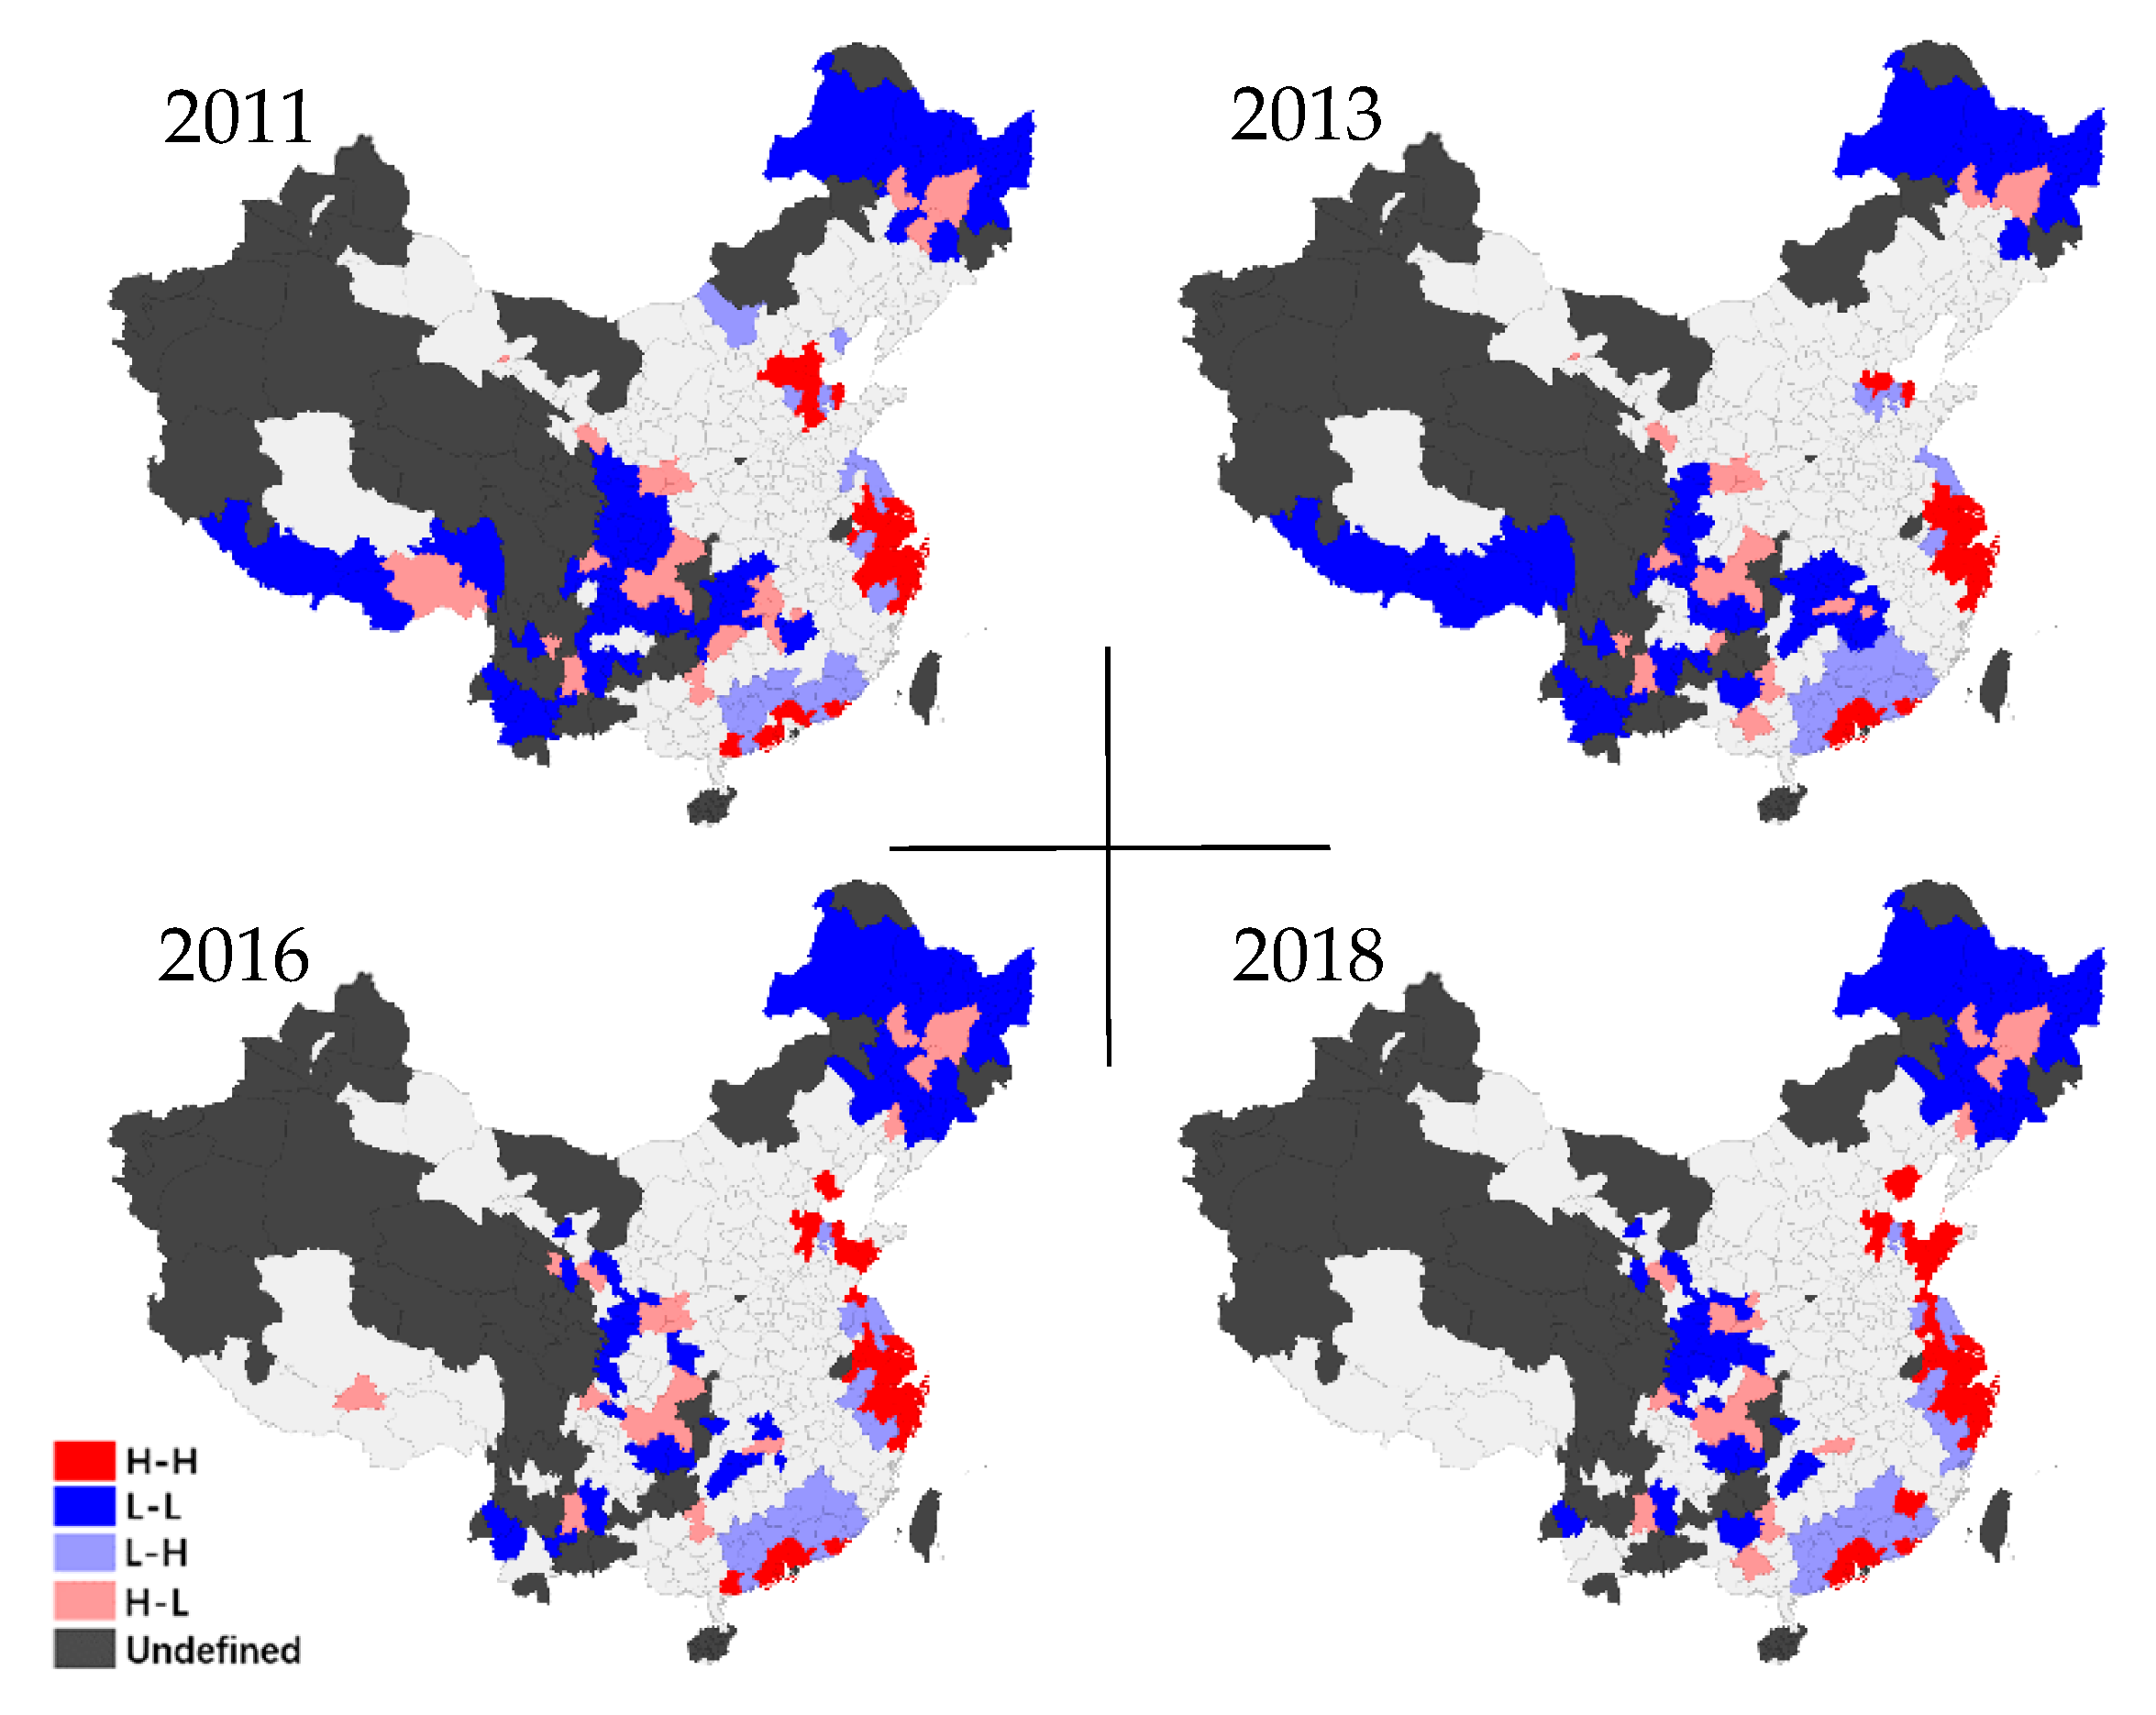
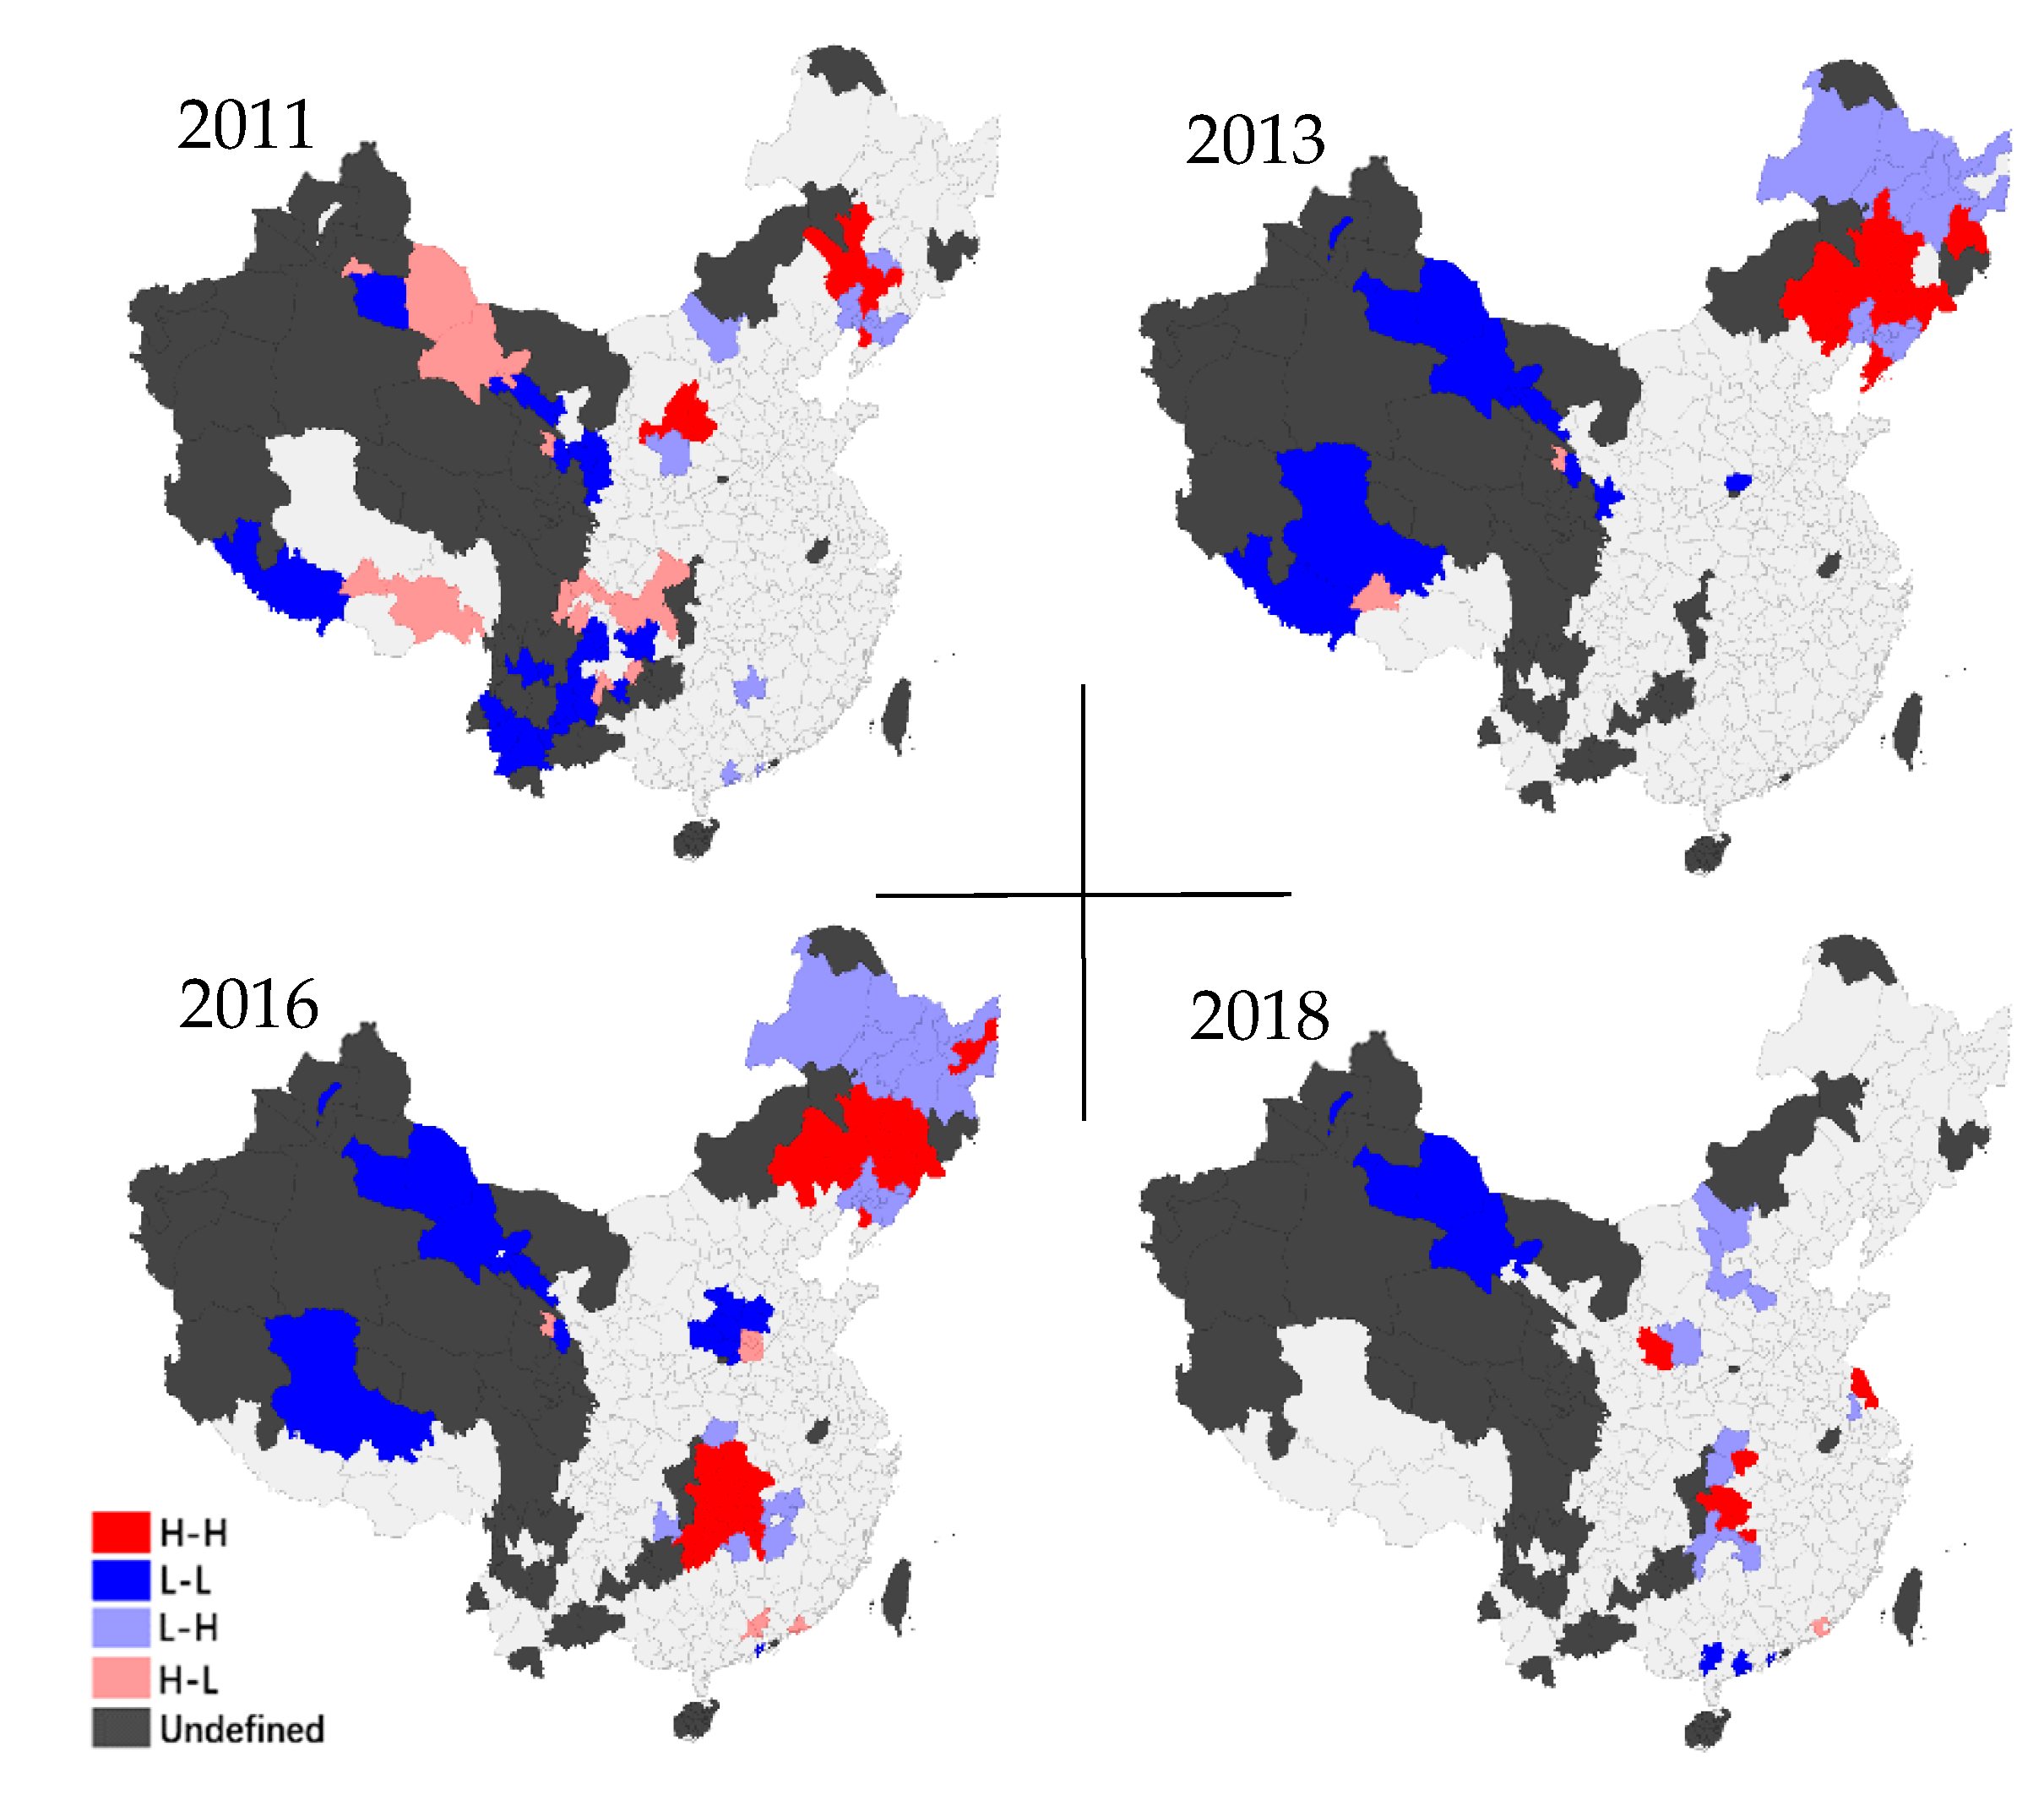
3.2.2. Regional Spatial Evolution Characteristics
4. Spatial Inter-Spillover Effects of the New-Urbanization and the Green Land Utilization Efficiency of Chinese Cities
4.1. Parameter Estimation Results
4.2. Empirical Results Analysis
4.2.1. General Interaction Effect between New-Urbanization and Green Land Utilization Efficiency
4.2.2. Spatial Spillover Effects between New-Urbanization and Green Land Utilization Efficiency
4.2.3. Spatial Interaction between New-Urbanization and Green Land Utilization Efficiency
4.3. Robustness Test
4.3.1. Distance-Band Robustness Test
4.3.2. Robustness Test of Adjusting the Spatial Weighted Matrix Type
5. Conclusions and Implications
Author Contributions
Funding
Institutional Review Board Statement
Informed Consent Statement
Data Availability Statement
Conflicts of Interest
References
- Tang, Y.; Wang, K.; Ji, X.; Xu, H.; Xiao, Y. Assessment and Spatial-Temporal Evolution Analysis of Urban Land Use Efficiency under Green Development Orientation: Case of the Yangtze River Delta Urban Agglomerations. Land 2021, 10, 715. [Google Scholar] [CrossRef]
- Gómez-Baggethun, E.; Gren, Å.; Barton, D.; Langemeyer, J.; McPhearson, T.; O’Farrell, P. Urbanization, Biodiversity and Ecosystem Services: Challenges and Opportunities: A Global Assessment; Springer: Berlin/Heidelberg, Germany, 2013. [Google Scholar]
- Hak, T.; Janoušková, S.; Moldan, B. Sustainable Development Goals: A need for relevant indicators. Ecol. Indic. 2016, 60, 565–573. [Google Scholar] [CrossRef]
- Wei, Y.D.; Ye, X. Urbanization, urban land expansion and environmental change in China. Stoch. Environ. Res. Risk. Assess. 2014, 28, 757–765. [Google Scholar] [CrossRef]
- Li, T.; Ma, J.; Mo, B. Does the Land Market Have an Impact on Green Total Factor Productivity? A Case Study on China. Land 2021, 10, 595. [Google Scholar] [CrossRef]
- Li, Z.; Zou, F.; Tan, Y.; Zhu, J. Does Financial Excess Support Land Urbanization—An Empirical Study of Cities in China. Land 2021, 10, 635. [Google Scholar] [CrossRef]
- d’Amour, C.B.; Reitsma, F.; Baiocchi, G.; Barthel, S.; Guneralp, B.; Erb, K.-H.; Haberl, H.; Creutzig, F.; Seto, K.C. Future urban land expansion and implications for global croplands. Proc. Natl. Acad. Sci. USA 2017, 114, 8939–8944. [Google Scholar] [CrossRef] [PubMed] [Green Version]
- Gorelick, J.; Walmsley, N. The greening of municipal infrastructure investments: Technical assistance, instruments, and city champions. Green Financ. 2020, 2, 114–134. [Google Scholar] [CrossRef]
- Yang, C.; Li, T.; Albitar, K. Does Energy Efficiency Affect Ambient PM2.5? The Moderating Role of Energy Investment. Front. Environ. Sci. 2021, 9, 707751. [Google Scholar] [CrossRef]
- Chen, M.; Liu, W.; Lu, D. Challenges and the way forward in China’s new-type urbanization. Land Use Policy 2016, 55, 334–339. [Google Scholar] [CrossRef]
- Zeng, L.; Wang, J.; Zhang, J.; Sun, Z.; Gonzalez, E.D.S. A path matching model on new urbanization in mineral resource abundant regions. Resour. Policy 2021, 73, 102214. [Google Scholar] [CrossRef]
- Wang, A.; Lin, W.; Liu, B.; Wang, H.; Xu, H. Does Smart City Construction Improve the Green Utilization Efficiency of Urban Land? Land 2021, 10, 657. [Google Scholar] [CrossRef]
- Zhao, J.; Chen, S.; Jiang, B.; Ren, Y.; Wang, H.; Vause, J.; Yu, H. Temporal trend of green space coverage in China and its relationship with urbanization over the last two decades. Sci. Total Environ. 2012, 442, 455–465. [Google Scholar] [CrossRef] [PubMed]
- Lin, S.-W.; Ben, T.-M. Impact of government and industrial agglomeration on industrial land prices: A Taiwanese case study. Habitat Int. 2009, 33, 412–418. [Google Scholar] [CrossRef]
- Huang, X.; Li, Y.; Yu, R.; Zhao, X. Reconsidering the controversial land use policy of” linking the decrease in rural construction land with the increase in urban construction land”: A local government perspective. China Rev. 2014, 175–198. [Google Scholar]
- Alberti, M. The Effects of Urban Patterns on Ecosystem Function. Int. Reg. Sci. Rev. 2005, 28, 168–192. [Google Scholar] [CrossRef]
- Liu, Y.; Yao, C.; Wang, G.; Bao, S. An integrated sustainable development approach to modeling the eco-environmental effects from urbanization. Ecol. Indic. 2011, 11, 1599–1608. [Google Scholar] [CrossRef]
- Bajocco, S.; De Angelis, A.; Perini, L.; Ferrara, A.; Salvati, L. The Impact of Land Use/Land Cover Changes on Land Degradation Dynamics: A Mediterranean Case Study. Environ. Manag. 2012, 49, 980–989. [Google Scholar] [CrossRef]
- Tian, Z.; Cao, G.; Shi, J.; McCallum, I.; Cui, L.; Fan, D.; Li, X. Urban transformation of a metropolis and its environmental impacts. Environ. Sci. Pollut. Res. 2012, 19, 1364–1374. [Google Scholar] [CrossRef] [PubMed]
- Yang, H.; Flower, R.J.; Thompson, J.R. Sustaining China’s Water Resources. Science 2013, 339, 141. [Google Scholar] [CrossRef] [PubMed]
- Di-fang, H. Empirical Analysis of the Economic Growth and Environmental Quality Under the Influence of Industrialization and Urbanization. In Based on Panel Data. China Population, Resources And Environment; CNIK: Beijing, China, 2011; p. S2. [Google Scholar]
- Zhao, J.J.; Shi, X.C.; Wang, K.L.; Yu, W.H.; Yin, H.C. The Influence of Land Intensive Use and Urbanization to Air Pollution: Evidence from China. IOP Conf. Ser. Earth Environ. Sci. 2017, 94, 12139. [Google Scholar] [CrossRef]
- Long, H.; Liu, Y.; Hou, X.; Li, T.; Li, Y. Effects of land use transitions due to rapid urbanization on ecosystem services: Implications for urban planning in the new developing area of China. Habitat Int. 2014, 44, 536–544. [Google Scholar] [CrossRef]
- Song, W.; Deng, X. Land-use/land-cover change and ecosystem service provision in China. Sci. Total Environ. 2016, 576, 705–719. [Google Scholar] [CrossRef]
- Qiu, L.; Pan, Y.; Zhu, J.; Amable, G.S.; Xu, B. Integrated analysis of urbanization-triggered land use change trajectory and implications for ecological land management: A case study in Fuyang, China. Sci. Total Environ. 2018, 660, 209–217. [Google Scholar] [CrossRef]
- Liu, Y.; Huang, X.; Yang, H.; Zhong, T. Environmental effects of land-use/cover change caused by urbanization and policies in Southwest China Karst area—A case study of Guiyang. Habitat Int. 2014, 44, 339–348. [Google Scholar] [CrossRef]
- Ouyang, X.; Tang, L.; Wei, X.; Li, Y. Spatial interaction between urbanization and ecosystem services in Chinese urban agglomerations. Land Use Policy 2021, 109, 105587. [Google Scholar] [CrossRef]
- Wang, Z.; Xu, M.; Lin, H.; Qureshi, S.; Cao, A.; Ma, Y. Understanding the dynamics and factors affecting cultural ecosystem services during urbanization through spatial pattern analysis and a mixed-methods approach. J. Clean. Prod. 2020, 279, 123422. [Google Scholar] [CrossRef]
- Zhang, P.; Pan, J.; Xie, L.; Zhou, T.; Bai, H.; Zhu, Y. Spatial–Temporal Evolution and Regional Differentiation Features of Urbanization in China from 2003 to 2013. ISPRS Int. J. Geo-Inf. 2019, 8, 31. [Google Scholar] [CrossRef] [Green Version]
- Kuang, W.; Chi, W.; Lu, D.; Dou, Y. A comparative analysis of megacity expansions in China and the US: Patterns, rates and driving forces. Landsc. Urban. Plan. 2014, 132, 121–135. [Google Scholar] [CrossRef]
- Yang, C.; Li, Q.; Hu, Z.; Chen, J.; Shi, T.; Ding, K.; Wu, G. Spatiotemporal evolution of urban agglomerations in four major bay areas of US, China and Japan from 1987 to 2017: Evidence from remote sensing images. Sci. Total Environ. 2019, 671, 232–247. [Google Scholar] [CrossRef] [PubMed]
- Xu, J.; Huang, D.; He, Z.; Zhu, Y. Research on the Structural Features and Influential Factors of the Spatial Network of China’s Regional Ecological Efficiency Spillover. Sustainability 2020, 12, 3137. [Google Scholar] [CrossRef] [Green Version]
- Yue, L.; Xue, D.; Draz, M.U.; Ahmad, F.; Li, J.; Shahzad, F.; Ali, S. The Double-Edged Sword of Urbanization and Its Nexus with Eco-Efficiency in China. Int. J. Environ. Res. Public Health 2020, 17, 446. [Google Scholar] [CrossRef] [Green Version]
- Sun, Z.Q.; Sun, T. FINANCIAL DEVELOPMENT, INDUSTRIAL STRUCTURE OPTIMIZATION, AND ECO-EFFICIENCY PROMOTION. Fresenius Environ. Bull. 2019, 28, 6231–6238. [Google Scholar]
- Chen, C.; Sun, Y.; Lan, Q.; Jiang, F. Impacts of industrial agglomeration on pollution and ecological efficiency-A spatial econometric analysis based on a big panel dataset of China’s 259 cities. J. Clean. Prod. 2020, 258, 120721. [Google Scholar] [CrossRef]
- Ren, W.Z.; Zhang, Z.L.; Wang, Y.J.; Xue, B.; Chen, X.P. Measuring Regional Eco-Efficiency in China (2003–2016): A “Full World” Perspective and Network Data Envelopment Analysis. Int. J. Environ. Res. Public Health 2020, 17, 3456. [Google Scholar] [CrossRef]
- Liao, G.; Drakeford, B.M. An analysis of financial support, technological progress and energy efficiency:evidence from China. Green Financ. 2019, 1, 174–187. [Google Scholar] [CrossRef]
- Wen, F.; Li, C.; Sha, H.; Shao, L. How does economic policy uncertainty affect corporate risk-taking? Evidence from China. Financ. Res. Lett. 2020, 41, 101840. [Google Scholar] [CrossRef]
- Zellner, A.; Theil, H. Three-Stage Least Squares: Simultaneous Estimation of Simultaneous Equations. Econometrica 1962, 30, 54. [Google Scholar] [CrossRef]
- Su, Y.; Li, Z.; Yang, C. Spatial Interaction Spillover Effects between Digital Financial Technology and Urban Ecological Efficiency in China: An Empirical Study Based on Spatial Simultaneous Equations. Int. J. Environ. Res. Public Health 2021, 18, 8535. [Google Scholar] [CrossRef]
- Zhou, D.; Xu, J.; Wang, L.; Lin, Z. Assessing urbanization quality using structure and function analyses: A case study of the urban agglomeration around Hangzhou Bay (UAHB), China. Habitat Int. 2015, 49, 165–176. [Google Scholar] [CrossRef]
- Shakouri, R.; Salahi, M.; Kordrostami, S. Stochastic p-robust approach to two-stage network DEA model. Quant. Financ. Econ. 2019, 3, 315–346. [Google Scholar] [CrossRef]
- Demirtaş, Y.E.; Keçeci, N.F. The efficiency of private pension companies using dynamic data envelopment analysis. Quant. Financ. Econ. 2020, 4, 204–219. [Google Scholar] [CrossRef]
- Charnes, A.; Cooper, W.W.; Rhodes, E. Measuring the effificiency of decision making units. Eur. J. Oper. Res. 1978, 2, 429–444. [Google Scholar] [CrossRef]
- Li, T.; Huang, Z.; Drakeford, B.M. Statistical measurement of total factor productivity under resource and environmental constraints. Natl. Account. Rev. 2019, 1, 16–27. [Google Scholar] [CrossRef]
- Zheng, Y.; Chen, S.; Wang, N. Does financial agglomeration enhance regional green economy development? Evidence from China. Green Financ. 2020, 2, 173–196. [Google Scholar] [CrossRef]
- Tone, K. A slacks-based measure of efficiency in data envelopment analysis. Eur. J. Oper. Res. 2001, 130, 498–509. [Google Scholar] [CrossRef] [Green Version]
- Tone, K. A slacks-based measure of super-efficiency in data envelopment analysis. Eur. J. Oper. Res. 2002, 143, 32–41. [Google Scholar] [CrossRef] [Green Version]
- Malmquist, S. Index numbers and indifference surfaces. Trab. de Estad. 1953, 4, 209–242. [Google Scholar] [CrossRef]
- Caves, D.W.; Christensen, L.R.; Diewert, W.E. The Economic Theory of Index Numbers and the Measurement of Input, Output, and Productivity. Econometrica 1982, 50, 1393. [Google Scholar] [CrossRef]
- Oh, D.-H. A global Malmquist-Luenberger productivity index. J. Prod. Anal. 2010, 34, 183–197. [Google Scholar] [CrossRef]
- Tuzcuoğlu, T. The impact of financial fragility on firm performance: An analysis of BIST companies. Quant. Financ. Econ. 2020, 4, 310–342. [Google Scholar] [CrossRef]
- Matei, I. Is financial development good for economic growth? Empirical insights from emerging European countries. Quant. Financ. Econ. 2020, 4, 653–678. [Google Scholar] [CrossRef]
- Yao, Y.; Hu, D.; Yang, C.; Tan, Y. The impact and mechanism of fintech on green total factor productivity. Green Financ. 2021, 3, 198–221. [Google Scholar] [CrossRef]
- Anselin, L.; Syabri, I.; Kho, Y. GeoDa: An Introduction to Spatial Data Analysis. Geogr. Anal. 2005, 38, 5–22. [Google Scholar] [CrossRef]
- Moran, P.A.P. Notes on continuous stochastic phenomena. Biometrika 1950, 37, 17–23. [Google Scholar] [CrossRef]
- Li, H.; Calder, C.; Cressie, N. Beyond Moran’s I: Testing for Spatial Dependence Based on the Spatial Autoregressive Model. Geogr. Anal. 2007, 39, 357–375. [Google Scholar] [CrossRef]


| Primary Indicator | Secondary Indicator | Weight |
|---|---|---|
| Population urbanization (0.20991) | The proportion of urban population | 0.04797 |
| The proportion of urban population (negative indicator) | 0.05940 | |
| Urban population density | 0.04633 | |
| The proportion of employees in the tertiary industry | 0.05619 | |
| Economy urbanization (0.27383) | GDP per capita | 0.04925 |
| The proportion of the total output value of the secondary industry in GDP | 0.05700 | |
| The proportion of total output value of secondary and tertiary industries in GDP | 0.04871 | |
| Public revenue | 0.01882 | |
| Per capita disposable income of urban residents | 0.05367 | |
| Total retail sales of consumer goods per capita | 0.04634 | |
| Land urbanization (0.13700) | The proportion of built-up area | 0.01977 |
| Urban road area per capita | 0.05150 | |
| Green area per capita | 0.02731 | |
| Per capita real estate and residential investment | 0.03840 | |
| Society urbanization (0.37926) | The proportion of education expenditure in financial expenditure | 0.04337 |
| The proportion of expenditure on science and technology in government expenditure | 0.05816 | |
| Public transport vehicles per 10,000 people | 0.02817 | |
| Per capita public library collection | 0.03191 | |
| Number of doctors per 1000 people | 0.05412 | |
| Number of secondary schools and primary schools | 0.04731 | |
| Number of full-time teachers in secondary and primary schools | 0.05015 | |
| Per capita water supply | 0.02670 | |
| Per capita electricity consumption | 0.02720 | |
| Per capita gas supply | 0.01213 |
| Primary Indicator | Secondary Indicator | Tertiary Indicator |
|---|---|---|
| Input indicator | Capital | Fixed-assets investment |
| Labor | Total employees | |
| Land | Built-up area | |
| Energy | Total energy consumption | |
| Output indicator | Desired output | GDP |
| Undesired output | Wastewater discharge | |
| Exhaust gas emission | ||
| Soot emission |
| Variable | Abbr. | Source |
|---|---|---|
| New-urbanization | N-urb | Entropy weight method |
| Green land utilization efficiency | L-eff | DEA Analysis |
| Openness degree | ope | China City Statistical Yearbook |
| Transport development level | tra | China City Statistical Yearbook |
| Capitalization degree | com | Wind |
| Capital allocation efficiency | cap | DEA Analysis |
| Innovation level | inv | CNRDS |
| Import and export trade volume | m&x | Statistical Yearbook of each city |
| centrality of scientific research personnel | rd | Social Network Analysis |
| Unit | Items | Summary | Eastern | Central | Western | 2011–2014 | 2015–2018 | |
|---|---|---|---|---|---|---|---|---|
| N | - | - | 2376 | 904 | 896 | 576 | 1188 | 1188 |
| N-urb | - | Mean Std | 0.235 0.049 | 0.254 0.060 | 0.223 0.034 | 0.222 0.037 | 0.227 0.044 | 0.242 0.052 |
| L-eff | - | Mean Std | 1.660 0.528 | 1.652 0.470 | 1.702 0.541 | 1.608 0.584 | 1.445 0.364 | 1.876 0.576 |
| ope | ratio | Mean Std | 0.019 0.027 | 0.019 0.019 | 0.026 0.036 | 0.005 0.011 | 0.017 0.017 | 0.020 0.034 |
| tra | ratio | Mean Std | 2.740 0.784 | 2.715 0.867 | 2.660 0.713 | 2.904 0.728 | 2.954 0.769 | 2.527 0.740 |
| com | - | Mean Std | 0 1 | 0.320 0.789 | −0.064 0.967 | −0.402 1.168 | −0.062 1.000 | 0.062 0.996 |
| cap | ratio | Mean Std | 0 1 | 0.100 1.024 | 0.050 0.916 | −0.235 1.048 | −0.528 0.821 | 0.528 0.875 |
| inv | Ln(n + 1) | Mean Std | 4.722 1.864 | 5.663 1.743 | 4.423 1.524 | 3.712 1.848 | 4.297 1.791 | 5.148 1.839 |
| m&x | ratio | Mean Std | 0.229 0.648 | 0.482 0.990 | 0.081 0.115 | 0.062 0.123 | 0.256 0.746 | 0.201 0.532 |
| rd | - | Mean Std | 0.043 0.146 | 0.043 0.152 | 0.038 0.112 | 0.050 0.178 | 0.044 0.164 | 0.042 0.124 |
| Items | Explained Variable: N-urb | Explained Variable: L-eff | ||||
|---|---|---|---|---|---|---|
| (1) | (2) | (3) | (4) | (5) | (6) | |
| N-urb | - | - | - | 1.799 *** (8.30) | 3.031 *** (8.99) | 8.904 *** (12.58) |
| L-eff | 0.016 *** (8.30) | 0.011 *** (8.99) | 0.008 *** (12.58) | - | - | - |
| ope | - | −0.084 *** (−3.57) | −0.016 (−1.49) | - | 1.989 *** (5.06) | 0.821 ** (2.29) |
| tra | - | 0.003 *** (3.63) | −0.002 *** (−3.93) | - | −0.074 *** (−5.16) | −0.121 *** (−6.76) |
| com | - | 0.003 *** (4.36) | 0.003 ** (2.20) | - | −0.031 ** (−2.36) | 0.115 *** (2.85) |
| cap | - | −0.003 *** (−4.18) | 0.003 *** (6.42) | - | 0.089 *** (7.75) | 0.027 ** (2.01) |
| inv | - | 0.013 *** (26.74) | 0.006 *** (11.19) | - | −0.004 (−0.44) | 0.143 *** (7.39) |
| m&x | - | 0.030 *** (27.50) | −0.010 *** (−7.06) | - | −0.108 *** (−5.25) | 0.187 *** (3.91) |
| rd | - | 0.008 ** (1.99) | 0.003 ** (2.05) | - | −0.097 (−1.38) | −0.075 (−1.38) |
| Cons | 0.209 | 0.141 | 0.200 | 1.238 | 1.163 | −0.832 |
| N | 2376 | 2376 | 2376 | 2376 | 2376 | 2376 |
| FE | No | No | Yes | No | No | Yes |
| R2 | 0.0282 | 0.6307 | 0.4119 | 0.0282 | 0.1053 | 0.3097 |
| F | 68.83 *** | 505.27 *** | 181.33 *** | 68.83 *** | 34.81 *** | 116.12 *** |
| Items | Explained Variable: N-urb | Explained Variable: L-eff |
|---|---|---|
| (1) | (2) | |
| N-urb | 0.940 *** (4.00) | 2.173 * (1.65) |
| L-eff | 0.106 *** (4.27) | 1.037 *** (21.53) |
| N-urb | - | −5.298 *** (−7.80) |
| L-eff | −0.109 *** (−4.94) | - |
| ope | 0.031 (0.89) | 0.382 (1.25) |
| tra | 0.008 *** (4.96) | 0.047 *** (3.87) |
| com | 0.002 * (1.82) | 0.011 (0.89) |
| cap | −0.004 *** (−4.19) | −0.021 ** (−2.49) |
| inv | 0.014 *** (18.43) | 0.081 *** (7.76) |
| m&x | 0.024 *** (13.08) | 0.128 *** (4.97) |
| rd | 0.001 (0.17) | −0.006 (−0.10) |
| Cons | −0.082 | 0.117 |
| N | 2376 | 2376 |
| R2 | 0.9295 | 0.9309 |
| F | 4974.16 *** | 3482.31 *** |
| Items | ||||
|---|---|---|---|---|
| Explained Variable: N-urb | Explained Variable: L-eff | Explained Variable: N-urb | Explained Variable: L-eff | |
| (1) | (2) | (3) | (4) | |
| N-urb | 0.525 ** (2.37) | 2.325 * (1.66) | 1.071 *** (5.26) | 1.111 (0.69) |
| L-eff | 0.119 *** (4.24) | 1.019 *** (23.53) | 0.063 *** (2.65) | 1.060 *** (20.35) |
| N-urb | - | −5.472 *** (−12.93) | - | −4.538 *** (−4.26) |
| L-eff | −0.141 *** (−6.63) | - | −0.070 *** (−3.20) | - |
| ope | 0.071 *** (1.54) | 0.491 (1.60) | 0.008 (0.26) | 0.622 * (1.82) |
| tra | 0.010 *** (5.21) | 0.056 *** (4.47) | 0.008 *** (5.64) | 0.050 *** (3.68) |
| com | 0.003 * (1.70) | 0.013 (1.08) | 0.002 *** (2.65) | 0.008 (0.69) |
| cap | −0.004 *** (−3.17) | −0.020 *** (−2.58) | −0.005 *** (−5.61) | −0.019 * (−1.78) |
| inv | 0.014 *** (14.39) | 0.078 *** (9.23) | 0.014 *** (21.81) | 0.071 *** (4.85) |
| m&x | 0.024 *** (10.79) | 0.129 *** (6.29) | 0.024 *** (16.31) | 0.108 *** (3.17) |
| rd | 0.001 (0.13) | 0.002 (0.03) | 0.003 (0.50) | −0.022 (−0.34) |
| Cons | 0.049 | 0.138 | −0.104 | 0.192 |
| N | 2376 | 2376 | 2376 | 2376 |
| R2 | 0.1519 | 0.9523 | 0.9786 | 0.9338 |
| F | 356.09 *** | 5124.91 *** | 15989.13 *** | 3518.62 *** |
| Items | (Qualitative Weight Matrix) | (Qualitative Weight Matrix) | (Qualitative Weight Matrix) | |||
|---|---|---|---|---|---|---|
| Explained Variable: N-urb | Explained Variable: L-eff | Explained Variable: N-urb | Explained Variable: L-eff | Explained Variable: N-urb | Explained Variable: L-eff | |
| (1) | (2) | (3) | (4) | (5) | (6) | |
| N-urb | 0.240 (0.91) | 1.586 (0.52) | 0.276 (0.78) | 4.815 * (1.58) | 1.550 *** (6.23) | 11.301 *** (3.15) |
| L-eff | 0.097 *** (−0.91) | 1.141 *** (13.69) | 0.107 *** (8.07) | 1.081 *** (12.94) | 0.039 *** (3.07) | 0.894 *** (10.00) |
| N-urb | - | −7.977 *** (−13.31) | - | −8.816 *** (−16.90) | - | −8.040 *** (−7.57) |
| L-eff | −0.069*** (−6.81) | - | −0.090 *** (−11.31) | - | −0.057 *** (−5.67) | - |
| ope | 0.001 (0.03) | 0.464 (1.36) | 0.036 (1.06) | 0.437 (1.29) | −0.021 (−0.74) | 0.444 (1.27) |
| tra | 0.007 *** (6.64) | 0.076 *** (5.63) | 0.008 *** (6.11) | 0.073 *** (5.48) | 0.007 *** (6.48) | 0.069 *** (4.95) |
| com | 0.003 *** (3.09) | 0.022 * (1.83) | 0.003 *** (6.11) | 0.026 ** (2.16) | 0.003 *** (3.92) | 0.024 * (1.91) |
| cap | −0.002 ** (−1.98) | −0.028 ** (−2.23) | −0.005 *** (−4.29) | −0.042 *** (−3.51) | −0.007 *** (−7.67) | −0.054 *** (−3.87) |
| inv | −0.002 *** (22.34) | 0.108 *** (10.42) | 0.014 *** (20.09) | 0.124 *** (12.40) | 0.014 *** (24.63) | 0.115 *** (7.33) |
| m&x | 0.028 *** (21.36) | 0.213 *** (8.78) | 0.027 *** (18.24) | 0.238 *** (10.54) | 0.028 *** (23.29) | 0.216 *** (6.07) |
| rd | 0.005 (0.92) | 0.014 (0.22) | 0.003 (0.53) | 0.016 (0.25) | 0.005 (0.99) | 0.006 (0.09) |
| Cons | 0.156 | 0.480 | 0.048 | −0.047 | −0.188 | −1.381 |
| N | 2376 | 2376 | 2376 | 2376 | 2376 | 2376 |
| R2 | 0.9838 | 0.9698 | 0.9589 | 0.9729 | 0.9900 | 0.9768 |
| F | 21611.99 *** | 9652.20 *** | 8485.45 *** | 11001.47 *** | 33120.49 *** | 12386.61 *** |
Publisher’s Note: MDPI stays neutral with regard to jurisdictional claims in published maps and institutional affiliations. |
© 2021 by the authors. Licensee MDPI, Basel, Switzerland. This article is an open access article distributed under the terms and conditions of the Creative Commons Attribution (CC BY) license (https://creativecommons.org/licenses/by/4.0/).
Share and Cite
Wang, S.; Yang, C.; Li, Z. Spatio-Temporal Evolution Characteristics and Spatial Interaction Spillover Effects of New-Urbanization and Green Land Utilization Efficiency. Land 2021, 10, 1105. https://doi.org/10.3390/land10101105
Wang S, Yang C, Li Z. Spatio-Temporal Evolution Characteristics and Spatial Interaction Spillover Effects of New-Urbanization and Green Land Utilization Efficiency. Land. 2021; 10(10):1105. https://doi.org/10.3390/land10101105
Chicago/Turabian StyleWang, Shuai, Cunyi Yang, and Zhenghui Li. 2021. "Spatio-Temporal Evolution Characteristics and Spatial Interaction Spillover Effects of New-Urbanization and Green Land Utilization Efficiency" Land 10, no. 10: 1105. https://doi.org/10.3390/land10101105