
Using Particle Swarm Optimization with Backpropagation Neural Networks and Analytic Hierarchy Process to Optimize the Power Generation Performance of Enhanced Geothermal System (EGS)

Abstract
:1. Introduction
Background
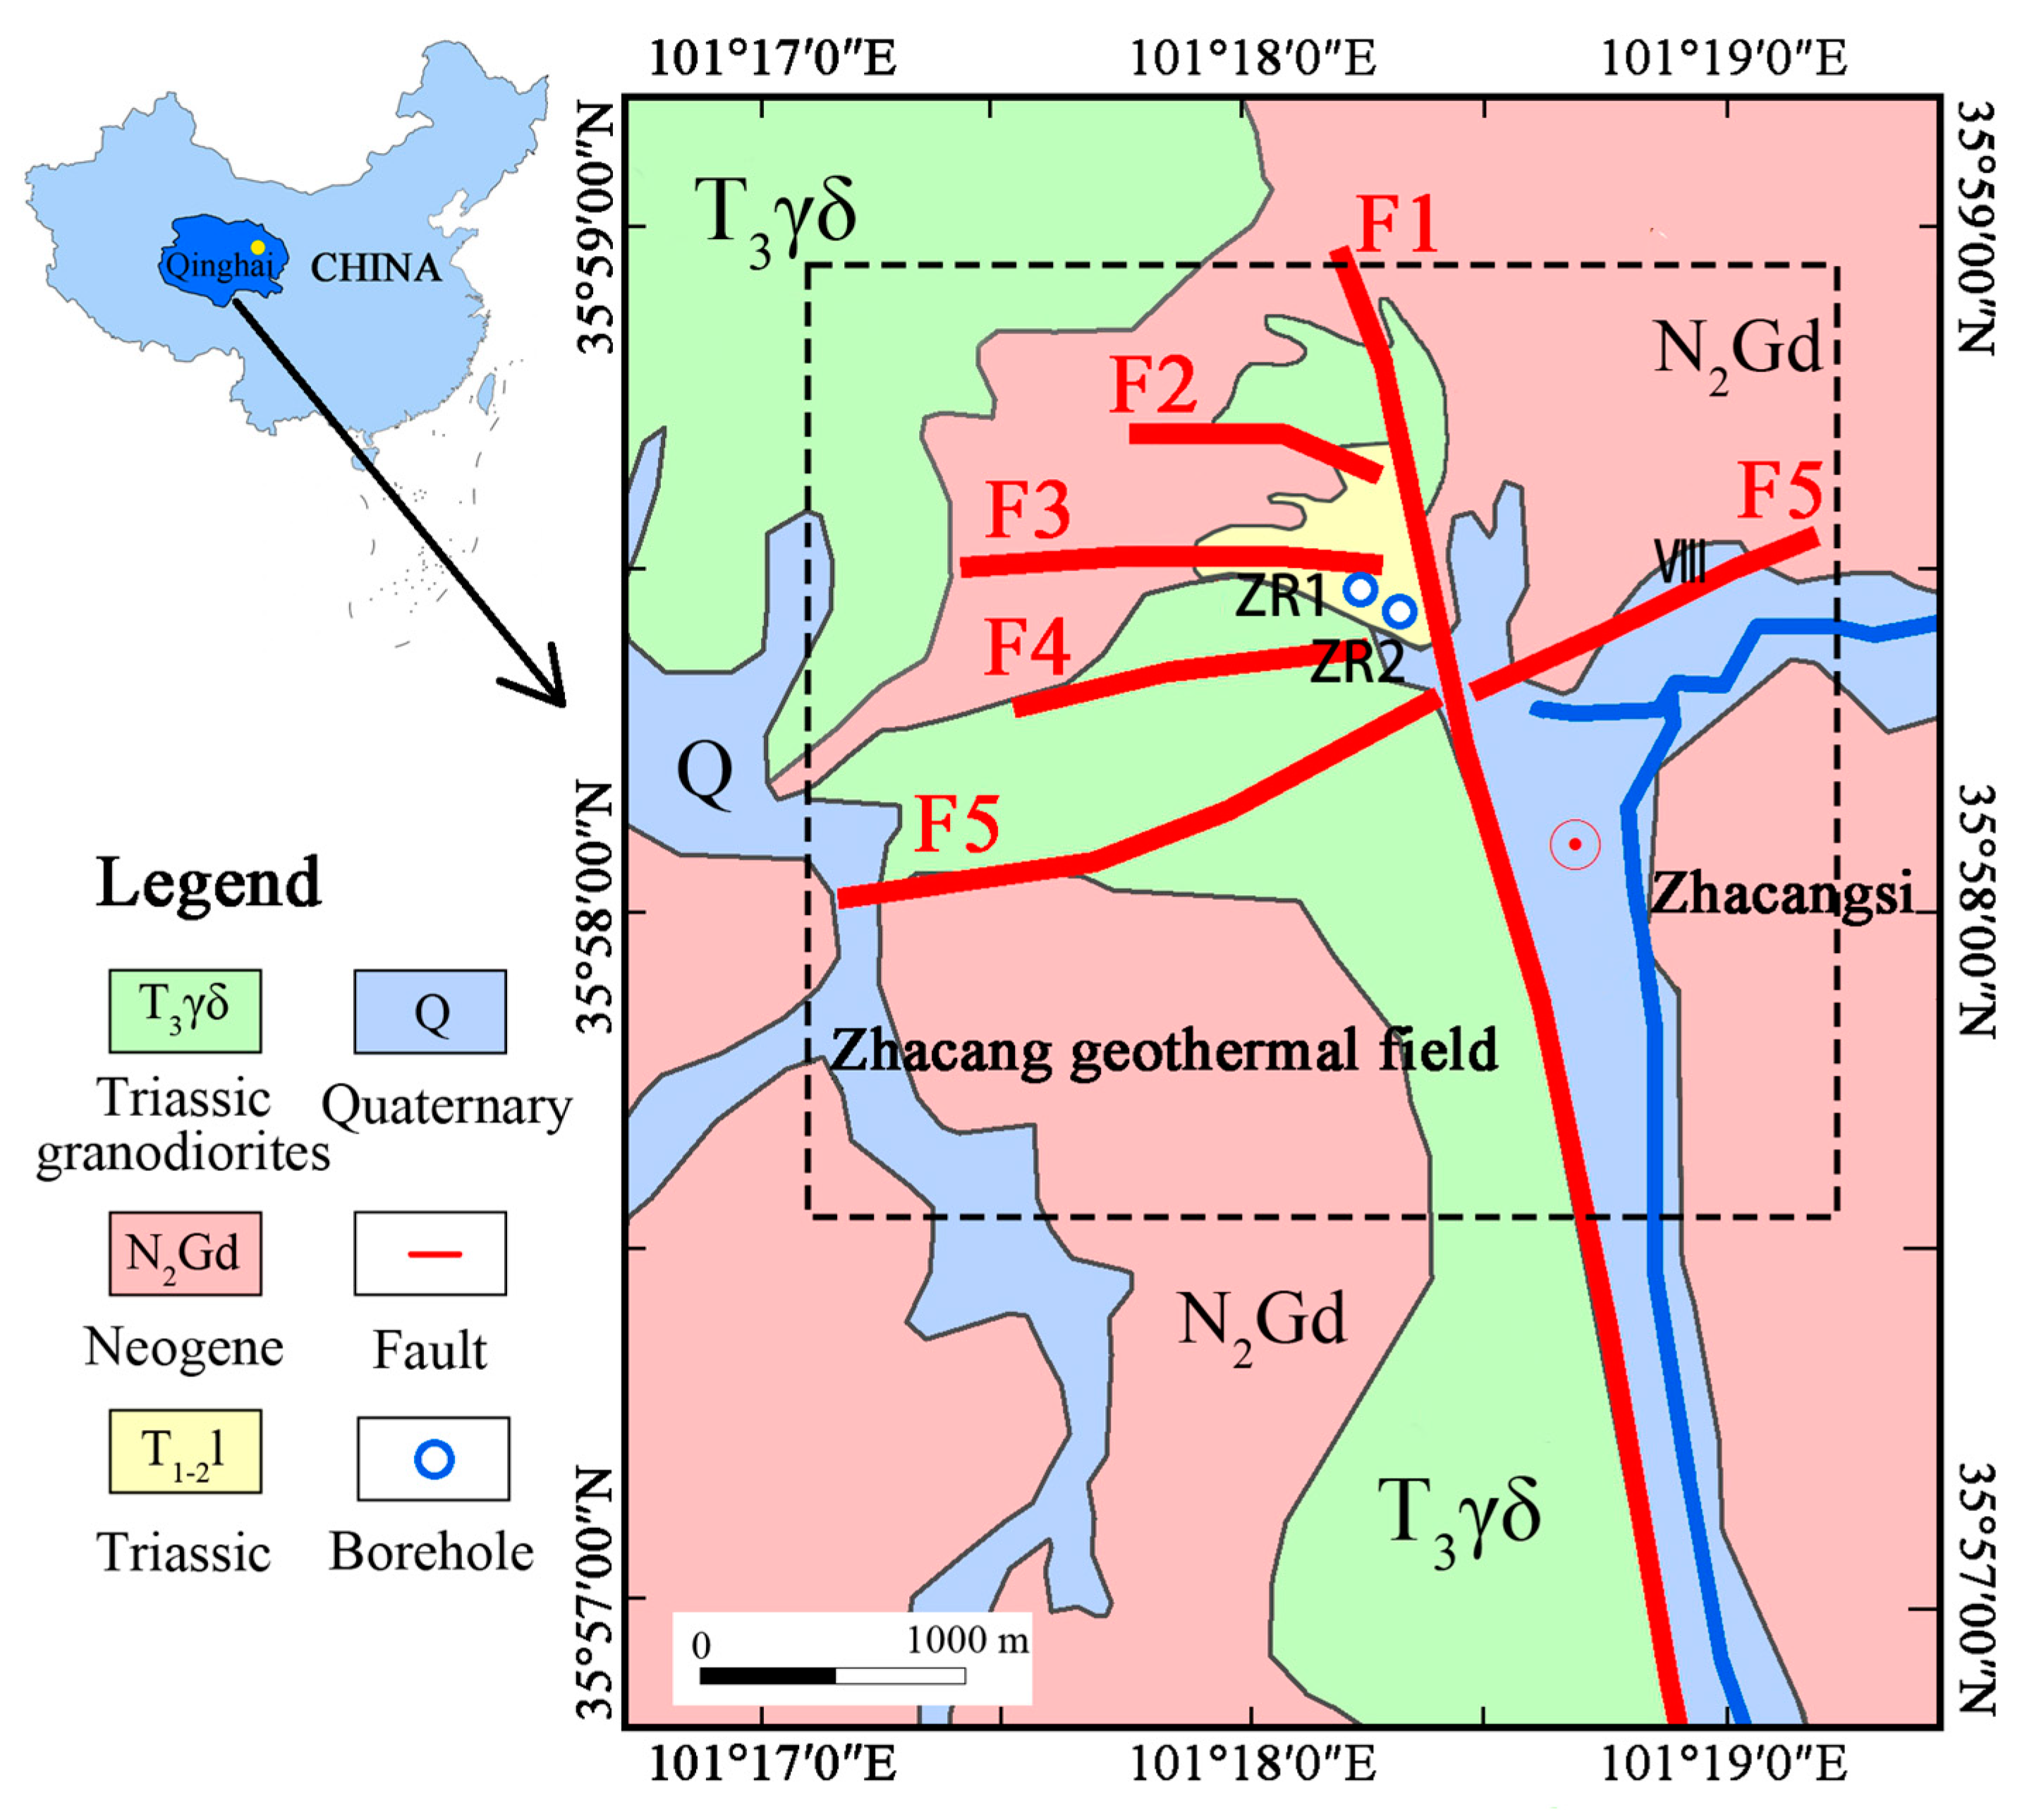
2. Background of the Study Site
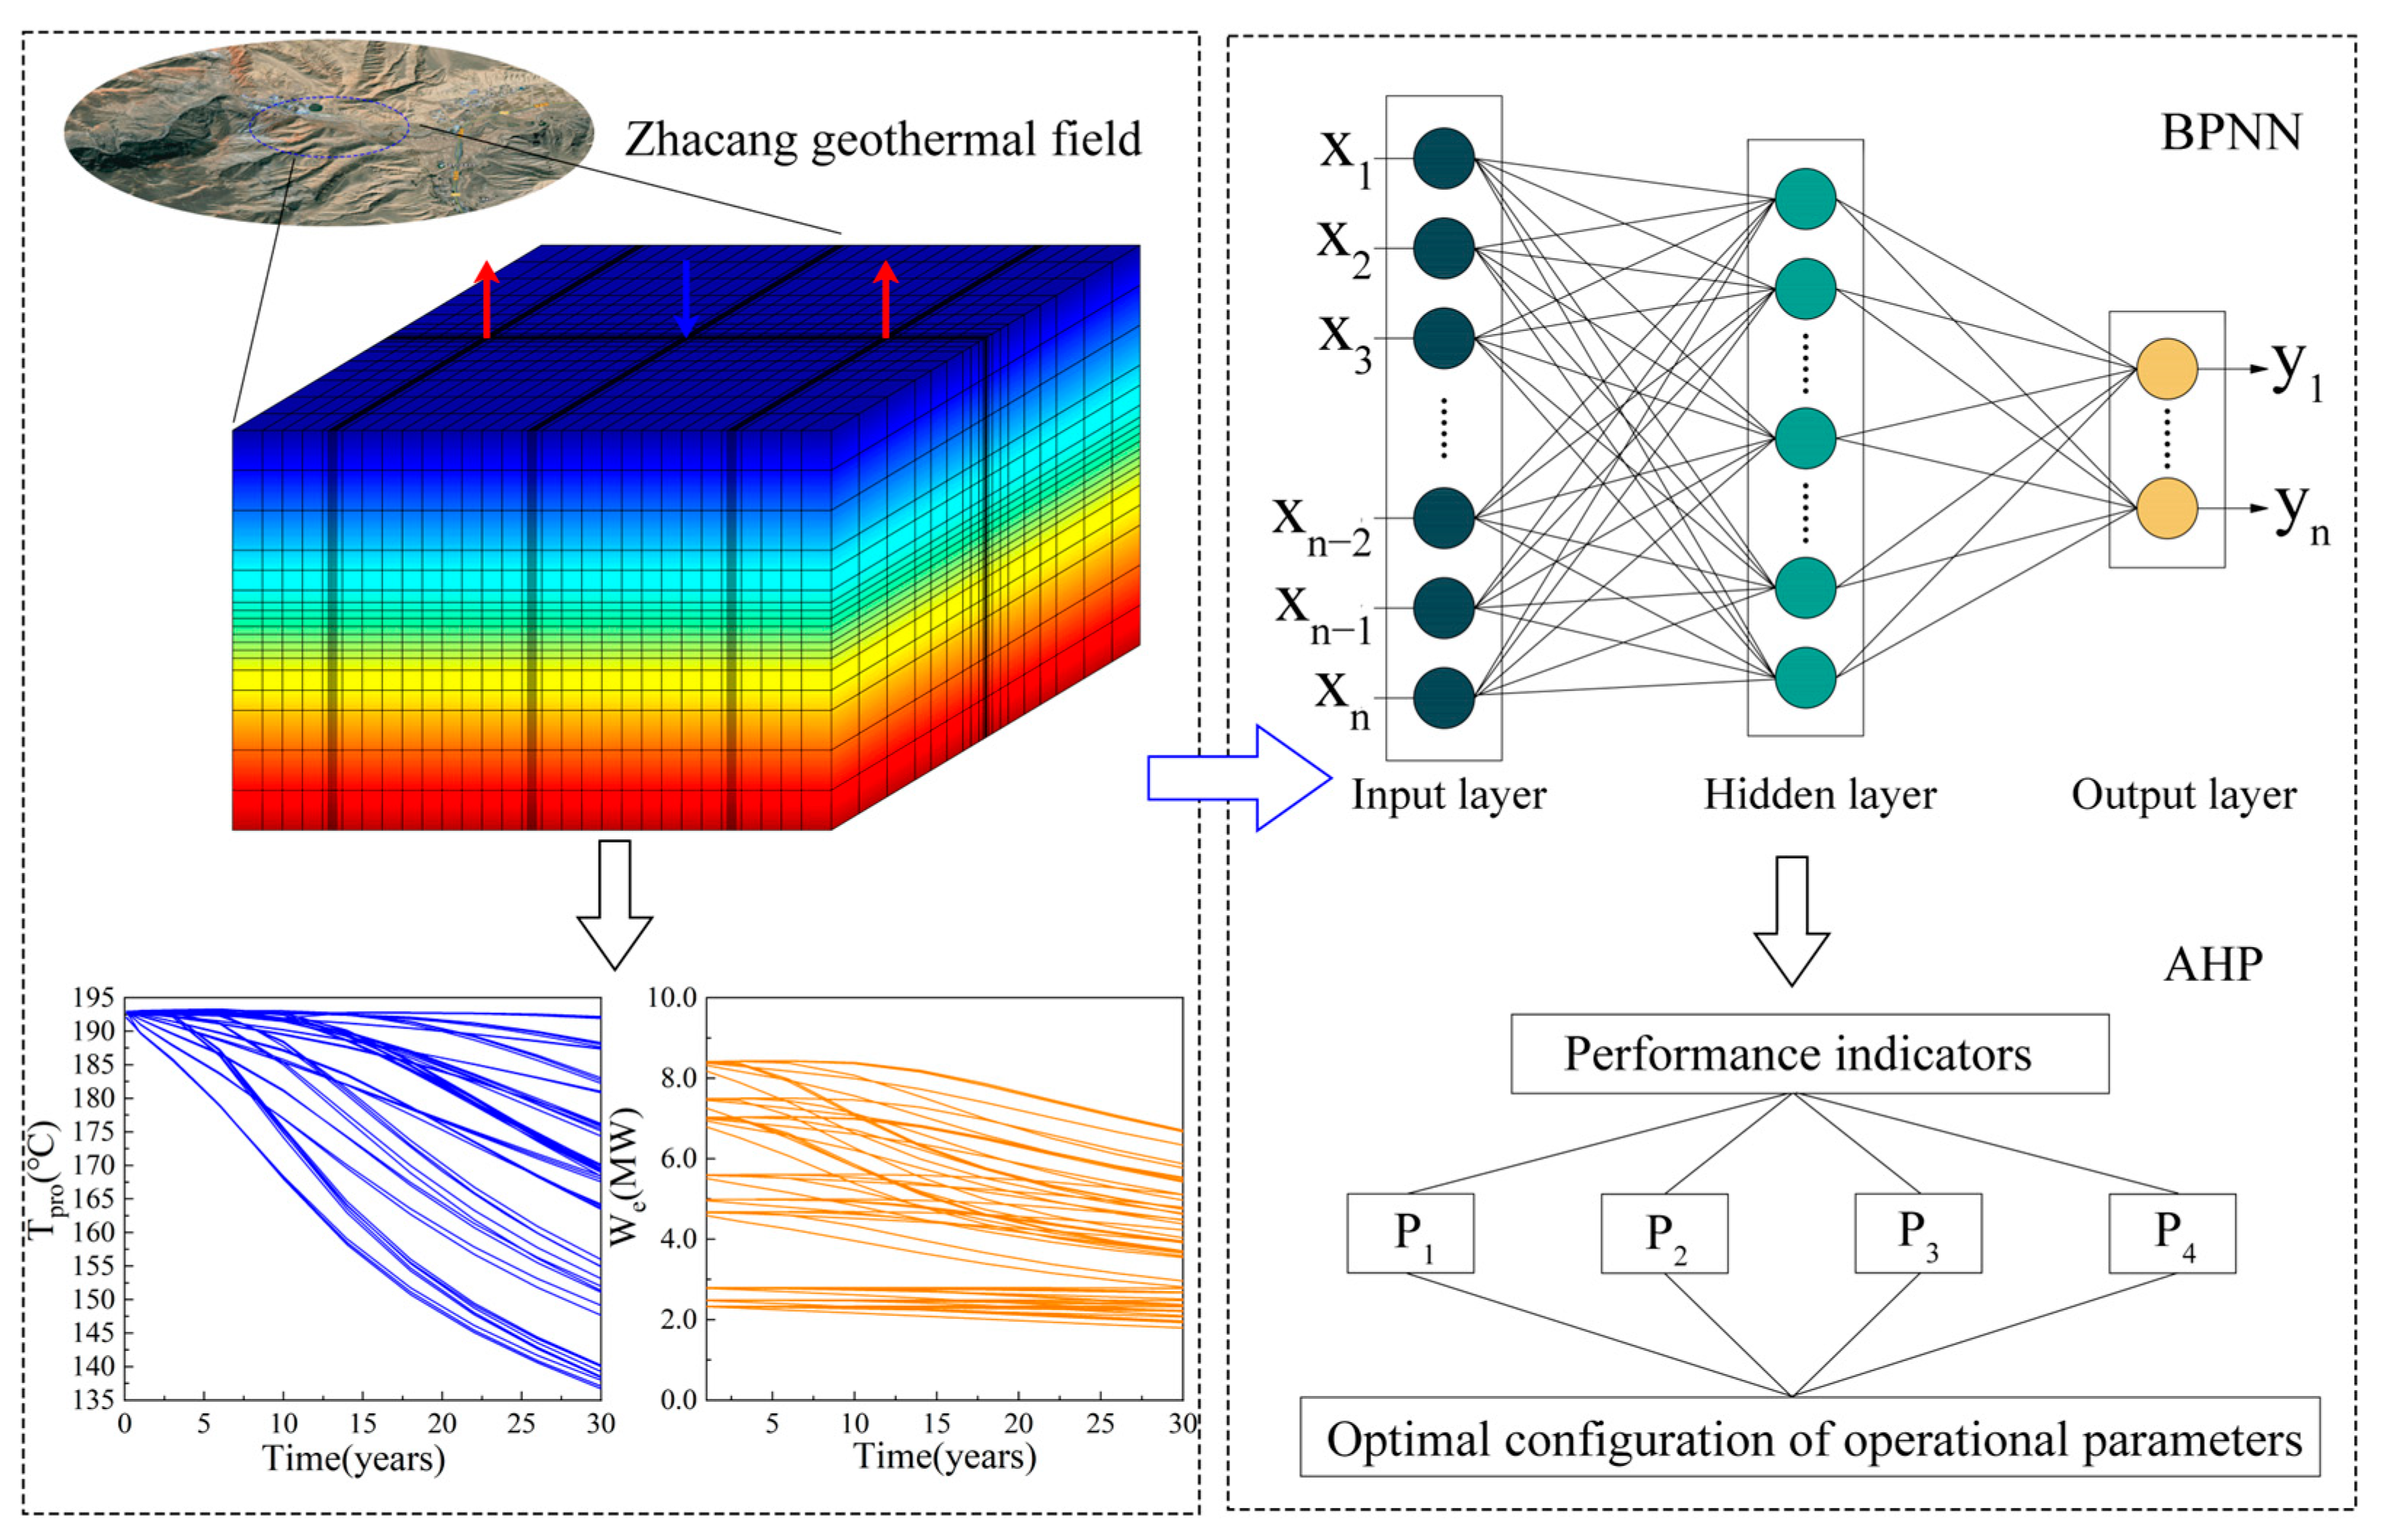
3. Methodology
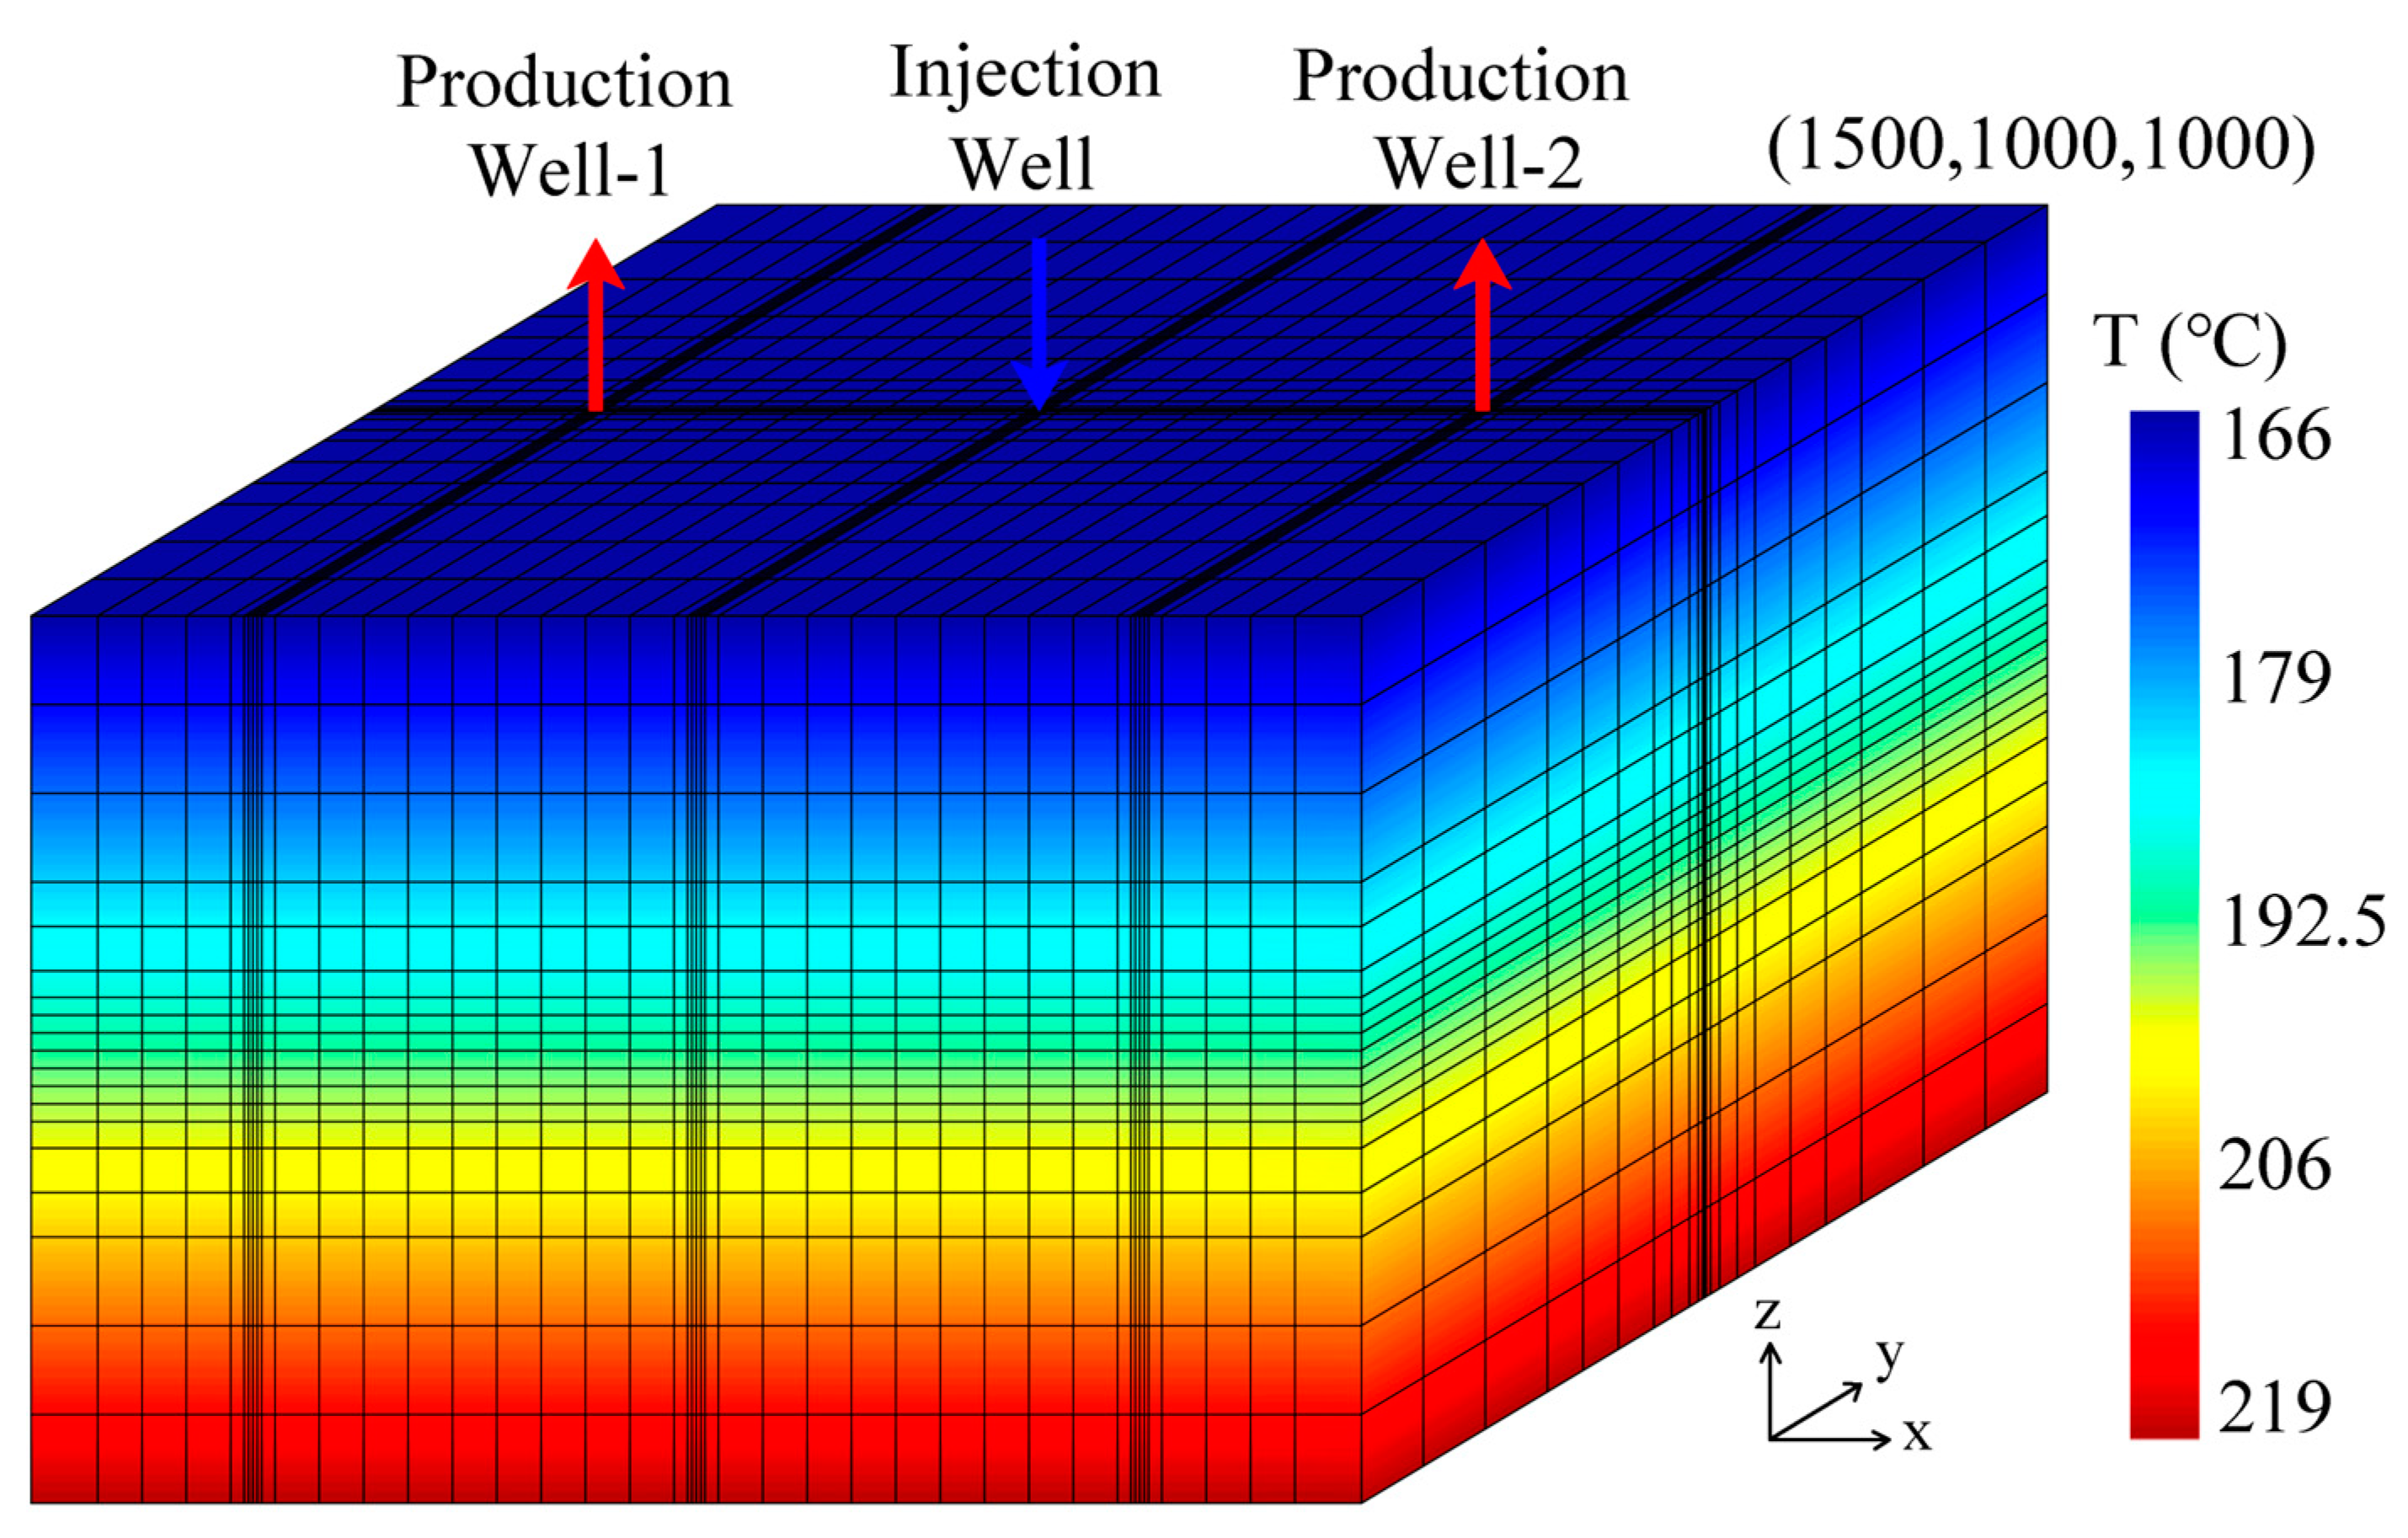
4. EGS Numerical Model of Three Vertical Wells
4.1. Modeling and Model Conditions
4.2. The Performance Indicators
- (1)
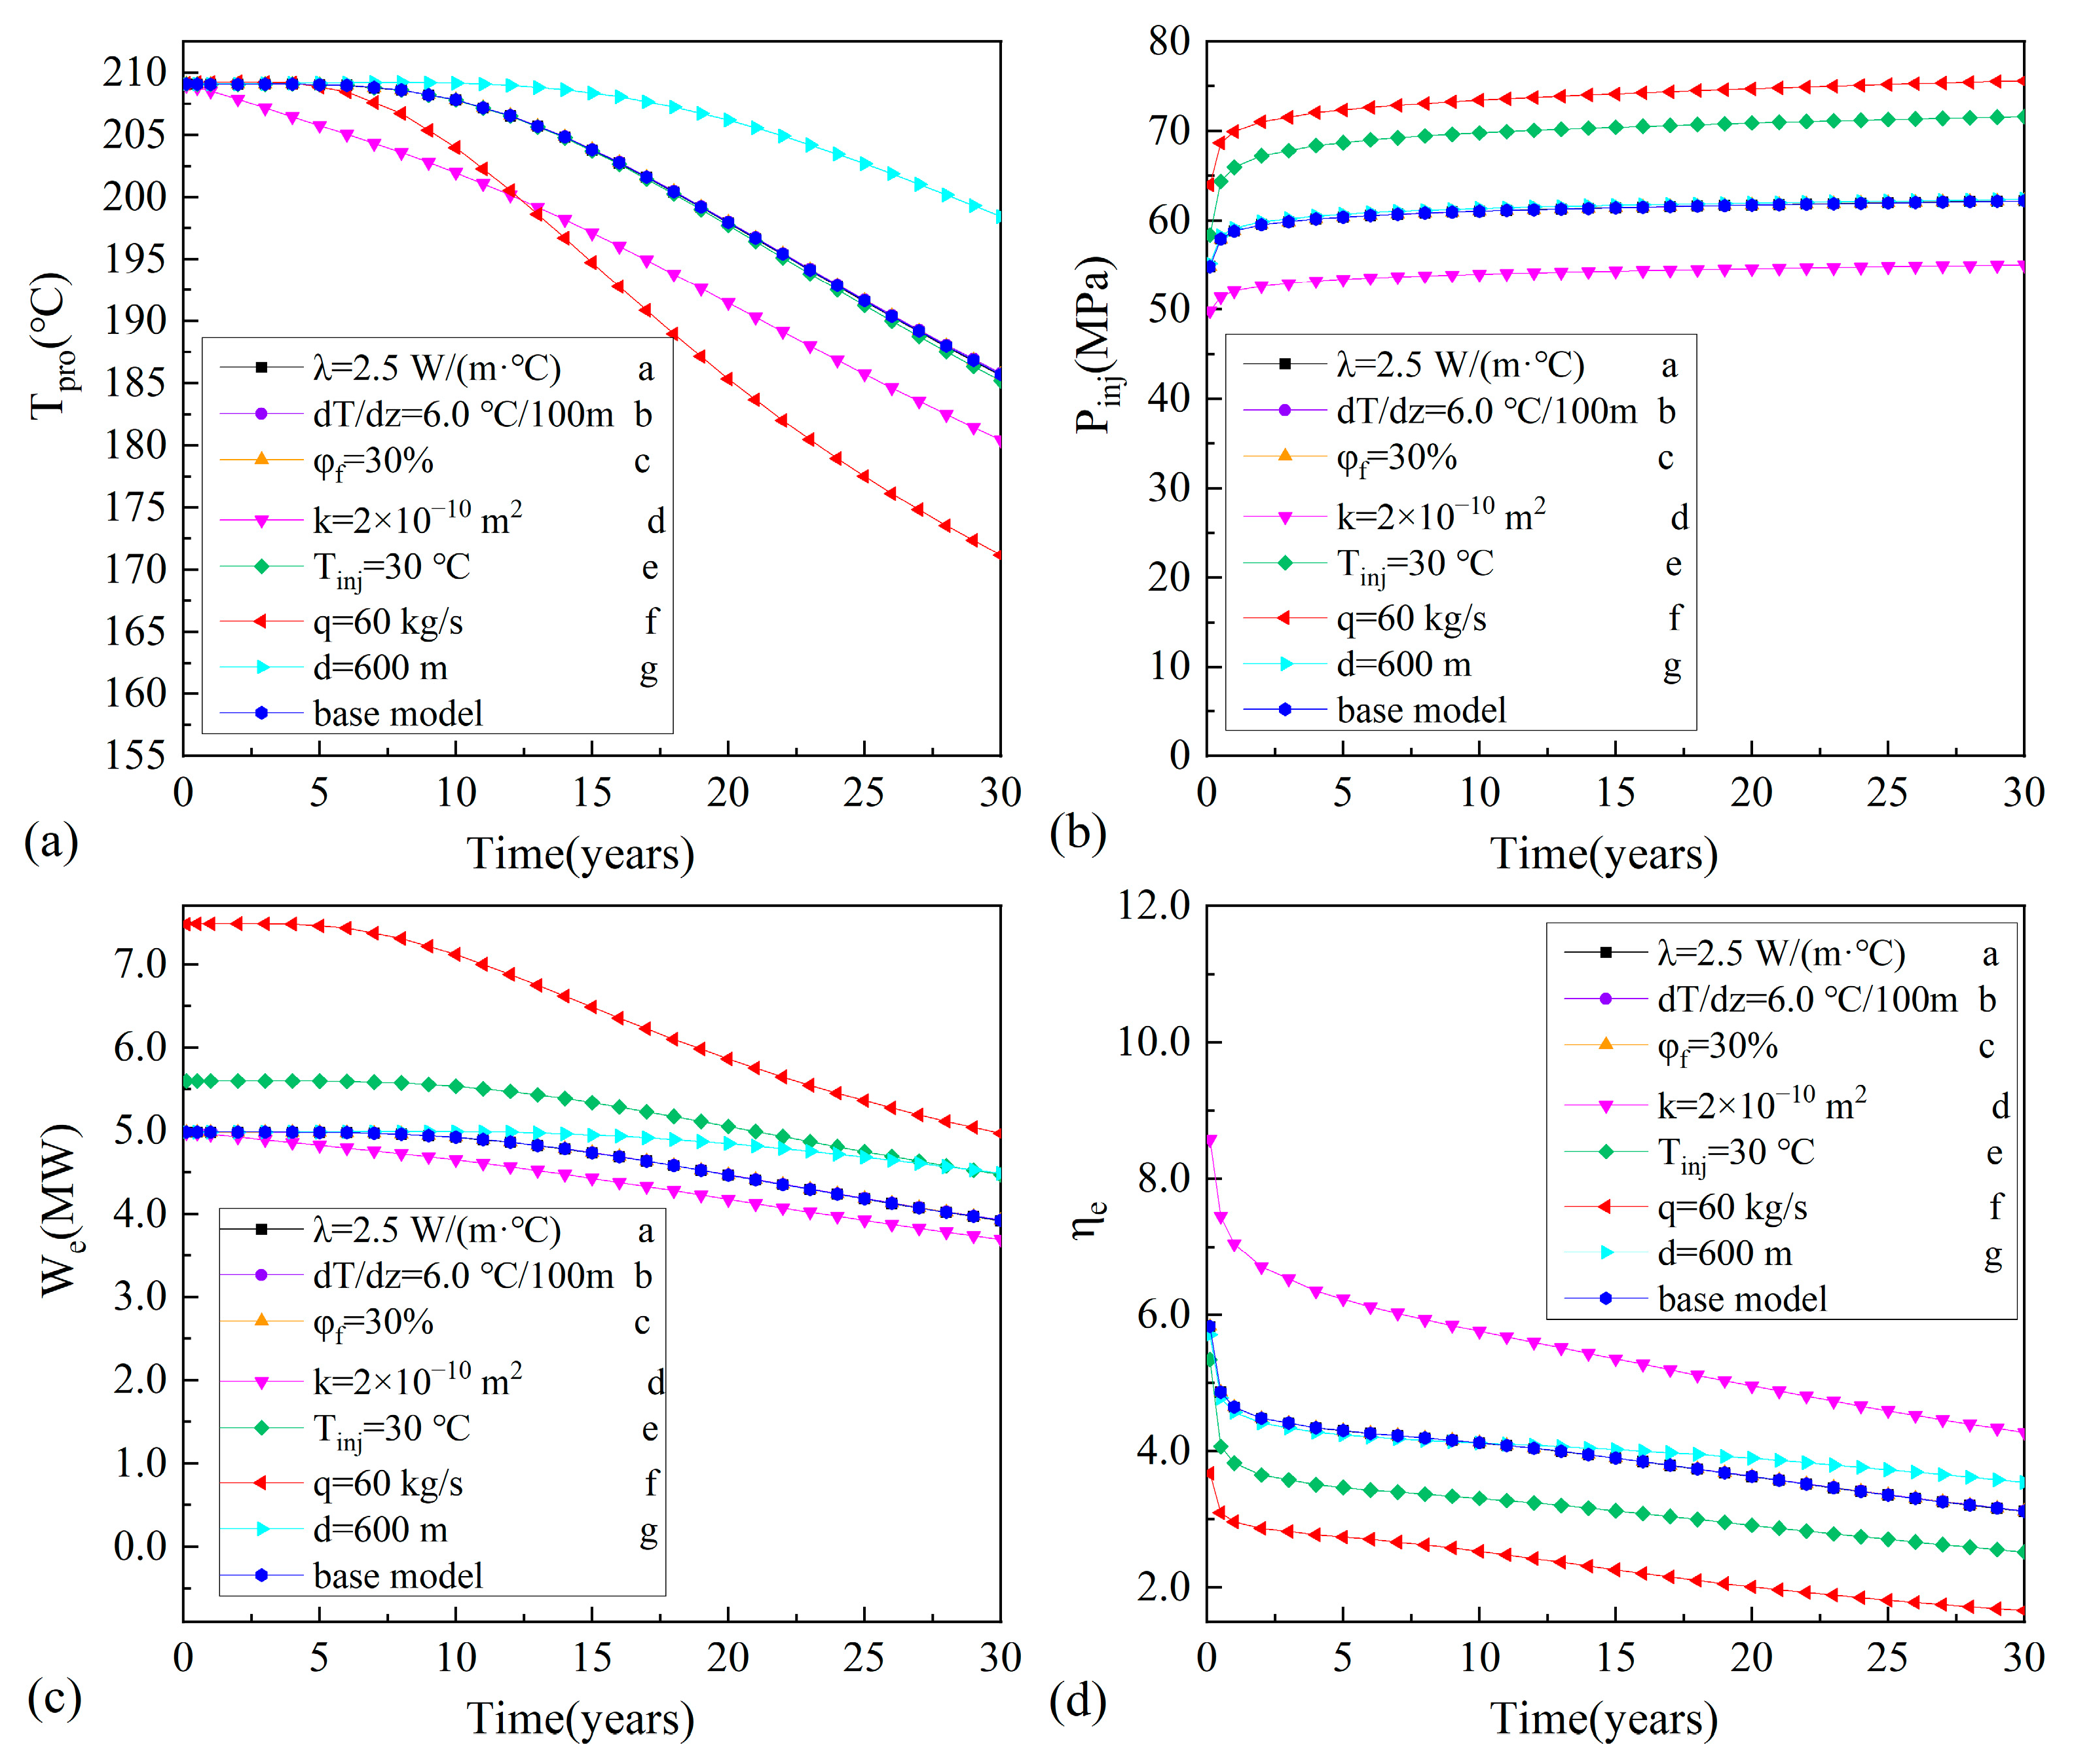
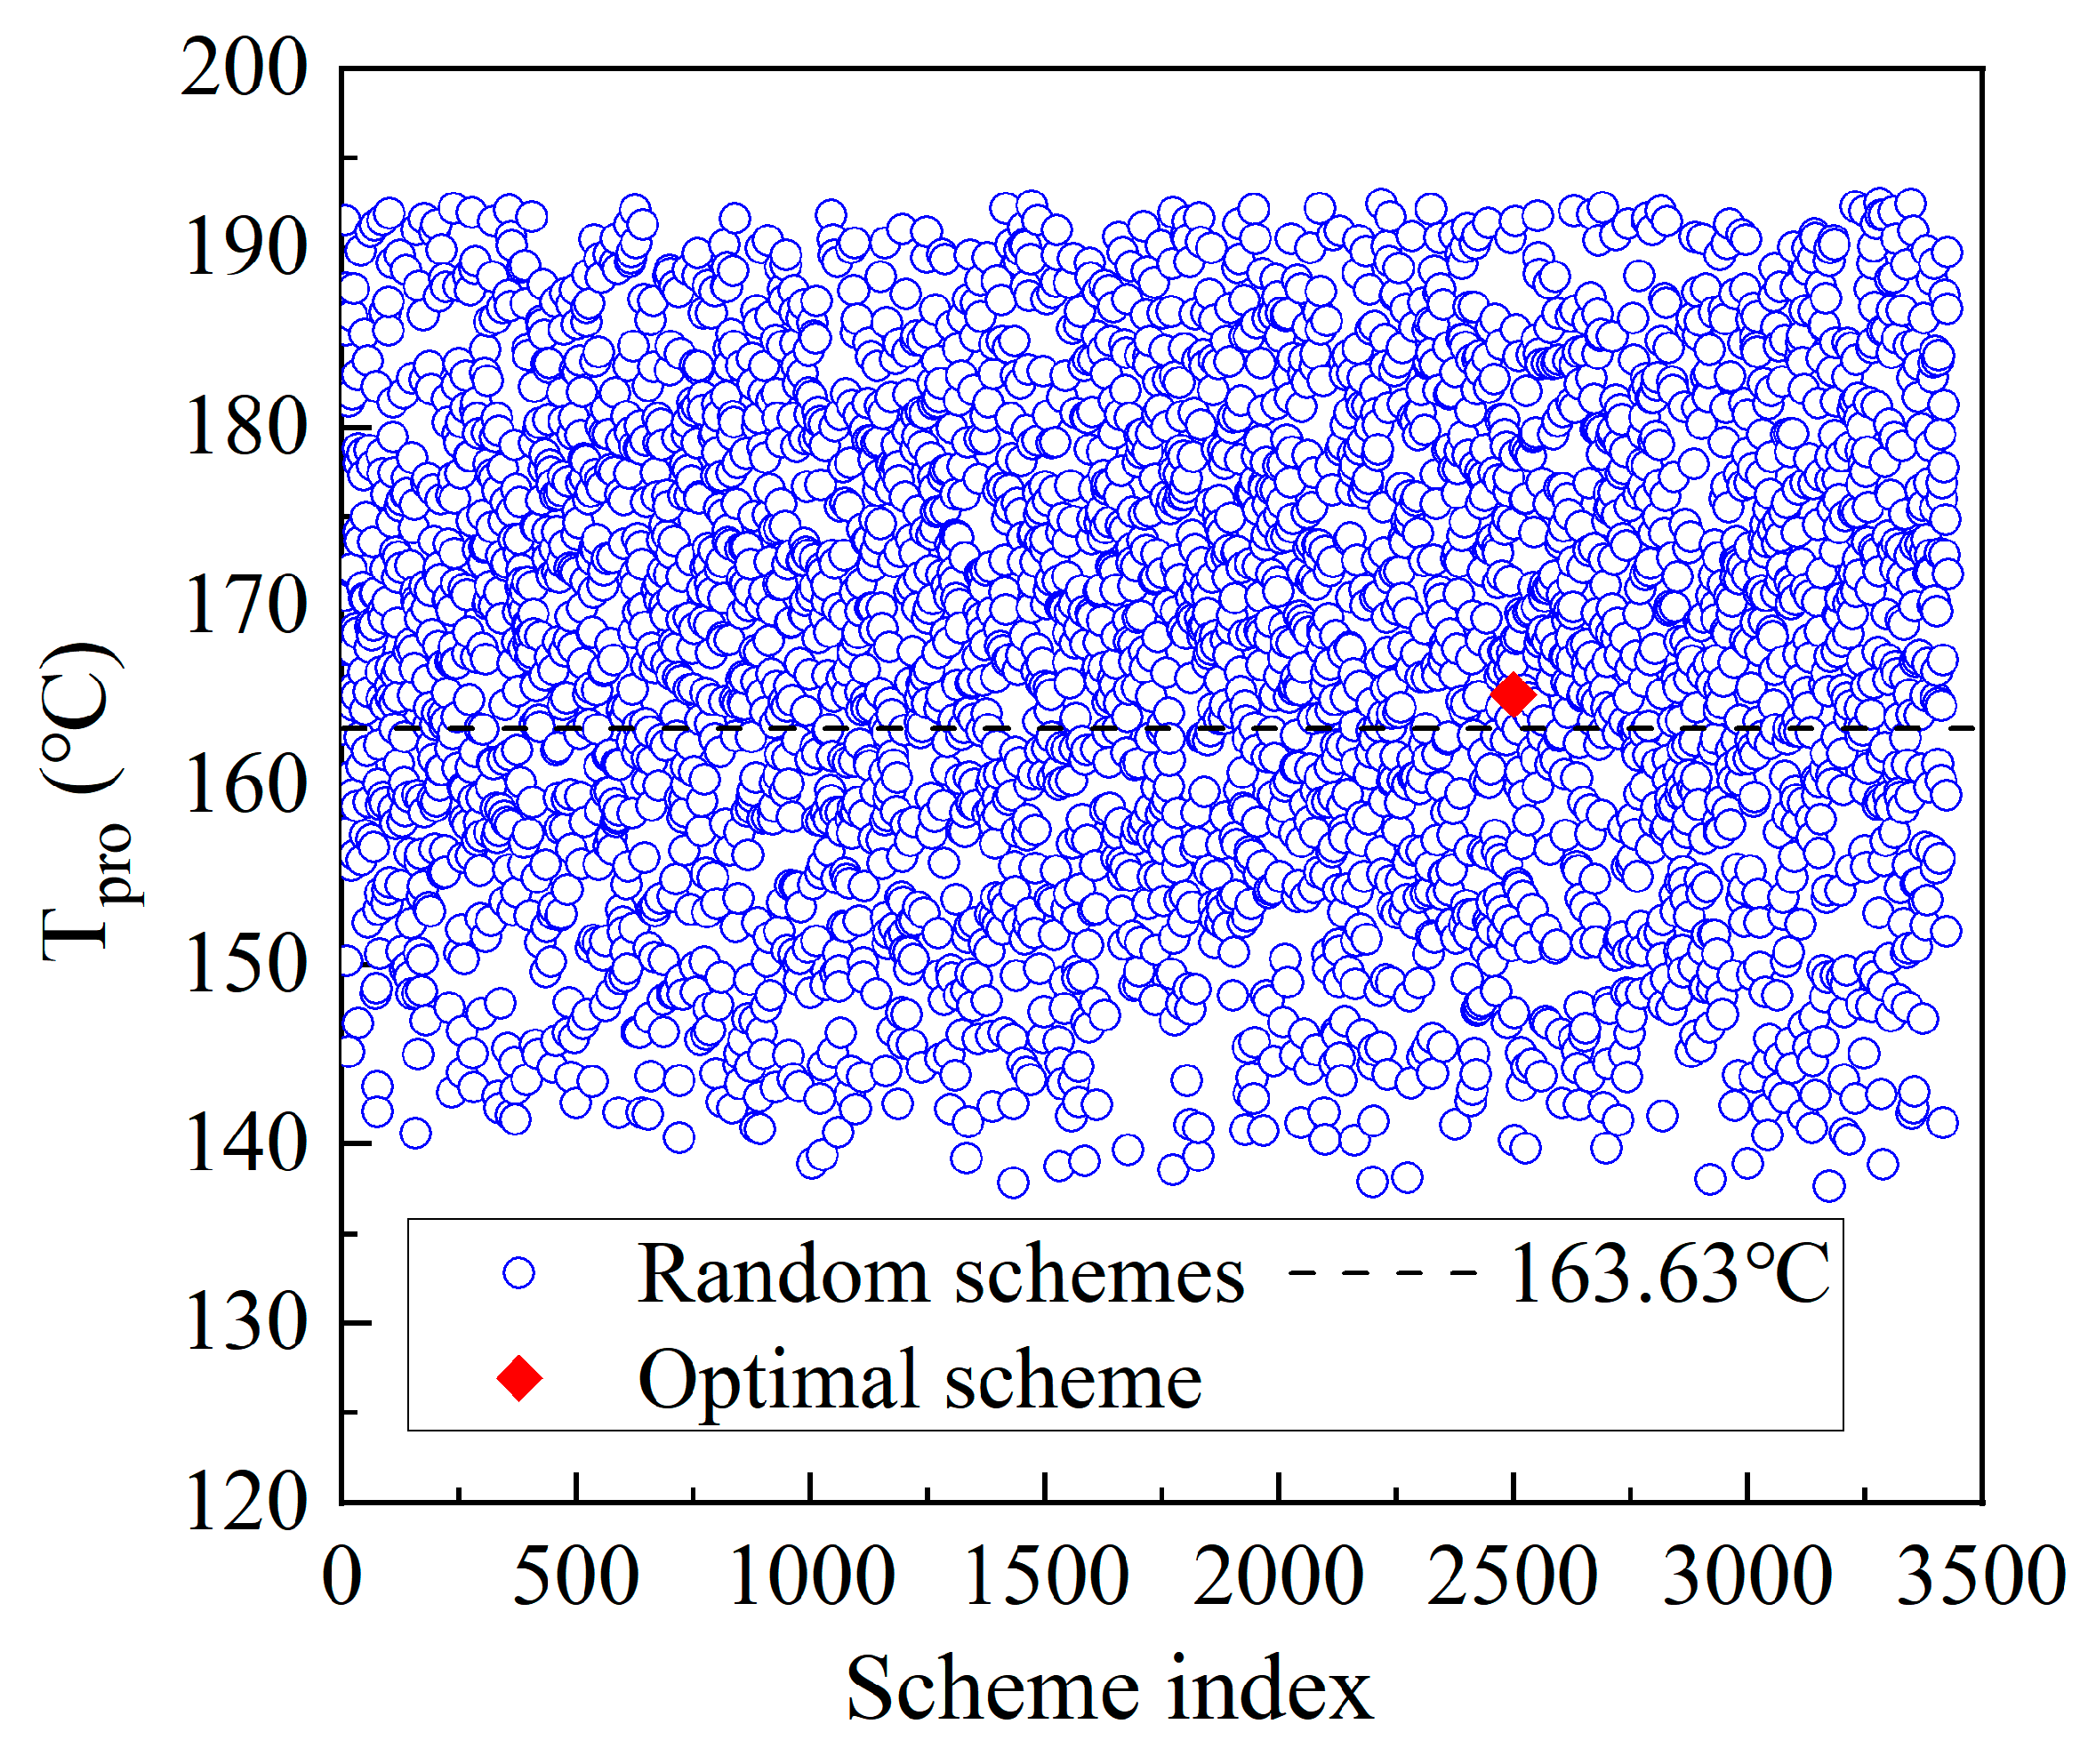
- is the temperature of the production water, °C. In order to ensure the stable power generation of the system, the production temperature drop should be less than 10% during the 15–20 years of designed operating life [38].
- (2)
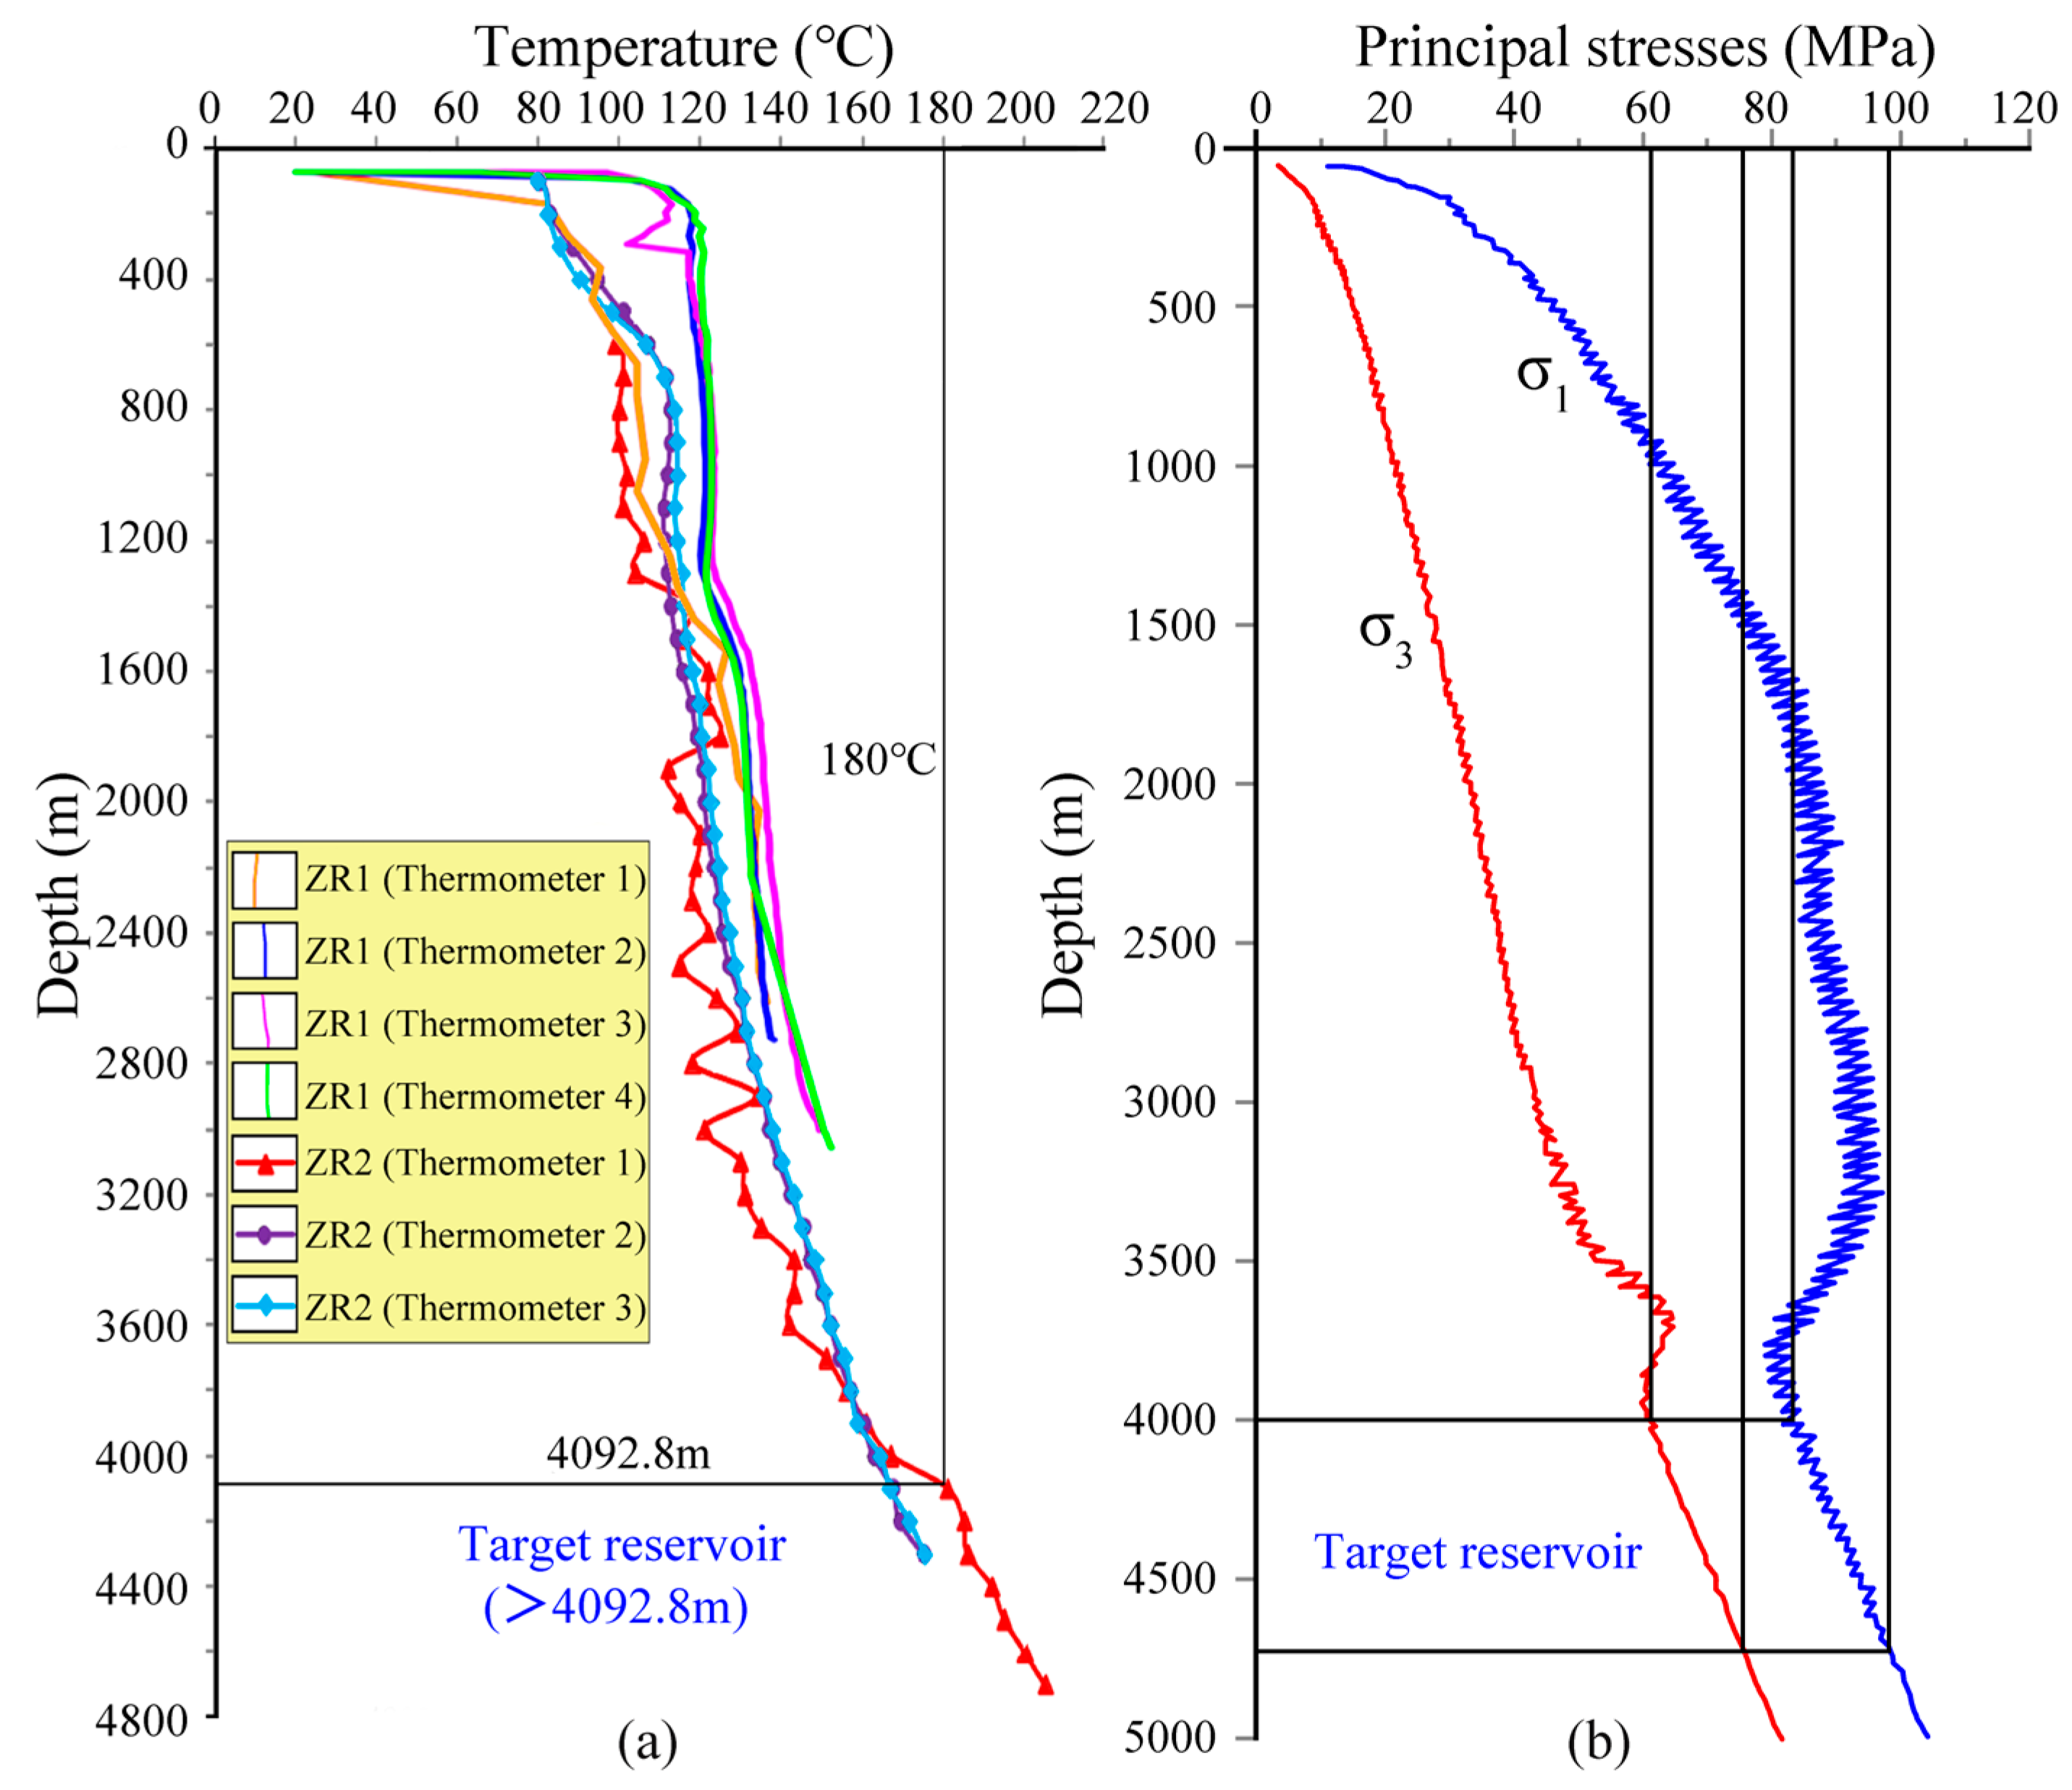
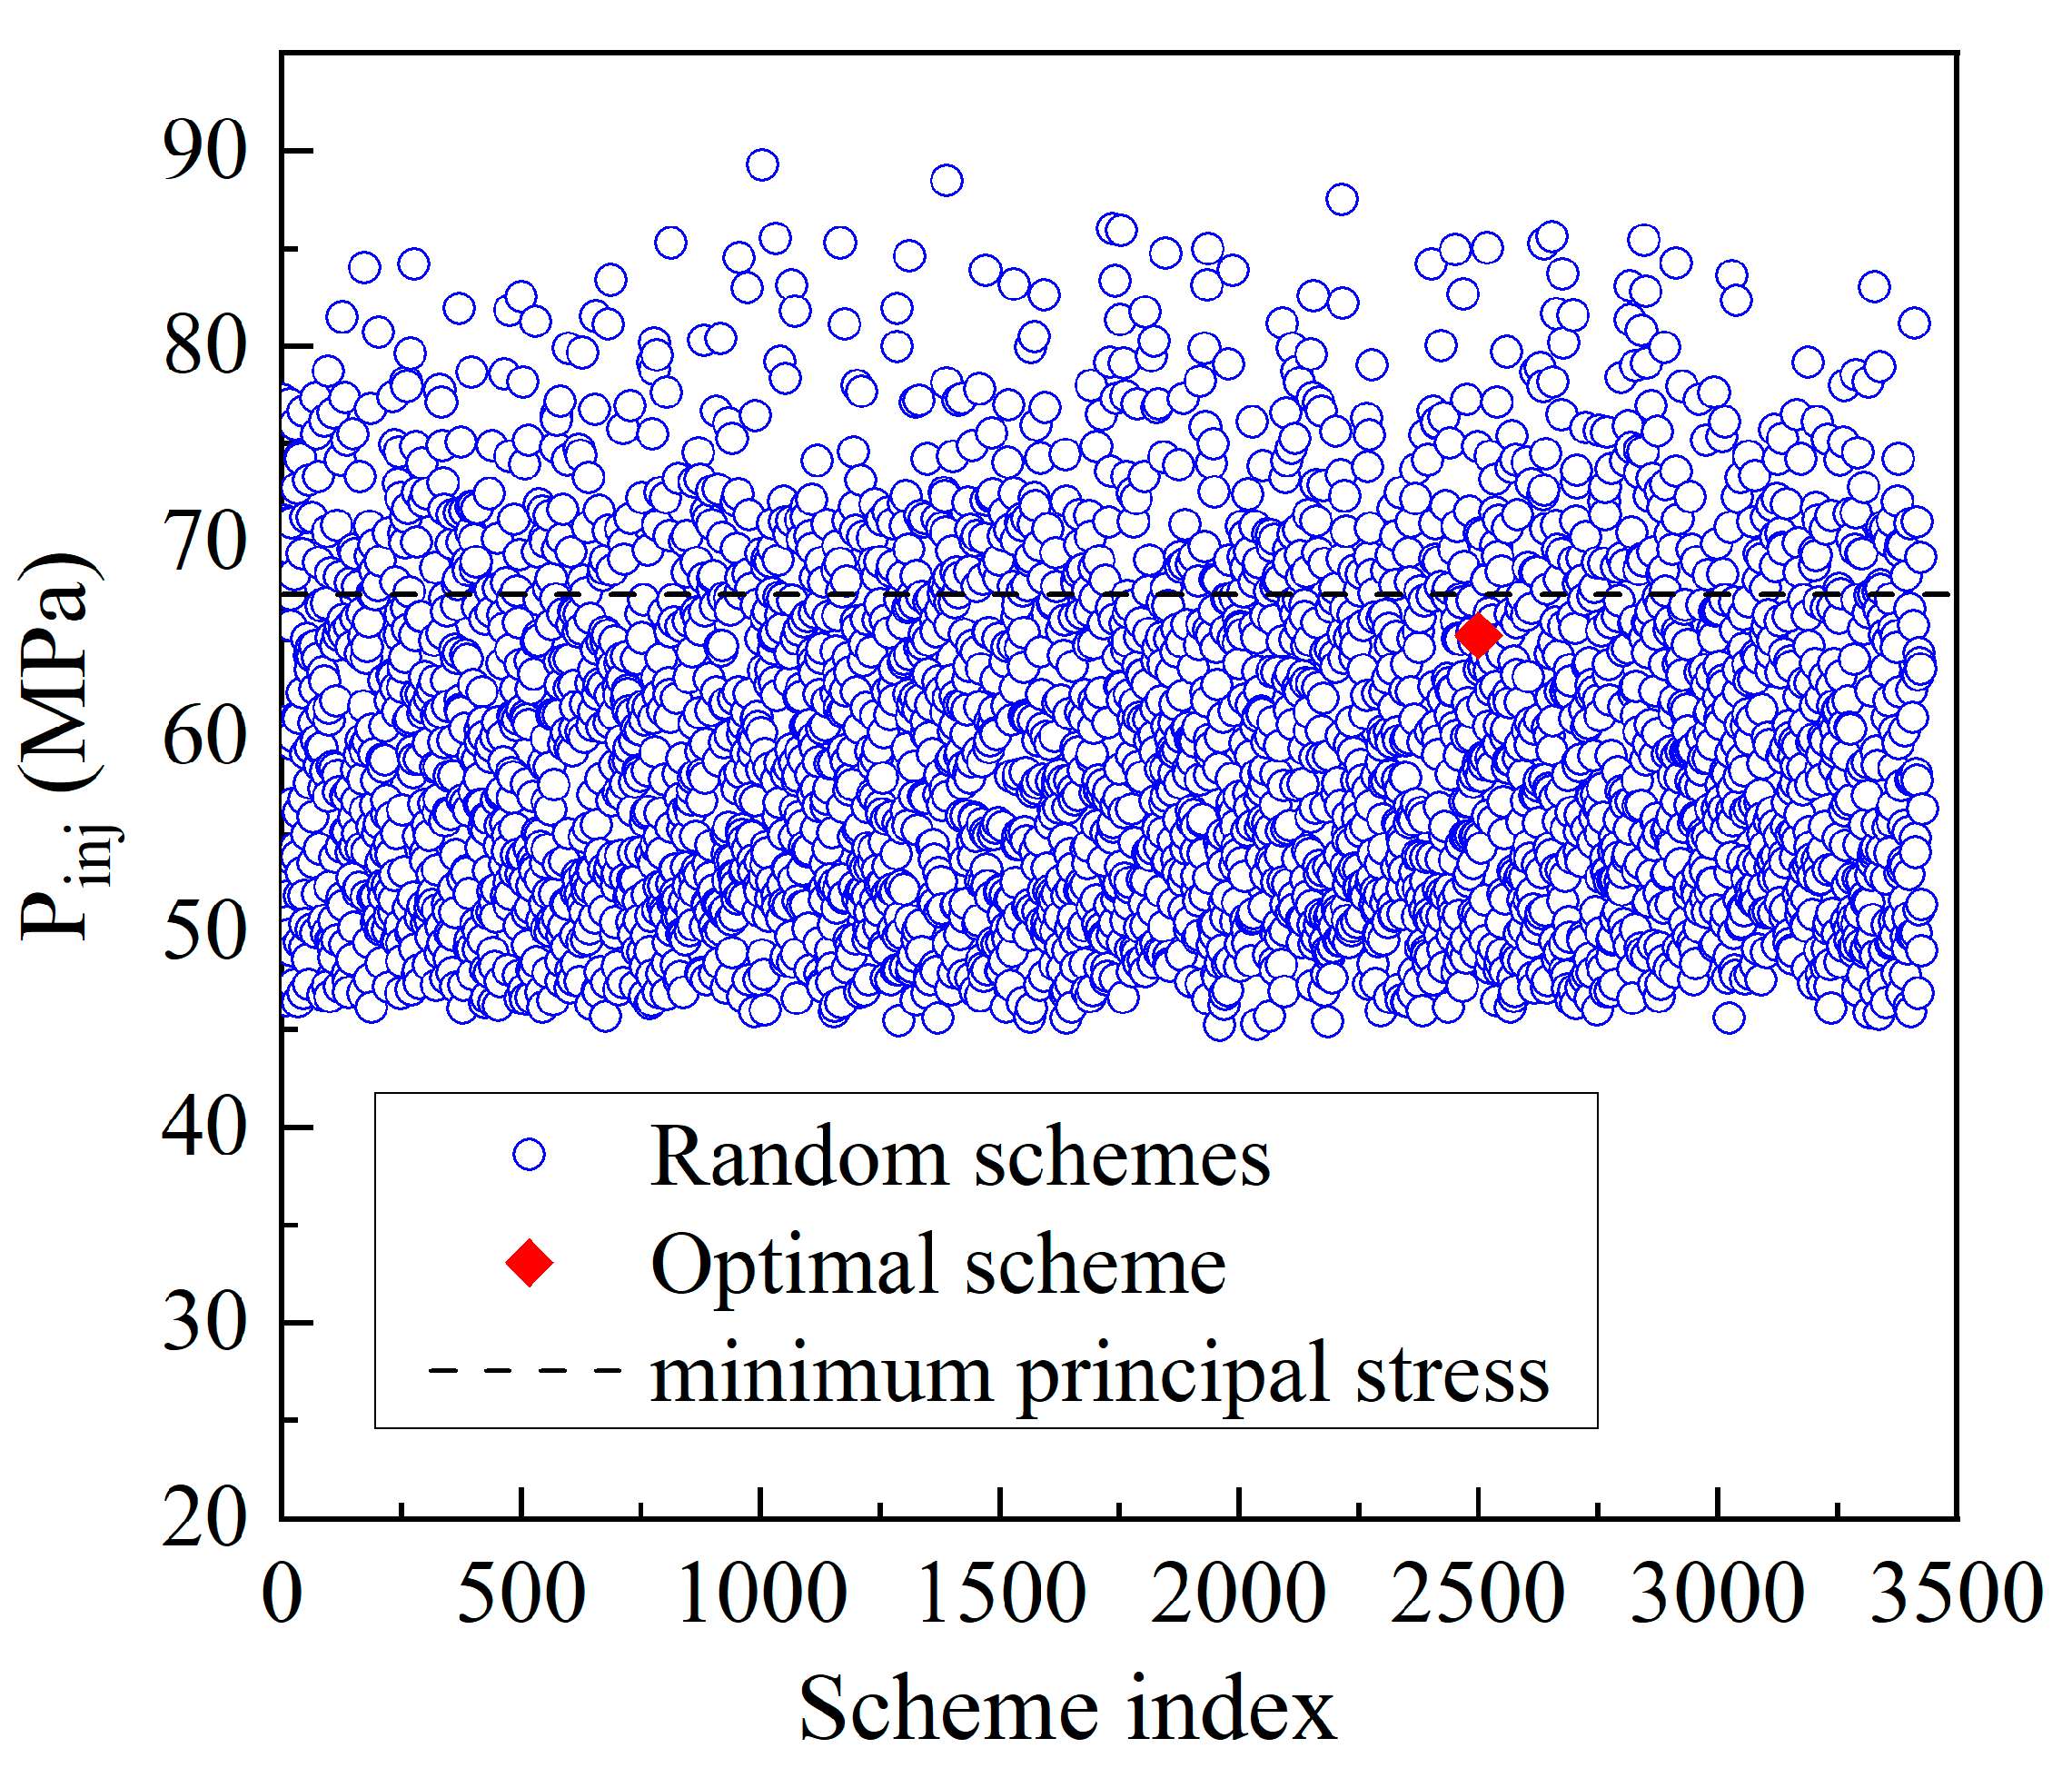
- When exceeds the minimum horizontal principal stress of the reservoir, the proppant will relax or even fall off in the reservoir fracture, and the fallen proppant will pile up at the bottom of the fracture, forming a “pipe” with high conductivity, which will result in a thermal short-circuit phenomenon. Therefore, it must be ensured that the injection pressure is not greater than the minimum horizontal principal stress of the reservoir (Equation (1)) [39].where is the minimum horizontal principal stress of the target reservoir, and the minimum principal stress of the reservoir 4100~4300 m below ground is 63.2~67.3 MPa.
- (3)
- is the total electricity generation by EGS in 30 years (Equations (2)–(4)) [6].where is the electricity generation rate (MW), the energy conversion efficiency is assumed to be 0.45, is the specific enthalpy of the production fluid (kJ/kg), is the specific enthalpy of the injection fluid (kJ/kg), is the average heat rejection temperature (K), with the annual average temperature of Guide Basin is 7.2 °C, and the heat rejection temperature is 280.35 K.
- (4)
- The electric energy efficiency () is defined as the ratio of the total power generation energy to the internal energy consumption, which can be written in Equation (5) [17]. The internal energy consumption () is the sum of the energy consumption of the injection and production pumps, which can be expressed in Equation (6) [17].where is the density of water (kg/m3), is the efficiency of the pump, , is the acceleration of gravity (m/s2), is the depth of the injection wells, is the depth of the production wells, .
- (5)
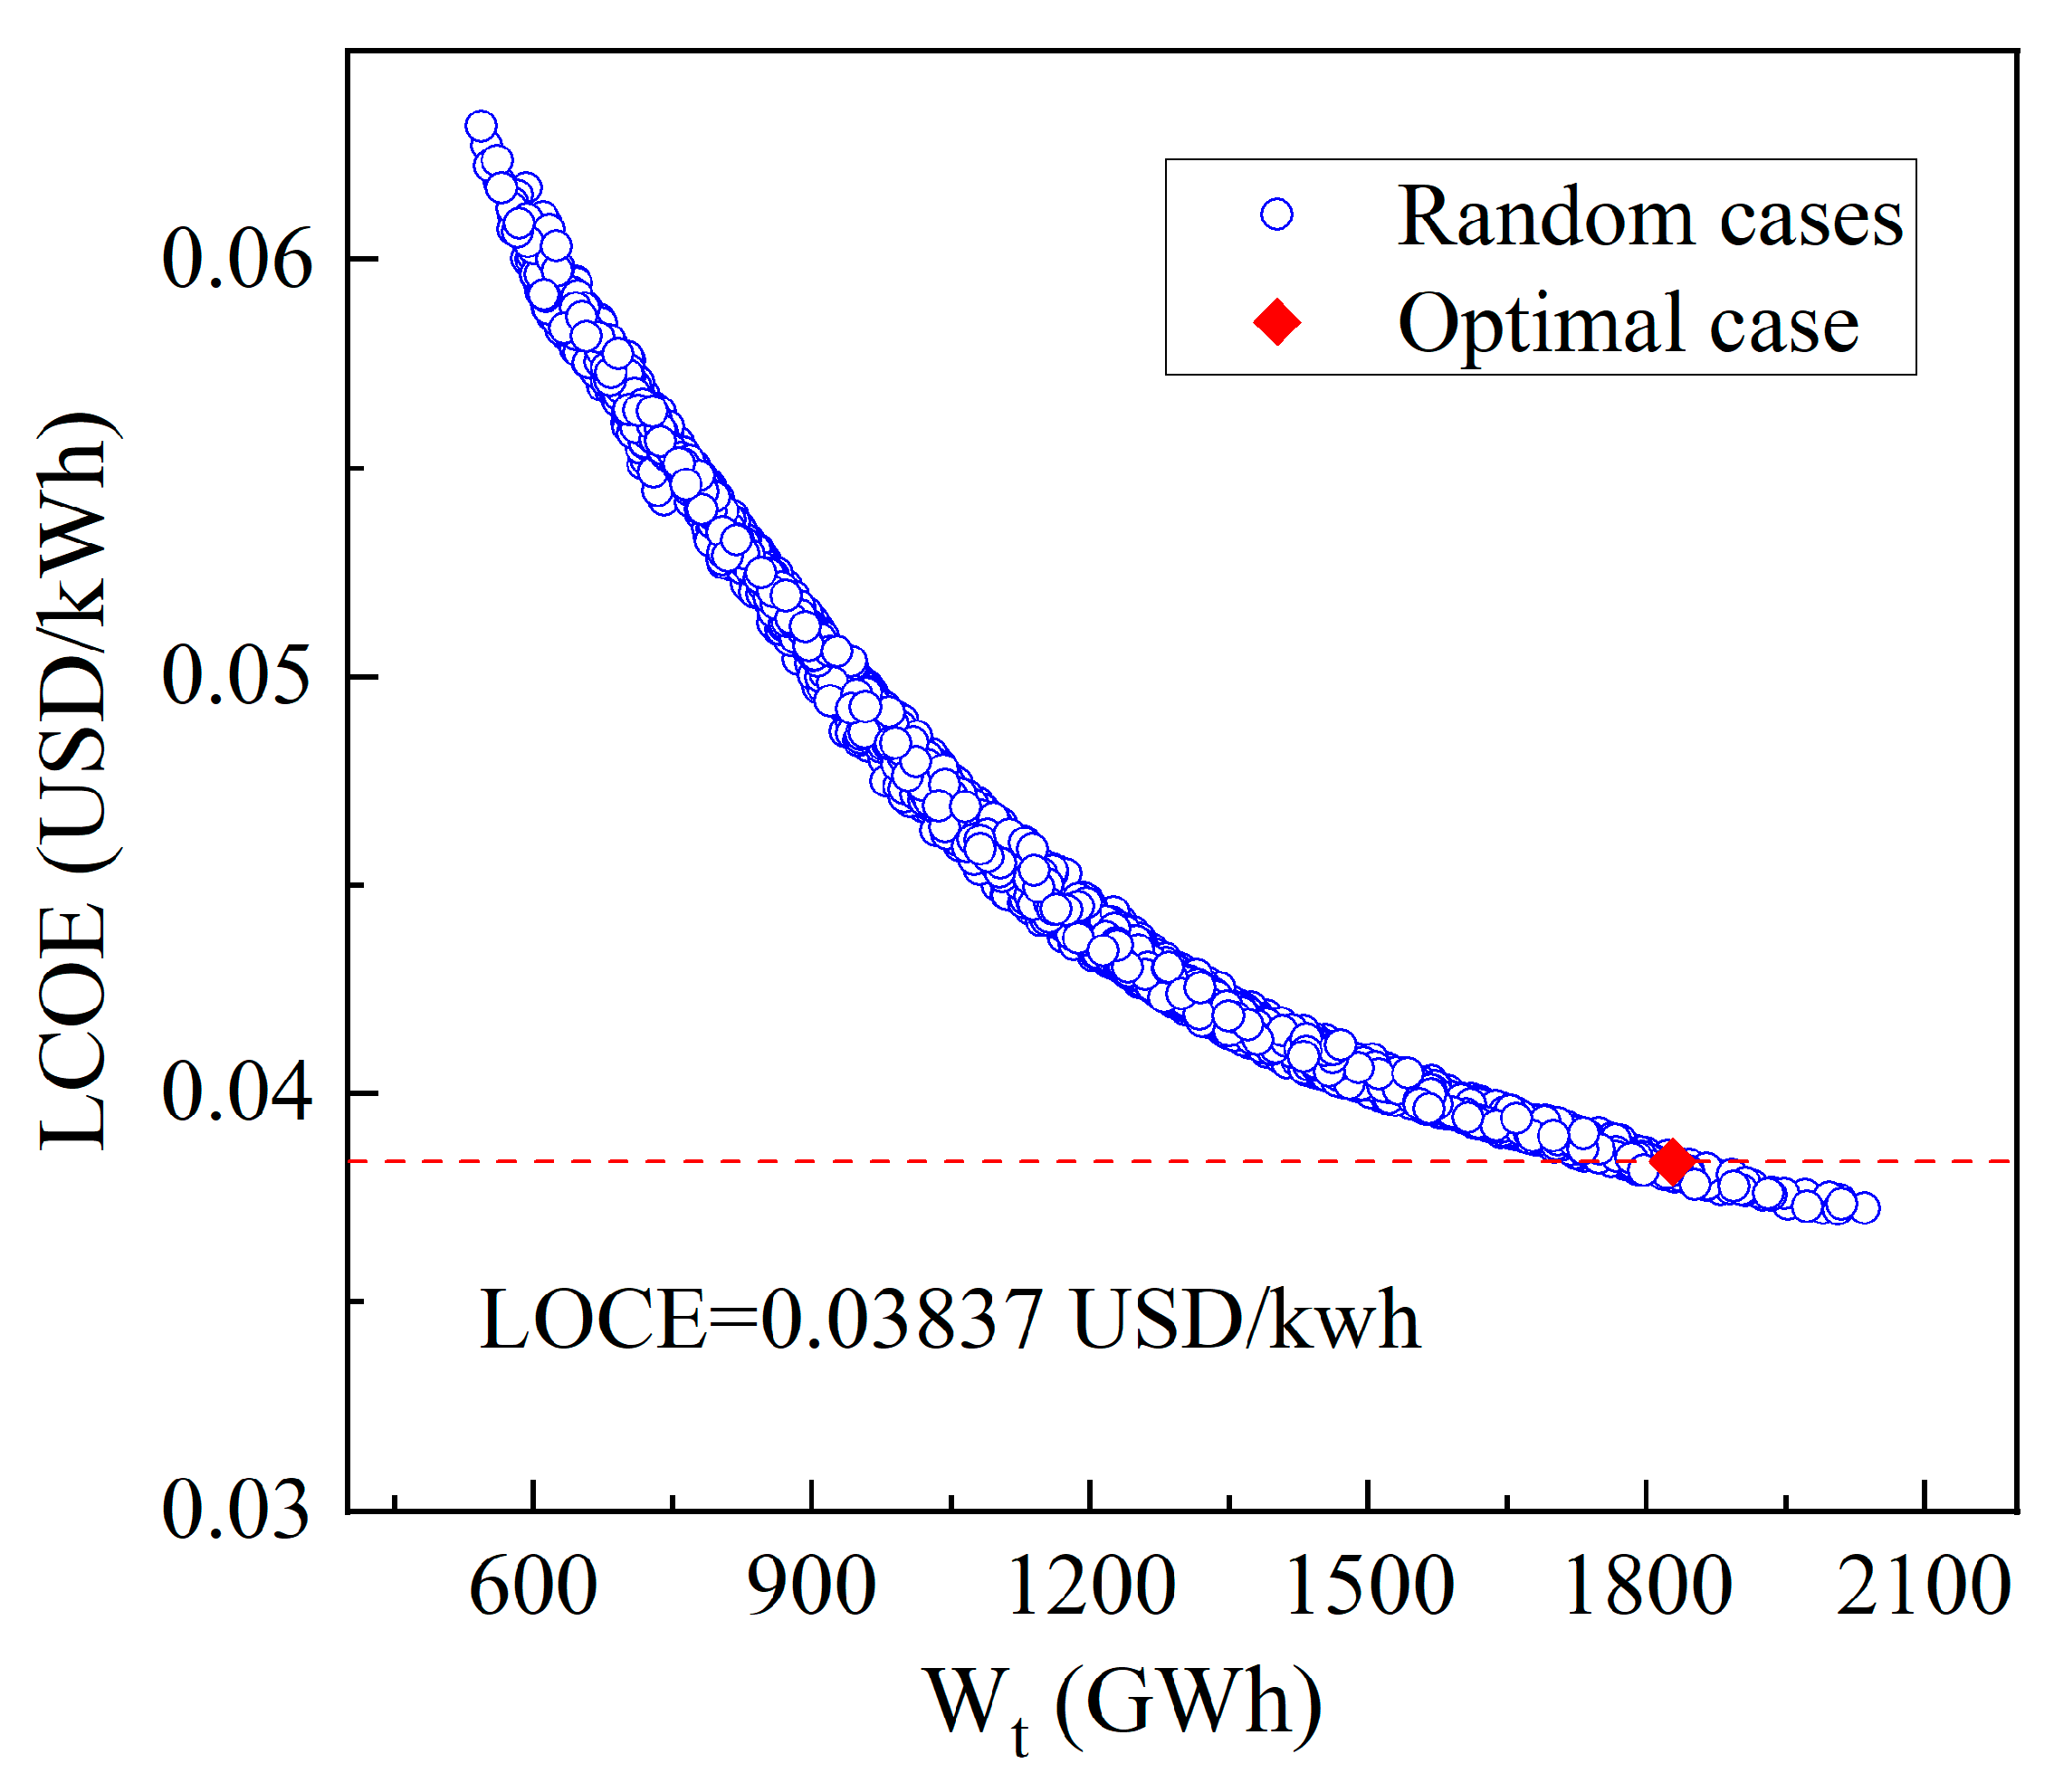
- The levelized cost of electricity (LCOE) is the most commonly used method for evaluating the economics of power plants, which is the present value of costs over the life cycle/present value of electricity generation over the life cycle. This paper uses a simplified LCOE method to evaluate EGS, calculating the total costs of a designed EGS over its life cycle, divided by the total electricity generation over its life cycle.For EGS projects, the total costs can be divided into reservoir exploration cost (), equipment installation cost (), drilling cost (), reservoir development cost () and operation and maintenance cost (). For the Zhacang geothermal field, is about 4.3 M USD [29]. is related to the installed power capacity, and the unit capital cost is estimated to be 2000 USD/kW. Based on the scale of the project, the unit capital cost is estimated at 2000 USD/kW, can be expressed in Equation (7) [40]. is based on the 5100 m GPK3 and GPK4 wells at Soultz EGS in France, which cost 6.57 M USD and 5.14 M USD, respectively [41]. The depth of the three vertical wells in this project is all 4300 m, and can be calculated by Equation (8), where , . can be made up of logging cost and hydraulic fracturing cost. The estimated cost of a high-precision logging at a depth of 4300 m is 4.5 M USD, and the cost of hydraulic fracturing to reservoir modification at a spacing of 300–600 m is 4.5 M USD. is usually inversely proportional to the installed capacity and can be expressed as Equation (9) [29]. Consequently, for the Zhacang EGS power plant can be expressed in Equation (10), and the LCOE can be written in Equation (11).where is the average electrical power generation (MW).
4.3. Simulation Results and Analysis
5. Optimization Model for Power Generation Performance of EGS
5.1. PSO-BPNN Model of EGS
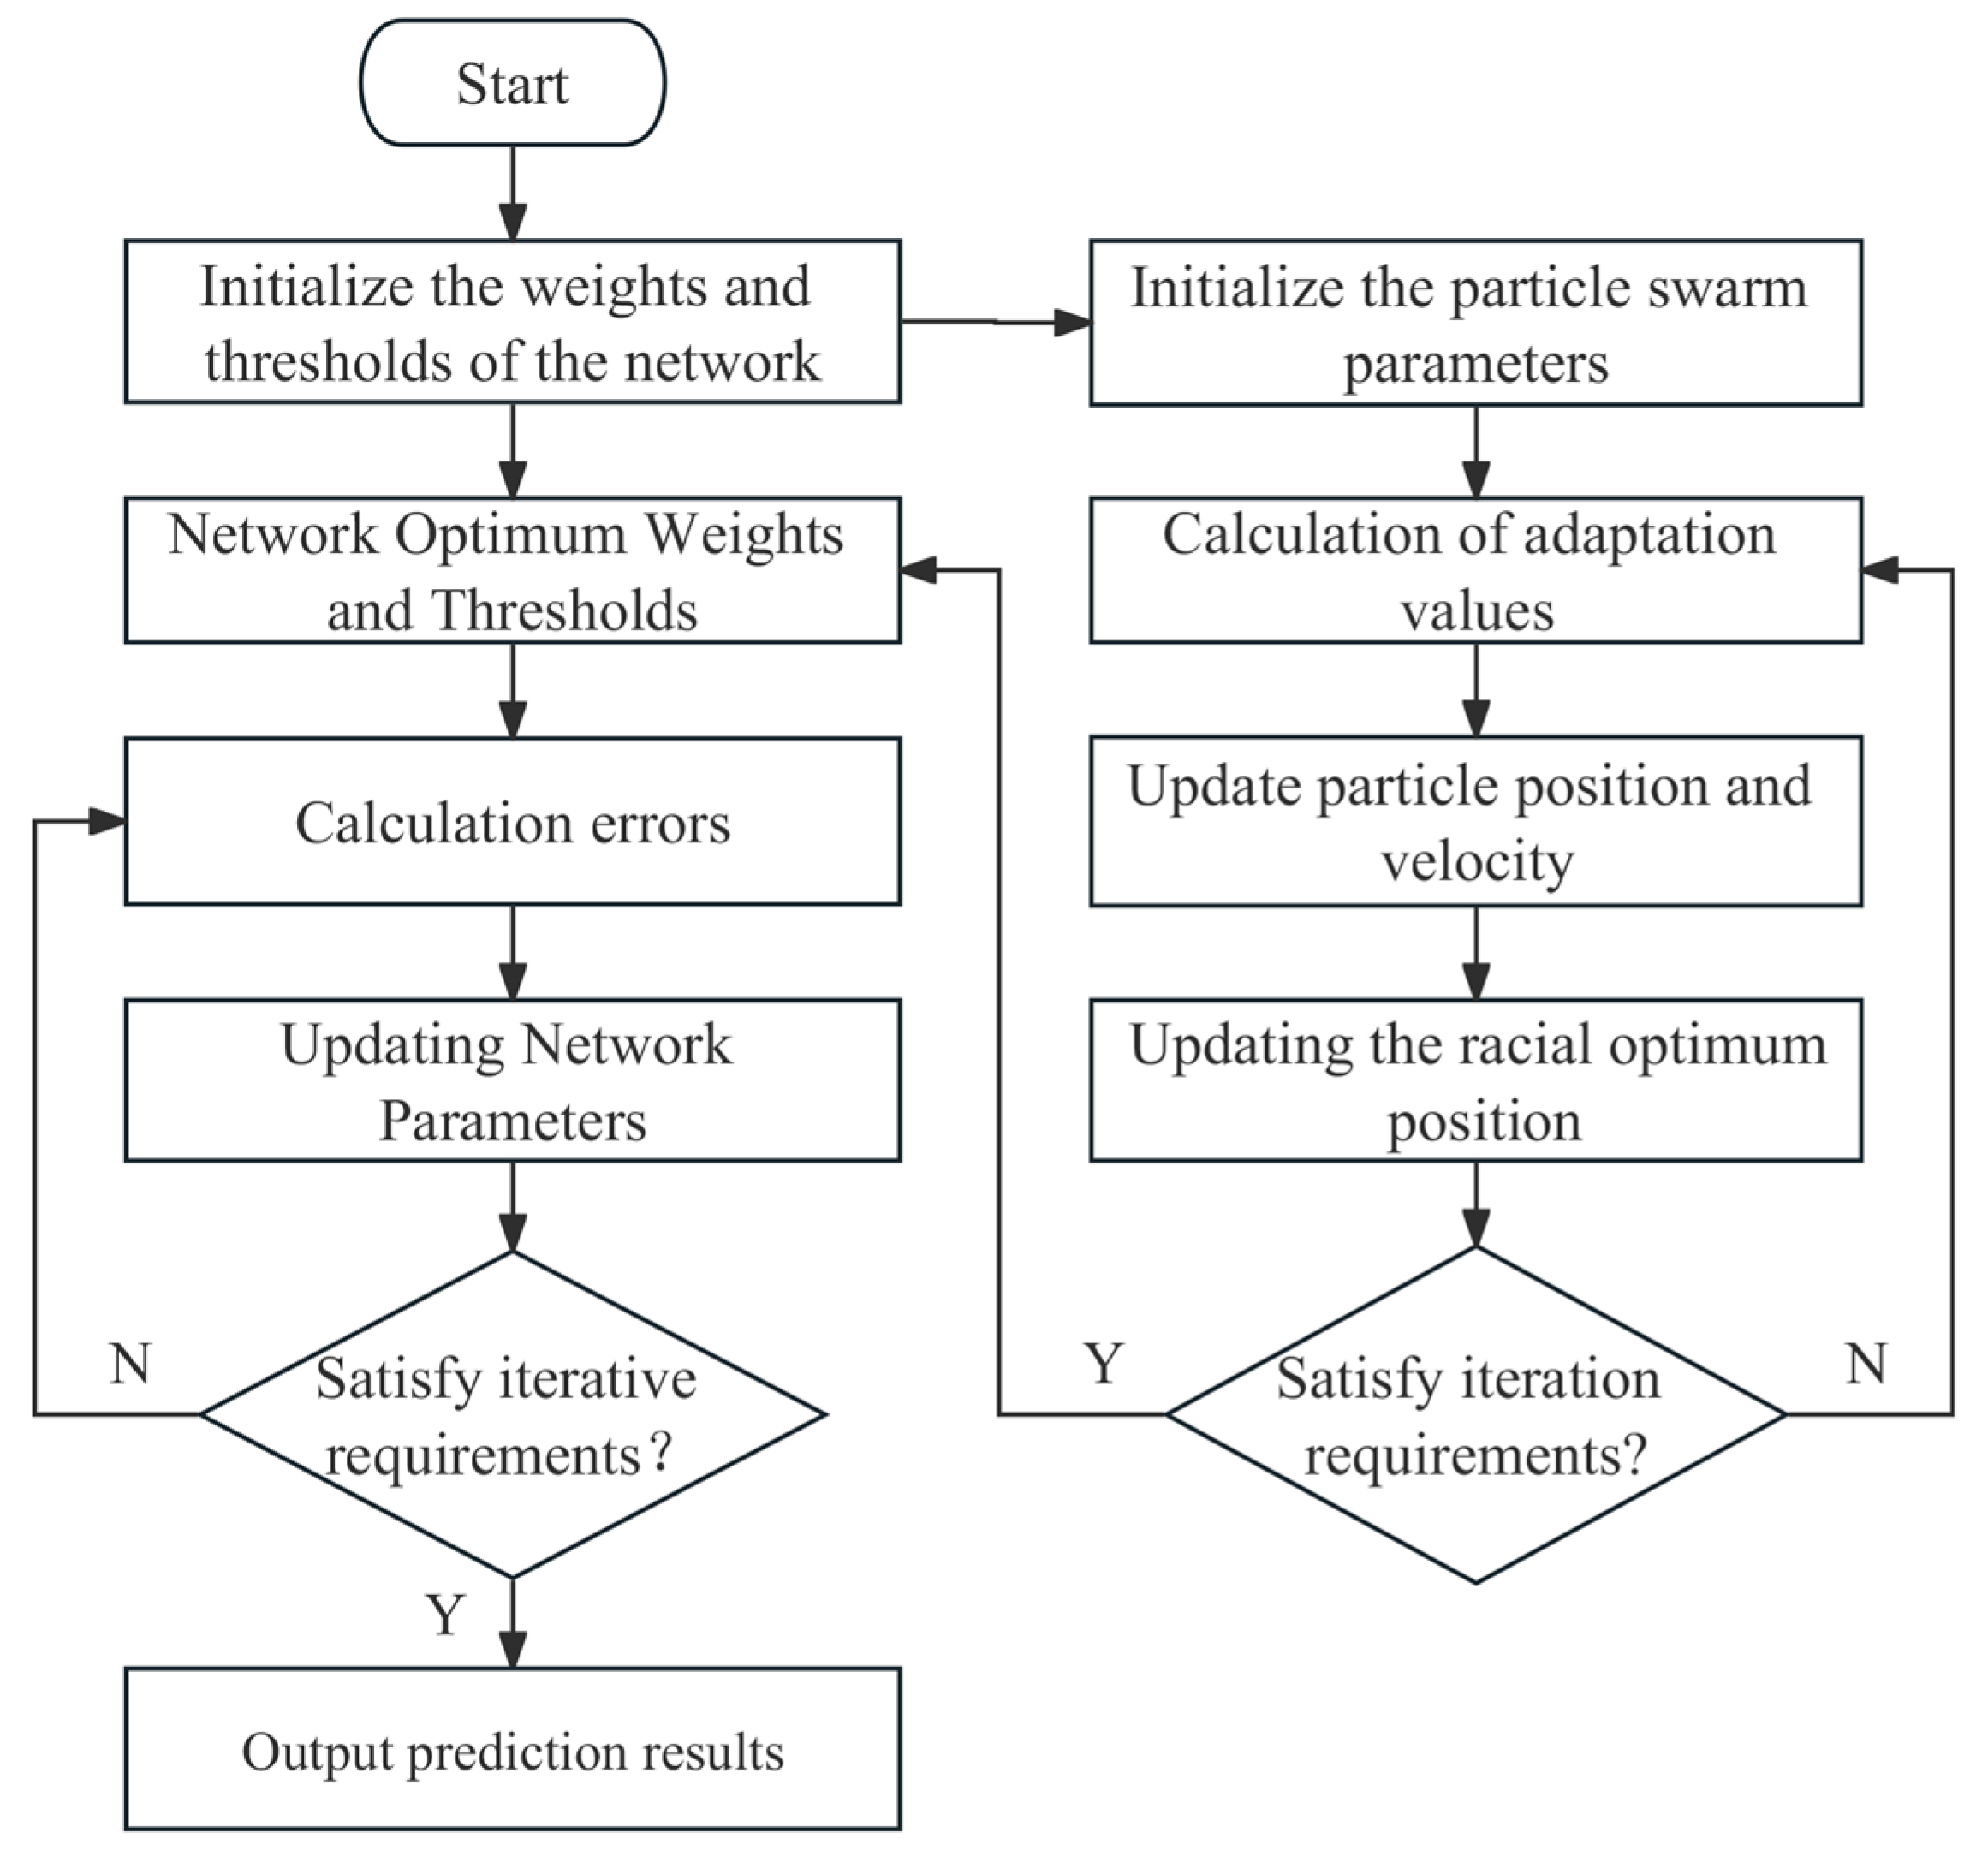
5.1.1. The Steps of PSO-BPNN
- (1)
- Initialization operations are carried out on the parameters of the BP neural network, such as weights and thresholds, to ensure their proper starting values.
- (2)
- Initialize the parameters of the PSO algorithm, including the velocity and position of the particle, inertia weight and acceleration.
- (3)
- The fitness of each particle in the population is calculated, and the position and velocity of the particle are continuously updated based on their fitness values to obtain the optimal position for the entire population. Upon meeting the maximum iteration requirement, the algorithm terminates, yielding an optimal solution for network weight and minimum value. This method can be iteratively updated until all requirements are met.
- (4)
- Until the error satisfies the prediction requirements, the parameters of the network are adjusted in accordance with the estimated error situation between the prediction strategy output value and the actual value.
- (5)
- The model iterates continuously and, when the allotted number of iterations is reached, outputs the final forecast.
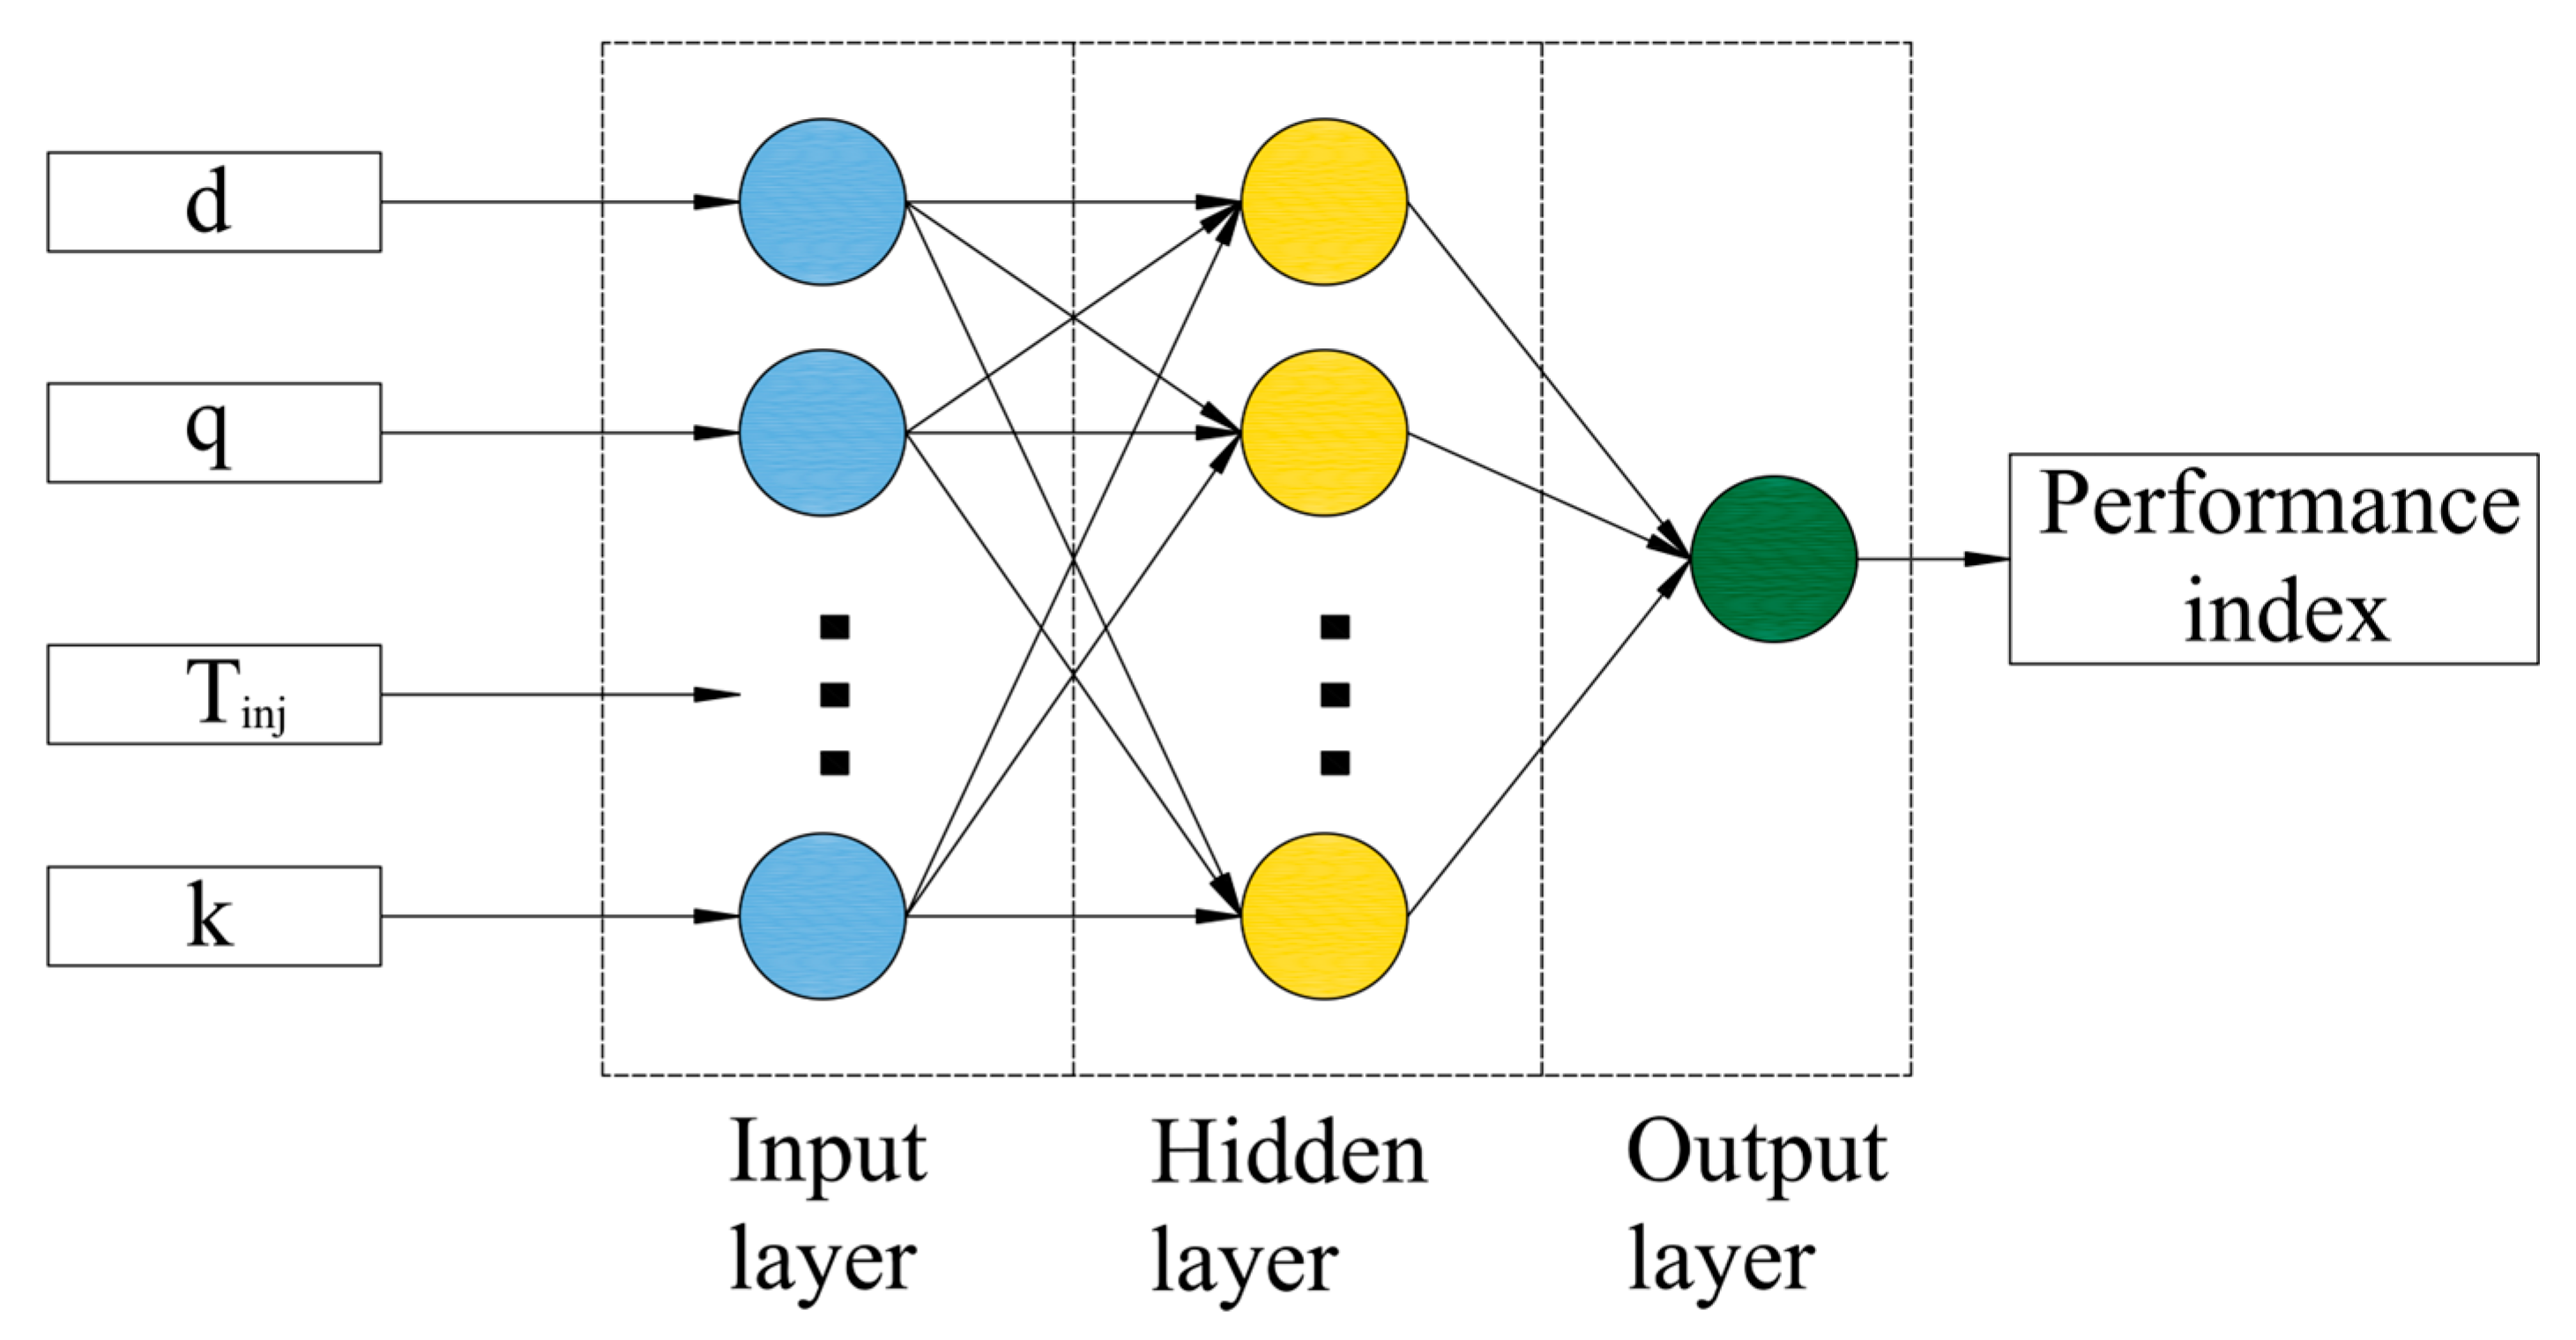
5.1.2. Build PSO-BPNN Model
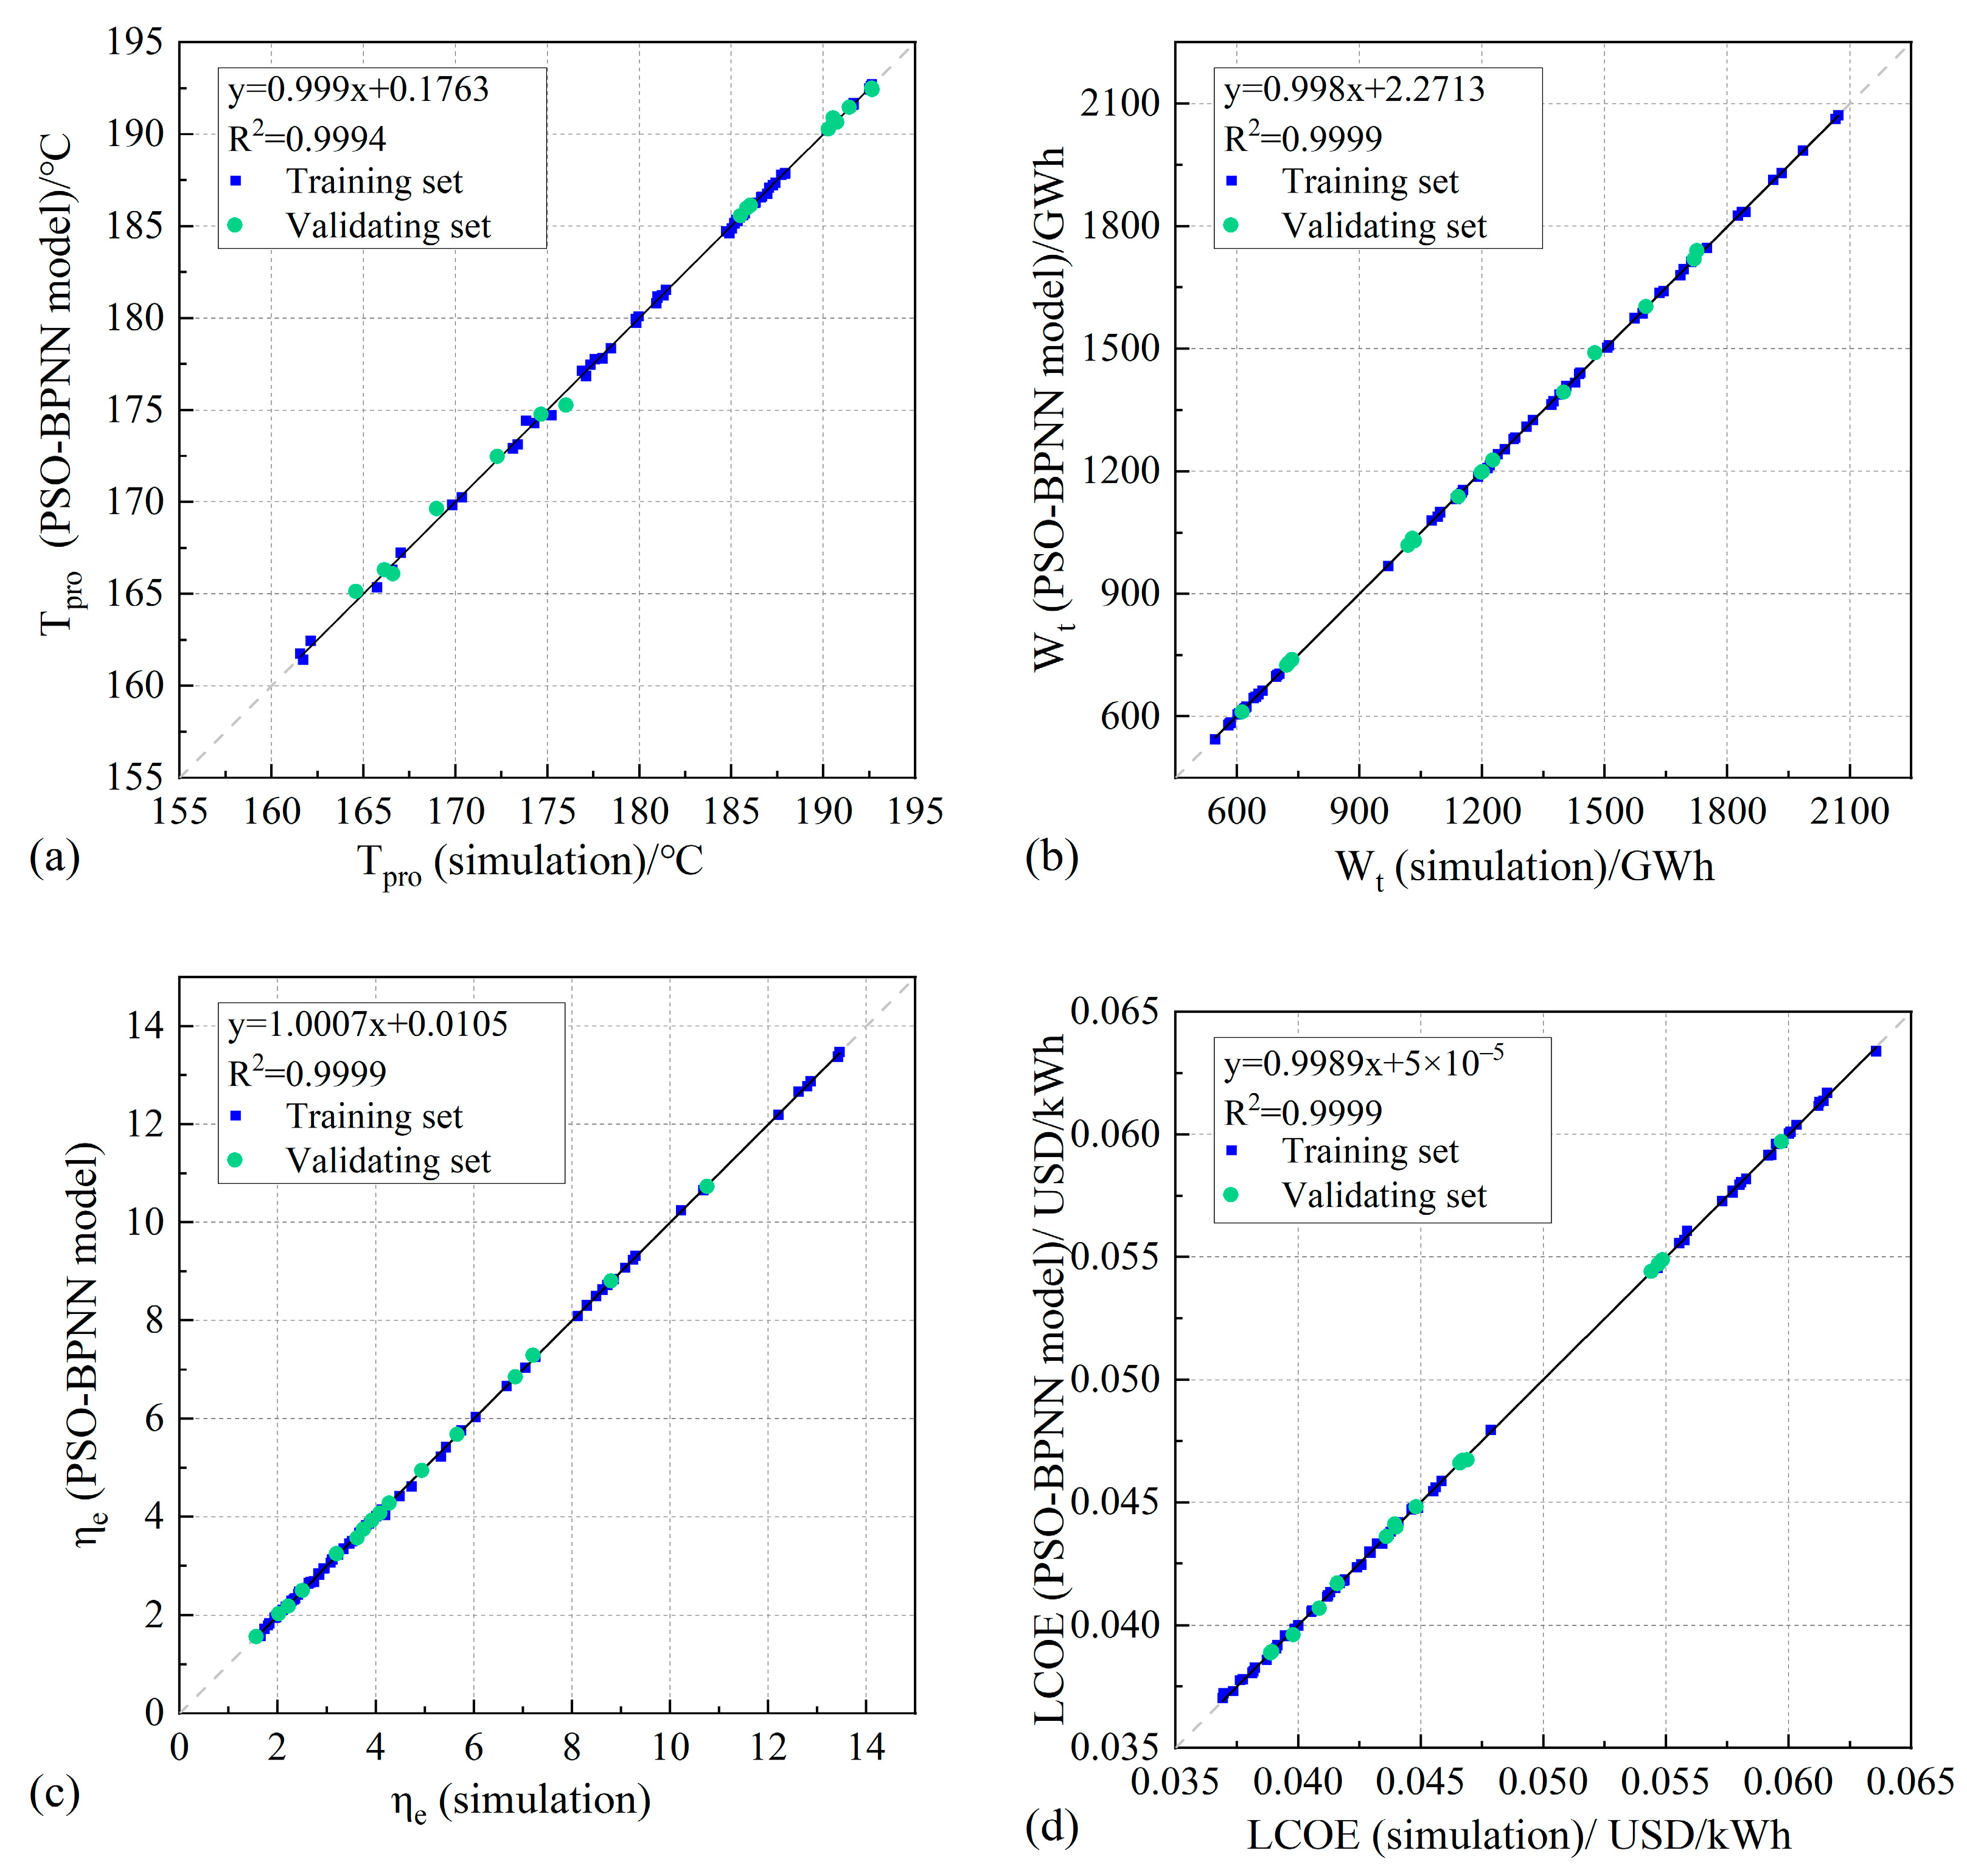
5.1.3. Prediction Accuracy Evaluation
5.2. Evaluation Modeling of EGS Power Generation Performance
- (1)
- Establish an evaluation index system, compare each element pairwise and construct a comparative judgment matrix based on the relative importance of each index (Equation (15)). The construction often employs the 1~9 scale method.
- (2)
- The consistency test is conducted on the constructed comparative judgment matrix. The process of solving the weight of the evaluation index is essentially the process of solving the eigenvector corresponding to the maximum eigenroot of the judgment matrix, and the eigenvector represents the importance of each element. The calculation formula is shown in Equations (16) and (17).where is the order of the judgment matrix; is the relative importance of the two indicators in the judgment matrix.
- (3)
- Verify whether the judgment matrix meets the criteria of consistency, . When , the matrix needs to be rebuilt if it fails to meet the consistency requirement, which can be expressed in Equations (18) and (19):where is the consistency index; is the random consistency index. When , the [43].
- (4)
- Under the condition of satisfying the consistency test, the evaluation of the EGS power generation performance of three vertical wells can be determined according to Equation (20).where is the parameter set of each indicator after standardization.
6. Results and Discussion
6.1. Performance of ANN Models
6.2. Results of AHP Optimization
6.3. Discussion
7. Conclusions
Author Contributions
Funding
Data Availability Statement
Acknowledgments
Conflicts of Interest
References
- Kristmannsdóttir, H.; Ármannsson, H. Environmental aspects of geothermal energy utilization. Geothermics 2003, 32, 451–461. [Google Scholar] [CrossRef]
- Liao, Y.Z.; Liu, Y.G.; Wang, G.L.; Li, T.X.; Liu, F.; Wei, S.C.; Yan, X.X.; Gan, H.N.; Zhang, W. Genesis Mechanisms of Geothermal Resources in Mangkang Geothermal Field, Tibet, China: Evidence from Hydrochemical Characteristics of Geothermal Water. Water 2022, 14, 4041. [Google Scholar] [CrossRef]
- Zhang, X.; Du, D.; Man, T.; Ge, Z.; Huppert, H. Particle clogging mechanisms in hyporheic exchange with coupled lattice Boltzmann discrete element simulations. Phys. Fluids 2024, 36, 013312. [Google Scholar] [CrossRef]
- Wang, G.L.; Zhang, W.; Ma, F.; Lin, W.J.; Liang, J.Y.; Zhu, X. Overview on hydrothermal and hot dry rock researches in China. China Geol. 2018, 1, 273–285. [Google Scholar] [CrossRef]
- Soltani, M.; Farshad, M.K.; Denghani-sanij, A.R.; Kazemi, A.R.; Bordbar, N.; Farshchi, M.J.; Elmi, M.; Gharali, K.; Dusseault, M.B. A comprehensive study of geothermal heating and cooling systems. Sustain. Cities Soc. 2019, 44, 793–818. [Google Scholar] [CrossRef]
- Lei, Z.H.; Zhang, Y.J.; Yu, Z.W.; Hu, Z.J.; Li, L.Z.; Zhang, S.Q.; Fu, L.; Zhou, L.; Xie, Y.Y. Exploratory research into the enhanced geothermal system power generation project: The Qiabuqia geothermal field, Northwest China. Renew. Energy 2019, 139, 52–70. [Google Scholar] [CrossRef]
- Lund, J.W.; Freeston, D.H.; Boyd, T.L. Direct application of geothermal energy: 2005 worldwide review. Geothermics 2005, 34, 691–727. [Google Scholar] [CrossRef]
- Zhang, C.; Hu, S.B.; Huang, R.H.; Wang, Z.T.; Qin, S.; Zuo, Y.H.; Song, Y.C. Research status of heat source mechanism of the hot dry rock geothermal resources and its implications to the studies of genetic mechanism. Prog. Geophys. 2022, 37, 1907–1919. (In Chinese) [Google Scholar]
- Zhou, L.; Zhang, Y.J.; Hu, Z.J.; Yu, Z.W.; Luo, Y.F.; Lei, Y.D.; Lei, H.L.; Lei, Z.H.; Ma, Y.Q. Analysis of influencing factors of the production performance of an enhanced geothermal system (EGS) with numerical simulation and artificial neural network (ANN). Energy Build. 2019, 200, 31–46. [Google Scholar] [CrossRef]
- Lei, Y.D.; Yuan, Y.J.; Qin, G.X.; Ba, R.S.; Zhao, Z.; Li, T.B. Analysis of Thermal Storage Characteristics of the Guide Zhacang Geothermal Field in Gonghe Basin Based on Logging Data. Acta Geosci. Sin. 2023, 44, 145–157. (In Chinese) [Google Scholar]
- Gudmundsdottir, H.; Horne, R.N. Prediction modeling for geothermal reservoirs using deep learning. In Proceedings of the 45th Workshop on Geothermal Reservoir Engineering, Stanford, CA, USA, 10–12 February 2020. [Google Scholar]
- Zhang, X.; Huang, Z.; Lei, Q.; Yao, J.; Gong, L.; Sun, Z.; Li, Y. Impact of fracture shear dilation on long-term heat extraction in Enhanced Geothermal Systems: Insights from a fully-coupled thermo-hydro-mechanical simulation. Geothermics 2021, 96, 102216. [Google Scholar] [CrossRef]
- Lei, Z.H.; Zhang, Y.L.; Cui, Q.L.; Shi, Y. The injection-production performance of an enhanced geothermal system considering fracture network complexity and thermo-hydro-mechanical coupling in numerical simulations. Sci. Rep. 2023, 13, 14558. [Google Scholar] [CrossRef] [PubMed]
- Gong, F.; Guo, T.; Sun, W.; Li, Z.; Yang, B.; Chen, Y.; Qu, Z. Evaluation of geothermal energy extraction in Enhanced Geothermal System (EGS) with multiple fracturing horizontal wells (MFHW). Renew. Energy 2020, 151, 1339–1351. [Google Scholar] [CrossRef]
- Liao, J.; Xu, B.; Mehmood, F.; Hu, K.; Wang, H.; Hou, Z. Numerical study of the long-term performance of EGS based on discrete fracture network with consideration of fracture deformation. Renew. Energy 2023, 216, 119045. [Google Scholar] [CrossRef]
- Zhang, C.; Jiang, G.Z.; Jia, X.F.; Li, S.T.; Zhang, S.S.; Hu, D.; Hu, S.B.; Wang, Y.B. Parametric study of the production performance of an enhanced geothermal system: A case study at the Qiabuqia geothermal area, northeast Tibetan plateau. Renew. Energy 2018, 132, 959–978. [Google Scholar] [CrossRef]
- Xu, T.F.; Yuan, Y.L.; Jia, X.F.; Lei, Y.D.; Li, S.D.; Feng, B.; Hou, Z.Y.; Jiang, Z.J. Prospects of power generation from an enhanced geothermal system by water circulation through two horizontal wells: A case study in the Gonghe Basin, Qinghai Province. China. Energy 2018, 148, 196–207. [Google Scholar] [CrossRef]
- Chen, T.R.; Liu, G.; Liao, S.M. A comparison study of reservoir boundary conditions of Enhanced Geothermal Systems (EGS). Energy Procedia 2019, 160, 301–309. [Google Scholar] [CrossRef]
- Cui, H.B.; Tang, J.P.; Jiang, X.T. Influence of permeability on reservoir change during dry hot rock mining. Hydrogeol. Eng. Geol. 2020, 47, 171–180. (In Chinese) [Google Scholar]
- Lous, M.L.; Larroque, F.; Dupuy, A.; Moignard, A. Thermal performance of a deviated deep borehole heat exchanger: Insights from a synthetic coupled heat and flow model. Geothermics 2015, 57, 157–172. [Google Scholar] [CrossRef]
- Wang, Z.; Wang, F.; Liu, J.; Ma, Z.; Han, E.; Song, M. Field test and numerical investigation on the heat transfer characteristics and optimal design of the heat exchangers of a deep borehole ground source heat pump system. Energy Convers. Manag. 2017, 153, 603–615. [Google Scholar] [CrossRef]
- Sun, Z.X.; Zhang, X.; Xu, Y.; Yao, J.; Wang, H.X.; Lv, S.; Sun, Z.L.; Huang, Y.; Cai, M.Y.; Huang, X. Numerical simulation of the heat extraction in EGS with thermal-hydraulic-mechanical coupling method based on discrete fractures model. Energy 2017, 120, 20–33. [Google Scholar] [CrossRef]
- Huang, Z.; Chen, Z.J. Comparison of different machine learning algorithms for predicting the SAGD production performance. J. Pet. Sci. Eng. 2021, 202, 108559. [Google Scholar] [CrossRef]
- Senturk, A.M. Multi-stage artificial neural network structure-based optimization of geothermal energy powered Kalina cycle. J. Therm. Anal. Calorim. 2021, 145, 829–849. [Google Scholar] [CrossRef]
- Shahdi, A.; Lee, S.; Karpatne, A.; Nojabaei, B. Exploratory analysis of machine learning methods in predicting subsurface temperature and geothermal gradient of Northeastern United States. Geotherm. Energy 2021, 9, 18. [Google Scholar] [CrossRef]
- Khosravi, A.; Syri, S. Modeling of geothermal power system equipped with absorption refrigeration and solar energy using multilayer perceptron neural network optimized with imperialist competitive algorithm. J. Clean. Prod. 2020, 276, 124216. [Google Scholar] [CrossRef]
- Akın, S.; Kok, M.V.; Uraz, I. Optimization of well placement geothermal reservoirs using artificial intelligence. Comput. Geosci. 2010, 36, 776–785. [Google Scholar] [CrossRef]
- Yilmaz, C.; Koyuncu, I. Thermoeconomic modeling and artificial neural network optimization of Afyon geothermal power plant. Renew. Energy 2021, 163, 1166–1181. [Google Scholar] [CrossRef]
- Zhang, Y.; Zhang, Y.J.; Zhou, L.; Lei, Z.H.; Guo, L.L.; Zhou, J. Reservoir stimulation design and evaluation of heat exploitation of a two-horizontal-well enhanced geothermal system (EGS) in the Zhacang geothermal field, Northwest China. Renew. Energy 2022, 183, 330–350. [Google Scholar] [CrossRef]
- Zeng, Y.C.; Tang, L.S.; Wu, N.Y.; Cao, Y.F. Analysis of influencing factors of production performance of enhanced geothermal system: A case study at Yangbajing geothermal field. Energy 2017, 127, 218–235. [Google Scholar] [CrossRef]
- Dong, J.; He, P.; Liu, H.H.; Guan, Y.; Liu, H.S.; Xia, W.Q.; Dong, J.R. AHP-Based Evaluation of the Suitability of Shallow Geothermal Energy Utilization in GSHP System. Front. Energy Res. 2022, 10, 3389. [Google Scholar] [CrossRef]
- Yalcin, M.; Sari, F.; Yildiz, A. Exploration of potential geothermal fields using MAXENT and AHP: A case study of the Buyuk Menderes Graben. Geothermics 2023, 114, 102792. [Google Scholar] [CrossRef]
- Sener, E.; Sener, S. Exploration of geothermal potential using integrated fuzzy logic and analytic hierarchy process (AHP) in Agri, Eastern Turkey. Turk. J. Earth Sci. 2021, 30, 1134–1150. [Google Scholar] [CrossRef]
- Han, Z.H.; Han, S.J.; Cao, C.G.; Han, Y.S. Petrogenesis and Geological Significance of the Zhacanggou Granodiorite in Guide Basin, Qinghai Province: Constraints from Zircon U Pb Age, Petrogeochemistry and Hflsotope. J. Jilin Univ. 2023, 53, 177–195. (In Chinese) [Google Scholar]
- Jiang, Z.J.; Xu, T.F.; Owen, D.D.R.; Jia, X.F.; Feng, B.; Zhang, Y. Geothermal fluid circulation in the Guide Basin of the northeastern Tibetan Plateau: Isotopic analysis and numerical modeling. Geothermics 2018, 71, 234–244. [Google Scholar] [CrossRef]
- Lang, X.J.; Lin, W.J.; Liu, Z.M.; Xing, L.X.; Wang, G.L. Hydrochemical characteristics of geothermal water in guide basin. Earth Sci. 2016, 41, 1723–1734. (In Chinese) [Google Scholar]
- Fang, B.; Zhou, X.; Liang, S.H. Characteristics and utilization of the Zhacang hot springs in guide county, Qinghai. Geoscience 2009, 23, 57–63. (In Chinese) [Google Scholar]
- Garnish, J.D. Hot dry rock-a european perspective. Geotherm. Resour. Counc. Trans. 1985, 9, 329–337. [Google Scholar]
- Guo, L.L. Test and Model Research of Hydraulic Fracturing Andreservoir Damage Evolution in Enhanced Geothermal System; Jilin University: Changchun, China, 2016. [Google Scholar]
- César, R.C.; Mondéjar, R.; Segovia, C.; Martín, A.V. World geothermal power production status: Energy, environmental and economic study of high enthalpy technologies. Energy 2012, 42, 10–18. [Google Scholar]
- Lukawski, M.Z.; Anderson, B.; Augustine, C.; Capuano, L.E.; Beckers, K.F.; Livesay, B. Cost analysis of oil, gas, and geothermal well drilling. J. Petroleum. Sci. Eng. 2014, 118, 1–14. [Google Scholar] [CrossRef]
- Tibshirani, R.; Walther, G.; Hastie, T. Estimating the number of clusters in a data set via the gap statistic. J. R. Stat. Soc. Ser. B 2001, 63, 411–423. [Google Scholar] [CrossRef]
- Saaty, T.L. Multicriteria Decision Making: The Analytic Hierarchy Process; McGraw-Hill: New York, NY, USA, 1980. [Google Scholar]


| Parameters | Value |
|---|---|
| Rock density | 2711 kg/m3 |
| Rock porosity | 1.86% |
| Rock permeability (kx = ky = kz) | 3.66 × 10⁻¹⁶ m2 |
| Rock thermal conductivity | 3.36 W/(m·K) |
| Rock-specific heat capacity | 713 J/(kg·K) |
| Fracture porosity | 50% |
| Fracture permeability (kx = ky = kz) | 2.0 × 10⁻¹¹ m2 |
| Initial reservoir temperature | T = 219 − 0.053z (°C) |
| Initial reservoir pressure | P = 4.7 × 10⁷ − 10,000z (Pa) |
| Productivity index | 5.0 × 10⁻¹² m3 |
| Operation time | 30 years |
| Value | |||
|---|---|---|---|
| Well Spacing, d (m) | 400 | 500 | 600 |
| Water Injection Tate, q (kg/s) | 20 | 40 | 60 |
| Injection Temperature, Tinj (°C) | 30 | 50 | 70 |
| Fracture Permeability, k (m2) | 2 × 10⁻¹² | 2 × 10⁻¹¹ | 2 × 10⁻¹⁰ |
| Evaluation Indicators | BPNN | PSO-BPNN | ||||
|---|---|---|---|---|---|---|
| Training set | ||||||
| 0.1589 | 0.0886 | 0.2147 | 0.1205 | 0.0681 | 0.1695 | |
| 7.1527 | 0.7486 | 10.4210 | 2.3274 | 0.2139 | 3.0900 | |
| 0.0526 | 1.3191 | 0.0721 | 0.0186 | 0.4656 | 0.0291 | |
| LCOE | 0.0003 | 0.6650 | 0.0004 | 0.0001 | 0.1253 | 0.0001 |
| Validating set | ||||||
| 0.4360 | 0.2522 | 0.5521 | 0.2571 | 0.1470 | 0.3421 | |
| 9.5780 | 0.8191 | 13.2173 | 4.1580 | 0.3588 | 5.9462 | |
| 0.1266 | 3.0370 | 0.1608 | 0.0209 | 0.5244 | 0.0353 | |
| LCOE | 0.0003 | 0.7129 | 0.0005 | 0.0001 | 0.1341 | 0.0001 |
| A | LCOE | Indicators | ||||
|---|---|---|---|---|---|---|
| 1 | 1/3 | 1/2 | 1/6 | 0.0827 | ||
| 3 | 1 | 2 | 1/2 | 0.2668 | ||
| 2 | 1/2 | 1 | 1/3 | 0.1540 | ||
| LCOE | 6 | 2 | 3 | 1 | 0.4965 |
Disclaimer/Publisher’s Note: The statements, opinions and data contained in all publications are solely those of the individual author(s) and contributor(s) and not of MDPI and/or the editor(s). MDPI and/or the editor(s) disclaim responsibility for any injury to people or property resulting from any ideas, methods, instructions or products referred to in the content. |
© 2024 by the authors. Licensee MDPI, Basel, Switzerland. This article is an open access article distributed under the terms and conditions of the Creative Commons Attribution (CC BY) license (https://creativecommons.org/licenses/by/4.0/).
Share and Cite
Zhou, L.; Yan, P.; Zhang, Y.; Lei, H.; Hao, S.; Ma, Y.; Sun, S. Using Particle Swarm Optimization with Backpropagation Neural Networks and Analytic Hierarchy Process to Optimize the Power Generation Performance of Enhanced Geothermal System (EGS). Water 2024, 16, 509. https://doi.org/10.3390/w16030509
Zhou L, Yan P, Zhang Y, Lei H, Hao S, Ma Y, Sun S. Using Particle Swarm Optimization with Backpropagation Neural Networks and Analytic Hierarchy Process to Optimize the Power Generation Performance of Enhanced Geothermal System (EGS). Water. 2024; 16(3):509. https://doi.org/10.3390/w16030509
Chicago/Turabian StyleZhou, Ling, Peng Yan, Yanjun Zhang, Honglei Lei, Shuren Hao, Yueqiang Ma, and Shaoyou Sun. 2024. "Using Particle Swarm Optimization with Backpropagation Neural Networks and Analytic Hierarchy Process to Optimize the Power Generation Performance of Enhanced Geothermal System (EGS)" Water 16, no. 3: 509. https://doi.org/10.3390/w16030509