Article

Simulation Study on the Mechanical Effect of CO2 Geological Storage in Ordos Demonstration Area

1
Harbin Center for General Survey of Natural Resources, CGS, Harbin 150081, China
2
Observation and Research Station of Earth Critical Zone on Black Soil in Harbin, Harbin 150081, China
3
School of Civil and Architectural Engineering, East China University of Technology, Nanchang 330013, China
4
Engineering Research Center for Geological Environment and Underground Space of Jiangxi Province, East China University of Technology, Nanchang 330013, China
5
Department of Natural Resources of Jiangxi Province, Nanchang 330002, China
*
Author to whom correspondence should be addressed.
Water 2024, 16(1), 144; https://doi.org/10.3390/w16010144
Submission received: 10 November 2023 / Revised: 18 December 2023 / Accepted: 21 December 2023 / Published: 29 December 2023
(This article belongs to the Special Issue Effects of Groundwater and Surface Water on the Natural Geo-Hazards)

Abstract

:
In order to understand the long-term process of CO2 storage and demonstrate its safety, multi-field coupled numerical simulation is considered a crucial technology in the field of geological CO2 storage. This study establishes a site-specific homogeneous thermo-hydro-mechanical coupling model based on TOUGH-FLAC3D coupling program using actual stratigraphic data from the Ordos demonstration area. The analysis investigates the transport behavior of CO2 within the formation considering pore permeability homogeneity, incorporates redistribution of effective stress and rock deformation, and provides a mechanical evaluation of the effectiveness of CO2 sequestration at this specific site. The findings indicate that: (1) the sealing effect of the cap rock depends on the difference of permeability between the reservoirs. The greater the permeability difference, the better the sealing effect. (2) High pore fluid pressure can lead to a decrease in the effective stress of rocks, causing deformation. After simulation calculations, the maximum deformation of rocks can reach 7.79 mm within a decade of CO2 injection. (3) Under the condition of continuous CO2 injection, the pore pressure will not be able to dissipate quickly and will continue to rise, and eventually shear failure will occur in the rock layer, but it is mainly concentrated in the lower part of the cap rock.

1. Introduction

Various human activities, particularly fossil fuel burning and land use change, have caused atmospheric carbon dioxide (CO2) to rise over the past 250 years (from 280 ppm to 380 ppm) and are continuing to increase at a rate of 1 ppm/year [1,2], a change that causes global warming. The mitigation process of greenhouse gas emissions such as CO2 into the atmosphere is considered crucial in modern society, hence the emergence of Carbon Capture and Storage (CCS) technology [3]. Through the use of CCS, technology the total abatement costs will be significantly reduced, and the contribution of CCS technology to global CO2 reduction will gradually increase: it is expected to represent 3% of total abatement in 2020, rising to 10% in 2030 then increase to 19% in 2050 [4,5,6,7,8]. It turns out that CCS has the largest share of emissions reduction among all individual emission reduction technologies. In many countries such as the United States, Australia and the United Kingdom, CCS technology has a large potential market, and in China, CCS technology also has the potential for large-scale application. However, the large-scale use of CCS technology will have a negative impact on the environment on which we depend if we do not pay attention to its safety and reliability. When CO2 is injected into the ground, the formation pressure increases. When this pressure is too high and reaches a certain value, CO2 will break through the top cover layer and escape, or the cover layer will be damaged by hydraulic fracturing Excessive pore fluid pressure, resulting in CO2 leakage. Whichever of the above situations occurs, it will have serious consequences [9,10,11].
With the injection of CO2 into the subsurface and its long-term storage, the stress field and chemical field in the layer change, triggering a series of changes in geological factors that affect the stability and safety of long-term storage of CO2. Yang Duoxing et al. found that carbon dioxide-leakage levels and crustal tilt changes vary systematically through time and are highly correlated, indicating increased degrees of carbon dioxide degassing from the fault zone [12]. Xu Lifeng et al. conducted five groups of supercritical CO2 leakage experiments at different initial CO2 temperatures to study the mechanism of internal and external strain differences caused by the phase transition of supercritical CO2 leakage along faults [13]. Sang Guijie et al. investigated the changes in minerals, nanopores, elastic velocity, and mechanical response of carbonate cap rocks caused by rock water/brine-CO2 interactions (CO2 pressure: about 12 MPa; 50 degrees Celsius) to assess the risk of leakage and rock instability caused by injection [14]. Zhao et al. used an MRI visualization system to study the formation characteristics of hydrate caps during CO2 upward leakage under different CO2 flow rates, pressures, and temperatures. They found that the plugging effect of hydrate caps realized the termination of CO2 leakage [15]. The development of numerical simulation techniques based on multi-field coupled models provides a convenient way to evaluate the feasibility, safety, and durability of geological storage of CO2. Credo et al. [16] used reactive solute transport software to simulate the chemical reactions after CO2 injection into the overburden and compared them with experimental data. Bildste et al. [17] used a reactive solute transport model to simulate the change in caprock porosity under the acidification environment. Rutqvist [18] designed the overlapping program of TOUGH2 hydrothermal coupling software and FLAC3D fluid-solid coupling software to realize THM coupling and applied it to geological CO2 storage, considering the mechanical stability of reservoir and cap formation and leakage risk rated Lei Hongwu et al. [19] added a Taishaki mechanics module to TOUGH to analyze a series of thermodynamic changes caused by CO2 injection. Yu Ziwang [20] prepared a code to realize the round calculation of TOUGHREACT and FLAC3D, and applied it to geological CO2 storage to realize the correction of mechanical parameters by chemical Yanjun Zhang et al. [21] proposed a CO2 surface evaluation system based on the surface uplift phenomenon after deep CO2 injection, and studied the changing relationship between the injection volume and surface uplift through numerical simulation.
The Ordos Basin is the first pilot project in China to carry out carbon dioxide salty water layer storage. In previous studies, few multi-field coupling based on mechanical effects were carried out for this site. Therefore, it is necessary to establish a field level CO2 heterogeneous THM coupling model based on actual geological data and measured rock parameters. Under the condition of heterogeneous pore infiltration, analyze the migration law of CO2 in the formation, and combine the redistribution of effective stress and rock deformation to mechanically evaluate the carbon dioxide sequestration effect of the site.

2. Overview of the Study Area

The Ordos Basin extends across the five provinces (regions) of Shaanxi, Gansu, Ningxia, Mongolia and Jin and is the second largest sedimentary basin in China with a total area of 370,000 square kilometers. Overall, the Ordos Basin is tectonically simple and geologically stable, without major fracture zones, and its bedrock consists of Paleoproterozoic and Lower Paleoproterozoic metamorphic facies, and the total thickness of the sedimentary cover can reach 5000 to 10,000 m [22,23,24], so has a very large storage potential.
According to the drilling data, the stratigraphic and lithological features of the study area are summarized and presented in Table 1. The stratigraphy and lithology of each layer and lithology in the CO2 infusion demonstration area of the Ordos Basin are as follows:

3. Conceptual Modeling of the Shiqianfeng Formation at the Ordos Site

CO2 sequestration is a multi-field coupling problem involving temperature, percolation, chemistry and stress. In this article, the author is granted permission to use the Geological CO2 Sequestration, Temperature Field, Seepage Field, Chemical Field and Stress Field (GCS-THCM) coupled simulation program to conduct carbon sequestration simulation research at the Ordos site [26,27]. The program was developed by the author’s Rock Mechanics Group based on two numerical simulation software, TOUGHREACT and FLAC3D, and the coupled temperature-seepage chemistry stress field (THCM) calculations were effectively performed by compiling a lap-linking program between them The two are used to simulate the mechanical effects of the caprock and the changes in surface displacement caused by CO2 filling [28,29,30].

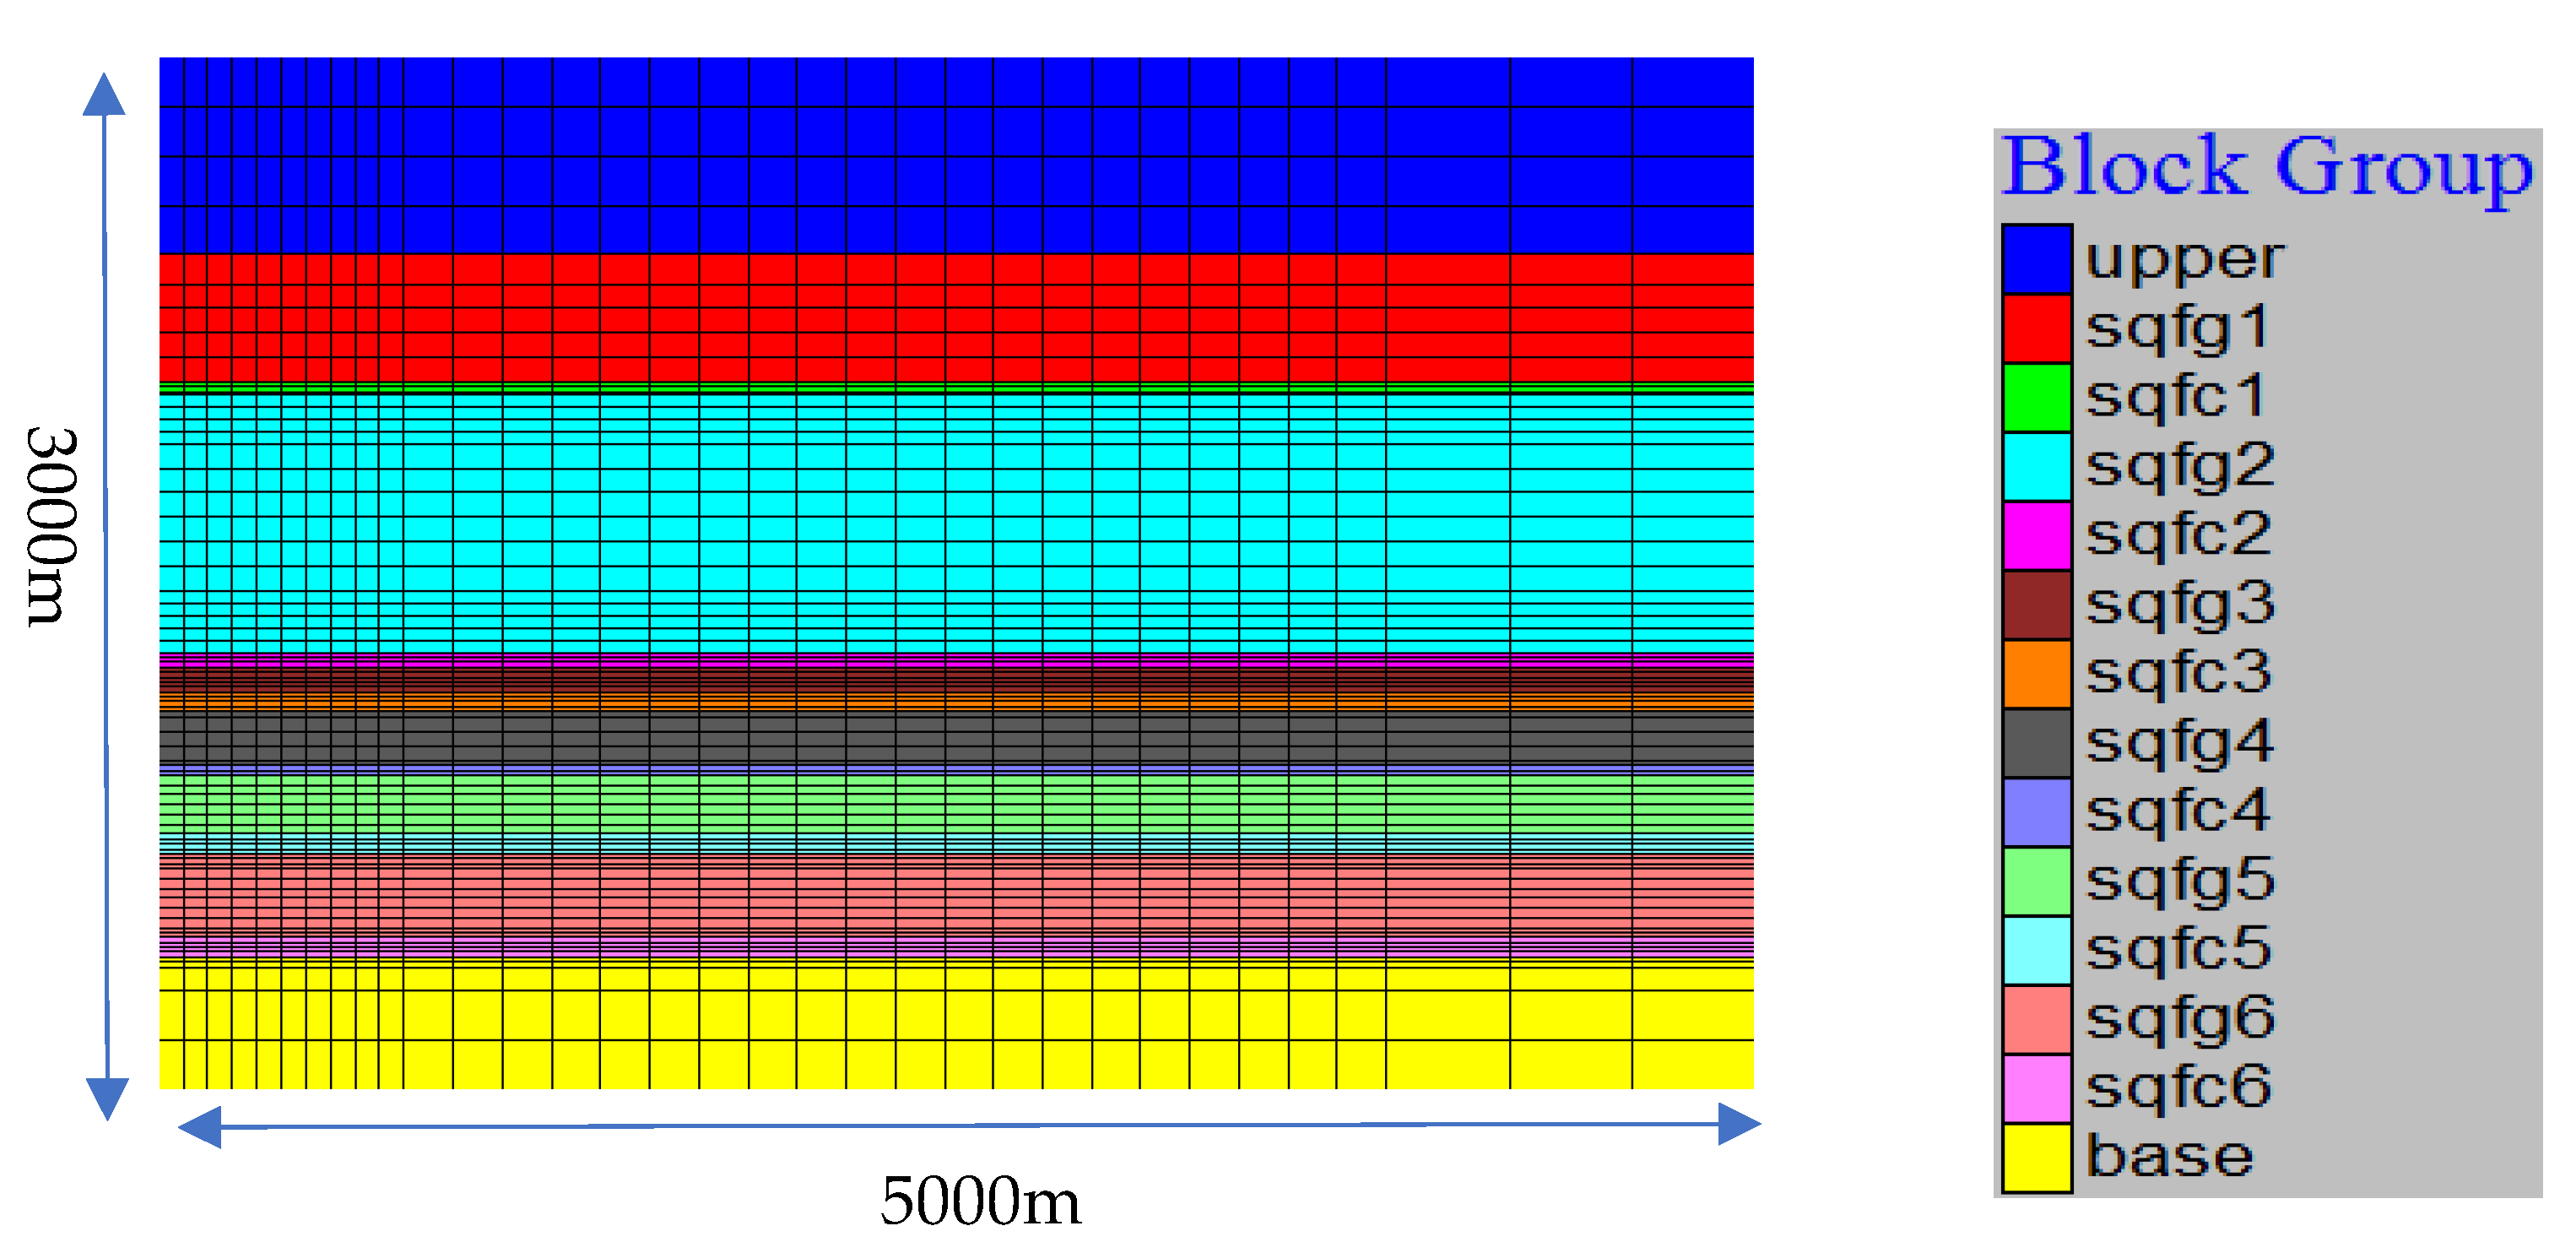
3.1. Grid Segmentation

A 2D model of the reservoir cap assembly of the Shiqianfeng Formation at the Ordos site is constructed. The simulation area is generalized as a symmetrical 2D spatial model with a length of 5000 m and a thickness of 3000 m. The model consists of 14 layers arranged in a top-to-bottom sequence. In this study, the focus is solely on the stratigraphy of the Shiqianfeng Formation. Therefore, for simplicity, both overburden and submontane materials are treated as homogeneous substances. Based on drilling data analysis, it is observed that interactions between sandstone and mudstone formations give rise to a total of 12 layers with 6 composite reservoir-lid layers. Considering the possible range of stress changes caused by CO2 injection and the influence of boundary effects, the model is horizontally decomposed by a non-isometric grid, and the grid gradually increases from the injection point to the boundary, and the entire model is divided into a total of 7931 cells (Figure 1). The essential material parameters of the homogeneous model layer were determined based on this grid model and are shown in Table 2.
Based on the actual total injection volume of 100,000 tons per year and according to the actual reservoir sandstone thickness of the Shiqianfeng Formation, the reservoir sandstone thickness of this reservoir-cap combination is estimated to inject 0.03 to 0.05 million t/a of carbon dioxide per year, which is in the two-dimensional Modeling calculations are discounted, and the injection rate of the fixed flow rate can be estimated to be about 0.002 kg/s.
In this study, we simulated the injection of CO2 into the target reservoir of Shiqianfeng Formation under the condition of constant flow injection, and analyzed the subsurface mechanical processes such as fluid transport, stress field changes, distribution of plastic zones and deformation characteristics of cap rock in the reservoir and cover formation Consideration of homogeneous conditions.

3.2. Initial and Boundary Conditions

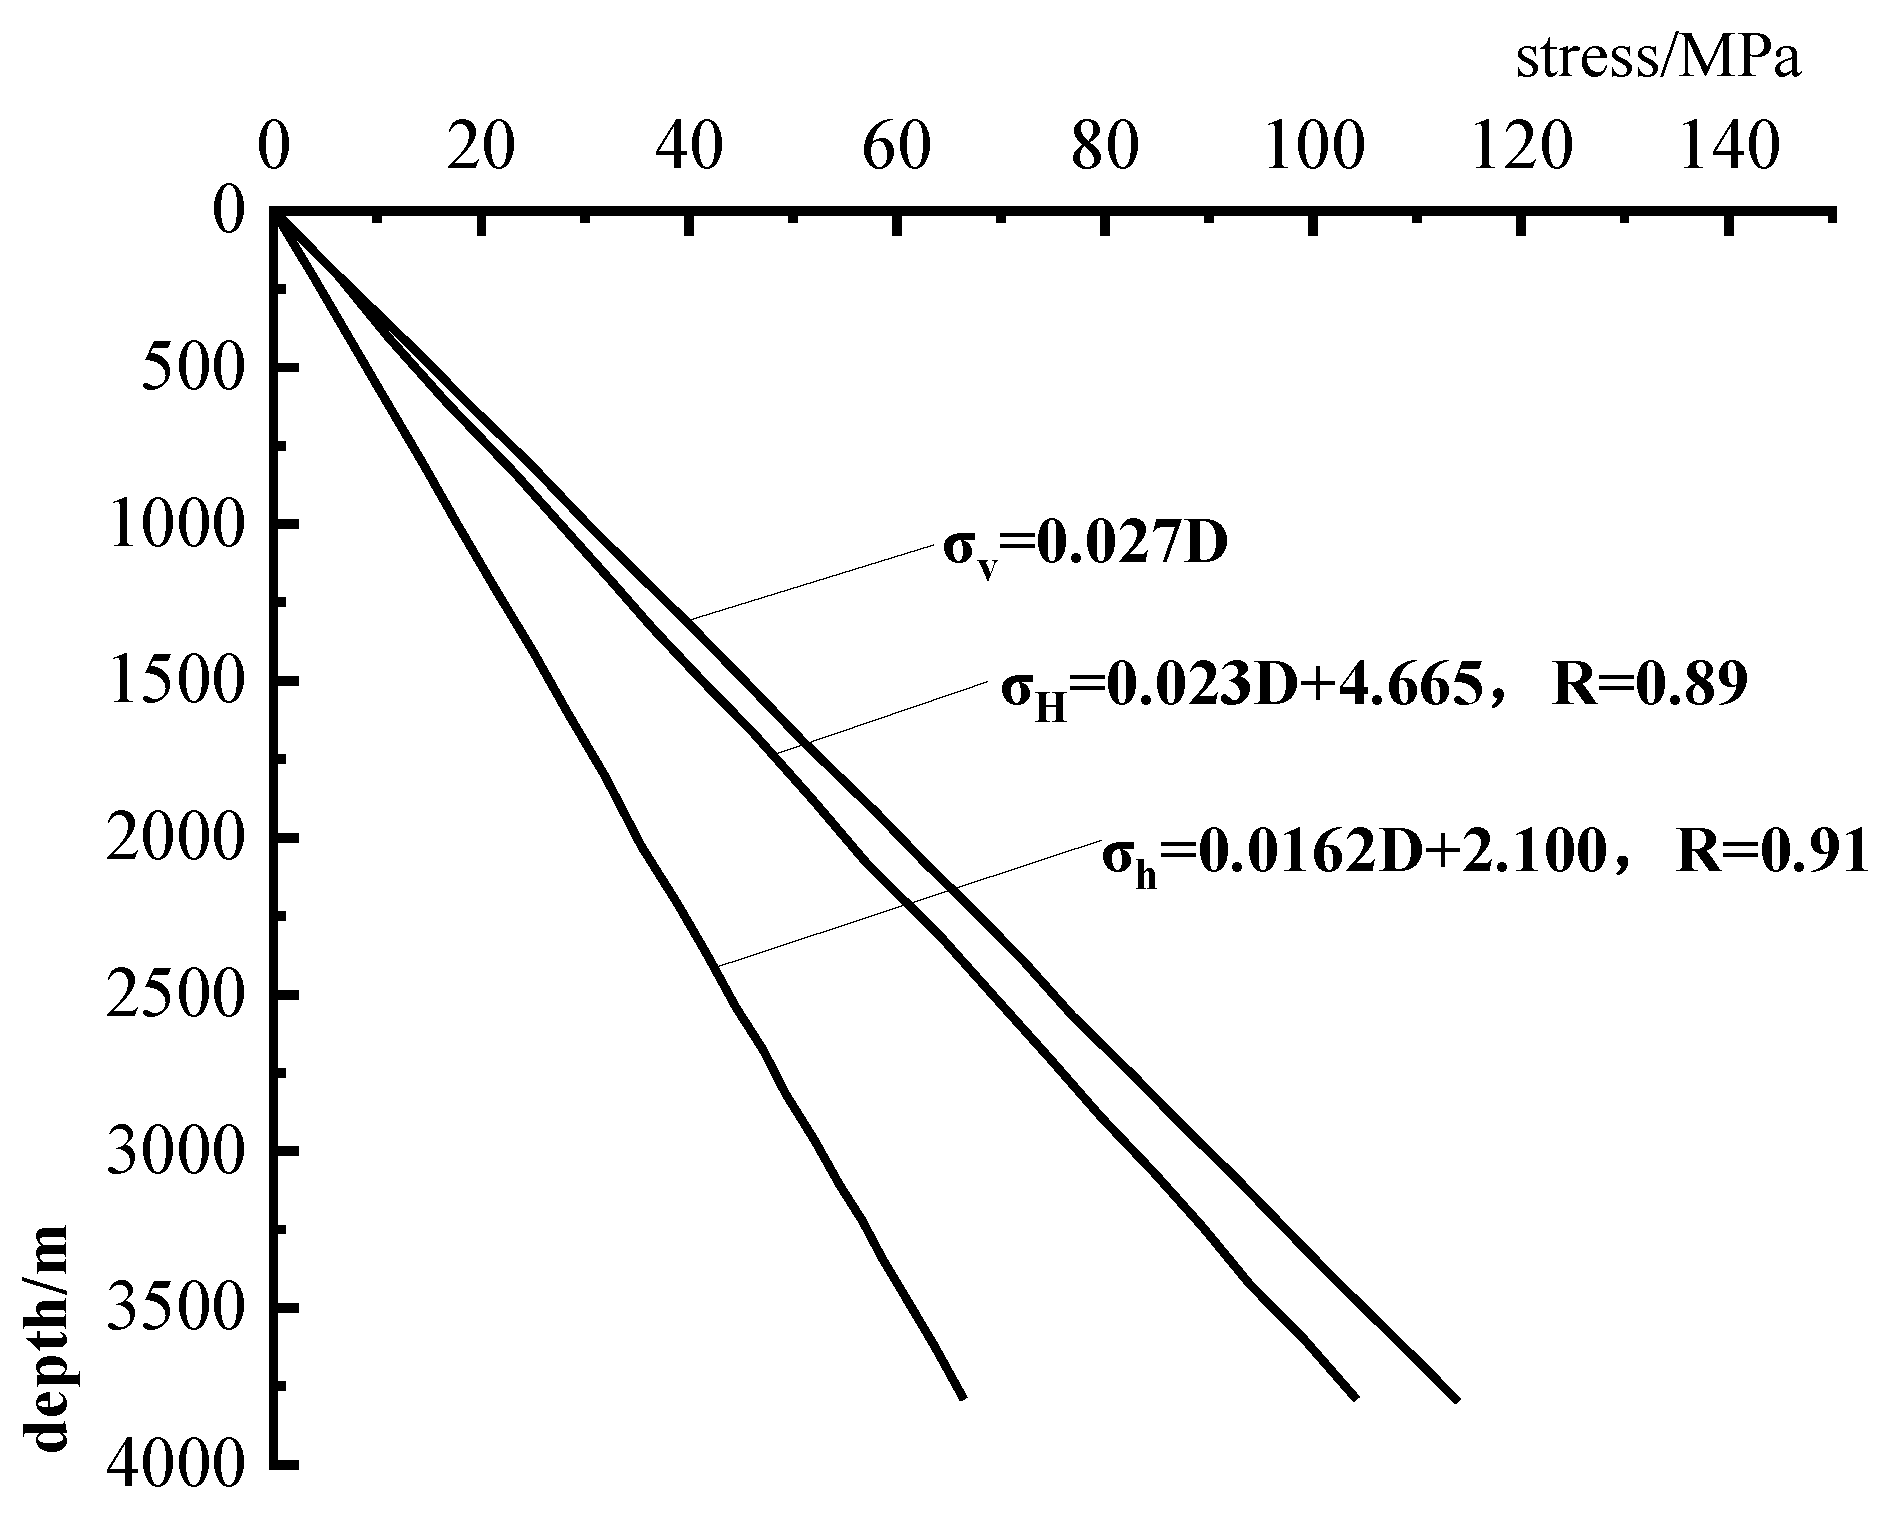
3.2.1. Initial Conditions

The initial state of the model is established before starting the numerical simulation, including the initial temperature, initial pore water pressure, and initial formation stress. The temperature gradient is determined according to the research results of Yu Qiang et al. [31] set to the Ordos area: T = 0.029H + 10.86; The pore water pressure is set to 10 MPa/km (Figure 2) according to the hydrostatic pressure gradient. and the initial geopathic stress is determined with reference to the stress gradient assumed in the study by Bai Lin [32] for geological CO2 disposal at the Ordos site.

3.2.2. Boundary Conditions

Mechanical boundary conditions settings: The top of the model is a free boundary, the bottom is a fixed boundary, and both sides are sliding boundaries. Fluid boundary settings: Since the model is a centrosymmetric half model and the left boundary is the injection center, the left boundary of the model is set as the water-isolated boundary, the right and upper boundaries of the model are set-head boundaries, and the lower boundary of the model is a water-isolated boundary; Temperature Limit Settings: The left limit is an isolated limit and the other limits are fixed temperature limits.

4. Results and Discussion
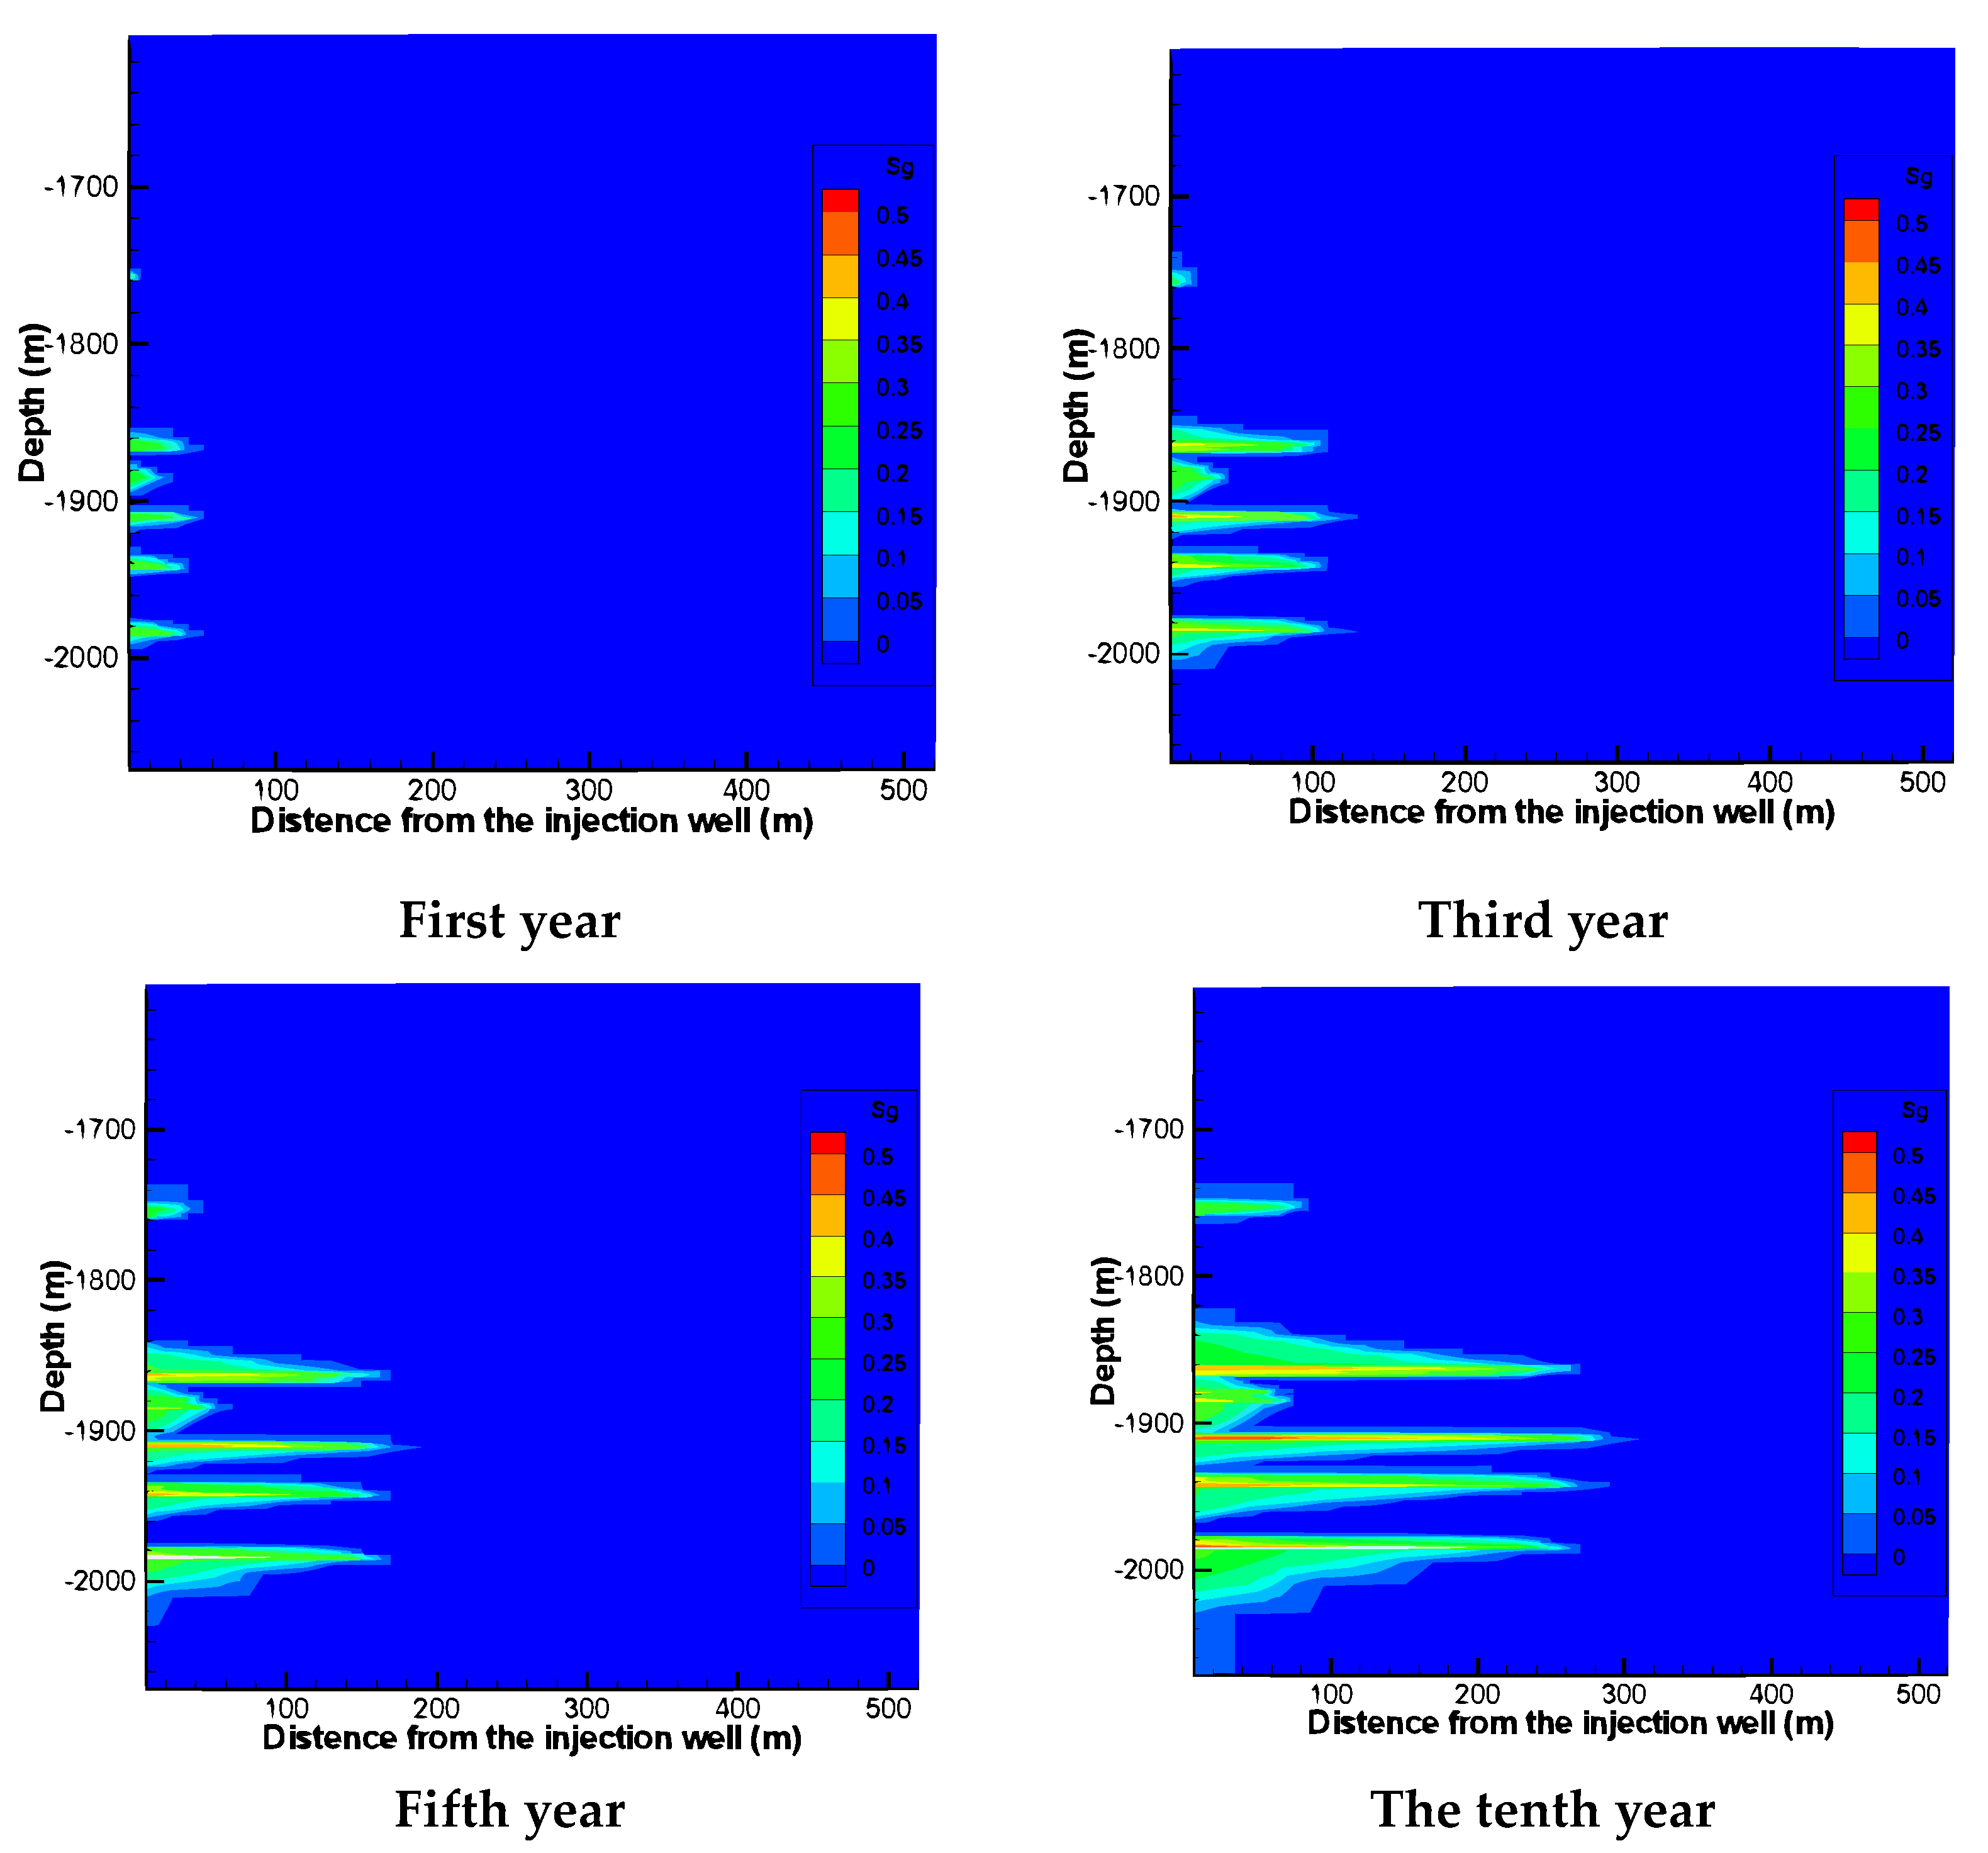
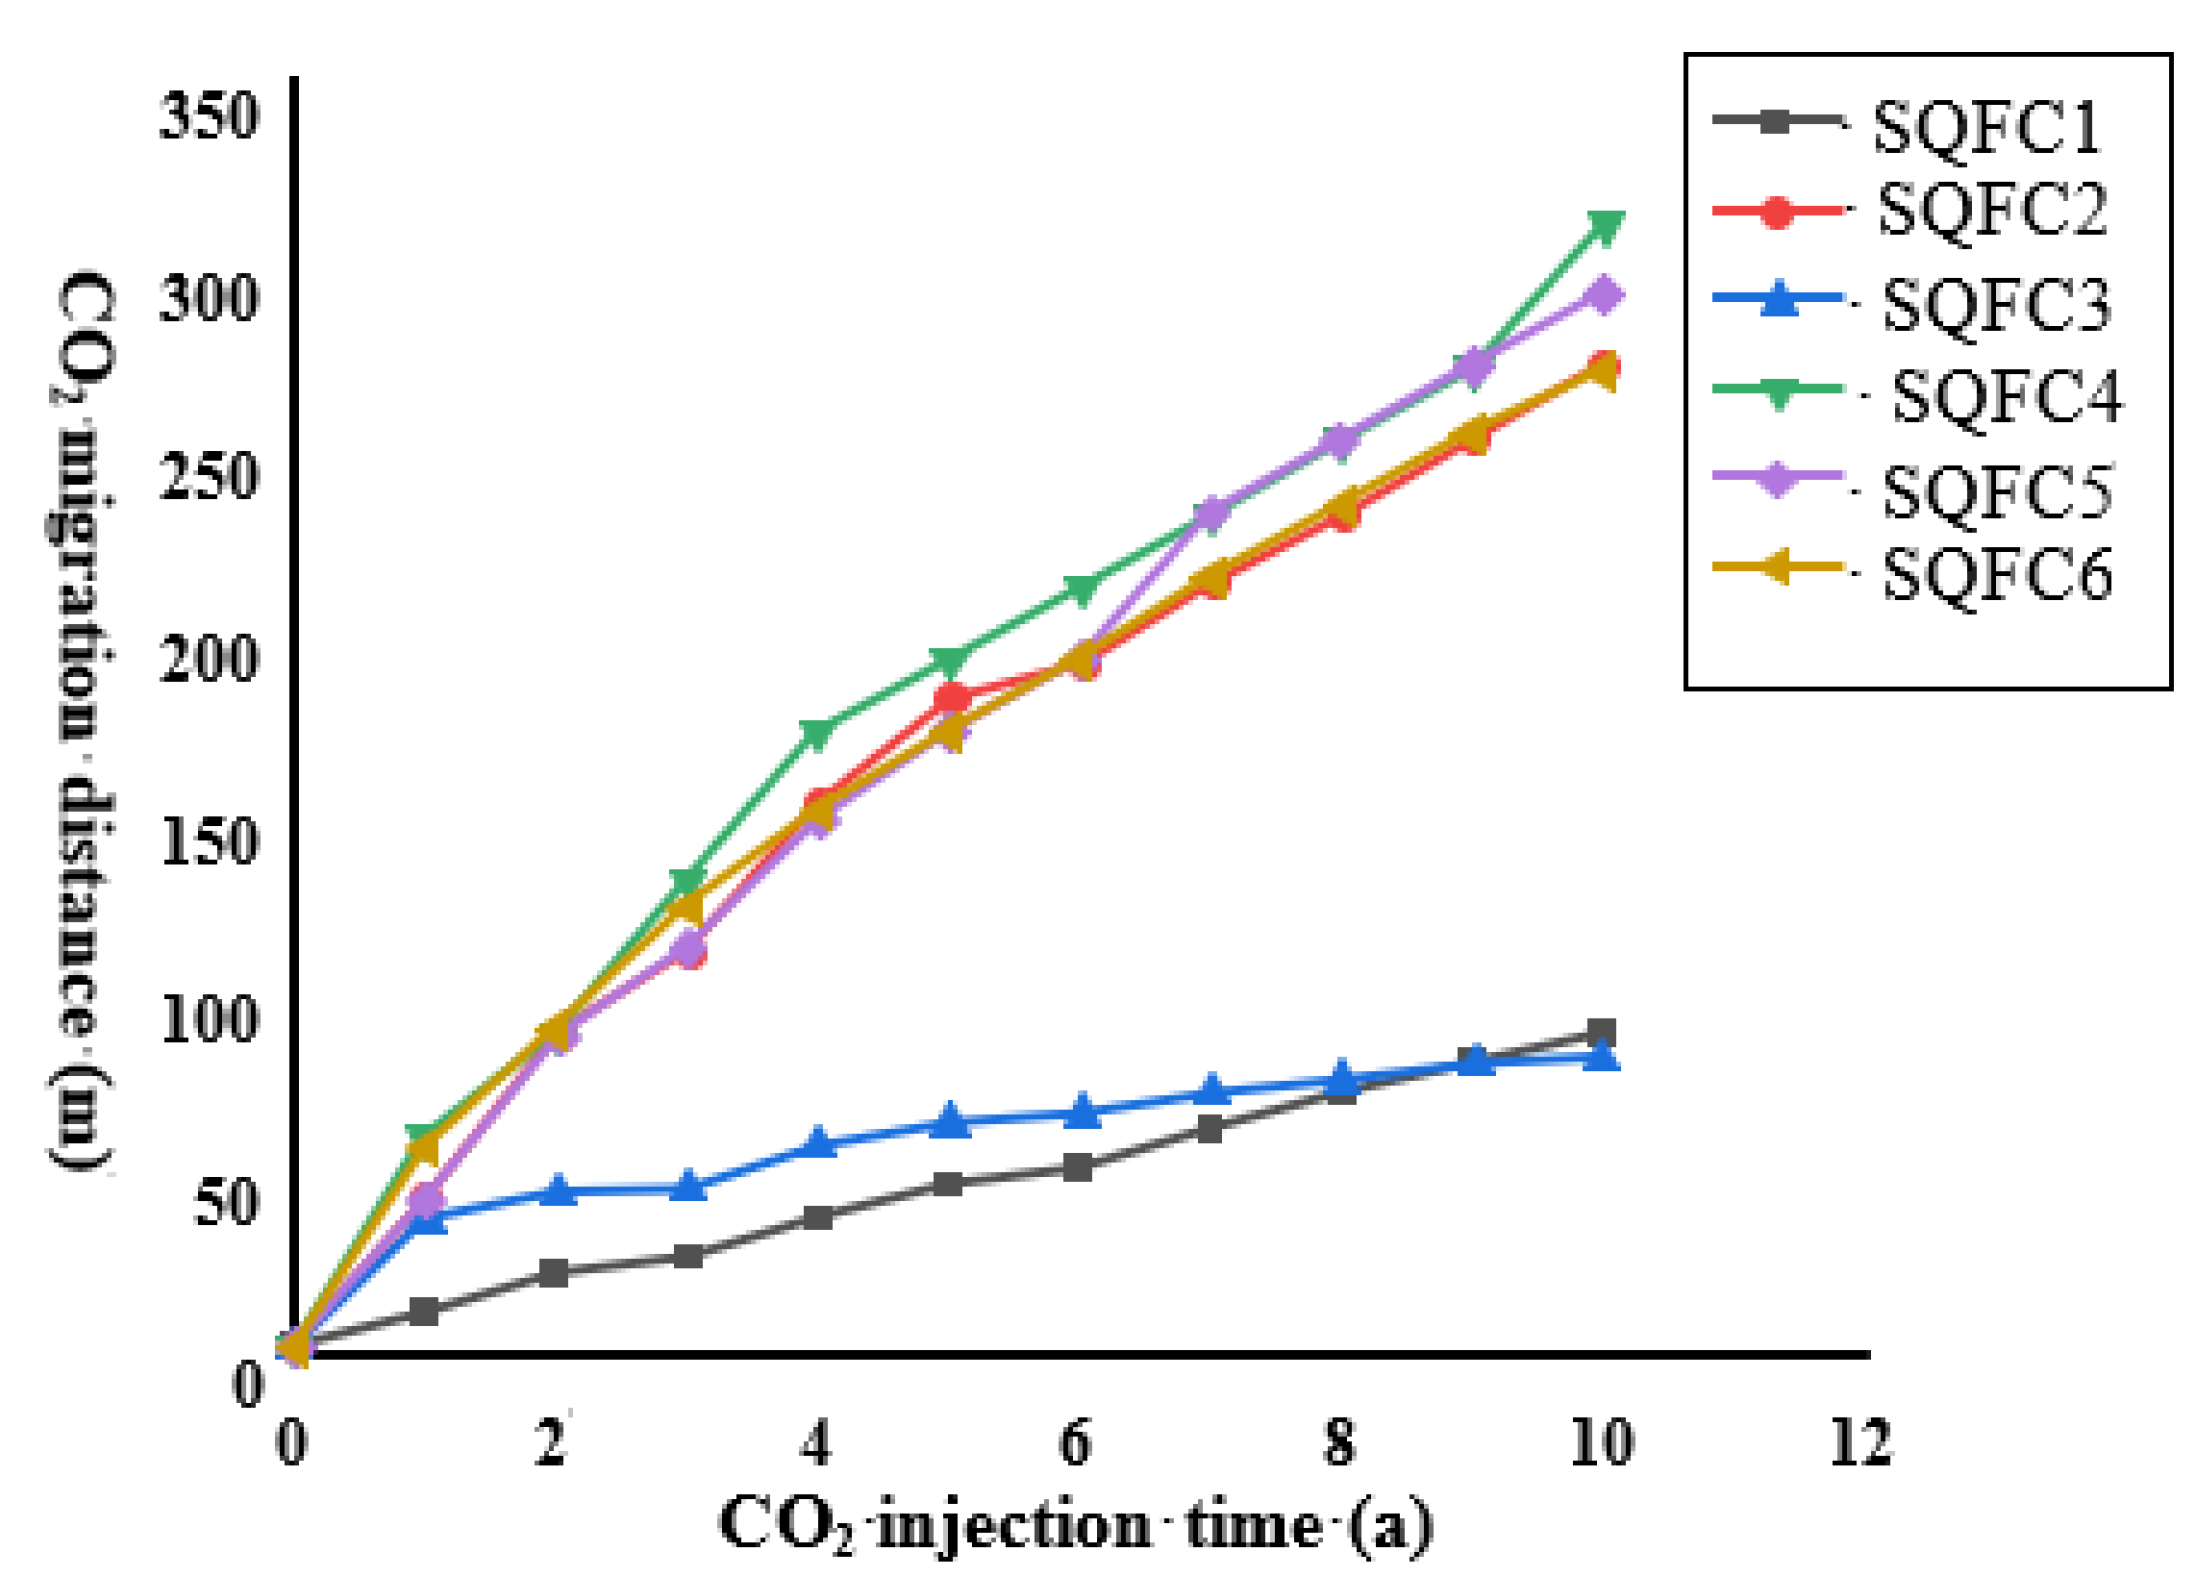
On the basis of the conceptual model established in this chapter, software TOUGHREACT (v4.13-OMP) and software FLAC3D (version 7.0) are overlapped for coupled numerical calculation. Conduct a ten-year injection simulation, with a calculation time of up to ten days. Explore the migration of CO2 in homogeneous and heterogeneous models, as well as the changes in pore fluid pressure and effective stress caused by CO2 injection. Further analyze the formation deformation caused by CO2 injection, and apply the Mohr-Coulomb model to analyze and evaluate the stability of the mudstone cap rock.

4.1. CO2 Migration

Figure 3 shows the transport of CO2 through the reservoir over a decade. As the injection time increases, CO2 migrates further and upward over time. In the vertical direction, CO2 has a lower density and moves upwards under the effect of buoyancy. Due to the shading of the top layer, CO2 converges at the bottom of the cap layer and is transported laterally, with a small proportion of diffusion occurring into the top layer and an overall cloud-like distribution.
Figure 4 shows the relationship between the migration distance of CO2 in each reservoir over time. It can be seen that the CO2 migration distance in two reservoirs, SQFC1 and SQFC3, is the shortest, and the migration distances of the other four reservoirs are relatively close to each other. In other reservoir-overburden combination formations, the maximum migration distance of CO2 is 62.45 m after one year of injection or 286.68 m after ten years of injection.

Mechanism Analysis of CO2 Migration

By comparing the vertical permeability relationship of each reservoir cap in Table 2, it can be observed that the disparity between the vertical permeability of SQFC1 and SQFC3, as well as the upper cap SQFG1 and SQFG3, is less than two orders of magnitude. This leads to facile CO2 breakthrough into the cap rocks. Moreover, due to CO2 breakthrough into the cap layer, there is minimal increase in lateral pressure difference between the injection site and surrounding reservoir rocks, which hampers lateral migration of carbon dioxide. In other reservoir-overburden combination formations, due to the large difference in the vertical permeability of the reservoir-overburden layer and the influence of capillary pressure closure after injection, CO2 is more easily transported laterally.
Based on the analysis of the above results, we can conclude that the sealing ability of cap rock to CO2 is related to the difference in permeability between reservoir and cap rock. The lower the permeability of cap rock is than that of reservoir rock, the more favorable it is for CO2 to be stored in reservoir rock. And when the permeability difference between two rock layers is more than two orders of magnitude, the rock with cover layer has a good sealing effect.

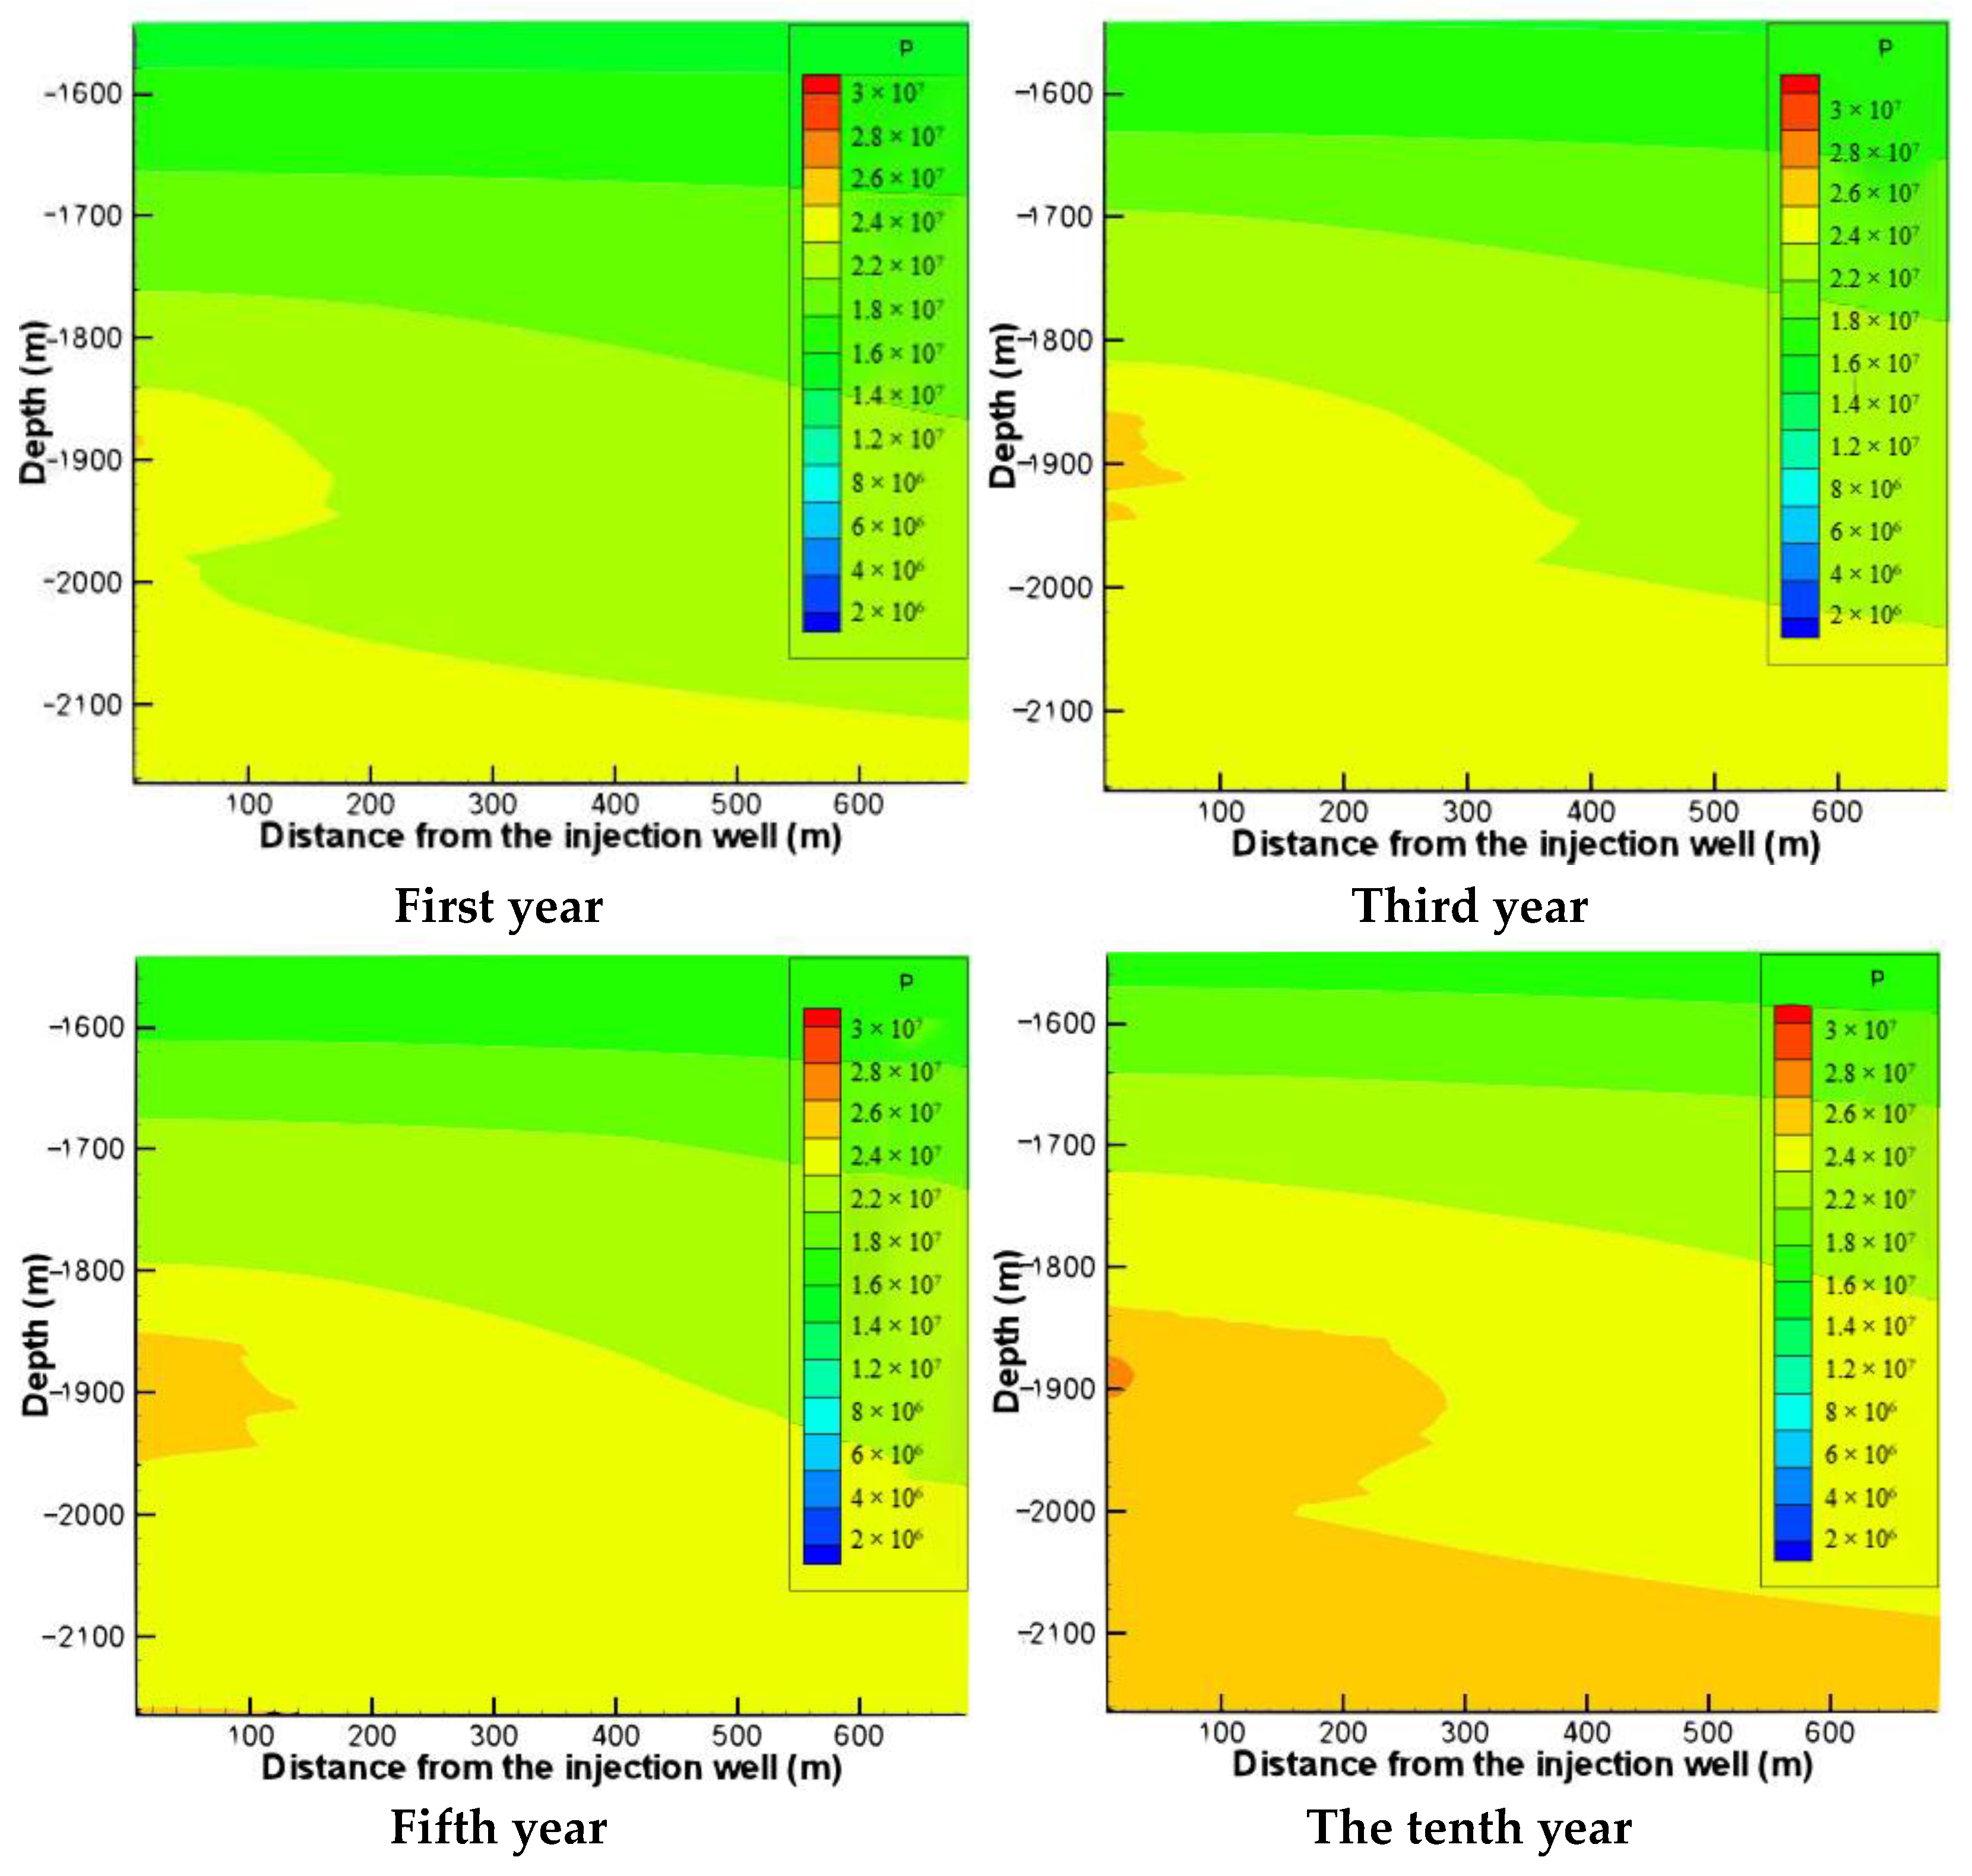
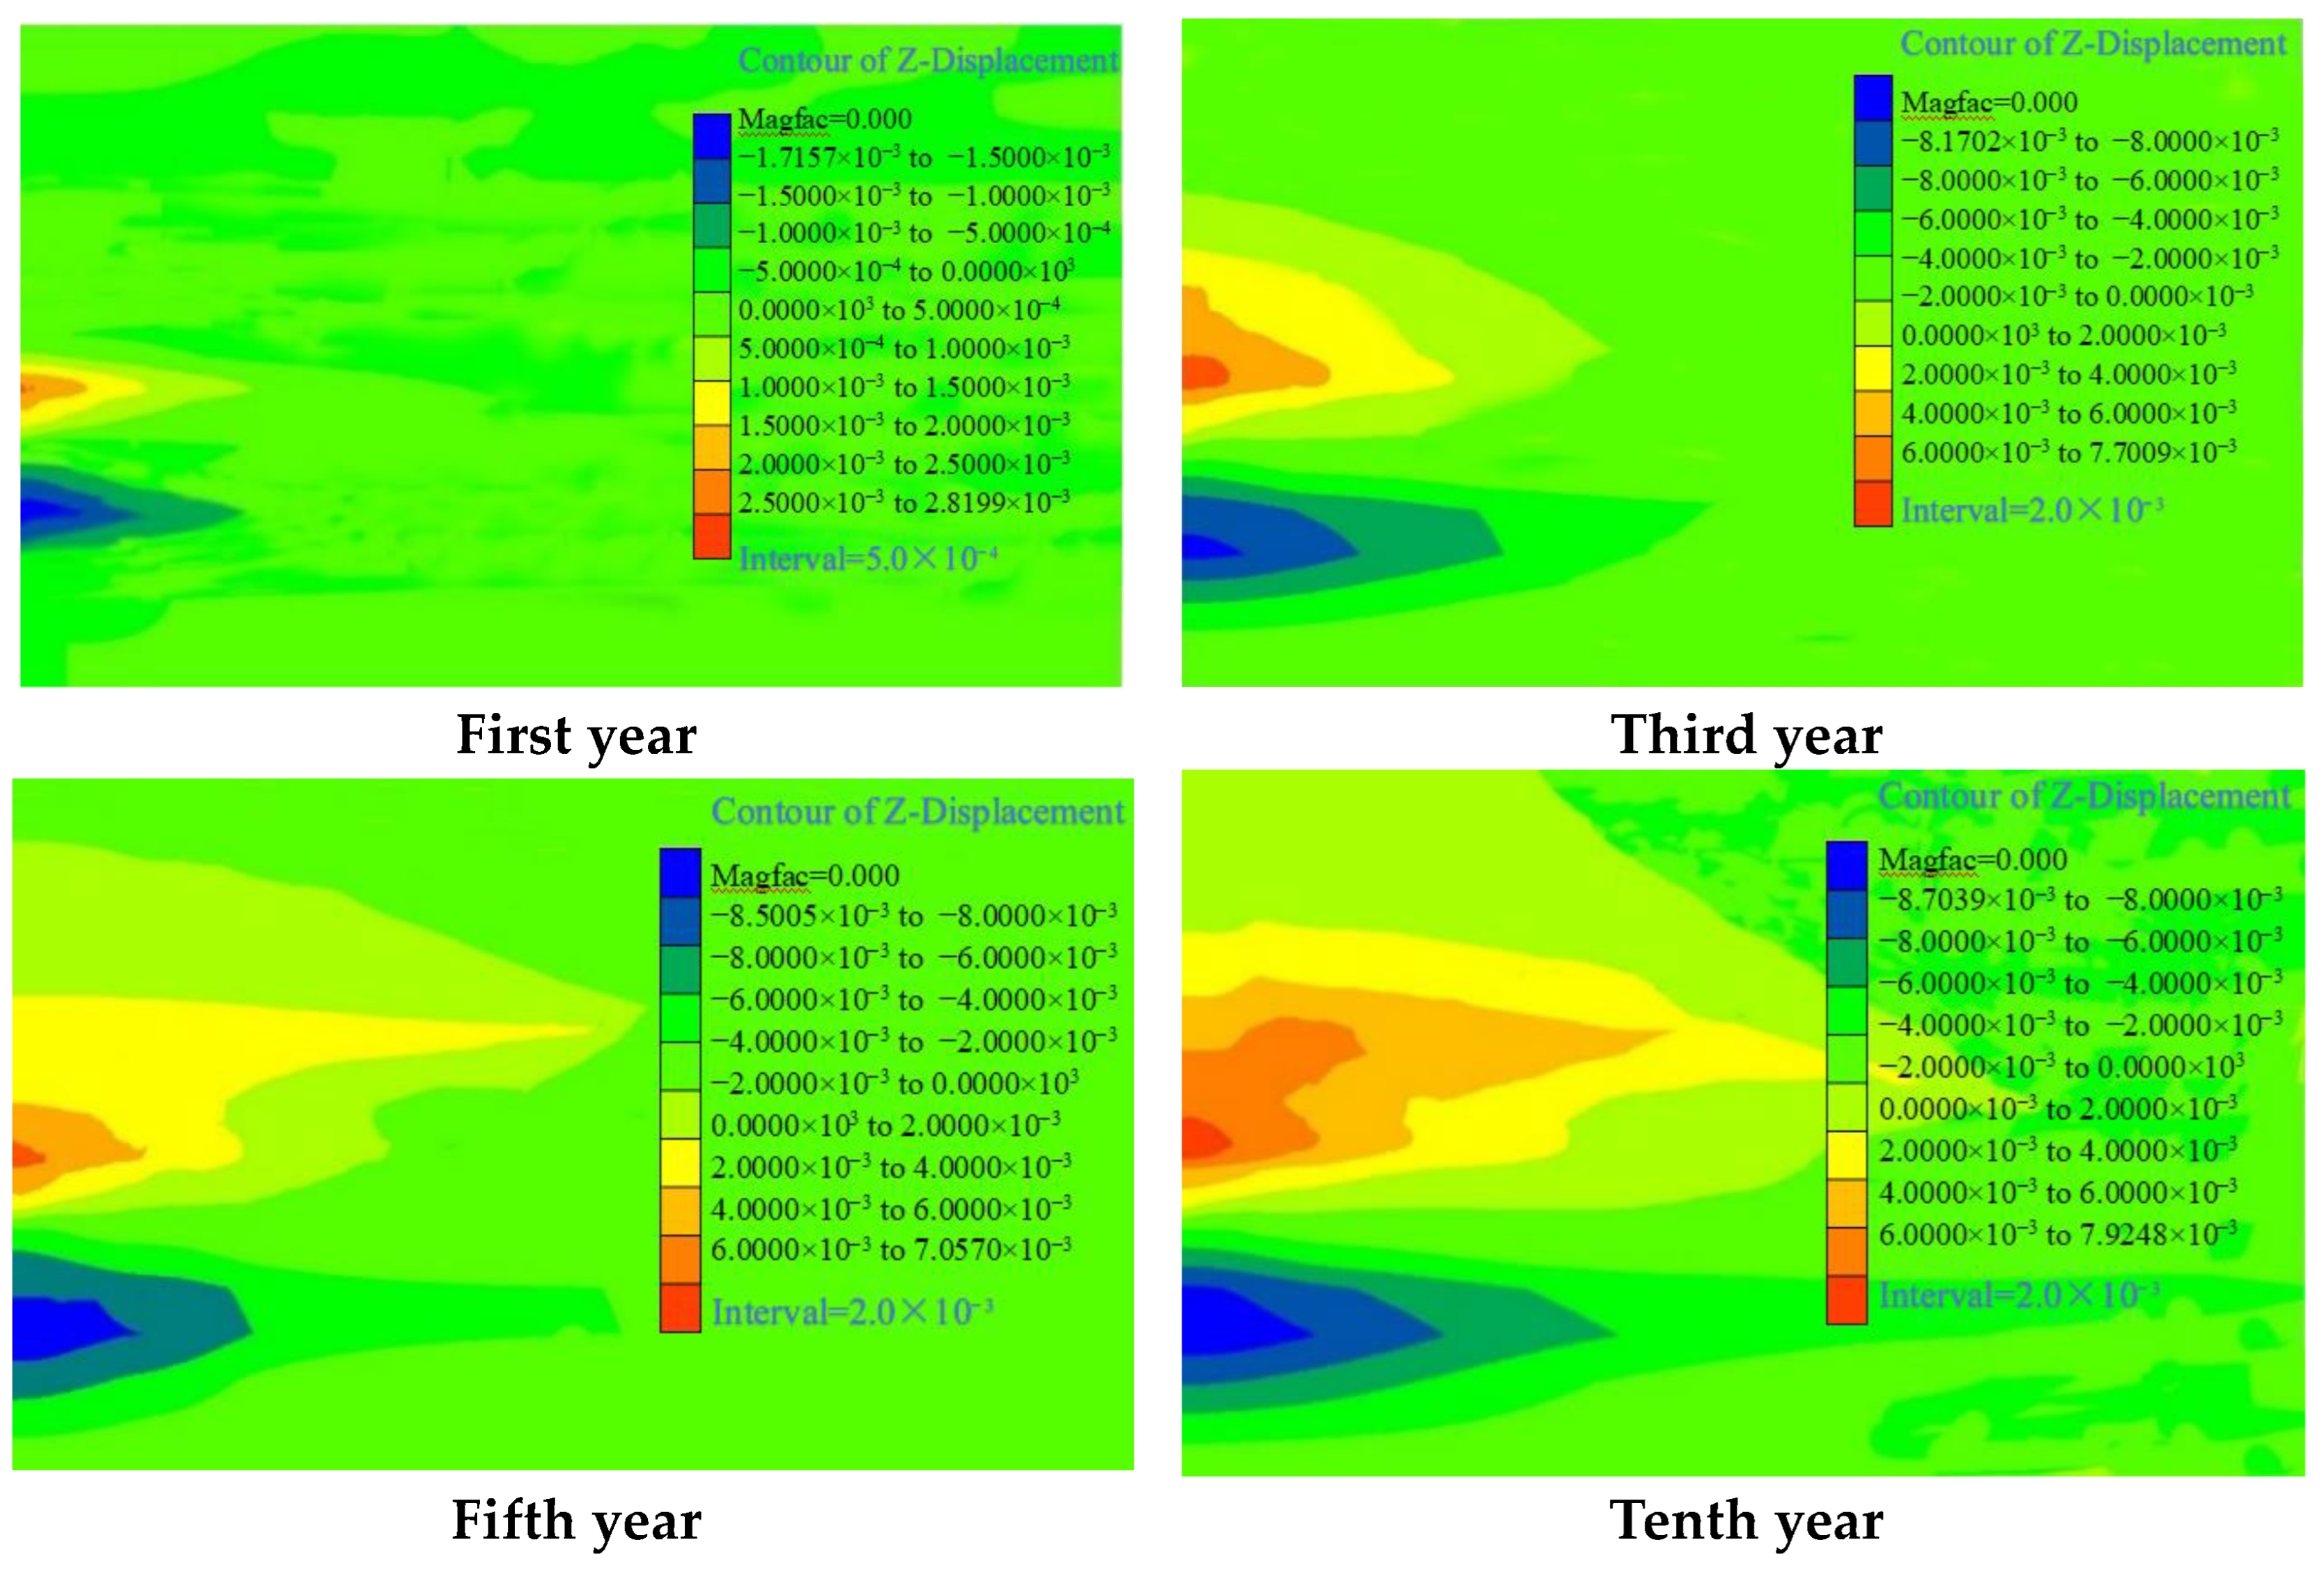
4.2. Pore Pressure and Stress Effects

The pore pressure cloud diagram in Figure 5 illustrates the gradual increase in pore pressure within the reservoir-cover combination of rock layers near the injection wells following CO2 injection. Moreover, as the amount of injected CO2 increases, so does the extent of pore pressure changes caused by this gradual increase in pore pressure. By comparing Figure 3’s migration distance of CO2, it becomes evident that the range of pore pressure changes surpasses the diffusion range of CO2. This phenomenon can be attributed to both reservoir sandstone and cover mudstone facilitating CO2 transport by overcoming capillary resistance within their respective rock pore spaces during saltwater displacement induced by CO2 injection. Consequently, due to faster downstream displacement caused by CO2 injection, there is insufficient time for relief of pore water pressure resulting in a larger range of increased pore pressures. The increase of pore pressure caused by CO2 injection also causes the change of ground stress and the deformation of rock strata.
Due to the injection of CO2 fluid, the pore fluid pressure at the depth of the formation increases greatly, and according to the Terzaghi effective stress principle, the effective stress decreases accordingly, resulting in the formation deformation near the injection point. The vertical deformation cloud diagrams of the formation near the injection point in the first, third, fifth and tenth years of the pore permeability homogenization model are shown in Figure 6. It can be seen from the figure that there is a clear demarcation of the rock deformation, with upward uplift of the part of the formation above the vicinity of the injection point and a slight subsidence of the part below the injection point. According to the simulation, the maximum deformation of the rocks in the can reach 7.79 mm within 10 years after CO2 injection. This is due to the increase in fluid pressure of the rock pores, which expand and compress in all directions. In the vertical direction, the overlying layers are lifted by upward extrusion and the underlying rock layers are compressed downward by downward extrusion.

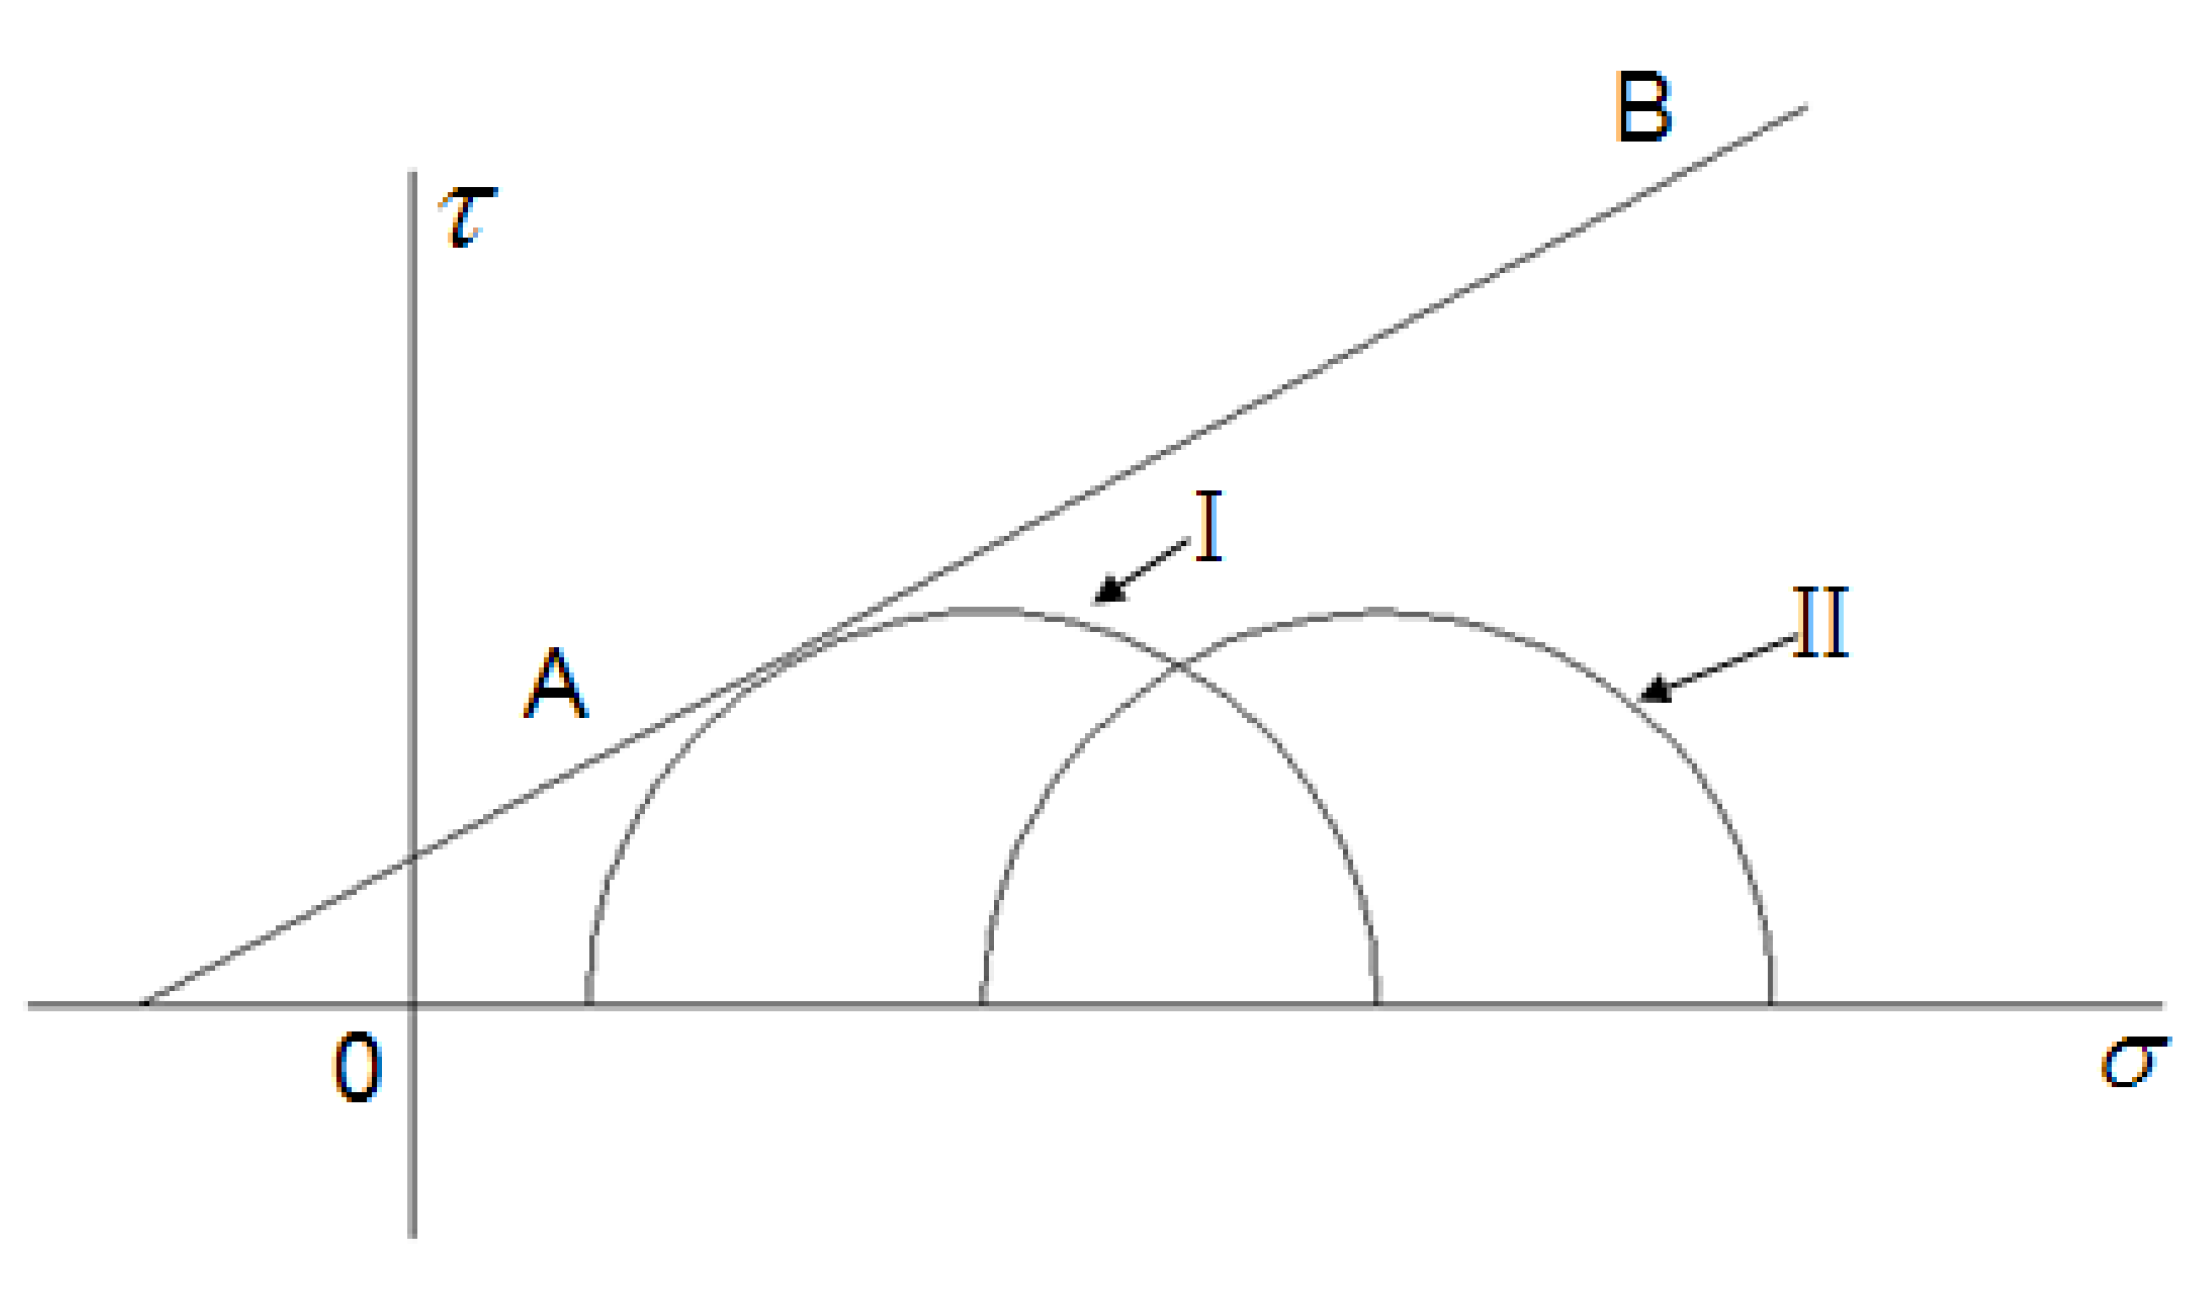
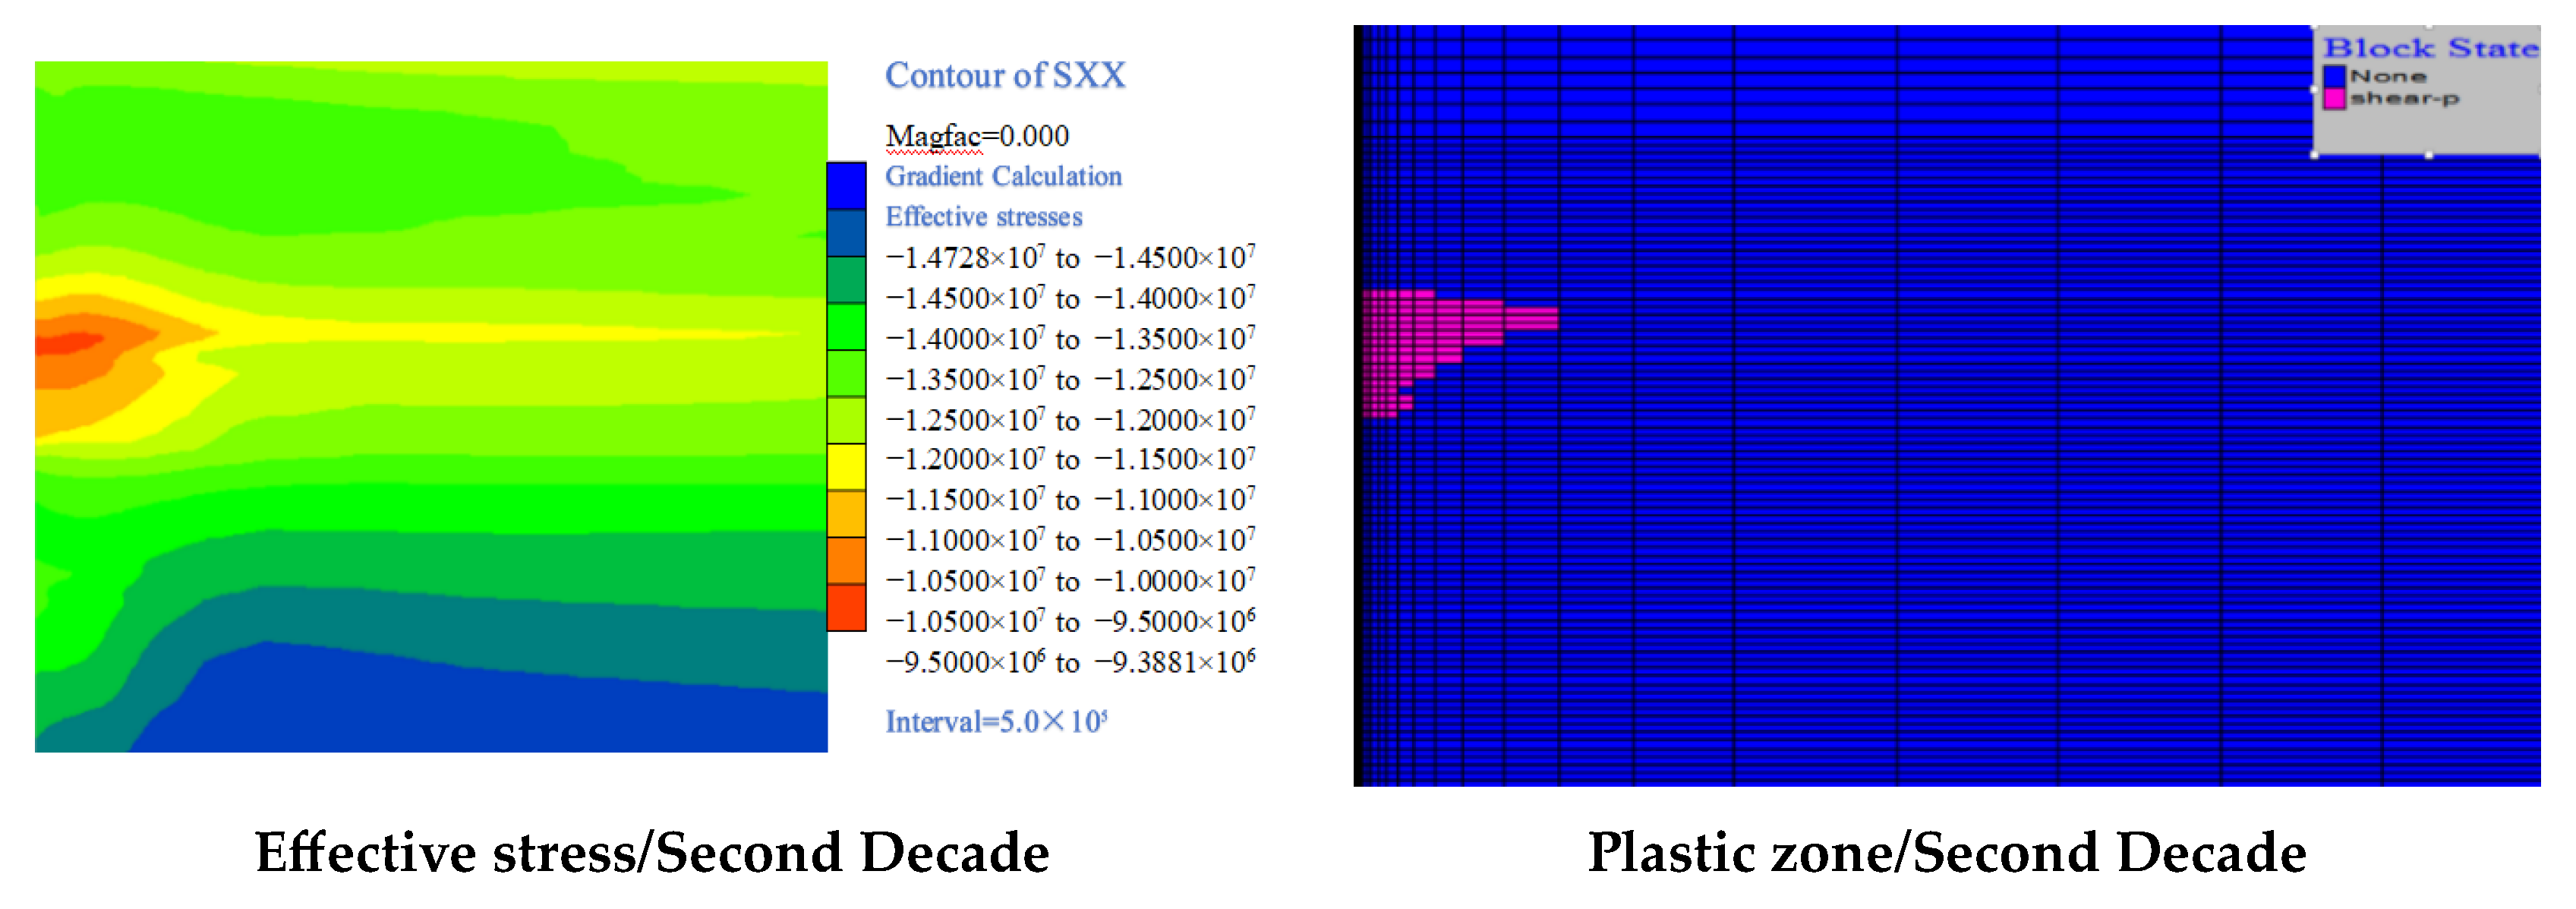
Mechanical Mechanism and Stability Analysis

Comparing Figure 5 and Figure 6, it can be seen that the area and magnitude of the total deformation of the formation is positively correlated with the magnitude and range of the increase in pore pressure, with the increase in the injection volume, which leads to the size and range of the pore fluid pressure in the combined area of the reservoir overburden increases from year to year, and the magnitude and range of deformation of the formation near the injection point also gradually increases. According to the simulation results, the maximum vertical deformation of the formation under this injection condition is on the order of millimeters. The area of influence gradually extends from initially a few hundred meters to a few thousand meters. Comparing the results of Jonny’s study on the surface displacement of the Insalah geological CO2 storage site [33], the simulation results in this paper are within a reasonable range given the difference between the injection volume and the pore pressure variation.
The effect of pore pressure on rock damage is illustrated in Figure 7. In this figure, AB represents the Moore shell under zero pore fluid pressure. Curve II depicts the Mohr circle of effective stress when pore fluid pressure (p) equals zero, which can be observed within the Mohr envelope. As the pore pressure increases, the Mohr circle of effective stress shifts towards the left until it becomes tangent to Mohr envelope AB, indicating that curve I and AB in the figure are tangential at this point, signifying rock damage.
After CO2 is injected into the target underground reservoir, the increase in pore pressure leads to a decrease in effective stress, and when the pore pressure increases to a certain extent, the reservoir rock will be damaged, which is reflected in the simulation results as the appearance of plastic zones. In the model of this work, the pore water pressure increases within ten years of simulation, which is not enough to cause damage to the formation. The simulation time continues to increase and after 20 years of simulating continuous injection, the formation begins to experience shear damage. Figure 8 shows the distribution of plastic zones simulated by our model by years of CO2 injection. According to the plastic evolution trend shown in the figure, the decrease in effective stress corresponds to the change rule of plastic zone expansion. Due to the different permeability and thickness of the reservoir and cover layer between individual layers, the pore fluid pressure increases to different extents at different locations and therefore the damage to the rock is different at different depths.
The main reason is that at the beginning of injection, the pore water pressure near the injection point of each layer increases sharply, while the initial pressure in the upper reservoir is lower and the effective stress change is the largest, so the first shear damage occurs. As the injection time increases and the pore pressure gradually builds up, the fluid migrates in the horizontal direction due to the shading of the cap rock, the change range of the pore fluid pressure and effective stress expands laterally, and the extent of plastic damage The area expands horizontally. However, the changes in pore pressure and effective stress are limited to the vicinity of the depth range of the formation where the reservoir is located, and the changes in pore fluid pressure and effective stress in the overlying formation are not obvious. Therefore, the distribution of the plastic zone is limited to the lower part of the cap rock, and the integrity of the overlying rock layer can still be maintained.

5. Conclusions

When CO2 is stored in the intact formation, the effectiveness of cap rock sealing depends on the permeability contrast between the reservoirs. The greater the difference in permeability, the more effective the sealing becomes. If the permeability of the cap rock is two orders of magnitude lower than that of the reservoir rock, CO2 storage can be achieved effectively.
By injecting supercritical CO2, the pore pressure in the formation is greatly increased in a short time, resulting in a reduction in the effective stress in the rock and an uplift of the rock towards the surface. According to the simulation, the maximum deformation of the rocks in the can reach 7.79 mm within 10 years after CO2 injection.
According to the Moore-Cullen criterion, the stability of the caprock during the CO2 injection period was evaluated by simulation. In the model, there was no shear damage to the formation rock due to the small increase in pore pressure during the 10-year injection period. After extending the injection time to 20 years, the formation began to exhibit shear damage, but the distribution of the plastic zone was limited to the lower part of the overburden and the integrity of the overlying rock layer was still maintained.

Author Contributions

C.L. and S.H. is responsible for the design of the data collection and parameter testing; S.Z. and S.H. are responsible for the data processing, numerical simulation, article writing, and proofreading; S.Z. and Y.J. are responsible for the data processing and plotting; Z.Y. is in charge of the data processing. All authors have read and agreed to the published version of the manuscript.

Funding

This research was funded by the Natural Science Foundation of China (grant No. 42002258), the Jiangxi Geological Environment and Underground Space Engineering Research Center (grant No. JXDHJJ2022-013). China Geological Survey Project “Hydrogeological survey of Key Areas of the Upper Reaches of Hutuo River” (grant No. DD20230470).

Institutional Review Board Statement

Not applicable.

Informed Consent Statement

Not applicable.

Data Availability Statement

Data are contained within the article.

Acknowledgments

Thanks to the National Natural science Foundation of China and the Harbin Center for General Survey of Natural Resources.

Conflicts of Interest

The authors declare no conflict of interest.

Abbreviations

THM, Thermo-Hydro-Mechanical; CCS, Carbon Capture and Storage; TOUGH, Transport of Unsaturated Groundwater and Heat; FLAC3D, Fast Lagrangian Analysis of Continua; MRI, Magnetic Resonance Imaging; GCS, Geological CO2 Sequestration; THCM, Thermal-Hydrological-Mechanical-Chemical; 2D, Two-Dimensional.

References

  1. Sprunt, E.S. Stand tall and speak up: We Can Be a Key Player in the Solution to Global Warming. J. Pet. Technol. 2006, 58, 10–12. [Google Scholar] [CrossRef]
  2. Shi, J.; Liu, J.Y.; Gao, Z.Q.; Cui, L.L. Research Advances of the Influence of Afforestation on Terrestrial Carbon Sink. Prog. Geogr. 2004, 23, 58–64. [Google Scholar]
  3. Marjani, A.; Nakhjiri, A.T.; Pishnamazi, M.; Shirazian, S. Evaluation of potassium glycinate, potassium lysinate, potassium sarcosinate and potassium threonate solutions in CO2 capture using membranes. Arab. J. Chem. 2021, 14, 102979. [Google Scholar] [CrossRef]
  4. Holloway, S. Underground sequestration of carbon dioxide—A viable green house gas mitigation option. Energy 2005, 30, 2318–2333. [Google Scholar] [CrossRef]
  5. Grimston, M.C.; Karakoussis, V.; Fouquet, R.; Van der Vorst, R.; Pearson, P.; Leach, M. The European and global Potential of carbon dioxide sequestration in tackling climate change. Clim. Policy 2001, 1, 155–171. [Google Scholar] [CrossRef]
  6. Sundquist, E.; Burruss, R.; Faulkner, S.; Gleason, R.; Harden, J.; Kharaka, Y.; Tieszen, L.; Waldrop, M. Carbon sequestration to mitigate climate change. Geol. Surv. 2008, 3097. [Google Scholar] [CrossRef]
  7. Pruess, K.; Xu, T.; Apps, J.; García, J. Numerical modeling of aquifer disposal of CO2. SPE J. 2003, 8, 49–60. [Google Scholar] [CrossRef]
  8. Bruant, R.; Guswa, A.; Celia, M.; Peters, C. Safe storage of CO2 in deep saline aquifers. Environ. Sci. Technol. 2002, 36, 240–245. [Google Scholar] [CrossRef]
  9. Gupta, P.K.; Yadav, B. Leakage of CO2 from geological storage and its impacts on fresh soil-water systems: A review. Environ. Sci. Pollut. Res. 2020, 27, 12995–13018. [Google Scholar] [CrossRef]
  10. Vasylkivska, V.; Dilmore, R.; Lackey, G.; Zhang, Y.; King, S.; Bacon, D.; Chen, B.; Mansoor, K.; Harp, D. NRAP-open-IAM: A flexible open-source integrated-assessment-model for geologic carbon storage risk assessment and management. Environ. Model. Softw. 2021, 143, 105114. [Google Scholar] [CrossRef]
  11. Sorai, M. Effects of Calcite Dissolution on Caprock’s Sealing Performance Under Geologic CO2 Storage. Transp. Porous Media 2021, 136, 569–585. [Google Scholar] [CrossRef]
  12. Yang, D.; Zhang, L. Carbon Dioxide Leakages through Fault Zones: Potential Implications for the Long-Term Integrity of Geological Storage Sites. Aerosol Air Qual. Res. 2021, 21, 210220. [Google Scholar] [CrossRef]
  13. Xu, L.; Li, Q.; Tan, Y.; Li, X.; Chen, B. Phase change-induced internal-external strain of faults during supercritical CO2 leakage. Gondwana Res. 2023, 122, 215–231. [Google Scholar] [CrossRef]
  14. Sang, G.; Liu, S. Carbonate caprock–brine–carbon dioxide interaction: Alteration of hydromechanical properties and implications on carbon dioxide leakage. Spe J. 2021, 26, 2780–2792. [Google Scholar] [CrossRef]
  15. Zhao, G.; Zheng, J.; Gong, G.; Chen, B.; Yang, M.; Song, Y. Formation characteristics and leakage termination effects of CO2 hydrate cap in case of geological sequestration leakage. Appl. Energy 2023, 351, 121896. [Google Scholar] [CrossRef]
  16. Credoz, A.; Bildstein, O.; Jullien, M.; Raynal, J.; Pétronin, J.C.; Lillo, M.; Pozo, C.; Geniaut, G. Experimental and modeling study of geochemical reactivity between clayey caprocks and CO2 in geological storage conditions. Energy Procedia 2009, 1, 3445–3452. [Google Scholar] [CrossRef]
  17. Bildstein, O.; Kervévan, C.; Lagneau, V.; Delaplace, P.; Crédoz, A.; Audigane, P.; Perfetti, E.; Jacquemet, N.; Jullien, M. Integrative Modeling of Caprock Integrity in the Context of CO2 Storage: Evolution of Transport and Geochemical Properties and Impact on Performance and Safety Assessment. Oil Gas Sci. Technol. Rev. L’institut Fran Ais Du Pétrole 2010, 65, 485–502. [Google Scholar] [CrossRef]
  18. Rutqvist, J.; Wu, Y.S.; Tsang, C.F.; Bodvarsson, G. A Modeling Approach for Analysis of Coupled Multiphase Fluid Flow, Heat Transfer, and Deformation in Fractured Porous Rock. Int. J. Rock Mech. Min. Sci. 2002, 39, 429–442. [Google Scholar] [CrossRef]
  19. Lei, H.W.; Li, J.Q.; Xu, T.F.; Wang, F.G. Numerical Simulation of Coupled Thermal-Hydrodynamic Mechanical (THM) Processes for CO2 Geological Sequestration in Deep Saline Aquifers at Ordos Basin, China. J. Jilin Univ. (Earth Sci. Ed.) 2015, 45, 552–563. (In Chinese) [Google Scholar]
  20. Yu, Z.W.; Zhang, Y.J.; Zhang, Q.; Xu, T.F. Algorithm of TOUGHREACT Links to FLAC3D. J. Jilin Univ. (Earth Sci. Ed.) 2013, 43, 199–206. (In Chinese) [Google Scholar]
  21. Hao, S.R.; Zhang, Y.J.; Li, X.G.; Yu, Z. Numerical Modeling of Ground Surface Deformation in the Process of CO2 Geological Storage. Ournal Eng. Geol. 2015, 23, 320–326. (In Chinese) [Google Scholar]
  22. Ito, D.; Akaku, K.; Okabe, T.; Takahashi, T.; Tsuji, T. Measurement of threshold capillary pressure for seal rocks using the step-by-step approach and the residual pressure approach. Energy Procedia 2011, 4, 5211–5218. [Google Scholar] [CrossRef]
  23. Hildenbrand, A.; Schlömer, S.; Krooss, B.M.; Littke, R. Gas breakthrough experiments on pelitic rocks: Comparative study with N2, CO2 and CH4. Geofluids 2004, 4, 61–80. [Google Scholar] [CrossRef]
  24. Yang, Y.; Aplin, A.C. Permeability and petrophysical properties of 30 natural mudstones. J. Geophys. Res. 2007, 112, B03206. [Google Scholar] [CrossRef]
  25. Yu, Z.W. Research on Multiphase-Multicomponent THCM Coupling Mechanism and Its Application. Ph.D. Thesis, Jilin University, Jilin, China, 2013. (In Chinese). [Google Scholar]
  26. Ren, L. Study on thermodynamic chemical effect coupling model of CO2 geological storage process. Adhesion 2022, 49, 93–97. (In Chinese) [Google Scholar]
  27. Gong, G.; Li, Y.; Tang, D.; Yu, H.; Jiang, Z. Research on Optimization of Co, Injection Scheme Underthm Couplings in Co, Geological Storage. J. Eng. Geol. 2023, 31, 1084–1096. (In Chinese) [Google Scholar]
  28. Niessner, J.; Helmig, R. Multi-scale modelling of two-phase-two-component processes in heterogeneous porous media. Numer. Linear Algebra Appl. 2006, 13, 699–715. [Google Scholar] [CrossRef]
  29. Xu, R.N.; Ji, T.C.; Lu, T.J.; Jiang, P. Research progress on heat and mass transfer in carbon geological storage and enhanced oil/gas/geothermal recovery technology. J. Tsinghua Univ. (Sci. Technol.) 2022, 62, 634–654. (In Chinese) [Google Scholar]
  30. Siriwardane, H.J.; Gondle, R.K.; Bromhal, G.S. Coupled flow and deformation modeling of carbon dioxide migration in the presence of a caprock fracture during injection. Energy Fuels 2013, 27, 4232–4243. [Google Scholar] [CrossRef]
  31. Yu, Q.; Ren, Z.L. Comparison of Geothermal Fields in the Huangling and Dongsheng Areas, Ordos Basin. J. Jilin Univ. (Earth Sci. Ed.) 2008, 6, 933–945. (In Chinese) [Google Scholar]
  32. Bai, L. Experimental Analysis of Rock Biot coefficient and Engineering Application of Geological Disposal of Carbon Dioxide. Ph.D. Thesis, Jilin University, Changchun, China, 2016. (In Chinese). [Google Scholar]
  33. Rutqvist, J.; Vasco, D.W.; Myer, L. Coupled Reservoir-Geomechanical Analysis of CO2 Injection and Ground Deformations at In Salah, Algeria. Int. J. Greenh. Gas Control 2010, 4, 225–230. [Google Scholar] [CrossRef]
Figure 1. Model mesh dissection.
Water 16 00144 g001
Figure 2. Geostress gradient.
Water 16 00144 g002
Figure 3. Extent of CO2 transport over the decade.
Water 16 00144 g003
Figure 4. CO2 migration distance over time.
Water 16 00144 g004
Figure 5. Pore fluid pressure cloud within a decade after CO2 injection.
Water 16 00144 g005
Figure 6. Rock deformation near the injection point.
Water 16 00144 g006
Figure 7. Effect of pore pressure on rock damage (Moore envelope in AB) [25]. I: Mohr’s circle of effective stress; II: Mohr’s circle of non-porous fluid pressure.
Water 16 00144 g007
Figure 8. Distribution of effective stress and plastic zone during injection.
Water 16 00144 g008
Table 1. Stratigraphy and lithology of the study area [25].
ErathemSytemSeriesGroupDepths
(m)
Thicknesses
(m)
Lithology
CenozoicQuaternary 1515Grey-yellow clay interspersed with yellowish-brown, light brown sandy clay and gravel layers.
MesozoicCretaceous Zhidan140125Orange-red and earthy-yellow cross-cut sandstone embedded in mudstone.
JurassicMiddleAnding19050Dark red-brown coarse sandstone with fine gravel, light brown-yellow, light red-brown fine sandstone and light brown-yellow muddy siltstone.
Zhiluo25666The upper part consists of gray-green muddy siltstone and thin interbedded siltstone and siltstone, and the lower part consists of coarse sandstone.
LowerYan’an443187In the upper part, gray mudstone and light gray medium sandstone are interbedded with bituminous coal, in the middle part, mottled conglomerate is interbedded with coal, and in the lower part, gray mudstone and light gray medium sandstone are interbedded with thin coal beds.
TriassicUpperYanchang961518Upper light gray medium sandstone and light gray coarse sandstone embedded in gray mudstone, medium gray claystone embedded in light gray fine sandstone and light gray medium sandstone.
MiddleYifang1384423The upper part consists of brownish-red mudstone interspersed with light gray medium sandstone, the middle part consists of brownish-red mudstone interspersed with light gray and brownish-red fine sandstone, and the lower part consists of brownish- red claystone, in which brownish-red sandstone is embedded fine sandstone.
LowerShangshanggou1576192In the upper part, brownish-red sandy claystone is interspersed with light brown-red fine sandstone, in the middle part, brownish-red sandy claystone is unevenly interspersed with light brown-red fine sandstone and in the lower part, brownish-red sandy claystone is interspersed with light brown-red fine sandstone.
Liujiagou1699123The upper part consists of light brownish-red, fine sandstone interspersed with brownish-red claystone, the middle part consists of brownish-red claystone interspersed with light brownish-red, fine sandstone, and the lower part consists of light brownish- red, fine sandstone, interspersed with brownish-red claystone mudstone.
PaleozoicPermianUpperShiqianfeng1990291The upper part is interspersed with purple-red mudstone and brownish-red fine sandstone, the middle part is interspersed with purple-red and greenish-gray mudstone and gray fine sandstone of unequal thickness, and the lower part is interspersed with purple-red mudstone and brownish-red fine sandstone.
MiddleStone Box2232242The upper part is mainly interspersed with purple-red mudstone and brownish-red fine sandstone, the middle part is interspersed with brownish-red, greenish-gray mudstone and brownish-red fine sandstone, and the lower part is interspersed with gray mudstone, purple-red mudstone and light gray fine sandstone and gravelly coarse sandstone.
LowerShanxi233098Dark gray and gray-black mudstone embedded in light gray fine to medium sandstone embedded in coal seams and coal lines.
Taiyuan235525Grey-white medium-coarse quartz sandstone and dark gray coarse-grained clastic quartz sandstone dominate, interspersed with mudstone and coal seams, in the lower part with bioclastic tuff lenses. There are also black mudstone and anthracite mudstone interspersed with sandstone.
CarboniferousLowerBenxi2516161The upper part consists of dark gray and gray-black mudstone interspersed with thin layers of fine sandstone, tuff and coal layer. The soil consists of bauxite deposits.
OrdovicianLowerMajiagou2826310Gray-brown dolomitic tuff, brown-gray gypsum dolomite and dark gray dolomitic claystone dominate.
Table 2. Stratigraphic parameters of the model.
Stratum NumberThicknessDensity PorosityPermeability Coefficient
x, y
Permeability Coefficient
z
Thermal ConductivitySpecific Heat CapacityBulk ModulusShear Modulus
(m)(kg/m) (m2/Pa/s)(m2/Pa/s)(W/m·°C)(J/kg·°C)(Pa)(Pa)
UPPER (overlying strata)170025800.123.20 × 10−153.21 × 10−152.5294033 × 1082.3 × 109
SQFG1 (SQF is the Shiqianfeng Formation, G1 is a manually assigned number for each interlayer of the Shiqianfeng Formation.)5225800.0223.16 × 10−157.89 × 10−162.5294033 × 1083.8 × 108
SQFC1525800.1242.30 × 10−135.79 × 10−142.5294033 × 1082.6 × 109
SQFG210525800.0273.60 × 10−158.98 × 10−162.5294033 × 1083.8 × 108
SQFC2625800.0836.28 × 10−141.62 × 10−142.5294033 × 1082.6 × 109
SQFG31025800.0283.80 × 10−159.48 × 10−162.5294033 × 1083.8 × 108
SQFC3825800.0644.00 × 10−151.01 × 10−152.5294033 × 1082.6 × 109
SQFG42225800.0213.68 × 10−159.31 × 10−162. 5294033 × 1083.8 × 108
SQFC4425800.0986.80 × 10−141.70 × 10−142.5294033 × 1082.6 × 109
SQFG52425800.0233.40 × 10−158.48 × 10−162.5294033 × 1083.8 × 108
SQFC5825800.1119.44 × 10−142.36 × 10−142.5294033 × 1082.6 × 109
SQFG63425800.0263.56 × 10−159.10 × 10−162.5294033 × 1083.8 × 108
SQFC6825800.1091.41 × 10−133.49 × 10−142.5294033 × 1082.6 × 109
BASE (underlying stratum)101425800.113.20 × 10−153.31 × 10−152.5294033 × 1082.5 × 109
Disclaimer/Publisher’s Note: The statements, opinions and data contained in all publications are solely those of the individual author(s) and contributor(s) and not of MDPI and/or the editor(s). MDPI and/or the editor(s) disclaim responsibility for any injury to people or property resulting from any ideas, methods, instructions or products referred to in the content.

