Article

Groundwater Dynamics near the Saltwater–Freshwater Interface in an Island of Seto Inland Sea

1
Graduate School of Advanced Science and Engineering, Hiroshima University, 1-7-1 Kagamiyama, Higashihiroshima 739-8521, Japan
2
Geo-Science Laboratory Co., Ltd., 1-608, Ueda Honmachi, Tenpaku-ku, Nagoya 468-0007, Japan
*
Author to whom correspondence should be addressed.
Water 2023, 15(7), 1416; https://doi.org/10.3390/w15071416
Submission received: 28 February 2023 / Revised: 30 March 2023 / Accepted: 1 April 2023 / Published: 5 April 2023
(This article belongs to the Section Hydrogeology)

Abstract

:
Groundwater dynamics near the saltwater–freshwater interface were investigated in an island of the Seto Inland Sea, using multiple tracers (δD, δ18O, Cl, SF6, and 14C) at two coastal groundwater monitoring wells at depths of 10–40 m. The groundwater recharge area and age were also estimated using these tracers. Additionally, bedrock groundwater at a depth of 40 m at the 2.7 m altitude was brackish and considered to be near the saltwater–freshwater interface, and a mixture of seawater (2–3.5%) and fresh groundwater (97–98%) was estimated by the Cl concentration. Based on the δ18O of fresh groundwater estimated from the seawater mixing ratio, the recharge area was estimated to range from near to above the summit; however, this region is unlikely to be the actual recharge area, as the groundwater may be old freshwater that was recharged during a previously colder period. Groundwater dating using SF6 and 14C suggests that the fresh groundwater originated during the last glacial period (assumed 20,000 years ago) and that the 40 m deep bedrock groundwater is a mixture of old water (0–28%), 30 m deep groundwater (76–100%), and stagnant seawater (1–3%).

1. Introduction

Islands lack freshwater resources, and groundwater wells and reservoirs have long been exhausted on islands in the Seto Inland Sea [1,2]. These local water resources are especially important on islands with high water demands, such as tourism-focused coral reef islands [3] and national parks in the Seto Inland Sea [2,3,4,5,6]. The adoption of local water resources should be encouraged to achieve the sixth Sustainable Development Goal (SDG) by 2030 (clean water and sanitation for all) [7]. Comprehensively understanding the dynamics of fresh groundwater in coastal areas is important, because it is based on the delicate balance of the saltwater–fressssshwater interface and is considerably influenced by anthropogenic overpumping and sea-level fluctuations [8,9,10,11,12,13,14,15,16].
Several numerical simulations and field observations have been conducted to evaluate the effects of tidal changes and waves on groundwater–seawater mixing and submarine groundwater discharge (SGD) near the saltwater–freshwater interface in the coastal zone [17,18,19,20,21]. Groundwater salinization processes have been examined using hydrochemical and isotopic methods in coastal plain aquifers [19,20]. Groundwater flow characteristics, including those in recharge and discharge areas, have been measured and analyzed using a combination of hydraulic potential and environmental tracers [21,22,23]. The differences in water-stable isotope ratios (δ18O and δD) of precipitation and spring water at different altitudes were adopted to estimate the groundwater recharge altitude and flow system [24,25,26]. Furthermore, Shimada et al. [27] confirmed various groundwater flow systems, including bedrock groundwater, based on hydraulic potentials and groundwater age tracers (3H, radiocarbon (14C), and chlorofluorocarbons (CFCs)) at multi-depth observation boreholes in the coastal catchment of the Yatsushiro Sea, which is composed of low-permeability rocks and pyroclastic flow deposits. Kusano et al. [28] measured δ18O, δD, and various age tracers of groundwater and spring water at depths of several tens and hundreds of meters in the Oki Islands of the Shimane Prefecture. Based on the results, they evaluated the groundwater flow system from the mountain top to the coastal area and suggested that the hot spring water was derived from stagnant groundwater originating from rainwater during the last glacial period. Eissa (2018) assessed the recharge and salinization sources in Dahab Basin aquifers in Egypt based on multi-isotopes, including δ18O and δD, and 14C dating [29]. However, there have been few studies on the detailed dynamics of groundwater near the saltwater–freshwater interface using a multi-tracer approach.
The objective of this study is to investigate the groundwater dynamics near the saltwater–freshwater interface using groundwater hydraulic head, isotopes (δ18O and δD), and age tracers (SF6 and 14C) in the island coastal areas of the Seto Inland Sea, where the authors have accumulated long-term groundwater monitoring data at several depths [30,31].

2. Materials and Methods
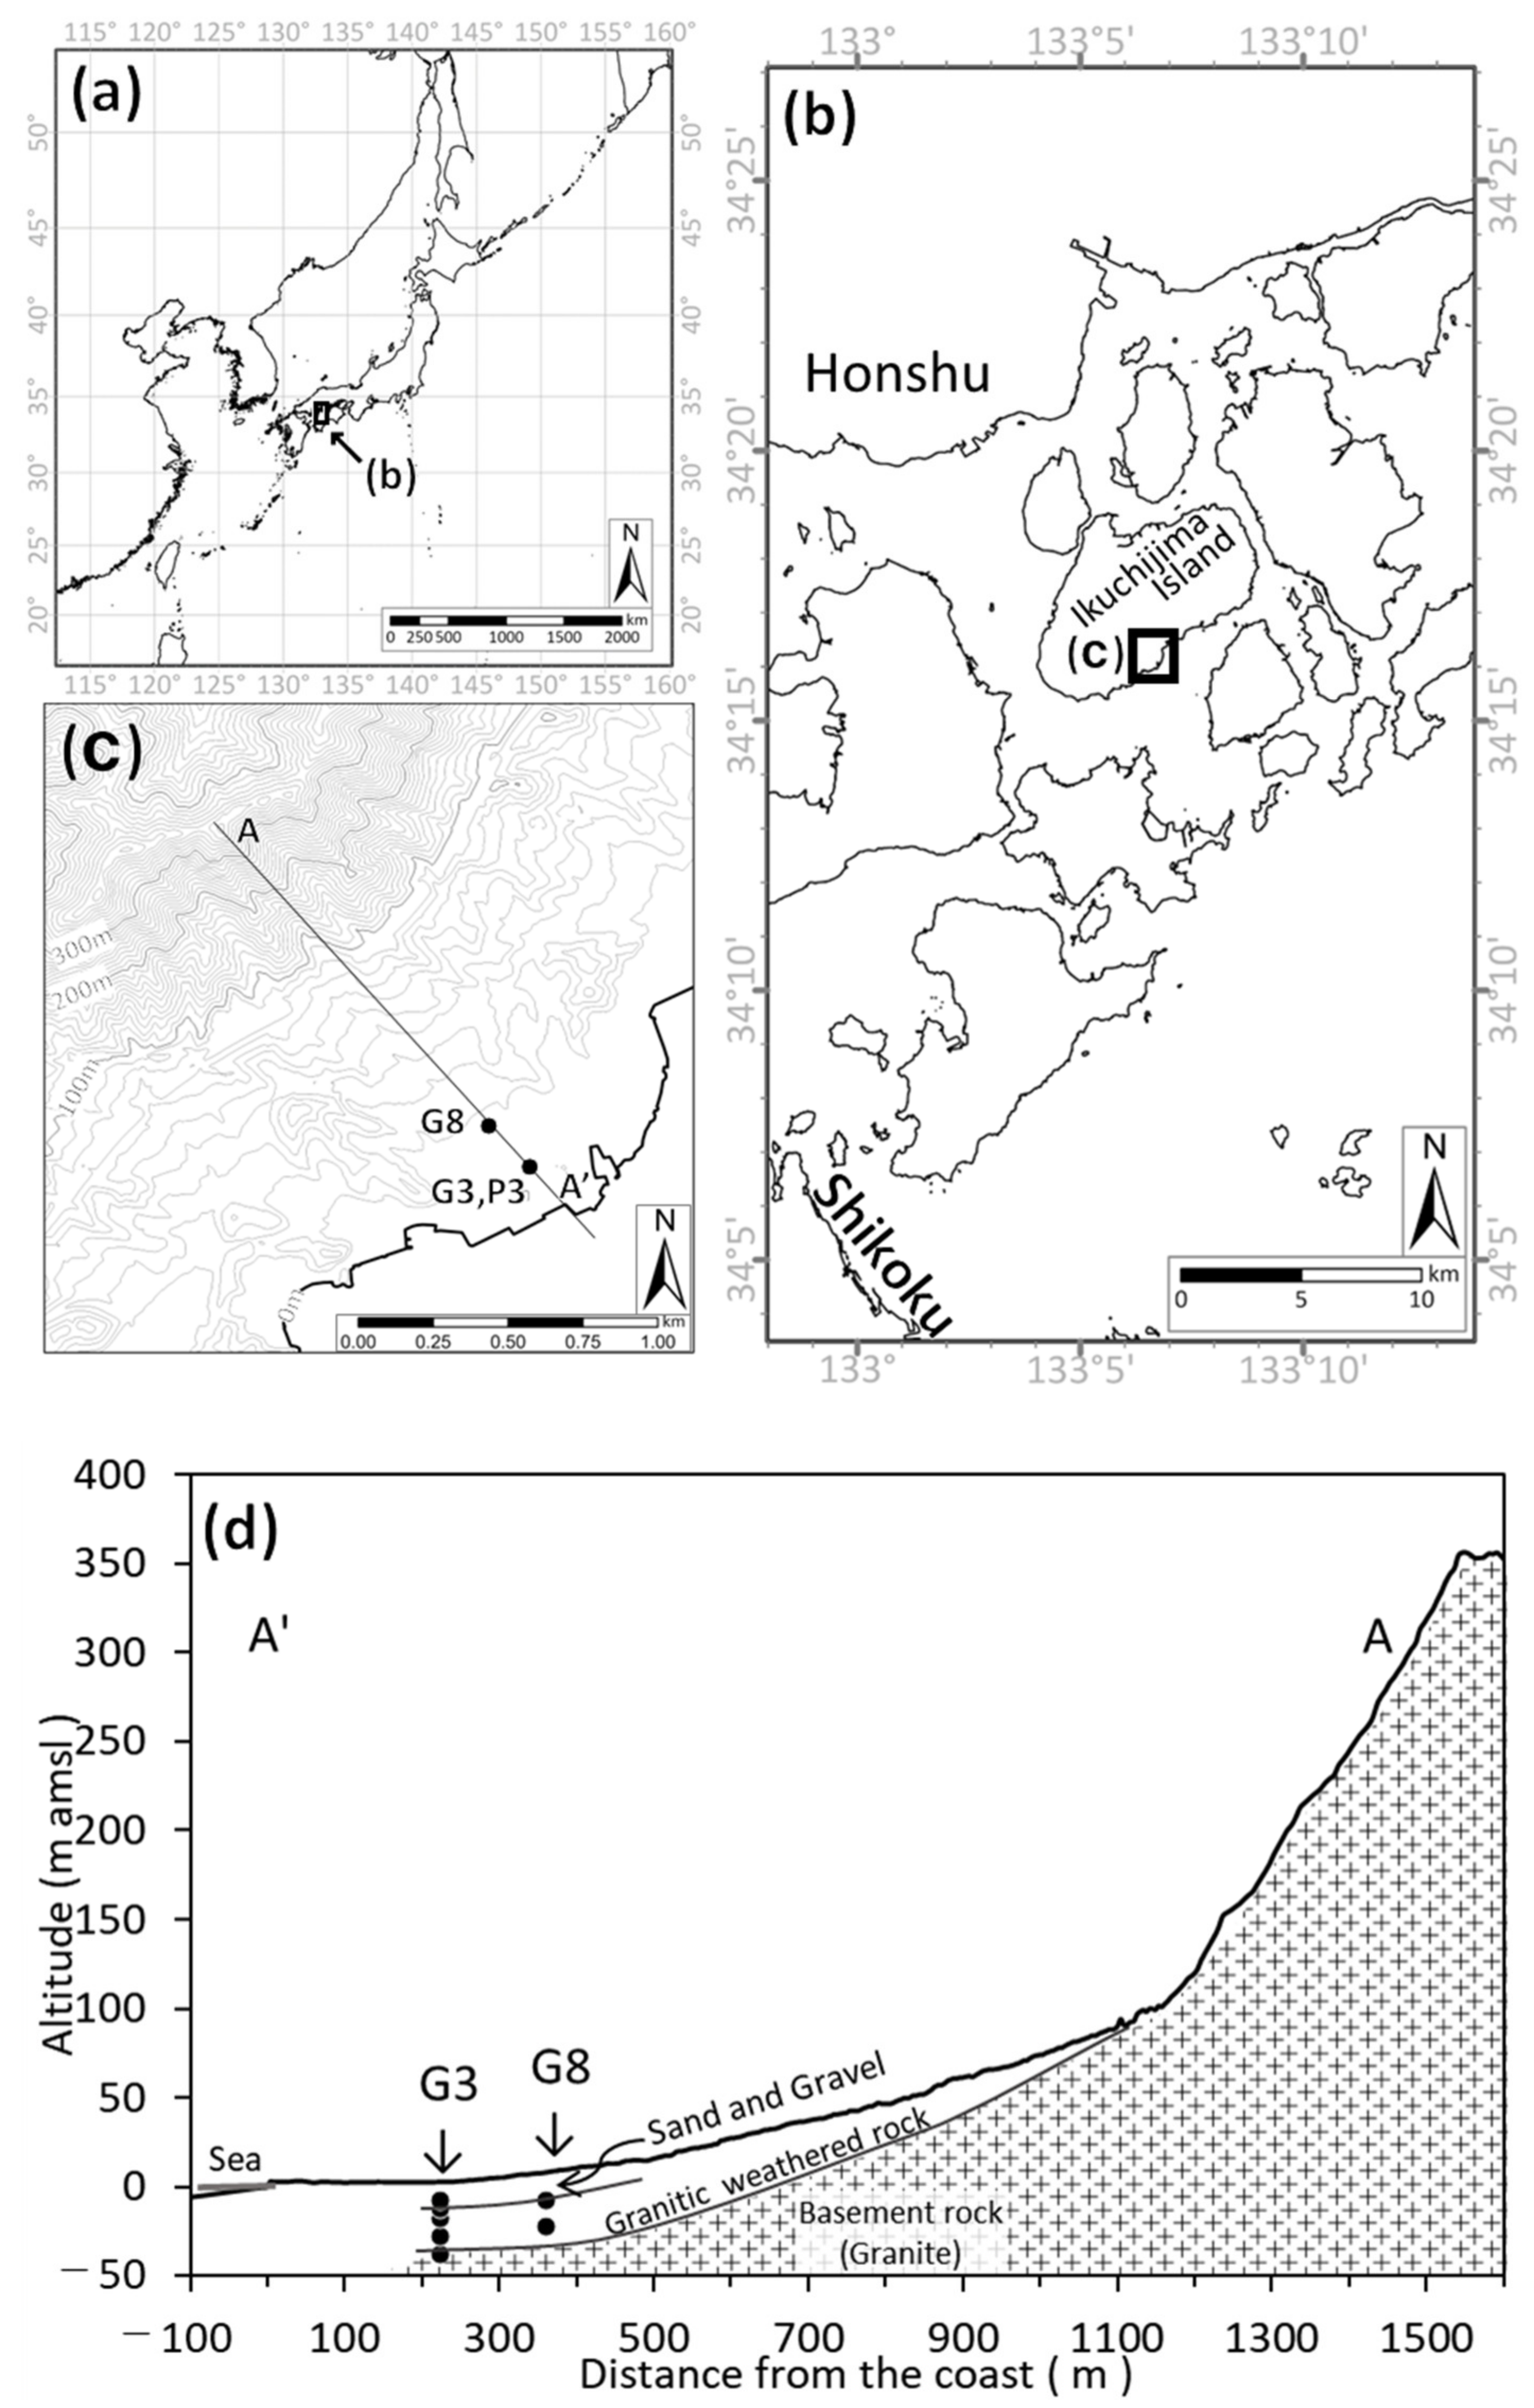
2.1. Study Area

The study site is located on Ikuchijima Island in Onomichi City, where the Nishi-Seto Expressway (Shimanami Kaido) connects Honshu and Shikoku in Japan (Figure 1a) and covers an area of 31.21 km2. The geology of the region consists of granite and its weathered products. The area has a maximum altitude of 456 m, an average temperature of 15.9 °C, and an annual average rainfall of 1138.3 mm (1991–2020 average; AMeDAS). Land use is widely distributed with citrus orchards.
The watershed with observation wells (Figure 1b,c); G8 and G3) is located in the southeastern part of Ikuchijima Island. The distance from the mountaintop to the shoreline is 1.8 km, the highest altitude is 396 m, and the total area of the watershed is 0.44 km². The relief ratio, which indicates the average slope of the watershed, is 0.24, indicating steep, mountainous watershed topography [30]. The spring at the headwater is approximately 120 m above sea level, and the relief ratio of the valley slope is 0.38, which is steeper than that of the headwater. In this area, the river surface altitude is higher than the groundwater surface altitude; as a result, the river tends to lose water to the groundwater recharge [30]. As for land use in the basin, mainly orchards and houses are distributed in the area, with an altitude of approximately 3 m to 100 m, whereas the higher altitude area is mountainous.
At the G3 site, sand, gravel, and clayey soil are distributed from the surface down to 14 m, weathered granite is distributed from approximately 14 m to 30 m, and the granite bedrock is distributed at depths greater than 30 m. The interface between the weathered layers and basement rock is at a depth of approximately 30 m (Figure 1d) [31]. At sites G8 and G3, no distinct impermeable layer was observed from the ground surface to a depth of 30 m, suggesting that the aquifer is mainly a single layer. The observation wells were located within the orchard site at seven different depths: two depths upstream at an altitude of 8 m (G8-15:15 m and G8-30:30 m) and five depths downstream at an altitude of 2.7 m (G3-10:10 m, G3-15:15 m, G3-20:20 m, G3-30:30 m, and G3-40:40 m). The screen of the observation wells was 5 m from the bottom at G3-40 only and 1 m at the others. The distance between points G3 and G8 was 137 m.

2.2. Method

Groundwater was measured and sampled multiple times. Water level loggers (Onset Computer Corporation, Bourne, MA, USA) were installed in the observation wells, and water levels were observed at 30-min intervals. Water levels for the period from 2013 to 2016 were used in this study, and they were converted to hydraulic heads using 0 m as the reference plane.
Groundwater sampling was conducted five to seven times (1–2-month intervals) in 2015; for G3-40 (bedrock groundwater), 18 time periods (1–13-month intervals) were conducted between June 2014 and August 2020. A standing water equivalent to at least one well volume was drawn from the wells before the groundwater samples were collected. Tube pumps (Chikyu Kagaku Kenkyusho, Nagoya, Japan) and balers (Daiki Rika Kogyo Co., Ltd., Konosu, Japan) were used for water sampling. Sampled water was filtered on-site through a 0.2-μm pore diameter membrane filter (Advantec Toyo Corporation, Tokyo, Japan) and stored frozen in Spitz tubes (AS ONE Corporation, Osaka, Japan).
The samples were analyzed in the laboratory for hydrogen and oxygen-stable isotope ratios (δD and δ18O) using the WS-CRDS method [32] (Picarro, Inc., Santa Clara, CA, USA). The accuracy of the analysis is 0.025‰ for δ18O and 0.1‰ for δD [33,34,35]. The Cl concentrations were analyzed by ion-exchange chromatography (Shimadzu Corporation, Kyoto, Japan).
To determine the groundwater residence time, water samples were collected in 2019 from two depths (15 m and 30 m) of an upstream observation well (G8) and three depths (15 m, 30 m, and 40 m) of a downstream observation well (G3). Sulfur hexafluoride (SF6) from these samples was measured in the laboratory. Atmospheric contact was avoided during the sampling procedure (IAEA, 2006) [36]. The water samples were stored in a cool and dark place and analyzed within 2 weeks of collection. SF6 measurements were performed using the Purge and Trap GC (ECD) method (analytical precision: within 3%). Each result was corrected for excess air (average concentration of mountain spring water in Japan), as shown in Asai et al. (2021) [37]. In 2022, water samples were collected at two depths (30 m and 40 m) in the downstream observation well (G3), and 14C and 13C were measured by the radiocarbon isotope analysis. The dissolved inorganic carbon (DIC) was reduced to graphite using a vacuum line, and 14C was counted using an accelerator mass spectrometer (AMS). δ13C was also measured using a stable isotopic rare gases mass spectrometer (IRMS). The 13C of carbon dioxide in soil was assumed to be −25‰ and corrected for dead carbon, which does not contain 14C.

3. Results and Discussion

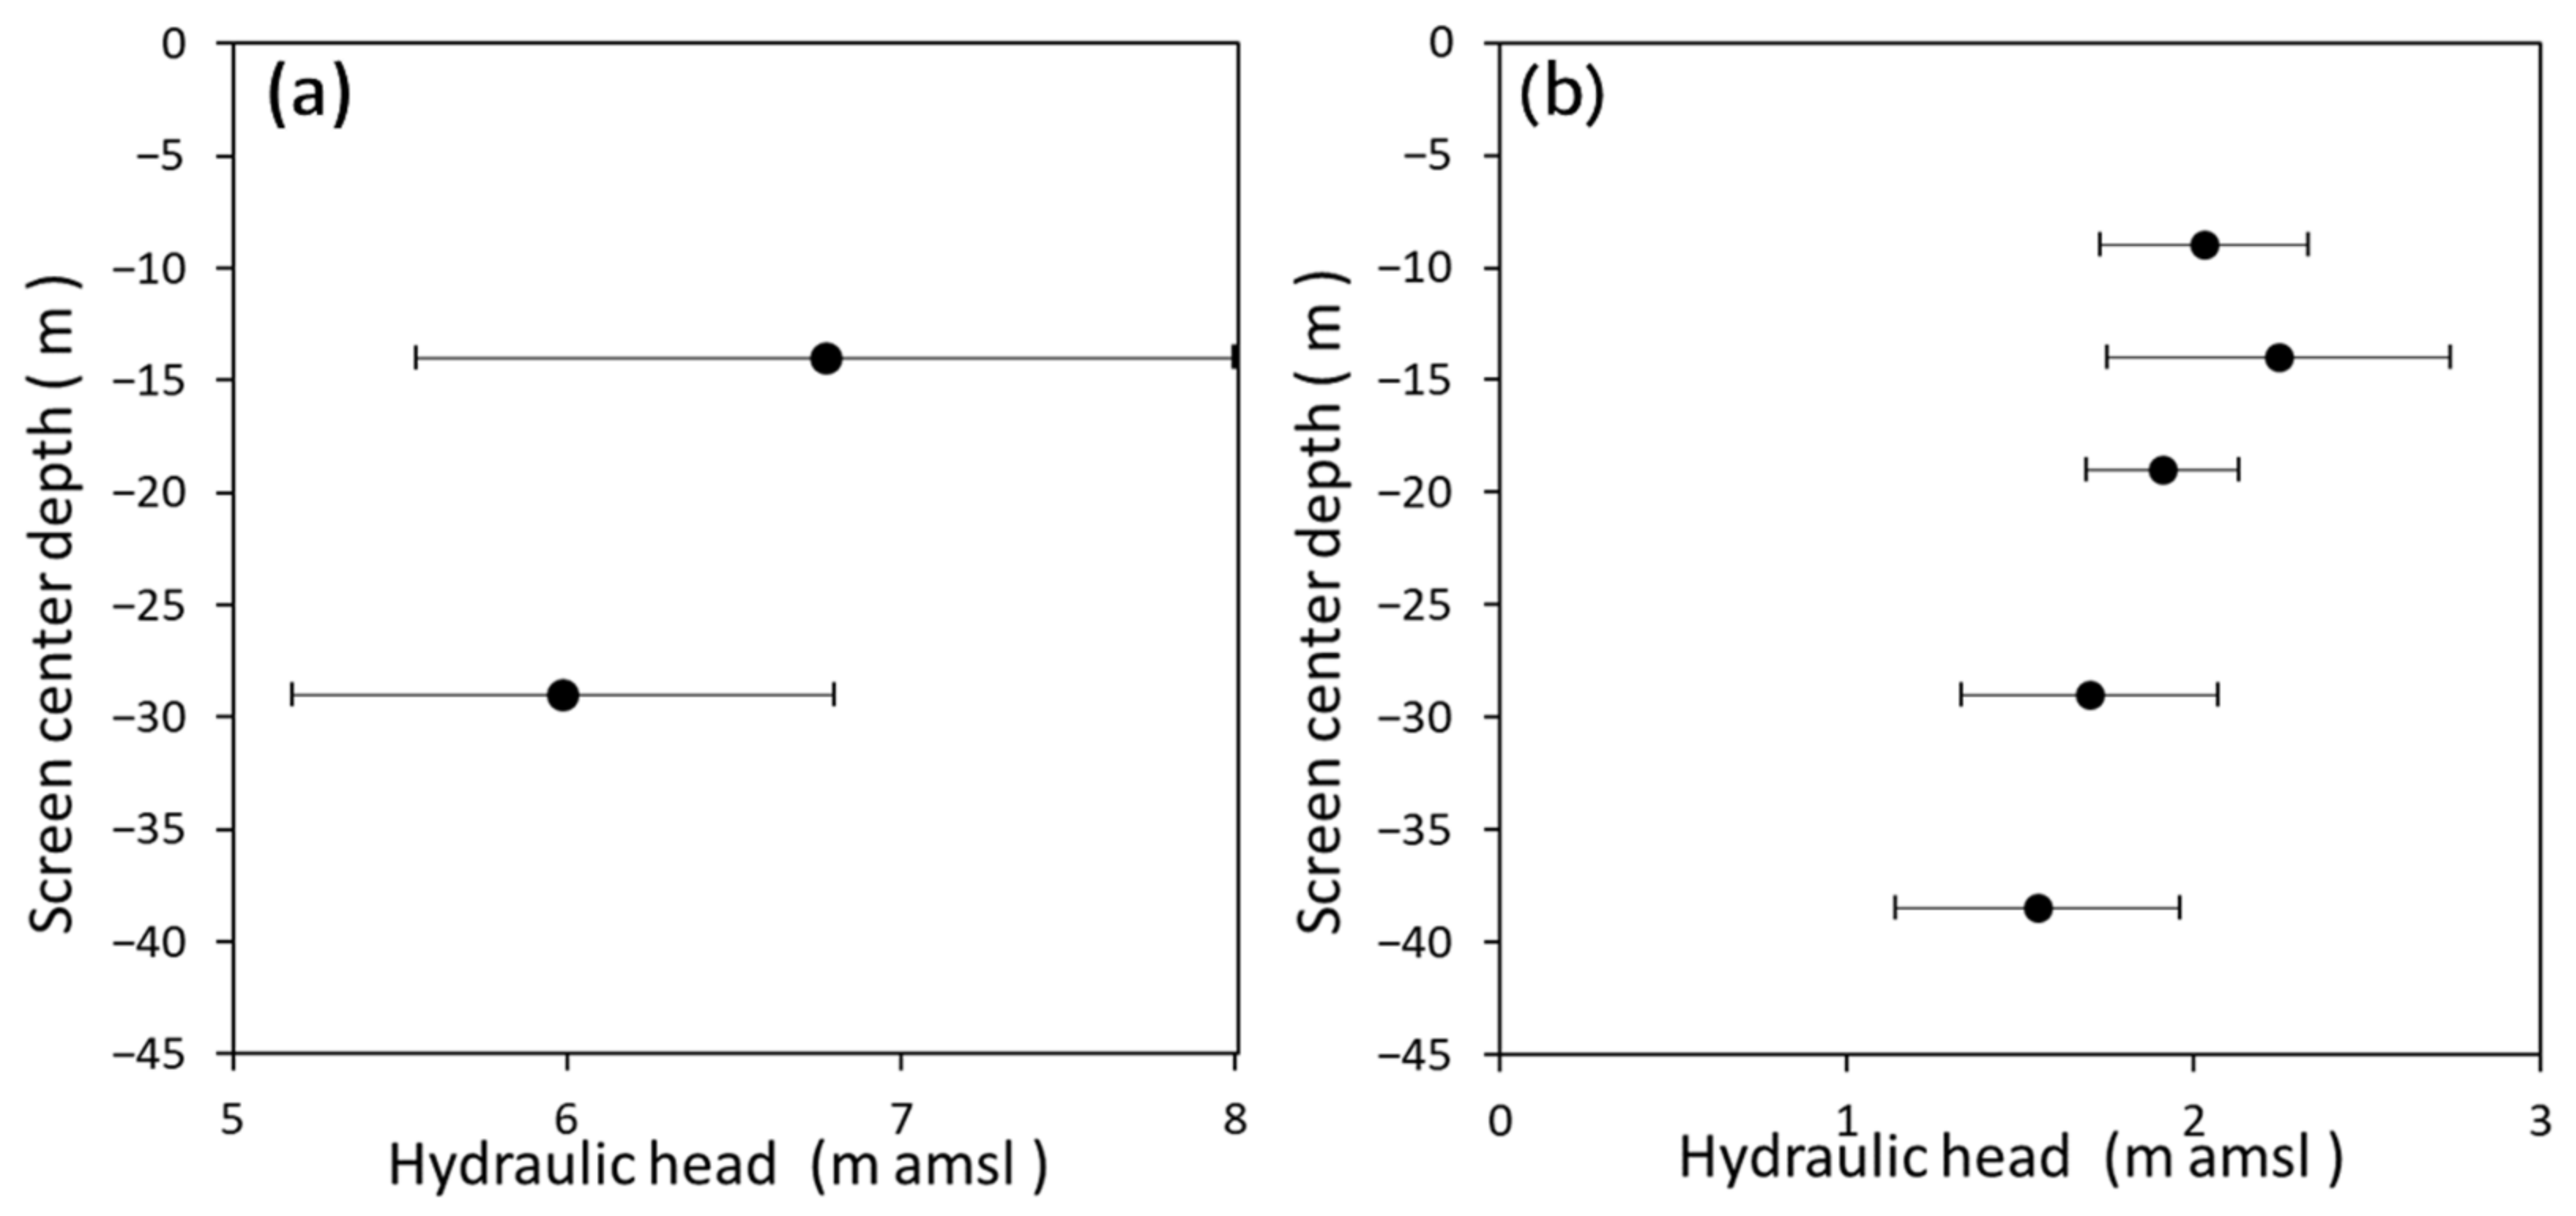
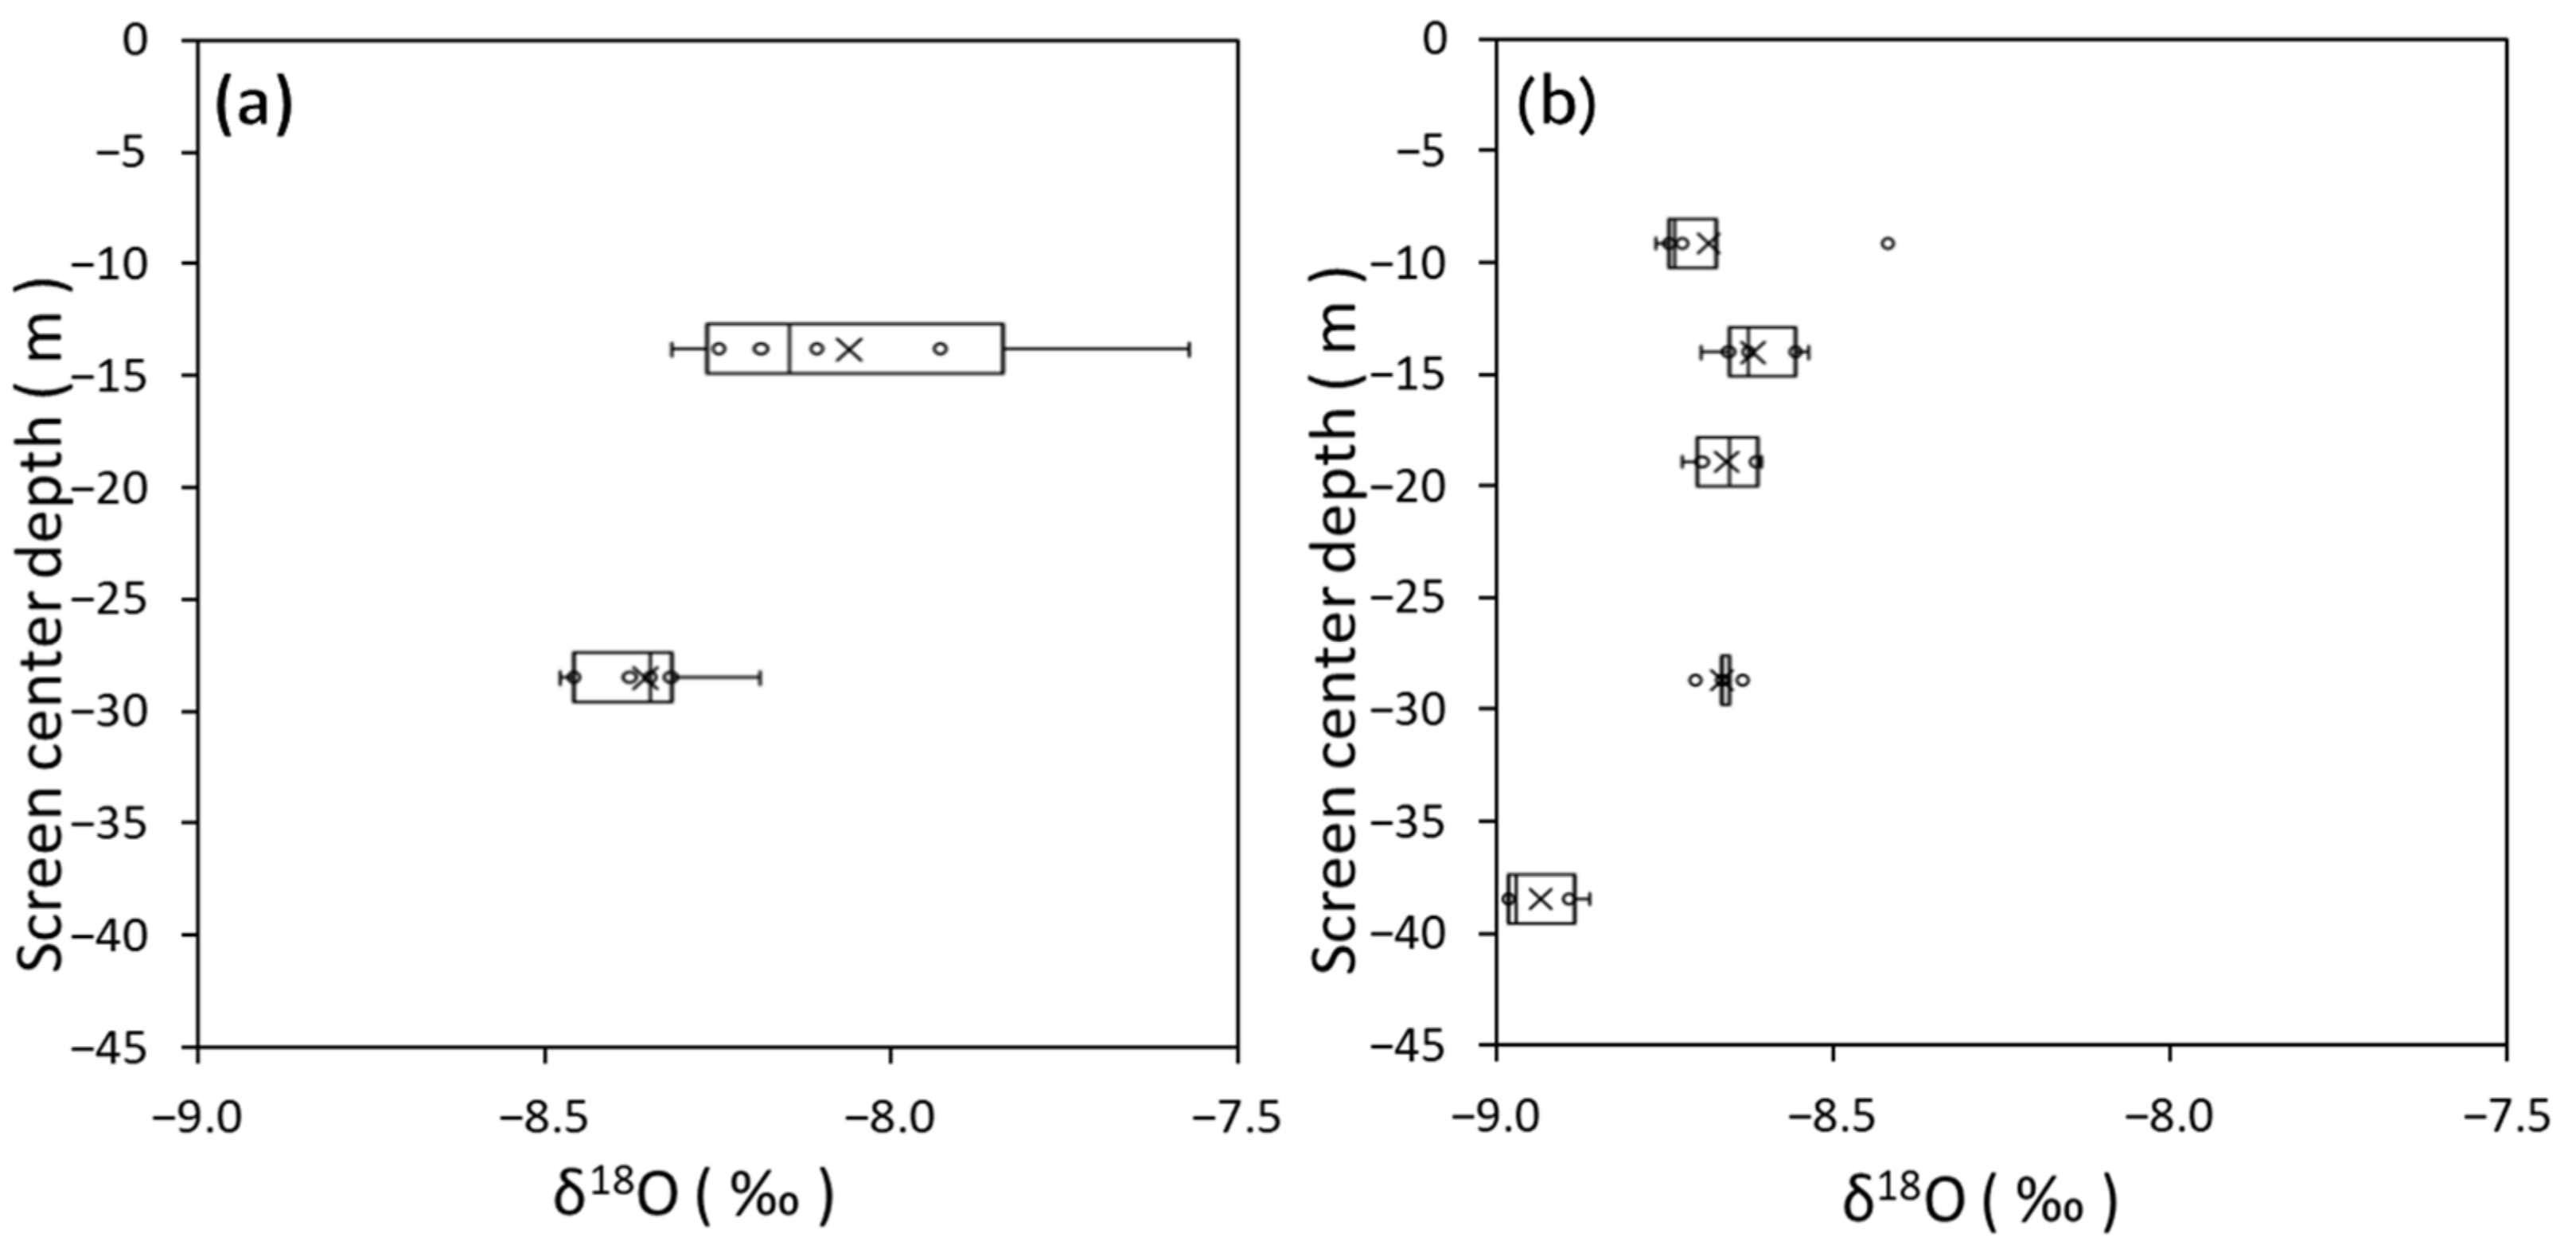
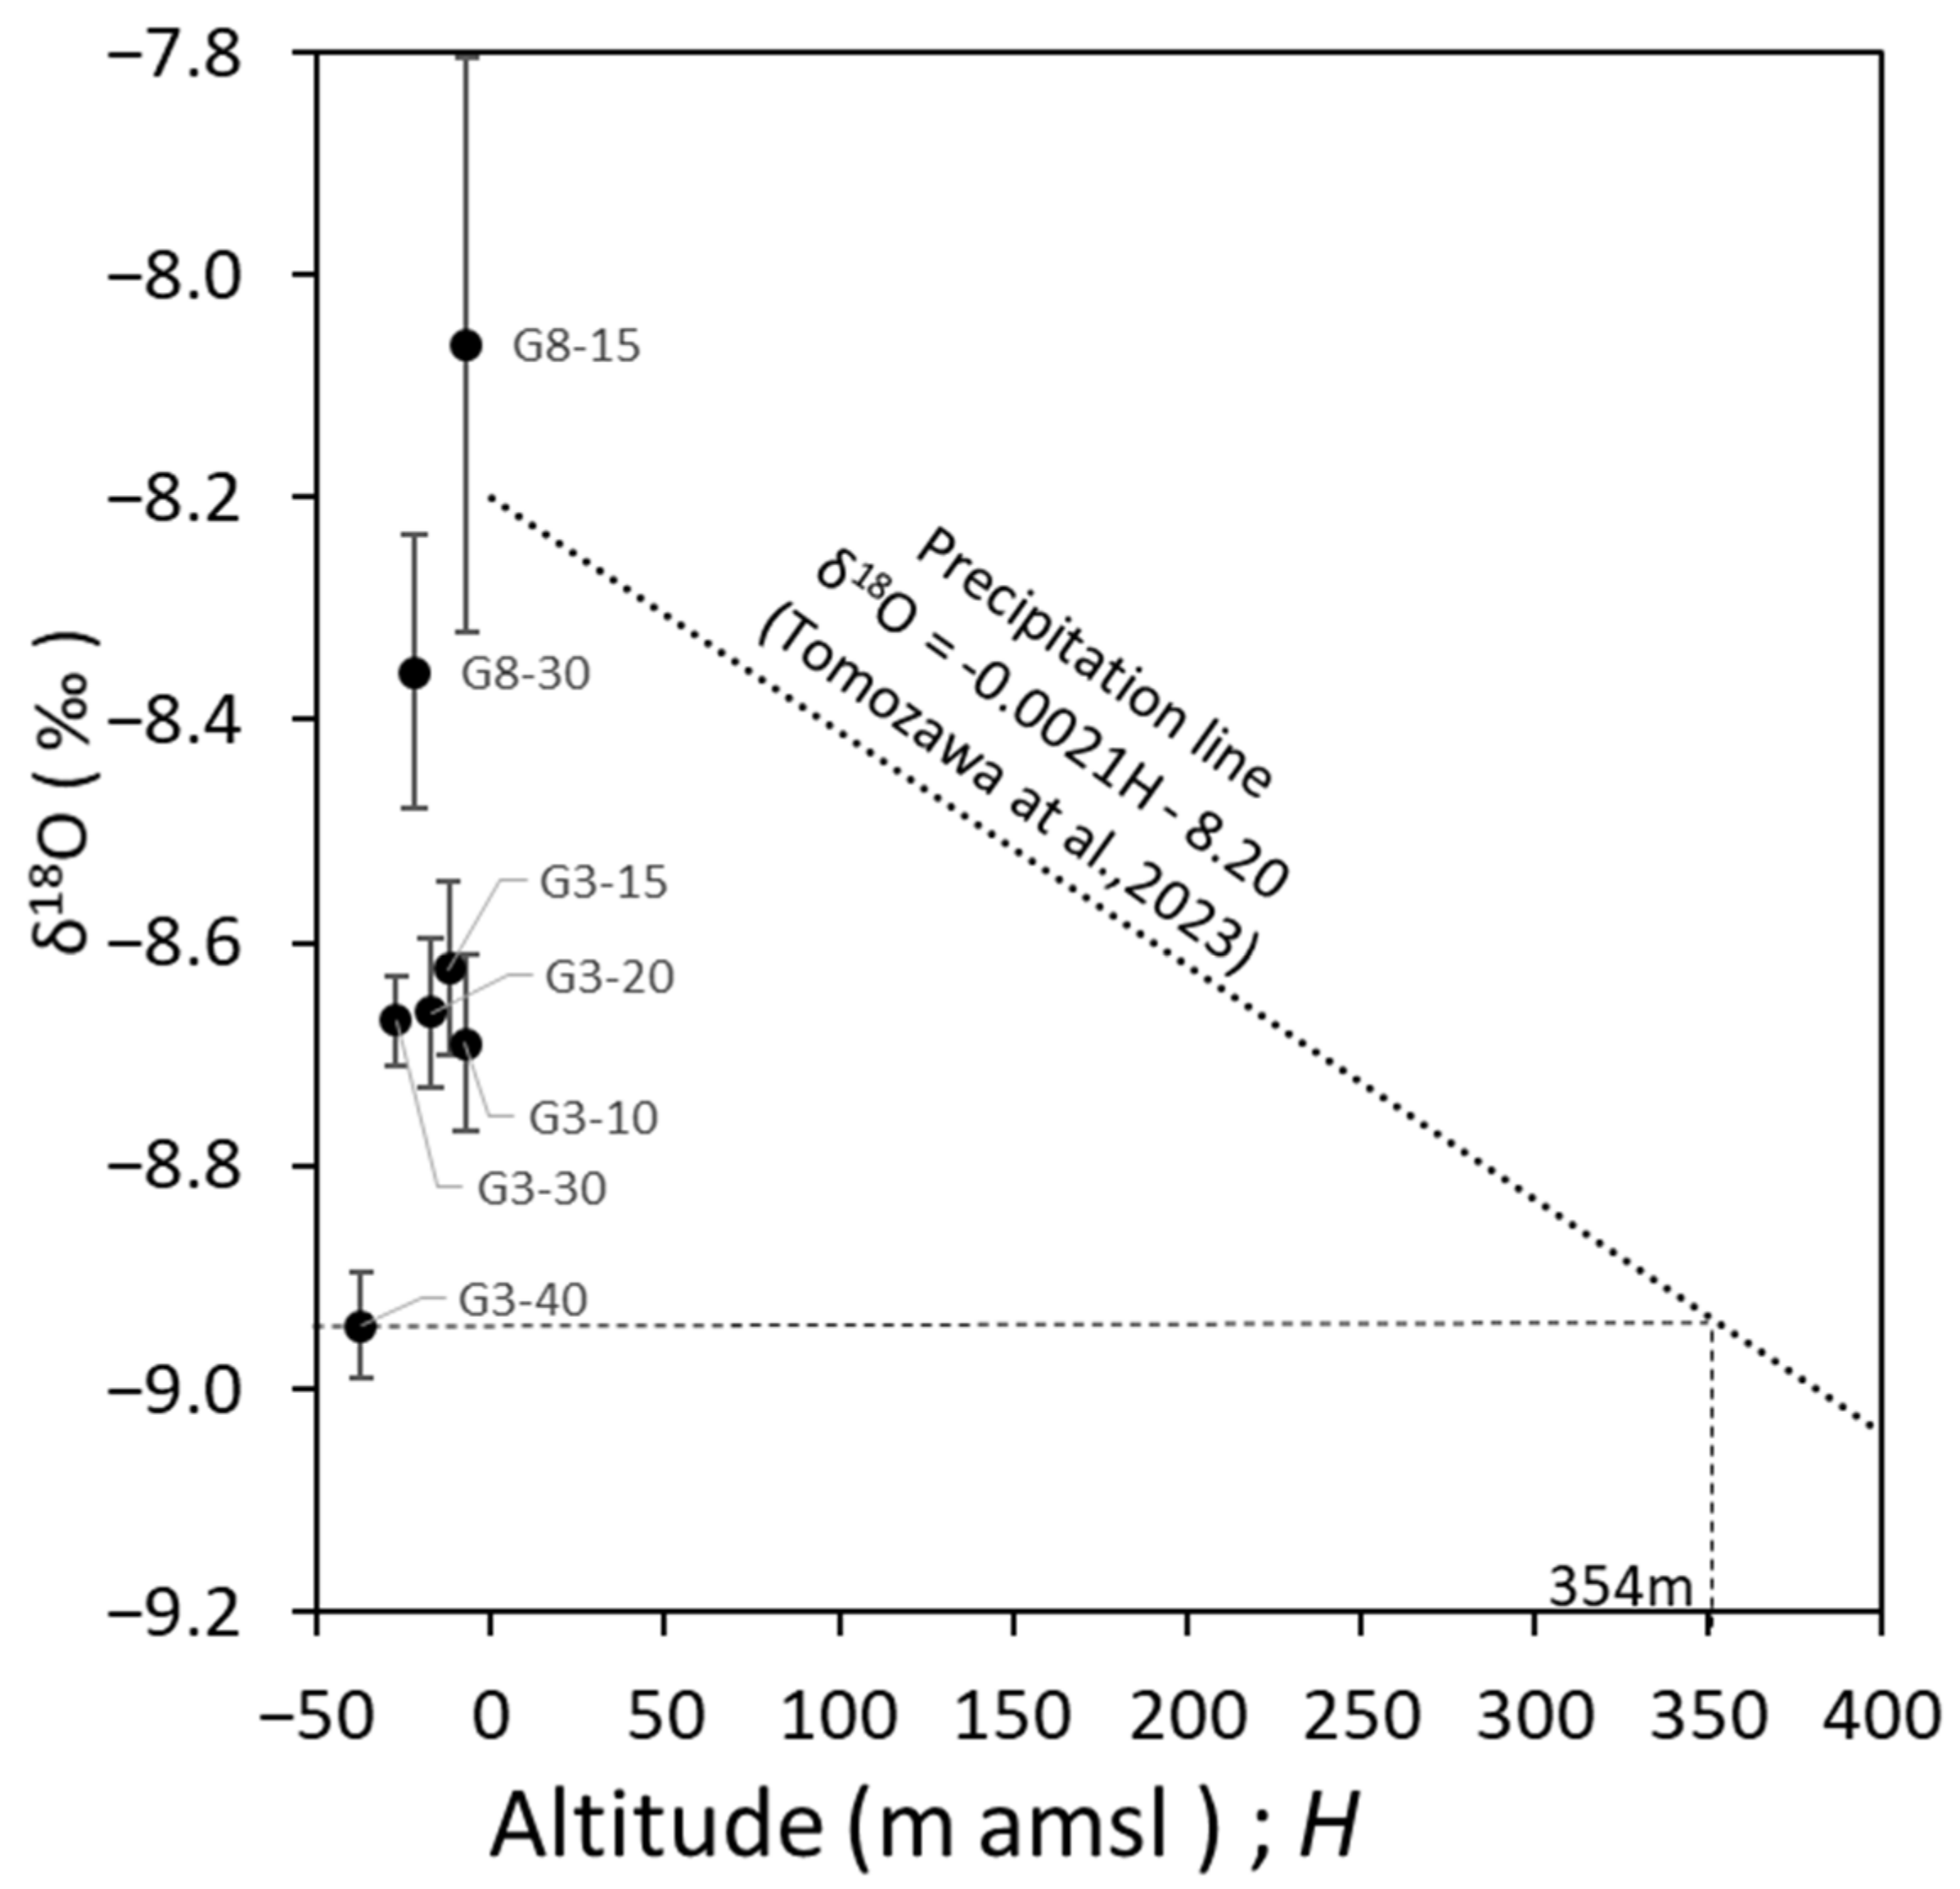
3.1. Groundwater Flow System Estimated from Hydraulic Head, δ18O, and δD

Figure 2 shows the variations in the central depth of the screen and the hydraulic head of each observation well at G8 (Figure 2a) and G3 (Figure 2b), with the plots indicating mean values and error bars indicating fluctuation ranges. The fluctuation range was 2 m or more for G8 and approximately 0.5–1 m for G3. At depths of 15 m in G3, the variation range was large. The hydraulic heads at depths of 15 m and 30 m were higher at G8 than at G3, indicating that the horizontal flow was dominant downstream. Additionally, both G8 and G3 showed high hydraulic heads at 15 m, which decreased with increasing depth. This finding indicated a downward flow from a depth of 15 m at the same point. As the depth was similar to those of the wells in the surrounding area, the hydraulic head was assumed to fluctuate in a range lower than that at G8-15 due to the pumping effect.
Figure 3 shows the central depth of the screen of each observation well, average δ18O value, and fluctuation range (error bar) at G8 (Figure 3a) and G3 (Figure 3b). In Japan, temporal variations in groundwater isotopic ratios are generally much lower than that of precipitation. This observation is due to the stabilization of seasonal variations in precipitation values during the recharge process, which results in a constant value. For example, the stable isotope ratio vertical profile observed at Tsukuba, a hydrogeological condition with a thick unsaturated zone where seasonality has been confirmed in precipitation and isotope ratios of precipitation, shows cyclic fluctuations down to a depth of about 4 m but not deeper than that (Yabusaki et al. 2011) [38]. The change in δ18O at G8 was relatively large (−8.3 to −7.5‰) at G8-15 and was approximately −8.4‰ at G8-30, whereas, at G3, it was approximately −8.7‰ for G3-10, G3-15, G3-20, and G3-30 and approximately −8.9‰ for G3-40. Moreover, based on the aforementioned hydraulic heads, a downward flow occurred below G3-15. Therefore, from G3-10 to -30, the water was well dispersed instead of in independent streamlines.
Figure 4 shows the precipitation lines obtained in a previous study [39]. In general, due to the altitude effect, the isotopic ratios of precipitation decrease with altitude. In Japan, both precipitation and isotopic ratios show seasonal variations; however, by obtaining annual weighted averages, representative values can be calculated for a given location, and by examining averages from multi-year observations, the inter-annual variation effects can be reduced. In the same watershed, a linear relationship (precipitation line: δ18O = −0.0021H − 8.20) was observed between the altitude at which precipitation was collected at the three sites and the isotope-weighted average value over two years.
These results can be used to estimate the groundwater recharge area. In Japan, which has steep topographies, the recharge altitude of groundwater was determined while considering the effect of precipitation infiltrating the ground; therefore, a groundwater recharge line is used, which is created using several spring points with known topographical recharge altitudes [40,41]. Asai et al. (2009) [26] compared the groundwater recharge lines and precipitation lines obtained from springs with small catchments (<1 km2) at Ontake Volcano (elevation 3067 m) and confirmed that there was a difference. However, in the Ikuchijima Island observation area, long-term continuous observations were challenging, as there was relatively less spring water points. Therefore, in this study, to estimate the extent of groundwater recharge, the precipitation line was assumed to be the groundwater recharge line, and the actual topography was evaluated. The altitude and average δ18O of the groundwater sampling points are plotted in Figure 4. The error bars indicate the minimum and maximum δ18O values for that location. The recharge altitude can be determined from the intersection of the horizontal line passing through the groundwater value and the precipitation line. For example, the recharge altitude of G3-40 was 354 m. The topography of the area corresponding to each groundwater recharge altitude was estimated as follows: G8-15 is near a plain; G8-30 is a fan-shaped area; G3-10, G3-15, and G3-20 are alluvial areas; and G3-30 and G3-40 are mountainous areas.

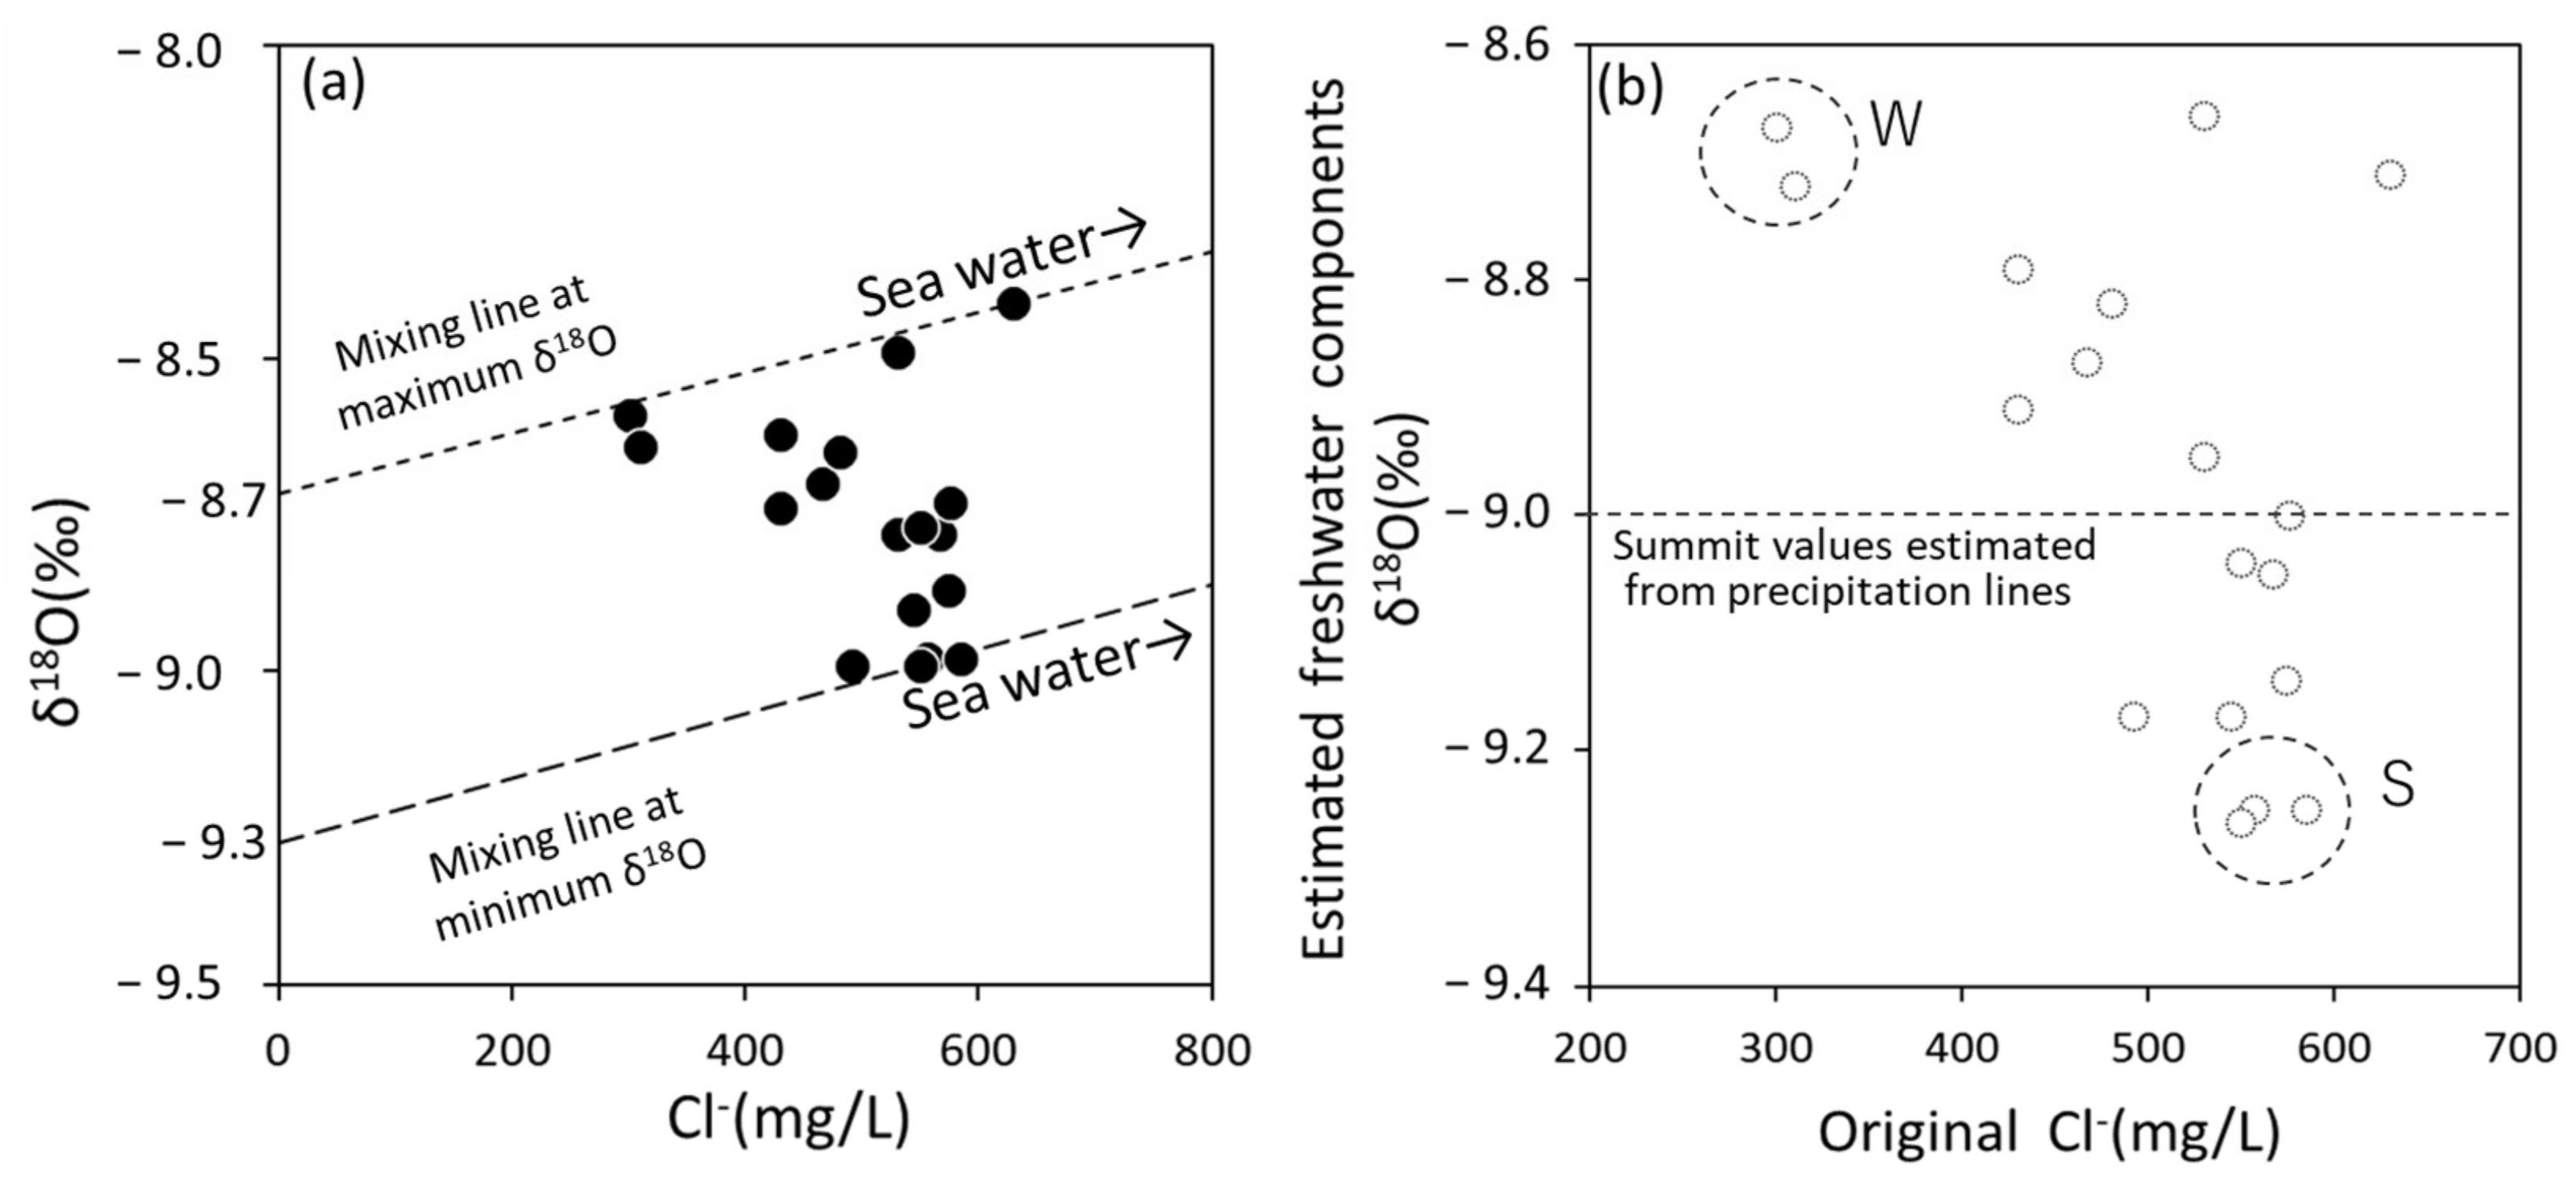
3.2. Features of Coastal Bedrock Groundwater Based on Cl Concentration and δ18O

δ18O in seven seasons throughout 2015 in G3-40 was remarkably lower than those at other sites (average value: −8.9‰). Figure 5a shows the relationship between δ18O and Cl concentrations during 2014–2020. δ18O fluctuated from −9.0 to −8.4‰, whereas the Cl concentration fluctuated from 300 mg/L to 600 mg/L, but no clear correlation was observed. These Cl concentrations were higher than those at other depths (<60 mg/L), and assuming that the Cl concentration in the seawater in the Seto Inland Sea was approximately 18,000 mg/L [18], the seawater mixing ratio was 2.0–3.5%. Based on the Ghyben–Herzberg equation [42,43], the depth of the saltwater–freshwater interface at point G3 was calculated to be 80 m, because the mean water head at G3-10 was about 2 m. This indicates that the effect of the saltwater–freshwater interface at the 40 m point was small. Figure 5a shows the relationship between the Cl concentrations of G3-30 and δ18O. The Cl concentration of seawater was 18,000 mg/L and δ18O was 0.0‰, and the intersection point (y-intercept) of the mixing line passing through the seawater and the measured value on the y-axis can be assumed to be the δ18O of the freshwater component. Therefore, the measured value consists of two endmembers: seawater and fresh groundwater components. The value of fresh groundwater can be estimated using the following equations:
Rsea + Rfw = 1
δseaRsea + δfw Rfw = δsmp
CseaRsea + Cfw Rfw = Csmp
where Rsea is the seawater mixing ratio, Rfw is the fresh groundwater mixing ratio before seawater mixing, Csea is the seawater Cl concentration, Cfw is the freshwater groundwater Cl concentration before seawater mixing, Csmp is the sample Cl concentration, δsea is the seawater δ18O, δfw is the fresh groundwater δ18O before seawater mixing, and δsmp is the sample δ18O.
Using Equations (1)–(3), the following equation is derived:
Rfw = 1 − Rsea
where, from Equation (2)
δfw = (δsmpδsea Rsea)/Rfw
Substituting (4)
δfw = (δsmpδsea Rsea)/(1 − Rsea)
where, from Equation (3)
Rsea = (Csmp Cfw Rfw)/Csea
Substituting (7)
Rsea = (Csmp Cfw(1 − Rsea))/Csea
Rsea = (CsmpCfw)/(CseaCfw)
Substitute (6) for (8)
δfw = (δsmpδsea(CsmpCfw)/(CseaCfw))/(1 − (CsmpCfw)/(CseaCfw))
where δsea = 0 ‰ and Cfw = 0 mg/L
δfw = δsmp/(1 − Csmp/Csea)
Accordingly, the δ18O of fresh groundwater was calculated as −9.3 to −8.7‰ using Equation (9).
Figure 5b shows the estimated relationship between the δ18O and Cl concentrations in fresh groundwater. Although some outliers were observed, the δ18O of fresh groundwater was low when the Cl concentration was high—that is, when the seawater component was abundant.
Additionally, based on the freshwater groundwater results, the recharge area can be estimated using the precipitation line [39] described in the previous section. Moreover, the precipitation at the maximum altitude (396 m) in the target basin was −9.0‰; therefore, precipitation occurred near or above the summit. However, considering that the recharge area was almost absent, this possibility was unlikely.

3.3. Origin Estimation of Fresh Groundwater with Low δ18O Based on the Groundwater Age Tracer

Precipitation isotope ratios vary because of various factors, including altitude, precipitation, latitude, inland area, and temperature [44]. Mount and temperature effects can be considered seasonal changes and long-term, time-varying factors at specific points. Additionally, the isotope ratio is low during heavy rains or at low temperatures. Heavy rains and cold waves occur occasionally in the study area but, considering that these affect only the groundwater at a depth of 40 m in the long term, is not plausible. Several previous studies have reported low δ18O values in fresh groundwater, which was also confirmed in this study, suggesting the existence of old water that was recharged during the glacial period. Kusano et al. (2014) [28] used groundwater age indices and stable isotope ratios to reveal the presence of old groundwater at depths of several hundred meters on Nakanoshima Island in the Oki Islands, Shimane Prefecture, and pointed out the possibility that water recharged during the last glacial period, when the sea level was lower than today, remains. Yamada et al. (2006) [45] investigated 151 hot springs in the Chugoku region and found low isotope ratios in nine hot springs several hundred meters below the surface, which cannot be explained by the current precipitation, and pointed out the possibility that the water was natural water supplied 10,000 years ago. Shintani et al. (2022) [46] classified and mapped groundwater in the entire Osaka Plain by cluster analysis and found fossil freshwater with low isotope ratios at the depth. Additionally, Ju et al. (2021) [47] clarified that, in groundwater along the Yellow Sea Coast, the difference in density caused by salinity ingress is the driving force, causing the upward flow of older bedrock groundwater along the saltwater–freshwater interface. Therefore, to examine these possibilities, we analyzed SF6 and 14C in the groundwater and estimated the groundwater age.
Assuming the piston flow model, the SF6 results indicate that the groundwater age was 8–23 years old. Table 1 shows the depth of each site and the groundwater age estimated using SF6. The ages were 12 and 8 years for G8-15 and G8-30, respectively, 19 years for G3-15 and G3-30, and 23 years for G3-40. Additionally, the water at G8, which was closer to the recharge basin, was younger, whereas the water at G3, which was closer to the outflow basin, was relatively older. In the previous section, the values of G3-15 and G3-30 were suggested to be closer than that of δ18O and that they mixed well downward, which was also supported by the groundwater ages. Overall, the deepest layer, G3-40, was determined to have the oldest water.
Furthermore, from the ages based on 14C, G3-30 was estimated to have been recharged with water after 1950 (pMc = 132.8%), whereas the estimated age of G3-40 was 2100 (pMc = 77.6%). This 14C result also revealed that G3-40 contained relatively older water than that of G3-30.
The δ18O and age tracer values revealed the specificity of the fresh groundwater contributing to G3-40. G3-40 indicates water in the bedrock, but the lack of a clear impermeable layer between G3-30 [31] suggests that it is mixed with G3-30 water. Thus, we assumed that the G3-40 fresh groundwater was formed by mixing of the upper G3-30 water and the old glacial water; therefore, we attempted to estimate the mixing ratio, and the corresponding results are listed in Table 2.
We hypothesized that the endmembers of low δ18O waters represented the waters mentioned by Yamada et al. (2006) [45] in the last glacial period. Consequently, G3-40 (−9.3 to −8.7‰ fresh groundwater value before seawater mixing) was estimated to be a mixture of 90–100% G3-30 water (average −8.7‰) and 0–28% of the last glacial water (−10.8‰).
Similar calculations were performed using the SF6 concentration (Table 3), which was considered zero for the last glacial water. Consequently, G3-40 (1.84 f mol/kg) was a mixture of 82% G3-30 (2.24 f mol/kg) water and 18% water from the last glacial period (0 mol/kg).
A similar trial calculation was performed using 14C (Table 3). For the last glacial water, we used values derived from the graph in the existing literature [44]. Accordingly, the value for G3-40 was pMc 77.6%, and the analytical value was pMc 132.8% for G3-30. However, 76% of the water from the theoretical value of pMc after 1950 (calculated as 100% of the theoretical value of water after 1950) and 24% of the water from the last glacial period (20,000 years ago, pMc 5%) were mixed.
As described above, the sampling time may differ, and although there were some differences, the results showed a similar tendency, indicating that the water in G3-40 was a mixture of three potential components (G3-30, last glacial period recharged freshwater, and stagnant seawater). However, collecting water from the last glacial period is difficult; therefore, we can estimate that the water in G3-40 was believed to have been formed from a mixture of water from the last glacial period and a small amount of seawater in G3-30.

3.4. Groundwater Dynamics near the Saltwater–Freshwater Interface

As shown in the previous section, bedrock groundwater (G3-40) near the saltwater–freshwater interface was suggested to be a mixture of G3-30 water and old water (water from the last glacial period and stagnant seawater). Moreover, as shown in Figure 5b, the Cl concentrations of G3-40 (i.e., mixing ratio of seawater) and δ18O of unknown freshwater groundwater (i.e., mixing ratio of old water) appear to be related. Therefore, we discuss the following two periods of G3-40: “a period of low Cl concentration and high δ18O of freshwater groundwater” (W period) and “a period of high Cl concentration and low δ18O of freshwater groundwater” (S period). To explain the characteristics of these periods, we can assume that the saltwater–freshwater interface fluctuated, and the mixing ratio of old water and G3-30 water changed accordingly.
As the Cl concentration in G3-40 was high in the S period, a strong invasion of the saltwater–freshwater interface was suggested. Accordingly, the old water contributed to the increase, because the saltwater–freshwater interface moved, which pushed the old water upwards. Conversely, in the W period, the Cl concentration in G3-40 was low; therefore, a weak invasion of the saltwater–freshwater interface was considered; moreover, unlike in the S period, the ability of the saltwater–freshwater interface movement to push the old water up was weakened. Thus, the contribution of the old water was believed to be marginal.
Thus, the dynamics of G3-40 were influenced by changes in the saltwater–freshwater interface. However, this study does not sufficiently clarify the change mechanism of the saltwater–freshwater interface; thus, further research is required.

4. Conclusions

In this study, we investigated the groundwater dynamics near the saltwater–freshwater interface of coastal groundwater on an island of the Seto Inland Sea, Western Japan, using a multi-tracer approach.
At the observation wells, at depths of 10–30 m located at 8 m and 2.7 m altitudes, the groundwater recharge areas were estimated to range from plains to mountainous areas. Additionally, the impact of groundwater pumping (from a depth of approximately 30 m) was evaluated at both sites.
The bedrock groundwater at a 40 m depth located at 2.7 m in altitude was brackish with a high Cl concentration and was considered to be the groundwater near the saltwater–freshwater interface, which is a mixture of seawater and fresh groundwater. In contrast, the estimated δ18O of fresh groundwater could not be explained by the precipitation values on the island. This result suggests the possibility that the fresh groundwater was recharged during a previously colder period. The dating results indicated that the origin of fresh groundwater was likely freshwater recharged during the last glacial period. The source of the groundwater at a 40 m depth, inferred from the combined results of each tracer, can be explained by a mixture of stagnant old water (0–28%), groundwater at a 30 m depth (76–100%), and stagnant seawater (1–3%). Moreover, the changes in the δ18O and Cl concentrations were affected by changes in the saltwater–freshwater interface.
The results of this study contribute to a detailed understanding of the risk of groundwater salinization, which is a challenge for the sustainable use of fresh groundwater resources in coastal areas.

Author Contributions

Conceptualization, Y.T., S.-i.O. and M.S.; Methodology, Y.T., S.-i.O. and M.S.; Validation, Y.T., S.-i.O. and M.S.; Formal Analysis, Y.T. and K.A.; Investigation, Y.T., S.-i.O. and M.S.; Resources, Y.T., S.-i.O. and M.S.; Data Curation, Y.T.; Writing—Original Draft Preparation, Y.T.; Writing—Review and Editing, Y.T., S.-i.O. and M.S.; Visualization, Y.T.; Supervision, Y.T. and S.-i.O.; Project Administration, Y.T. and S.-i.O.; and Funding Acquisition, S.-i.O. and M.S. All authors have read and agreed to the published version of the manuscript.

Funding

This work was funded by the following: Grant-in-Aid for Scientific Research (A) by the Japan Society for the Promotion of Science (Project No. 18H04151, PI: Shin-ichi Onodera), The Asia-Pacific Network for Global Change Research (APN) under grant no. CRRP2019-09 MY-Onodera (funder ID: http://dx.doi.org/10.13039/100005536, accessed on 19 July 2022) and Hiroshima University Promising Research Initiatives (PRIs) (Project Title: Catchment Healthy Cycle between urban and rural in Setouchi to Asia, toward the creation (HURu-SAto), PI: Shin-ichi Onodera).

Institutional Review Board Statement

Not applicable.

Informed Consent Statement

Not applicable.

Data Availability Statement

The data presented in this study are available upon request from the corresponding author.

Acknowledgments

We would like to thank the local people, including Japan Agricultural Cooperatives Setoda, for their cooperation in conducting this research. We express our deepest gratitude to them. We would also like to thank the past members of the Onodera Laboratory.

Conflicts of Interest

All opinions, findings, conclusions, or recommendations expressed in this material are those of the authors and do not necessarily reflect the views of APN. While the information and advice in this publication are believed to be true and accurate at the date of publication, neither the editors nor the APN accept any legal responsibility for any errors or omissions that may be made. APN and its member countries have no warranty, either expressed or implied, with respect to the material contained herein.

References

  1. Onodera, S.; Saito, M.; Kitaoka, K. Water Environment in Seto Inland Sea Catchments: Sato Water; Kibito Publishing: Okayama, Japan, 2018; p. 266. (In Japanese) [Google Scholar]
  2. Holding, S.; Allen, D.M.; Foster, S.; Hsieh, A.; Larocque, I.; Klassen, J.; Van Pelt, S.C. Groundwater vulnerability on small islands. Nat. Clim. Change 2016, 6, 1100–1103. [Google Scholar] [CrossRef]
  3. Ioka, S.; Onodera, S.; Saito, M.; Rusydi, A.; Bakti, H.; Wakasa, S.A. Species and potential sources of phosphorus in groundwater in and around Mataram City, Lombok Island, Indonesia. SN Appl. Sci. 2021, 3, 27. [Google Scholar] [CrossRef]
  4. Kimbi, S.; Onodera, S.; Nozaki, S.; Tomozawa, Y.; Wang, K.; Rusydi, A.F.; Saito, M. Impact of citrus agriculture on the quality of water resource in a small steep Island, Seto Inland Sea, Japan. Int. J. Geomate 2021, 20, 109–114. [Google Scholar] [CrossRef]
  5. Kimbi, S.; Onodera, S.; Ishida, T.; Saito, M.; Tamura, M.; Tomozawa, Y.; Nagasaka, I. Nitrate contamination in groundwater: Evaluating the effects of demographic aging and depopulation in an island with intensive citrus cultivation. Water 2022, 14, 2277. [Google Scholar] [CrossRef]
  6. UNESCO-IHP; UNEP. Transboundary Aquifers and Groundwater Systems of Small Island Developing States: Status and Trends; United Nations Environment Programme (UNEP): Nairobi, Kenya, 2016; p. 172. [Google Scholar]
  7. United Nations-Transforming our World: The 2030 Agenda for Sustainable Development. Available online: https://sustainabledevelopment.un.org/post2015/transformingourworld (accessed on 1 December 2021).
  8. Ferguson, G.; Gleeson, T. Vulnerability of coastal aquifers to groundwater use and climate change. Nat. Clim. Change 2012, 2, 342–345. [Google Scholar] [CrossRef]
  9. Jin, G.; Shimizu, Y.; Onodera, S.; Saito, M.; Matsumori, K. Evaluation of drought impact on groundwater recharge rate using SWAT and Hydrus models on an agricultural island in western Japan. Proc. Int. Assoc. Hydrol. Sci. (PIAHS) 2015, 371, 143–148. [Google Scholar] [CrossRef] [Green Version]
  10. Onodera, S.; Saito, M.; Sawano, M.; Hosono, T.; Taniguchi, M.; Shimada, J.; Umezawa, Y.; Lubis, R.F.; Buapeng, S.; Delinom, R. Effects of intensive urbanization on the intrusion of shallow groundwater into deep groundwater: Examples from Bangkok and Jakarta. Sci. Total Environ. 2009, 407, 3209–3217. [Google Scholar] [CrossRef] [PubMed]
  11. Onodera, S. Subsurface pollution in Asian megacities. In Groundwater and Subsurface Environments; Taniguchi, M., Ed.; Springer: Tokyo, Japan, 2011; pp. 159–184. [Google Scholar]
  12. Rusydi, A.F.; Onodera, S.; Saito, M.; Hyodo, F.; Maeda, M.; Sugianti, K.; Wibawa, S. Potential Sources of Ammonium-Nitrogen in the Coastal Groundwater Determined from a Combined Analysis of Nitrogen Isotope, Biological and Geological Parameters, and Land Use. Water 2021, 13, 25. [Google Scholar] [CrossRef]
  13. Rusydi, A.F.; Onodera, S.; Saito, M.; Ioka, S.; Maria, R.; Ridwansyah, I.; Delinom, R. Vulnerability of groundwater to iron and manganese contamination in the coastal alluvial plain of a developing Indonesian city. SN Appl. Sci. 2021, 3, 399. [Google Scholar] [CrossRef]
  14. Taniguchi, M.; Hiyama, T. Groundwater as a Key for Adaptation to Changing Climate and Society; Speringer: Tokyo, Japan, 2014; p. 145. [Google Scholar]
  15. Tomozawa, Y.; Onodera, S.; Saito, M. Estimation of groundwater recharge and salinization in a coastal alluvial plain and Osaka megacity, Japan, using δ18O, δD, and Cl. Int. J. Geomate 2019, 16, 153–158. [Google Scholar] [CrossRef]
  16. Yamanaka, T.; Shimada, J.; Tsujimura, M.; Lorphensri, O.; Mikita, M.; Hagihara, A.; Onodera, S. Tracing a confined groundwater flow system under the pressure of excessive groundwater use in the lower central plain, Thailand. Hydrol. Process. 2011, 25, 2654–2664. [Google Scholar] [CrossRef]
  17. Nozaki, S.; Onodera, S.; Tomozawa, Y.; Saito, M. Spatial distributions in groundwater discharge on various tidal flats in a small and steep island, western Japan. Int. J. Geomate 2021, 20, 66–71. [Google Scholar] [CrossRef]
  18. Onodera, S.; Saito, M.; Hayashi, M.; Sawano, M. Nutrient dynamics with groundwater -seawater interactions in a beach slope of a steep island, western Japan. IAHS Publ. 2007, 312, 150–158. [Google Scholar]
  19. Robinson, C.; Li, L.; Barry, D.A. Effect of tidal forcing on a subterranean estuary. Adv. Water Resour. 2007, 30, 851–865. [Google Scholar] [CrossRef]
  20. Xin, P.; Robinson, C.; Li, L.; Barry, D.A.; Bakhtyar, R. Effects of wave forcing on a subterranean estuary. Water Resour. Res. 2010, 46, W12505. [Google Scholar] [CrossRef]
  21. Zhu, A.; Saito, M.; Onodera, S.; Shimizu, Y.; Jin, G.; Ohta, T.; Chen, J. Evaluation of the spatial distribution of submarine groundwater discharge in a small island scale using the 222 Rn tracer method and comparative modeling. Mar. Chem. 2019, 209, 25–35. [Google Scholar] [CrossRef]
  22. Han, D.; Currell, M.J. Delineating multiple salinization processes in a coastal plain aquifer, northern China: Hydrochemical and isotopic evidence. Hydrol. Earth Syst. Sci. 2018, 22, 3473–3491. [Google Scholar] [CrossRef] [Green Version]
  23. Jasechko, S. Global isotope hydrogeology—Review. Rev. Geophys. 2019, 57, 835–965. [Google Scholar] [CrossRef]
  24. Shimada, J. Groundwater Flow System in the Bedrock Aquifer of a Mountainous Body. J. Jpn. Assoc. Hydrol. Sci. 2001, 31, 37–47, (In Japanese with English abstract). [Google Scholar] [CrossRef]
  25. Carol, E.; Perdomo, S.; Álvarez, M.d.P.; Tanjal, C.; Bouza, P. Hydrochemical, isotopic, and geophysical studies applied to the evaluation of groundwater salinization processes in quaternary beach ridges in a semiarid coastal area of northern Patagonia, Argentina. Water 2021, 13, 3509. [Google Scholar] [CrossRef]
  26. Asai, K.; Satake, H.; Tsujimura, M. Isotopic approach to understanding the groundwater flow system within an andesitic stratovolcano in a temperate humid region: Case study of Ontake volcano, central Japan. Hydrol. Process. 2009, 23, 559–571. [Google Scholar] [CrossRef]
  27. Shimada, J.; Inoue, D.; Satoh, S.; Takamoto, N.; Sueda, T.; Hase, Y.; Iwagami, S.; Tsujimura, M.; Ishitobi, T.; Taniguchi, M. Basin-wide groundwater flow study in a volcanic low permeability bedrock aquifer with coastal submarine groundwater discharge. IAHS Publ. 2007, 312, 75–85. [Google Scholar]
  28. Kusano, Y.; Tokunaga, T.; Asai, K.; Asai, K.; Takahashi, H.A.; Morikawa, N.; Yasuhara, M. Occurrence of old groundwater in a volcanic island on a continental shelf; an example from Nakano-shima Island, Oki-Dozen, Japan. J. Hydrol. 2014, 511, 295–309. [Google Scholar] [CrossRef]
  29. Eissa, M.A. Application of multi-Isotopes and geochemical modeling for delineating recharge and salinization sources in Dahab Basin Aquifers (South Sinai, Egypt). Hydrology 2018, 5, 41. [Google Scholar] [CrossRef]
  30. Saito, M.; Onodera, S.; Takei, T. Nitrate transport process in a small coastal alluvial fan catchment. Jpn. J. Limnol. 2005, 66, 1–10, (In Japanese with English abstract). [Google Scholar] [CrossRef] [Green Version]
  31. Saito, M.; Onodera, S. Characteristics of seasonal NO3-N discharge by groundwater in a coastal agricultural catchment. Jpn. J. Limnol. 2009, 70, 141–151, (In Japanese with English abstract). [Google Scholar] [CrossRef] [Green Version]
  32. Kerstel, E.R.T.; van Trigt, R.; Dam, N.; Reuss, J.; Meijer, H.A.J. Simultaneous determination of the 2H/1H, 17O/16O, and 18O/16O isotope abundance ratios in water by means of laser spectrometry. Anal. Chem. 1999, 71, 5297–5303. [Google Scholar] [CrossRef] [Green Version]
  33. Yamanaka, T.; Onda, Y. On Measurement Accuracy of Liquid Water Isotope Analyzer Based on Wavelength-Scanned Cavity Ring-Down Spectroscopy (WS-CRDS). Bull. Terr. Environ. Res. Cent. Univ. Tsukuba 2011, 12, 31–40. (In Japanese) [Google Scholar]
  34. Takahashi, M. Hydrogen and oxygen isotope analyses of water samples based on the Cavity Ring-Down Spectroscopy “Water isotope analyzer”. J. Jpn. Assoc. Hydrol. Sci. 2018, 48, 17–21. (In Japanese) [Google Scholar] [CrossRef]
  35. Picarro, Inc. L2130-I Analyzer Datasheet. Available online: https://www.picarro.com/support/library/documents/l2130i_analyzer_datasheet# (accessed on 26 January 2023).
  36. IAEA. Use of Chlorofluorocarbons in Hydrology: A Guidebook; International Atomic Energy Agency: Vienna, Austria, 2006. [Google Scholar]
  37. Asai, K.; Tsujimurai, M.; Asai, K. Excess air of groundwater in Chubu region estimated from dissolved nitrogen and argon concentrations. J. Groundw. Hydrol. 2021, 63, 267–277, (In Japanese with English abstract). [Google Scholar] [CrossRef]
  38. Yabusaki, S.; Tase, N.; Shimada, J. Vertical Profile of Stable Isotopes in Soil Water Through the Volcanic Ash Soil Layer in Japan. Bull. Geo-Environ. Sci. 2021, 13, 43–57, (In Japanese with English abstract). [Google Scholar]
  39. Tomozawa, Y.; Onodera, S.; Saito, M. Seasonal Variation of in Water Stable Isotope Ratios of Water in of Precipitation and Groundwater in a Seto Inland Sea Islands. J. Jpn. Assoc. Hydrol. Sci. in press. (In Japanese with English abstract). 2023. [Google Scholar]
  40. Kazahaya, K.; Yasuhara, M. Symposium “Springs and Groundwater in Yatsugatake Volcano”. A Hydrogen Isotopic Study of Spring Waters in Mt. Yatsugatake, Japan: Application to Groundwater Recharge and Flow Processes. J. Jpn. Assoc. Hydrol. Sci. 1994, 24, 107–119. (In Japanese) [Google Scholar]
  41. Kazahaya, K. Recharge area and flow path of groundwater: Isotope Hydrology Techniques. Chishitsu News 1997, 513, 20–25. (In Japanese) [Google Scholar]
  42. Badon-Ghyben, W. Nota in Verband Met de Voorgenomen Putboring Nabil Amsterdam; K. Instituut van Ingenieurs: Hague, The Netherlands.
  43. Herzberg, A. Die Wasserversorgung einiger Nordseebader. J. Gasbeleucht. Wasserversorg 1901, 44, 815–819. [Google Scholar]
  44. Clark, I.; Fritz, P. Environmental Isotopes in Hydrogeology; CRC Press: New York, NY, USA, 1997; p. 342. [Google Scholar]
  45. Yamada, M.; Hirakawa, T.; Matsuda, R.; Yamaguchi, K.; Kitaoka, K.; Kusakabe, M. The origin of thermal water from deep zones in granite rocks inferred from stable isotopic ratios of hydrogen and oxygen. J. Jpn. Assoc. Hydrol. Sci. 2006, 36, 205–218, (In Japanese with English abstract). [Google Scholar] [CrossRef]
  46. Shintani, T.; Masuda, H.; Nemoto, T.; Ikawa, R.; Marui, A.; Tanimizu, M.; Ishikawa, T. Three-dimensional structure and sources of groundwater masses beneath the Osaka Plain, Southwest Japan. J. Hydrol. Reg. Stud. 2022, 43, 101193. [Google Scholar] [CrossRef]
  47. Ju, Y.; Massoudieh, A.; Green, C.T.; Lee, K.K.; Kaown, D. Complexity of groundwater age mixing near a seawater intrusion zone based on multiple tracers and Bayesian inference. Sci. Total Environ. 2021, 753, 141994. [Google Scholar] [CrossRef]
Figure 1. Observation site. (a) Map of Japan. (b) Map of Ikuchijima Island and its surrounding areas. (c) Contour map of the watershed area with the locations of G3 and G8 across A-A’. (d) Cross-section of A-A’.
Water 15 01416 g001
Figure 2. Hydraulic head variation at different depths: (a) G8 and (b) G3.
Water 15 01416 g002
Figure 3. δ18O variations in groundwater at different depths: (a) G8 and (b) G3.
Water 15 01416 g003
Figure 4. Estimation of the groundwater recharge altitude based on δ18O. (Tomozawa at al., 2023 [39]).
Water 15 01416 g004
Figure 5. (a) Relationship between the Cl concentration and δ18O at G3-30. (b) Relationship between the original Cl concentration and δ18O of the estimated freshwater components.
Water 15 01416 g005
Table 1. Average apparent age of groundwater with different depths by SF6.
Point NameAnalytical ResultEquivalent Atmospheric
Concentration
Apparent Age
SF6 (f mol/kg)SF6 (pptv)SF6 (Year)
G8-153.067.2712
G8-303.648.658
G3-152.265.3919
G3-302.245.3419
G3-401.844.4223
Table 2. Fresh groundwater mixing rate estimated from δ18O.
When Cl Concentration Is MaximumWhen Cl Concentration Is MinimumWhen SF6 Is Measured
Mixing rate of G3-30 *172%100%99%
Mixing rate of Stagnant groudwater *2*328%0%1%
*1: The δ18O of G3-30 should be the average value (−8.7‰). *2: Deep groudwater which was recharged in the last glacia (Assumed 20,000 years ago). *3: The δ18O value (−10.8‰) suggested in Yamada et al., 2006 [45].
Table 3. Fresh groundwater mixing rates estimated from age tracers.
Estimated from SF6Estimated from 14C *1
Mixing rate of G3-3082%76% *2
Mixing rate of Stagnant groudwater18%24% *3
*1: Analytical value of G3-40 is pMc 77.6%. *2: The analytical value of G3-30 is pMc 132.8%, but was calculated assuming. pMc 100%, which is the theoretical value for water after 1950. *3: Assuming 20,000 years ago, we read from the graph and assumed pMc 5% (Clark and Fritz, 1997) [44].
Disclaimer/Publisher’s Note: The statements, opinions and data contained in all publications are solely those of the individual author(s) and contributor(s) and not of MDPI and/or the editor(s). MDPI and/or the editor(s) disclaim responsibility for any injury to people or property resulting from any ideas, methods, instructions or products referred to in the content.

