

A Route Search System to Avoid the Danger to Life in Dynamic Inundation

Abstract
:1. Introduction
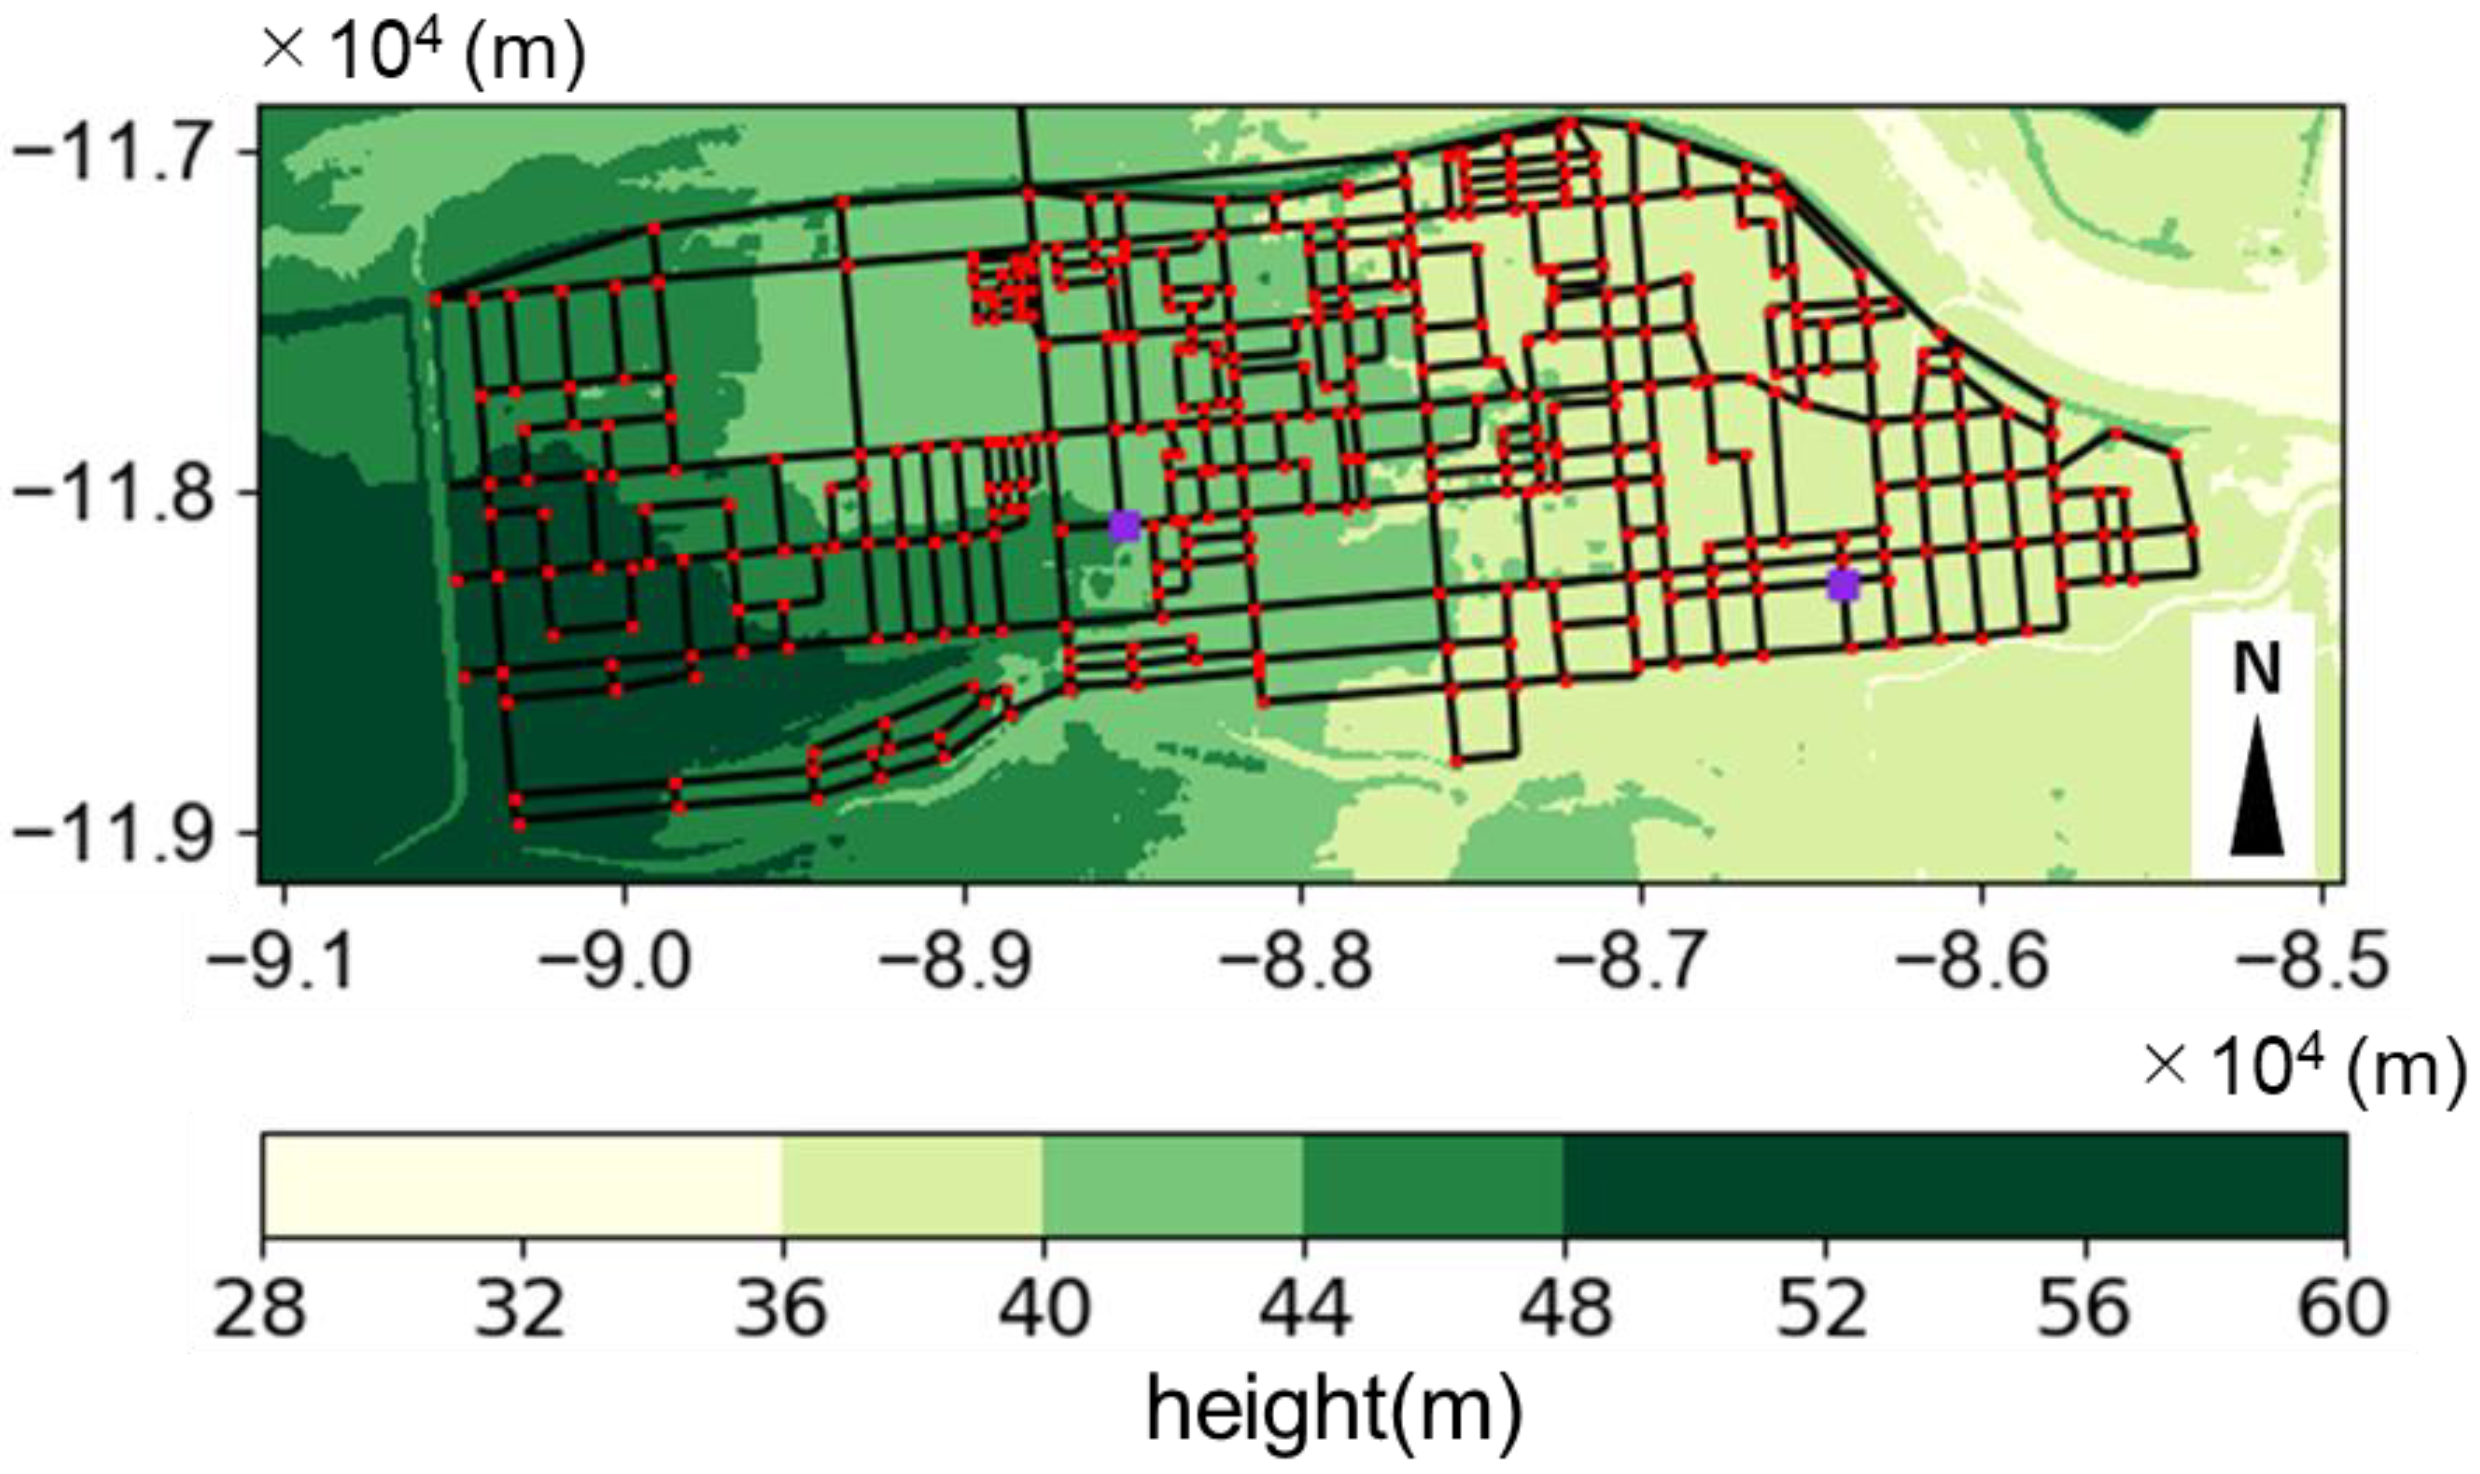
2. Methods
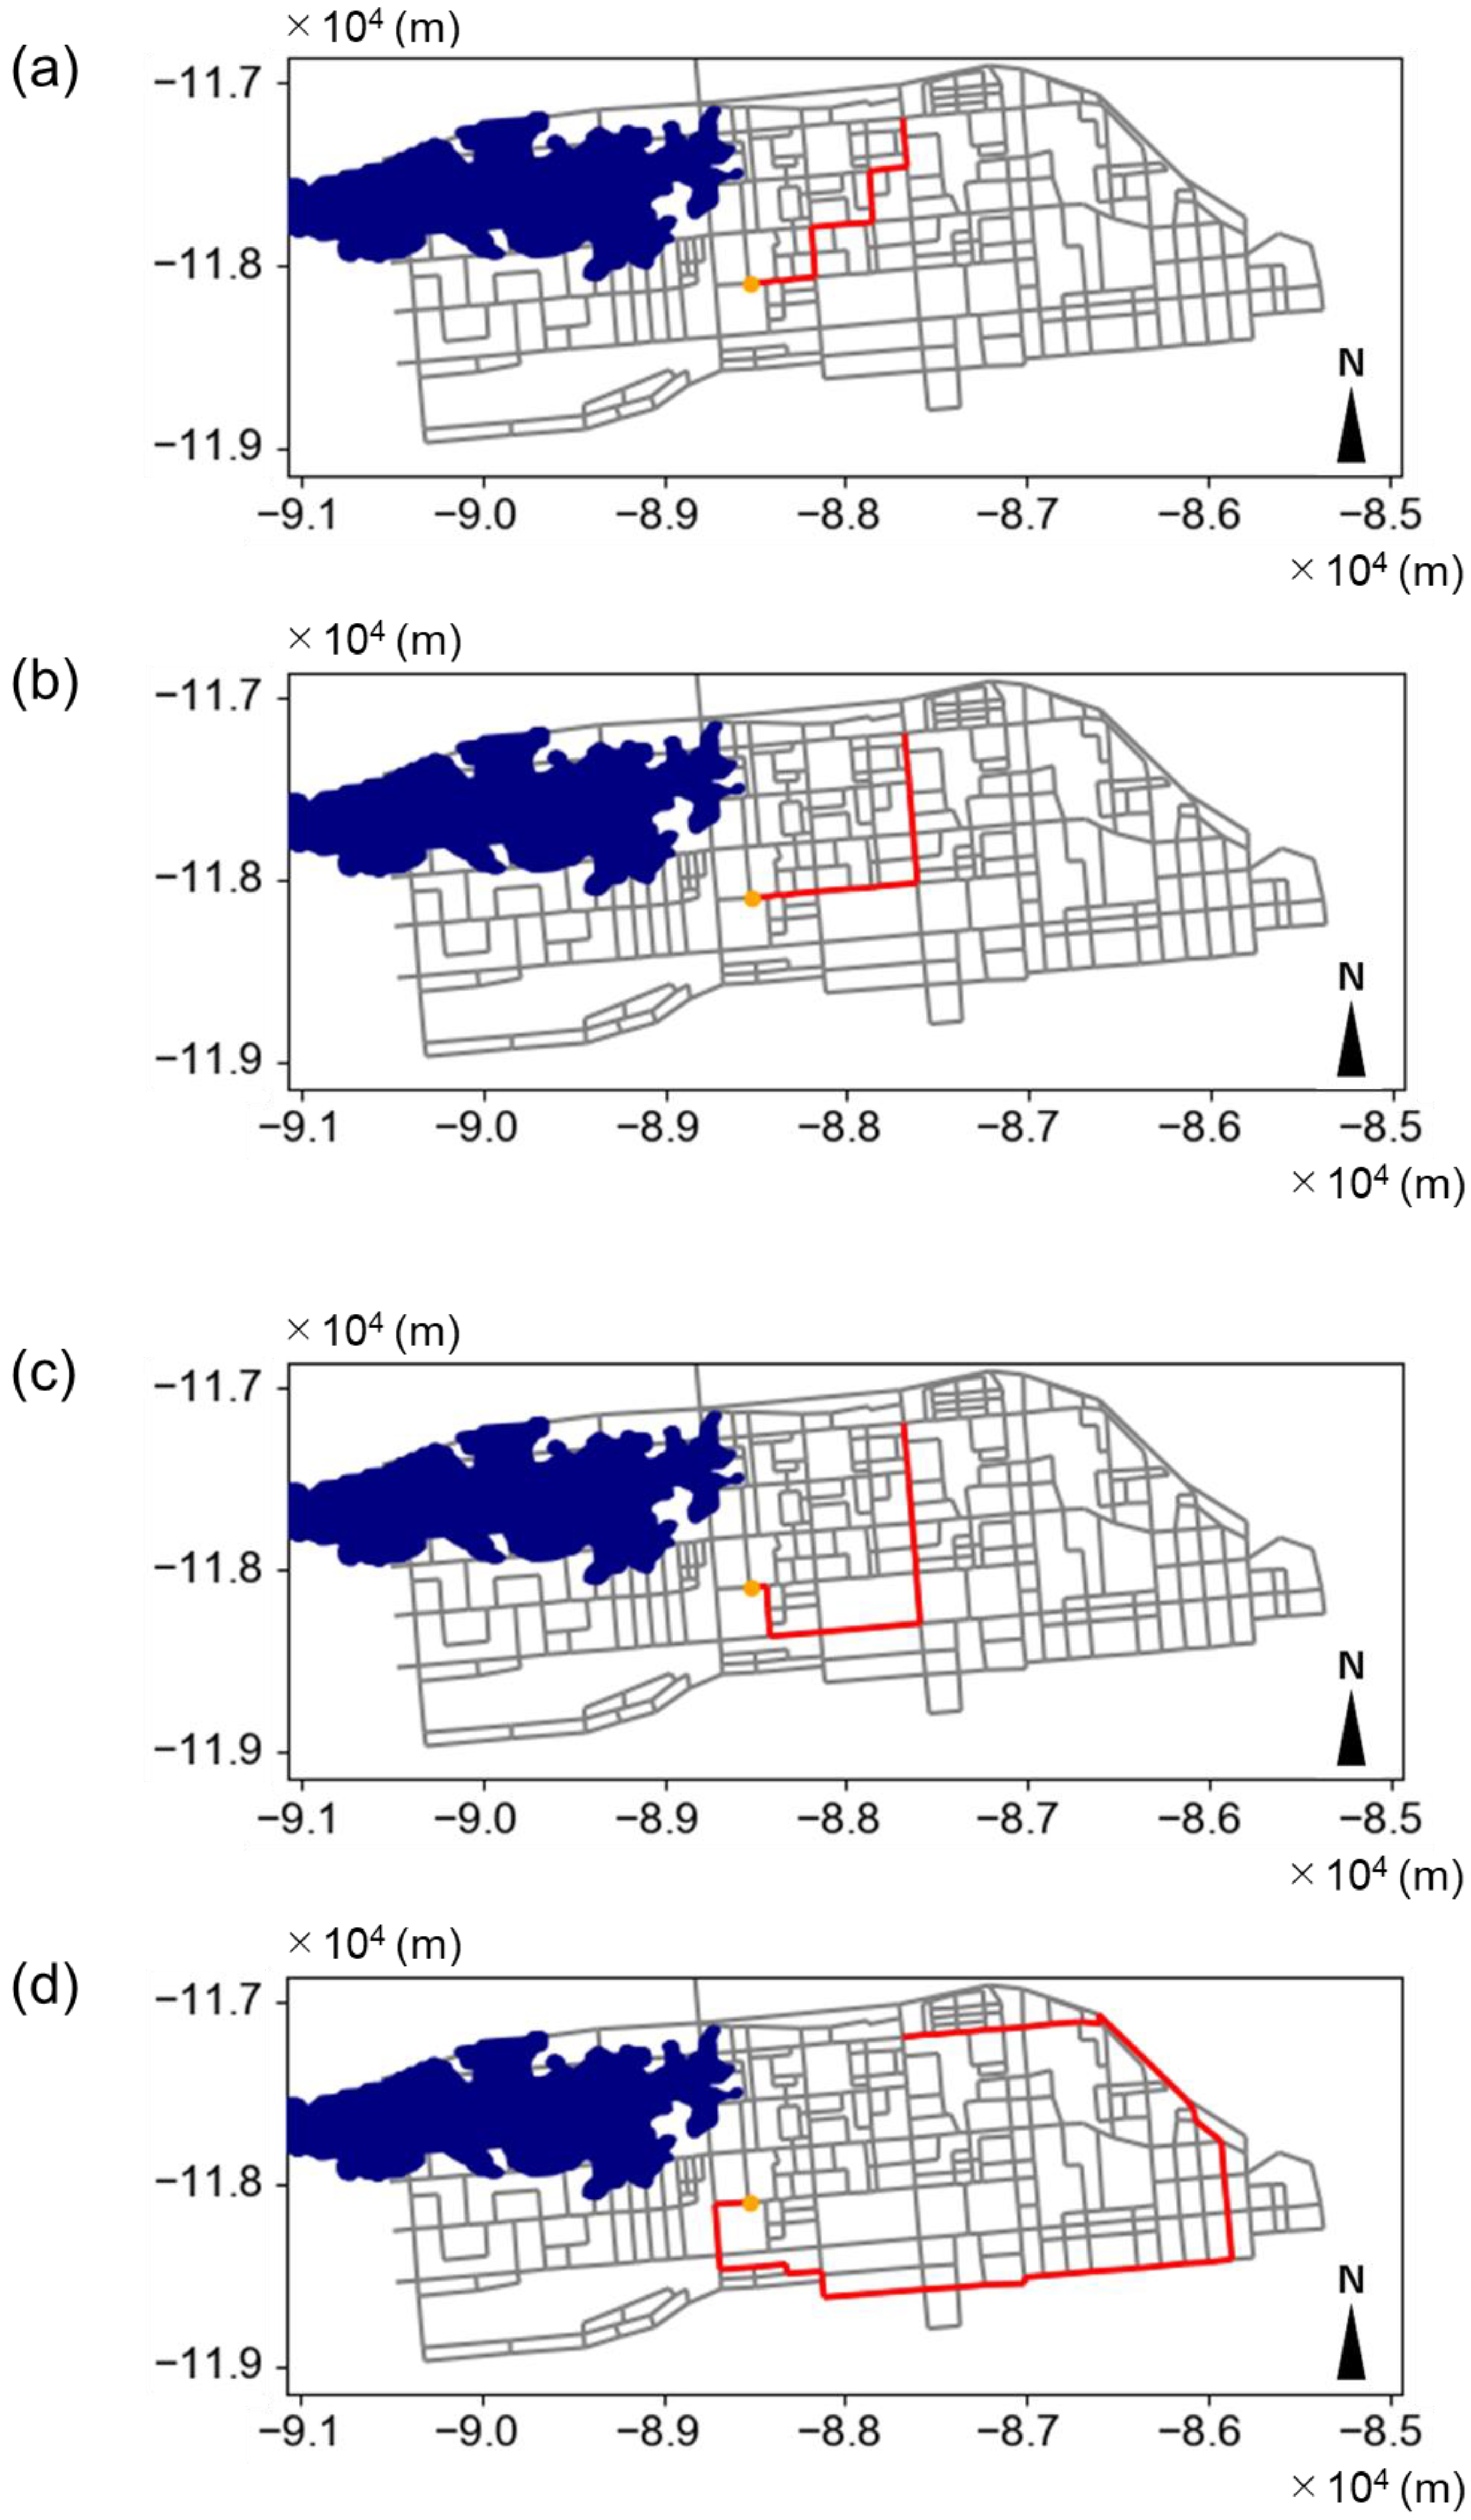
2.1. Evacuation Route Search System
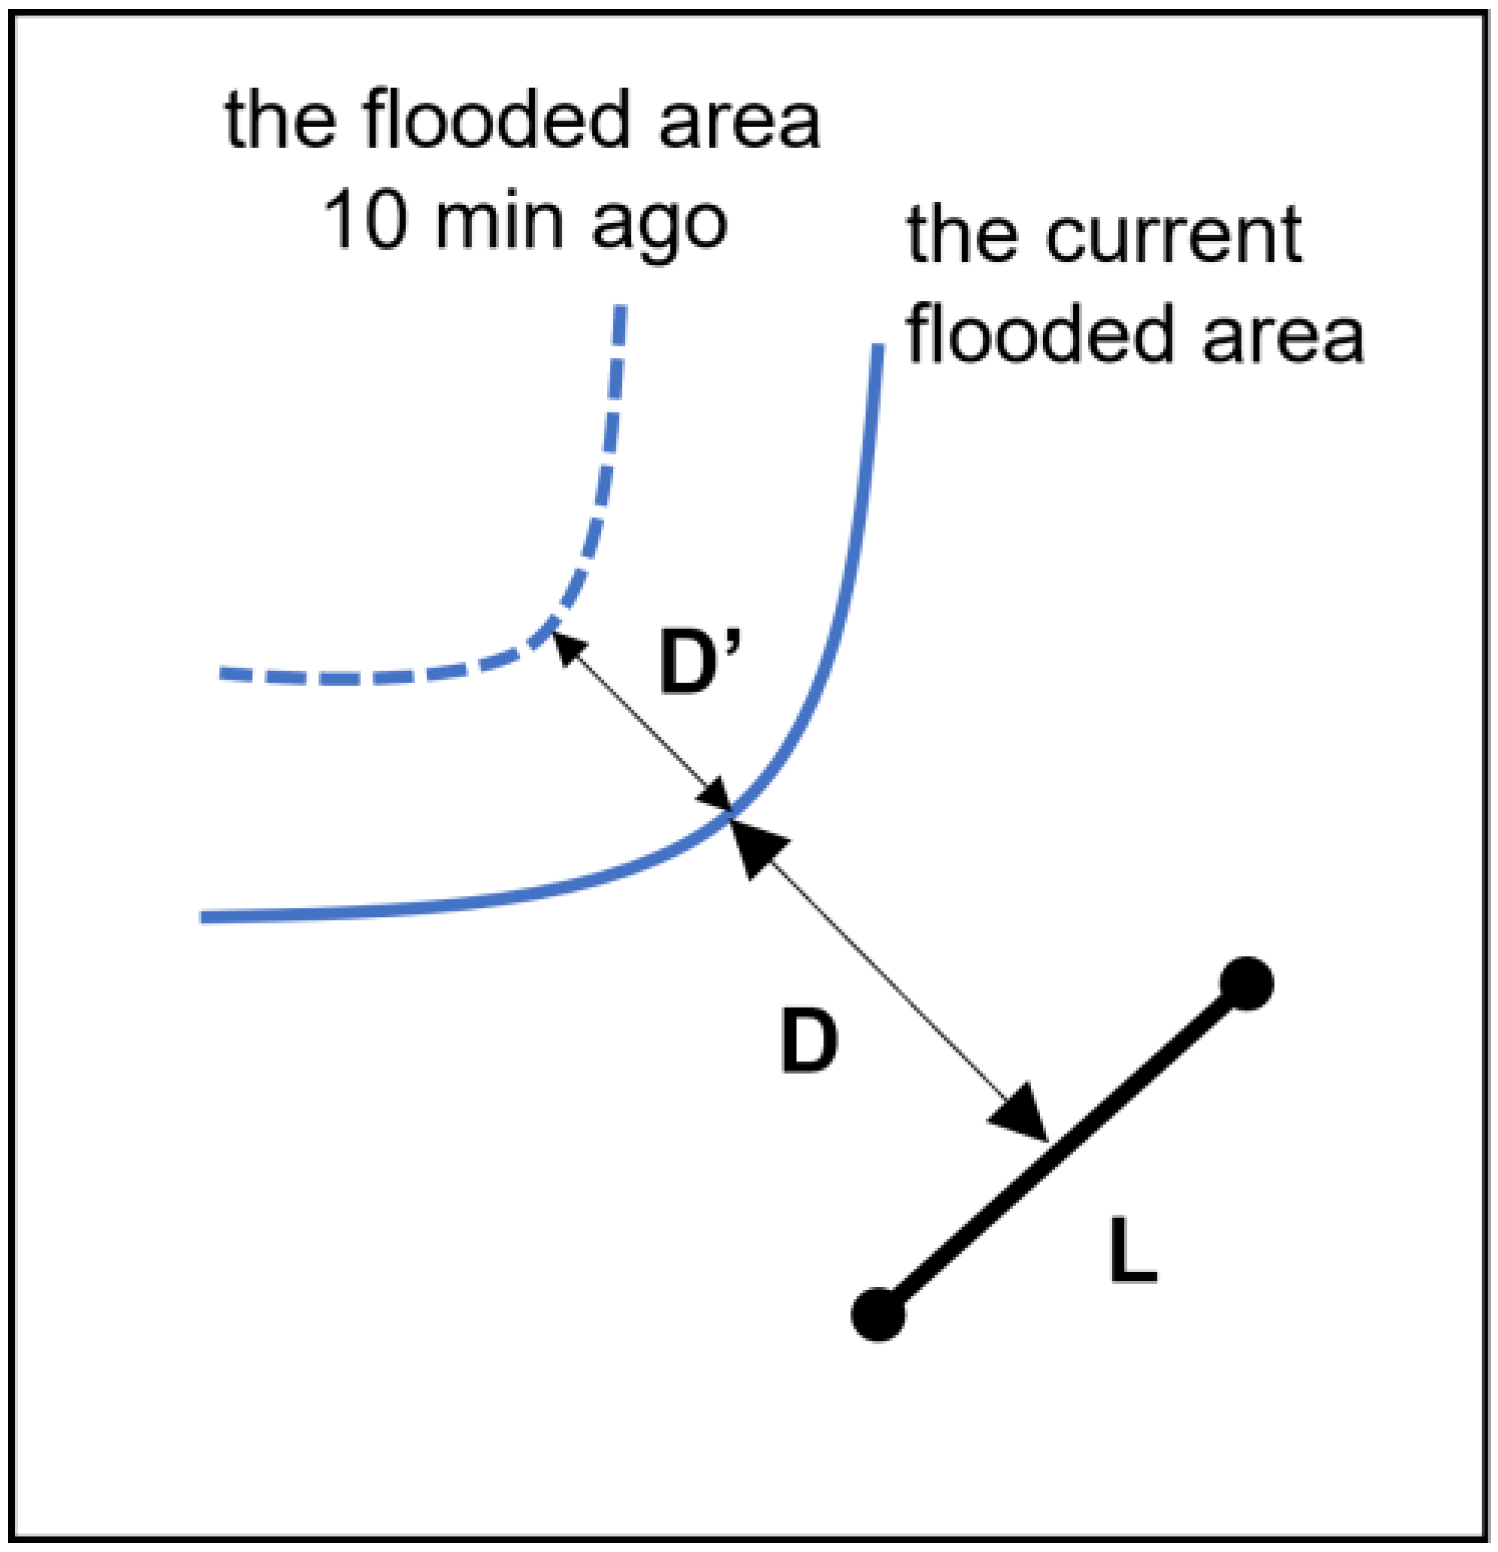
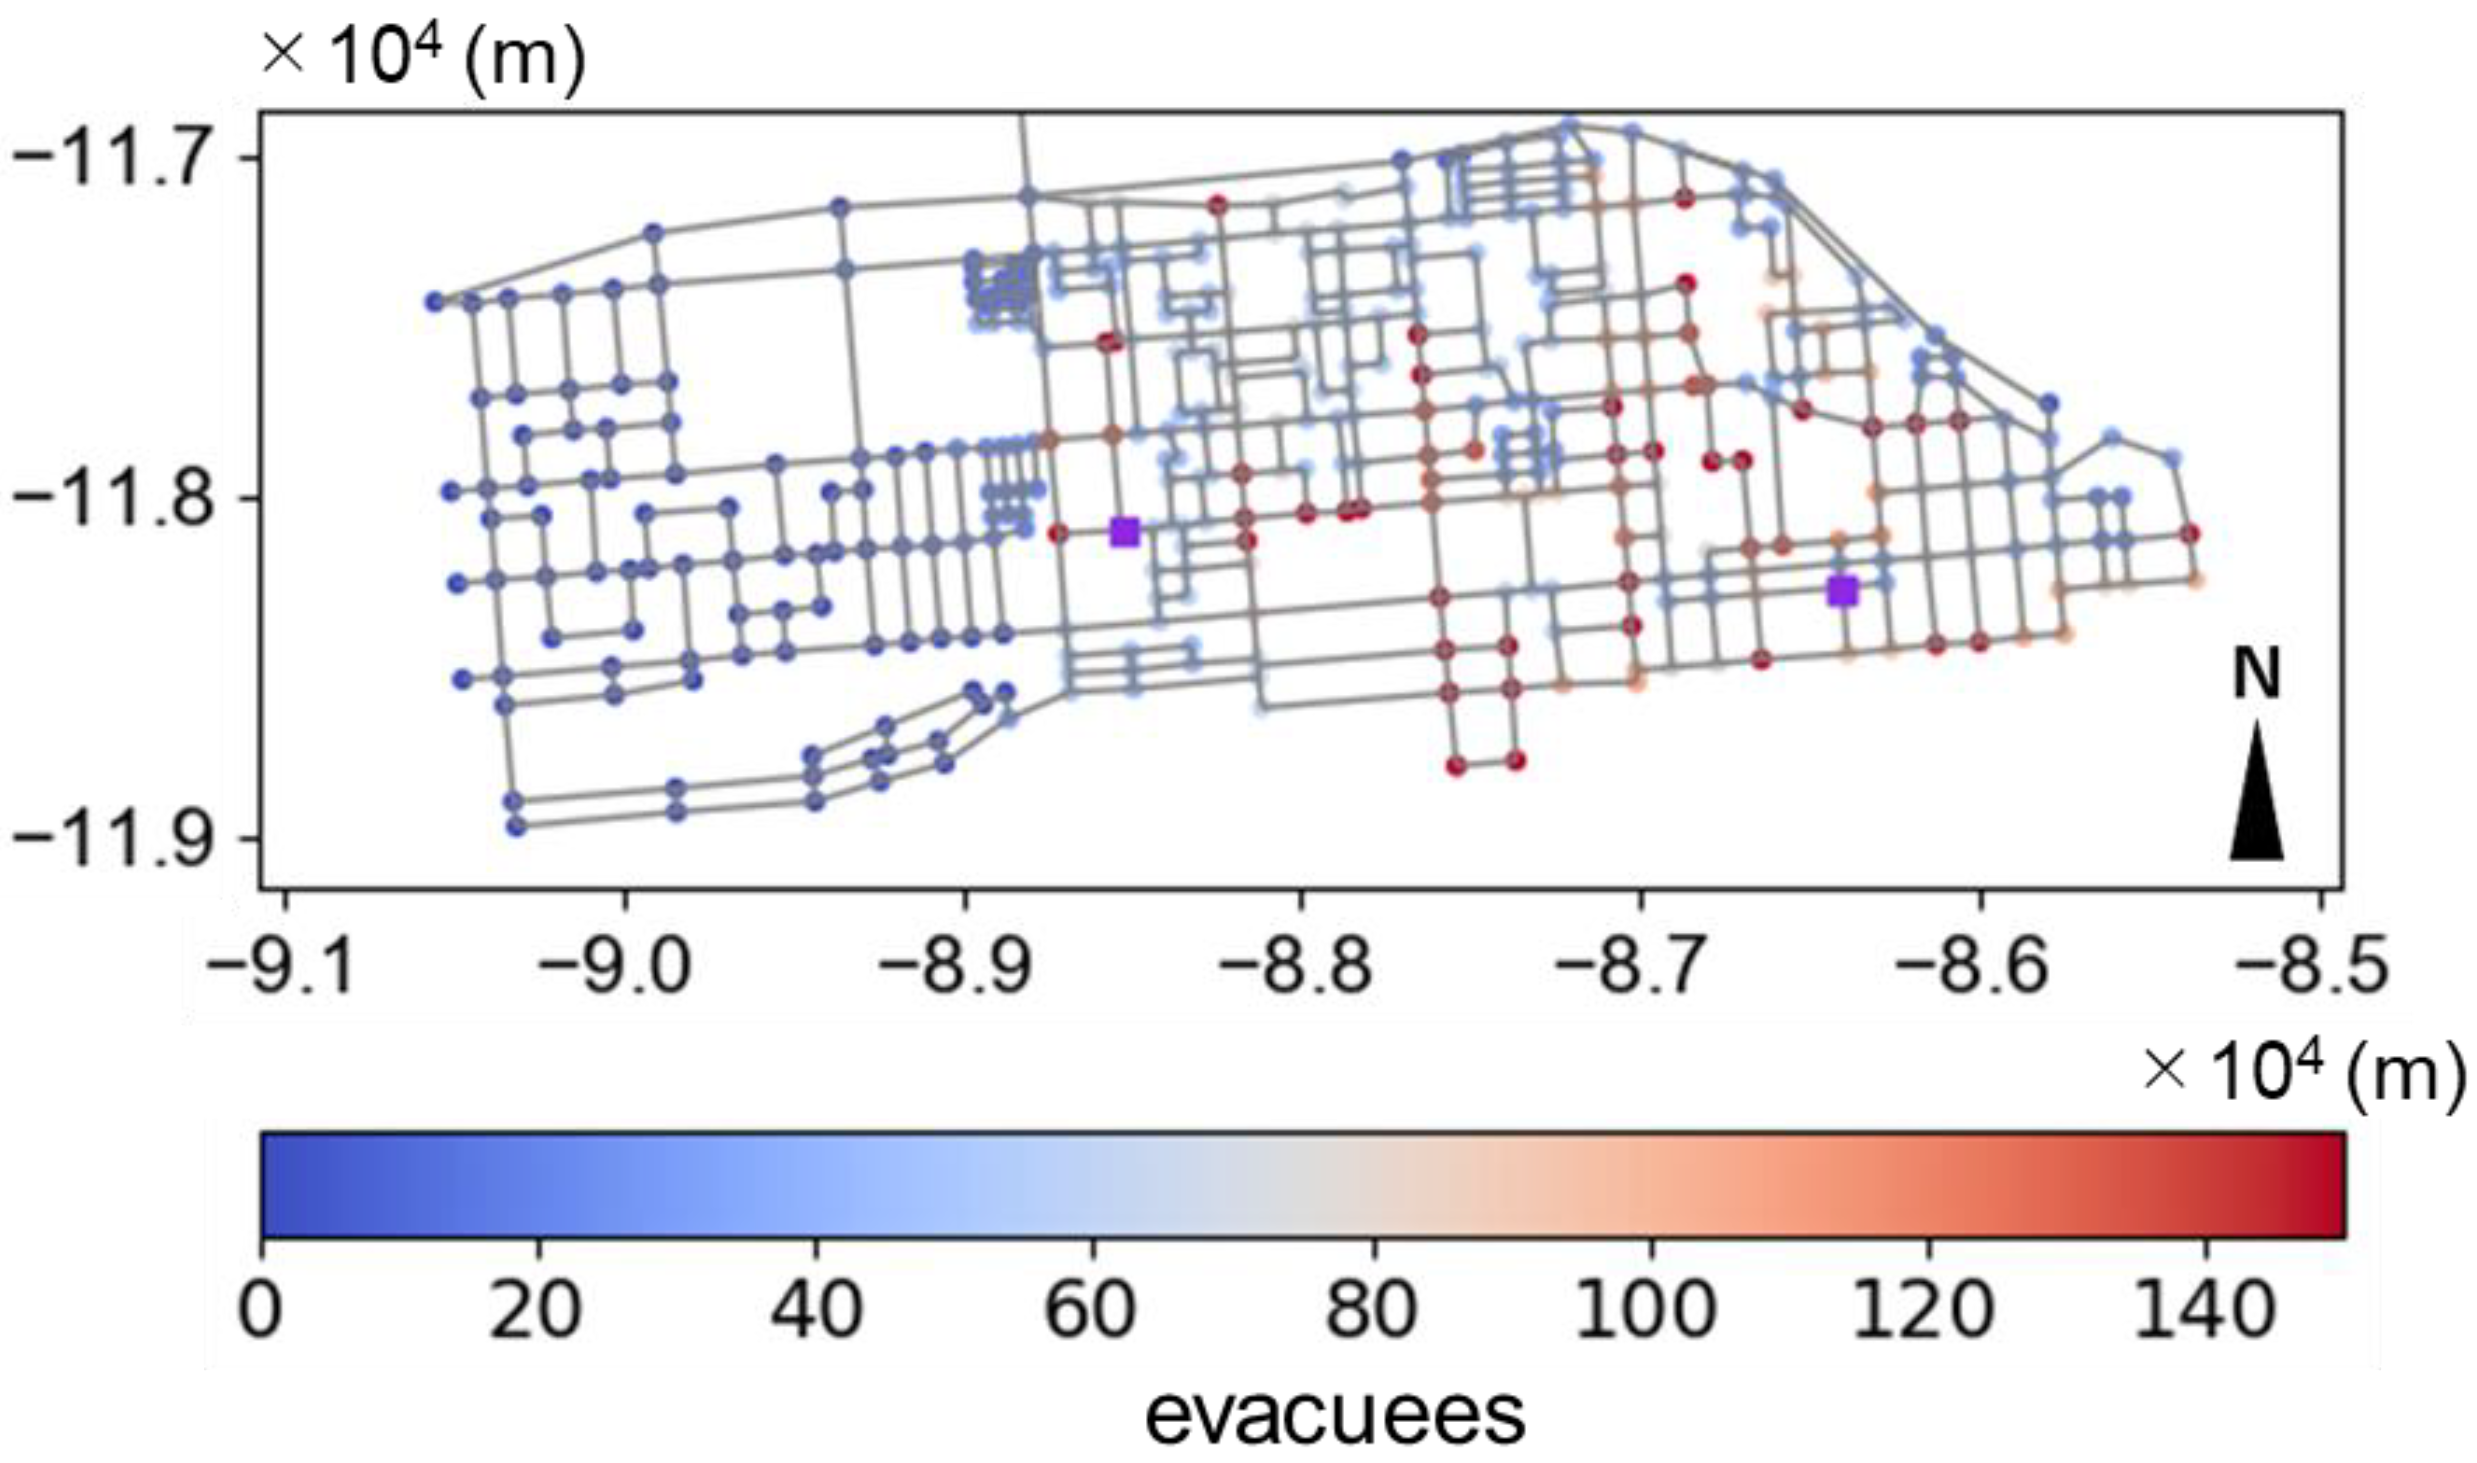
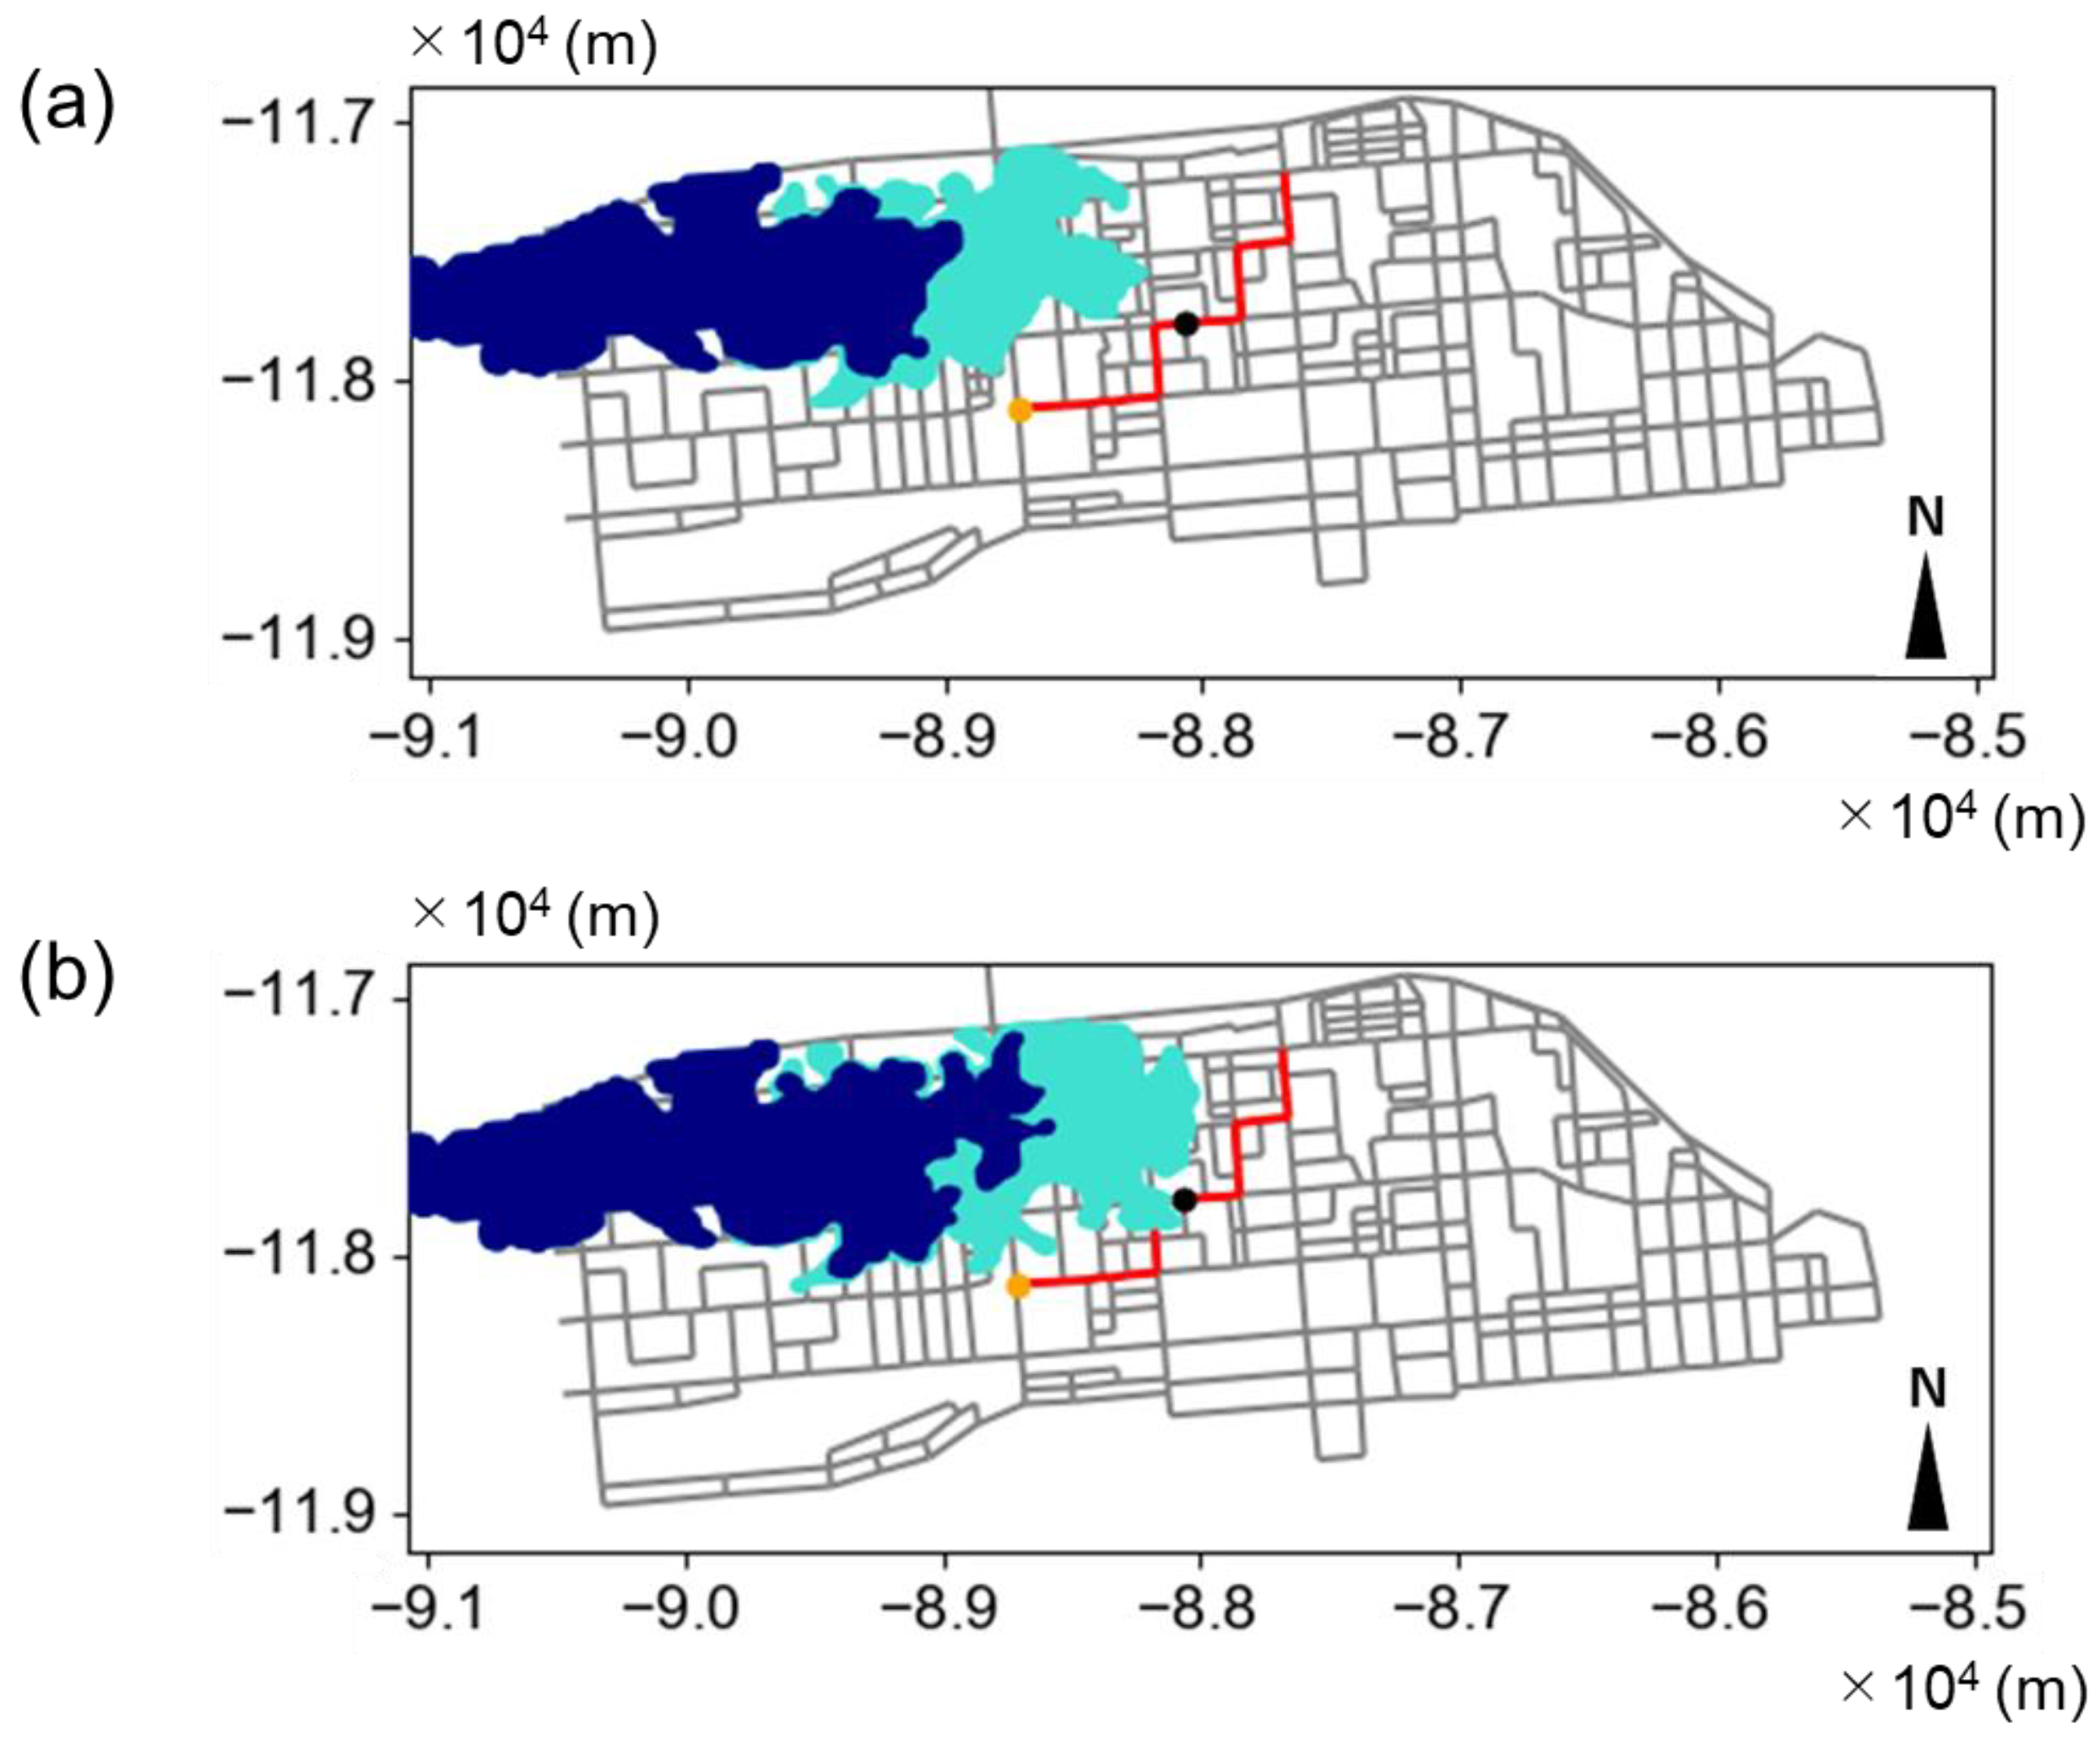
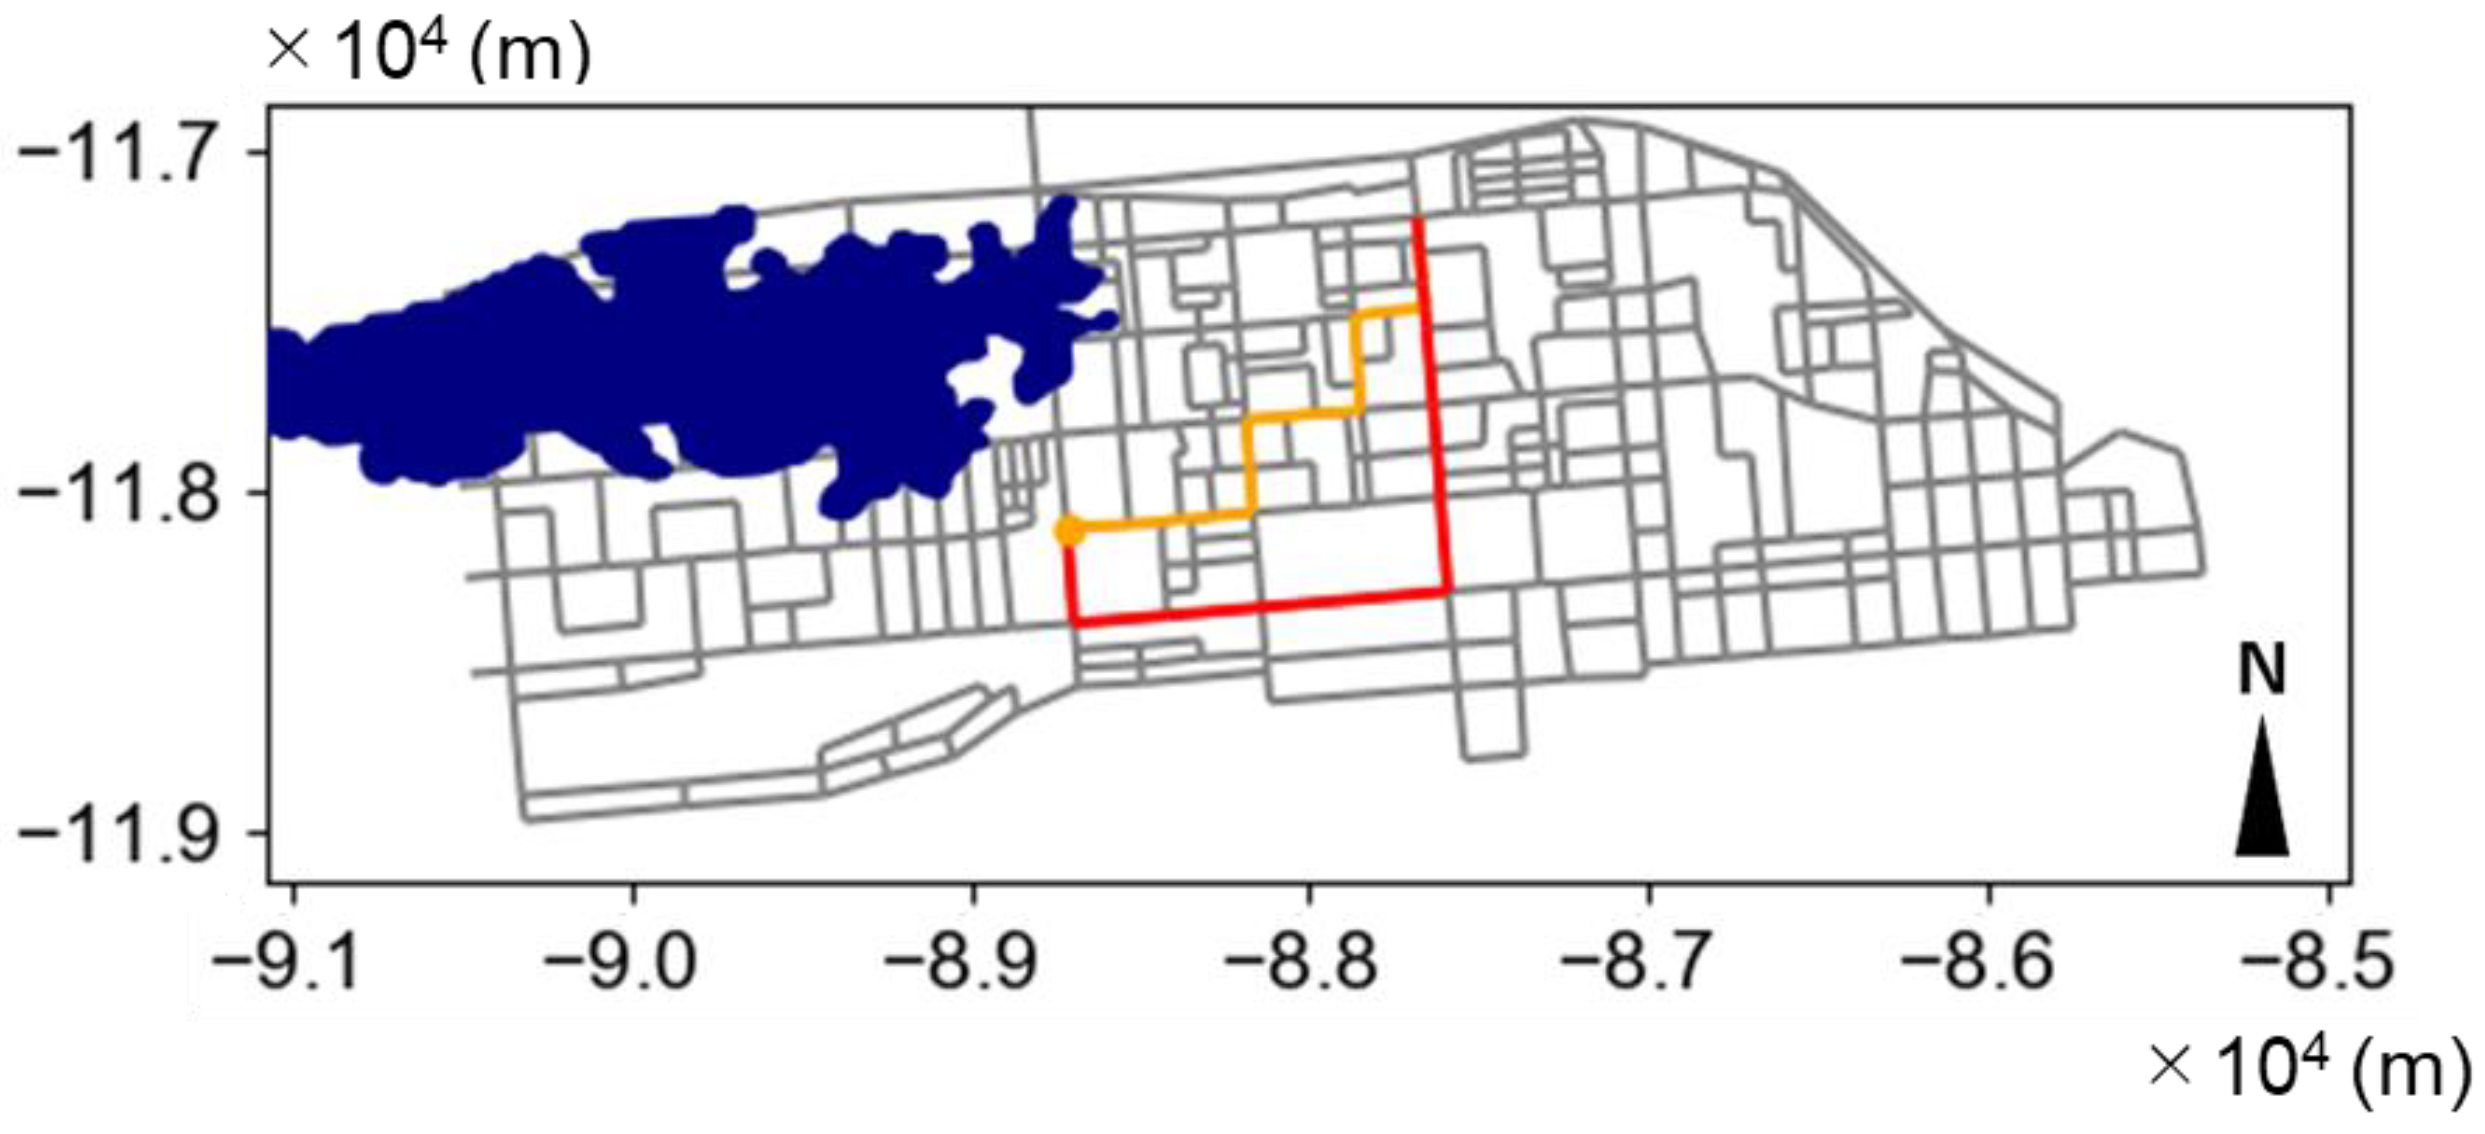
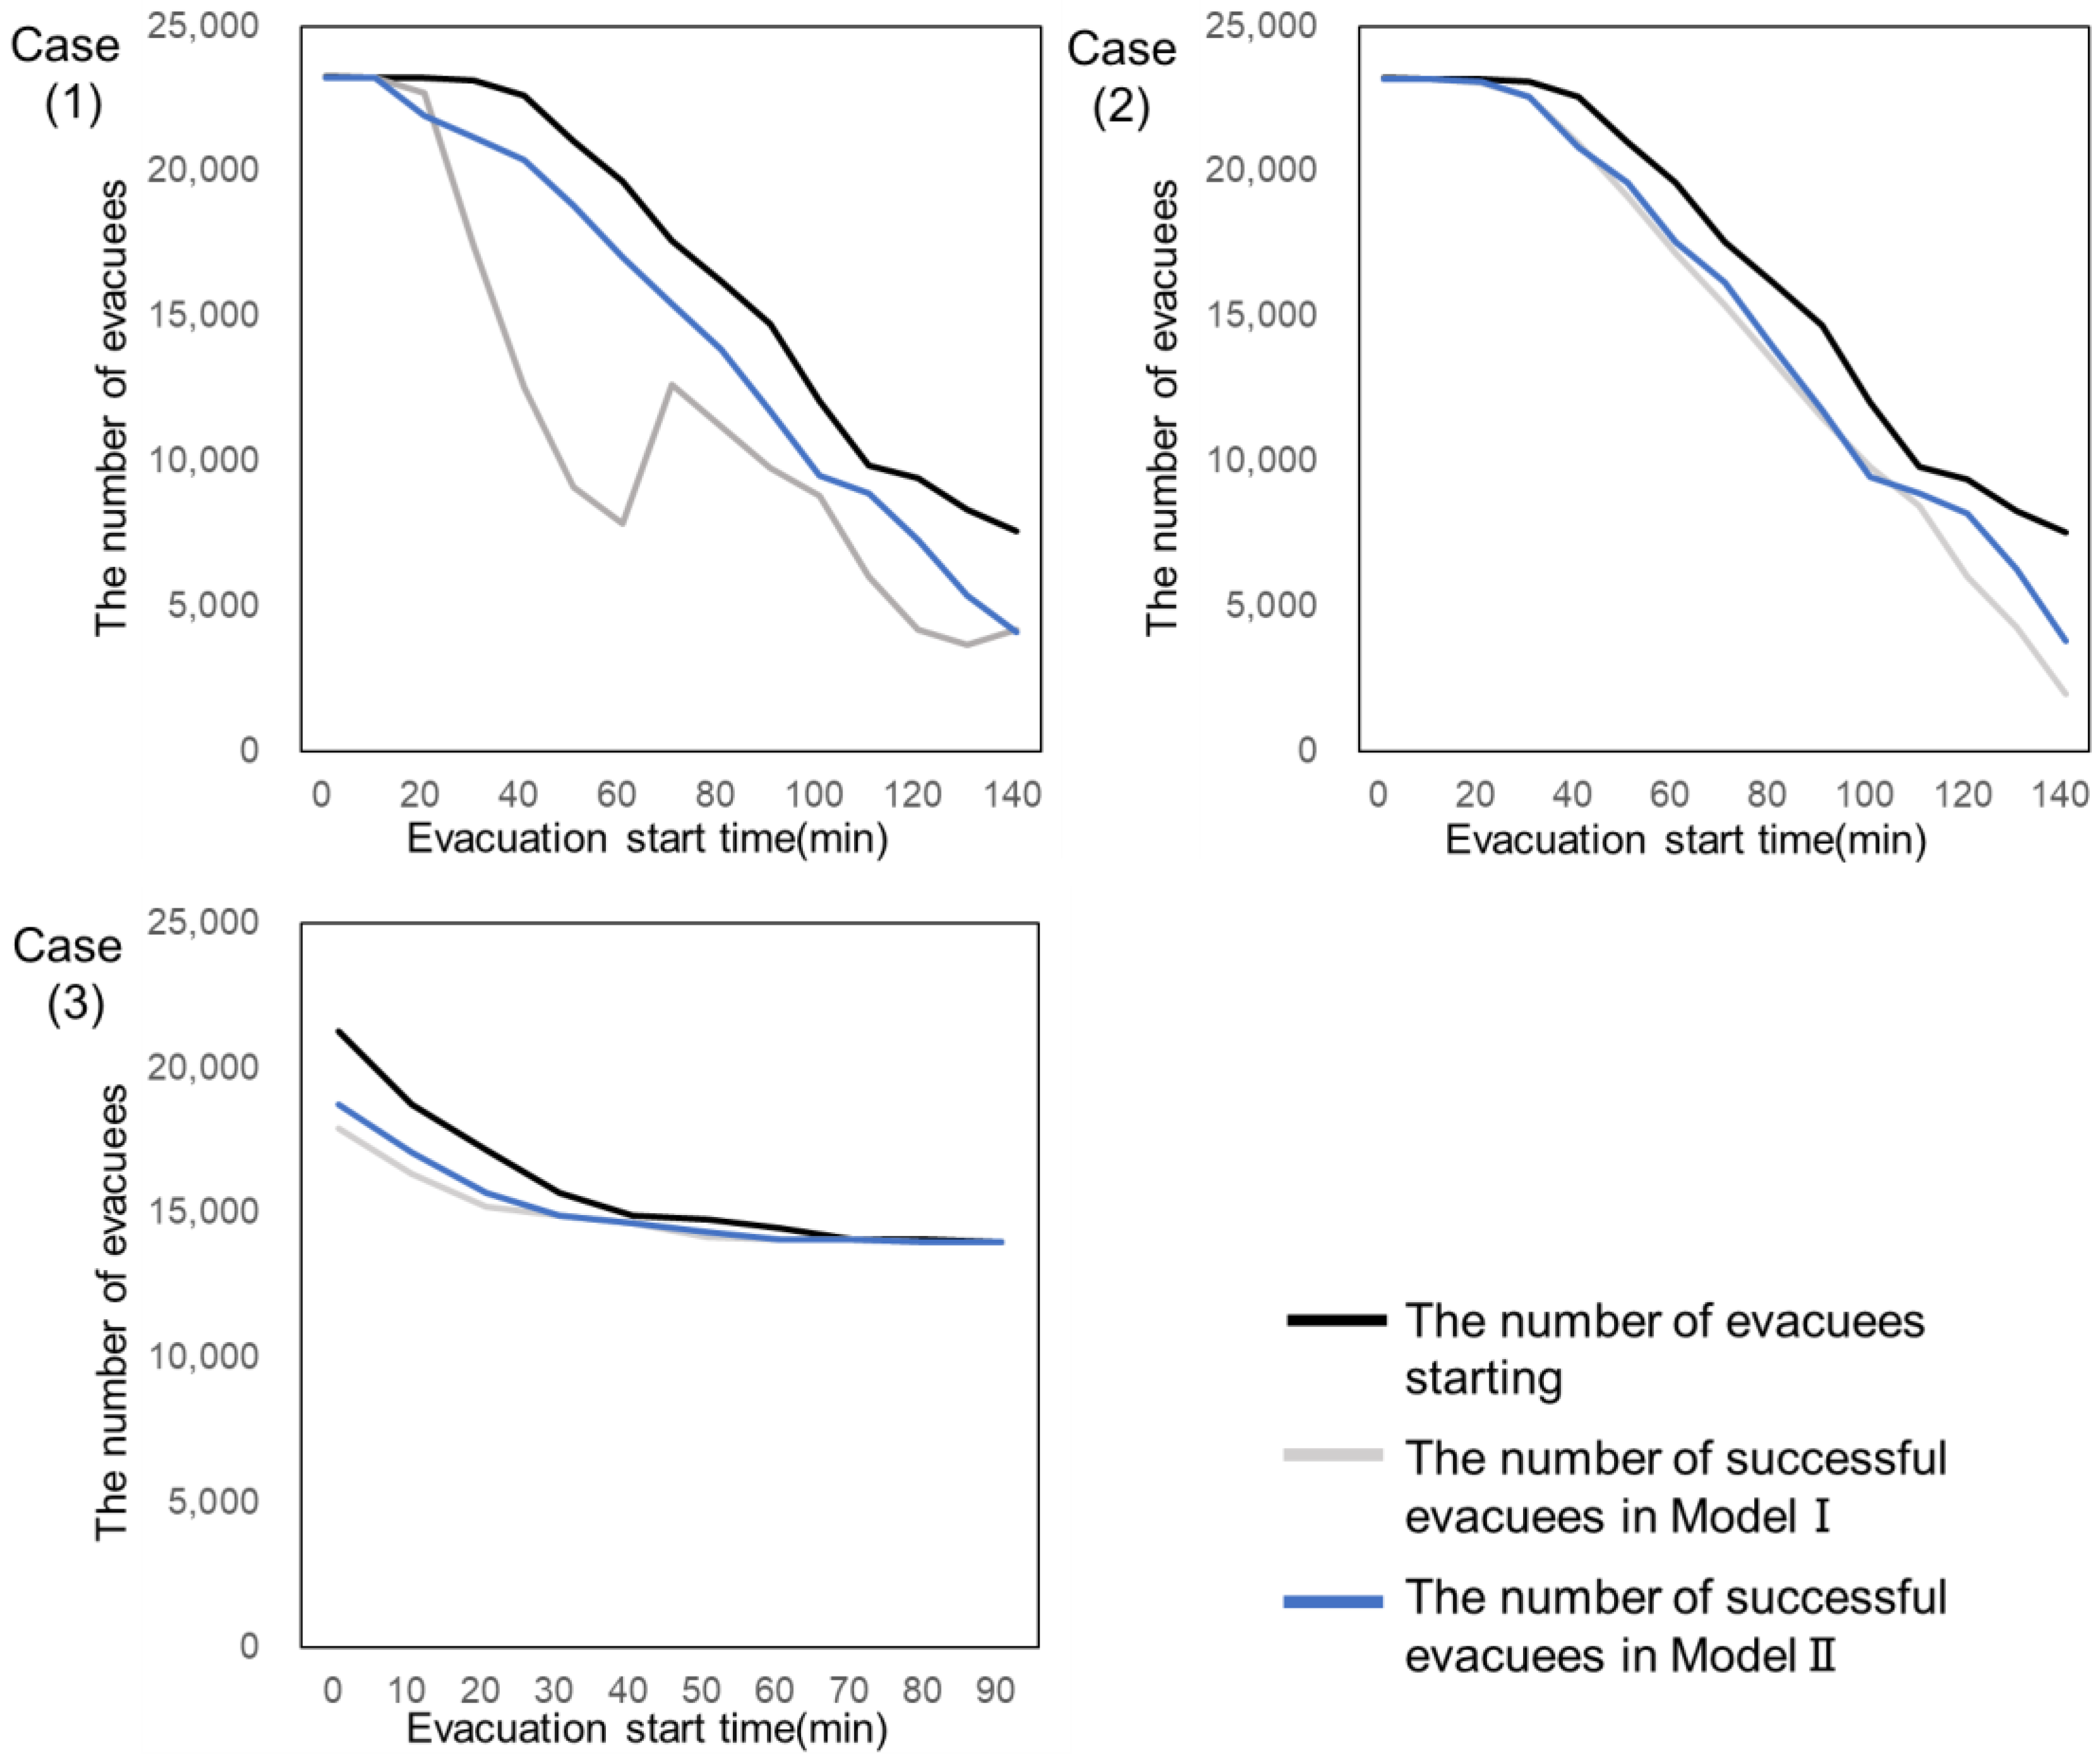
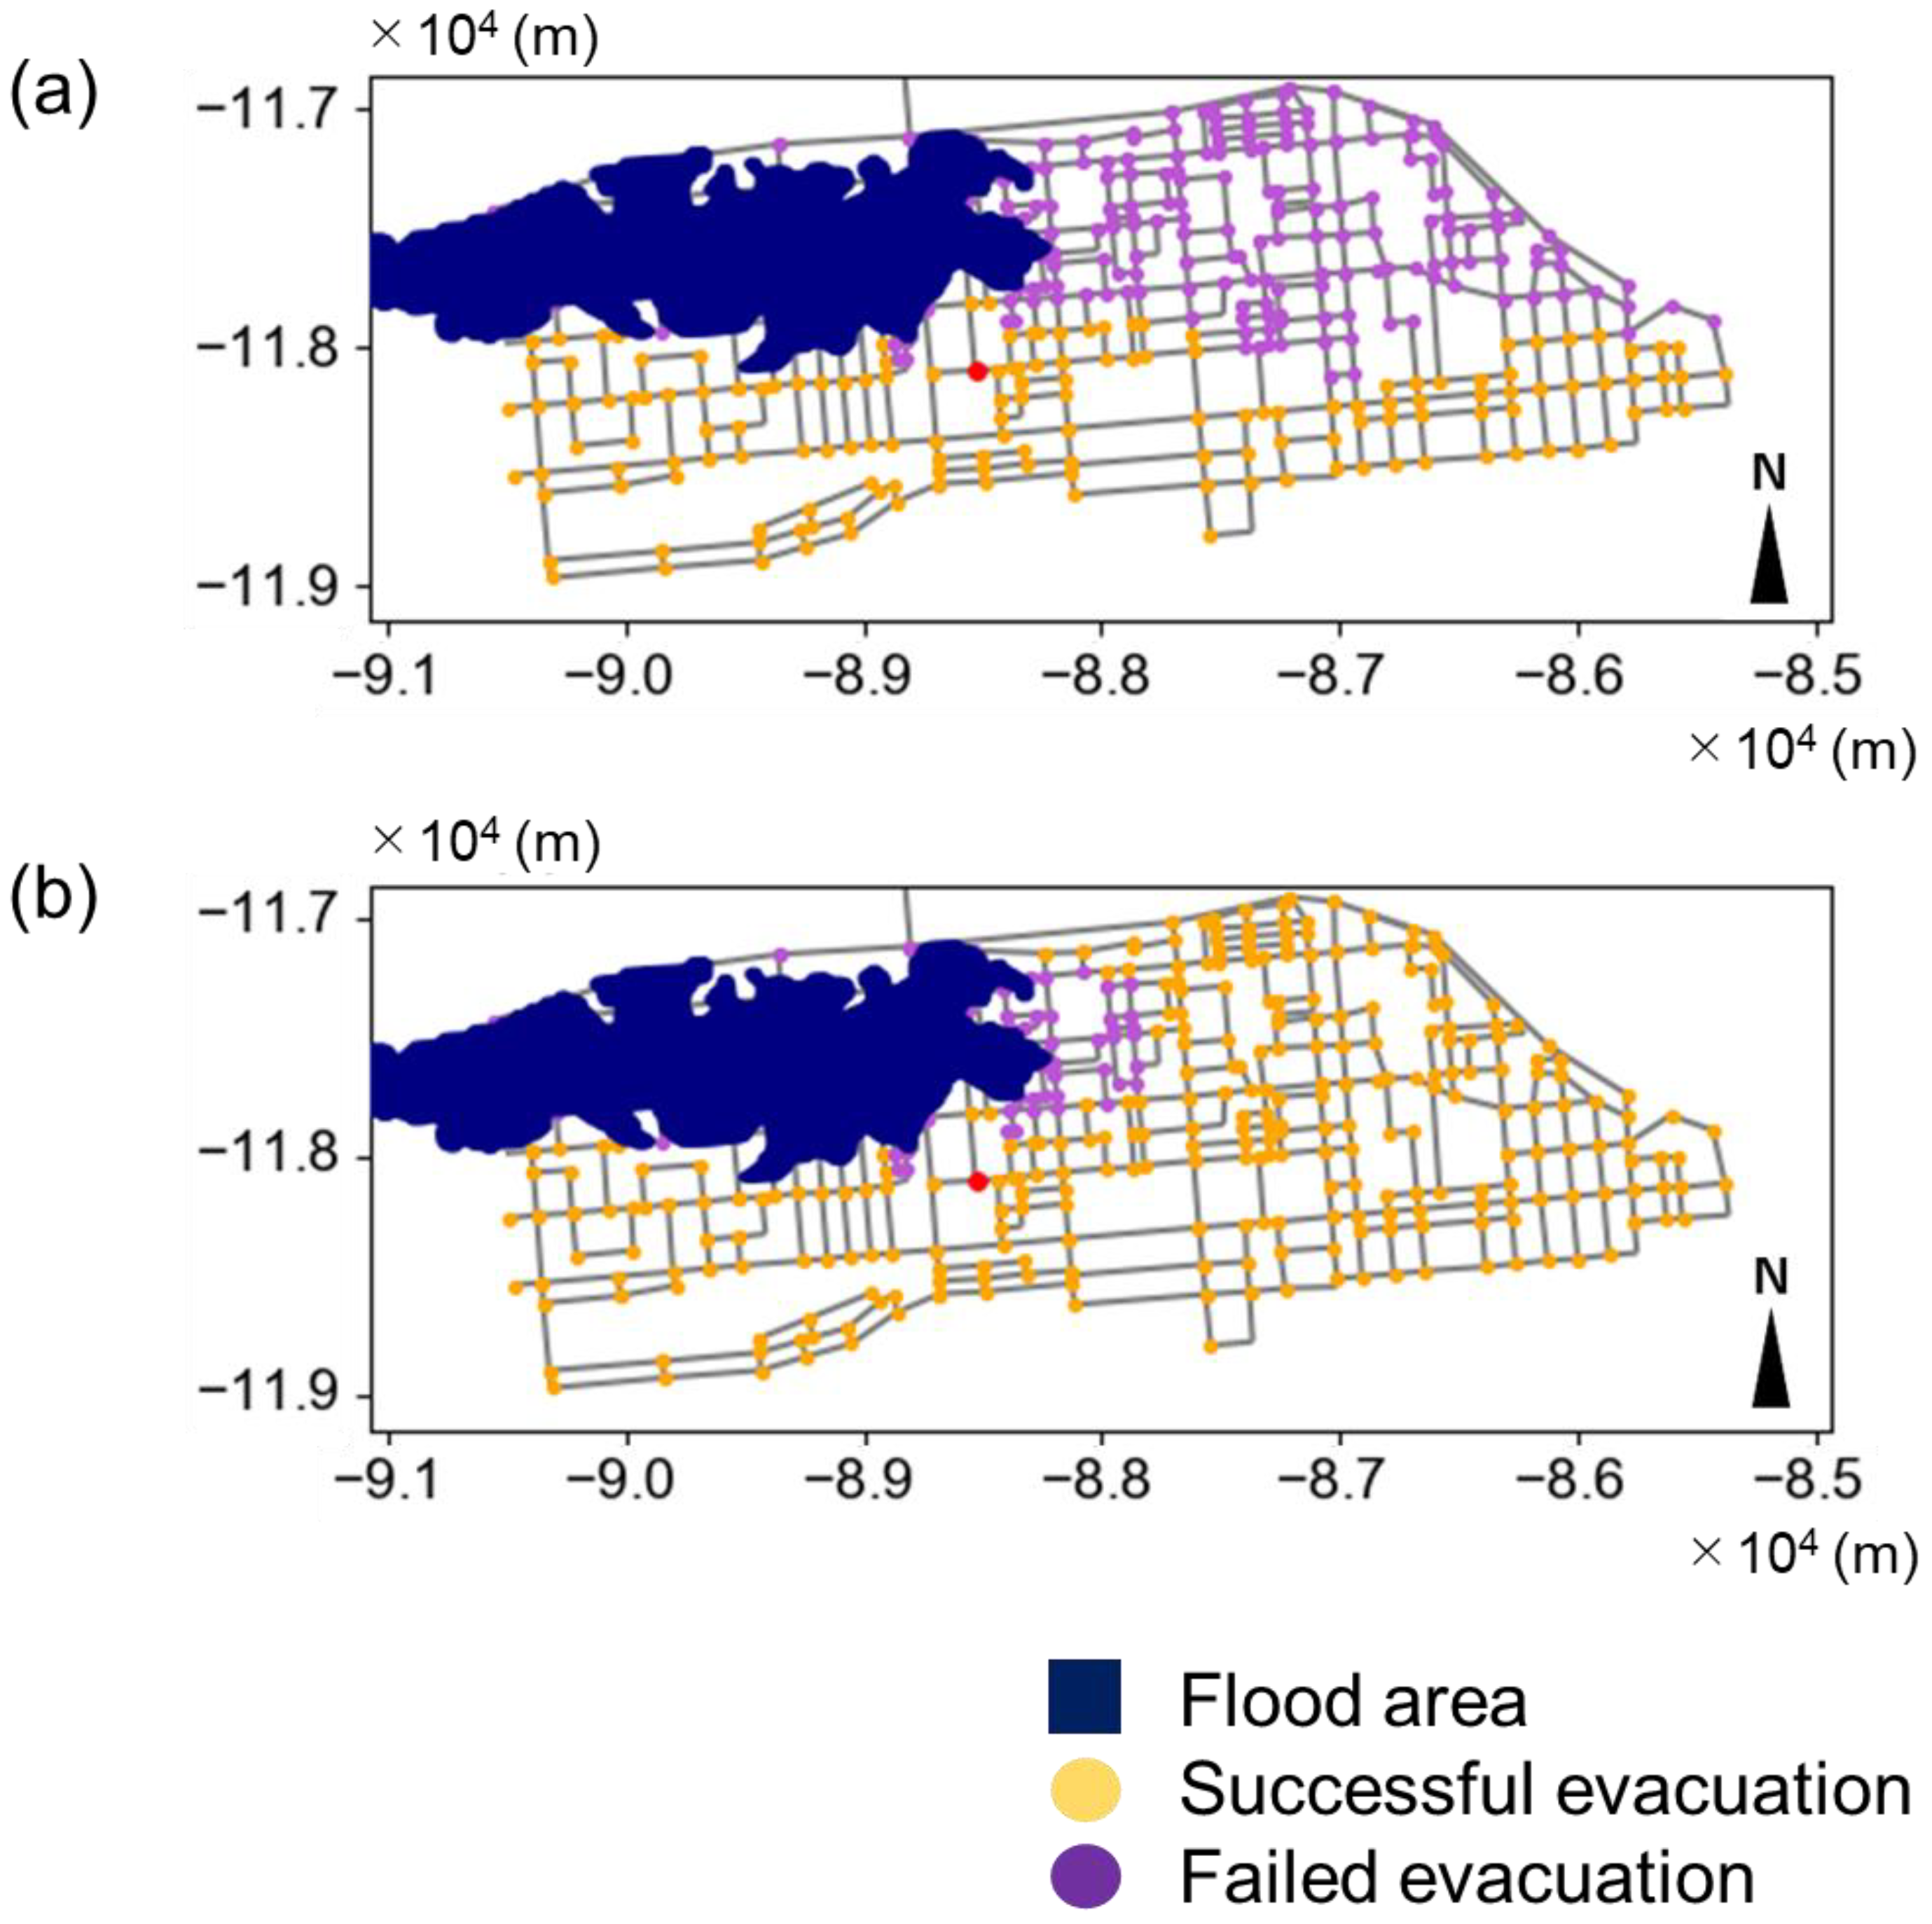
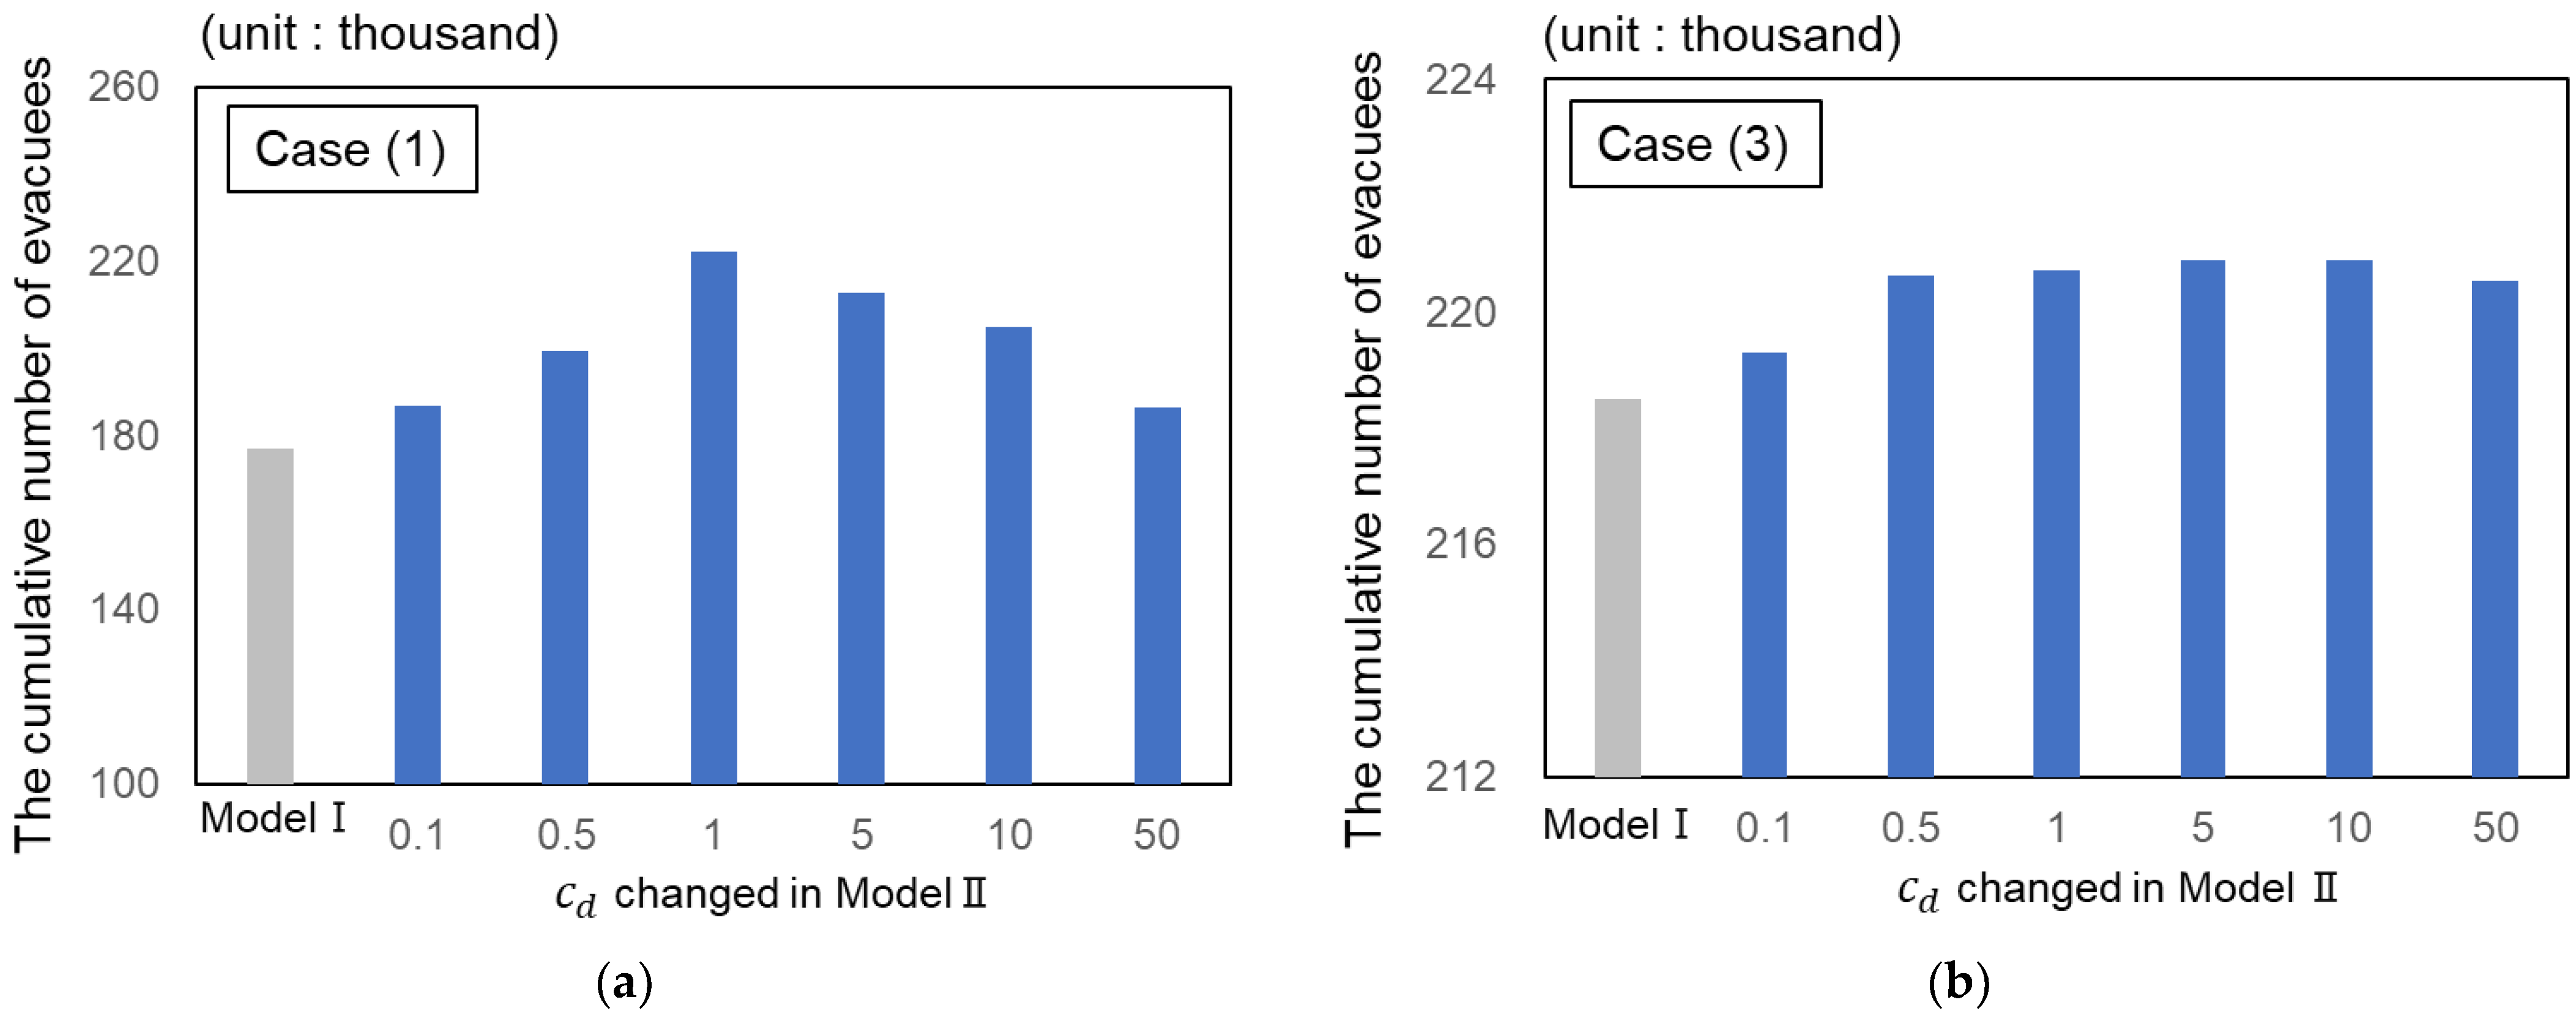
2.2. Evaluation Method of the System
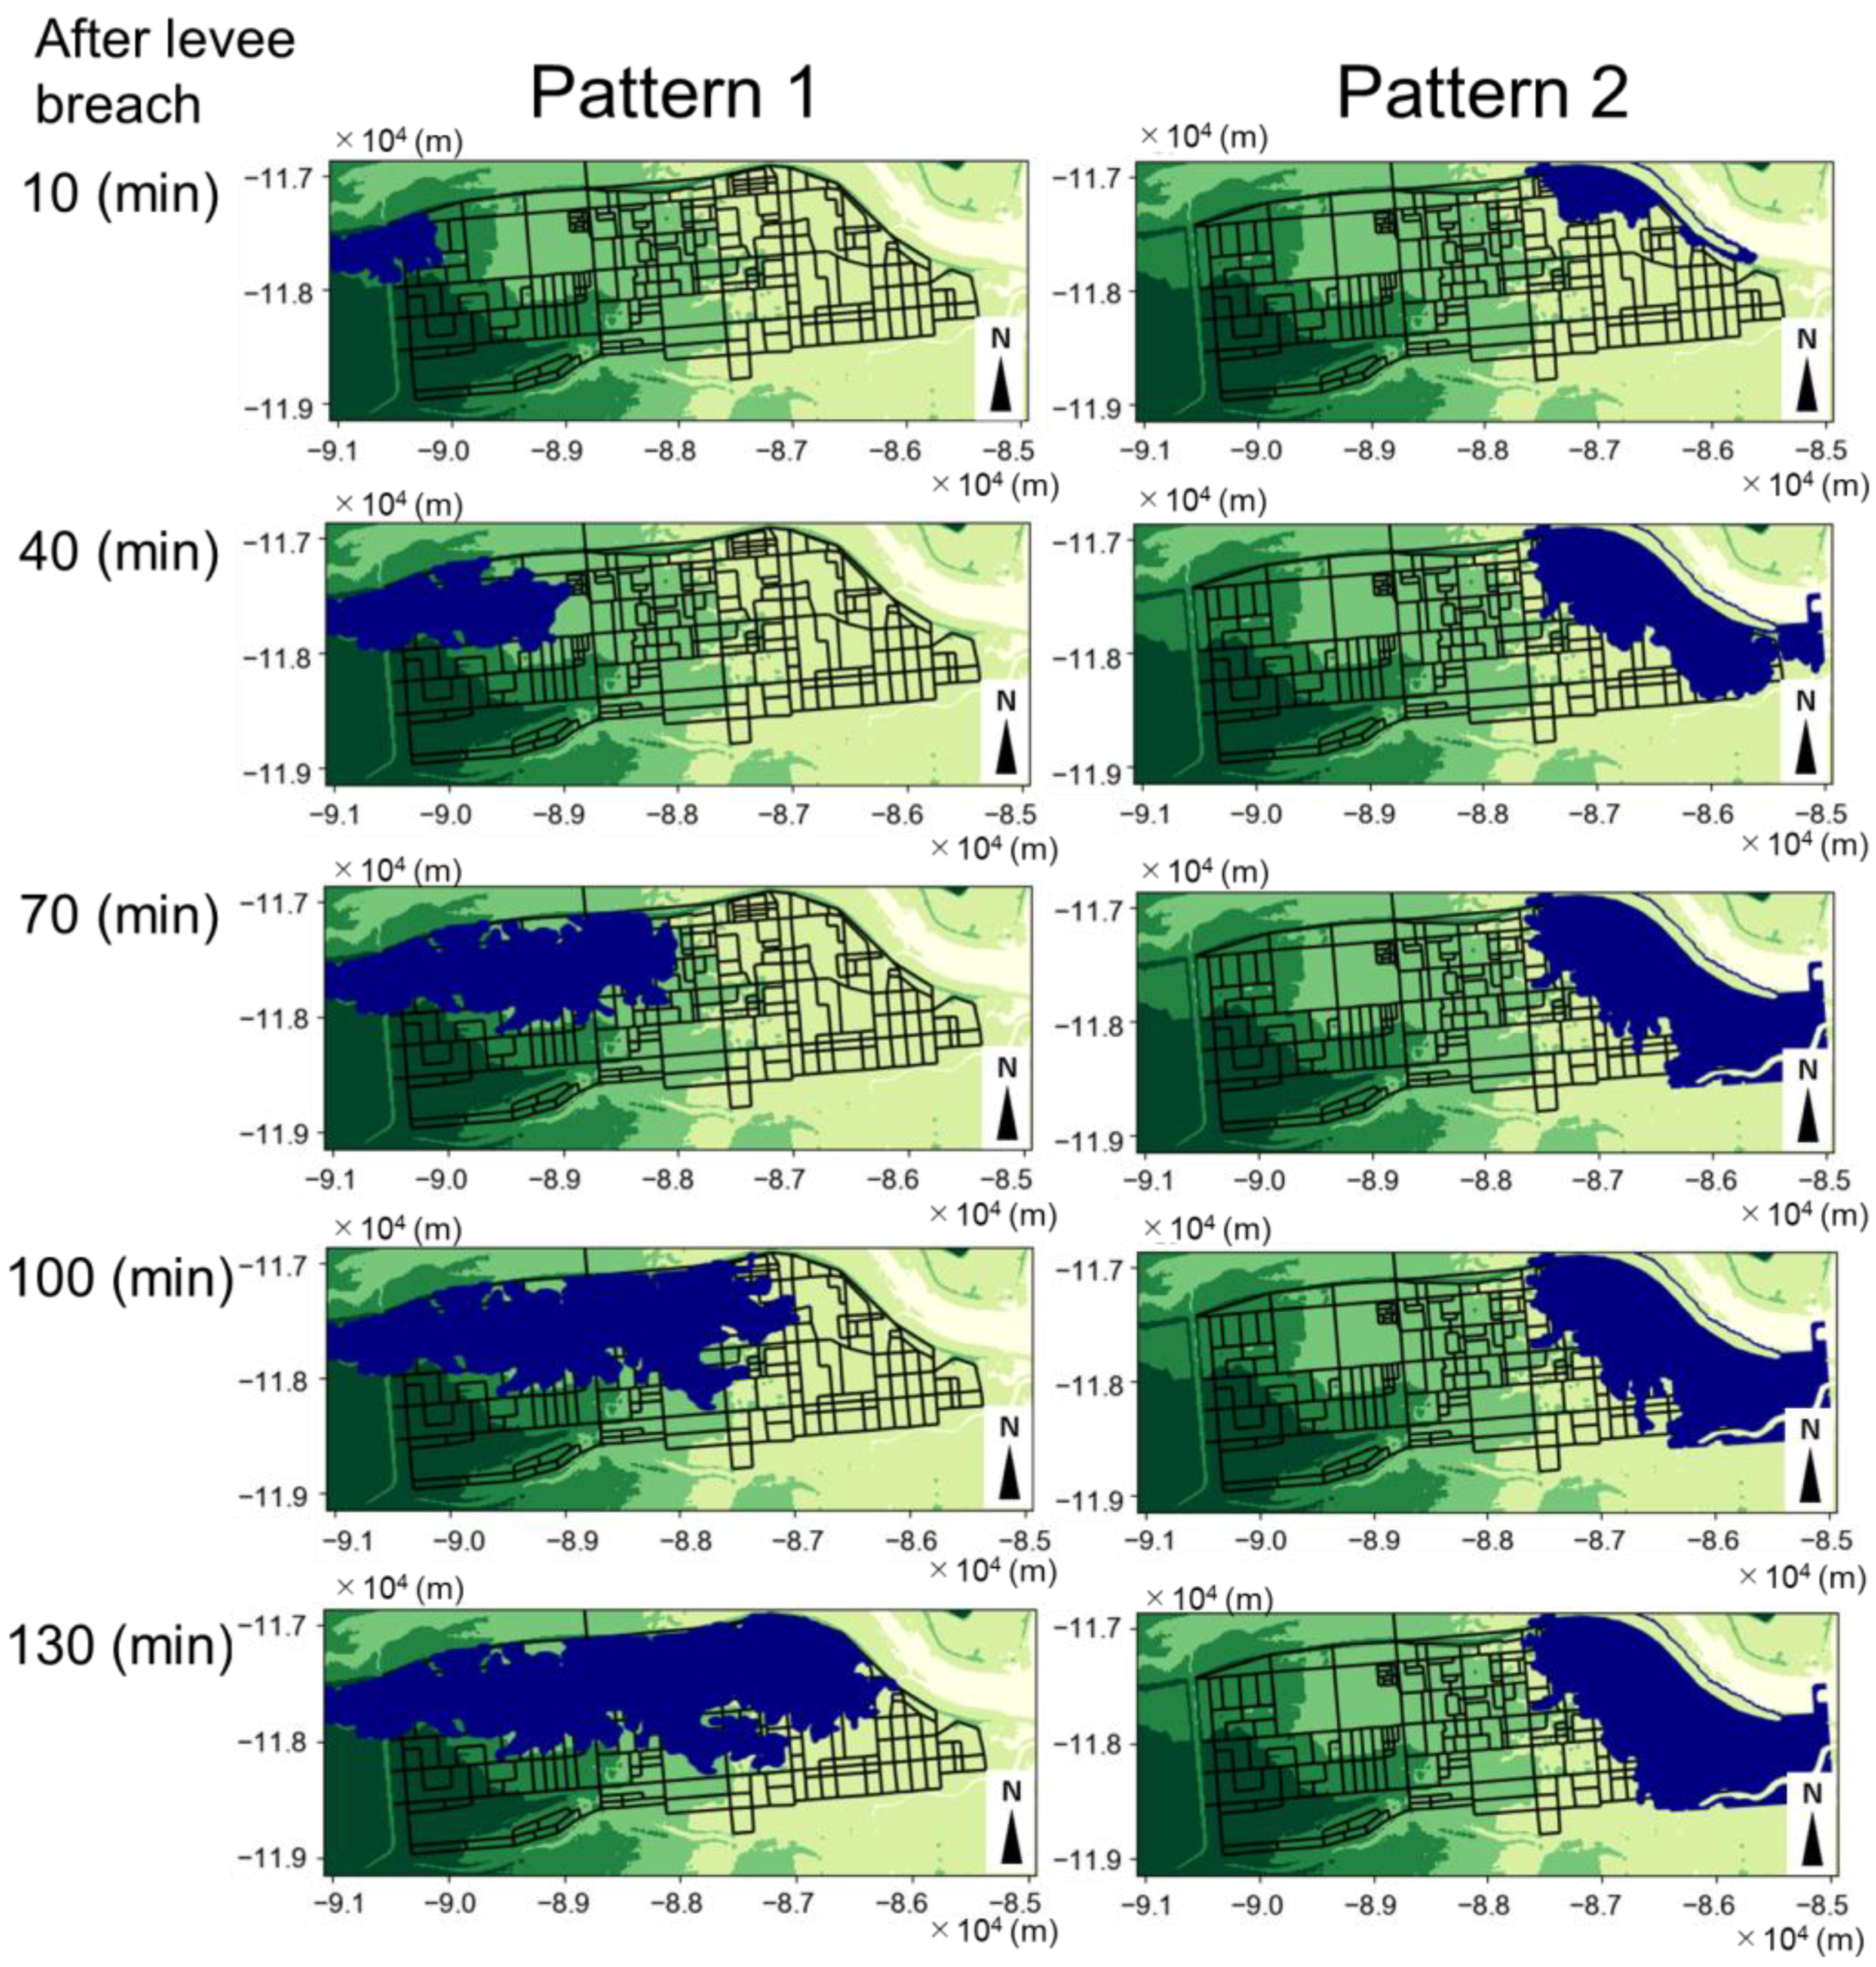
3. Results and Discussion
4. Conclusions
Author Contributions
Funding
Institutional Review Board Statement
Informed Consent Statement
Data Availability Statement
Conflicts of Interest
References
- CRED. 2021 Disasters in Numbers; CRED: Brussels, Belgium, 2021; Available online: https://cred.be/sites/default/files/2021_EMDAT_report.pdf (accessed on 5 December 2022).
- River Data Book. 2022. Available online: https://www.mlit.go.jp/river/toukei_chousa/kasen_db/ (accessed on 5 December 2022). (In Japanese).
- Chiu, Y.; Mirchandani, P.B. Online behavior-robust feedback information routing strategy for mass evacuation. IEEE Trans. Intell. Transp. Syst. 2008, 9, 264–274. [Google Scholar] [CrossRef]
- Xie, C.; Lin, D.; Waller, S. A dynamic evacuation network optimization problem with lane reversal and crossing elimination strategies. Transp. Res. Part E Logist. Transp. Rev. 2010, 46, 295–316. [Google Scholar] [CrossRef]
- Robinson, R.M.; Khattak, A. Route change decision Making by hurricane evacuees facing congestion. Transp. Res. Rec. 2010, 2196, 168–175. [Google Scholar] [CrossRef] [Green Version]
- Lim, H.R.; Lim, M.B.B.; Piantanakulchai, M. A Review of Recent Studies on Flood Evacuation Planning. J. East. Asia Soc. Transp. Stud. 2013, 10, 147–162. [Google Scholar]
- Chelariu, O.-E.; Iațu, C.; Minea, I. A GIS-Based Model for Flood Shelter Locations and Pedestrian Evacuation Scenarios in a Rural Mountain Catchment in Romania. Water 2022, 14, 3074. [Google Scholar] [CrossRef]
- Esposito Amideo, A.; Scaparra, M.P.; Kotiadis, K. Optimising shelter location and evacuation routing operations: The critical issues. Eur. J. Oper. Res. 2019, 279, 279–295. [Google Scholar] [CrossRef]
- Musolino, G.; Ahmadian, R.; Xiia, J.; Falconer, R.A. Mapping the danger to life in flash flood events adopting a mechanics based methodology and planning evacuation routes. J. Flood Risk Manag. 2020, 13, e12627. [Google Scholar] [CrossRef]
- Jonkman, S.N.; Penning-Rowsell, E. Human instability in flood flows. JAWRA J. Am. Water Resour. Assoc. 2008, 44, 1208–1218. [Google Scholar] [CrossRef]
- Lee, H.K.; Hong, W.H.; Lee, Y.H. Experimental study on the influence of water depth on the evacuation speed of elderly people in flood conditions. Int. J. Disaster Risk Reduct. 2019, 29, 101198. [Google Scholar] [CrossRef]
- Dash, N.; Gladwin, H. Evacuation decision making and behavioral responses: Individual and Household. Nat. Hazards Rev. 2007, 8, 69–77. [Google Scholar] [CrossRef] [Green Version]
- Kievik, M.; Gutteling, J. Yes, we can: Motivate Dutch citizens to engage in self-protective behavior with regard to flood risks. Nat. Hazards 2011, 5, 1475–1490. [Google Scholar] [CrossRef] [Green Version]
- Ming, X.; Liang, Q.; Xia, X.; Li, D.; Fowler, H.J. Real-time flood forecasting based on a high-performance 2-D hydrodynamic model and numerical weather predictions. Water Resour. Res. 2020, 56, e2019WR025583. [Google Scholar] [CrossRef]
- Van Ackere, S.; Verbeurgt, J.; De Sloover, L.; Gautama, S.; De Wulf, A.; De Maeyer, P. A Review of the Internet of Floods: Near Real-Time Detection of a Flood Event and Its Impact. Water 2019, 11, 2275. [Google Scholar] [CrossRef] [Green Version]
- Notti, D.; Giordan, D.; Caló, F.; Pepe, A.; Zucca, F.; Galve, J.P. Potential and Limitations of Open Satellite Data for Flood Mapping. Remote Sens. 2018, 10, 1673. [Google Scholar] [CrossRef] [Green Version]
- Sekine, M.; WU, Y.; Baba, W.; Ogata, K. Prediction of urban inundation and flooding of urban rivers caused by heavy rainfall and storm surge in Tokyo 23 wards. In Proceedings of the 22nd IAHR-APD Congress, Sapporo, Japan, 15–16 September 2020. [Google Scholar]
- Sekine’s Urban Inundation Prediction System (S-uiPS) Open to the Public in September 2022. Available online: https://kyodonewsprwire.jp/release/202209066029 (accessed on 5 December 2022). (In Japanese).
- Inoue, T.; Nakatani, T.; Yabe, H. Route search with real-time flood prediction. J. Jpn. Soc. Civ. Eng. Ser. B1 (Hydraul. Eng.) 2018, 74, I_1291–I_1296. (In Japanese) [Google Scholar] [CrossRef] [PubMed]
- Lee, Y.H.; Kim, H.I.; Han, K.Y.; Hong, W.H. Flood Evacuation Routes Based on Spatiotemporal Inundation Risk Assessment. Water 2020, 12, 2271. [Google Scholar] [CrossRef]
- Krytska, Y.; Skarga-Bandurova, I.; Velykzhanin, A. IoT-based situation awareness support system for real-time emergency management. In Proceedings of the 9th IEEE International Conference on Intelligent Data Acquisition and Advanced Computing Systems: Technology and Applications (IDAACS), Bucharest, Romania, 21–23 September 2017; Volume 2, pp. 955–960. [Google Scholar]
- Nishikawa, S.; Hori, T. Effect of obstacle information sharing among evacuees on flood evacuation. J. Jpn. Soc. Civ. Eng. 2019, 75, 1327–1332. [Google Scholar]
- Nelson, J.M.; Shimizu, Y.; Abe, T.; Asahi, K.; Gamou, M.; Inoue, T.; Iwasaki, T.; Kakinuma, T.; Kawamura, S.; Kimura, I.; et al. The international river interface cooperative: Public domain flow and morphodynamics software for education and applications. Adv. Water Resour. 2016, 93, 62–74. [Google Scholar] [CrossRef]
- Shimizu, Y.; Nelson, J.; Arnez, K.F.; Asahi, K.; Giri, S.; Inoue, T.; Iwasaki, T.; Jang, C.L.; Kang, T.; Kimura, I.; et al. Advances in computational morphodynamics using the International River Interface Cooperative (iRIC) software. Earth Surf. Process. Land. 2019, 45, 11–37. [Google Scholar] [CrossRef]
- Inoue, T.; Mishra, J.; Kato, K.; Sumner, T.; Shimizu, Y. Supplied sediment tracking for bridge collapse with large-scale channel migration. Water 2020, 12, 1881. [Google Scholar] [CrossRef]
- Pizarro, A.; Manfreda, S.; Tubaldi, E. The Science behind Scour at Bridge Foundations: A Review. Water 2020, 12, 374. [Google Scholar] [CrossRef] [Green Version]
- Sumner, T.; Inoue, T.; Shimizu, Y. The influence of bed slope change on erosional morphology. J. JSCE 2019, 7, 15–21. [Google Scholar] [CrossRef] [PubMed] [Green Version]
- Johnson, P.A.; Whittington, R.M. Vulnerability-Based Risk Assessment for Stream Instability at Bridges. J. Hydraul. Eng. 2011, 137, 1248–1256. [Google Scholar] [CrossRef]
- Huang, W.; Xiao, H. Numerical modeling of dynamic wave force acting on Escambia bay bridge deck during Hurricane Ivan. J. Waterw. Port Coast. Ocean. Eng. 2009, 135, 164e175. [Google Scholar] [CrossRef]
- Inoue, T.; Watanabe, Y.; Iwasaki, T.; Otsuka, J. Three-dimensional antidunes coexisting with alternate bars. Earth Surf. Process. Landf. 2020, 45, 2897–2911. [Google Scholar] [CrossRef]


| Data and Software | Data Sources and Links |
|---|---|
| iRIC Nays2D Flood | https://i-ric.org/en/solvers/nays2dflood/ (accessed on 17 March 2023) |
| Population density | https://www.e-stat.go.jp/gis (in Japanease) (accessed on 17 March 2023) |
| Digital Elevation Model (DEM) | https://fgd.gsi.go.jp/download/menu.php (in Japanese) (accessed on 17 March 2023) EPSG:2454: JGD2000/Japan Plane Rectangular CS Xll Resolution: About 3.5 (m) |
Disclaimer/Publisher’s Note: The statements, opinions and data contained in all publications are solely those of the individual author(s) and contributor(s) and not of MDPI and/or the editor(s). MDPI and/or the editor(s) disclaim responsibility for any injury to people or property resulting from any ideas, methods, instructions or products referred to in the content. |
© 2023 by the authors. Licensee MDPI, Basel, Switzerland. This article is an open access article distributed under the terms and conditions of the Creative Commons Attribution (CC BY) license (https://creativecommons.org/licenses/by/4.0/).
Share and Cite
Ogawa, K.; Inoue, T.; Hiramatsu, Y.; Mishra, J. A Route Search System to Avoid the Danger to Life in Dynamic Inundation. Water 2023, 15, 1417. https://doi.org/10.3390/w15071417
Ogawa K, Inoue T, Hiramatsu Y, Mishra J. A Route Search System to Avoid the Danger to Life in Dynamic Inundation. Water. 2023; 15(7):1417. https://doi.org/10.3390/w15071417
Chicago/Turabian StyleOgawa, Kohei, Takuya Inoue, Yuki Hiramatsu, and Jagriti Mishra. 2023. "A Route Search System to Avoid the Danger to Life in Dynamic Inundation" Water 15, no. 7: 1417. https://doi.org/10.3390/w15071417