

Replenishment Impacts on Hydrogeochemistry and Water Quality in the Hutuo River Plain
 , ,
, ,
Abstract
:1. Introduction
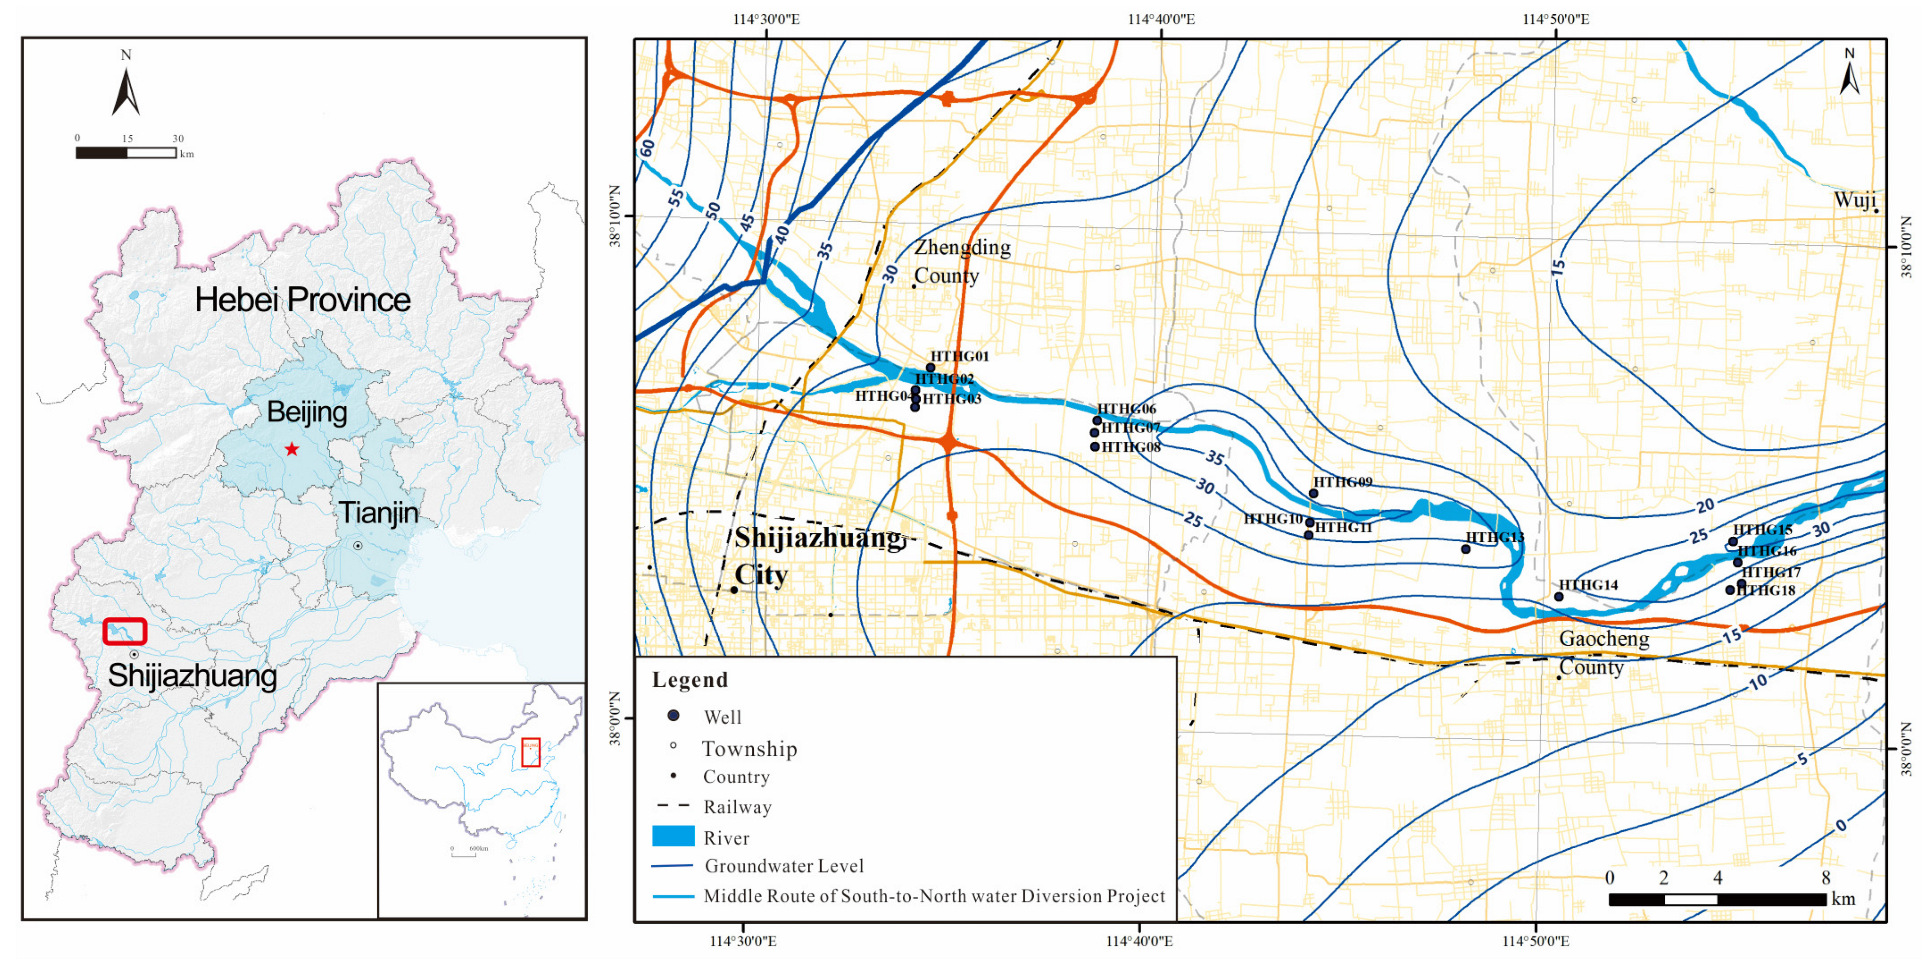
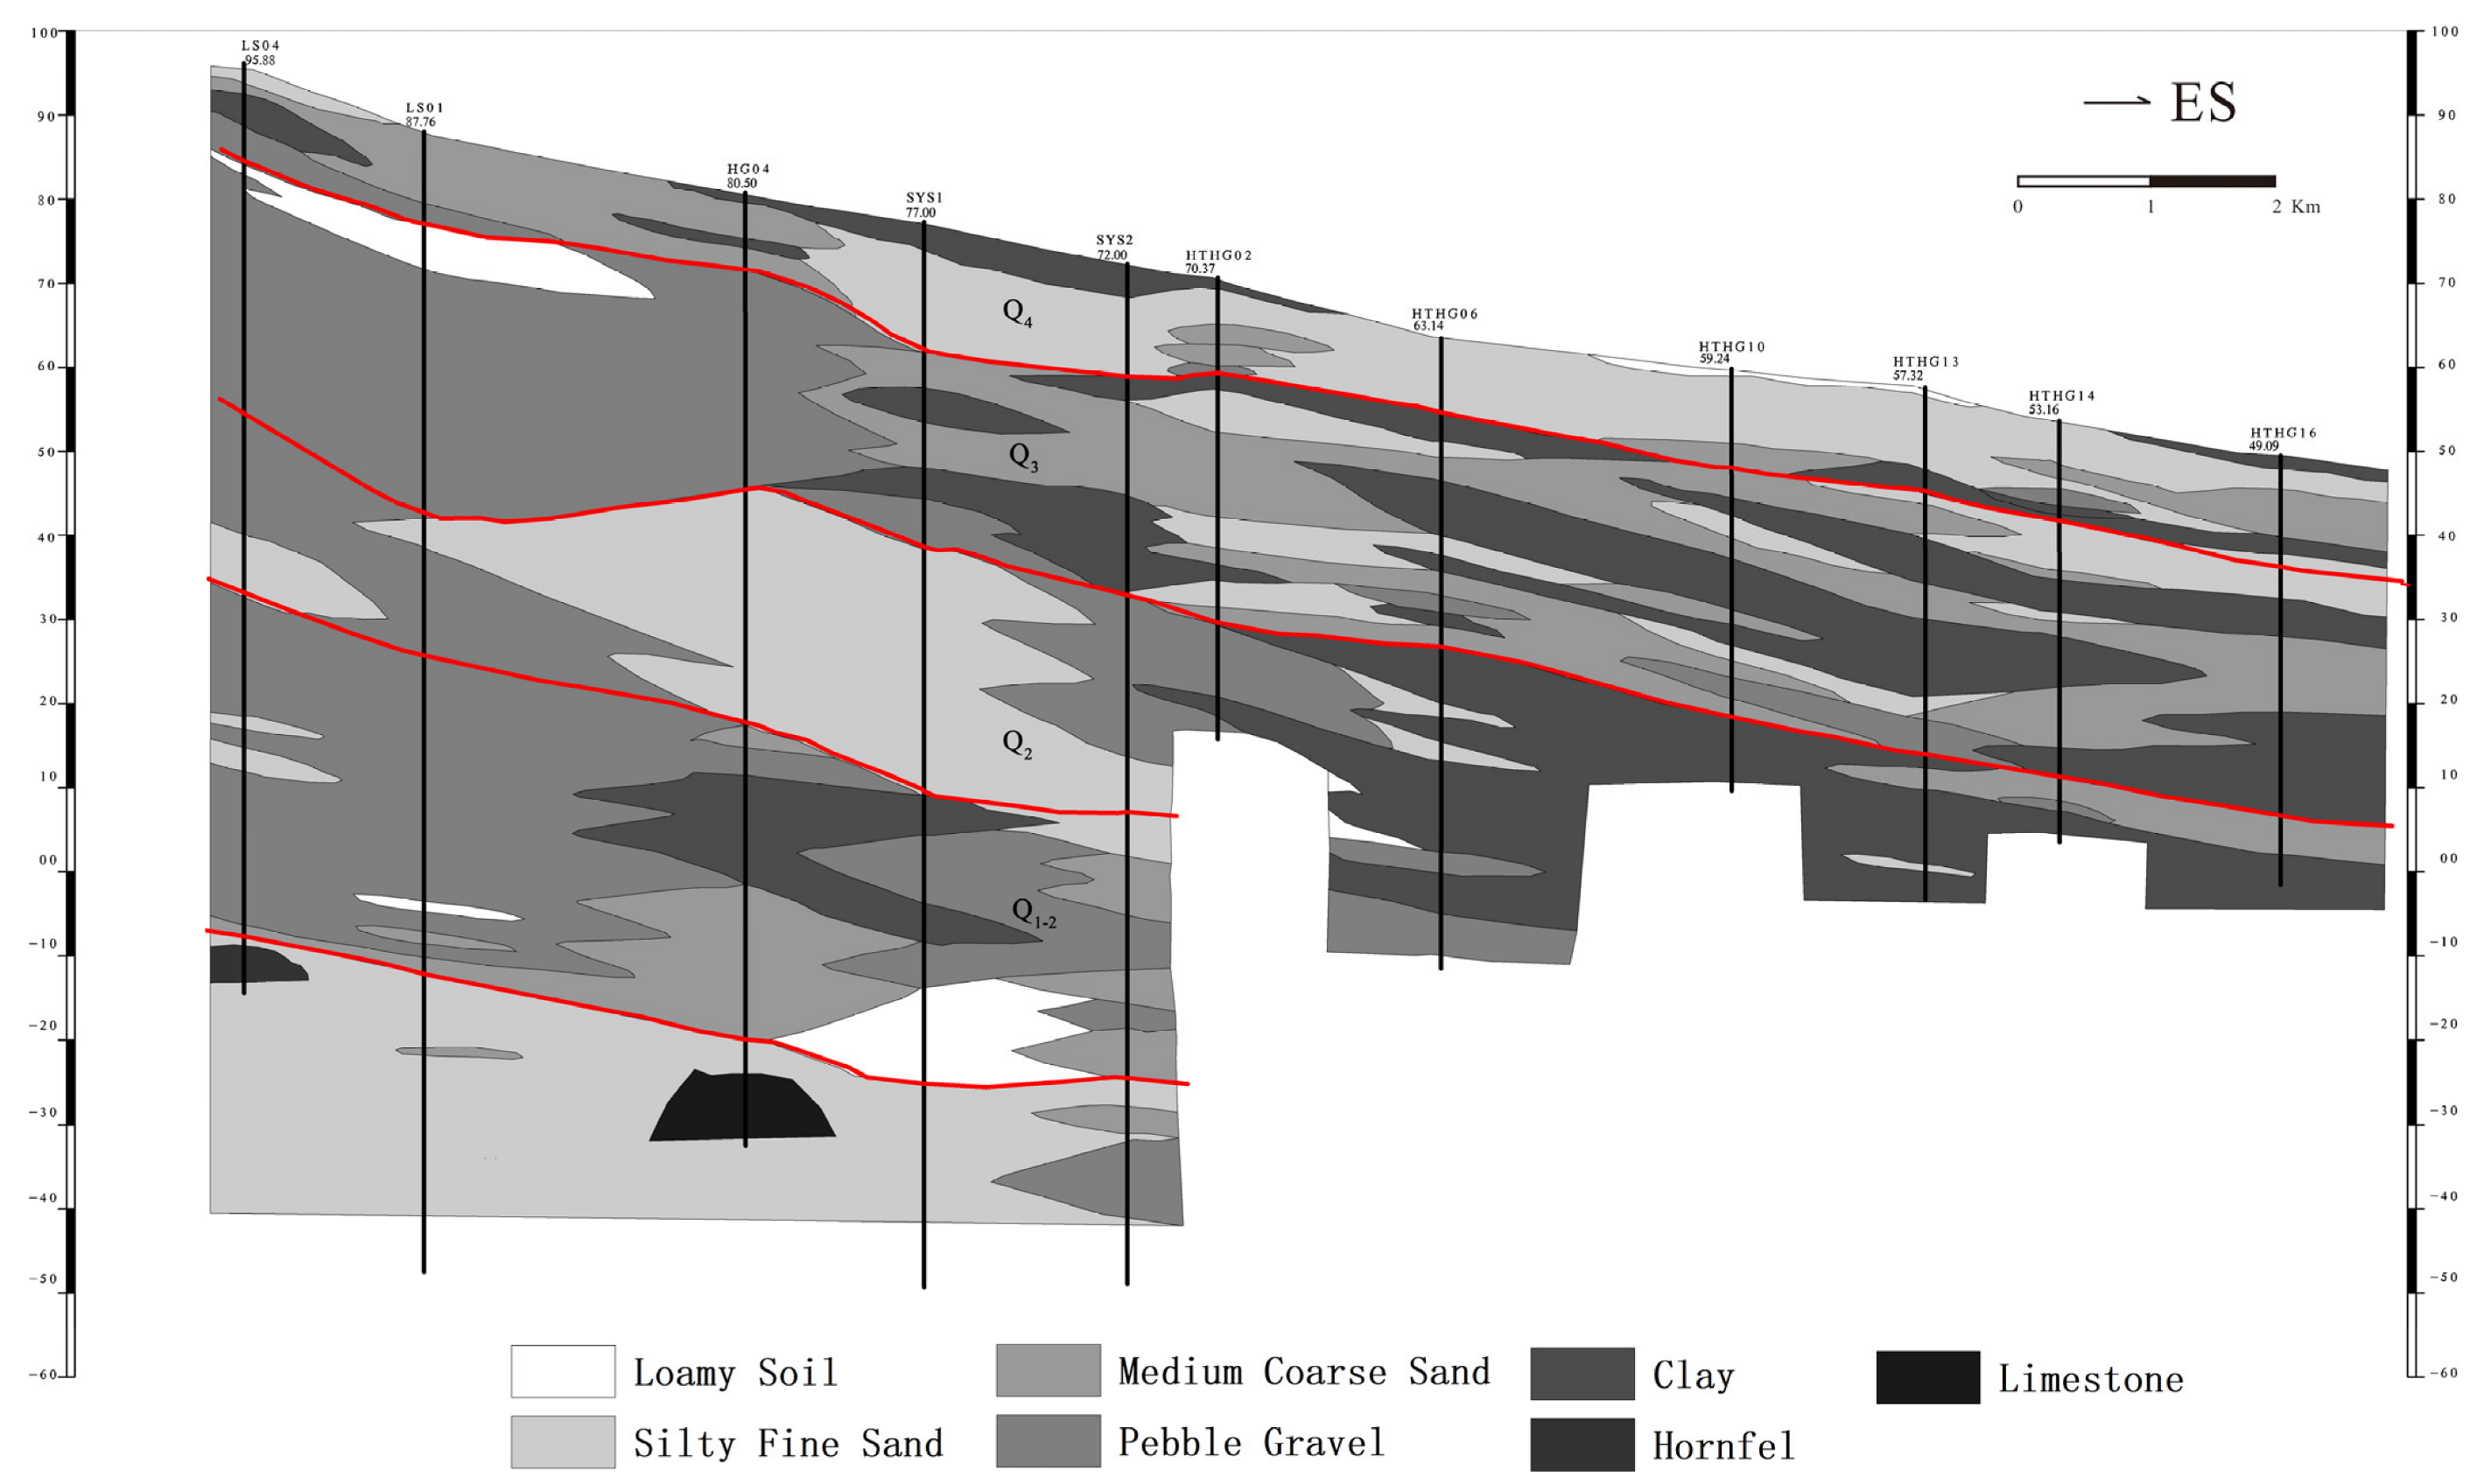
2. Study Area
3. Materials and Methods
3.1. Water Sample Collection and Analysis
3.2. Entropy Water Quality Index
4. Results
4.1. Entropy Water Quality Index
4.2. Groundwater Quality
5. Discussion
5.1. Hydrogeochemical Processes
5.2. Changes in Groundwater Quality during the Recharge Process
6. Conclusions
- (1)
- Overall, the groundwater in the area was slightly alkaline, and the pH increased as the recharge progressed. The TDS in the groundwater tended to be high but gradually decreased with recharge. The concentration of Ca2+ increased, whereas that of other elemental ions typically decreased or stabilized. Elemental concentrations in sample of the Middle Route of the South-to-North Water Diversion Project were generally lower than those in the groundwater.
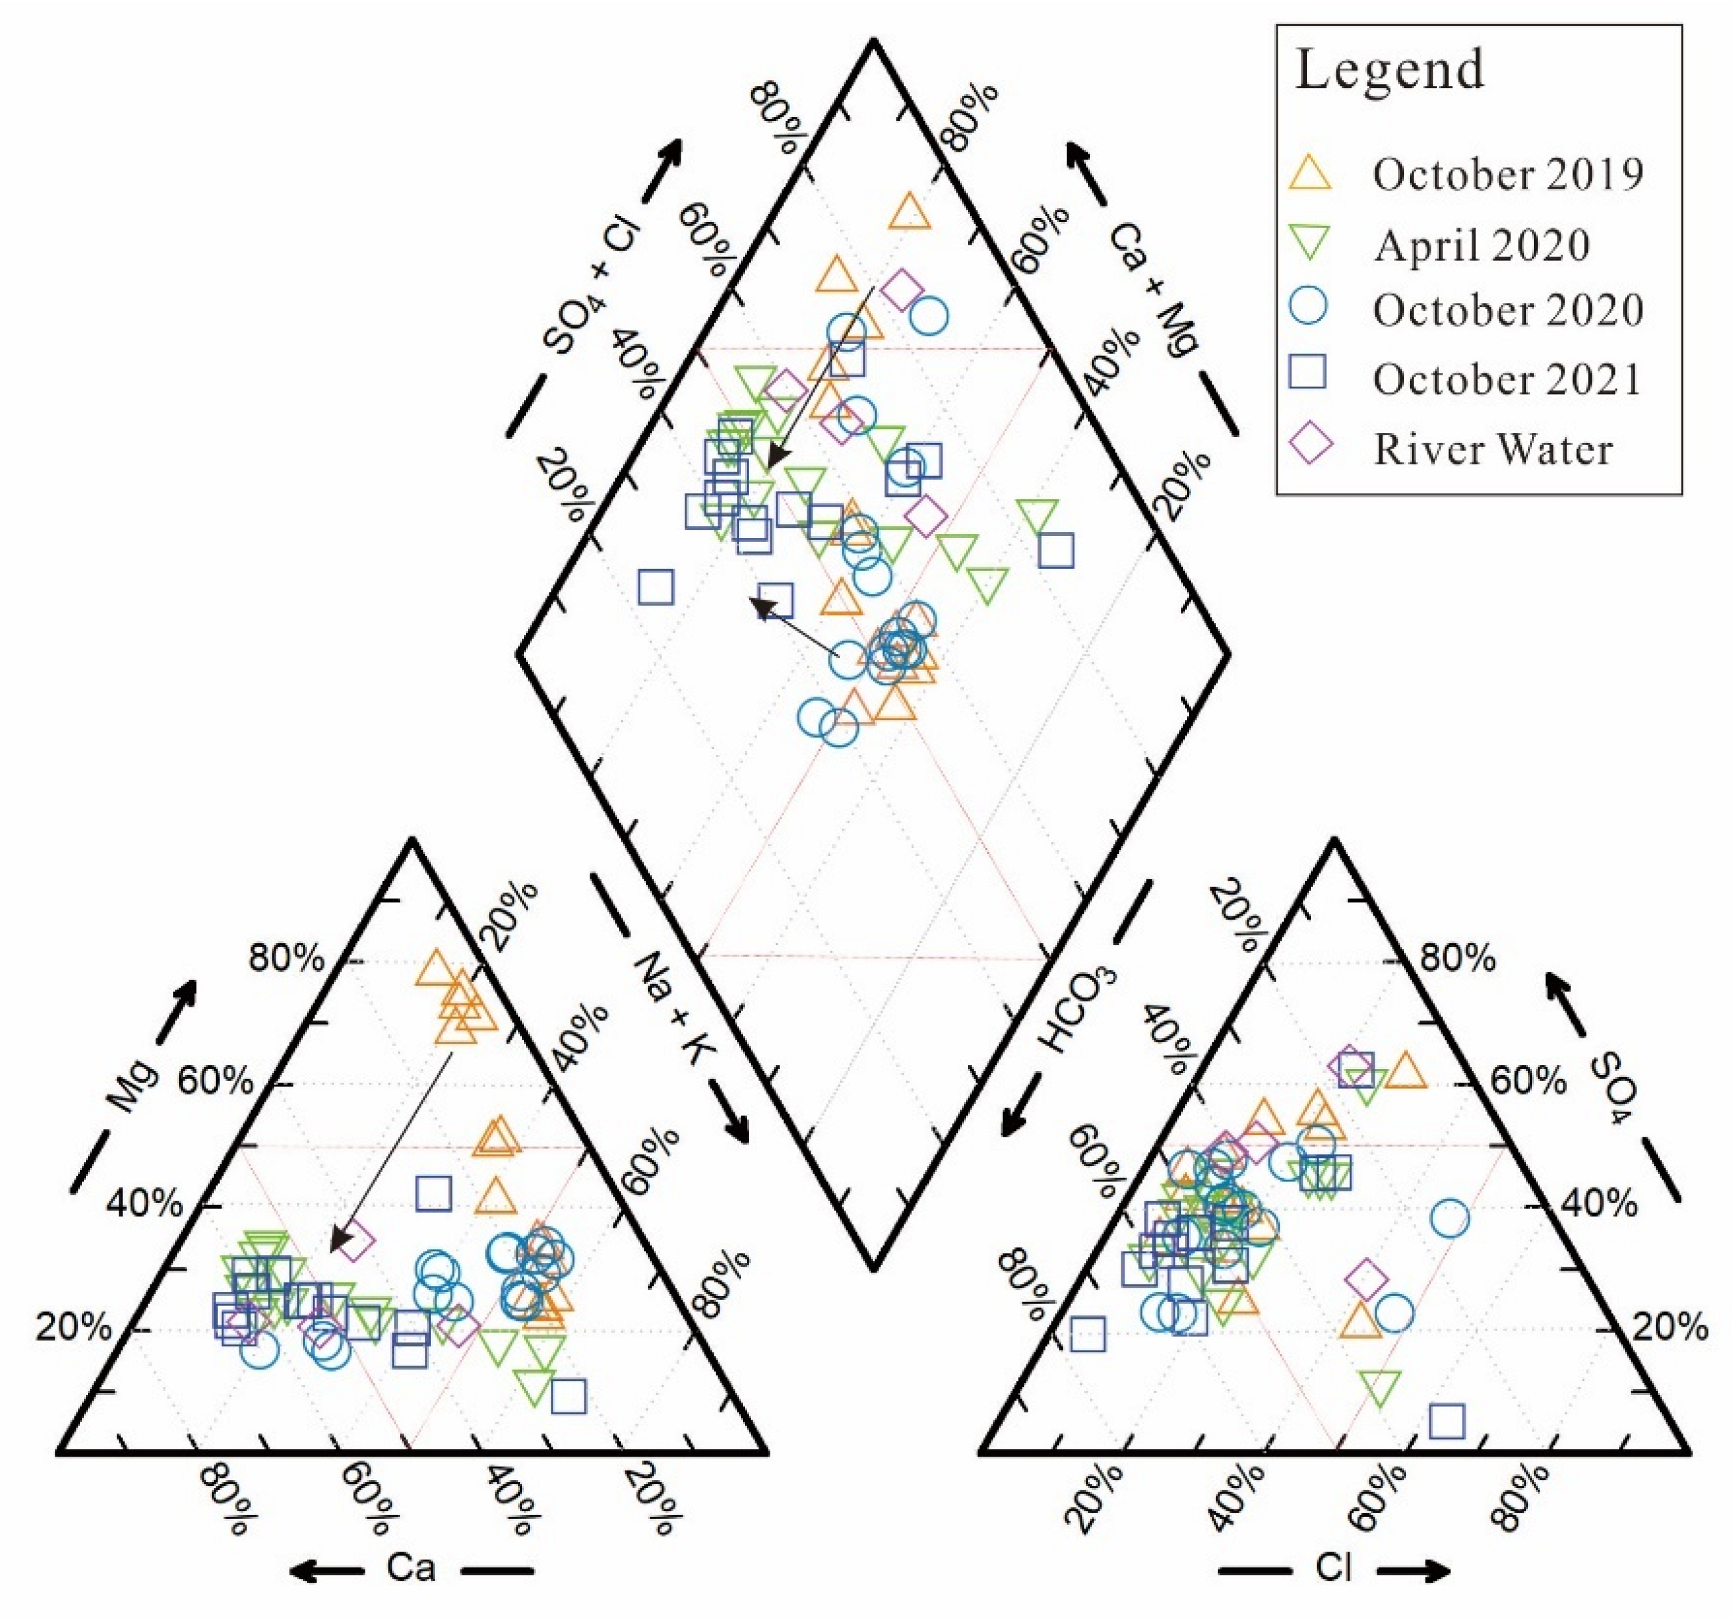
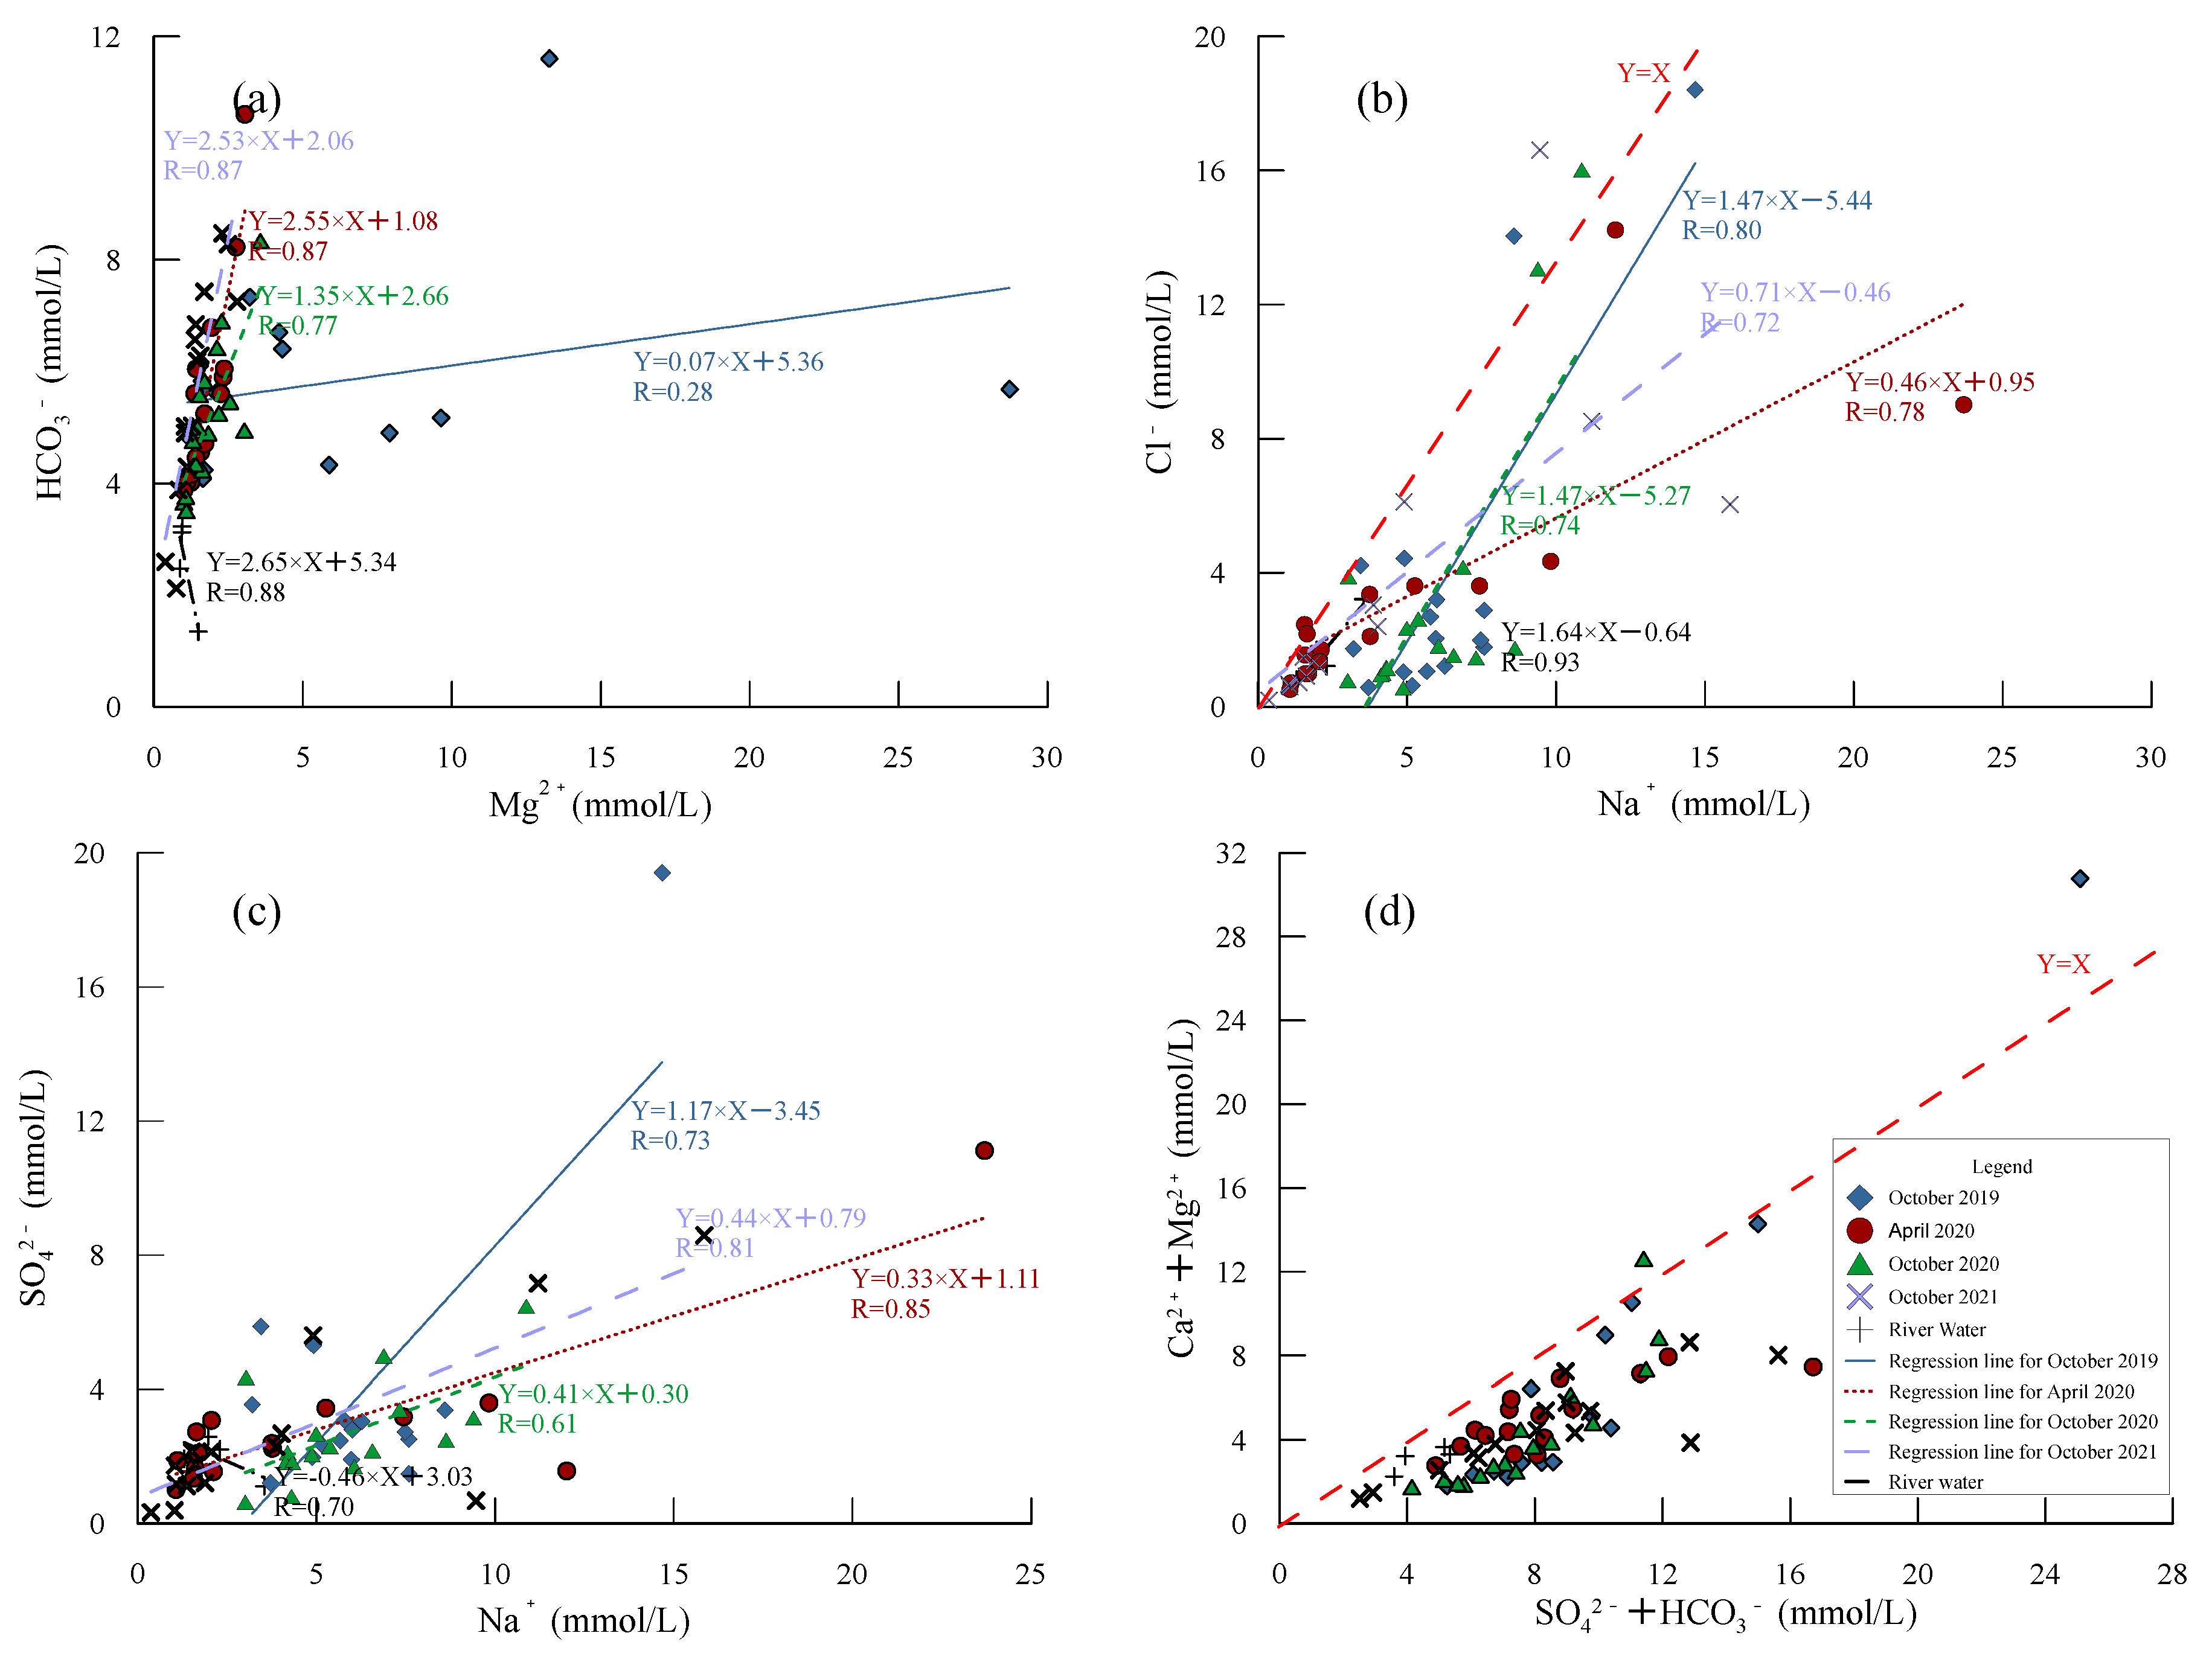
- (2)
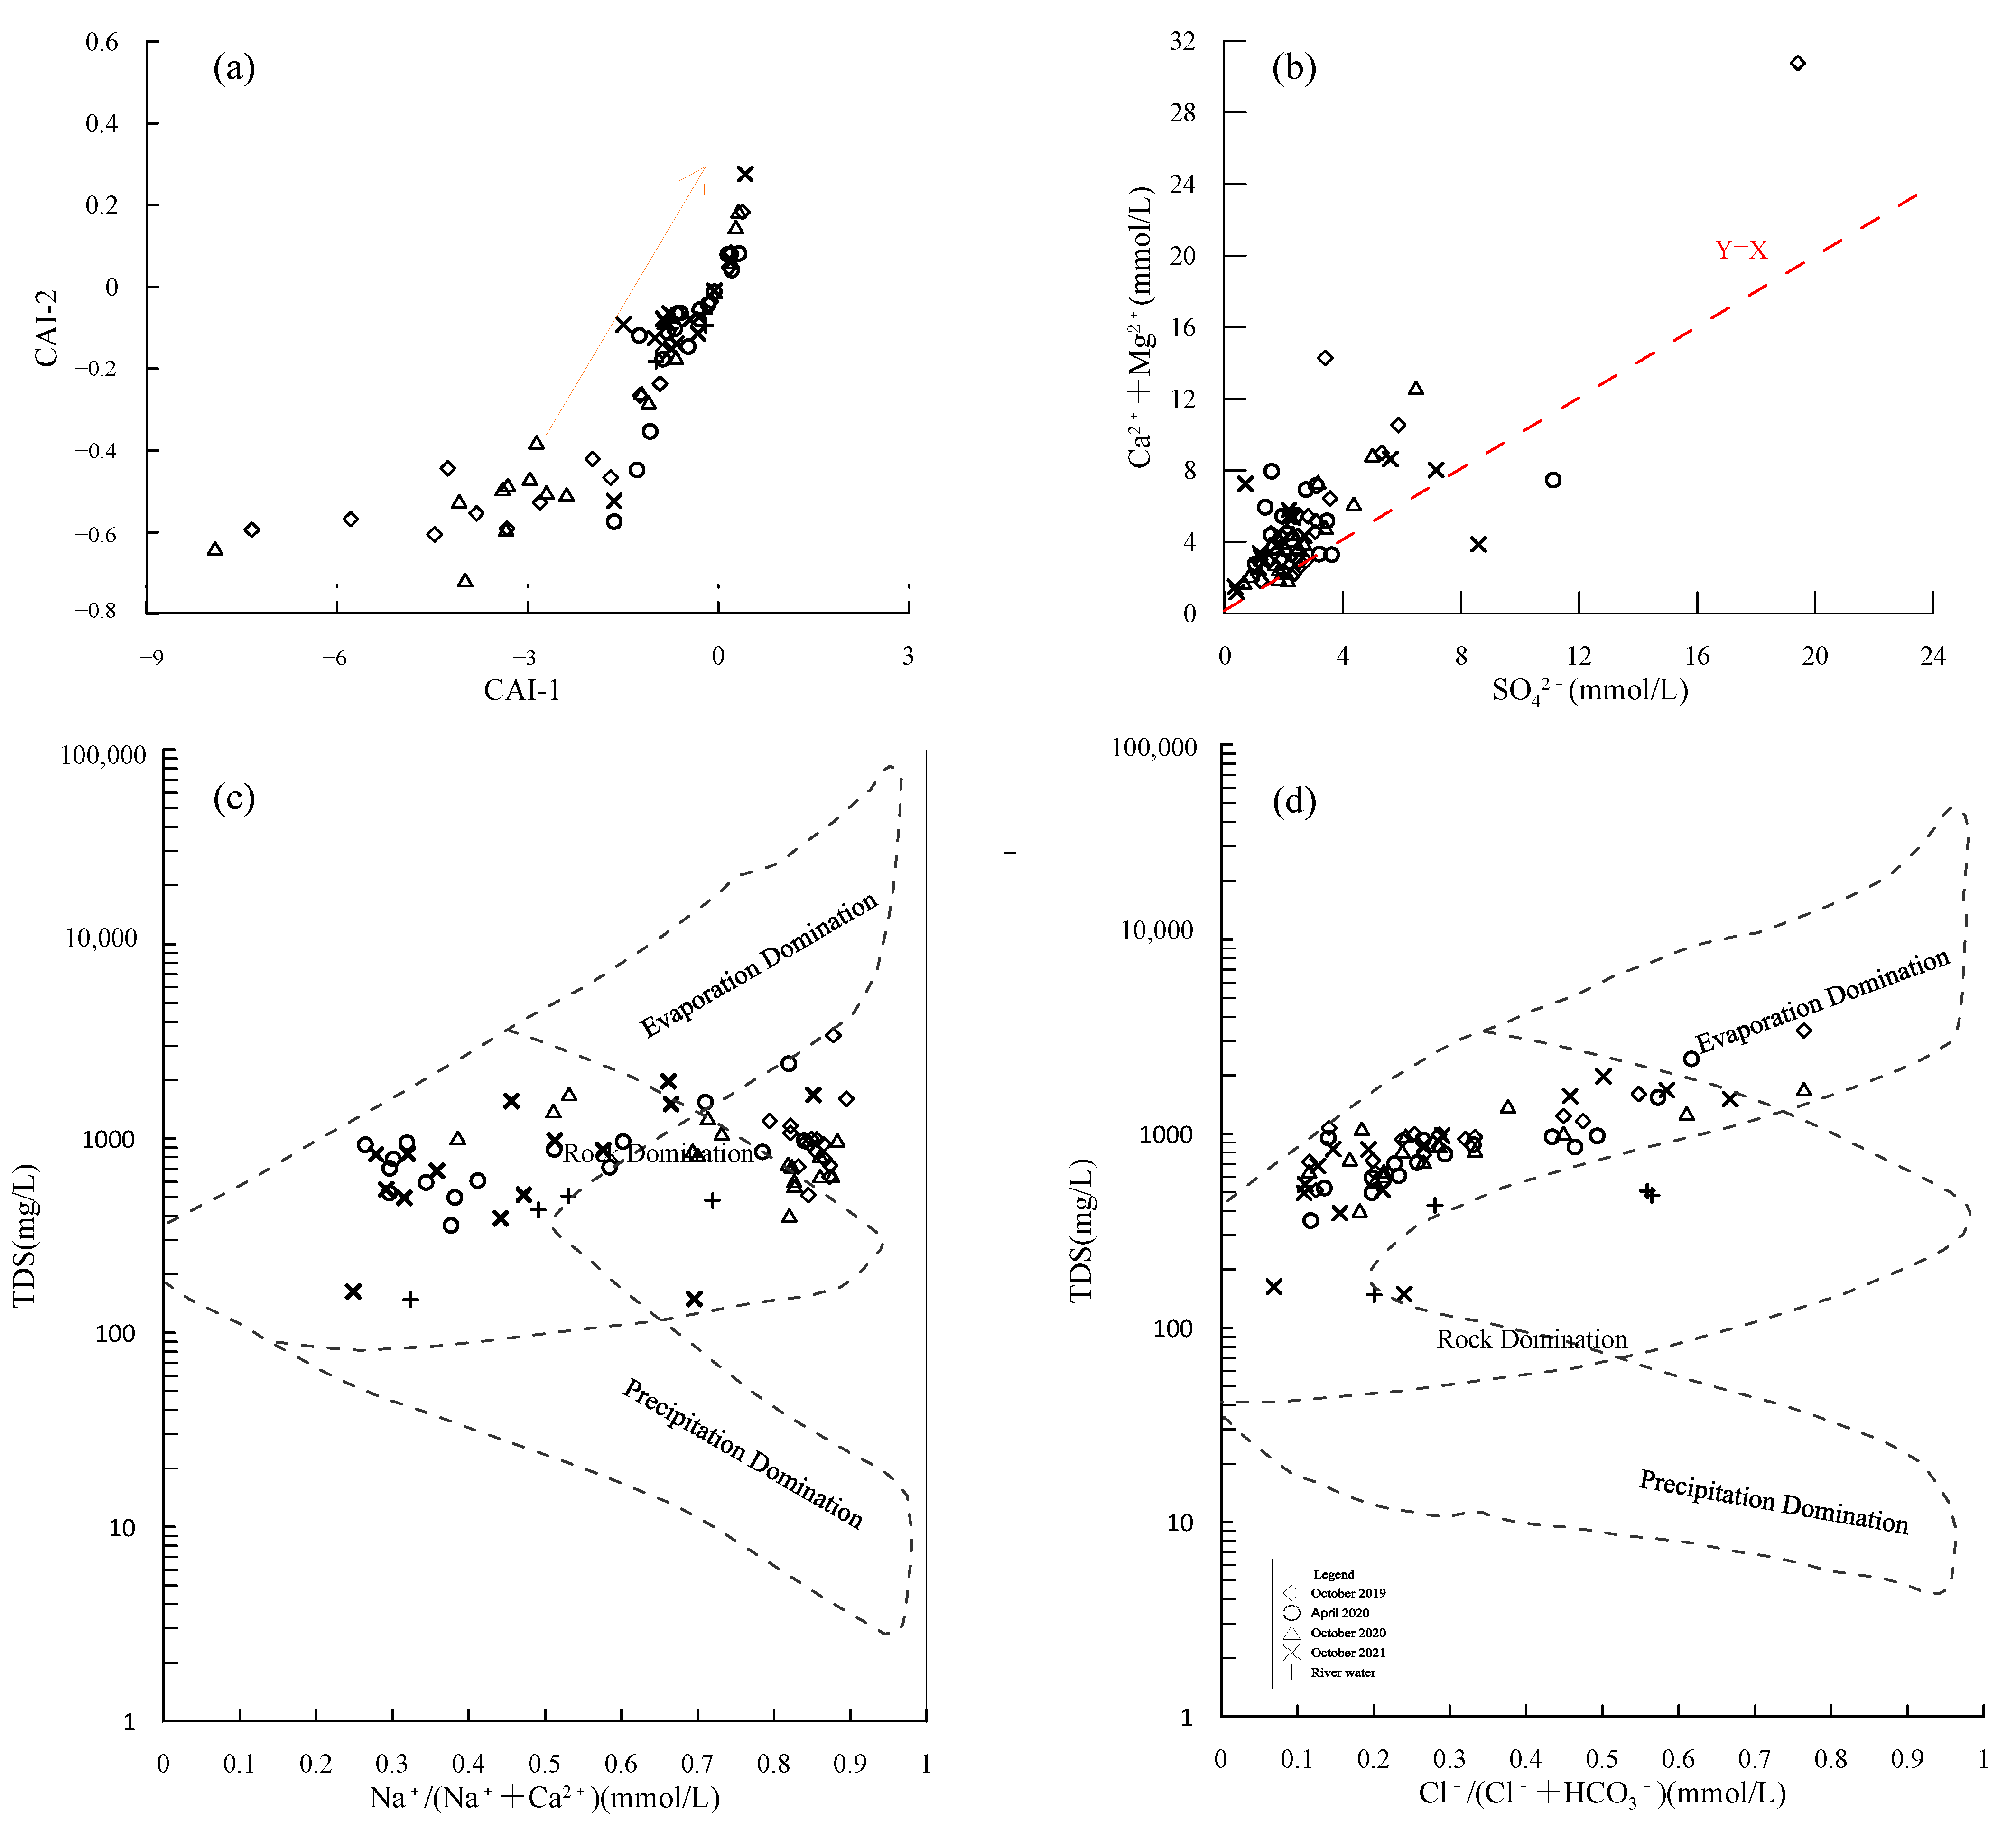
- Significant changes were observed in the chemical composition of groundwater during concentrated and continuous recharge processes in the Hutuo River area. In the early stages of recharge (October 2019), the groundwater in the study area was mainly of the type Mg-Na-HCO3-SO4, while the water from the Middle Route of the South-to-North Water Diversion Project was mainly of the type Ca-Na-SO4-HCO3. As the recharge continued, the groundwater in the study area evolved into Ca-Na-Mg-HCO3-SO4, Na-Ca-Mg-HCO3-SO4, and Ca-Na-Mg-SO4-HCO3. Groundwater primarily undergoes the dissolution of minerals, such as calcite, halite, mirabilite, carbonate rocks, and gypsum, accompanied by a dilution effect, and the intensity of ion interactions decreases as the recharge progresses.
- (3)
- The water quality was evaluated using the EWQI. The evaluation results indicated that in the early stages of recharge (October 2019), except for one medium quality water sample, the other water samples exhibited good quality and were suitable for drinking and domestic use. In April 2020, one fair quality sample persisted; however, the overall EWQI value decreased. The water from the Middle Route of the South-to-North Water Diversion Project was of excellent quality (Rank 1), and as the recharge progressed, by October 2020, all water samples exhibited good quality, indicating a gradual improvement in water quality.
Author Contributions
Funding
Data Availability Statement
Acknowledgments
Conflicts of Interest
References
- Regnery, J.; Li, D.; Lee, J.; Smits, K.M.; Sharp, J.O. Hydrogeochemical and microbiological effects of simulated recharge and drying within a 2D meso-scale aquifer. Chemosphere 2020, 241, 125116. [Google Scholar] [CrossRef] [PubMed]
- Zhang, Z.; Xu, Y.; Zhang, Y.; Guo, L.; Wang, Z.; Zheng, Q. Impact of groundwater overexploitation on karst aquifer and delineation of the critical zones: Case study of Jinci spring in Shanxi, China. Carbonates Evaporites 2022, 37, 68. [Google Scholar] [CrossRef]
- Dhaouadi, L.; Besser, H.; Karbout, N.; Wassar, F.; Alomrane, A.R. Assessment of natural resources in tunisian Oases: Degradation of irrigation water quality and continued overexploitation of groundwater. Euro-Mediterr. J. Environ. Integr. 2021, 6, 36. [Google Scholar] [CrossRef]
- Zhang, B.; Chen, L.; Li, Y.; Liu, Y.; Li, C.; Kong, X.; Zhang, Y. Impacts of River Bank Filtration on Groundwater Hydrogeochemistry in the Upper of Hutuo River Alluvial Plain, North China. Water 2023, 15, 1343. [Google Scholar] [CrossRef]
- Dillon, P.; Stuyfzand, P.; Grischek, T.; Lluria, M.; Pyne, R.; Jain, R.C.; Bear, J.; Schwarz, J.; Wang, W.; Fernandez, E.; et al. Sixty years of global progress in managed aquifer recharge. Hydrogeol. J. 2019, 27, 1–30. [Google Scholar] [CrossRef]
- Igwebuisi, N.; Muchingami, I.; Kangerere, T. Application of hydrogeophysics and diagnostic plots in setting up a sustainable managed aquifer recharge scheme, West Coast, South Africa. J. Afr. Earth Sci. 2023, 206, 105039. [Google Scholar] [CrossRef]
- Hu, B.; Teng, Y.; Zhai, Y.; Zuo, R.; Li, J.; Chen, H. Riverbank filtration in China: A review and perspective. J. Hydrol. 2016, 541, 914–927. [Google Scholar] [CrossRef]
- Zhang, X.; Zhang, G.; Yan, M. Evolution characteristics of total dissolved solids in the groundwater level funnel area in the Hufu piedmont plain. Hyd. Eng. Geol. 2021, 48, 72–81. (In Chinese) [Google Scholar]
- Hiscock, K.M.; Grischek, T. Attenuation of groundwater pollution by bank filtration. J. Hydrol. 2002, 266, 139–144. [Google Scholar] [CrossRef]
- Bouwer, H. Artificial recharge of groundwater: Hydrogeology and engineering. Hydrogeol. J. 2002, 10, 121–142. [Google Scholar] [CrossRef]
- Daesslé, L.W.; Andrade-Tafoya, P.D.; Lafarga-Moreno, J.; Mahlknecht, J.; Van Geldern, R.; Beramendi-Orosco, L.E.; Barth, J.A.C. Groundwater recharge sites and pollution sources in the wine-producing Guadalupe Valley (Mexico): Restrictions and mixing prior to transfer of reclaimed water from the US-México border. Sci. Total Environ. 2020, 713, 13. [Google Scholar] [CrossRef] [PubMed]
- Bartak, R.; Page, D.; Sandhu, C.; Grischek, T.; Saini, B.; Mehrotra, I.; Jain, C.K.; Ghosh, N.C. Application of risk-based assessment and management to riverbank filtration sites in India Application of risk-based assessment and management to riverbank filtration sites in India. J. Water Health 2015, 13, 174–189. [Google Scholar] [CrossRef] [PubMed]
- Kurki, V.; Lipponen, A.; Katko, T. Managed aquifer recharge in community water supply: The Finnish experience and some international comparisons. Water Int. 2013, 38, 774–789. [Google Scholar] [CrossRef]
- Greskowiak, J.; Prommer, H.; Massmann, G.; Johnston, C.D.; Nützmann, G.; Pekdeger, A. The impact of variably saturated conditions on hydrogeochemical changes during artificial recharge of groundwater. Appl. Geochem. 2005, 20, 1409–1426. [Google Scholar] [CrossRef]
- Wang, C.; Wang, P.F.; Hu, X. Removal of CODcr and nitrogen in severely polluted river water by bank filtration. Environ. Technol. 2007, 28, 649–657. [Google Scholar] [CrossRef]
- Su, D.; Su, X.; Zhang, L.; Yuan, W.; Lu, S.; Zuo, E.; Gao, R. Redox zonation in the process of river water infiltration in the Huangjia riverside well field, Shenyang City. China Environ. Sci. 2016, 36, 2043–2050. [Google Scholar]
- Wang, D.; Yu, J.; Wang, P.; Zhu, B. Shallow Groundwater Chemistry Characteristics and Their Controlling Factors in the Ejina Delta. South-to-North Water Diversion. Water Sci. Technol. 2013, 11, 51–55. (In Chinese) [Google Scholar]
- Zhu, Y.; Zhai, Y.; Teng, Y.; Wang, G.; Du, Q.; Wang, J.; Yang, G. Water supply safety of riverbank filtration wells under the impact of surface water-groundwater interaction: Evidence from long-term field pumping tests. Sci. Total Environ. 2020, 711, 135141. [Google Scholar] [CrossRef]
- Shamrukh, M.; Abdel-Wahab, A. Water Pollution and Riverbank Filtration for Water Supply Along River Nile, Egypt. In Riverbank Filtration for Water Security in Desert Countries; Springer: Berlin/Heidelberg, Germany, 2011; pp. 5–28. [Google Scholar]
- Boving, T.B.; Patil, K.; D’Souza, F.; Barker, S.F.; McGuinness, S.L.; O’Toole, J.; Sinclair, M.; Forbes, A.B.; Leder, K. Performance of riverbank filtration under hydrogeologic conditions along the upper Krishna river in Southern India. Water 2019, 11, 17. [Google Scholar] [CrossRef]
- Li, P.; Wu, J. Drinking water quality and public health. Expo. Health 2019, 11, 73–79. [Google Scholar] [CrossRef]
- Milovanovic, M. Water quality assessment and determination of pollution sources along the Axios/Vardar River, Southeastern Europe. Desalination 2007, 213, 159–173. [Google Scholar] [CrossRef]
- Mencio, A.; Mas-Pla, J.; Otero, N.; Regas, O.; Boy-Roura, M.; Puig, R.; Bach, J.; Domenech, C.; Zamorano, M.; Brusi, D.; et al. Nitrate pollution of groundwater; all right, but nothing else? Sci. Total Environ. 2016, 539, 241–251. [Google Scholar] [CrossRef] [PubMed]
- Verma, A.; Sharma, A.; Kumar, R.; Sharma, P. Nitrate contamination in groundwater and associated health risk assessment for Indo-Gangetic Plain, India. Groundw. Sustain. Dev. 2023, 23, 100978. [Google Scholar] [CrossRef]
- Ali, S.; Fakhri, Y.; Golbini, M.; Thakur, S.K.; Alinejad, A.; Parseh, I.; Shekhar, S.; Bhattacharya, P. Concentration of fluoride in groundwater of India: A systematic review, meta-analysis and risk assessment. Groundw. Sustain. Dev. 2019, 9, 100224. [Google Scholar] [CrossRef]
- Ali, S.; Shekhar, S.; Bhattacharya, P.; Verma, G.; Gurav, T.; Chandrashekhar, A.K. Elevated fluoride in groundwater of Siwani Block, Western Haryana, India: A potential concern for sustainable water supplies for drinking and irrigation. Groundw. Sustain. Dev. 2018, 7, 410–420. [Google Scholar] [CrossRef]
- Edmunds, W.M.; Smedley, P.L. Fluoride in natural waters. In Essentials of Medical Geology; Springer: Dordrecht, The Netherlands, 2012; pp. 311–336. [Google Scholar]
- Shen, Z.; Guo, H.; Xu, G.; Wang, C. Abnormal Groundwater Chemistry and Endemic Disease. Chin. J. Nat. 2010, 7, 83–89. (In Chinese) [Google Scholar]
- Li, P.; He, X.; Guo, W. Spatial groundwater quality and potential health risks due to nitrate ingestion through drinking water: A case study in Yan’an city on the loess plateau of northwest China. Hum. Ecol. Risk Assess. 2019, 25, 11–31. [Google Scholar] [CrossRef]
- Li, P.; He, X.; Li, Y.; Xiang, G. Occurrence and health implication of fluoride in groundwater of loess aquifer in the Chinese Loess Plateau: A case study of Tongchuan, Northwest China. Expo. Health 2019, 11, 95–107. [Google Scholar] [CrossRef]
- Li, Y.; Zhang, Z.; Fei, Y.; Chen, H.; Qian, Y.; Dun, Y. Investigation of quality and pollution characteristics of groundwater in the Hutuo River Alluvial Plain, North China Plain. Environ. Earth Sci. 2016, 75, 581. [Google Scholar] [CrossRef]
- Zhang, X.; He, J.; He, B.; Sun, J. Assessment, formation mechanism, and different source contributions of dissolved salt pollution in the shallow groundwater of Hutuo River alluvial-pluvial fan in the North China Plain. Environ. Sci. Pollut. Res. 2019, 26, 35742–35756. [Google Scholar] [CrossRef]
- Massmann, G.; Nogeitzig, A.; Taute, T.; Pekdeger, A. Seasonal and spatial distribution of redox zones during lake bank filtration in Berlin, Germany. Environ. Geol. 2007, 54, 53–65. [Google Scholar] [CrossRef]
- Yuan, J.; Dyke, M.I.V.; Huck, P.M. Water reuse through managed aquifer recharge (MAR): Assessment of regulations/guidelines and case studies. Water Pollut. Res. J. Can. 2016, 51, 357–376. [Google Scholar] [CrossRef]
- Cheng, Z.; Su, C.; Zheng, Z.; Chen, Z.; Wei, W. Characterize groundwater vulnerability to intensive groundwater exploitation using tritium time-series and hydrochemical data in Shijiazhuang, North China Plain. J. Hydrol. 2023, 603, 126953. [Google Scholar] [CrossRef]
- Yuan, R.; Wang, M.; Wang, S.; Song, X. Water transfer imposes hydrochemical impacts on groundwater by altering the interaction of groundwater and surface wate. J. Hydrol. 2020, 583, 124617. [Google Scholar] [CrossRef]
- Fu, J.; Zhang, L.; Liu, Z.; Yu, J. Study on the Sustainable Utilization of Groundwater Resources in Hebei Plain. Procedia Environ. Sci. 2021, 12, 1071–1076. [Google Scholar]
- Ganot, Y.; Holtzman, R.; Weisbrod, N.; Russak, A.; Katz, Y.; Kwtzman, D. Geochemical processes during managed aquifer recharge with desalinated seawater. Water Resour. Res. 2018, 54, 978–994. [Google Scholar] [CrossRef]
- Zhang, Q.; Wang, H.; Wang, L. Tracing nitrate pollution sources and transformations in the over-exploited groundwater region of north China using stable isotopes. J. Contam. Hydrol. 2018, 218, 1–9. [Google Scholar] [CrossRef]
- Zhang, Q.; Wang, H.; Wang, Y.; Yang, M.; Zhu, L. Groundwater quality assessment and pollution source apportionment in an intensely exploited region of northern China. Environ. Sci. Pollut. Res. 2017, 24, 16639–16650. [Google Scholar] [CrossRef]
- Su, X.; Xu, W.; Du, S. Responses of groundwater vulnerability to artificial recharge under extreme weather conditions in Shijiazhuang City, China. J. Water Supply Res. Technol. 2014, 63, 224–238. [Google Scholar] [CrossRef]
- Tian, X.; Meng, S.; Cui, X.; Zhang, X.; Zhang, Z.; Fei, Y. Hydrochemical Effect of Groundwater Recharge in Over-Exploited Area of Hutuo River Basin. Res. Environ. Sci. 2021, 34, 629–636. (In Chinese) [Google Scholar]
- Yan, M.; Wang, Q.; Tian, Y.; Wang, J.; Nie, Z.; Zhang, G. The dynamics and origin of groundwater salinity in the northeast Hufu Plain. Environ. Earth Sci. 2016, 75, 1154. [Google Scholar] [CrossRef]
- Wang, J.; Zhang, C.; Xiong, L.; Song, G.; Liu, F. Changes of antibiotic occurrence and hydrochemistry in groundwater under the influence of the South-to-North Water Diversion (the Hutuo River, China). Sci. Total Environ. 2022, 832, 154779. [Google Scholar]
- Zheng, Y.; Vanderzalm, J.; Hartog, N.; Escalante, E.F.; Stefan, C. The 21st century water quality challenges for managed aquifer recharge: Towards a risk-based regulatory approach. Hydrogeol. J. 2022, 31, 189. [Google Scholar] [CrossRef]
- Piper, A.M. A Graphic Procedure in the Geochemical Interpretation of Water Analysis; United States Department of the Interior, Geological Survey, Water Resources Division, Ground Water Branch: Washington, DC, USA; CRC Press: Boca Raton, FL, USA, 1953; p. 63. [Google Scholar]
- Horton, R.K. An index number system for rating water quality. J. Water Pollut. Control Fed. 1965, 37, 300–305. [Google Scholar]
- Amiri, V.; Rezaei, M.; Sohrabi, N. Groundwater quality assessment using entropy weighted water quality index (EWQI) in Lenjanat, Iran. Environ. Earth Sci. 2014, 72, 3479–3490. [Google Scholar] [CrossRef]
- Shannon, C.E. A mathematical theory of communication. Bell Syst. Tech. J. 1948, 27, 379–423. [Google Scholar] [CrossRef]
- Li, P.; Wu, J.; Tian, R.; He, S.; He, X.; Xue, C.; Zhang, K. Geochemistry, hydraulic connectivity and quality appraisal of multilayered groundwater in the Hongdunzi Coal Mine, Northwest China. Mine Water Environ. 2018, 37, 222–237. [Google Scholar] [CrossRef]
- Wang, D.; Wu, J.; Wang, Y.; Ji, Y. Finding high-quality groundwater resources to reduce the hydatidosis incidence in the Shiqu County of Sichuan Province, China: Analysis, assessment, and management. Expo. Health 2019, 12, 307–322. [Google Scholar] [CrossRef]
- Tian, R.; Wu, J. Groundwater quality appraisal by improved set pair analysis with game theory weightage and health risk estimation of contaminants for Xuecha drinking water source in a loess area in northwest China. Hum. Ecol. Risk Assess. 2019, 25, 176–190. [Google Scholar] [CrossRef]
- Wu, J.; Zhou, H.; He, S.; Zhang, Y. Comprehensive understanding of groundwater quality for domestic and agricultural purposes in terms of health risks in a coal mine area of the Ordos basin, north of the Chinese Loess Plateau. Environ. Earth Sci. 2019, 78, 446. [Google Scholar] [CrossRef]
- Lin, X.; Yang, A.; Chen, F. Measurement and evaluation of residual disinfection by products in tap water from Xiamen. IOP Conf. Ser. Earth Environ. Sci. 2018, 146, 012015. [Google Scholar]
- Zhang, Y.; Wu, J.; Xu, B. Human health risk assessment of groundwater nitrogen pollution in Jinghui canal irrigation area of the loess region, northwest China. Environ. Earth Sci. 2018, 77, 273. [Google Scholar] [CrossRef]
- Chen, J.; Wu, H.; Qian, H. Groundwater nitrate contamination and associated health risk for the rural communities in an agricultural area of Ningxia, Northwest China. Expo. Health 2016, 8, 349–359. [Google Scholar] [CrossRef]
- Adimalla, N.; Venkatayogi, S. Mechanism of fluoride enrichment in groundwater of hard rock aquifers in Medak, Telangana State, South India. Environ. Earth Sci. 2017, 76, 45. [Google Scholar] [CrossRef]
- Odiyo, J.O.; Makungo, R. Chemical and microbial quality of groundwater in siloam village, implications to human health and sources of contamination. Int. J. Environ. Res. Public Health 2018, 15, 317. [Google Scholar] [CrossRef]
- Fordyce, F.M.; Vrana, K.; Zhovinsky, E.; Povoroznuk, V.; Toth, G.; Hope, B.C.; Iljinsky, U.; Baker, J. A health risk assessment for fluoride in central Europe. Environ. Geochem. Health 2007, 29, 83–102. [Google Scholar] [CrossRef]
- He, X.; Li, P. Surface water pollution in the middle Chinese Loess Plateau with special focus on hexavalent chromium (Cr6+): Occurrence, sources and health risks. Expo. Health 2020, 12, 385–401. [Google Scholar] [CrossRef]
- Duan, R.; Li, P.; Wang, L.; He, X.; Zhang, L. Hydrochemical characteristics, hydrochemical processes and recharge sources of the geothermal systems in Lanzhou City, northwestern China. Urban Clim. 2022, 43, 101152. [Google Scholar] [CrossRef]
- Bekele, E.; Zhang, Y.; Donn, M.; McFarlane, D. Inferring groundwater dynamics in a coastal aquifer near wastewater infiltration ponds and shallow wetlands (Kwinana, Western Australia) using combined hydrochemical, isotopic and statistical approaches. J. Hydrol. 2019, 568, 1055–1070. [Google Scholar] [CrossRef]
- Wang, Z.; Yin, J.; Pu, J.; Wang, P.; Liang, X.; Yang, P.; He, Q.; Gou, P.; Yuan, D. Integrated understanding of the Critical Zone processes in a subtropical karst watershed (Qingmuguan, Southwestern China): Hydrochemical and isotopic constraints. Sci. Total Environ. 2020, 749, 141257. [Google Scholar] [CrossRef]
- Liu, J.; Gao, Z.; Wang, Z.; Xu, X.; Su, Q.; Wang, S.; Qu, W.; Xing, T. Hydrogeochemical processes and suitability assessment of groundwater in the Jiaodong Peninsula, China. Environ. Monit. Assess. 2020, 192, 17. [Google Scholar] [CrossRef] [PubMed]
- Wu, J.; Li, P.; Qian, H.; Duan, Z.; Zhang, X. Using correlation and multivariate statistical analysis to identify hydrogeochemical processes affecting the major ion chemistry of waters: A case study in Laoheba phosphorite mine in Sichuan, China. Arab. J. Geosci. 2014, 7, 3973–3982. [Google Scholar] [CrossRef]
- Guo, X.; Zuo, R.; Wang, J.; Meng, L.; Teng, Y.; Shi, R.; Gao, X.; Ding, F. Hydrogeochemical Evolution of Interaction Between Surface Water and Groundwater Affected by Exploitation. Groundwater 2019, 57, 430–442. [Google Scholar] [CrossRef]
- Han, Y.; Zhai, Y.; Guo, M.; Cao, X.; Lu, H.; Li, J.; Wang, S.; Yue, W. Hydrochemical and isotopic characterization of the impact of water diversion on water in drainage channels, groundwater, and Lake Ulansuhai in China. Water 2021, 13, 3033. [Google Scholar] [CrossRef]
- Gibbs, R.J. Mechanisms controlling world water chemistry. Science 1970, 170, 1088–1090. [Google Scholar] [CrossRef] [PubMed]
- Pant, R.R.; Zhang, F.; Rehman, F.U.; Wang, G.; Ye, M.; Zeng, C.; Tang, H. Spatiotemporal variations of hydrogeochemistry and its controlling factors in the Gandaki River Basin, Central Himalaya Nepal. Sci. Total Environ. 2018, 622–623, 770–782. [Google Scholar] [CrossRef]
- Su, H.; Kang, W.; Xu, Y.; Wang, J. Assessing groundwater quality and health risks of nitrogen pollution in the Shenfu mining area of Shaanxi Province, northwest China. Expo. Health 2018, 10, 77–97. [Google Scholar] [CrossRef]


| EWQI | Rank | Water Quality |
|---|---|---|
| <25 | 1 | Excellent quality |
| 25–50 | 2 | Good quality |
| 50–100 | 3 | Medium quality |
| 100–150 | 4 | Poor quality |
| >150 | 5 | Extremely poor quality |
| Time | Index | K+ | Na+ | Ca2+ | Mg2+ | Cl− | SO42− | HCO3− | NO3− | F− | NO2− | Al | As | Zn | TDS | pH |
|---|---|---|---|---|---|---|---|---|---|---|---|---|---|---|---|---|
| October 2019 | Maximum | 7.69 | 337.6 | 81.69 | 689.4 | 653.6 | 1863 | 707.8 | 149.5 | 0.65 | 3.81 | ND | ND | ND | 3394.58 | 7.5 |
| Minimum | 1.52 | 73.64 | 21.75 | 26.81 | 20.26 | 116.5 | 245.7 | 1.65 | 0.27 | ND | ND | ND | ND | 510.61 | 7 | |
| Medium | 3.27 | 135.3 | 41.08 | 63.41 | 71.29 | 266 | 344.75 | 12.49 | 0.41 | 0.094 | ND | ND | ND | 947.91 | 7.25 | |
| Average | 3.84 | 145.1 | 42.69 | 134.51 | 137.23 | 378.6 | 352.79 | 35.51 | 0.41 | 0.43 | ND | ND | ND | 1093.04 | 7.25 | |
| Coefficient of Variation | 0.45 | 0.42 | 0.32 | 1.22 | 1.26 | 1.06 | 0.31 | 1.22 | 0.23 | 2.15 | ND | ND | ND | 0.59 | 0.019 | |
| April 2020 | Maximum | 6.48 | 545 | 209 | 73.1 | 505 | 1067 | 647 | 147 | 0.88 | 0.99 | 0.048 | 0.0048 | ND | 2425 | 8.2 |
| Minimum | 1.65 | 24.6 | 70.8 | 23.9 | 18.3 | 97.9 | 236 | 0 | 0.22 | ND | 0.012 | ND | ND | 357 | 6.7 | |
| Medium | 3.17 | 48.05 | 134 | 39.1 | 75.8 | 209 | 331 | 27.15 | 0.35 | 0.0047 | 0.018 | ND | ND | 818.5 | 7.59 | |
| Average | 3.39 | 115.24 | 133.46 | 42.55 | 116.83 | 269.49 | 342.63 | 40.74 | 0.38 | 0.088 | 0.023 | 0.00044 | ND | 893.13 | 7.5 | |
| Coefficient of Variation | 0.36 | 1.15 | 0.31 | 0.33 | 1.05 | 0.81 | 0.31 | 1.05 | 0.44 | 2.7 | 0.43 | 2.83 | ND | 0.53 | 0.049 | |
| October 2020 | Maximum | 6.13 | 250 | 383.3 | 85.69 | 568.6 | 620.8 | 508.3 | 134.6 | 0.61 | 0.073 | 0.08 | ND | ND | 1694.32 | 7.77 |
| Minimum | 1.67 | 69.25 | 26.42 | 23.95 | 19.6 | 61.35 | 213.8 | 1.44 | 0.11 | ND | ND | ND | ND | 402.05 | 7.04 | |
| Medium | 2.4 | 119.25 | 48.82 | 39.68 | 58.02 | 214.4 | 303.35 | 10.9 | 0.32 | ND | ND | ND | ND | 816.86 | 7.34 | |
| Average | 2.69 | 135.06 | 100.55 | 44.52 | 120.2 | 257.77 | 315.975 | 31.58 | 0.33 | 0.0078 | 0.01 | ND | ND | 888.18 | 7.38 | |
| Coefficient of Variation | 0.41 | 0.37 | 0.97 | 0.38 | 1.29 | 0.55 | 0.24 | 1.22 | 0.48 | 2.43 | 2.64 | ND | ND | 0.37 | 0.029 | |
| October 2021 | Maximum | 4.85 | 364.6 | 234.1 | 66.83 | 589.7 | 824.2 | 517 | 88.96 | 1.59 | 0.094 | 0.36 | ND | 0.13 | 1972.74 | 9.5 |
| Minimum | 1.69 | 8.46 | 18.03 | 9 | 6.83 | 32.06 | 129.2 | 1.6 | 0 | ND | ND | ND | ND | 149.37 | 7.42 | |
| Medium | 2.39 | 43.22 | 116.2 | 32.97 | 47.78 | 169.6 | 377.5 | 11.36 | 0.15 | ND | ND | ND | ND | 830.51 | 7.83 | |
| Average | 2.87 | 93.97 | 125.96 | 34.23 | 119.33 | 249.82 | 346.31 | 28.52 | 0.26 | 0.023 | 0.061 | ND | 0.018 | 878.05 | 7.94 | |
| Coefficient of Variation | 0.31 | 1.07 | 0.48 | 0.45 | 1.28 | 0.93 | 0.33 | 1.03 | 1.59 | 1.31 | 1.81 | ND | 2.14 | 0.62 | 0.061 | |
| River Water | Maximum | 12.2 | 81.4 | 108.4 | 35.6 | 114 | 249 | 196.8 | 20.92 | 0.38 | 0.079 | 0.061 | ND | ND | 507 | 8.17 |
| Minimum | 4.06 | 29.84 | 55.2 | 20.9 | 28.75 | 107 | 82 | 1.05 | 0.19 | ND | 0.017 | ND | ND | 148 | 7.88 | |
| Medium | 4.515 | 48.98 | 82.33 | 22.46 | 51.8 | 199.35 | 170.75 | 8.18 | 0.32 | 0.019 | 0.045 | ND | ND | 454.5 | 7.94 | |
| Average | 6.32 | 52.3 | 82.06 | 25.35 | 61.58 | 188.67 | 155.07 | 9.58 | 0.3 | 0.029 | 0.042 | ND | ND | 391 | 7.98 | |
| Coefficient of Variation | 0.53 | 52.3 | 0.25 | 0.23 | 0.52 | 0.28 | 0.29 | 0.85 | 0.25 | 1.03 | 0.41 | ND | ND | 0.37 | 0.014 |
| Time | October 2019 | April 2020 | October 2020 | October 2021 | ||||||||
|---|---|---|---|---|---|---|---|---|---|---|---|---|
| ID | EWQI | Rank | Water Quality | EWQI | Rank | Water Quality | EWQI | Rank | Water Quality | EWQI | Rank | Water Quality |
| HTHG01 | 30.41 | 2 | Good quality | 24.69 | 1 | Excellent quality | 20.35 | 1 | Excellent quality | 19.04 | 1 | Excellent quality |
| HTHG02 | 17.87 | 1 | Excellent quality | 19.56 | 1 | Excellent quality | 14.31 | 1 | Excellent quality | 16.88 | 1 | Excellent quality |
| HTHG03 | 13.12 | 1 | Excellent quality | 9.34 | 1 | Excellent quality | 19.12 | 1 | Excellent quality | 9.95 | 1 | Excellent quality |
| HTHG04 | 16.58 | 1 | Excellent quality | 12.17 | 1 | Excellent quality | 21.45 | 1 | Excellent quality | 8.48 | 1 | Excellent quality |
| HTHG06 | 13.71 | 1 | Excellent quality | 9.50 | 1 | Excellent quality | 13.31 | 1 | Excellent quality | 26.30 | 2 | Good quality |
| HTHG07 | 9.14 | 1 | Excellent quality | 5.84 | 1 | Excellent quality | 11.01 | 1 | Excellent quality | 7.51 | 1 | Excellent quality |
| HTHG08 | 48.87 | 2 | Good quality | 46.90 | 2 | Good quality | 29.45 | 2 | Good quality | 11.99 | 1 | Excellent quality |
| HTHG09 | 33.2 | 2 | Good quality | 29.71 | 1 | Excellent quality | 25.79 | 2 | Good quality | 46.66 | 2 | Good quality |
| HTHG10 | 17.15 | 1 | Excellent quality | 10.85 | 1 | Excellent quality | 22.45 | 1 | Excellent quality | 14.39 | 1 | Excellent quality |
| HTHG11 | 18.69 | 1 | Excellent quality | 21.74 | 1 | Excellent quality | 14.53 | 1 | Excellent quality | 17.09 | 1 | Excellent quality |
| HTHG13 | 23.03 | 1 | Excellent quality | 26.07 | 2 | Good quality | 30.40 | 2 | Good quality | 12.70 | 1 | Excellent quality |
| HTHG14 | 31.51 | 2 | Good quality | 39.59 | 2 | Good quality | 33.22 | 2 | Good quality | 21.60 | 1 | Excellent quality |
| HTHG15 | 24.25 | 1 | Excellent quality | 17.79 | 1 | Excellent quality | 23.86 | 1 | Excellent quality | 20.16 | 1 | Excellent quality |
| HTHG16 | 23.84 | 1 | Excellent quality | 17.59 | 1 | Excellent quality | 19.97 | 1 | Excellent quality | 40.35 | 2 | Good quality |
| HTHG17 | 17.22 | 1 | Excellent quality | 27.30 | 1 | Excellent quality | 15.65 | 1 | Excellent quality | 31.13 | 2 | Good quality |
| HTHG18 | 84.18 | 3 | Medium quality | 53.85 | 3 | Medium quality | 40.41 | 2 | Good quality | 48.12 | 2 | Good quality |
| River Water | 22.71 | 1 | Excellent quality | 19.20 | 1 | Excellent quality | 5.40 | 1 | Excellent quality | 15.25 | 1 | Excellent quality |
Disclaimer/Publisher’s Note: The statements, opinions and data contained in all publications are solely those of the individual author(s) and contributor(s) and not of MDPI and/or the editor(s). MDPI and/or the editor(s) disclaim responsibility for any injury to people or property resulting from any ideas, methods, instructions or products referred to in the content. |
© 2023 by the authors. Licensee MDPI, Basel, Switzerland. This article is an open access article distributed under the terms and conditions of the Creative Commons Attribution (CC BY) license (https://creativecommons.org/licenses/by/4.0/).
Share and Cite
Zhang, R.; Zhang, B.; Guo, Y.; Kong, X.; Li, Y.; Liu, Y.; Chen, L.; Gong, Q. Replenishment Impacts on Hydrogeochemistry and Water Quality in the Hutuo River Plain. Water 2023, 15, 3326. https://doi.org/10.3390/w15193326
Zhang R, Zhang B, Guo Y, Kong X, Li Y, Liu Y, Chen L, Gong Q. Replenishment Impacts on Hydrogeochemistry and Water Quality in the Hutuo River Plain. Water. 2023; 15(19):3326. https://doi.org/10.3390/w15193326
Chicago/Turabian StyleZhang, Ruolin, Baoyun Zhang, Yuntong Guo, Xiangke Kong, Yasong Li, Yaci Liu, Lining Chen, and Qiuli Gong. 2023. "Replenishment Impacts on Hydrogeochemistry and Water Quality in the Hutuo River Plain" Water 15, no. 19: 3326. https://doi.org/10.3390/w15193326