Article

Measurement of Green Water Resource Utilization Efficiency for Carbon Neutrality: A Multiple Water Use Sectoral Perspective Considering Carbon Emission

1
School of Water Conservancy and Transportation, Zhengzhou University, Zhengzhou 450001, China
2
Henan International Joint Laboratory of Water Cycle Simulation and Environmental Protection, Zhengzhou 450001, China
*
Author to whom correspondence should be addressed.
Water 2023, 15(18), 3312; https://doi.org/10.3390/w15183312
Submission received: 29 August 2023 / Revised: 15 September 2023 / Accepted: 18 September 2023 / Published: 20 September 2023
(This article belongs to the Special Issue China Water Forum 2023)

Abstract

:
Green and high-efficiency water resource utilization patterns hold paramount importance in promoting sustainable economic and social development, as well as in attaining the goal of carbon neutrality. Most research on water utilization efficiency have taken a general perspective to quantify it, neglecting independent relationships and green effects among water use sectors. This study proposed an integrated measurement model of green water resource utilization efficiency (GWRUE), combined with the carbon dioxide emission equivalent analysis method of water resource behaviors, and constructed an input–output indicator system of GWRUE from four dimensions: domestic, industrial, agricultural, and ecological water. The aim is to achieve the measurement of GWRUE towards carbon neutrality. In this paper, 18 cities in Henan Province were used as instances to carry out the study. The results show that (1) The CO2 emission equivalent from multiple water use sectors in Henan Province showed a tendency of fluctuating reduction during the study period, from a peak of 21,090,100 tons in 2012 to a low of 12,351,900 tons in 2021, with large spatial variations, and the CO2 emission effect existed in most cities, with Zhengzhou being the highest. (2) The GWRUE of domestic, industrial, and agricultural water in Henan Province and 18 cities exhibited an overall upward trend, while that of ecological water presented a downward trend and was at the lowest level among the four sectors. (3) Consolidated GWRUE in Henan Province tended to decrease and then increase; its value was 0.512 in 2011, 0.448 in 2017, and 0.586 in 2021, and most of its cities were at a Medium level. The findings of this study can serve as a theoretical and practical basis for improving the level of green and efficient utilization of water resources, as well as offer references for relevant water use sectors to formulate CO2 emission reduction policies.

1. Introduction

Since the industrial revolution, fast economic and social development has caused a dramatic increase in water consumption and CO2 emissions, and the problems of global warming [1] and water scarcity [2] are increasingly serious, presenting a formidable challenge to the continued existence and progress of human society. In March 2020, a research report by the United Nations Meteorological Department revealed that global water consumption had undergone a staggering 6-fold increase over the past century and was still accelerating at a rate of about 1 percent per year. In addition, the global water crisis would further worsen due to global warming, and the report estimated that over half of the global population may encounter water scarcity by 2050 [3]. Currently, global warming and water scarcity have become the most preoccupying topics worldwide [4], and how to improve water resource utilization efficiency (WRUE) and reduce CO2 emissions (CE) are critical scientific issues that human society needs to face [5].
In previous years, these two major problems had been somewhat neglected. Nevertheless, with the convening of the United Nations World Summit on Sustainable Development in 2002 [6], the issues of water scarcity and environmental change gradually began to be taken into account. In particular, China made a strategic decision in 2012 to actively advance the formation of an ecological civilization. Then, in 2015, China released the “Guidelines for Accelerating the Advancement of Ecological Civilization Construction”, which insisted on green, recycling-focused, and low-carbon development, and energetically promoted water resource recycling and reduced CE. It was mandated to achieve a decrease of 40 to 45 percent in CO2 emission intensity per unit of GDP compared to the levels in 2005, and for total water consumption to be controlled at less than 670 billion m3 [7]. Water conservation and the reduction of CO2 have emerged as some of the most important tasks in China. However, China’s economic and social development is still limited by water scarcity, inefficient water use, and excessive CO2 emissions. In recent years, China’s per capita water resource consumption was less than 1/3 of the world’s level, and nearly 2/3 of China’s cities had various degrees of water shortage [8,9]. Yet, its average annual CO2 emissions were approximately 10 billion tons, accounting for about 30% of global emissions [10]. Water resources are an indispensable material basis for the sustainable progress of human society, and their sustainable utilization has a tremendous influence on the future of a country. CO2 is a key factor affecting climate warming, and its excess emissions are exacerbating water scarcity while contributing to global warming. Therefore, under the requirements of sustainable development in the new era, measuring green water resource utilization efficiency (GWRUE) oriented towards carbon neutrality not only enables the formulation of reasonable measures in water conservation and CO2 emissions reduction but also has a great theoretical and practical meaning for promoting sustainable development, protecting the ecological environment as well as safeguarding the survival and development of human beings.
To tackle the problem of water scarcity under the impact of climate change, academics have carried out abundant research on WRUE in recent years. The relevant research methods have mainly involved multi-indicator integrated evaluation [11], stochastic frontier analysis (SFA) [12], and data envelopment analysis (DEA) [13], among which DEA is the most widely applied. The following are common DEA models: the slack-based measure (SBM) model [14], the epsilon-based measure (EBM) model [15], and so on. These studies mainly include the measurement of WRUE from a macro-integral and sub-sectoral perspective. From a macro-integral perspective, for instance, Deng et al. [16] and Chen et al. [17] measured the WRUE of 31 provinces in mainland China by using the SBM and EBM models, respectively. Filippini et al. [18] adopted SFA to measure WRUE in Slovenia and comparatively analyzed inter-regional differences. From a sub-sectoral view, for example, Kaneko et al. [19] measured agricultural WRUE in China based on the SFA model. Alsharif et al. [20] evaluated the efficiency of urban domestic water use in developed western countries and the Gaza Strip using the DEA model. Yang et al. [21] gauged China’s industrial WRUE based on the SBM model. After that, with the continuous proposal of green development indicators [22], sustainable development goals [23,24], and water conservation programs [25], GWRUE [26] gradually turned into a spotlight of scholars’ research. In terms of measuring GWRUE from a macro-integral standpoint, Zhou et al. [27] applied a two-stage SBM model considering wastewater discharge to measure China’s GWRUE. Song et al. [28] used the DEA model with chemical oxygen demand (COD) emissions as undesirable outputs (UDO) to measure the water resource efficiency of Chinese provinces under environmental constraints, and the results demonstrated that GWRUE was unsatisfactory with significant inter-provincial variations. Zhang et al. [29] incorporated total wastewater discharge as UDO into the Super-SBM model as a way to estimate the GWRUE of 21 cities in Guangdong Province. Huang et al. [30], using wastewater discharge and COD emissions as UDOs, used the SBM model to gauge the GWRUE of 11 regions in the Yangtze River Economic Belt, which displayed a diminishing trend in general. In terms of a sub-sectoral perspective, Xu et al. [31] calculated the industrial WRUE in China using a four-stage DEA model which considered COD and NH3-N emissions, and it was found that industrial WRUE was less affected by pollutant discharge in the eastern regions and more seriously affected in the central regions. Based on China’s provincial panel data from 2004–2016, Liu et al. [32] introduced industrial blue water and gray water footprints as UDO indicators, and the industrial GWRUE was measured by using the EBM model, which indicated that there were obvious differences in efficiency among various provinces in China and that environmental regulations had a certain influence on the efficiency. Regarding COD, NH3-N, and total agricultural CO2 emissions as environmental constraints, Huang et al. [33] used the Super-SBM model to assess agricultural WRUE in various regions of China. Based on the agricultural gray water footprint and total CO2 emissions, Xu et al. [34] used the Super-SBM model to calculate the GWRUE of agriculture in China, which indicated that it presented a decreasing and then an increasing trend.
In summary, most of the current studies only consider indicators relating to wastewater discharge as undesirable outputs to measure GWRUE, and fewer studies regard CE from water use behaviors as UDO indicators. However, in real-world production and living activities, there exists an intimate relationship between water use and CO2 emission. Many scholars have conducted targeted research on this issue. For instance, Duan et al. [35] investigated the water–energy–carbon emission correlations in Beijing based on an input–output and material flow analysis approach. CO2 emissions from supply and wastewater systems were calculated using CO2 emission factors for the Mexican electricity sector by Valek et al. [36]. Zuo et al. [37] accounted for the carbon dioxide emission equivalent of various water resource behaviors based on the carbon dioxide emission equivalent analysis (CEEA) method. It is clear that the water use process is inevitably accompanied by CO2 emissions. Furthermore, it was also addressed in the global indicator framework for the Sustainable Development Goals [23,24] and in China’s green development indicators system [22]. Thus, it is necessary to include CE in the indicators system to measure GWRUE. Moreover, most of the related studies adopt total-type indicators, such as total CO2 emissions, which cannot accurately represent the CE generated from water use, leading to imprecise efficiency results. On the other hand, the majority of studies measure GWRUE only from a macro-integral or sub-sectoral perspective, while few researchers integrate the measurement of consolidated green water resource utilization efficiency (CGWRUE) from various water use sectors. Further onwards, in terms of sub-sectors, research has mainly focused on industrial green water resource utilization efficiency (IGWRUE) and agricultural green water resource utilization efficiency (AGWRUE). There are relatively few investigations on domestic green water resource utilization efficiency (DGWRUE) and ecological green water resource utilization efficiency (EGWRUE).
To account for the above problems, under the guidance of the concept of sustainable development, this study proposed an integrated measurement model of GWRUE which could more appropriately reflect the level of various water use sectors and the CGWRUE. Meanwhile, we constructed the multiple water use sectoral GWRUE input–output indicator system, serving as an integrated measurement model based on four dimensions of domestic, agricultural, industrial, and ecological water. CO2 emissions or absorption from water use processes were also regarded as undesirable or desirable output indicators embedding in it. Eventually, a case study was implemented using Henan Province and the 18 cities under its jurisdiction as the study area. Compared with previous related studies [27,28,29,30,31,32,33,34], the main innovations of this paper included the following three aspects: (1) The input–output indicators system of GWRUE was constructed from the domestic, industrial, agricultural, and ecological water use sectors. (2) More refined CO2 indicators for different water use sectors were calculated, replacing the overall CO2 indicator in the traditional study to improve the accuracy of the measurement of GWRUE. (3) The GWRUE of various sectors was measured from the perspectives of four subsectors, and an integrated measurement model for GWRUE was proposed. The study aims to provide some sense of practical reference value for the water use industry to improve water utilization efficiency and reduce CO2 emissions, which further facilitates the water resource field to promote the carbon neutrality goal.

2. Methodology

2.1. Integrated Measurement Model for GWRUE

The traditional DEA model, being a radial and angular measure, fails to take into account the slack in the input–output variables. To modify this problem, Tone [14] proposed the SBM model. But when several Decision-Making Units (DMUs) simultaneously reached the effective state, it was not feasible for the SBM model to further compare the level of efficiency among effective DMUs. As a result, in 2002, Tone formulated the super-efficiency SBM model [38] that was capable of differentiating between efficient DMUs while ensuring that slack variables were under consideration. In the meantime, considering that input factors were the fundamental variables determining urban development and also had a certain impact on the number of outputs [39], this paper adopted the input-oriented super-efficiency SBM model, including undesirable outputs to measure GWRUE in the four water use sectors. The modeling formula is as follows [40]:
min ρ t = 1 + 1 m i = 1 m S i x i k 1 1 c 1 + c 2 ( p = 1 c 1 S p + y p k + q = 1 c 2 S q y q k )
s . t . { j = 1 , j k n x i j λ j S i x i k j = 1 , j k n y p j λ j + S p + y p k j = 1 , j k n y q j λ j S q y q k [ 1 1 c 1 + c 2 ( p = 1 c 1 S p + y p k + q = 1 c 2 S q y q k ) ] > 0 j = 1 , j k n λ j = 1 λ j , S i , S p + , S q 0
where ρ t is GWRUE, t stands for the water use sector; n is the number of DMUs, which here means the number of cities; each DMU contains m inputs, c1 desirable outputs (DO), and c2 undesirable outputs (UDO); S i , S p + , S q are, respectively, the i-th slack variable for inputs, the p-th slack variable for DO, and the q-th slack variable for UDO; x i k , y p k , y q k are the i-th input variable, the p-th DO variable, and the q-th UDO variable of the k-th DMU, respectively; λ j is the weight coefficient of the j-th DMU. Of these, i = 1, 2, …, m; j = 1, 2, …, n; p = 1, 2, …, c1; q = 1, 2, …, c2.
The domestic, industrial, agricultural, and ecological GWRUE values measured via the super-efficiency SBM model were intended to symbolize the relative efficiency levels of individual water use sectors, but they could not represent the comprehensive level of a region. Thus, in this paper, the GWRUE results of the four water use sectors were integrated to calculate the CGWRUE using a weighted summation approach. The calculation formula is as follows:
C G W R U E = ω d ρ d + ω g ρ g + ω a ρ a + ω s ρ s
where CGWRUE is consolidated green water resource utilization efficiency; ρ d , ρ g , ρ a , and ρ s are DGWRUE, IGWRUE, AGWRUE, and EGWRUE, respectively; ω d , ω g , ω a , ω s are the corresponding weights. Here, since 4 sectors are of equal emphasis, the weight is initially set to 1/4.
To distinguish the efficiency level more clearly, referring to the related research [33], the GWRUE was subjectively classified into 6 levels and grades according to the size of the efficiency value (Table 1).

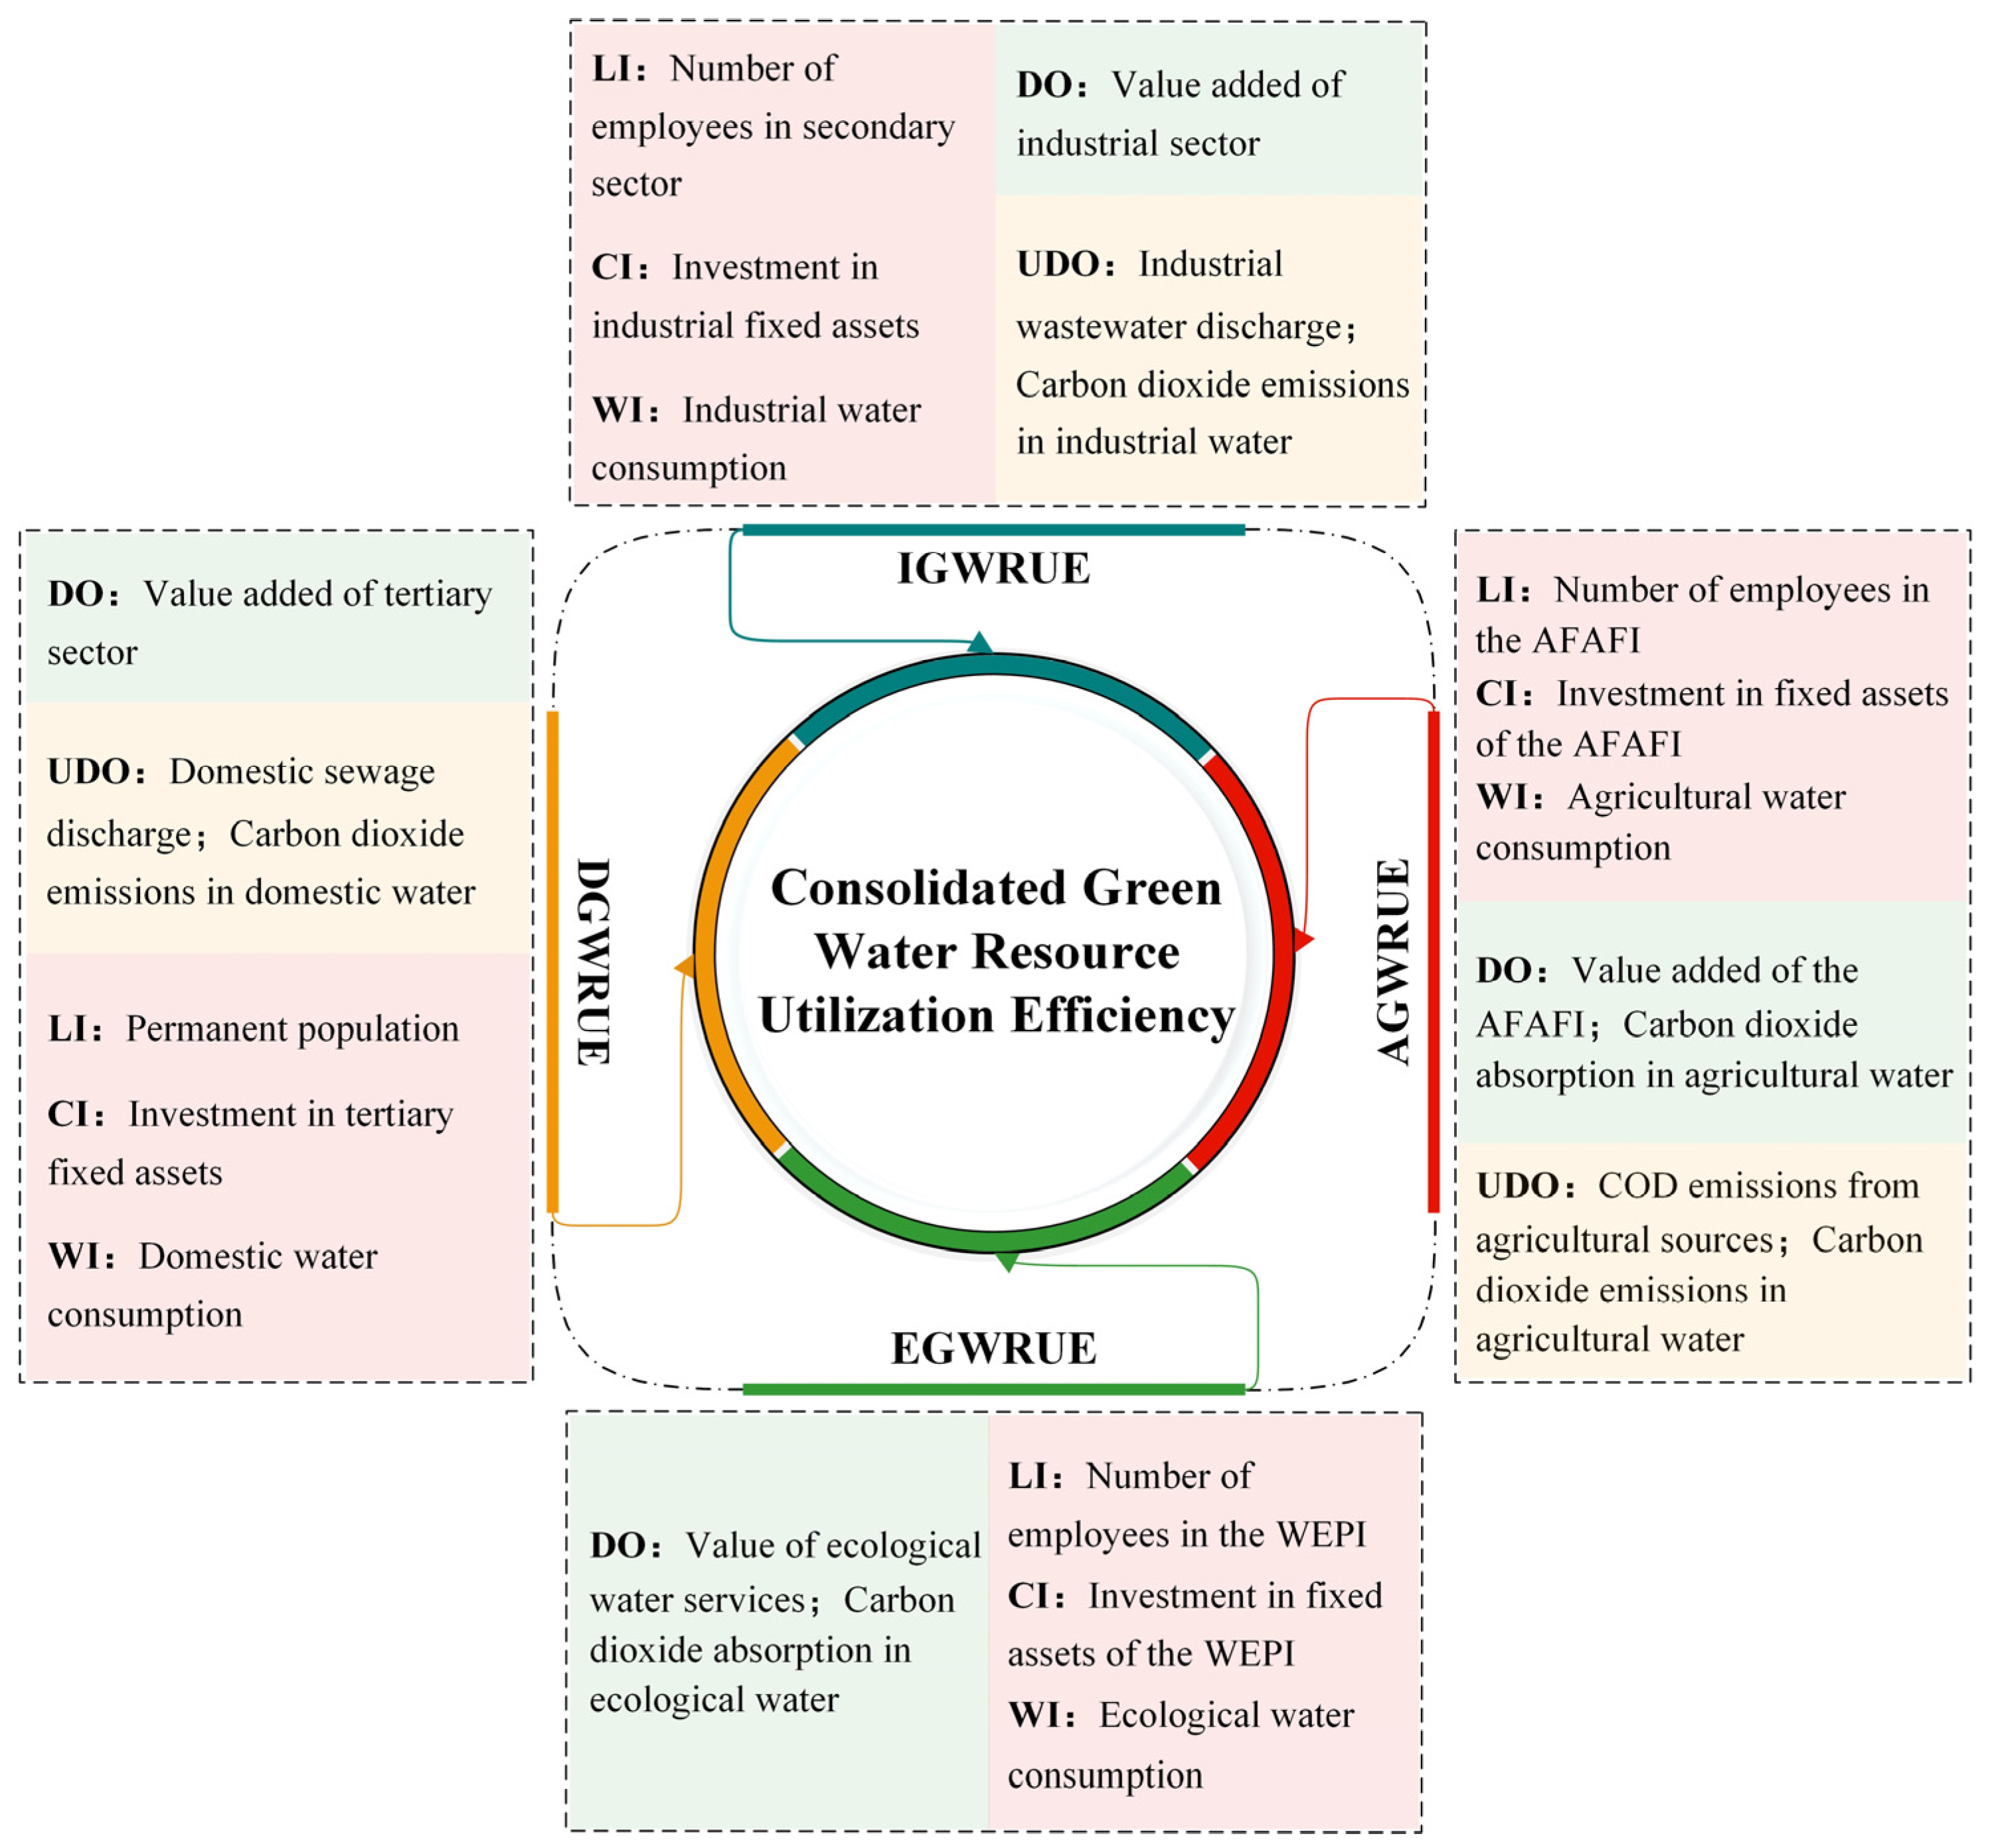
2.2. Input–output Indicator System for GWRUE in Multiple Water Use Sectors

In most studies, when constructing the input–output indicator system for WRUE, the selection of indicators has the same rationale, that is, under the precondition of considering the fundamental production factors such as resources, labor, and capital, it pursues the maximum of DOs, such as economic benefits, and the minimum of UDOs, such as wastewater and exhaust emissions. At present, however, most studies only consider the perspective of the total quantity, for example, selecting total water consumption as an input indicator, total GDP as the DO indicator, and total sewage discharge as the UDO indicator. Yet, these total-type indicators involve excessive and complex economic and social factors, which cannot reflect the level of GWRUE appropriately. On the other hand, few studies have included CO2-related indicators in the GWRUE indicator system. Additionally, only the total CO2 emissions of an entire sector or industry are regarded as an indicator of UDO, such as the total CO2 emissions from industry or agriculture. However, they do consider CE from other productive or living activities in the sector that are unrelated to water use, which could not be used with relative accuracy to measure the GWRUE.
With regard to the research objectives of this paper, based on reference to relevant research findings, and taking into account economic benefits, environmental protection, green development, sustainable utilization of resources, etc., we constructed a multiple water use sectoral GWRUE input–output indicator system (Figure 1) from four water use sectors, namely, domestic, industrial, agricultural, and ecological water, which incorporate the CO2 absorption (CA) or emissions of different water use sectors as DO or UDO indicators, respectively. What is necessary to note here is that the land associated with ecological water has a certain service value [41], which is defined as the value of ecological water services in this paper. It was calculated following the Technical Guideline on Gross Ecosystem Product [42], which was then considered as the DO indicator to reflect the economic benefits output of ecological water.

2.3. Methods of Accounting for CO2 Emission in Multiple Water Use Sectors

In terms of CO2 emission studies in the water use sectors, the CEEA method provided a relatively completed function table [37], which could be used to quantify the CO2 emission or absorption effects of different water resource behaviors, either directly or indirectly. Therefore, in this paper, the function formulas of four behaviors of domestic, industrial, agricultural, and ecological water use were selected from them, respectively, to account for the CE or CA of various water use sectors. Based on them, CO2 emission equivalent from multiple water use sectors (WCEE) was further calculated.
(1)
The formula for calculating CO2 emissions in domestic water (DWCE) is as follows [37]:
E d = E h + E p
E h = Q h × E I h × E F
E p = Q p × E I p × E F
E I h = ρ × C w × 1 / η × ( R h 1 × Δ T 1 + R h 2 × Δ T 2 )
E F = i ( F C i , y × N C V i , y × E F C O 2 , i , y ) E G y
where E d is DWCE, kg; E h , Q h , E I h are CE, water consumption, and energy intensity of household water, and their unit is, respectively, kg, m3, kW·h/m3; E p , Q p , E I p stand for public water with related symbols, as well as their unit is kg, m3, kW·h/m3, separately; E F is the CO2 emission coefficient of the power system, kg/kW·h; ρ is the water’s density, kg/m3; C w is the water’s specific heat capacity, kWh/(kg·°C); η is the efficiency of heating equipment; R h 1 is the ratio of water for cooking and drinking purposes, R h 2 is the ratio of water used for bathing, Δ T 1 and Δ T 2 are the temperature differential before and after the heating process of the two, respectively, °C; E G y is the cumulative net power generation of during the power system the calculation period y, kW·h; F C i , y , N C V i , y , and E F C O 2 , i , y are the total consumption, the average low-level heat production, and the CO2 emission factor of fuel i in the calculation period y, and their unit is mass or volume units, GJ/mass or volume units, and kgCO2/GJ, respectively.
(2)
The formula for calculating CO2 emissions in industrial water (IWCE) is as follows [37]:
E g = Q g × E I g × E F
where E g is IWCE, kg; Q g is water consumption in industry, m3; E I g is energy intensity of industrial water, kW·h/m3.
(3)
The formulas for calculating CO2 emissions in agricultural water (AWCE) and CO2 absorption in agricultural water (AWCA) are as follows [37]:
E a e = A × W e × 44 12
E a a = ω × A × W a × 44 12
where E a e and E a a are AWCE and AWCA, separately, kg; A is the actual irrigated area for agriculture, ha; W e and W a are the coefficient of CO2 emission and absorption per unit area of irrigated land, t/ha; ω is a weighting factor and is set to 1/3, which is because the three elements of sunlight, water, and fertilizer are equally important to the process of crop growth.
(4)
The formula for calculating CO2 absorption in ecological water (EWCA) is as follows [37]:
E s = s = 1 4 A s × W s × 44 12
where E s is EWCA, kg; A s and W s are the area and CO2 absorption coefficient of the sth type of ecologically watered land, and their unit is hm2 and t/hm2, respectively. Here, the land is mainly considered as land types associated with artificial ecological water [43,44], including urban gardens, urban green spaces, jurisdictional wetlands, and watersheds.
(5)
The formula for calculating multiple water use sectoral WCEE is as follows:.
E w = E d + E g + E a e + E a a + E s
where E w is multiple water use sectoral WCEE, kg.

3. Overview of the Study Area and Data Source

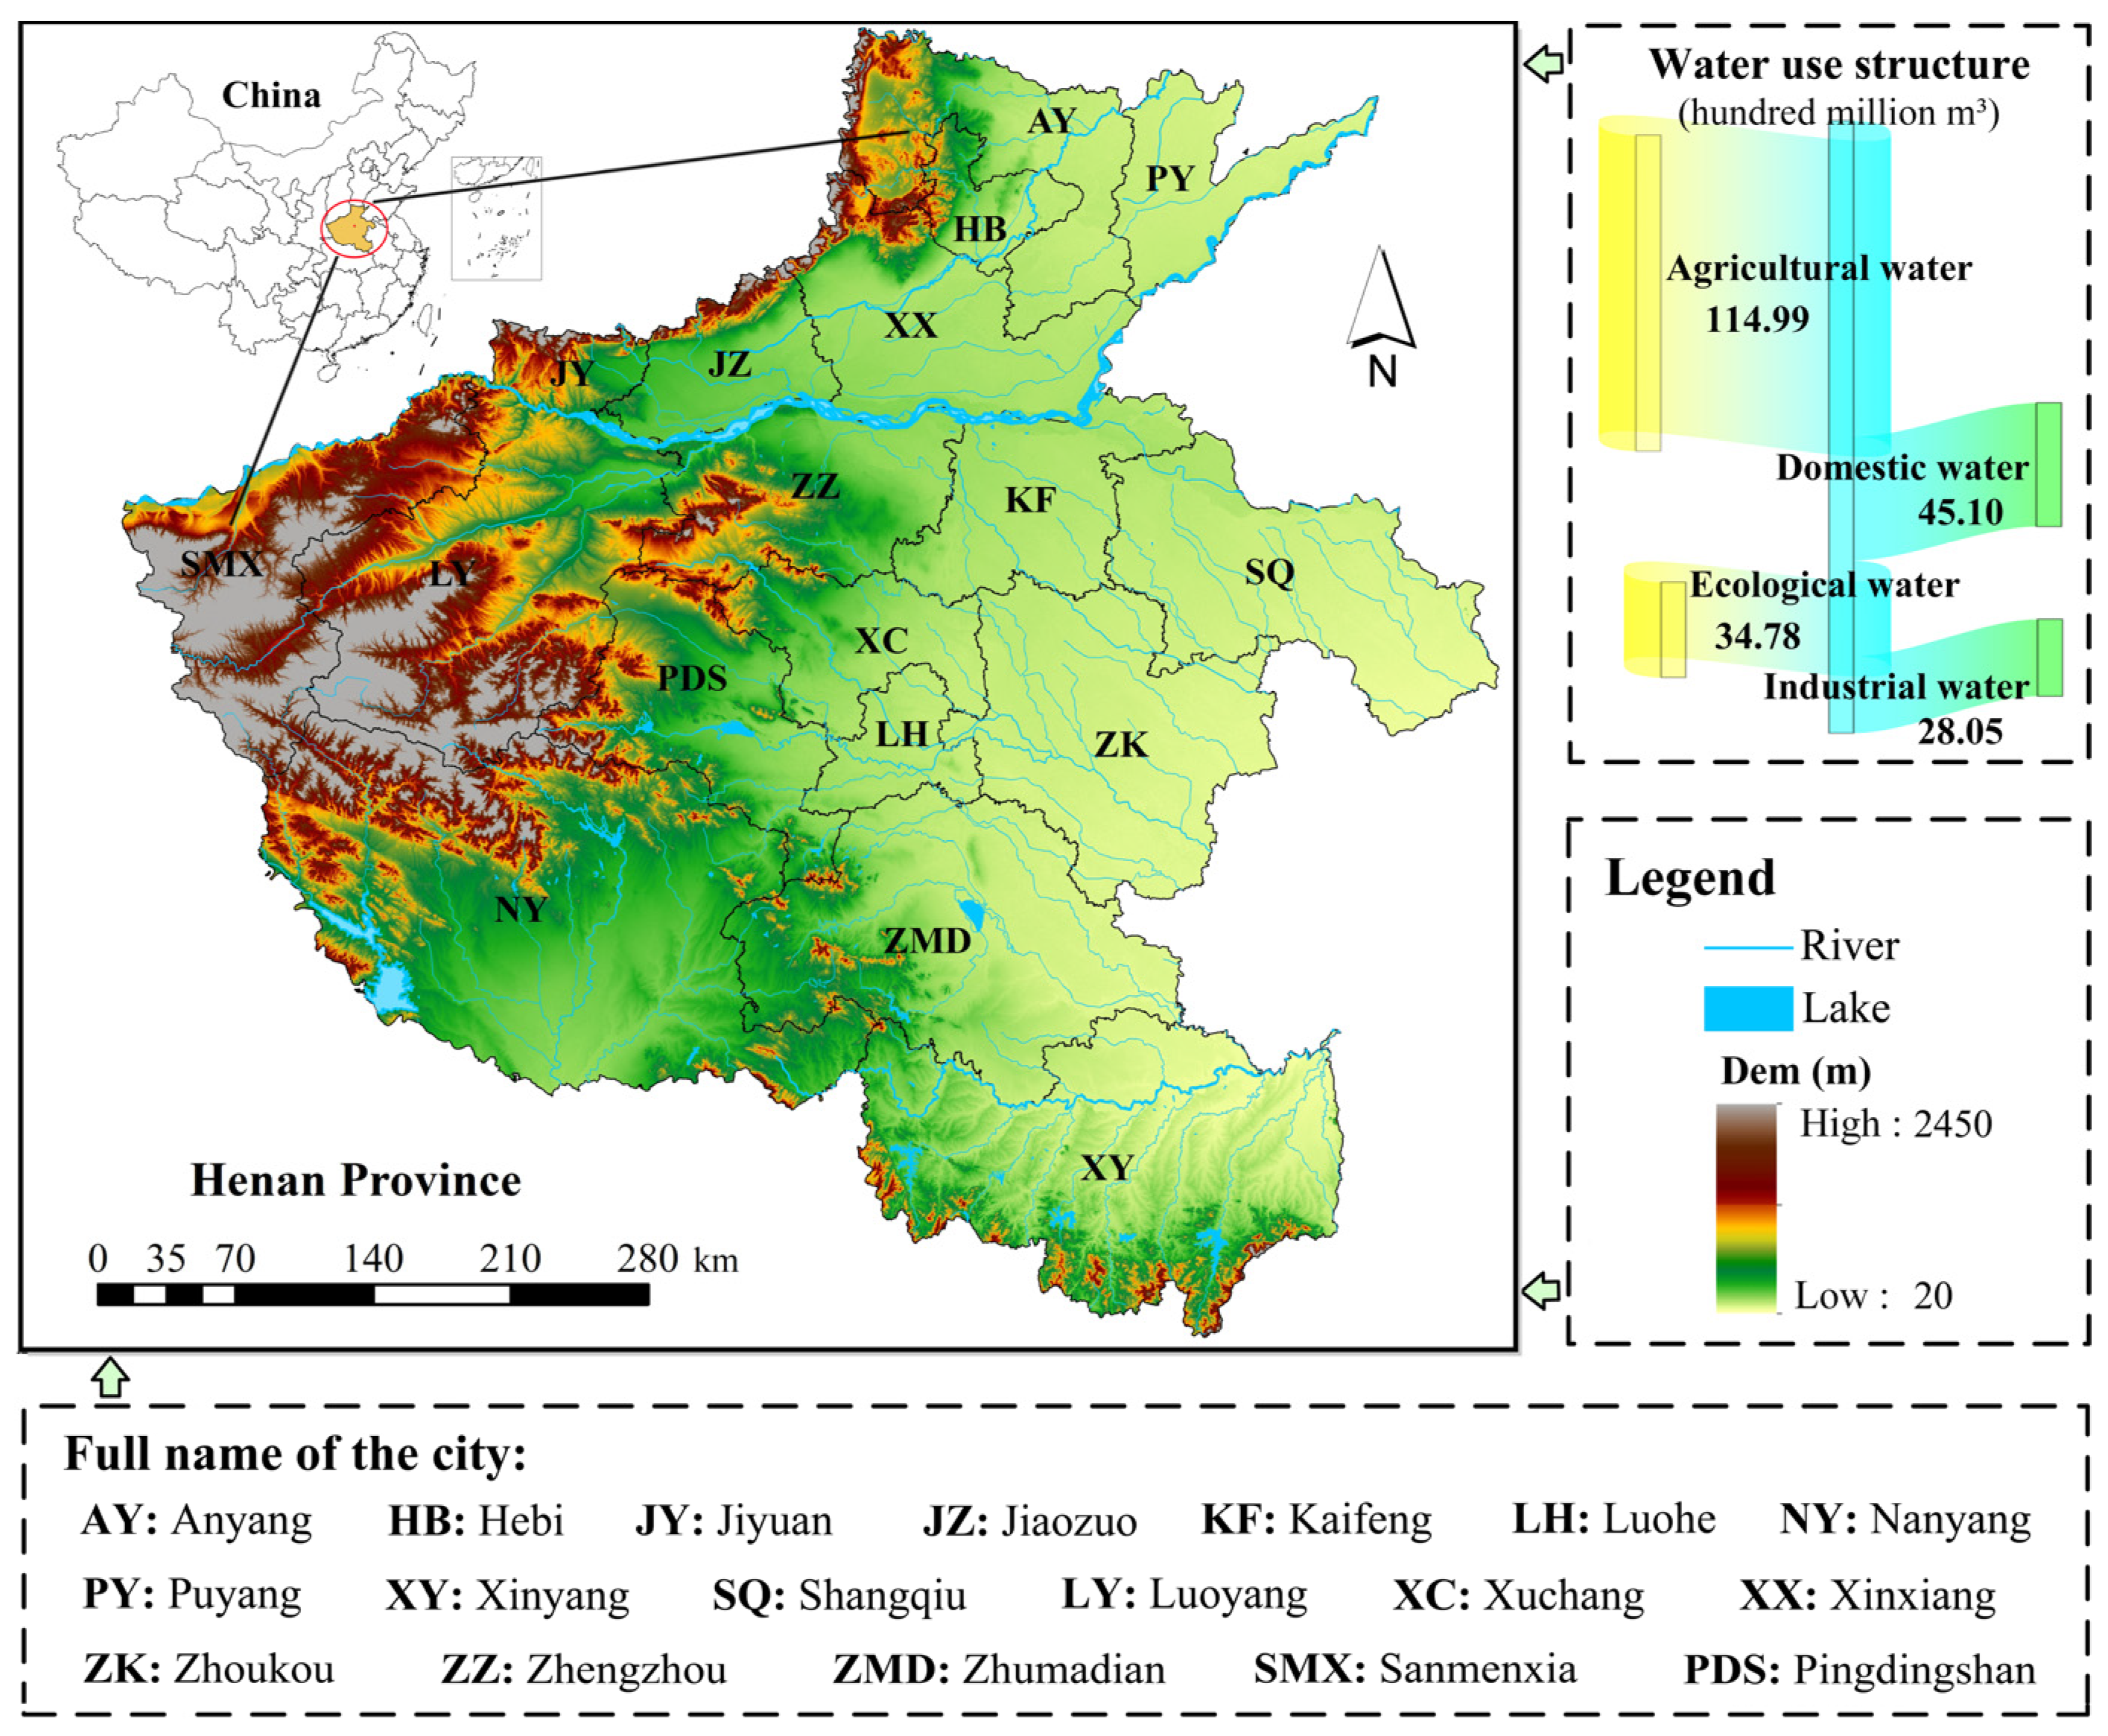
3.1. Overview of the Study Area

Henan Province is an essential energy and agricultural production base in China. In recent years, rapid urbanization and economic and social development have caused outstanding problems such as water resources shortage and ecological damage. Its per capita water resource is less than 400 m3, which is lower than the internationally recognized standard of 500 m3 per capita for serious water shortage, with an extremely dehydrated area. At the same time, the expansion of energy consumption and the densification of industries in Henan Province have resulted in a development pattern of high input, high consumption, and high emission that is still underway. Not only do overloaded production and living activities consume large amounts of water, but also produce a lot of pollutant emissions, which is a significant threat to the sustainable utilization of water resources and sustainable development. Hence, it is of great significance to scientifically assess the level of GWRUE in Henan for harmonizing the relationship between water utilization and sustainable development. Its regional location, elevation distribution, water system pattern, and water use structure are shown in Figure 2.

3.2. Data Source

Indicators data of GWRUE in the study area were obtained from Henan Provincial Statistical Yearbook, 2012–2022; Statistical Yearbook of various cities in Henan Province, 2012–2022; Water Resources Bulletin of Henan Province, 2011–2021; Water Resources Bulletin of various cities, 2011–2021; Annual Report of Environmental Statistics of Henan Province, 2011–2021; Statistical Yearbook of Urban Construction, 2011–2021; and Bulletin of the Second National Pollutant Source Census of Henan Province. Among them, the incomplete data on COD emissions from agricultural sources in each city were supplemented by linear interpolation, while the data on wetland and water areas were spatially extracted and interpolated using ArcGIS 10.4.

4. Results and Discussion

4.1. Multiple Water Use Sectoral CE, CA, and WCEE

The results of DWCE, IWCE, AWCE, AWCA, EWCA, and WCEE in Henan Province from 2011 to 2021 are shown in Figure 3. The WCEE of the water use sectors in Henan Province exhibited a decreasing trend overall. In 2011–2014, there was a phase of increasing and then decreasing, with the most CE generated in 2012 (21,090,100 tons), with industrial water CO2 emissions being the major contributor. There was a fluctuating upward trend from 2014 to 2018, primarily as a result of the increasing number of DWCE, whose absolute value of growth rate was much larger than that of IWCE and AWCA. From 2018 to 2021, there was a steadily decreasing phase, driven principally by the continuously diminishing IWCE and rising AWCA, with the absolute value of both growth rates approximately equal to that of DWCE, while the sum of the reduction in IWCE and the increment of AWCA far outstripped the enhancement of DWCE.
The results for WCEE for each urban water use sectors in Henan Province are presented in Figure 4. It is obvious that there was a CO2 emission effect in the WCEE of most cities during the period, with the number of cities accounting for 83.3%, mainly represented by ZZ, LY, PDS, and NS. The primary reasons for this are twofold. On the one hand, the large urban population and massive domestic water consumption contribute to huge CO2 emissions; on the other hand, the high water-consuming sectors in the province were mainly concentrate in these industrial cities [45], and the comparatively higher industrial water consumption drive a large amount of CO2 emissions. Moreover, it can also be noticed that there was a CO2 absorption effect in a few cities, exemplified mainly by ZMD and SQ. The reason is that these two cities, as large agricultural cities in Henan Province, own abundant irrigated agricultural land [46], and there are large amounts of crops absorbing CO2.
The detailed results of DWCE, IWCE, AWCE, AWCA, and EWCA in diverse cities of Henan Province from 2011 to 2021 are shown in the Supplementary Materials (Tables S1–S5). Overall, the DWCE exhibited an increasing trend in most cities during the study period. Within these, ZZ produced the dominant domestic water CO2 emissions and reached the highest value (5,024,300 tons) among all cities in 2021, with a multi-year average percentage as high as 18.0%. In contrast to the tendency of DWCE, the overall CO2 emissions from industrial water showed a decreasing trend. There were, compared with other cities, higher IWCE in LY, NY, PDS, and ZZ, with multi-year average proportions accounting for 11.6%, 11.3%, 10.8%, and 10.4%, respectively. The AWCE and AWCA displayed a growing trend in general, and CA was much higher than CE. However, the overall growth rate of both was insignificant, only about 8%. That is due to the implementation of the strictest arable land protection policies by city governments and the gradual tightening of controls on land [47]. At an urban scale, the vast plains of southeastern Henan Province are more amenable to agricultural development and crop growth than the hilly areas of northwestern [48,49], resulting in more CO2 emissions and absorption from agricultural water. The EWCA had a similar changing trend to the AWCA, which was on a steady rise from year to year. Of these, ZZ produced the most ecological water CO2 absorption, with a multi-year average ratio of 22.2%. The total area of wetlands and waters in ZZ was larger than that of other cities in the province, laying a material foundation for CO2 absorption, and the gross area of urban gardens and green spaces had been increasing, from 10,500 hectares in 2011 to 26,900 hectares in 2021. The city with the lowest multi-year average percentage of AWCA was XC, at just 1.7%, which generated only 31,300 tons of CA in 2021, leaving a large discrepancy with the city’s CE from both domestic and industrial sources.

4.2. Multiple Water Use Sectoral GWRUE

4.2.1. GWRUE of Various Water Use Sectors in Henan Province

The results and trends of GWRUE for the four water use sectors in Henan Province from 2011 to 2021 are shown in Figure 5. As a whole, DGWRUE, IGWRUE, and AGWRUE showed an upward trend, while EGWRUE with a downward trend. Moreover, the former three were higher than the latter. In the case of DGWRUE, its efficiency value increased volatility from 0.487 in 2011 to 0.732 in 2021, with the efficiency level rising to grade III. This demonstrates that since the introduction of the most rigorous water resource management system in 2012 [50], water conservation policies and the promotion of a range of domestic water-saving and energy-saving appliances in Henan Province led to decrease domestic water consumption and also reduce wastewater and exhaust emissions, which has led to a continuous improvement in DGWRUE. In terms of IGWRUE, Henan Province had been at a Medium level. From 2011 to 2015, its efficiency value first dropped from 0.568 to 0.447; this is because of the upward adjustment of China’s industrial raw materials, fuels, and power purchasing index [51], which resulted in the increased difficulty of industrial production activities, while enterprises were forced to lower the standard of water resource utilization and the standard of wastewater and exhaust emission due to the pressure of cost, which led to a decrease of efficiency value. During the period of 2016–2021, there was a fluctuating upward trend, with the efficiency value increasing to 0.595 in 2021; this is due to the vigorous control of industrial water consumption and pollutant emissions, as well as the optimization and upgrading of the industrial water use structure in each city [52], which promoted the IGWRUE. From the viewpoint of AGWRUE, its efficiency value showed an undulating downward trend during 2011–2017 on the whole, with the efficiency value dropping from 0.585 to 0.496, and the efficiency class was in IV. On the one hand, the traditional and inefficient irrigation techniques that has been practiced for years caused reckless use of agricultural water [53,54]; On the other hand, the problem of direct discharge of agricultural wastewater has always existed [55]. After 2017, it started to go back up and in growth, rising to grade I in 2021. What made it so is that all cities deeply carried out the implementation plan of Henan Province to win the battle against water pollution, emphasizing the prevention and control of pollution in agriculture and rural areas [56]. There is a significant improvement in the utilization of water resources in agriculture, with AWRUE rising. Looking at the EGWRUE, its efficiency value was the lowest and continued to decline during 2011–2021, once falling to grade VI. While vigorously expanding landscaped green space, it would consume a large amount of capital, manpower, material, and water resources [57]. Still, the economic and environmental benefits generated by this ecological land would relatively lag, resulting in an incongruity between inputs and outputs, which further reduced efficiency.

4.2.2. GWRUE of Various Water Use Sectors in Cities

The results and heat map of DGWRUE for cities in Henan Province from 2011 to 2021 are illustrated in Figure 6. Except for KF, AY, and ZK, each of the other cities demonstrated a fluctuating upward trend. By 2021, all cities in Henan Province were in grade IV and above, with two-thirds of cities in grade III. This indicates that most cities began to pay more attention to the coordinated development between the way of using water for living, environmental pollution, and economic growth, which effectively promoted the improvement of DGWRUE. In looking at concrete cities, ZZ had been in the leading position, its grade steadily climbing from III to I from 2011 to 2021, which is connected with its status as the political, economic, and cultural center of Henan Province. On the one hand, it owns a great deal of workforce, and financial resources, as well as sophisticated detection and treatment infrastructure of energy allocation, wastewater, and exhaust [58]. On the other hand, it is attributed to the government’s strict control of water use in high water-consuming sectors, as well as the vigorous efforts to propagate and educate the residents on water conservation in their daily life [59]. While the DGWRUE of HB and XY were also improving, the rate of enhancement was relatively slow. Their efficiency level, from 2011 to 2021, only rose from Bad to Poor, which is linked to the comparatively low level of economic development and domestic water conservation awareness in the two cities.
The results of IGWRUE for cities in Henan Province from 2011 to 2021 are shown in Figure 7. IGWRUE was generally lower in most cities compared with DGWRUE. This revealed that the level of intensive and economical water use and environmental protection in the industrial sector required further improvement. In addition to ZZ, the IGWRUE of the other cities in the 2011–2015 period as a whole was in a downward trend. This is because industrial enterprises in the cities were also affected by the revision of the purchase index of industrial materials during the “12th Five-Year Plan” period [51]. It is noteworthy that the IGWRUE of most cities in Henan Province decreased during the 2011–2015 period, but in 2016–2021, as the governments of the cities began to gradually strengthen the intensity of environmental regulation and resource constraints and continuously optimized and adjusted the structure or configuration of the industrial sectors, the pollution emissions had been effectively controlled [45], which contributed to the enhancement of the IGWRUE. By 2021, only three cities, PY, NY, and SQ, were still at grade V, while the rest were in grade IV and above.
The results of AGWRUE for cities are summarized in Figure 8. The AWGRUE for each city was in an overall fluctuating upward trend. By 2021, all 18 cities were at the Medium and above level, with eight of them in grade I. This proves that with the intensity of the prevention and regulation of agricultural water pollution by the country and governments as well as the popularization of agricultural water-saving facilities and technology [60], the AWGRUE was gradually enhanced. In the context of individual cities, the AGWRUE was relatively high in LH, SQ, and ZMD, while it was lower in ZZ, PDS, and JY—the reason why different regions have different development characteristics and emphasis. PDS and JZ are typical coal-producing areas; compared with the agricultural sector, the development level of technology related to the industrial sector is more advanced, so the AGWRUE is relatively low, while ZMD and SQ are agricultural cities, focusing on technological development in the agricultural sector; thus, the AGWRUE is relatively high.
As shown in Figure 9, it can be seen that the EGWRUE was decreasing from year to year, and the grade of efficiency was very low. In 2011, there were three cities at Excellent and one at Good, while in 2021, only one city, PY, was in grade IV and the rest were below grade V. This is the result of each city being heavily invested in the expeditious construction of urban gardens, green spaces, and wetlands, but neglecting considerable labor, material assets, and financial investments [57]. For the period of 2011–2021, the average annual growth rates of the 18 cities were 15.02% for WEPI inputs, 19.03% for capital inputs, 5.99% for ecological water inputs, 1.25% for outputs of ecological water service values, and 3.27% for CO2 absorption. It is not difficult to discover that the ecological and economic benefits, as well as CO2 absorption, had increased to some extent, but in terms of the growth rate, the growth rate of inputs to urban ecological construction was much higher than that of outputs, which has resulted in the decrease of the urban EGWRUE in recent years.
The multi-year average GWRUE ranking, value, and level of various water use sectors in each city of Henan Province are shown in Table 2.

4.3. Consolidated Green Water Resource Utilization Efficiency

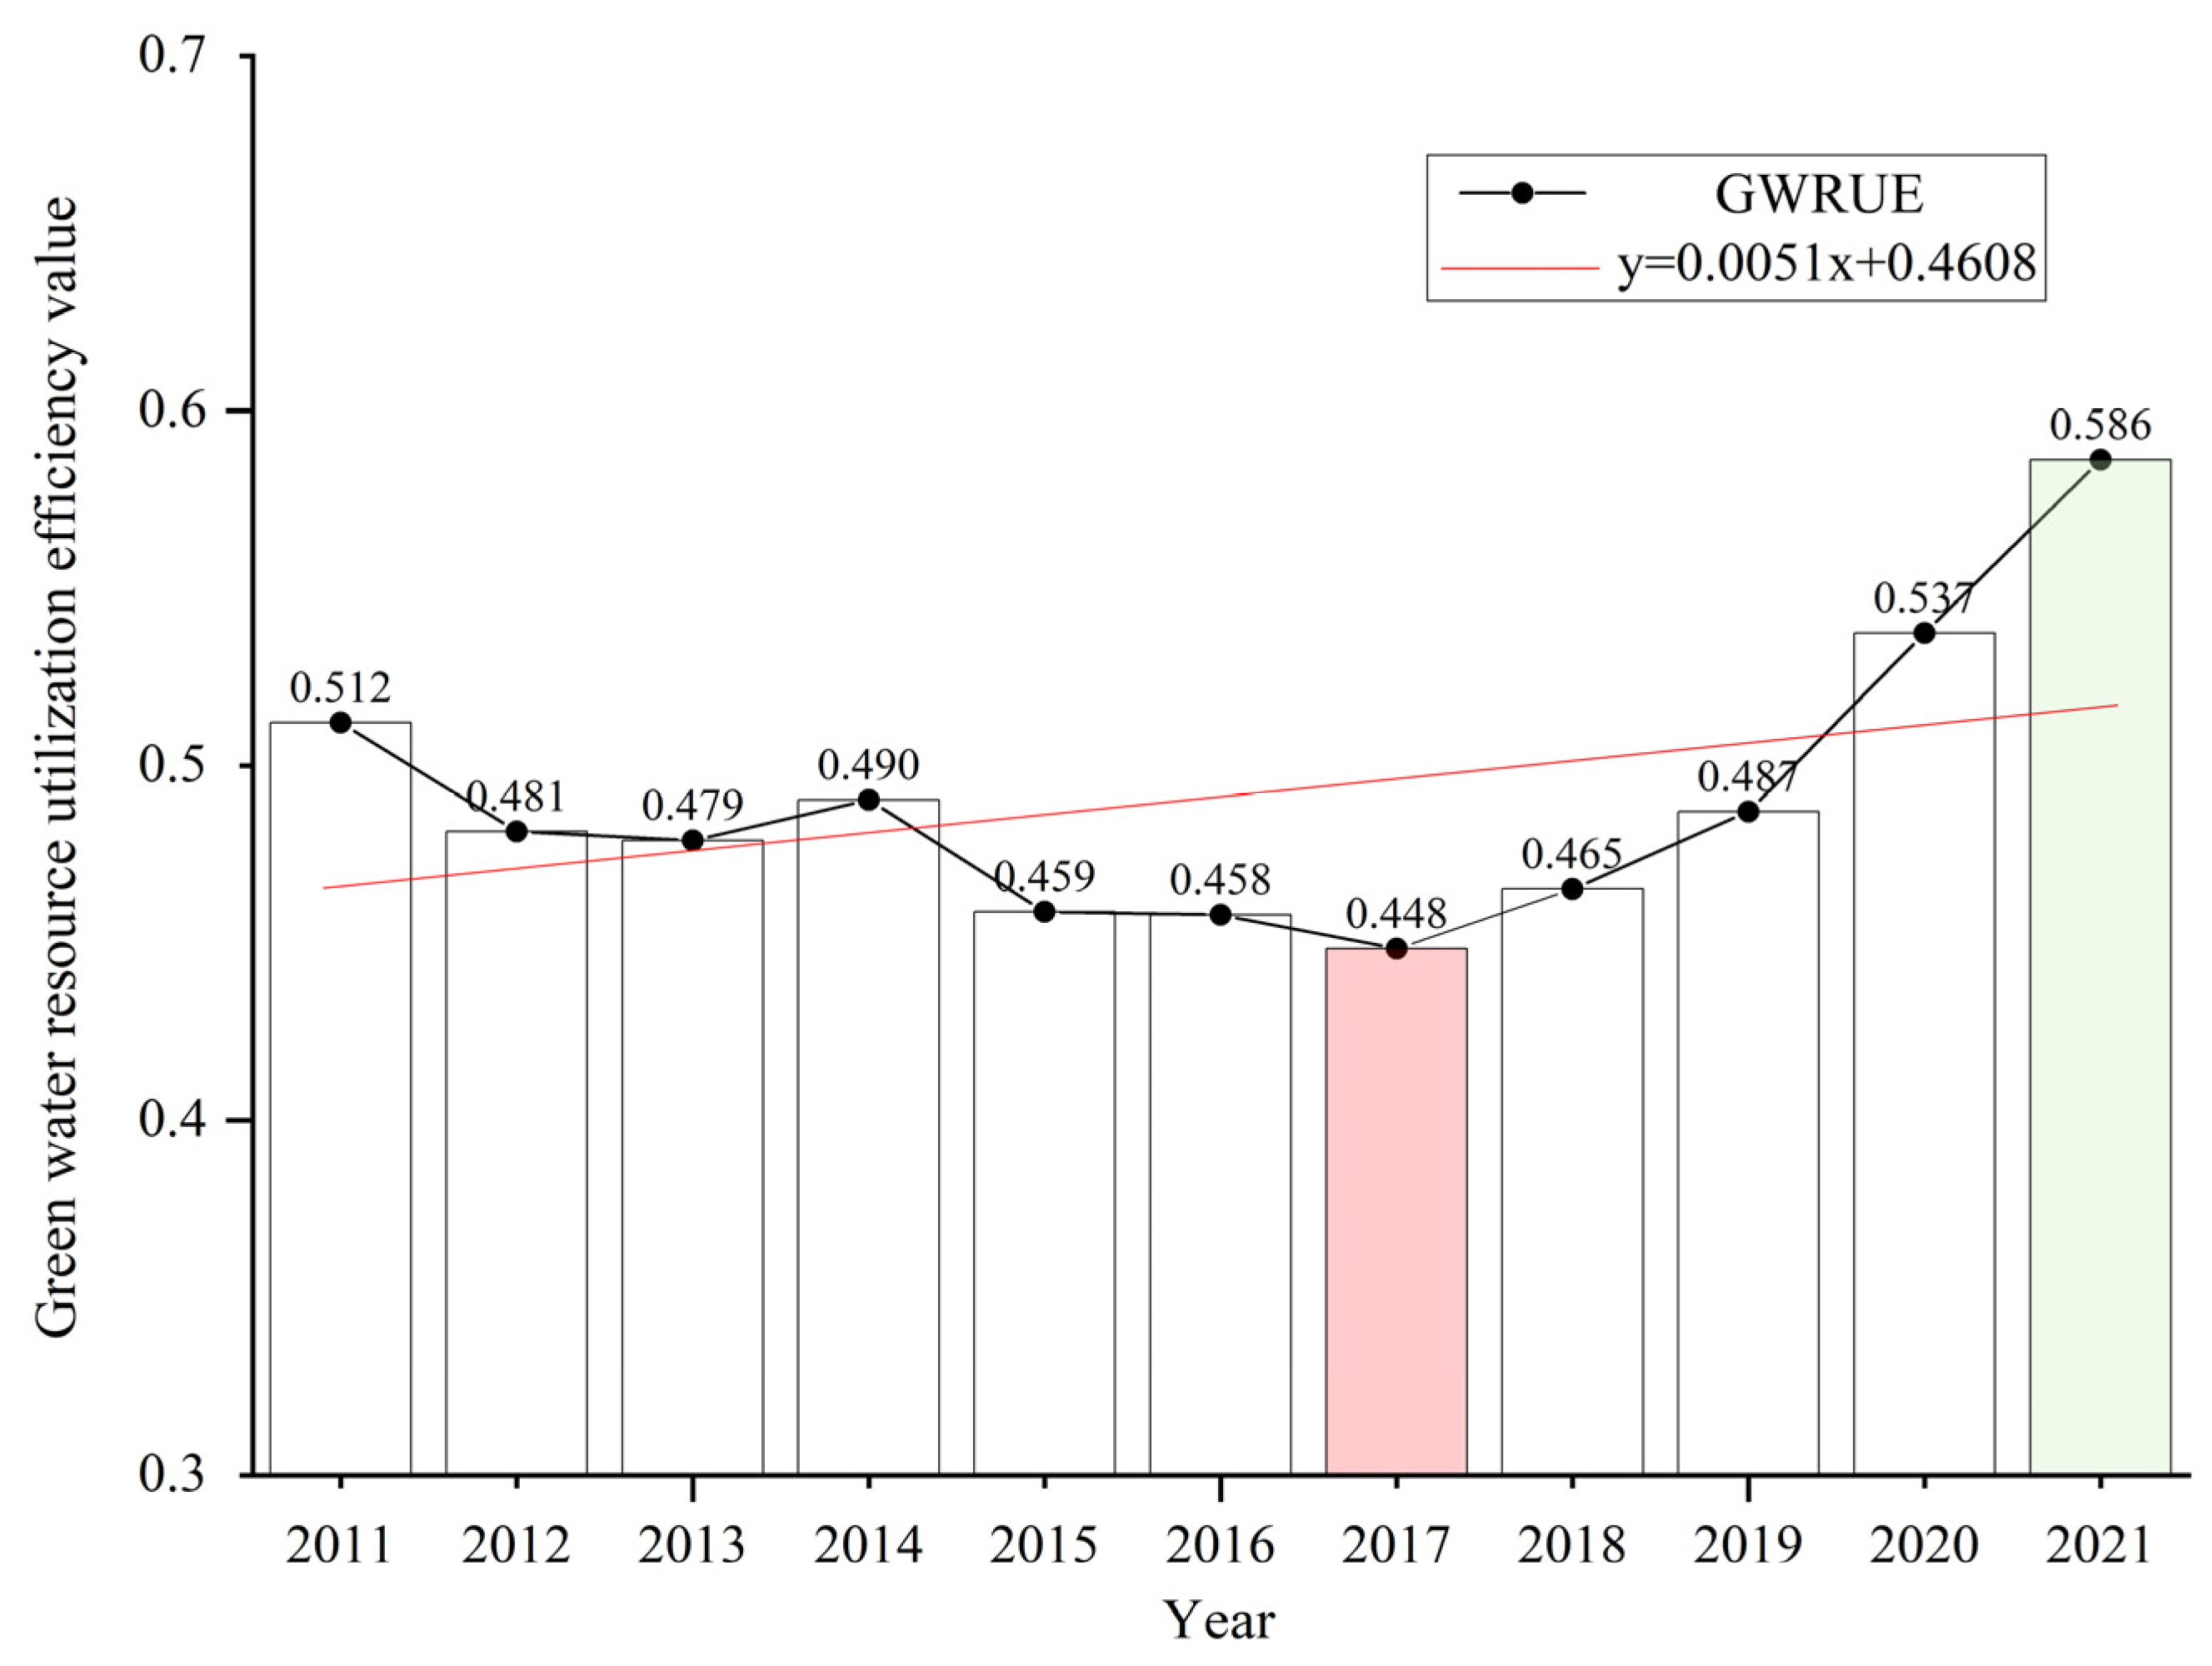
4.3.1. CGWRUE in Henan Province

The results and trends of CGWRUE in Henan Province from 2011 to 2021 are displayed in Figure 10. The CGWRUE presents an upward momentum on the whole, with an average annual growth rate of 3.08%, but it had been in grade IV for several years, which was subject to further improvement. Looking at the sub-periods, it showed a fluctuating decreasing trend from 2011 to 2017, and in 2017, it decreased to the lowest value of 0.448 in the decade, which was in the Medium range. This is due to the decline in AGWRUE and DGWRUE, which results in a significant drop in CGWRUE. It was for a steady growth phase in 2017–2021 and was essentially close to a Good level in 2021. On the one hand, it had benefited from the “13th Five-Year Plan of Action for Double-control of Total Water Consumption and Intensity” issued by Henan Province in 2017, which required local governments to restrict the consumption of water resources from the levels of “total amount” and “intensity” [61]. On the other hand, it was attributed to the “13th Five-Year Plan for the Construction of a Water-Saving Society” [62]. Meanwhile, this is a powerful testimony to the great results obtained by Henan Province after thoroughly implementing the relevant policies.

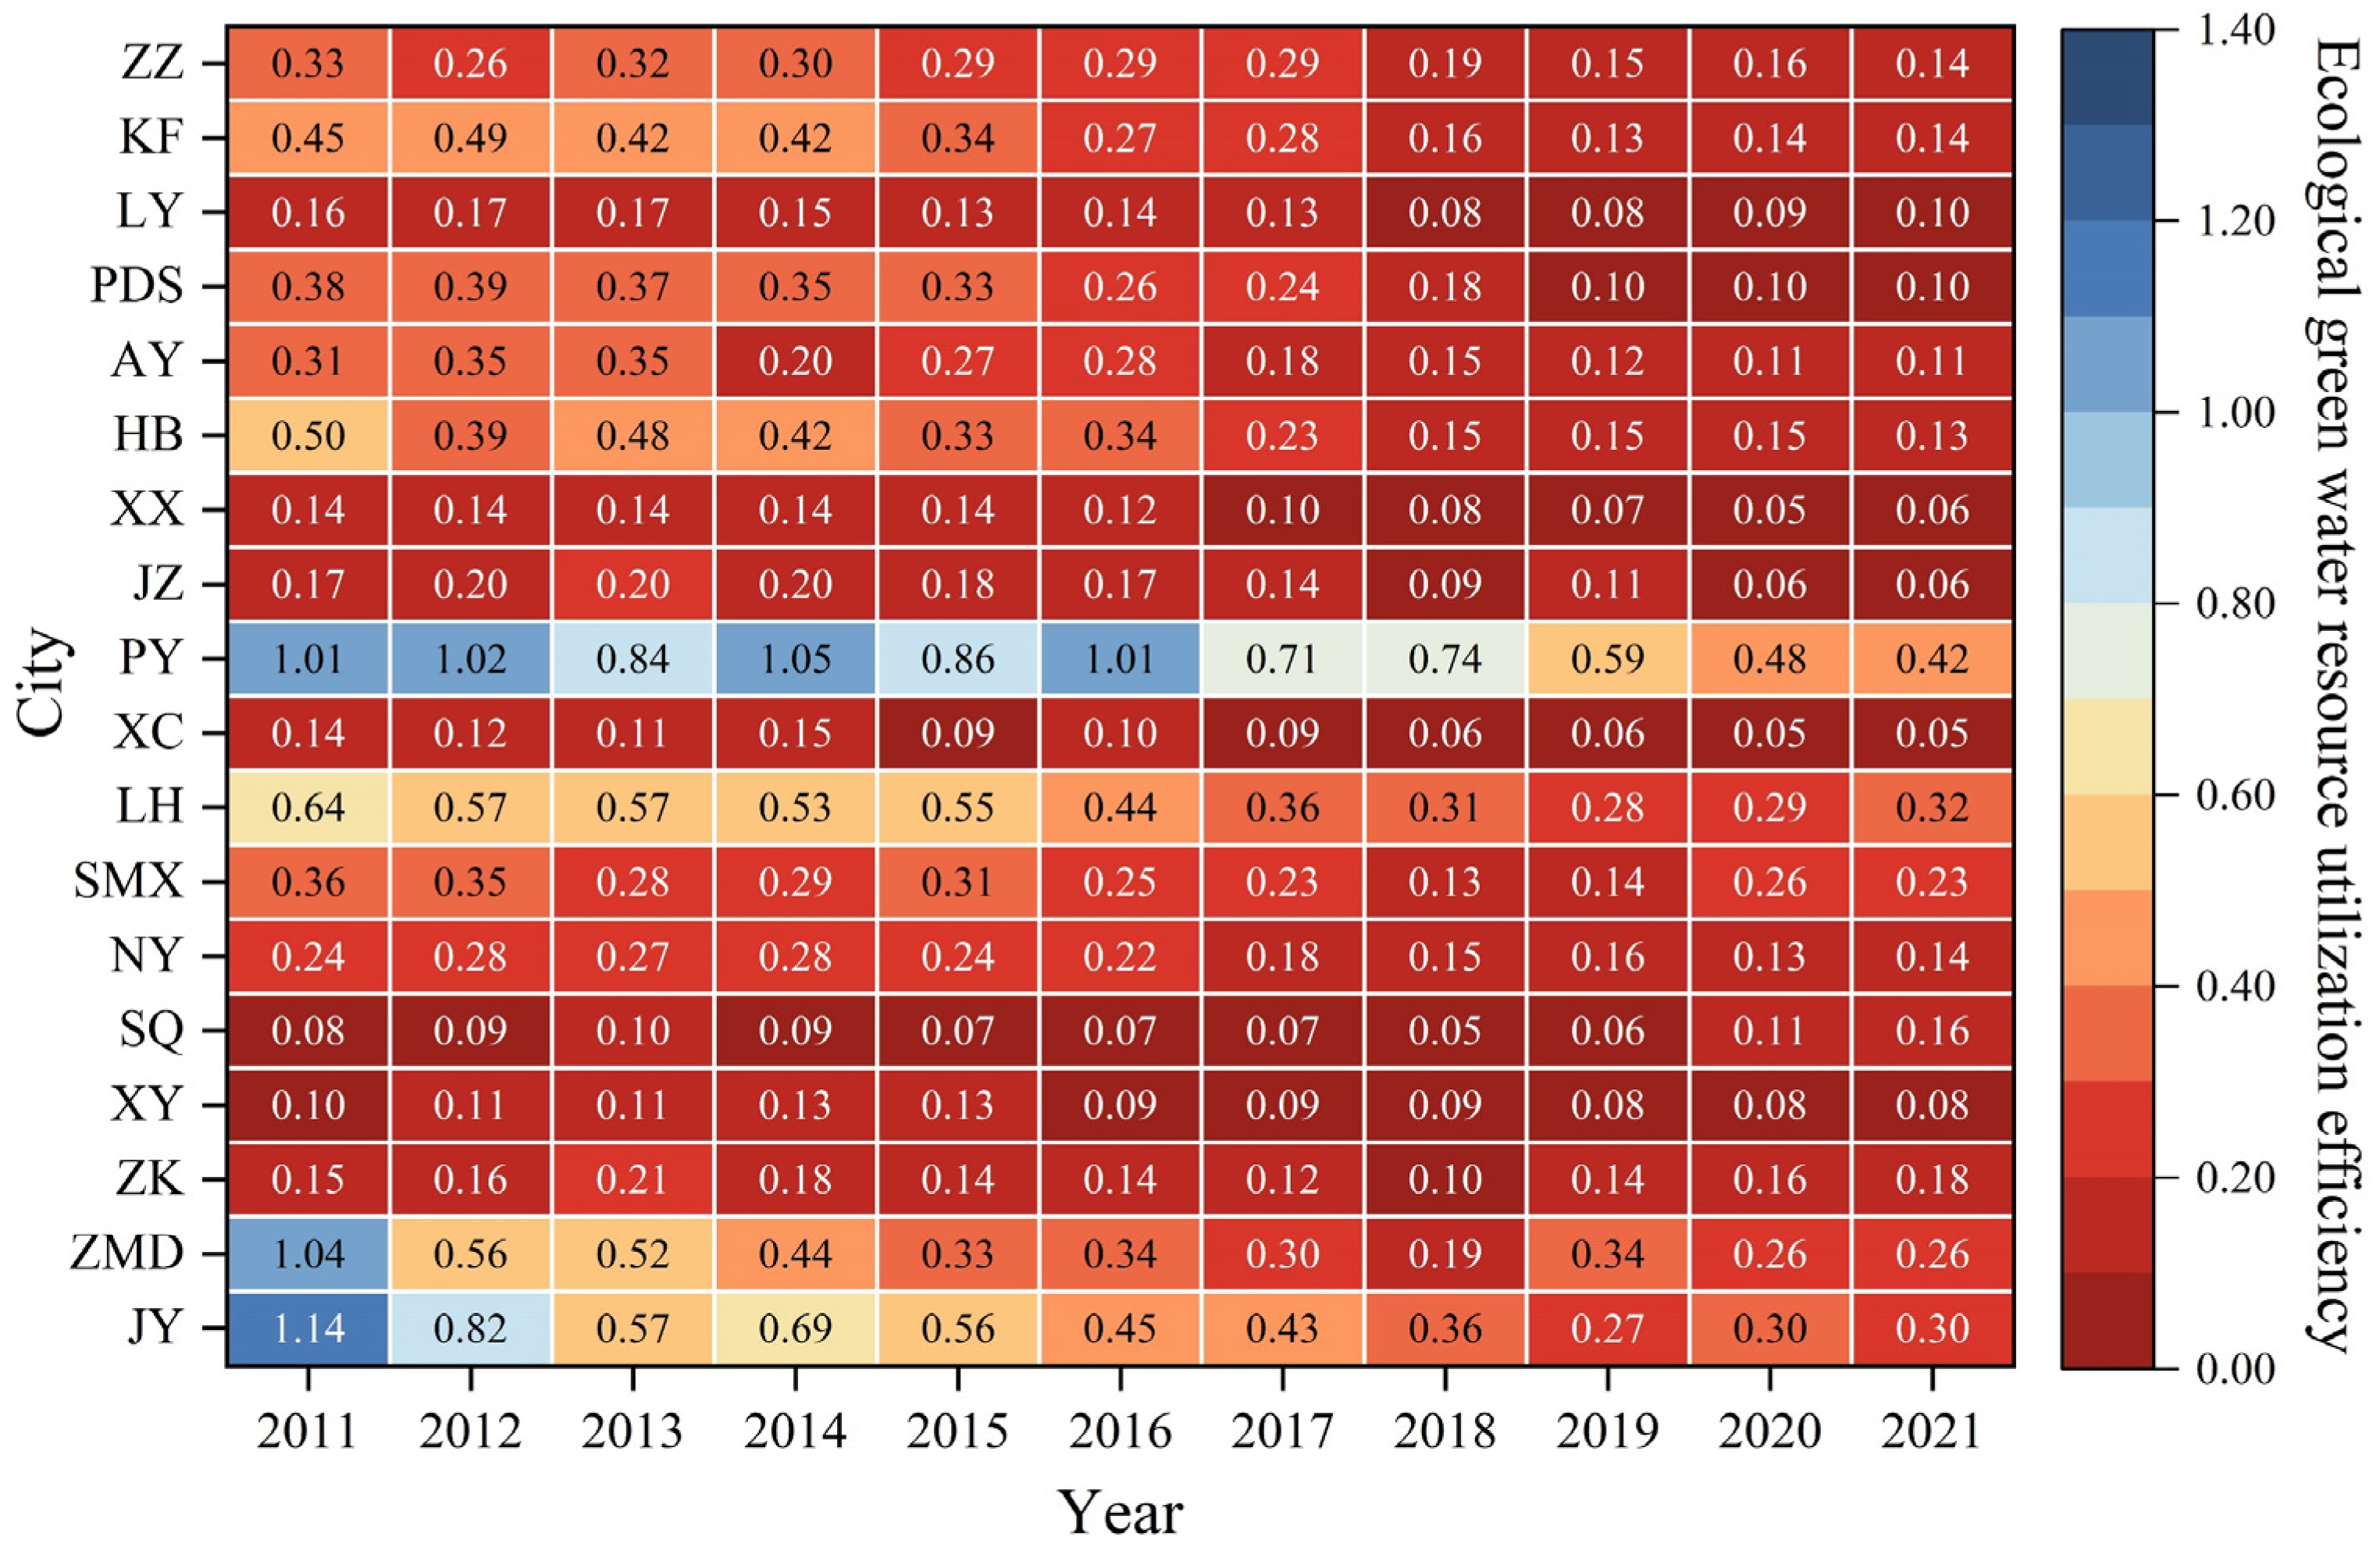
4.3.2. CGWRUE in Various Cities of Henan Province

The spatial and temporal change trends for the CGWRUE of 18 cities in 2011, 2016, and 2021 are shown in Figure 11 as well as the detailed results for each year, which are listed in Table S6.
In the temporal dimension, from 2011 to 2016, the CGWRUE levels in a third of cities dropped, with three cities, JY, LH, and ZMD, falling from grade III to IV, as well as three cities, AY, ZK, and NY, falling from grade IV to V. From 2016 to 2021, the level in half of the cities in Henan Province improved, with four cities, including ZZ, XC, and LH, improving from grade IV to III, as well as five cities, such as NY, XY, and ZK, upgrading to grade IV. Evidently, the number of cities with improved efficiency levels in the 13th Five-Year Plan period was more than in the 12th Five-Year Plan period, which demonstrates that the implementation of the “Double-control” and water-saving programs was effective in promoting the improvement of CGWRUE in Henan Province [61,63]. Spatially, in 2011, there were four cities at the Good level, mainly located in the northwestern and southern regions of Henan Province; the total number of cities at the Medium and Poor level accounted for 77.8%. In 2016, there were five cities at the Poor level, primarily concentrated in the northeastern region and the southern region, namely AY, XX, ZK, NY, and XY. In 2021, all cities in Henan Province were above the Medium level, of which there were five cities at the Good level, mostly located in the northwestern region and central region of Henan Province.
The multi-year average CGWRUE ranking, value, and level for each city are shown in Table 3. There are two cities in grade III, LH, and SMX, ranked 1st and 2nd, respectively; the number of cities in grade V is equal to that in grade III, namely NY and XY; the other cities are in grade IV. It can be seen that, although the CGWRUE of most cities in Henan Province enhanced from the “12th Five-Year Plan” to the “13th Five-Year Plan” period, only a few cities just reached grade III, and the overall level still required further improvement.

5. Conclusions

The efficient utilization of water resources is a fundamental pillar of sustainable development. Moreover, scientifically measuring the efficiency of utilizing green water resources holds strategic importance in the pursuit of carbon neutrality. Oriented toward the goal, this paper constructed an integrated measurement model of GWRUE, combined with the CEEA method, and established an input–output indicator system of GWRUE in four dimensions: domestic, industrial, agricultural, and ecological water. Finally, the above methodology was applied to Henan Province, carrying out a case study at two spatial scales: province and cities. The primary research findings are summarized as follows:
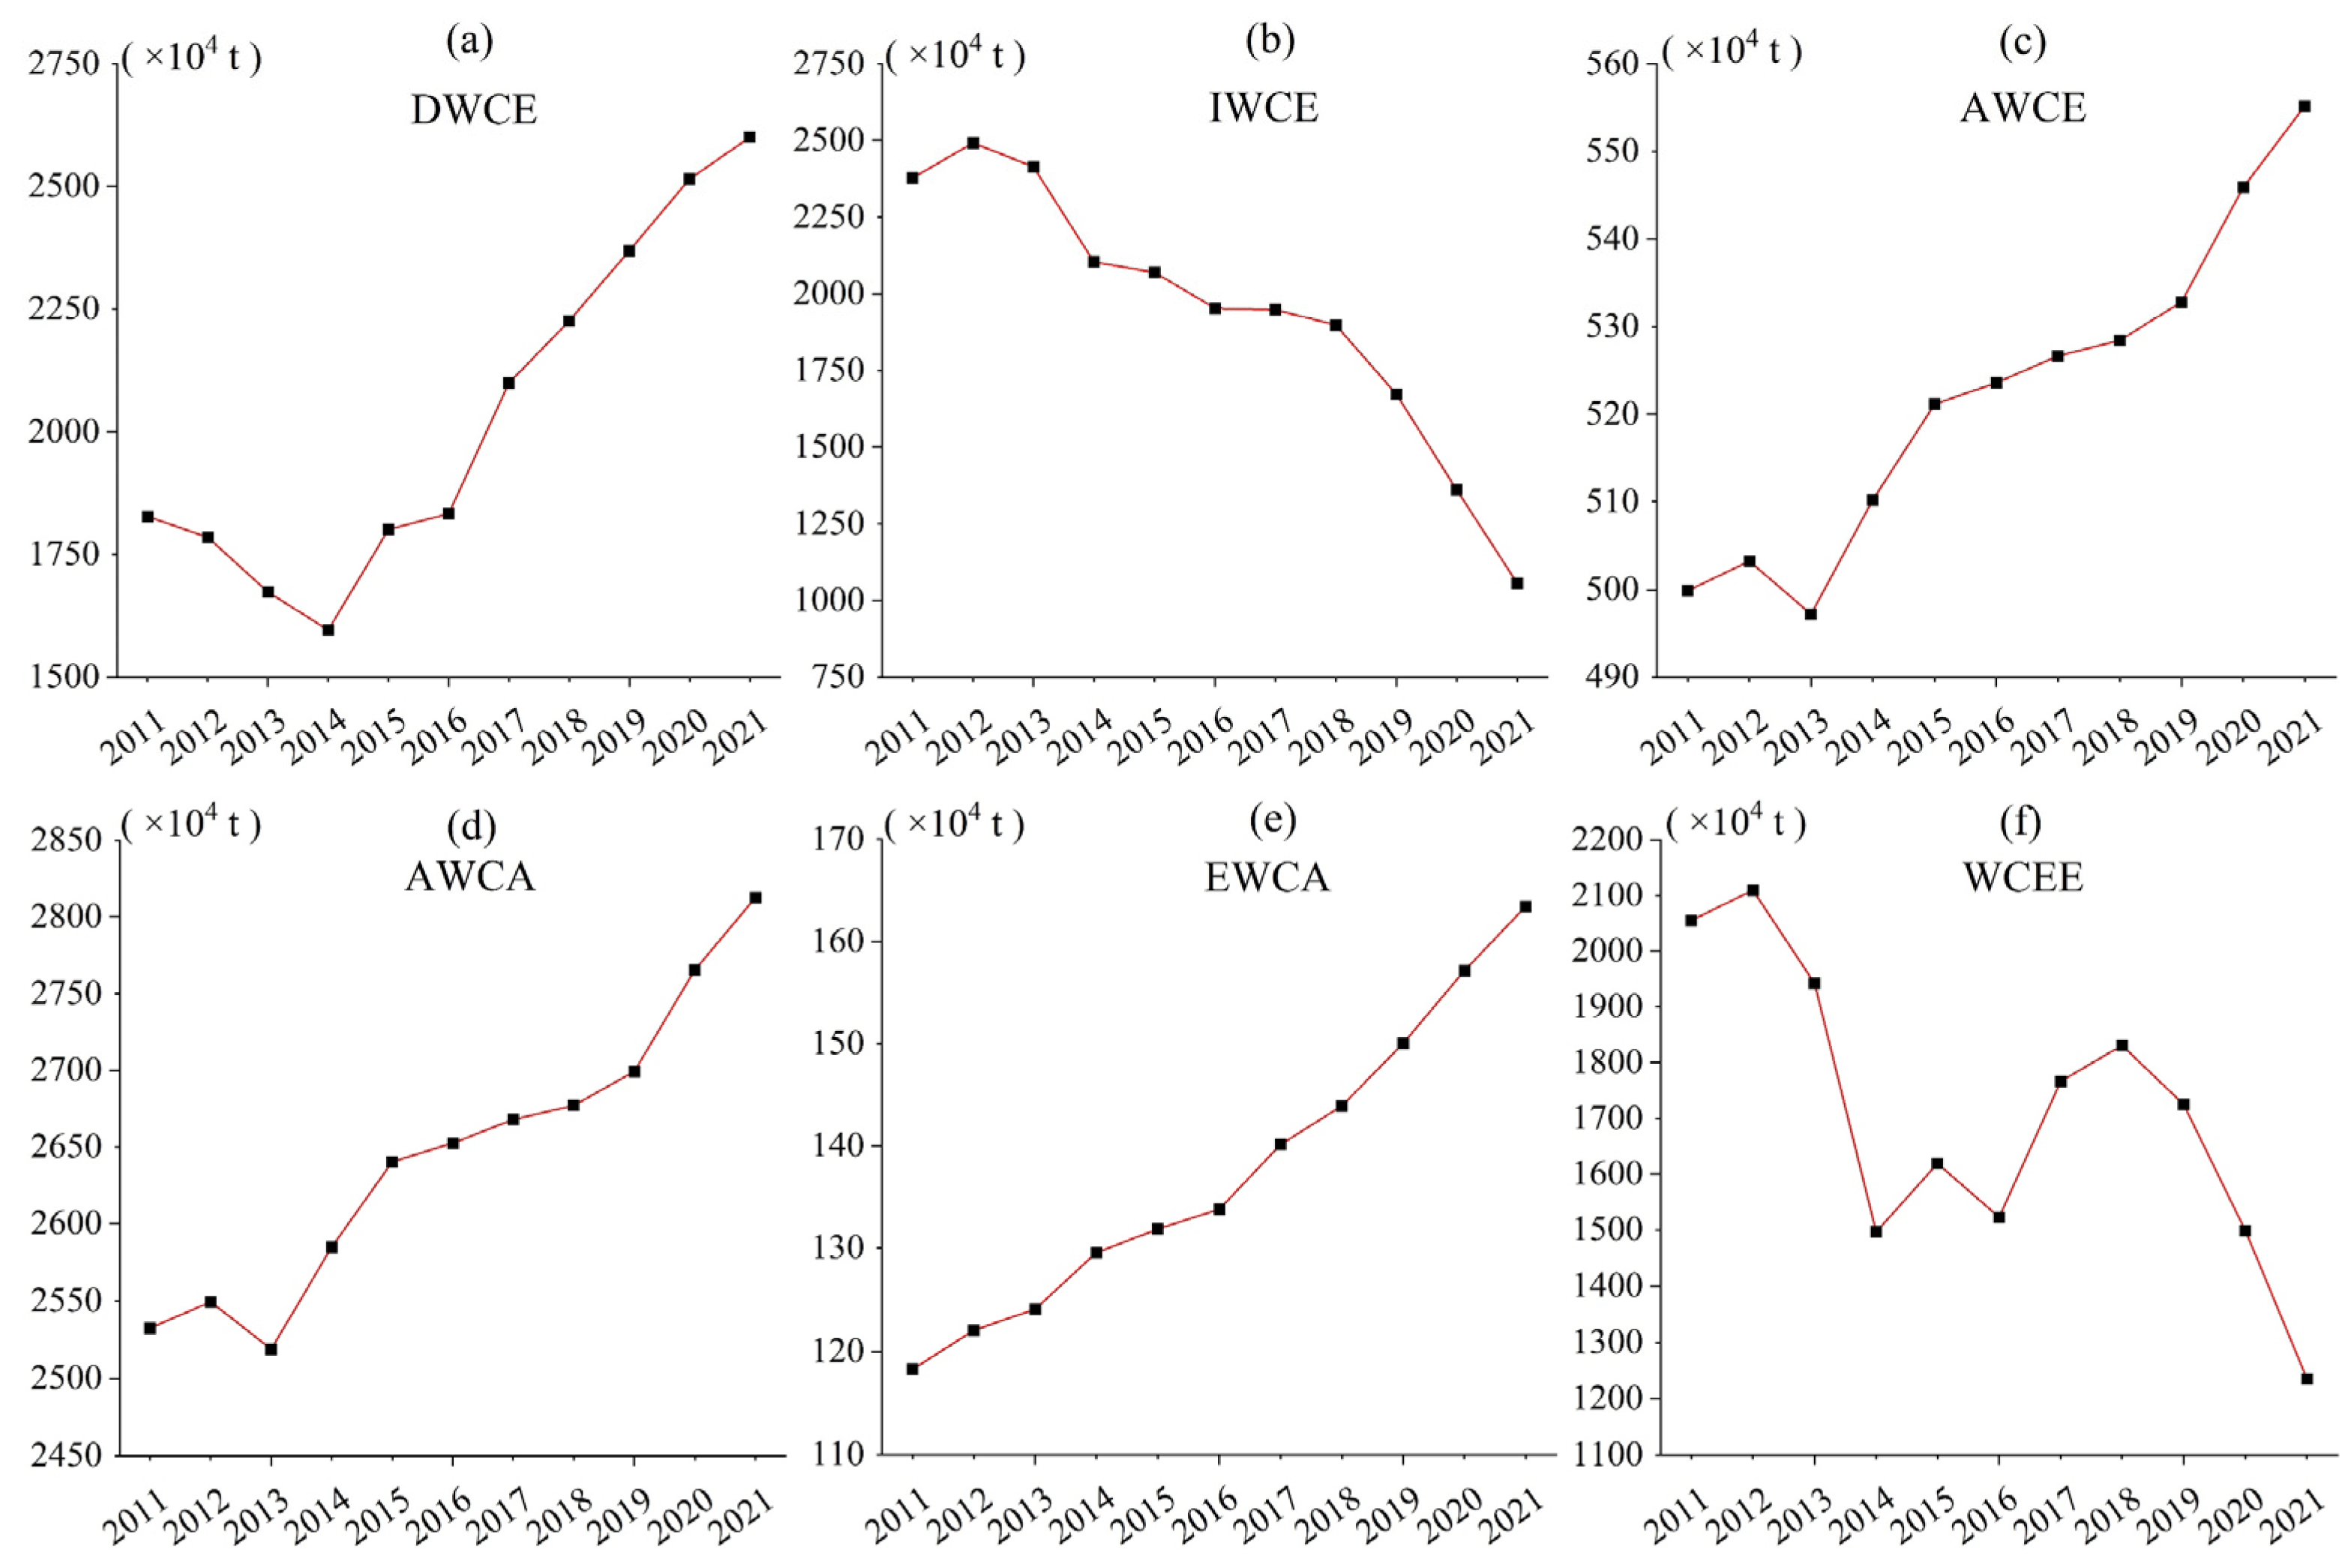
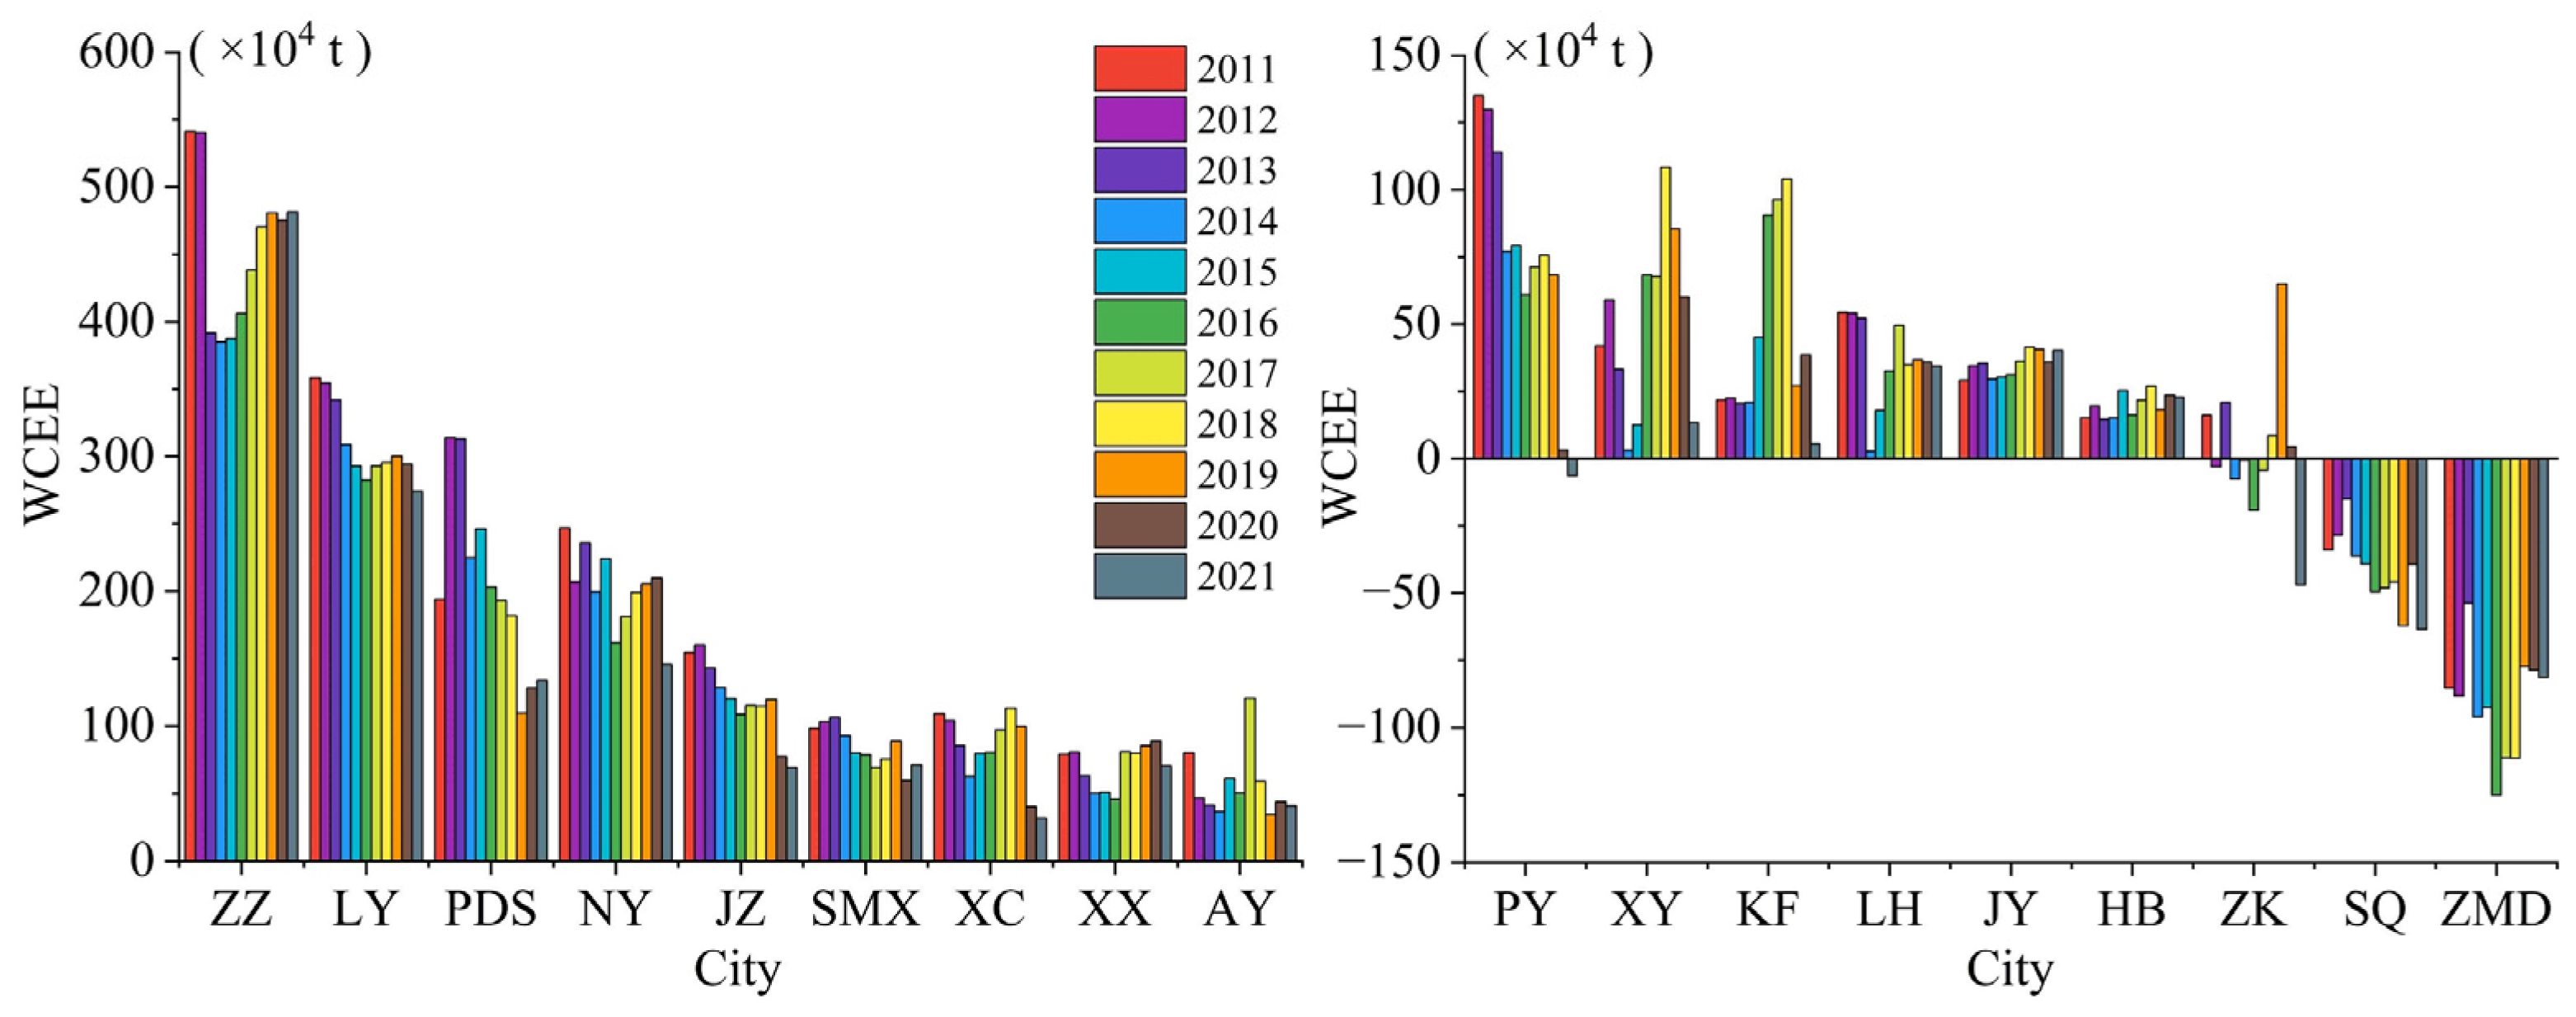
  • In 2011–2021, the WCEE of multiple water use sectors in Henan Province generally decreased in a fluctuating manner, from a peak of 21,090,100 tons in 2012 to a low of 12,351,900 tons in 2021. The water use sectors of those cities with high population densities and high water-consuming industrial clusters produced more CO2 emissions. In terms of different sectors, DWCE showed a decreasing and then an increasing trend; IWCE had a small increase and then a large decrease; AWCE and AWCA followed an increasing tendency; EWCA had the same movement as AWCA.
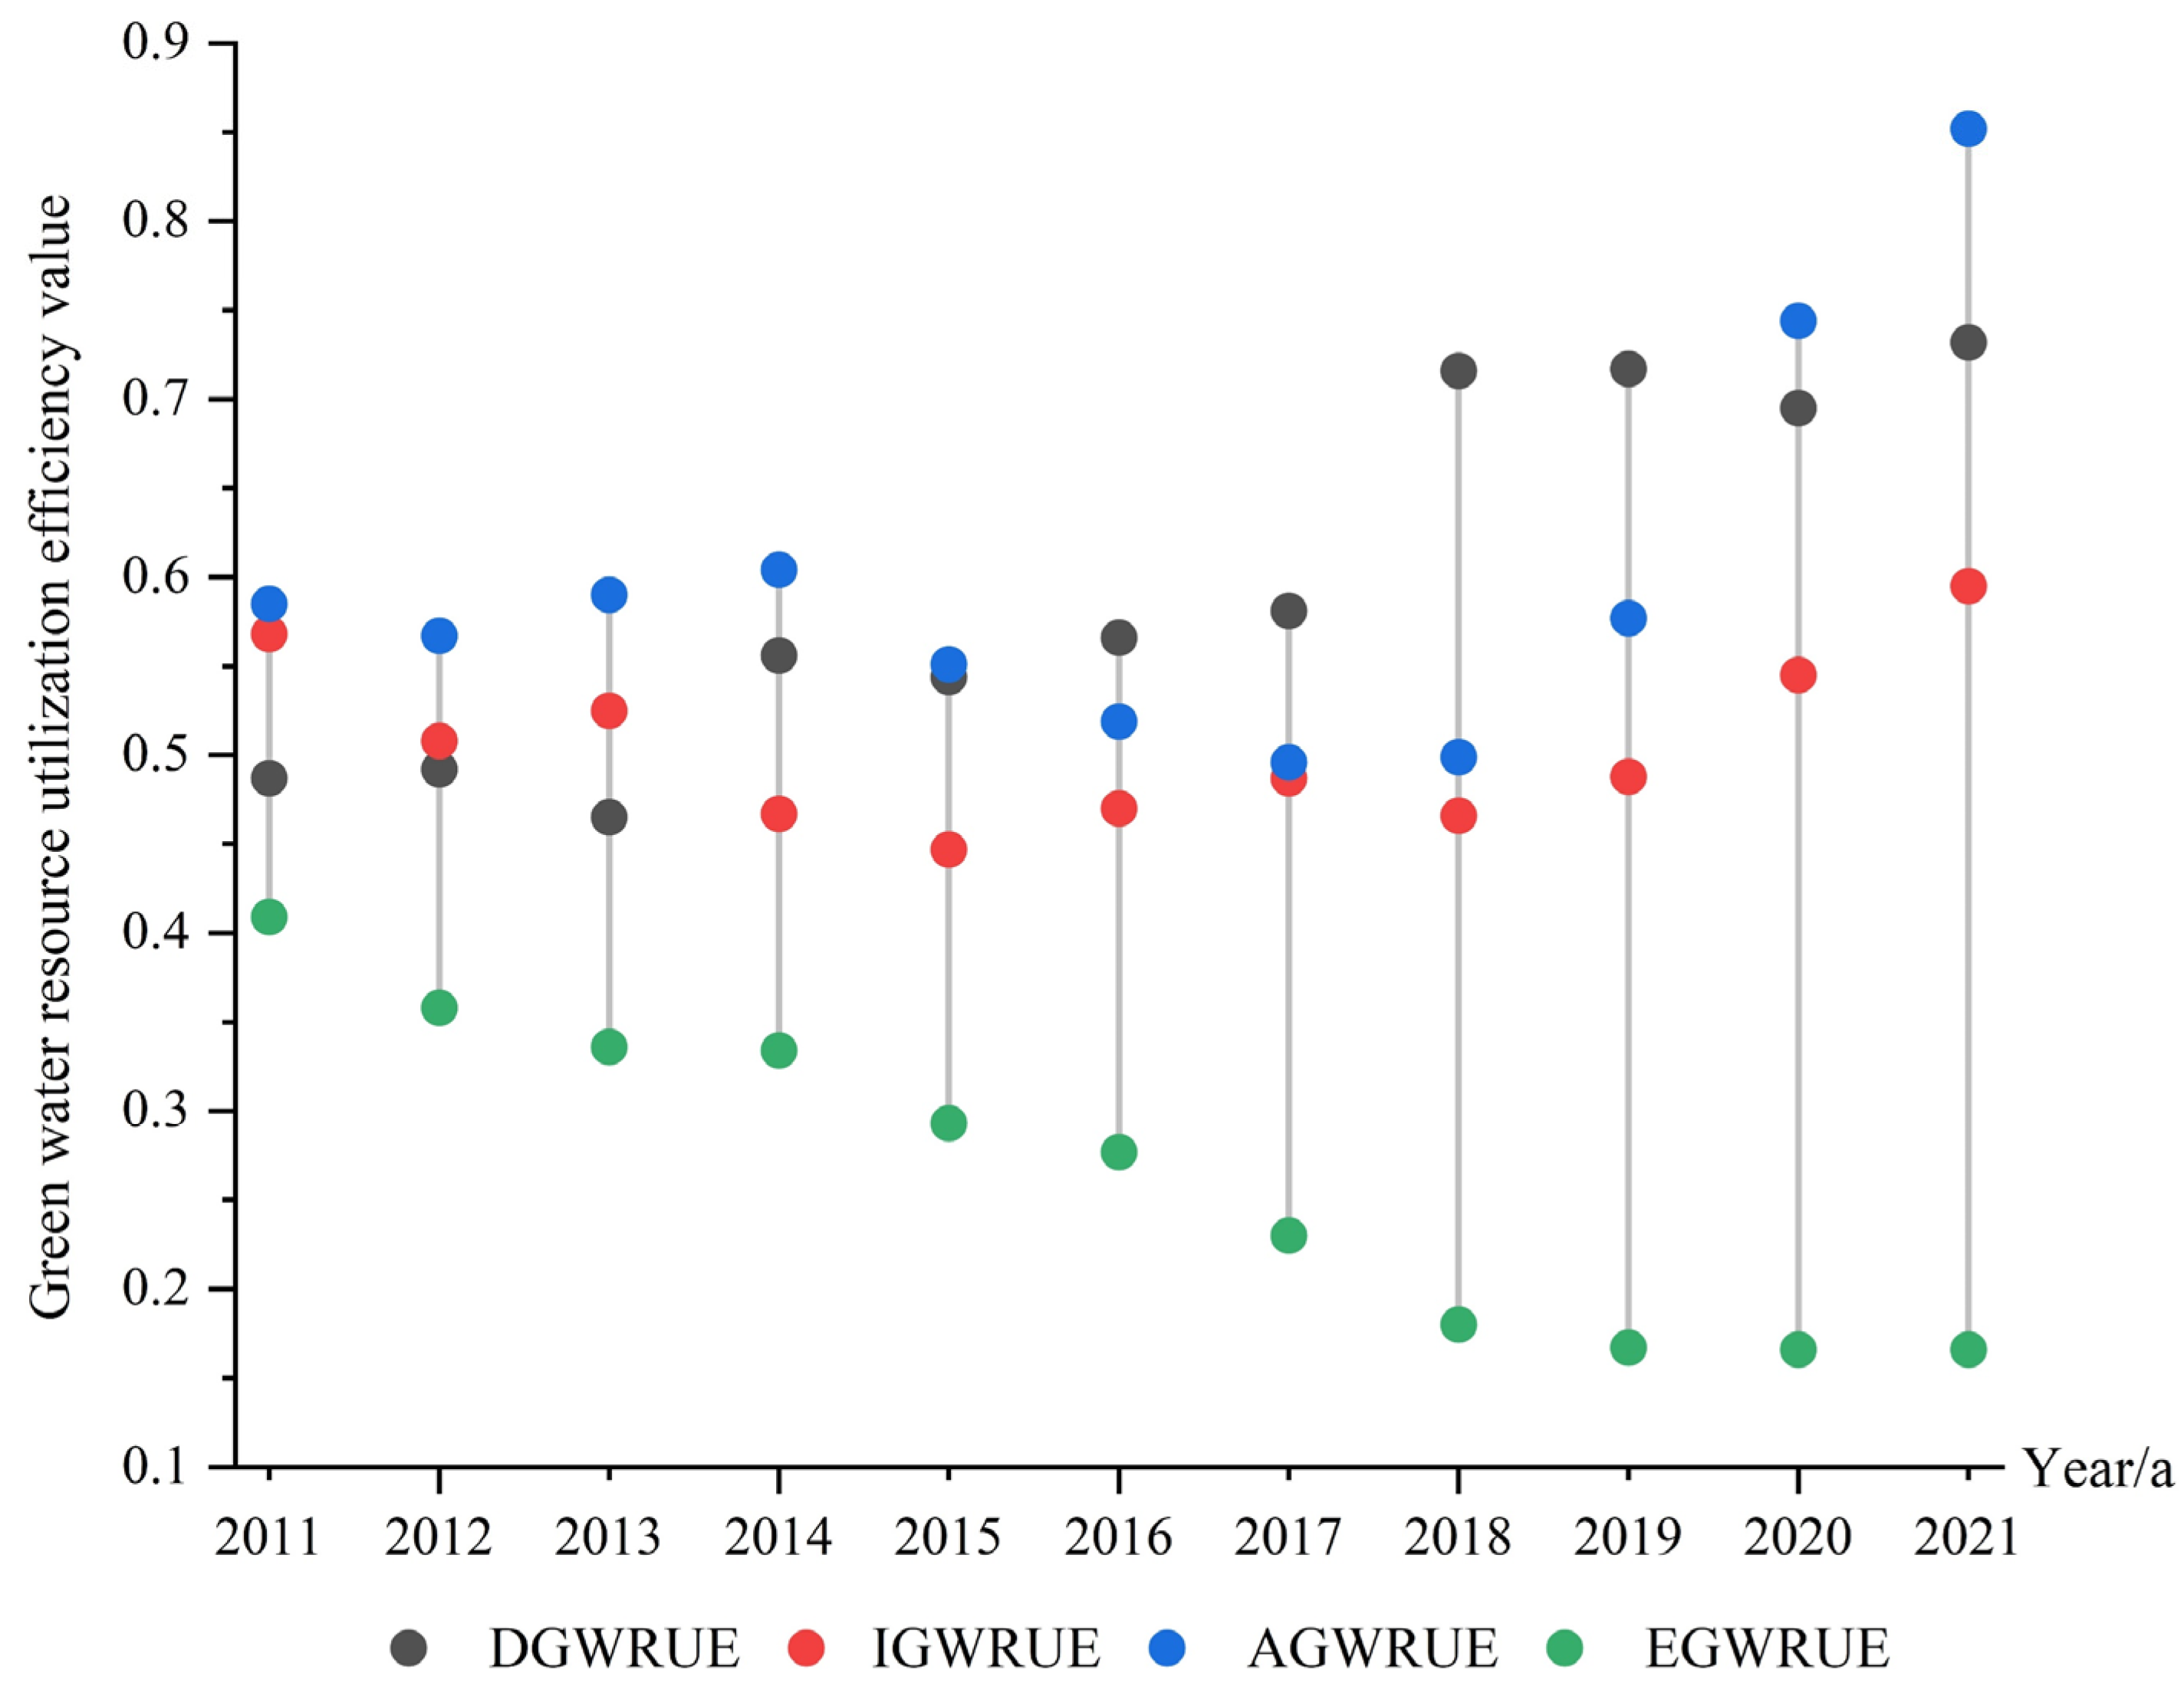
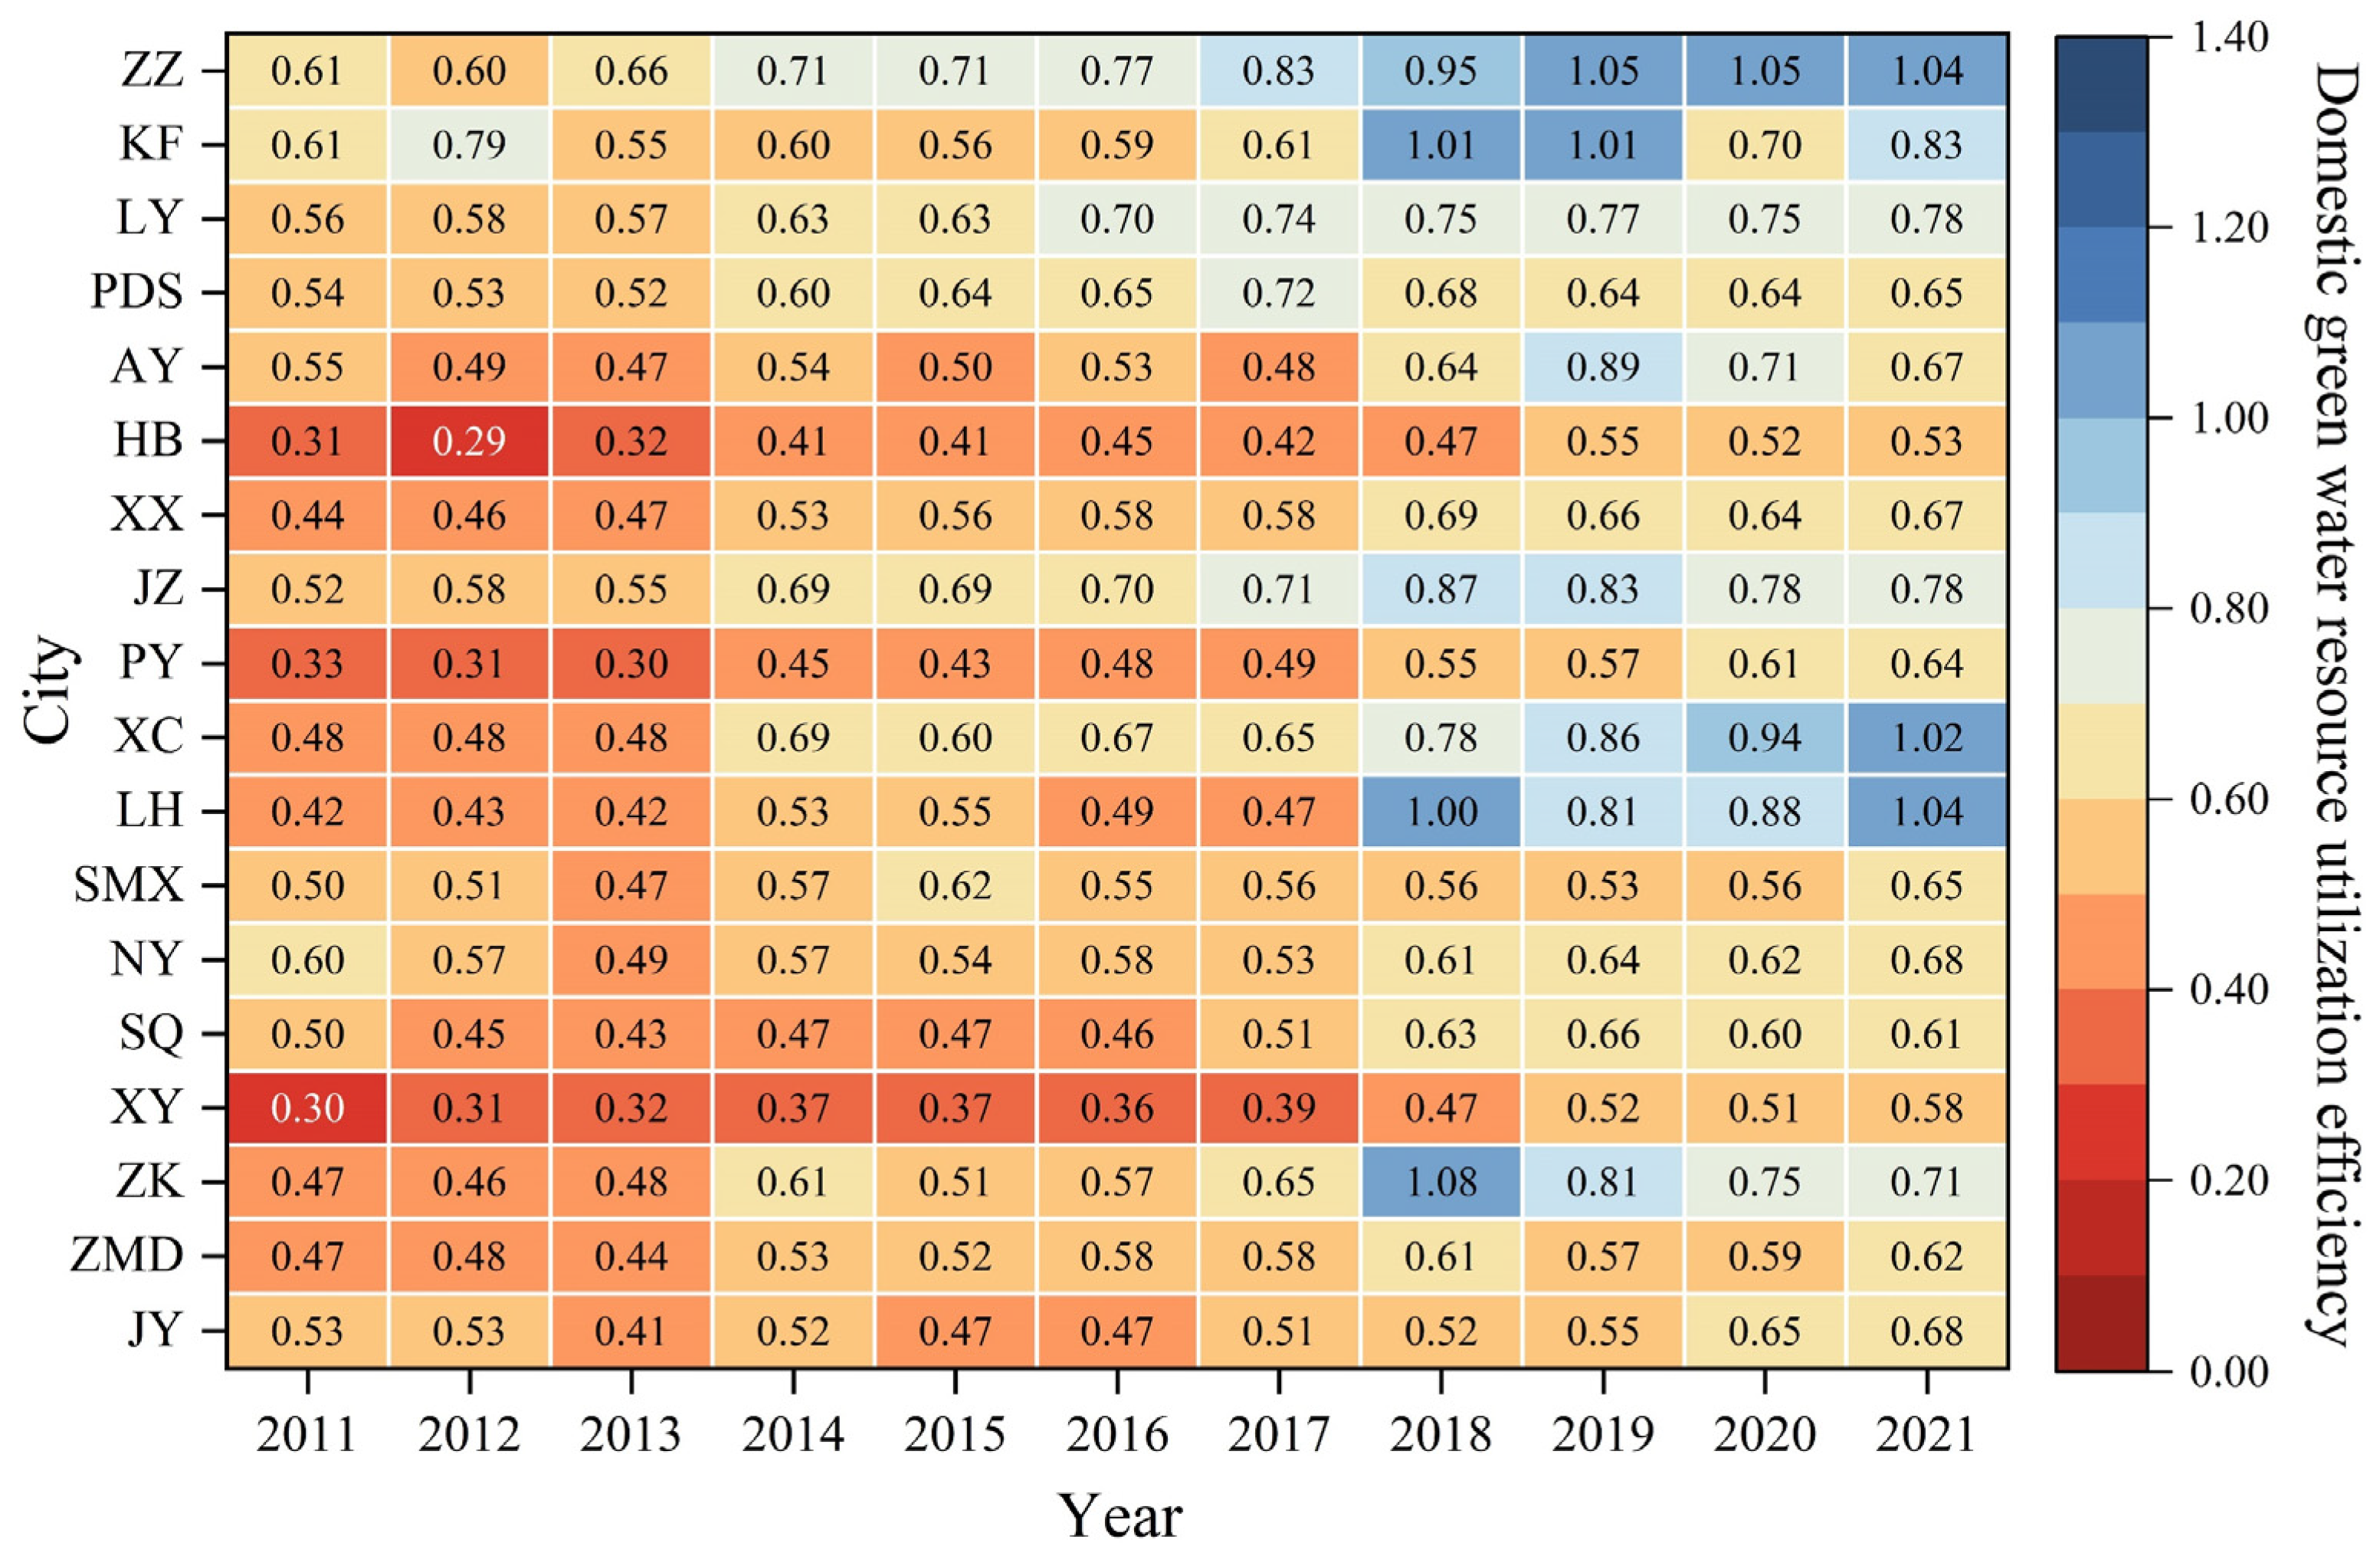
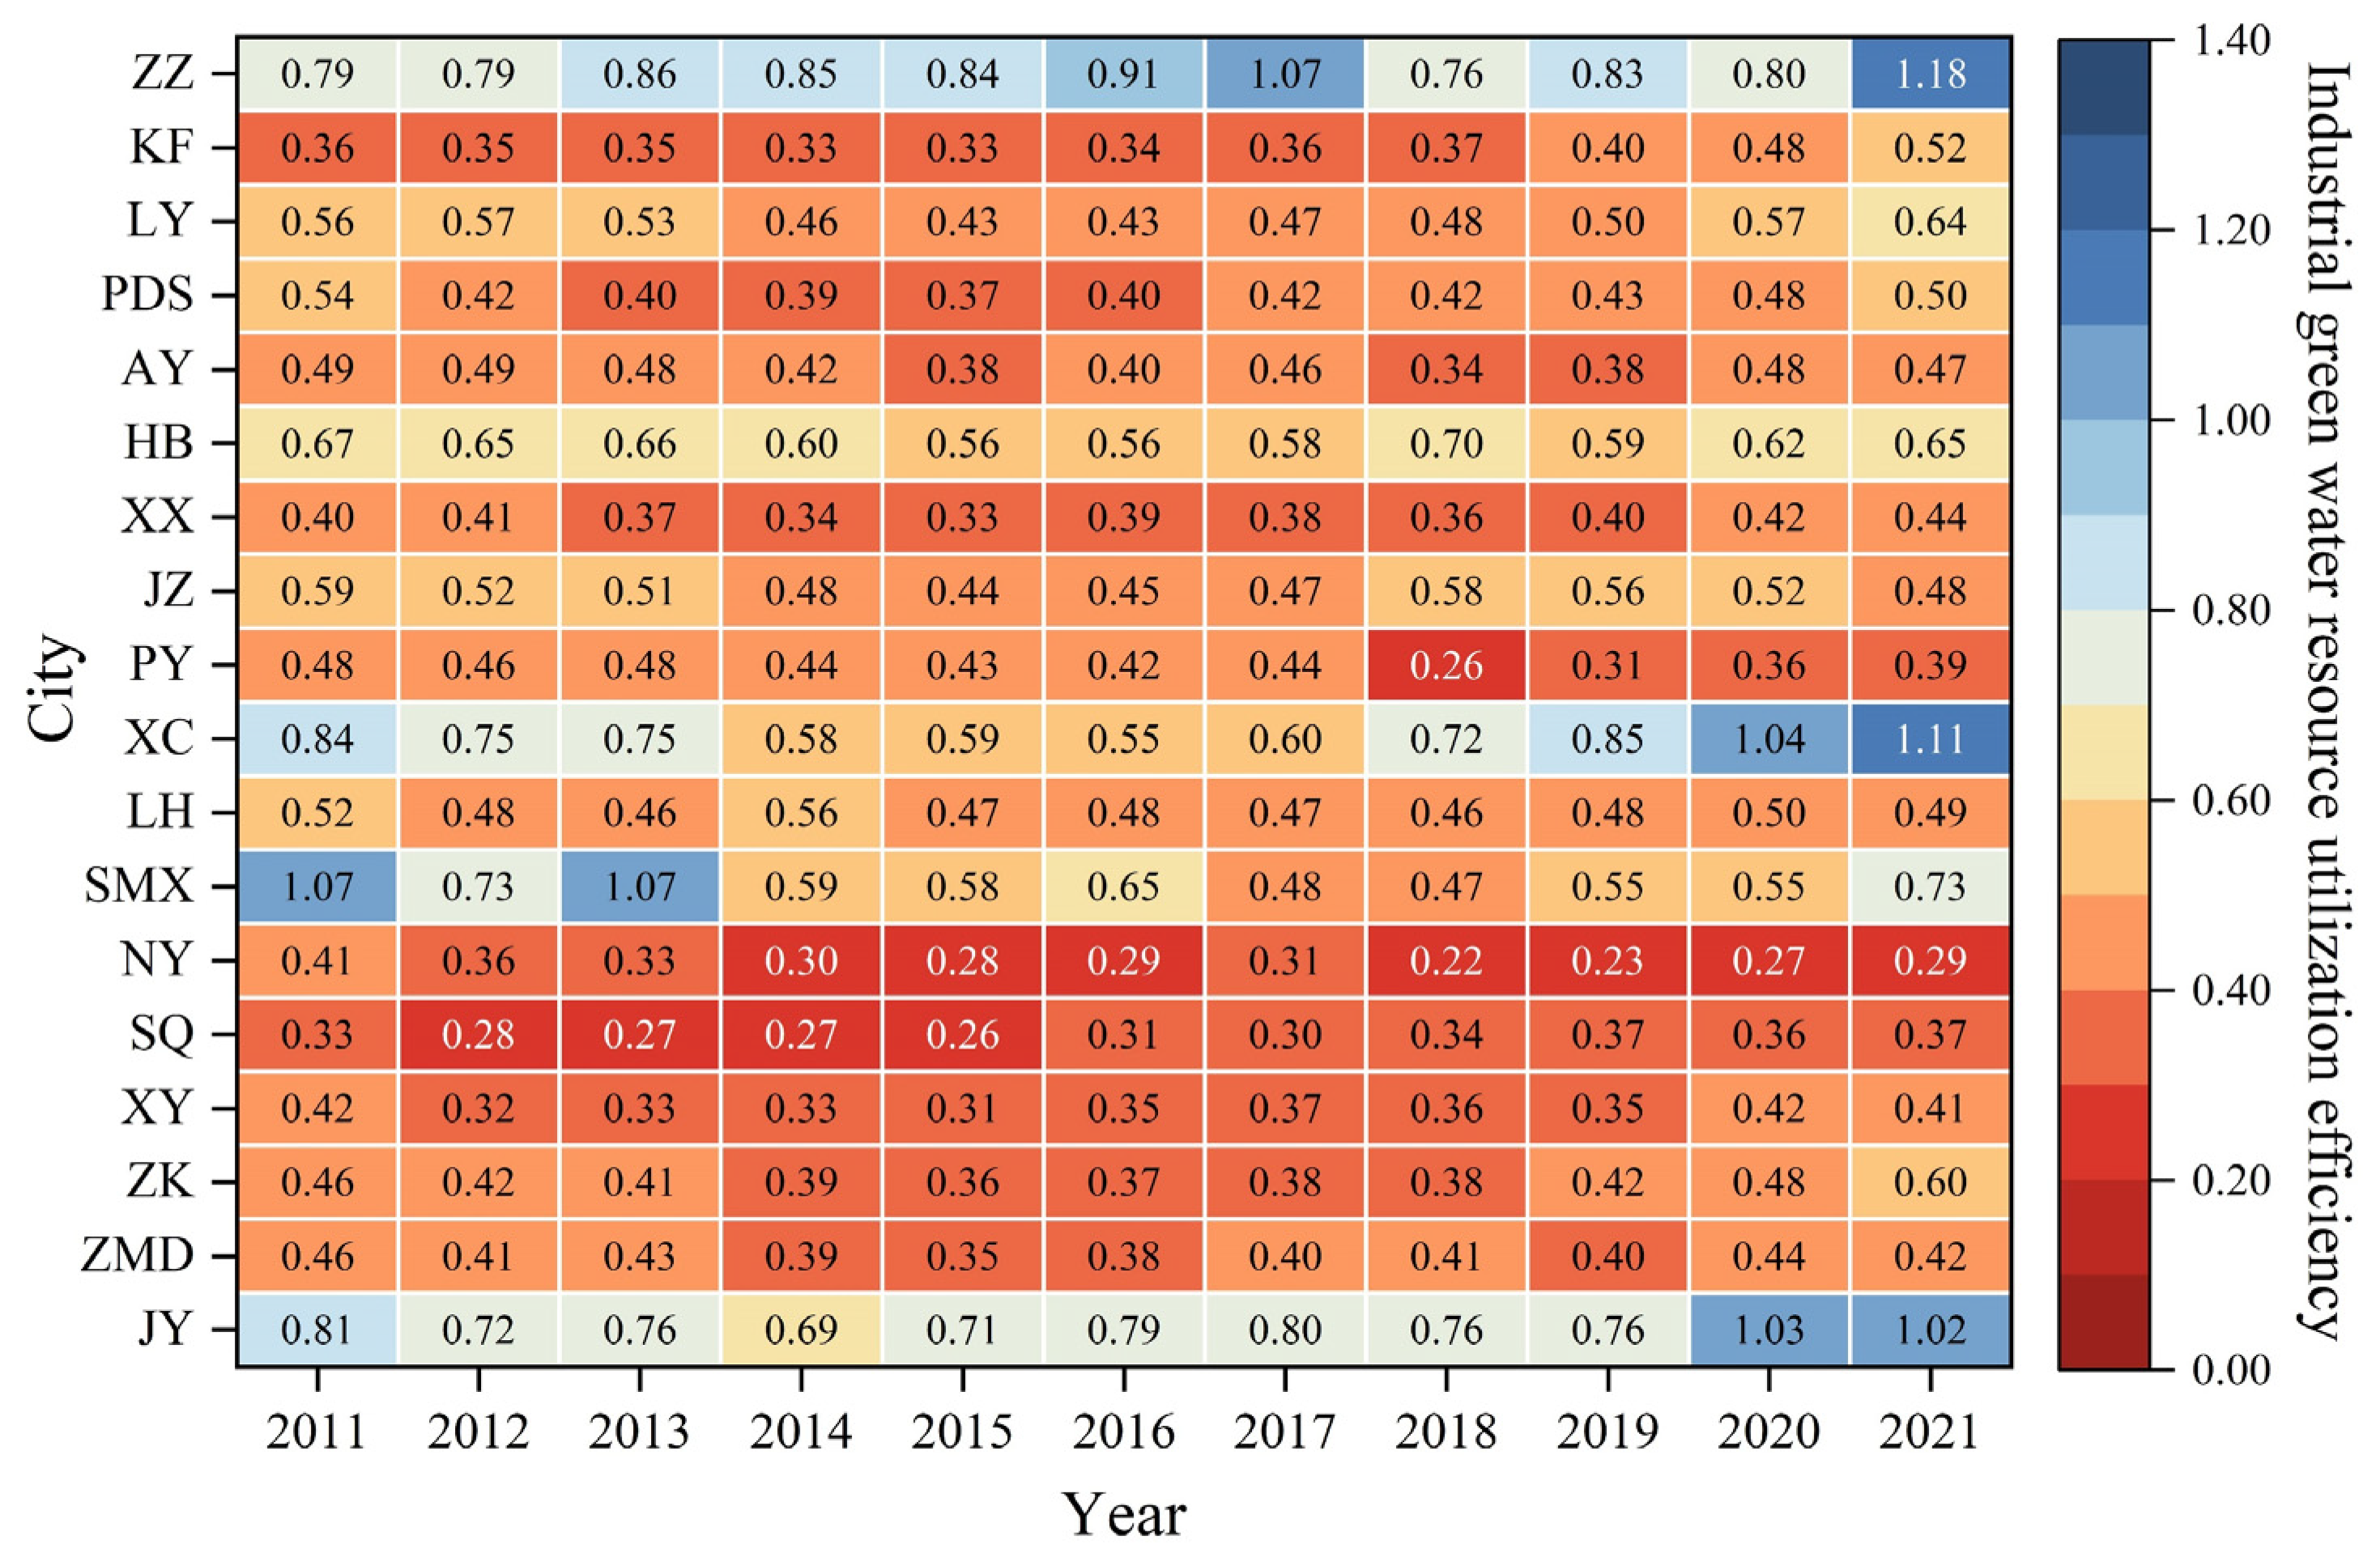
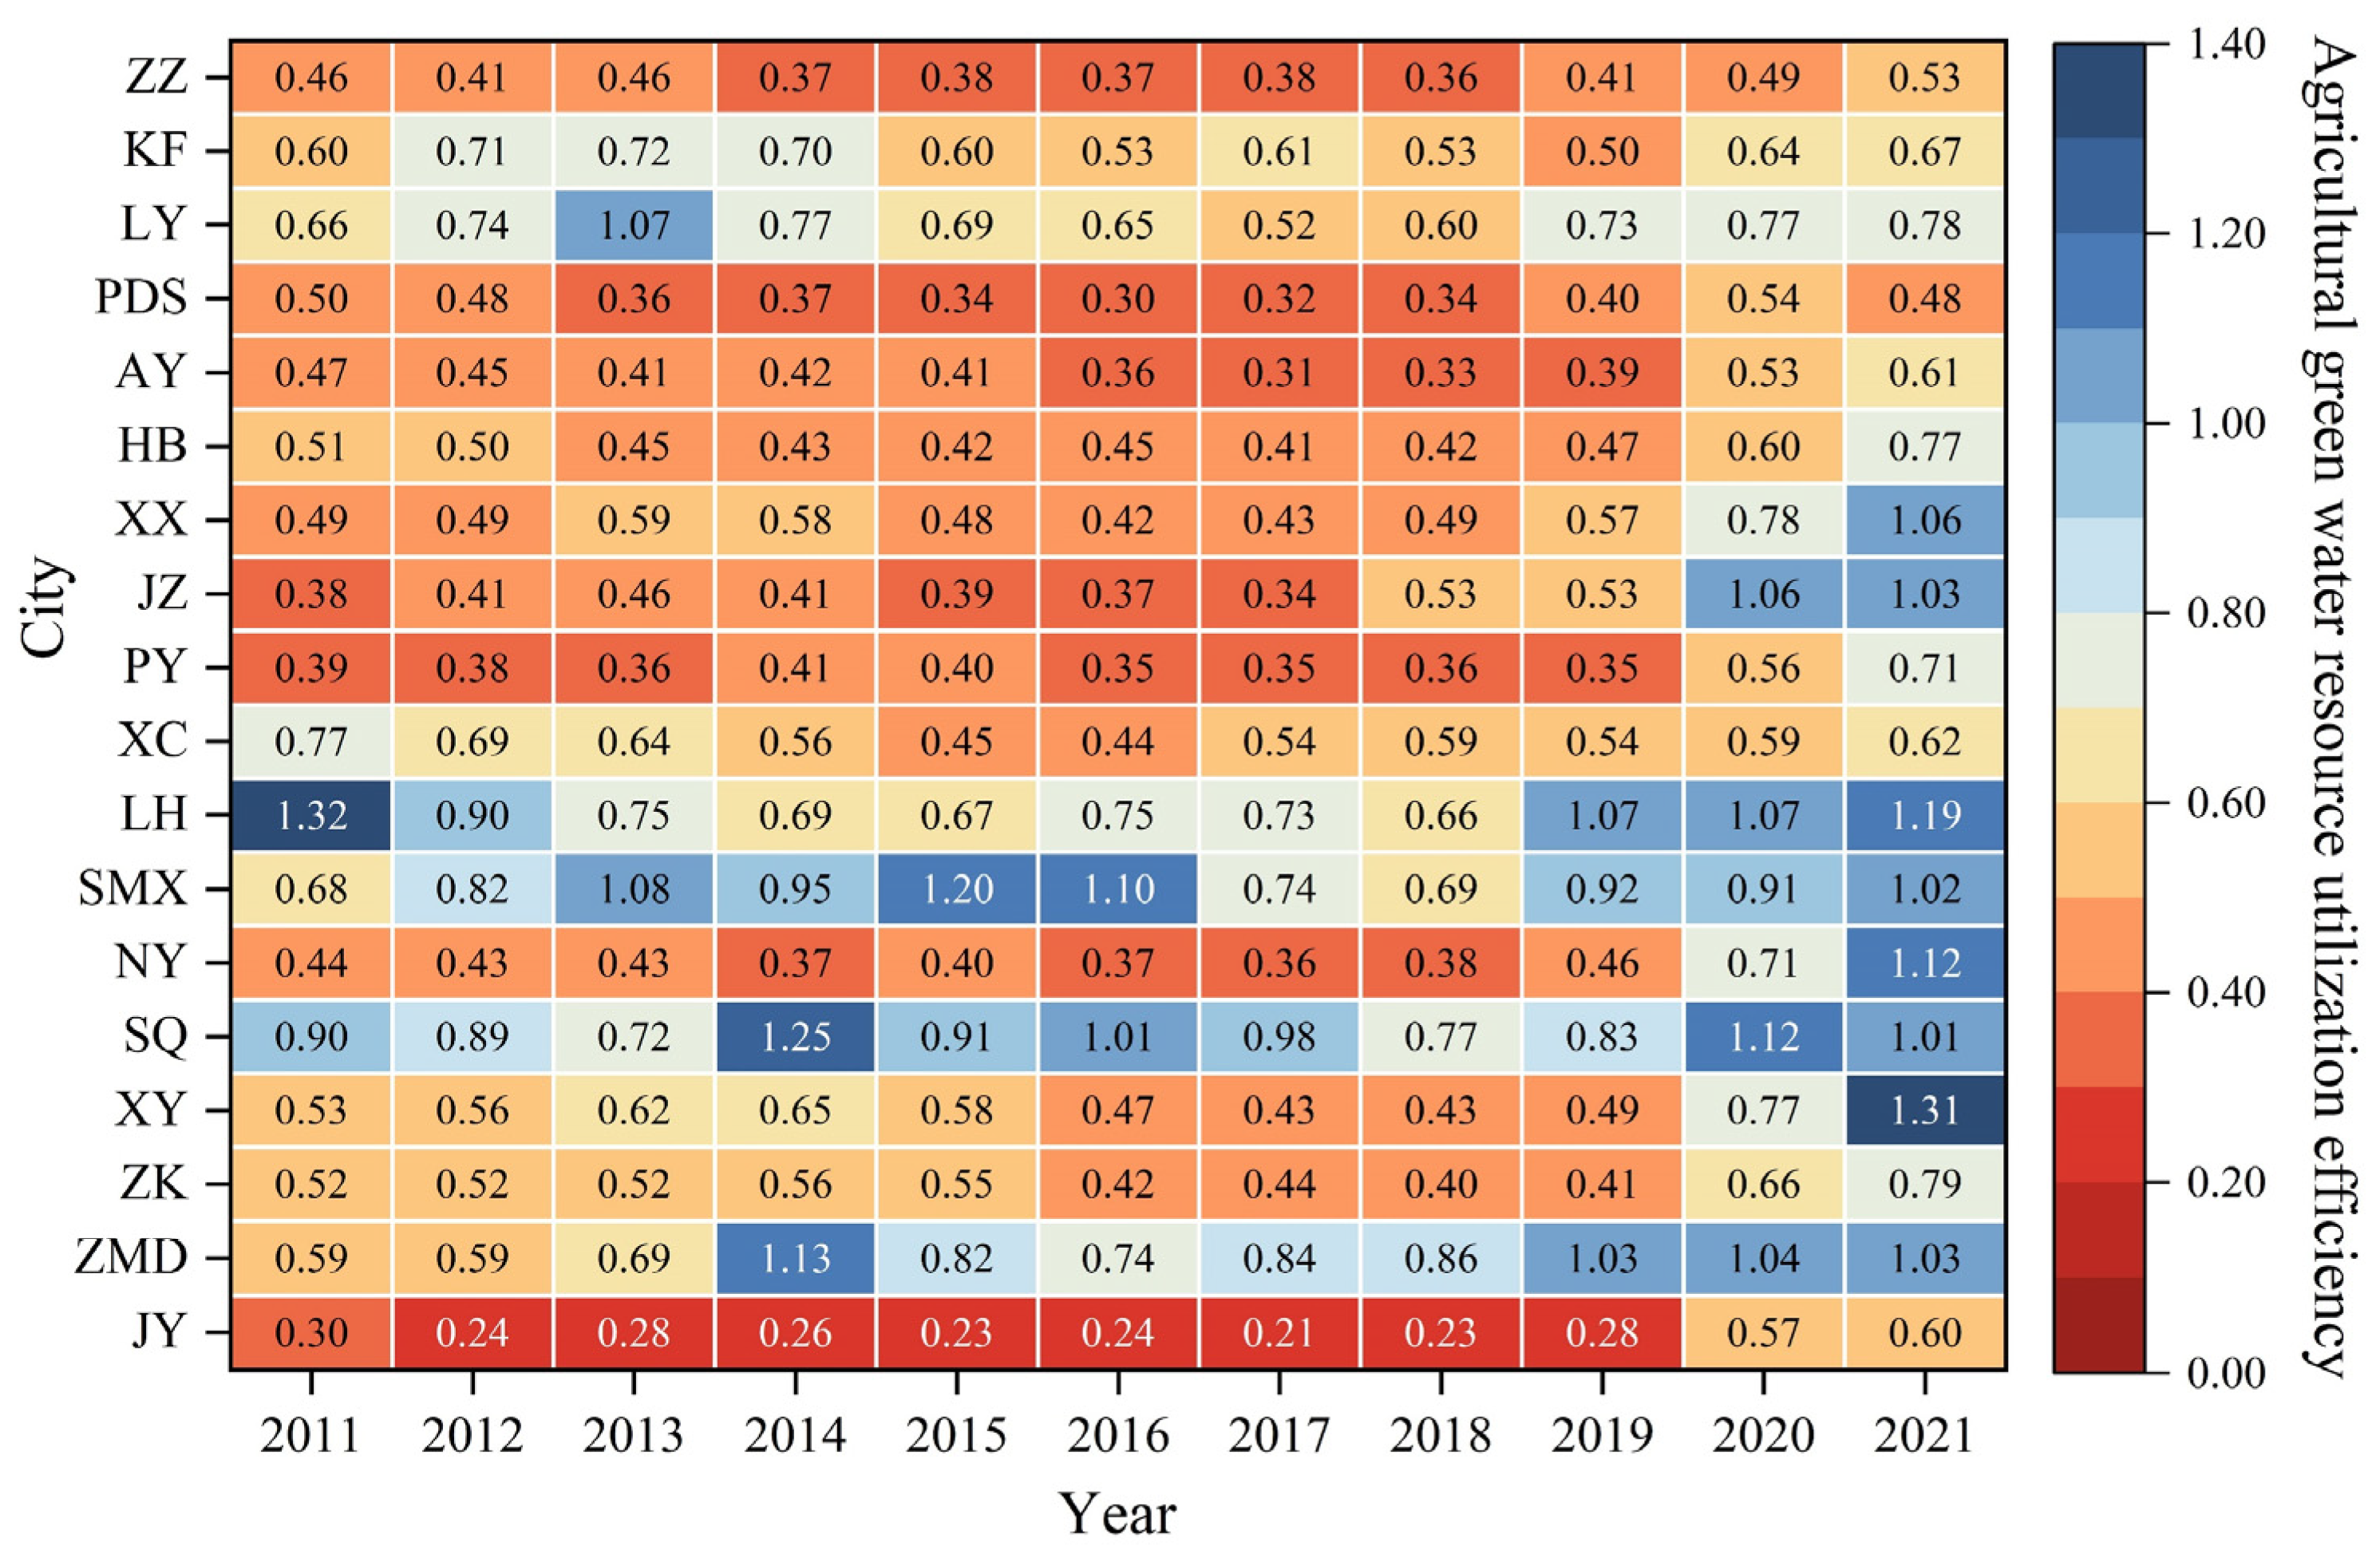
  • During the study period, DWRUE in Henan Province exhibited a fluctuating upward trend; IWRUE and AWRUE showed a downward and then upward trend. EWRUE displayed a downward trend and was at the lowest efficiency level among the four sectors, mainly due to the fact that the input growth rate of urban ecological construction was much larger than that of the outputs; thus, the inputs and outputs did not match each other. The more economically developed a city was, the higher the DGWRUE and IGWRUE were, such as ZZ, where in both values were ranked first among the 18 cities, while the higher level of AGWRUE was mainly concentrated in the southeast region, with SQ’s AGWRUE reaching 0.946; the city with the highest EGWRUE was PY, with its value of 0.795.
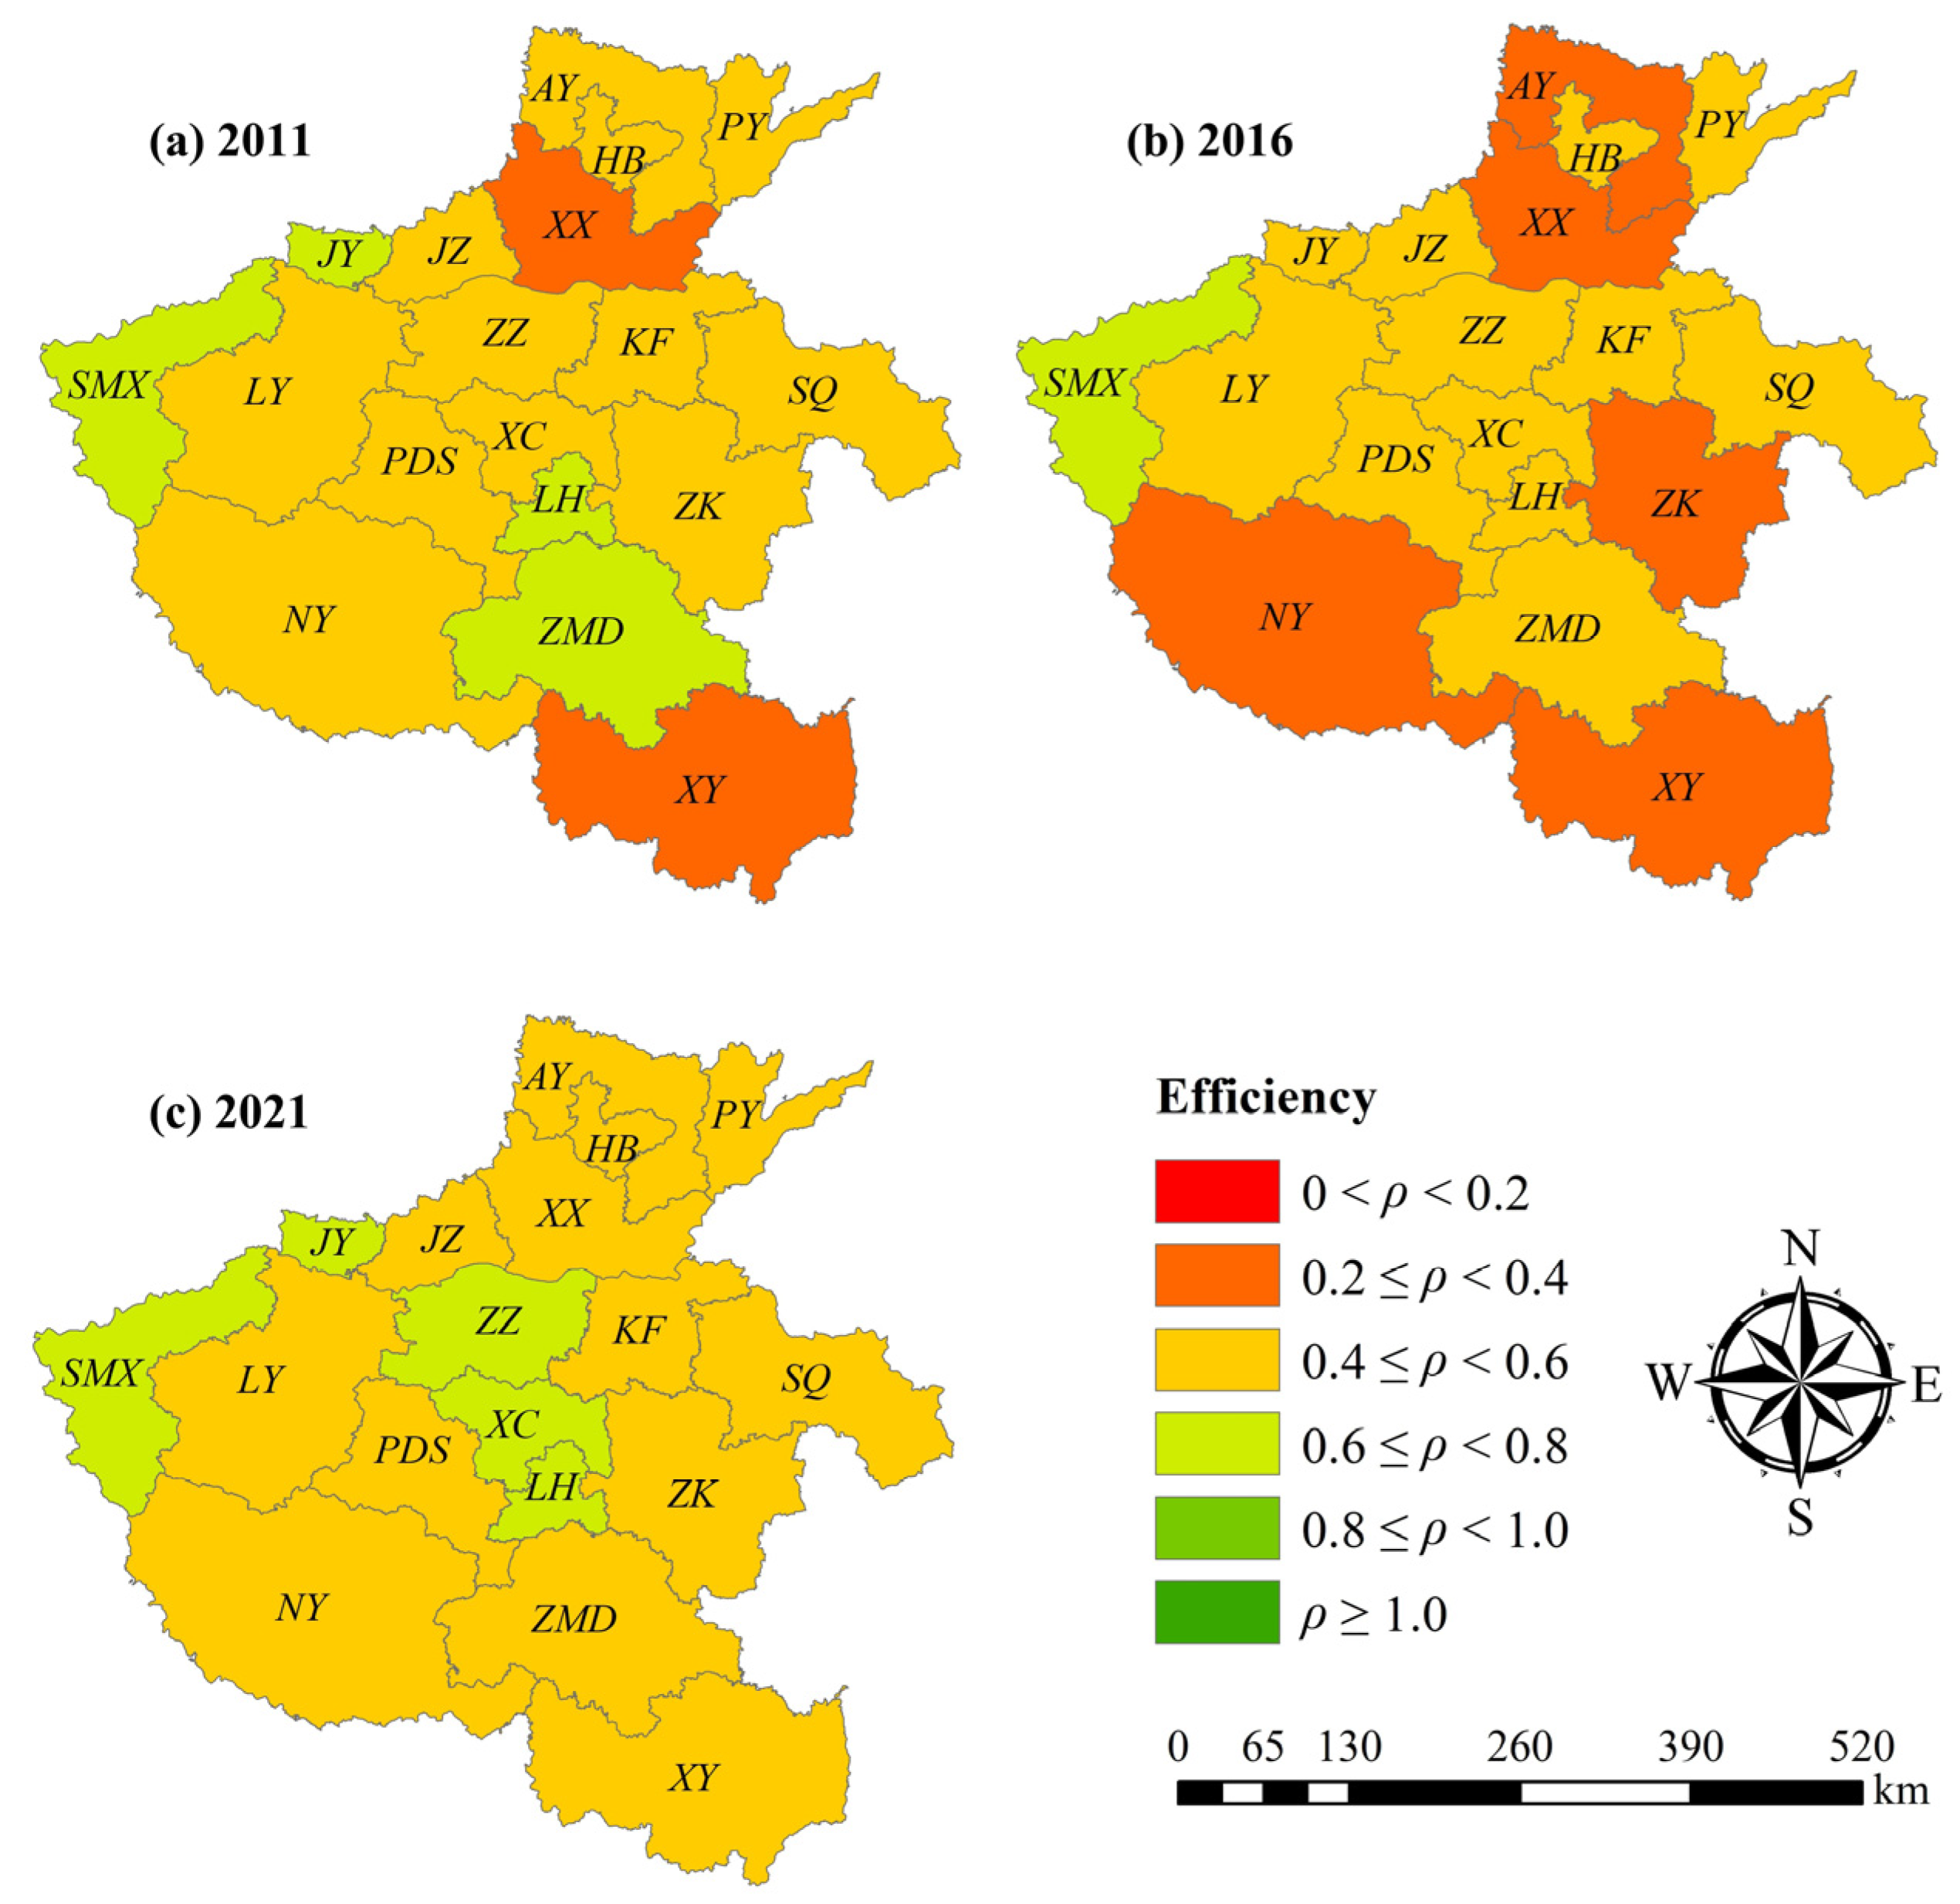
  • The CGWRUE of Henan Province and the 18 cities demonstrated a decreasing and then increasing trend, but the overall level still needs to be improved. From the provincial perspective, the CGWRUE had been at a Medium level during the previous years but underwent a steady increase from 2017–2021, which confirmed the strict implementation of the “double-control” program and the water-saving plan in recent years. At the city level, compared with the “12th Five-Year Plan” period, the CGWRUE of more cities had improved in the “13th Five-Year Plan” period, with the majority of cities in grade IV, characterized by the spatial distribution of which cities in the central and northwestern part were better than those in the southeastern part of Henan Province.
Nevertheless, this study does possess certain limitations. Firstly, the CEEA method operates under partially idealized assumptions. For instance, when accounting for AWCE and AWCA, only the agricultural irrigation behavior itself was considered, without taking into account related behaviors such as fertilizer application, agricultural machinery, etc. EWCA was an approximation based on land types that were closely related to ecological water, but in practice, the CO2 absorption mechanism of ecological water use behaviors was far more complex than described [64,65]. Secondly, due to constraints in data availability, the classification of water use sectors was initially restricted to four categories. With the support of more mature data conditions in the future, a more multi-dimensional water use sectors division scheme and a more detailed input–output indicator system will enhance the representativeness of the model results to reflect the real level of water resource utilization efficiency.

Supplementary Materials

The following supporting information can be downloaded at https://www.mdpi.com/article/10.3390/w15183312/s1, Table S1: Carbon dioxide emissions in domestic water of various cities; Table S2: Carbon dioxide emissions in industrial water of various cities; Table S3: Carbon dioxide emissions in agricultural water of various cities; Table S4: Carbon dioxide absorption in agricultural water of various cities; Table S5: Carbon dioxide absorption in ecological water of various cities; Table S6: Consolidated green water resource utilization efficiency of various cities.

Author Contributions

Conceptualization, formal analysis, funding acquisition, project administration, Q.Z.; data curation, methodology, software, visualization, writing—original draft, C.Z. (Chao Zang), C.Z. (Chenguang Zhao). and Q.W.; investigation, J.M., C.Z. (Chao Zang), C.Z. (Chenguang Zhao) and Q.W.; supervision, Q.Z. and J.M.; resources, Q.Z. and C.Z. (Chao Zang); writing—review and editing, Q.Z., C.Z. (Chao Zang), J.M., C.Z. (Chenguang Zhao) and Q.W. All authors have read and agreed to the published version of the manuscript.

Funding

This research was funded by the Natural Science Foundation of China (no. 52279027) and the National Key Research and Development Program of China (no. 2021YFC3200201).

Institutional Review Board Statement

Not applicable.

Informed Consent Statement

Not applicable.

Data Availability Statement

Publicly available datasets were analyzed in this study. These data can be found and downloaded on relevant websites.

Conflicts of Interest

The authors declare no conflict of interest.

References

  1. Xu, Y.; Ramanathan, V.; Victor, D.G. Global warming will happen faster than we think. Nature 2018, 564, 30–32. [Google Scholar] [CrossRef]
  2. Greve, P.; Kahil, T.; Mochizuki, J.; Schinko, T.; Satoh, Y.; Burek, P.; Fischer, G.; Tramberend, S.; Burtscher, R.; Langan, S.; et al. Global assessment of water challenges under uncertainty in water scarcity projections. Nat. Sustain. 2018, 1, 486–494. [Google Scholar] [CrossRef]
  3. Pltonykova, H.; Koeppel, S.; Bernardini, F.; Tiefenauer-Linardon, S.; de Strasser, L. The United Nations World Water Development Report 2020: Water and Climate Change; UNESCO for UN-Water: Paris, France, 2020; pp. 16–25. [Google Scholar]
  4. Liu, J.; Yang, H.; Gosling, S.N.; Kummu, M.; Flörke, M.; Pfister, S.; Hanasaki, N.; Wada, Y.; Zhang, X.; Zheng, C.; et al. Water scarcity assessments in the past, present, and future. Earth’s Future 2017, 5, 545–559. [Google Scholar] [CrossRef] [PubMed]
  5. Cooper, D.C.; Sehlke, G. Sustainability and energy development: Influences of greenhouse gas emission reduction options on water use in energy production. Environ. Sci. Technol. 2012, 46, 3509–3518. [Google Scholar] [CrossRef]
  6. Hens, L.; Nath, B. The World Summit on Sustainable Development; Springer: Dordrecht, The Netherlands, 2005. [Google Scholar]
  7. Yao, J.; Xu, P.; Huang, Z. Impact of urbanization on ecological efficiency in China: An empirical analysis based on provincial panel data. Ecol. Indic. 2021, 129, 107827. [Google Scholar] [CrossRef]
  8. Zhang, Y.; Song, X.; Wang, X.; Jin, Z.; Chen, F. Multi–Level Fuzzy Comprehensive Evaluation for Water Resources Carrying Capacity in Xuzhou City, China. Sustainability 2023, 15, 11369. [Google Scholar] [CrossRef]
  9. Wu, Y.; Ma, Z.; Li, X.; Sun, L.; Sun, S.; Jia, R. Assessment of water resources carrying capacity based on fuzzy comprehensive evaluation–case study of Jinan, China. Water Supply 2021, 21, 513–524. [Google Scholar] [CrossRef]
  10. Shan, Y.; Huang, Q.; Guan, D.; Hubacek, K. China CO2 emission accounts 2016–2017. Sci. Data 2020, 7, 54. [Google Scholar] [CrossRef] [PubMed]
  11. Meng, Y.; Zhang, X.; She, D.; Wang, J.; Wu, S. The spatial and temporal variation of water use efficiency in the Huai River Basin using a comprehensive indicator. Water Sci. Technol. Water Supply 2017, 17, 229–237. [Google Scholar] [CrossRef]
  12. Aigner, D.; Lovell, C.K.; Schmidt, P. Formulation and estimation of stochastic frontier production function models. J. Econom. 1977, 6, 21–37. [Google Scholar] [CrossRef]
  13. Charnes, A.; Cooper, W.W.; Rhodes, E. Measuring the efficiency of decision making units. Eur. J. Oper. Res. 1978, 2, 429–444. [Google Scholar] [CrossRef]
  14. Tone, K. A slacks–based measure of efficiency in data envelopment analysis. Eur. J. Oper. Res. 2001, 130, 498–509. [Google Scholar] [CrossRef]
  15. Tone, K.; Tsutsui, M. An epsilon–based measure of efficiency in DEA–A third pole of technical efficiency. Eur. J. Oper. Res. 2010, 207, 1554–1563. [Google Scholar] [CrossRef]
  16. Deng, G.; Li, L.; Song, Y. Provincial water use efficiency measurement and factor analysis in China: Based on SBM–DEA model. Ecol. Indic. 2016, 69, 12–18. [Google Scholar] [CrossRef]
  17. Chen, Q.; Ai, H.; Zhang, Y.; Hou, J. Marketization and water resource utilization efficiency in China. Sustain. Comput. Inform. Syst. 2019, 22, 32–43. [Google Scholar] [CrossRef]
  18. Filippini, M.; Hrovatin, N.; Zorić, J. Cost efficiency of Slovenian water distribution utilities: An application of stochastic frontier methods. J. Product. Anal. 2008, 29, 169–182. [Google Scholar] [CrossRef]
  19. Kaneko, S.; Tanaka, K.; Toyota, T.; Managi, S. Water efficiency of agricultural production in China: Regional comparison from 1999 to 2002. Int. J. Agric. Resour. Gov. Ecol. 2004, 3, 231–251. [Google Scholar] [CrossRef]
  20. Alsharif, K.; Feroz, E.H.; Klemer, A.; Raab, R. Governance of water supply systems in the Palestinian Territories: A data envelopment analysis approach to the management of water resources. J. Environ. Manag. 2008, 87, 80–94. [Google Scholar] [CrossRef]
  21. Yang, F.; Wang, D.; Zhao, L.; Wei, F. Efficiency evaluation for regional industrial water use and wastewater treatment systems in China: A dynamic interactive network slacks–based measure model. J. Environ. Manag. 2021, 279, 111721. [Google Scholar] [CrossRef]
  22. Li, X.; Pan, J. China Green Development Index Report 2011; Springer: Berlin/Heidelberg, Germany, 2013; pp. 133–165. [Google Scholar]
  23. Schmidt–Traub, G.; De la Mothe Karoubi, E.; Espey, J. Indicators and a monitoring framework for the sustainable development goals: Launching a data revolution for the SDGs; Sustainable Development Solutions Network: New York, NY, USA, 2015. [Google Scholar]
  24. Sustainable Development Solutions Network. Indicators and a monitoring framework for the Sustainable Development Goals: Launching a data revolution for the SDGs. A Report to the Secretary–General of the United Nations by the Leadership Council of the Sustainable Development Solutions Network; Sustainable Development Solutions Network: New York, NY, USA, 2015. [Google Scholar]
  25. National Water Conservation Action Program. Shanxi Water Resour. 2019, 35, 5–9.
  26. Ma, H.; Ding, Y.; Wang, L. Measurement and convergence analysis of green water utilization efficiency. J. Nat. Resour. 2017, 32, 406–417. [Google Scholar] [CrossRef]
  27. Zhou, X.; Luo, R.; Yao, L.; Cao, S.; Wang, S.; Lev, B. Assessing integrated water use and wastewater treatment systems in China: A mixed network structure two–stage SBM DEA model. J. Clean. Prod. 2018, 185, 533–546. [Google Scholar] [CrossRef]
  28. Song, M.; Wang, R.; Zeng, X. Water resources utilization efficiency and influence factors under environmental restrictions. J. Clean. Prod. 2018, 184, 611–621. [Google Scholar] [CrossRef]
  29. Zhang, W.; Wang, D.; Liu, X. Does financial agglomeration promote the green efficiency of water resources in China? Environ. Sci. Pollut. Res. 2021, 28, 56628–56641. [Google Scholar] [CrossRef]
  30. Huang, C.; Yin, K.; Liu, Z.; Cao, T. Spatial and temporal differences in the green efficiency of water resources in the Yangtze River Economic Belt and their influencing factors. Int. J. Environ. Res. Public Health 2021, 18, 3101. [Google Scholar] [CrossRef]
  31. Xu, R.; Wu, Y.; Wang, G.; Zhang, X.; Wu, W.; Xu, Z. Evaluation of industrial water use efficiency considering pollutant discharge in China. PLoS ONE 2019, 14, e0221363. [Google Scholar] [CrossRef]
  32. Liu, X.Y.; Peng, D.Y. Green efficiency of industrial water resource in china and its influencing factors: Empirical evidence from China’s 30 provinces. Appl. Ecol. Environ. Res. 2020, 18, 3057–3072. [Google Scholar] [CrossRef]
  33. Huang, Y.; Huang, X.; Xie, M.; Cheng, W.; Shu, Q. A study on the effects of regional differences on agricultural water resource utilization efficiency using super–efficiency SBM model. Sci. Rep. 2021, 11, 9953. [Google Scholar] [CrossRef]
  34. Xu, R.; Gao, J. Evolutionary Trends, Regional Differences and Influencing Factors of the Green Efficiency of Agricultural Water Use in China Based on WF–GTWR Model. Int. J. Environ. Res. Public Health 2023, 20, 1946. [Google Scholar] [CrossRef]
  35. Duan, C.; Chen, B. Energy–water–carbon nexus at urban scale. Energy Procedia 2016, 104, 183–190. [Google Scholar] [CrossRef]
  36. Valek, A.M.; Sušnik, J.; Grafakos, S. Quantification of the urban water–energy nexus in México City, México, with an assessment of water–system related carbon emissions. Sci. Total Environ. 2017, 590, 258–268. [Google Scholar] [CrossRef] [PubMed]
  37. Zuo, Q.; Zhang, Z.; Ma, J.; Zhao, C.; Qin, X. Carbon Dioxide Emission Equivalent Analysis of Water Resource Behaviors: Determination and Application of CEEA Function Table. Water 2023, 15, 431. [Google Scholar] [CrossRef]
  38. Tone, K. A slacks–based measure of super–efficiency in data envelopment analysis. Eur. J. Oper. Res. 2002, 143, 32–41. [Google Scholar] [CrossRef]
  39. Tang, J.; Wang, H.; Li, B.; Shen, X. Comparative analysis of China’s regional energy efficiency: Based on the Super–efficiency–SBM–DEA model and clustering method. In Modeling and Computation in Engineering III; CRC Press: Boca Raton, FL, USA, 2014; pp. 265–272. [Google Scholar] [CrossRef]
  40. Cheng, G. Data Envelopment Analysis: Methods and MaxDEA Software; Intellectual Property Publishing House: Beijing, China, 2022; pp. 178–183. [Google Scholar]
  41. Ouyang, Z.; Zhu, C.; Yang, G.; Xu, W.H.; Zheng, H.; Zhang, Y.; Xiao, Y. Gross ecosystem product: Concept, accounting framework and case study. Acta Ecol. Sin. 2013, 33, 6747–6761. [Google Scholar] [CrossRef]
  42. Wang, L.; Su, K.; Jiang, X.; Zhou, X.; Yu, Z.; Chen, Z.; Wei, C.; Zhang, Y.; Liao, Z.; Liao, Z. Measuring gross ecosystem product (GEP) in Guangxi, China, from 2005 to 2020. Land 2022, 11, 1213. [Google Scholar] [CrossRef]
  43. Qiu, M.; Zuo, Q.; Wu, Q.; Yang, Z.; Zhang, J. Water ecological security assessment and spatial autocorrelation analysis of prefectural regions involved in the Yellow River Basin. Sci. Rep. 2022, 12, 5105. [Google Scholar] [CrossRef]
  44. Zuo, Q.; Zhou, K.; Yang, L. Study on the quantity of water resources and the water quantity for ecosystem use in water resources programming. Arid Land Geogr. 2002, 4, 296–301. [Google Scholar] [CrossRef]
  45. Sun, K.; Liu, C.; Yang, Z.; Han, J.; Xie, W.; Cao, Y. The impact of industrial structure on the environment pollution and its spatial–temporal differences in Henan, China. J. Clean. Prod. 2022, 381, 135127. [Google Scholar] [CrossRef]
  46. Xiao, D.; Niu, H.; Guo, J.; Zhao, S.; Fan, L. Carbon Storage change analysis and emission reduction suggestions under land use transition: A case study of Henan Province, China. Int. J. Environ. Res. Public Health 2021, 18, 1844. [Google Scholar] [CrossRef]
  47. Zhou, Y.; Li, X.; Liu, Y. Cultivated land protection and rational use in China. Land Use Policy 2021, 106, 105454. [Google Scholar] [CrossRef]
  48. Ouyang, X.; Tang, L.; Wei, X.; Li, Y. Spatial interaction between urbanization and ecosystem services in Chinese urban agglomerations. Land Use Policy 2021, 109, 105587. [Google Scholar] [CrossRef]
  49. Ge, D.; Long, H. Coupling relationship between land use transitions and grain yield in the Huang–Huai–Hai Plain, China. In Proceedings of the 2017 6th International Conference on Agro–Geoinformatics, Fairfax VA, USA, 7–10 August 2017; IEEE: Piscataway, NJ, USA, 2017; pp. 1–6. [Google Scholar] [CrossRef]
  50. Zuo, Q.; Jin, R.; Ma, J.; Cui, G. China pursues a strict water resources management system. Environ. Earth Sci. 2014, 72, 2219–2222. [Google Scholar] [CrossRef]
  51. Sanming, X. Predication of the Industrial Growth Rate in 2014 and Analysis and Report on the Industrial Prospect Index. In Economic Analysis and Forecast of China (2015); Springer: Berlin/Heidelberg, Germany, 2017; pp. 91–108. [Google Scholar] [CrossRef]
  52. Zhang, W.; Du, J.; Wang, Y.; Li, J.; Feng, P.; Sun, H.; Qiao, G.; Sun, X.; Li, S. Bottleneck and development path of water resources protection and utilization in Henan Province in the new era. Nat. Resour. Conserv. Res. 2021, 4, 96–107. [Google Scholar] [CrossRef]
  53. Gao, Y.; Zhao, D.; Yu, L.; Yang, H. Influence of a new agricultural technology extension mode on farmers’ technology adoption behavior in China. J. Rural Stud. 2020, 76, 173–183. [Google Scholar] [CrossRef]
  54. Wei, J.; Lei, Y.; Yao, H.; Ge, J.; Wu, S.; Liu, L. Estimation and influencing factors of agricultural water efficiency in the Yellow River basin, China. J. Clean. Prod. 2021, 308, 127249. [Google Scholar] [CrossRef]
  55. Liu, P.; Liu, H.; Wang, J.; Chang, G. Analysis of the characteristics of major pollutants discharged from wastewater in China’s provinces. Environ. Monit. Assess. 2023, 195, 1030. [Google Scholar] [CrossRef]
  56. Notice of the General Office of Henan Provincial People’s Govern on the issuance of Henan Province water pollution prevention and control of 9 implementation programs. Bull. Henan Prov. People’s Gov. 2017, 8, 18–56.
  57. Ramaiah, M.; Avtar, R. Urban green spaces and their need in cities of rapidly urbanizing India: A review. Urban Sci. 2019, 3, 94. [Google Scholar] [CrossRef]
  58. Wang, X.; Tomaney, J. Zhengzhou–Political economy of an emerging Chinese megacity. Cities 2019, 84, 104–111. [Google Scholar] [CrossRef]
  59. Xu, R.; Wang, W.; Wang, Y.; Zhang, B. Can Water Knowledge Change Citizens’ Water Behavior? A Case Study in Zhengzhou, China. Ekoloji Derg. 2019, 107, 1019–1027. Available online: https://search.ebscohost.com/login.aspx?direct=true&db=eih&AN=136264724&lang=zh-cn&site=ehost-live (accessed on 9 August 2023).
  60. Cao, Y.; Zhang, W.; Ren, J. Efficiency analysis of the input for water–saving agriculture in China. Water 2020, 12, 207. [Google Scholar] [CrossRef]
  61. Notice of the General Office of Henan Provincial People’s Govern on the issuance of the implementation program of double–control work on total water consumption and intensity for the 13th Five–Year Plan in Henan Province. Bull. Henan Prov. People’s Gov. 2017, 9, 52–55.
  62. Zhang, C.; Wu, Y.; Yu, Y. Spatial decomposition analysis of water intensity in China. Socio–Econ. Plan. Sci. 2020, 69, 100680. [Google Scholar] [CrossRef]
  63. Ding, X.; Tang, N.; He, J. The threshold effect of environmental regulation, FDI agglomeration, and water utilization efficiency under “double control actions”—An empirical test based on Yangtze river economic belt. Water 2019, 11, 452. [Google Scholar] [CrossRef]
  64. Zhao, F.; Wu, Y.; Yao, Y.; Sun, K.; Zhang, X.; Winowiecki, L.; Vågen, T.G.; Xu, J.; Qiu, L.; Sun, P.; et al. Predicting the climate change impacts on water–carbon coupling cycles for a loess hilly–gully watershed. J. Hydrol. 2020, 581, 124388. [Google Scholar] [CrossRef]
  65. Field, C.B.; Randerson, J.T.; Malmström, C.M. Global net primary production: Combining ecology and remote sensing. Remote Sens. Environ. 1995, 51, 74–88. [Google Scholar] [CrossRef]
Figure 1. The multiple water use sectoral GWRUE input–output indicator system. (LI: labor inputs; CI: capital inputs; WI: water resource inputs; DO: desirable outputs; UDO: undesirable outputs; AFAFI: the agriculture, forestry, animal husbandry, and fishery industry; WEPI: the water, environment, and public facilities management industry).
Water 15 03312 g001
Figure 2. The study area.
Water 15 03312 g002
Figure 3. The trend of CE, CA, and WCEE from the water use sectors in Henan Province.
Water 15 03312 g003
Figure 4. The trend of WCEE from the water use sectors in various cities of Henan Province.
Water 15 03312 g004
Figure 5. The trend of different water use sectoral GWRUE in Henan Province.
Water 15 03312 g005
Figure 6. DGWRUE of each city in Henan Province from 2011 to 2021.
Water 15 03312 g006
Figure 7. IGWRUE of each city in Henan Province from 2011 to 2021.
Water 15 03312 g007
Figure 8. AGWRUE of each city in Henan Province from 2011 to 2021.
Water 15 03312 g008
Figure 9. EGWRUE of each city in Henan Province from 2011 to 2021.
Water 15 03312 g009
Figure 10. The trend of CGWRUE in Henan Province from 2011 to 2021.
Water 15 03312 g010
Figure 11. The spatial trend of CGWRUE in cities of Henan Province in 2011, 2016, and 2021.
Water 15 03312 g011
Table 1. The standards for classifying the GWRUE levels and grades.
RangeLevelGradeRangeLevel Grade
[1.0, +∞)ExcellentI[0.4, 0.6)MediumIV
[0.8, 1.0)GreatII[0.2, 0.4)PoorV
[0.6, 0.8)GoodIII(0, 0.2)BadVI
Table 2. Multi-year average GWRUE ranking, value, and level of various urban water use sectors in Henan Province.
RankingCityDGWRUE
Value
GradeCityIGWRUE
Value
GradeCityAGWRUE
Value
GradeCityEGWRUE
Value
Grade
1ZZ0.815IIZZ0.879IISQ0.946IIPY0.795III
2KF0.714IIIJY0.805IISMX0.918IIJY0.535IV
3JZ0.700IIIXC0.762IIILH0.891IILH0.442IV
4XC0.697IIISMX0.679IIIZMD0.851IIZMD0.416IV
5LY0.679IIIHB0.621IIILY0.725IIIHB0.297V
6ZK0.645IIILY0.513IVXY0.622IIIKF0.294V
7LH0.641IIIJZ0.509IVKF0.618IIISMX0.257V
8PDS0.619IIILH0.488IVXC0.585IVPDS0.253V
9AY0.590IVAY0.434IVXX0.580IVZZ0.246V
10NY0.583IVPDS0.433IVJZ0.537IVAY0.222V
11XX0.571IVZK0.426IVZK0.526IVNY0.209V
12SMX0.552IVZMD0.408IVNY0.499IVZK0.152VI
13ZMD0.547IVPY0.406IVHB0.493IVJZ0.143VI
14JY0.532IVXX0.386VAY0.426IVLY0.126VI
15SQ0.528IVKF0.382VPY0.421IVXX0.107VI
16PY0.47IVXY0.361VZZ0.420IVXY0.099VI
17HB0.425IVSQ0.315VPDS0.403IVXC0.092VI
18XY0.409IVNY0.300VJY0.312VSQ0.085VI
Table 3. Multi-year average CGWRUE ranking, value, and level for each city in Henan Province.
RankingCityCGWRUE ValueGradeRankingCityDGWRUE ValueGrade
1LH0.616III10JZ0.472IV
2SMX0.602III11SQ0.468IV
3ZZ0.590IV12HB0.459IV
4ZMD0.556IV13ZK0.437IV
5JY0.546IV14PDS0.427IV
6XC0.534IV15AY0.418IV
7PY0.523IV16XX0.411IV
8LY0.511IV17NY0.398V
9KF0.502IV18XY0.373V
Disclaimer/Publisher’s Note: The statements, opinions and data contained in all publications are solely those of the individual author(s) and contributor(s) and not of MDPI and/or the editor(s). MDPI and/or the editor(s) disclaim responsibility for any injury to people or property resulting from any ideas, methods, instructions or products referred to in the content.

