
Integration of Electrical Resistivity Tomography and Seismic Refraction Tomography to Investigate Subsiding Sinkholes in Karst Areas


 , ,
, ,  , ,
, ,
Abstract
:1. Introduction
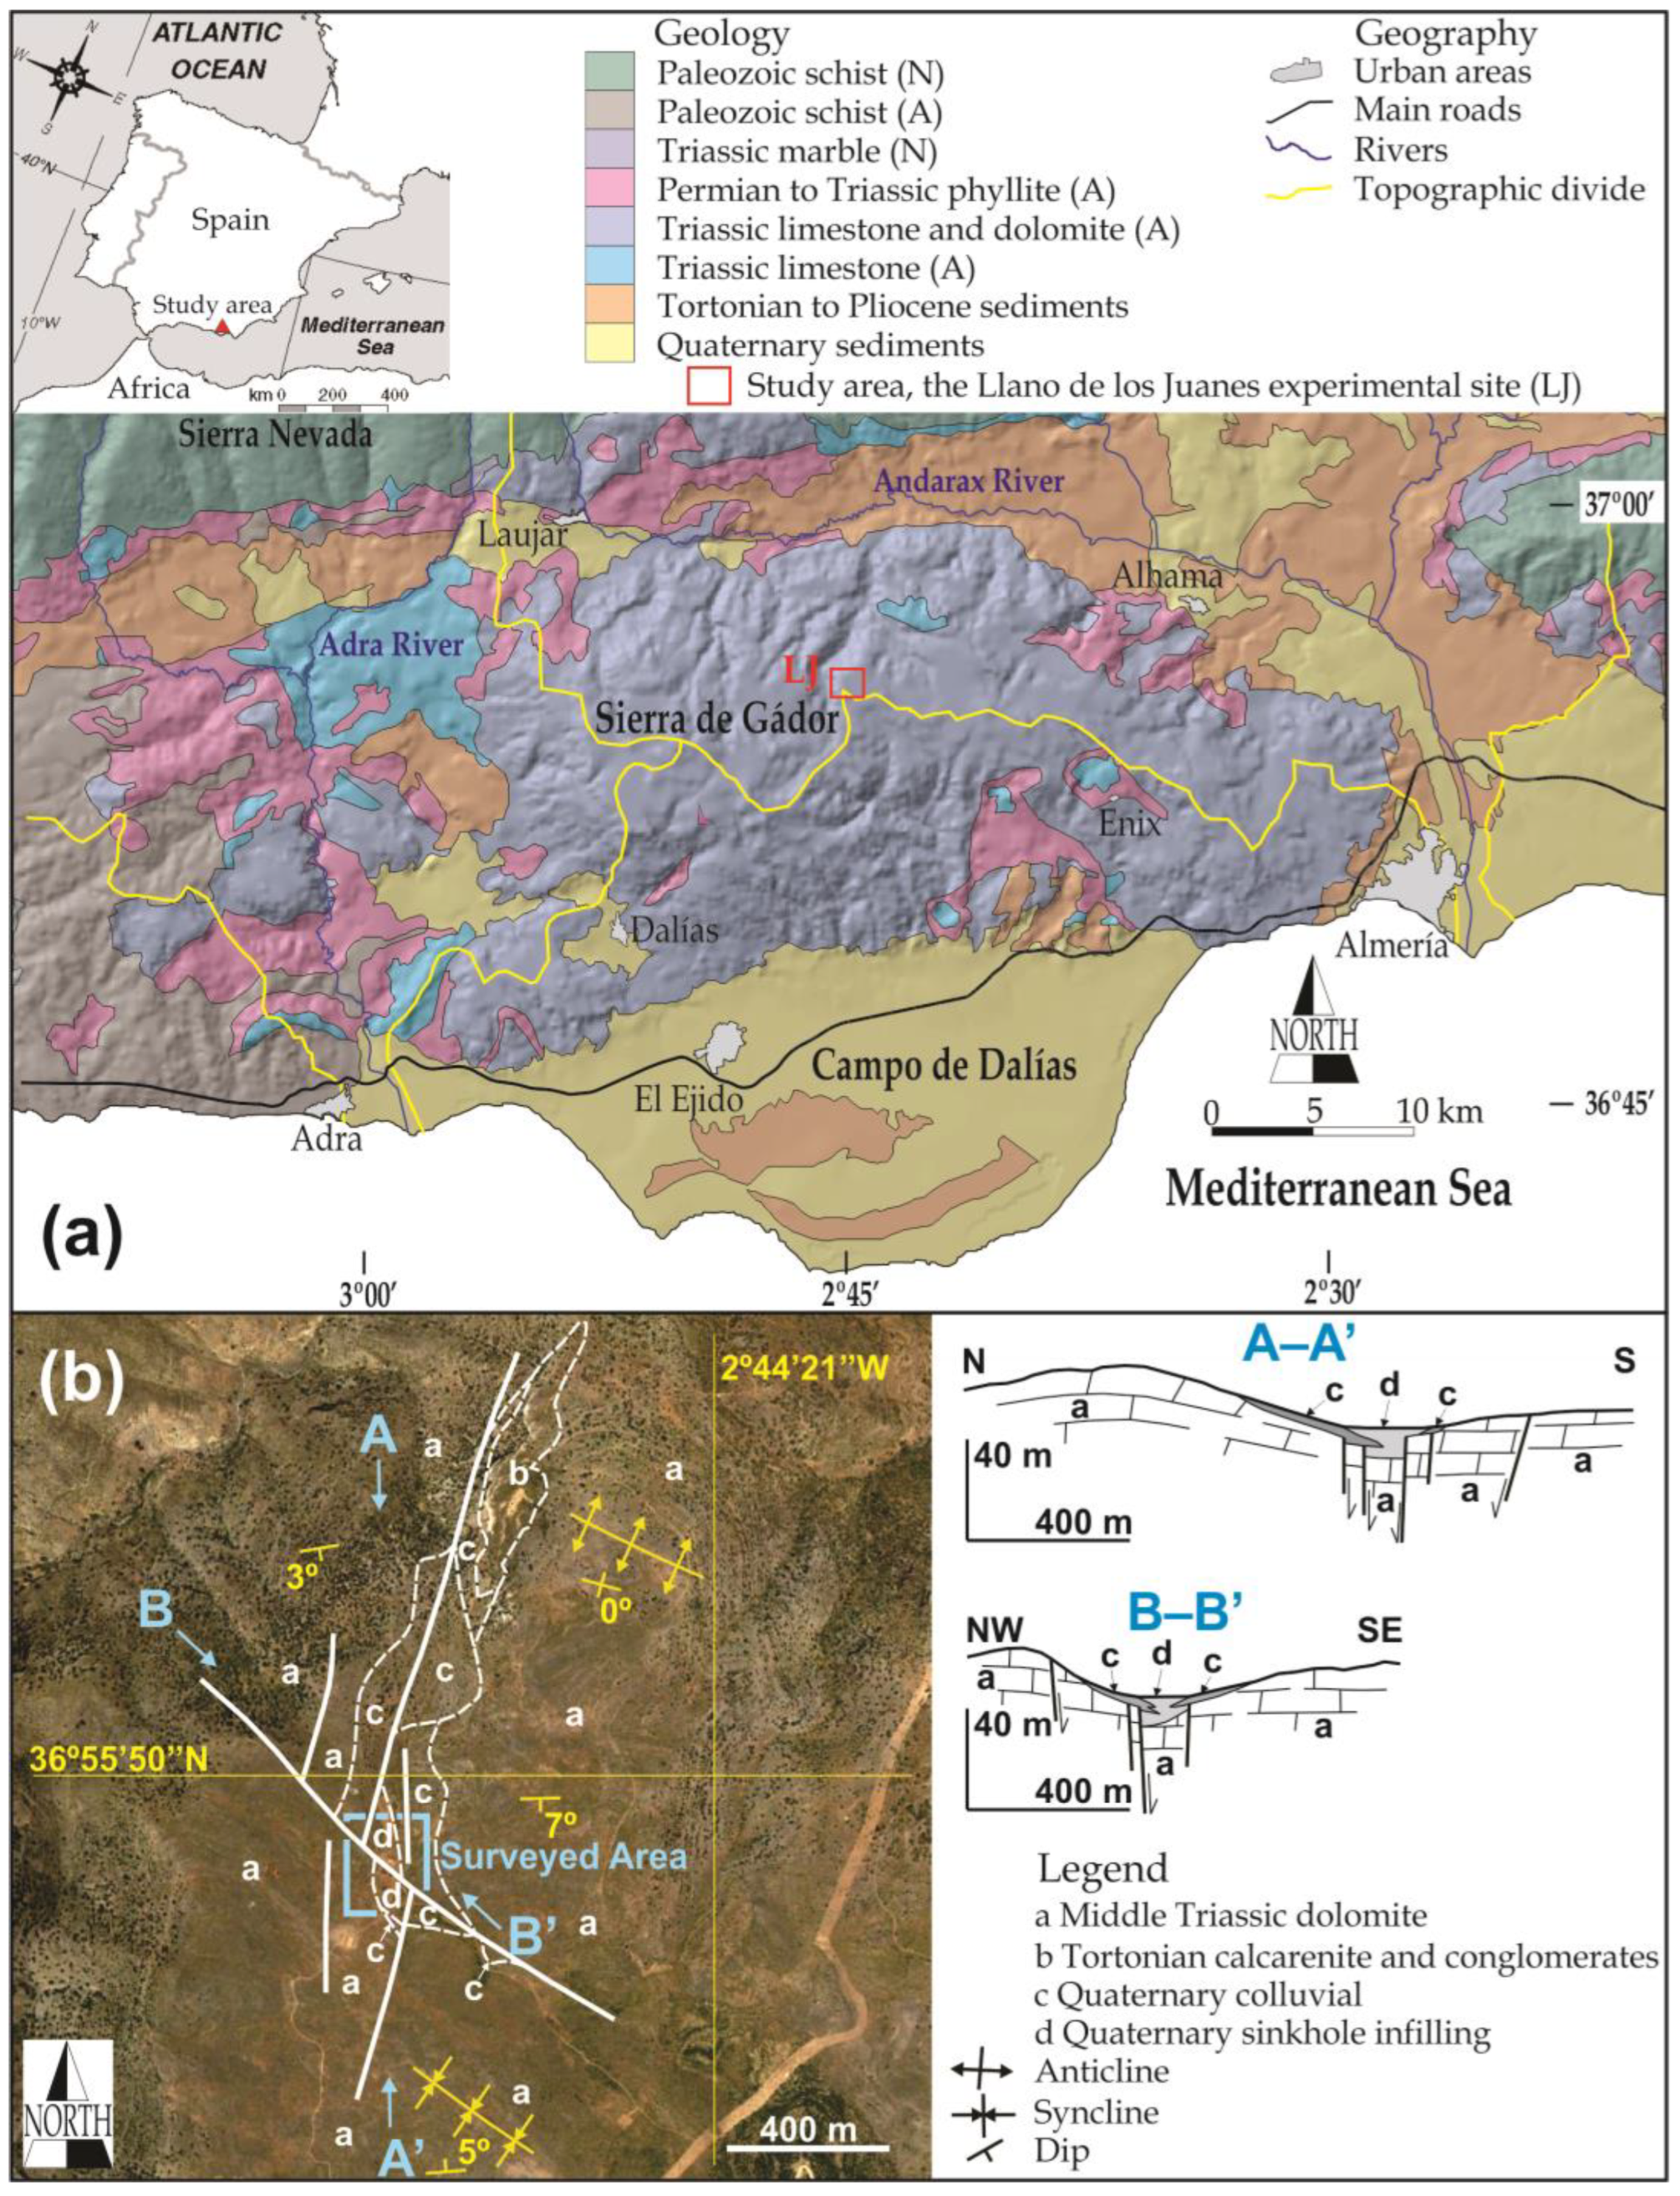
2. Study Area
3. Methods
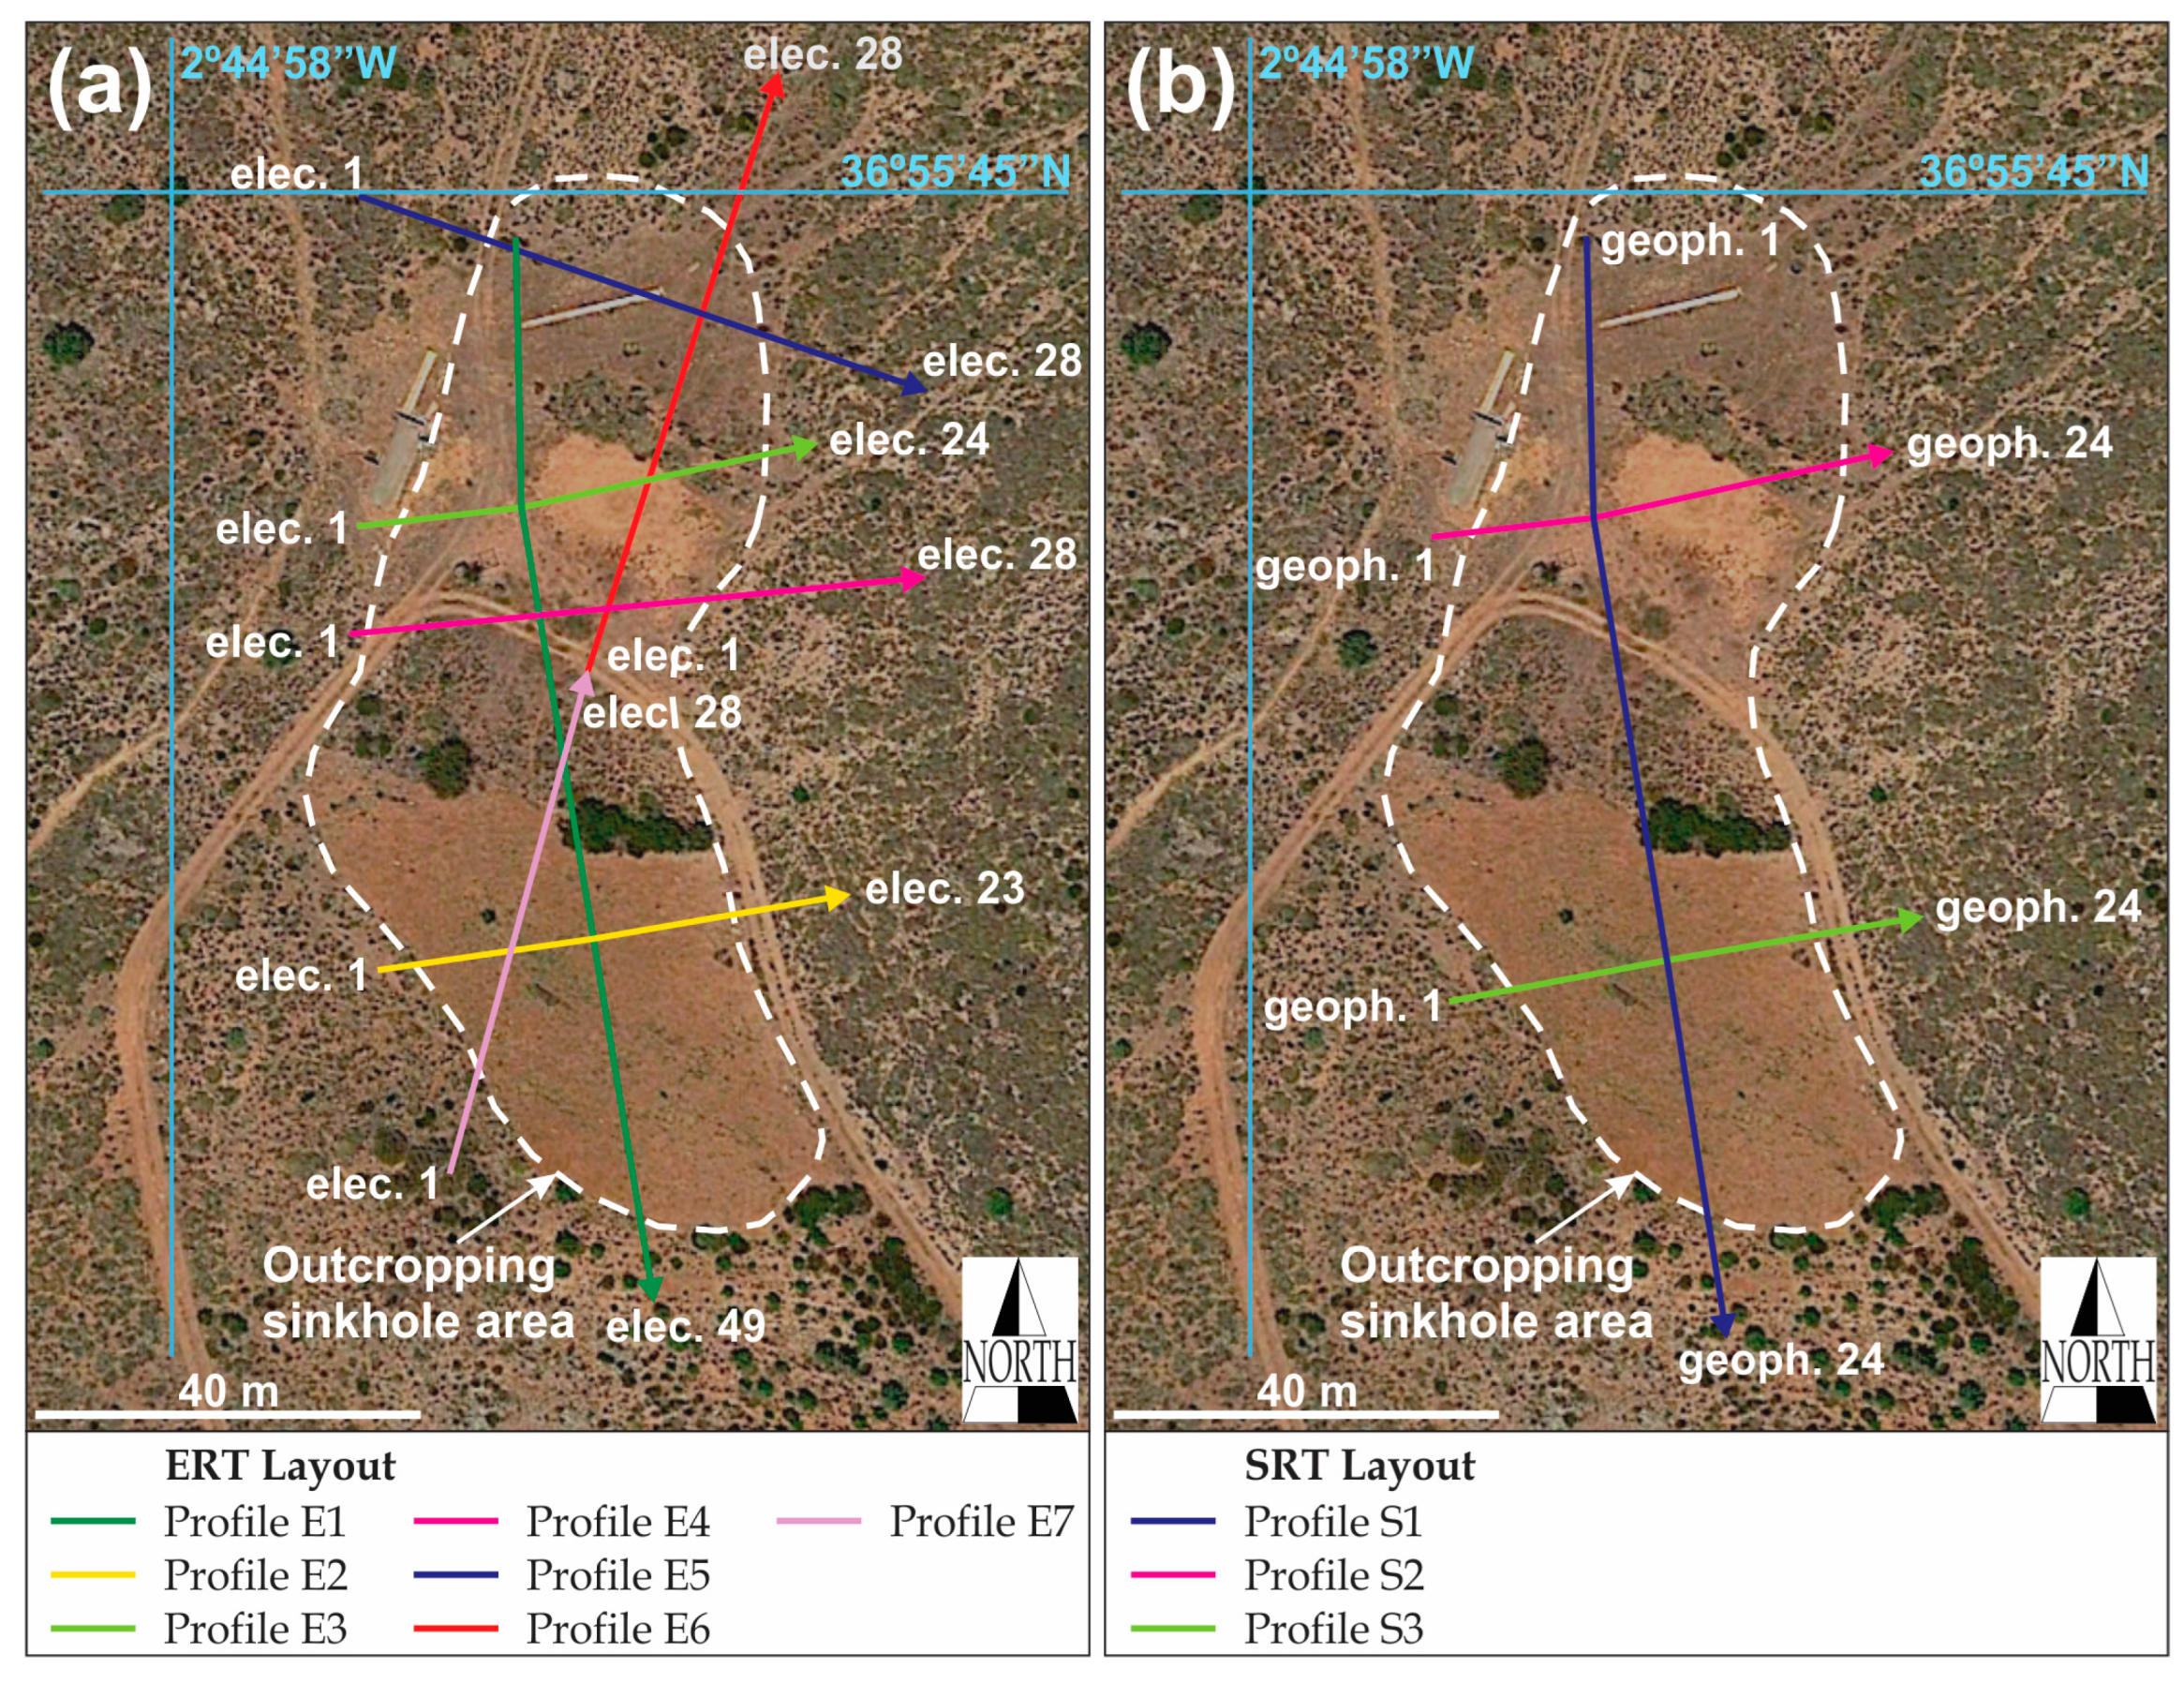
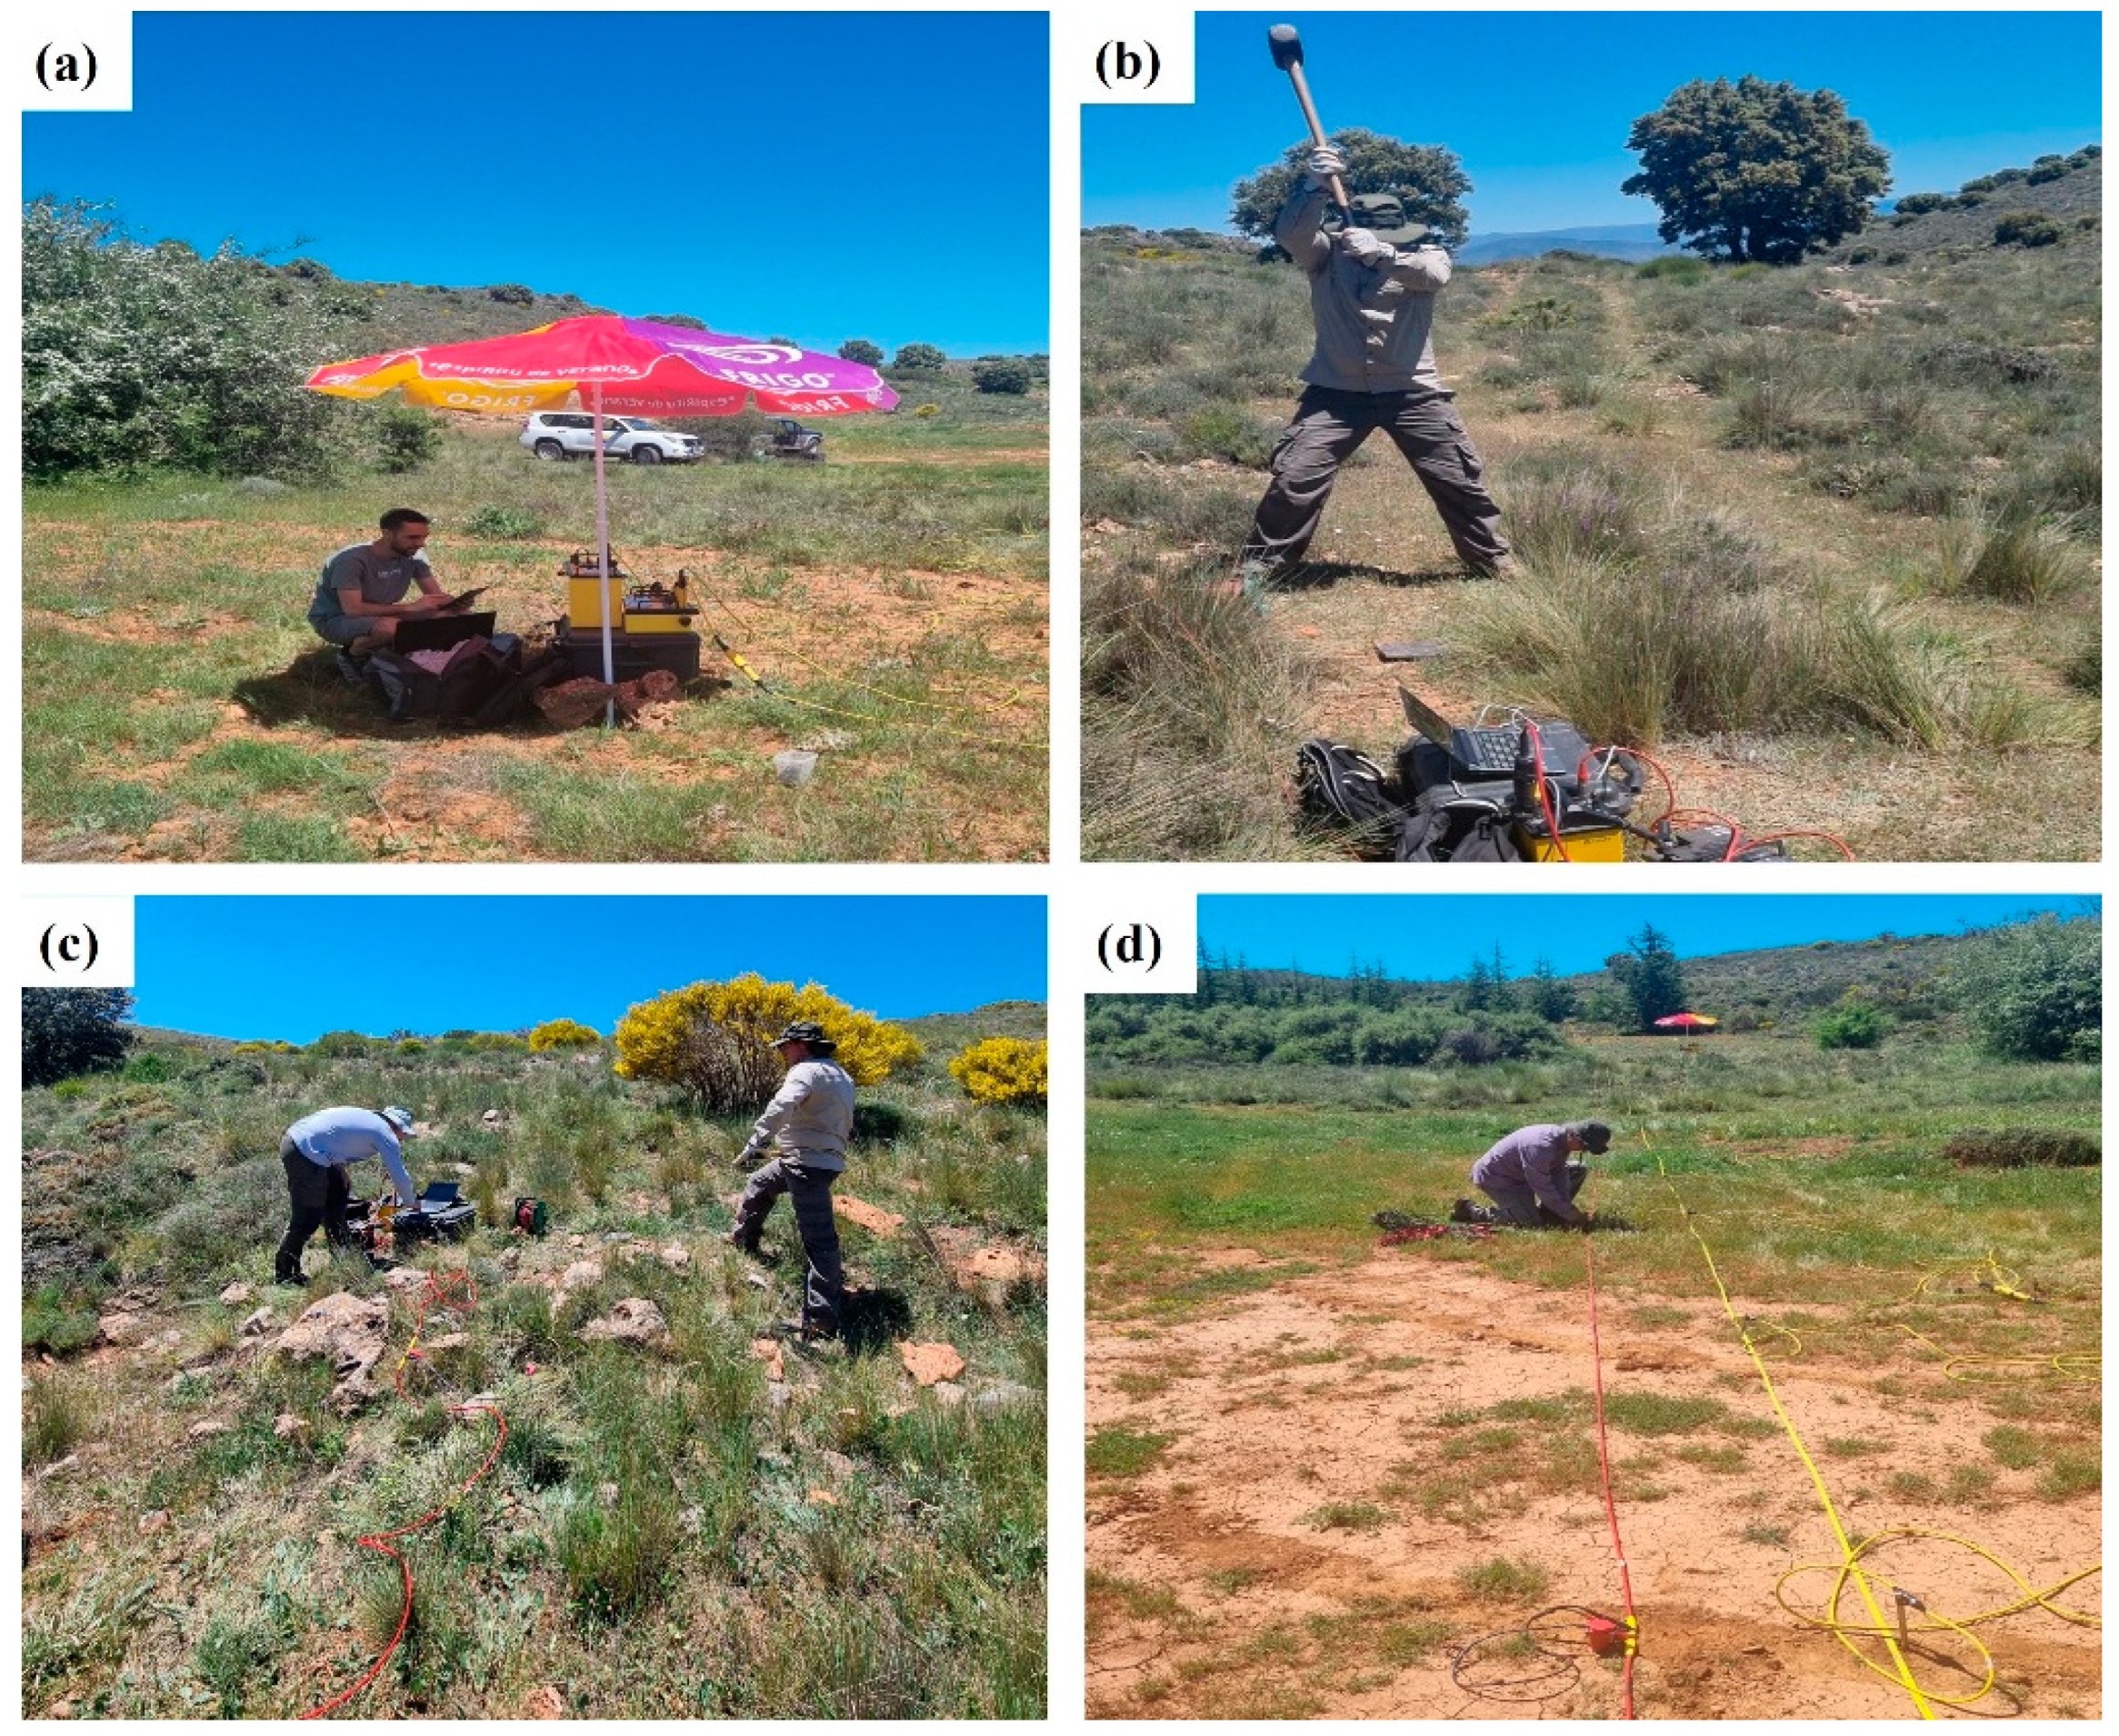
3.1. ERT Technique and Arrays
3.2. SRT Technique and Arrays
4. Results and Discussion
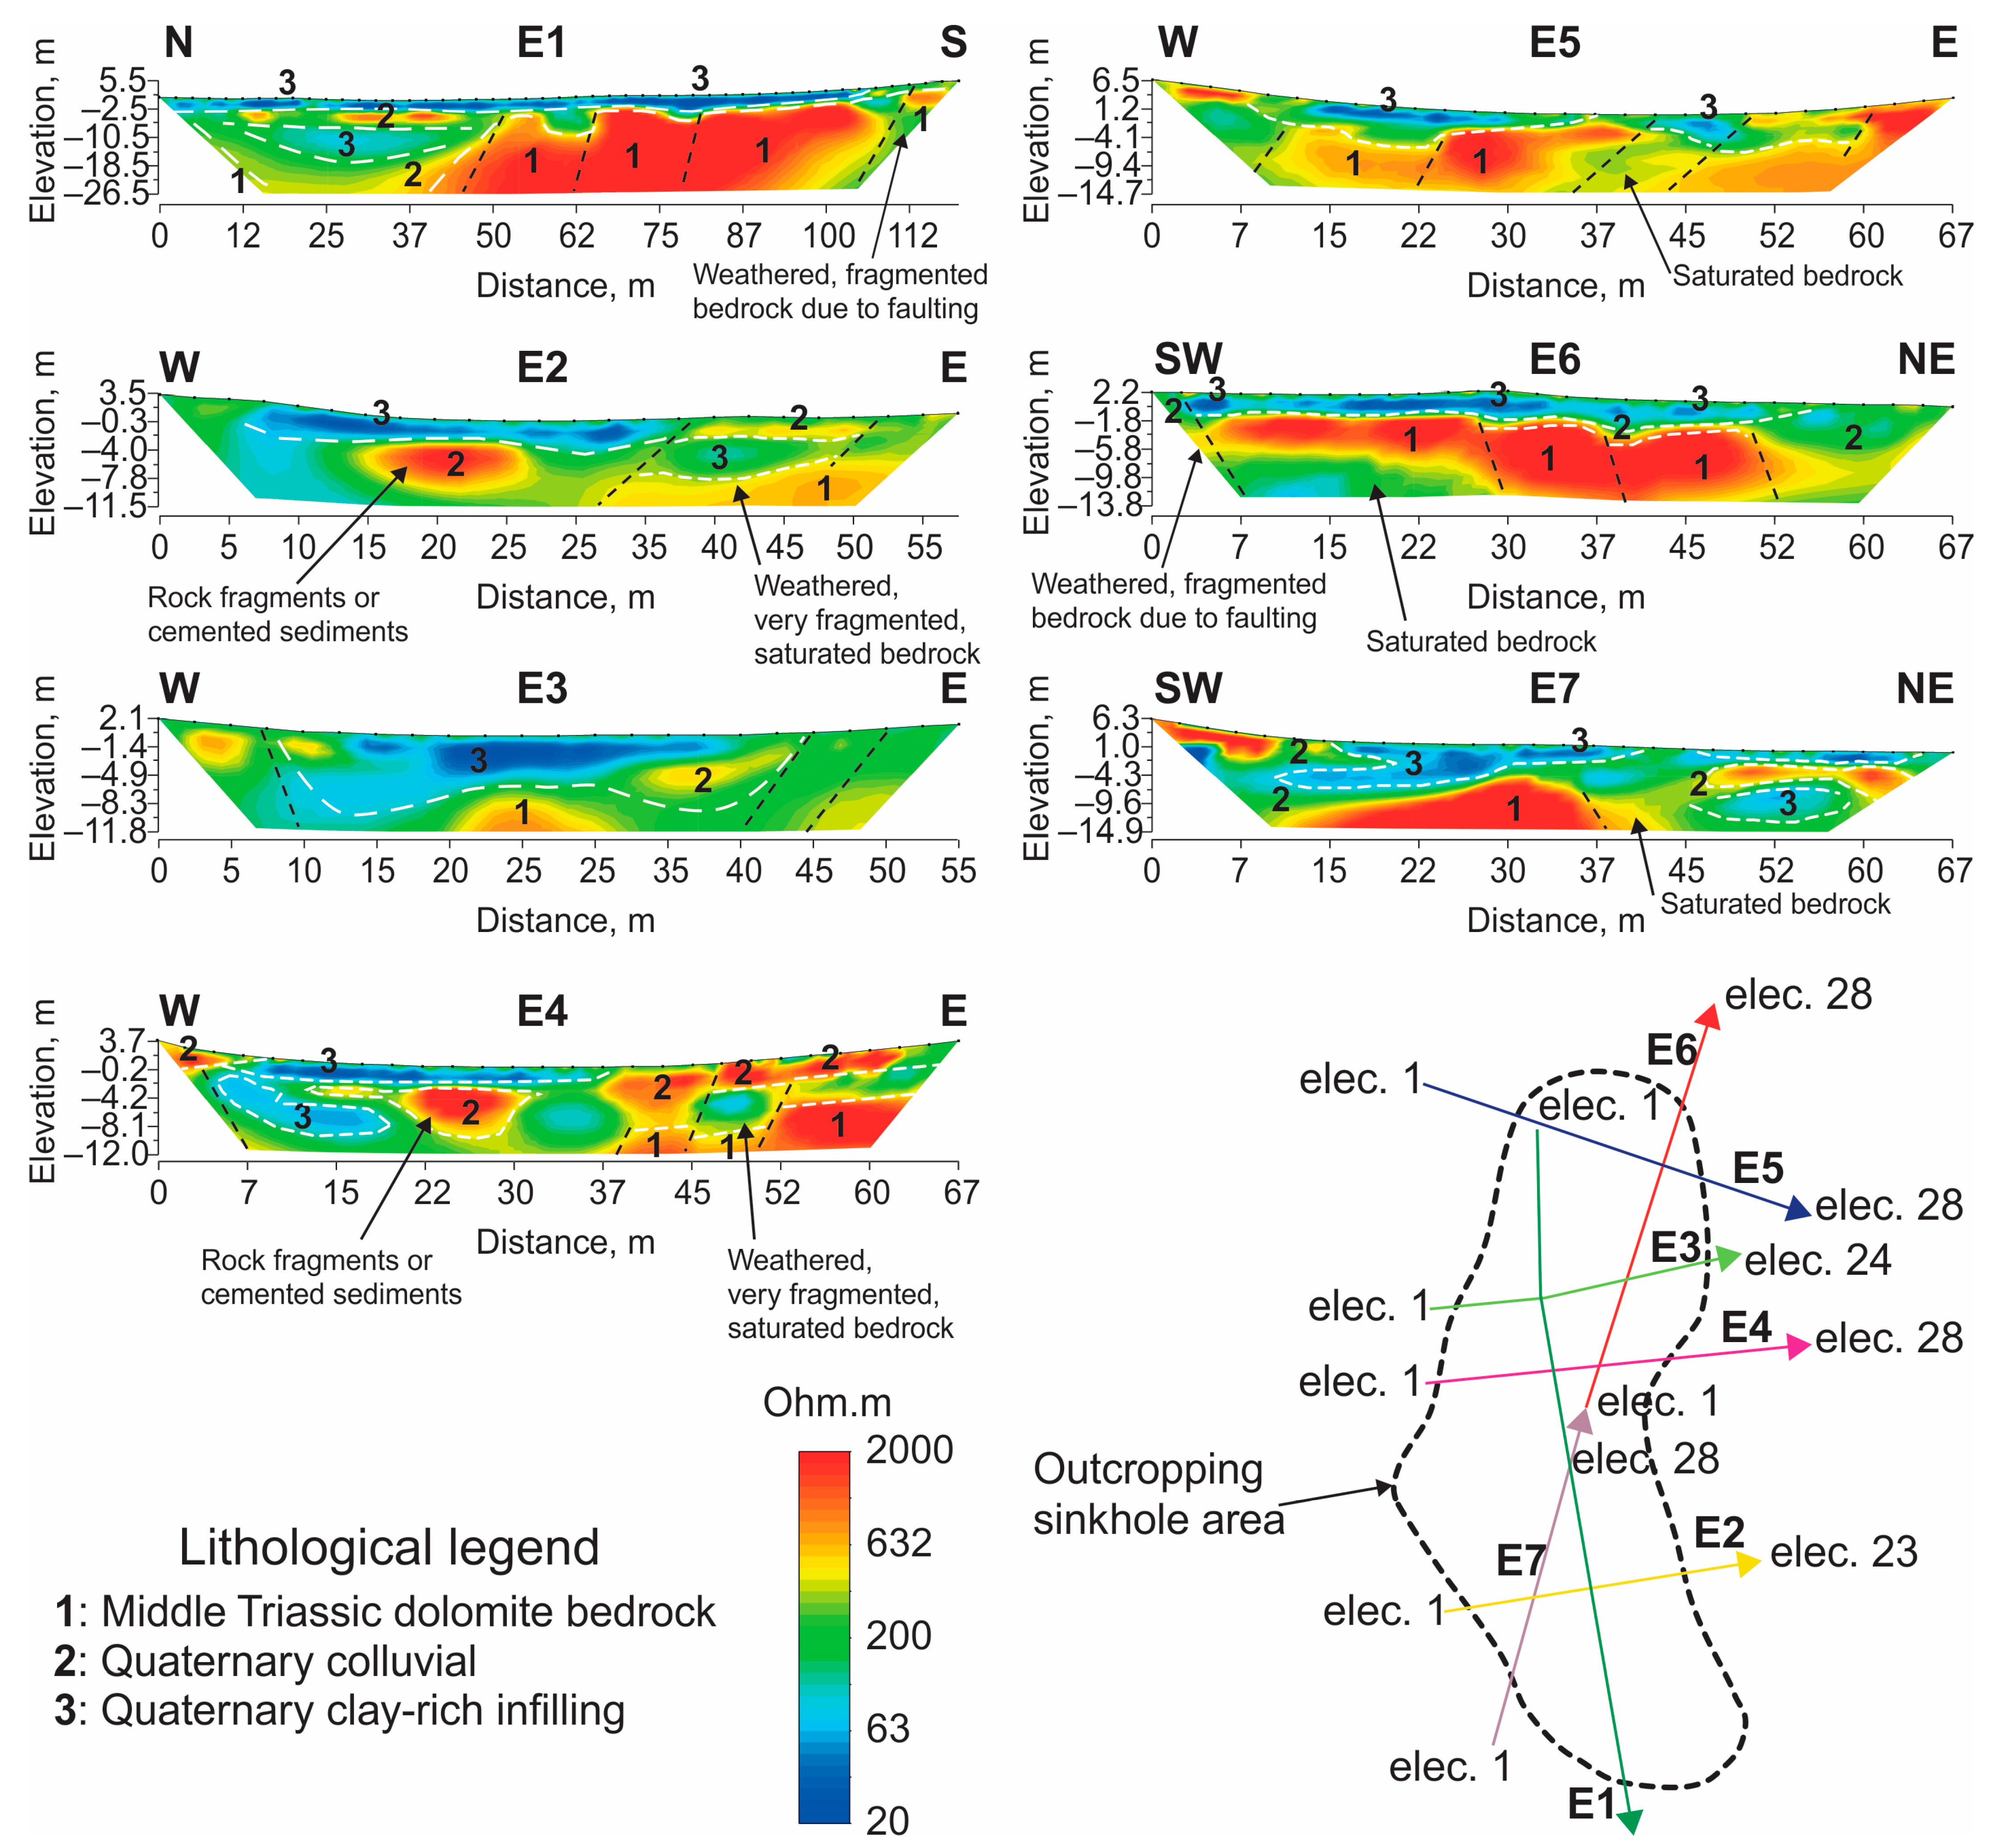
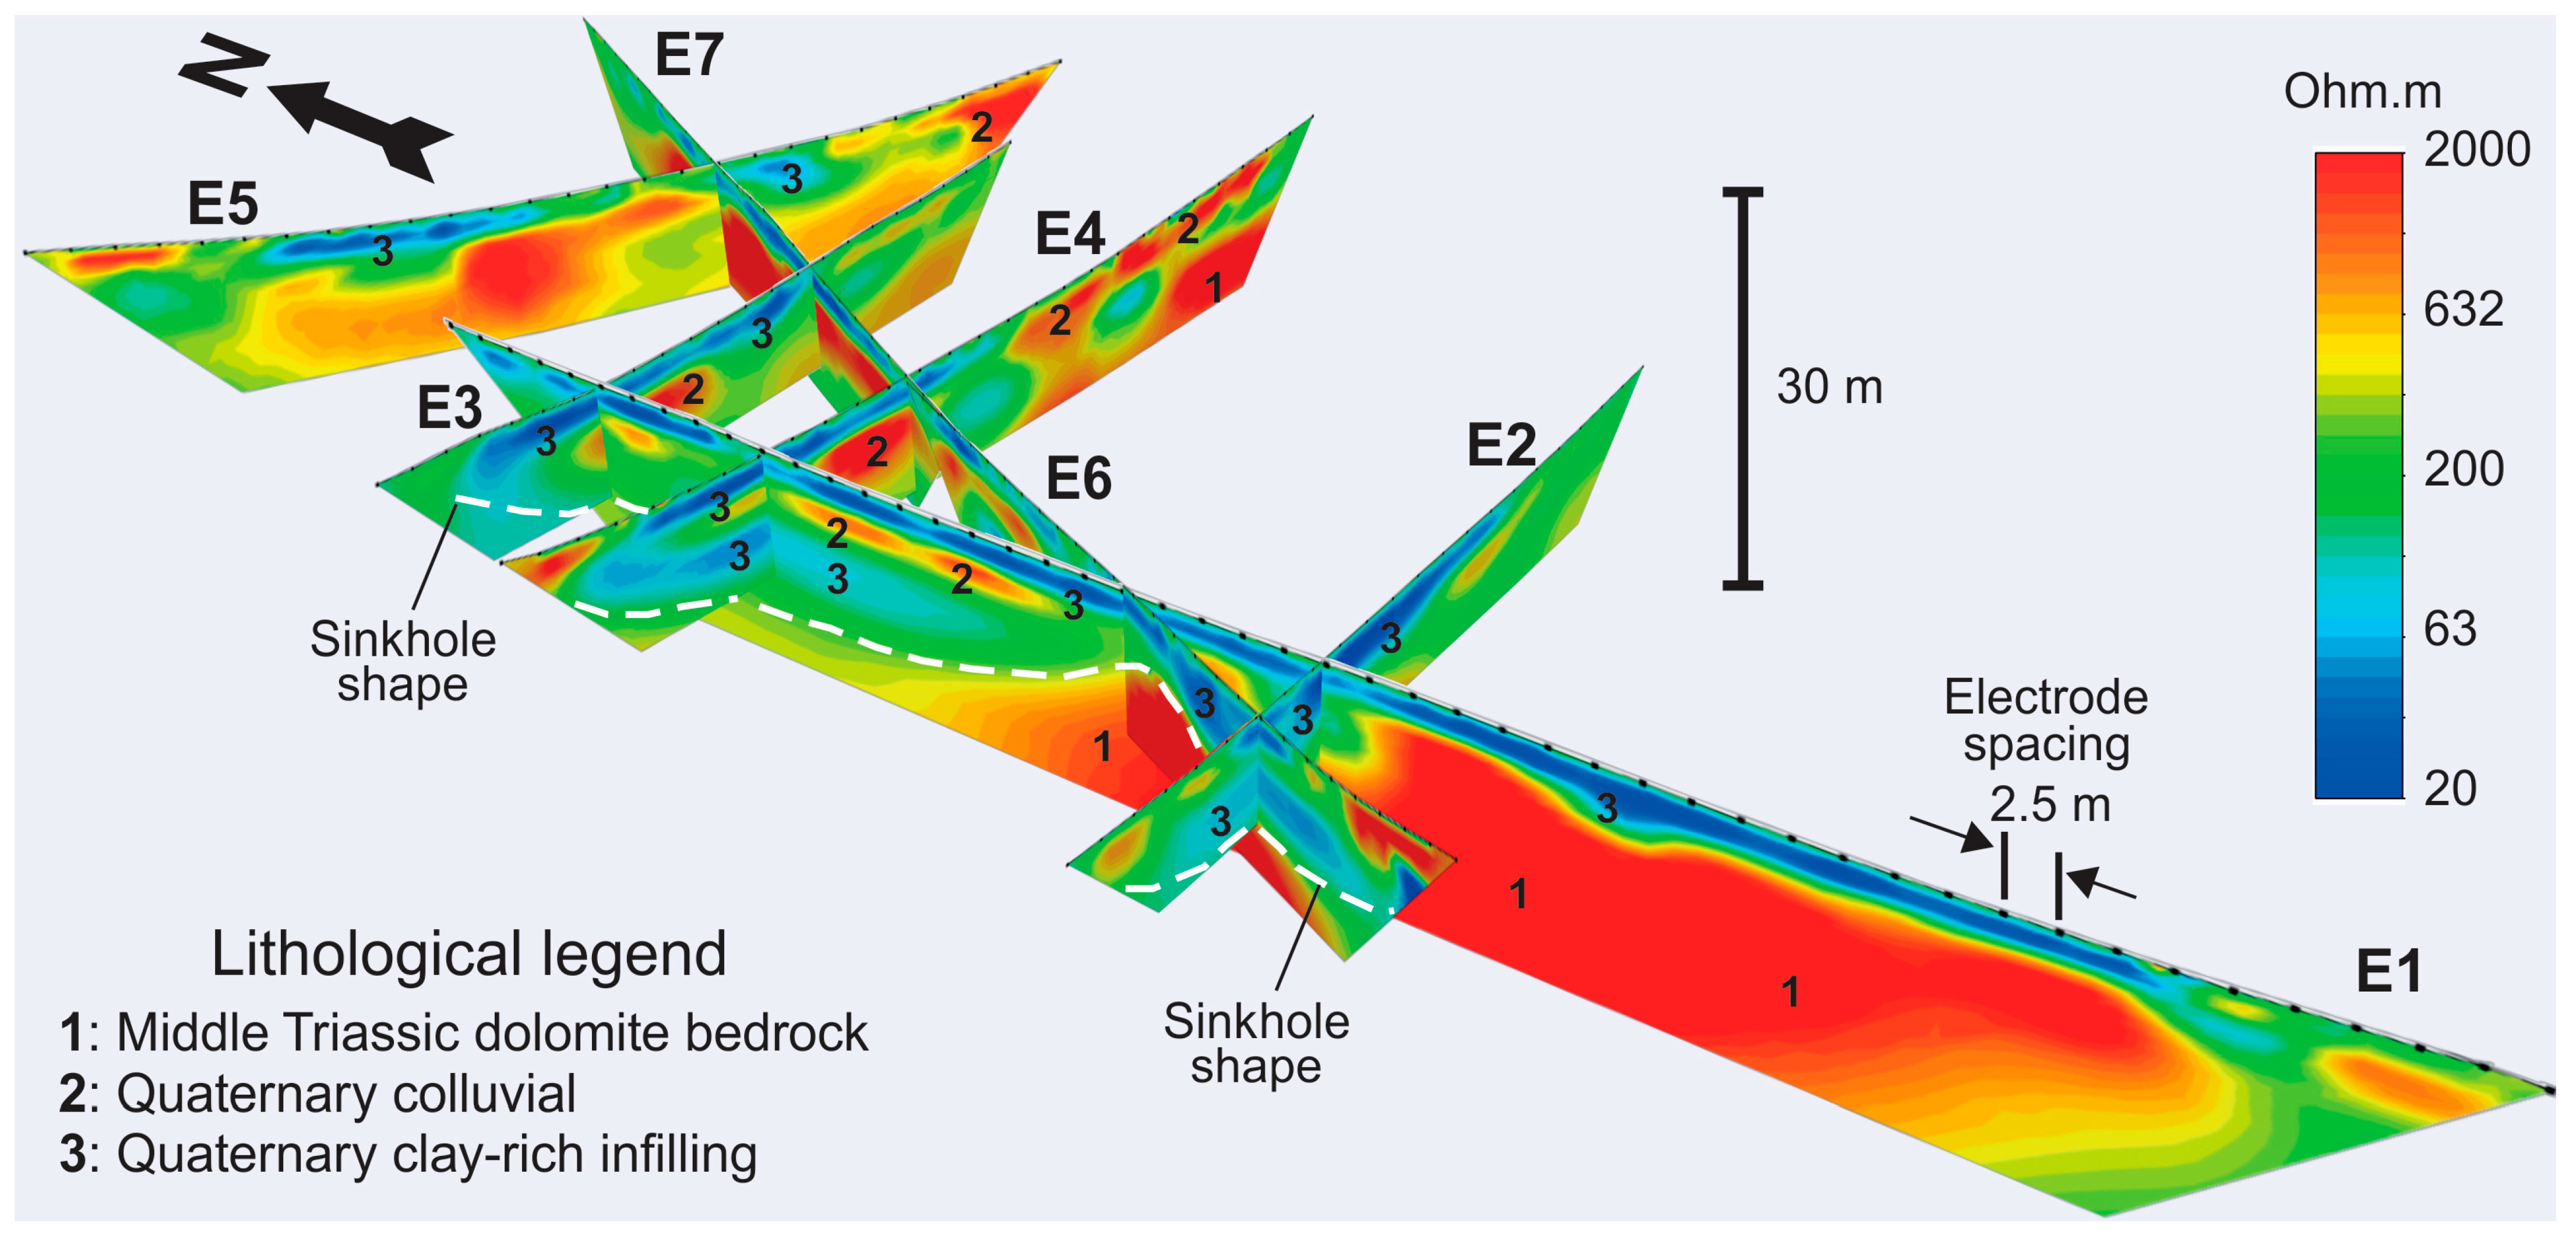
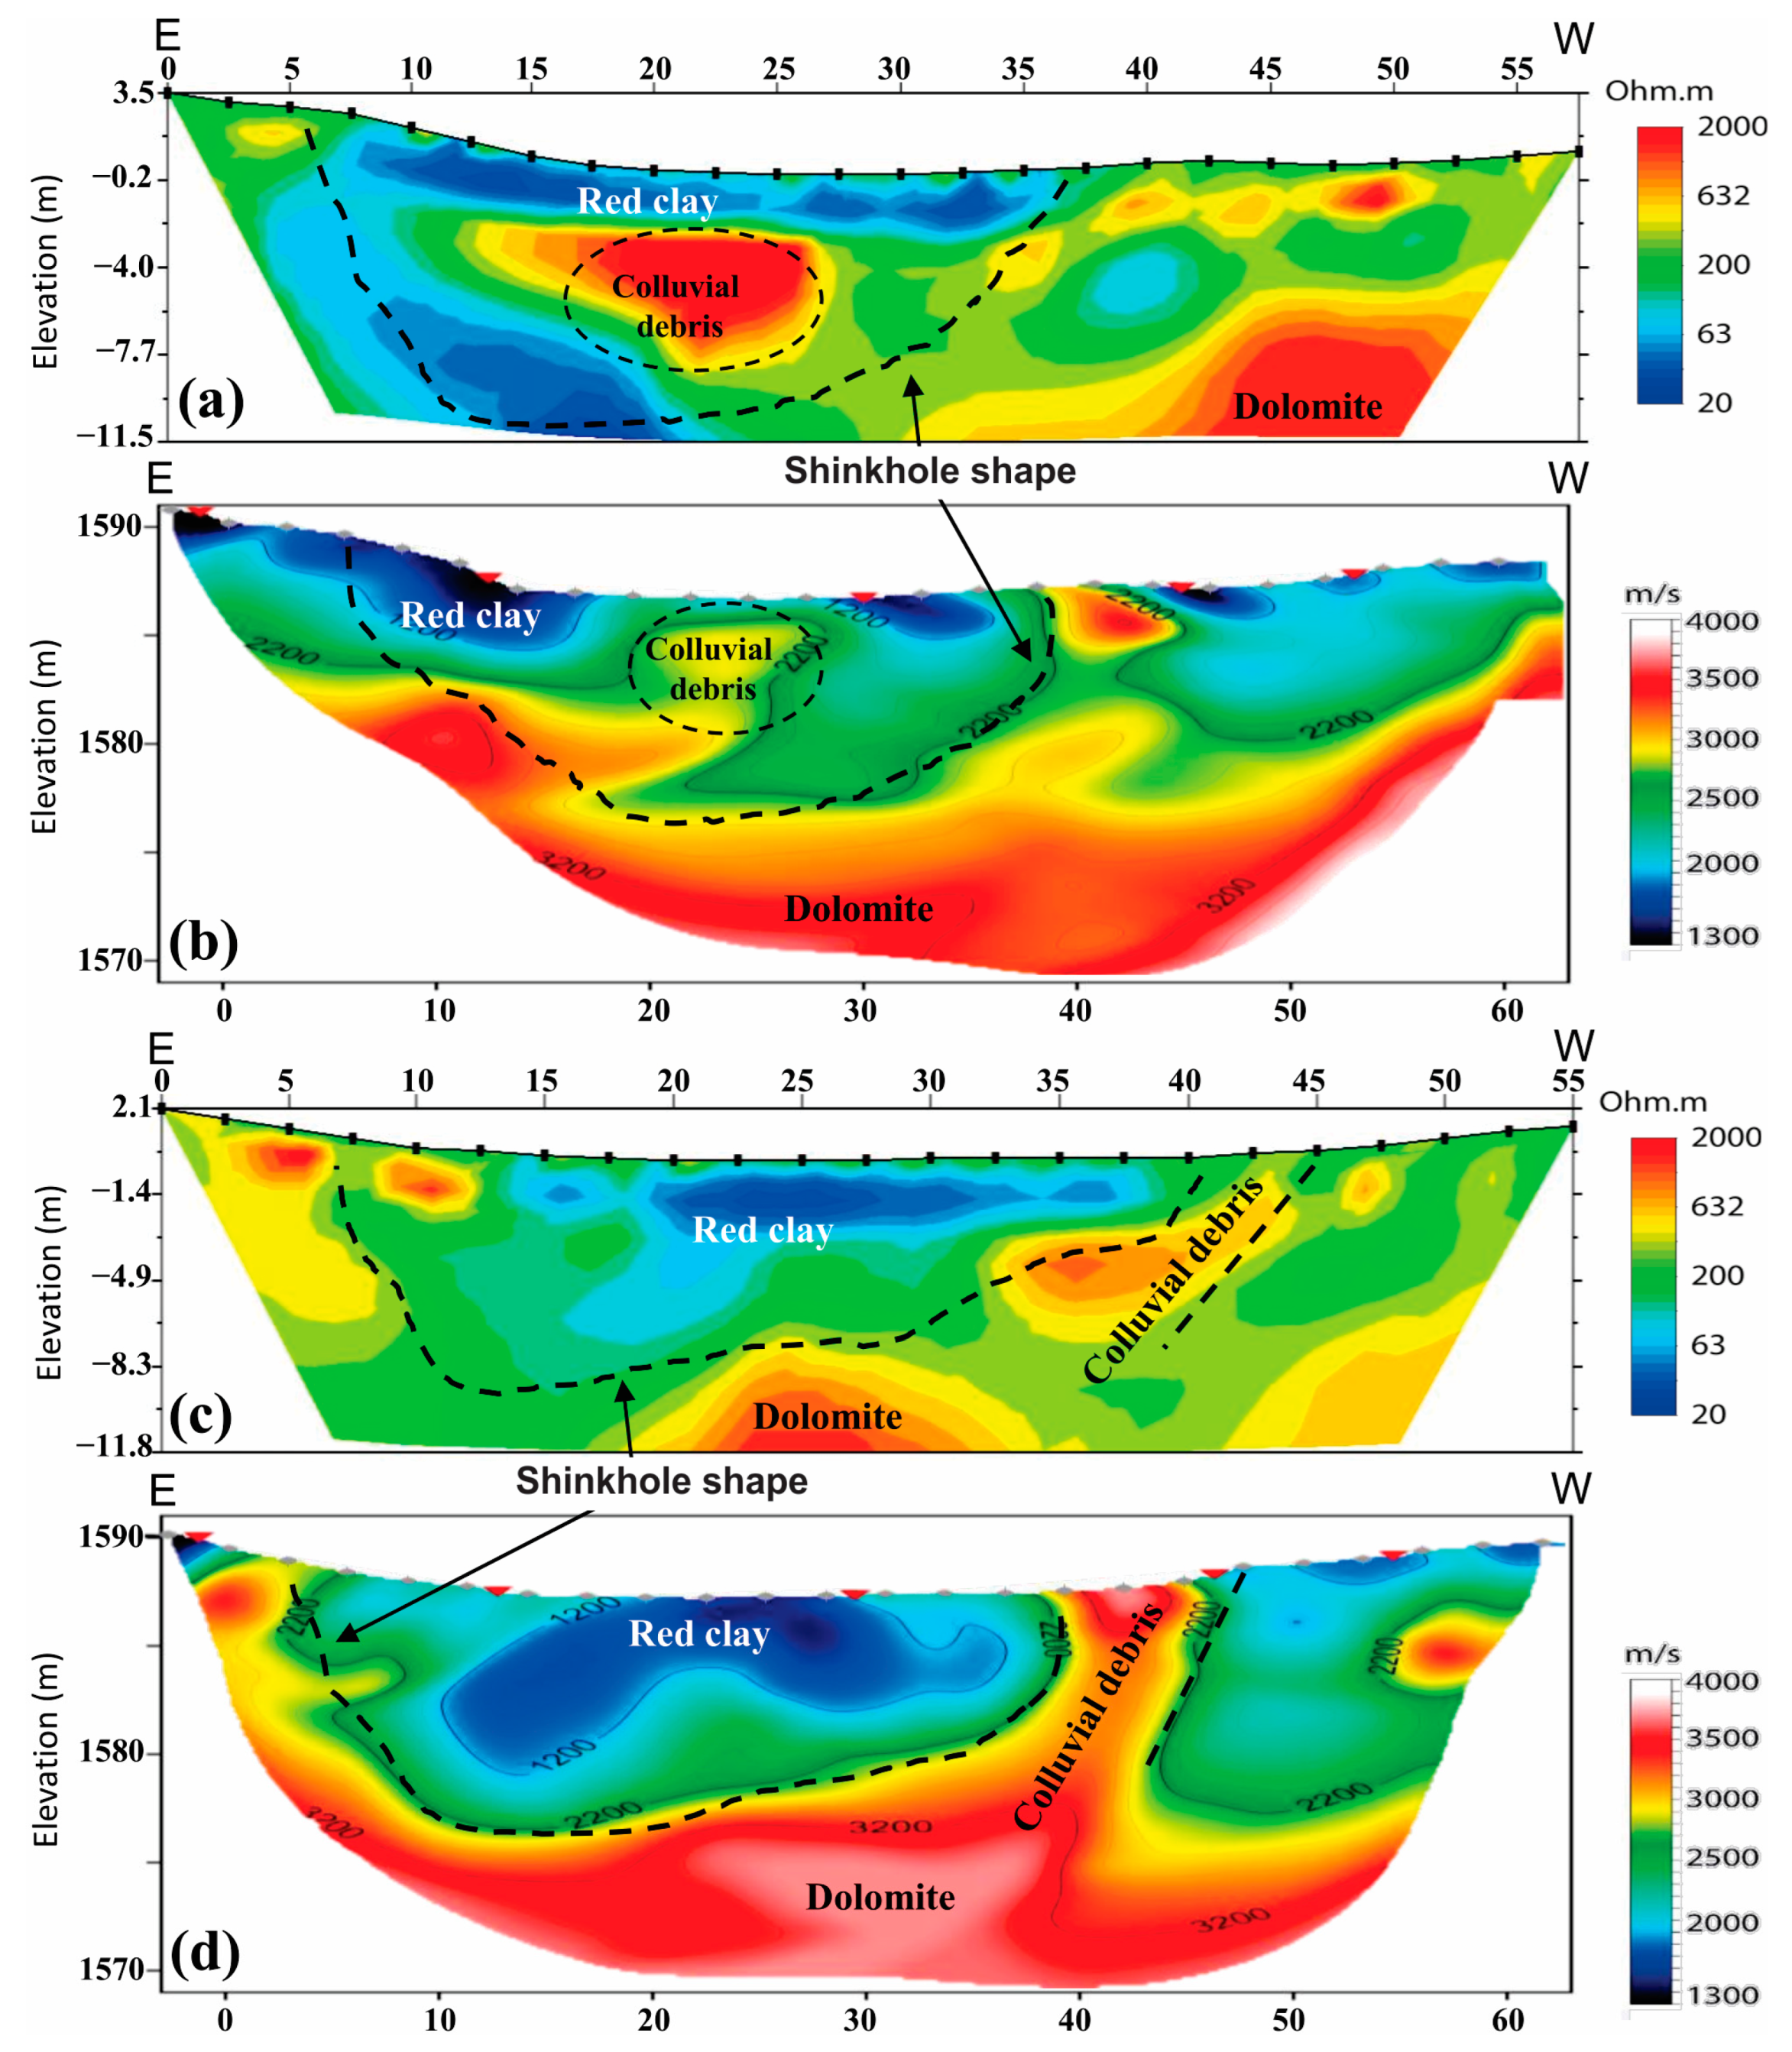
4.1. ERT Surveys
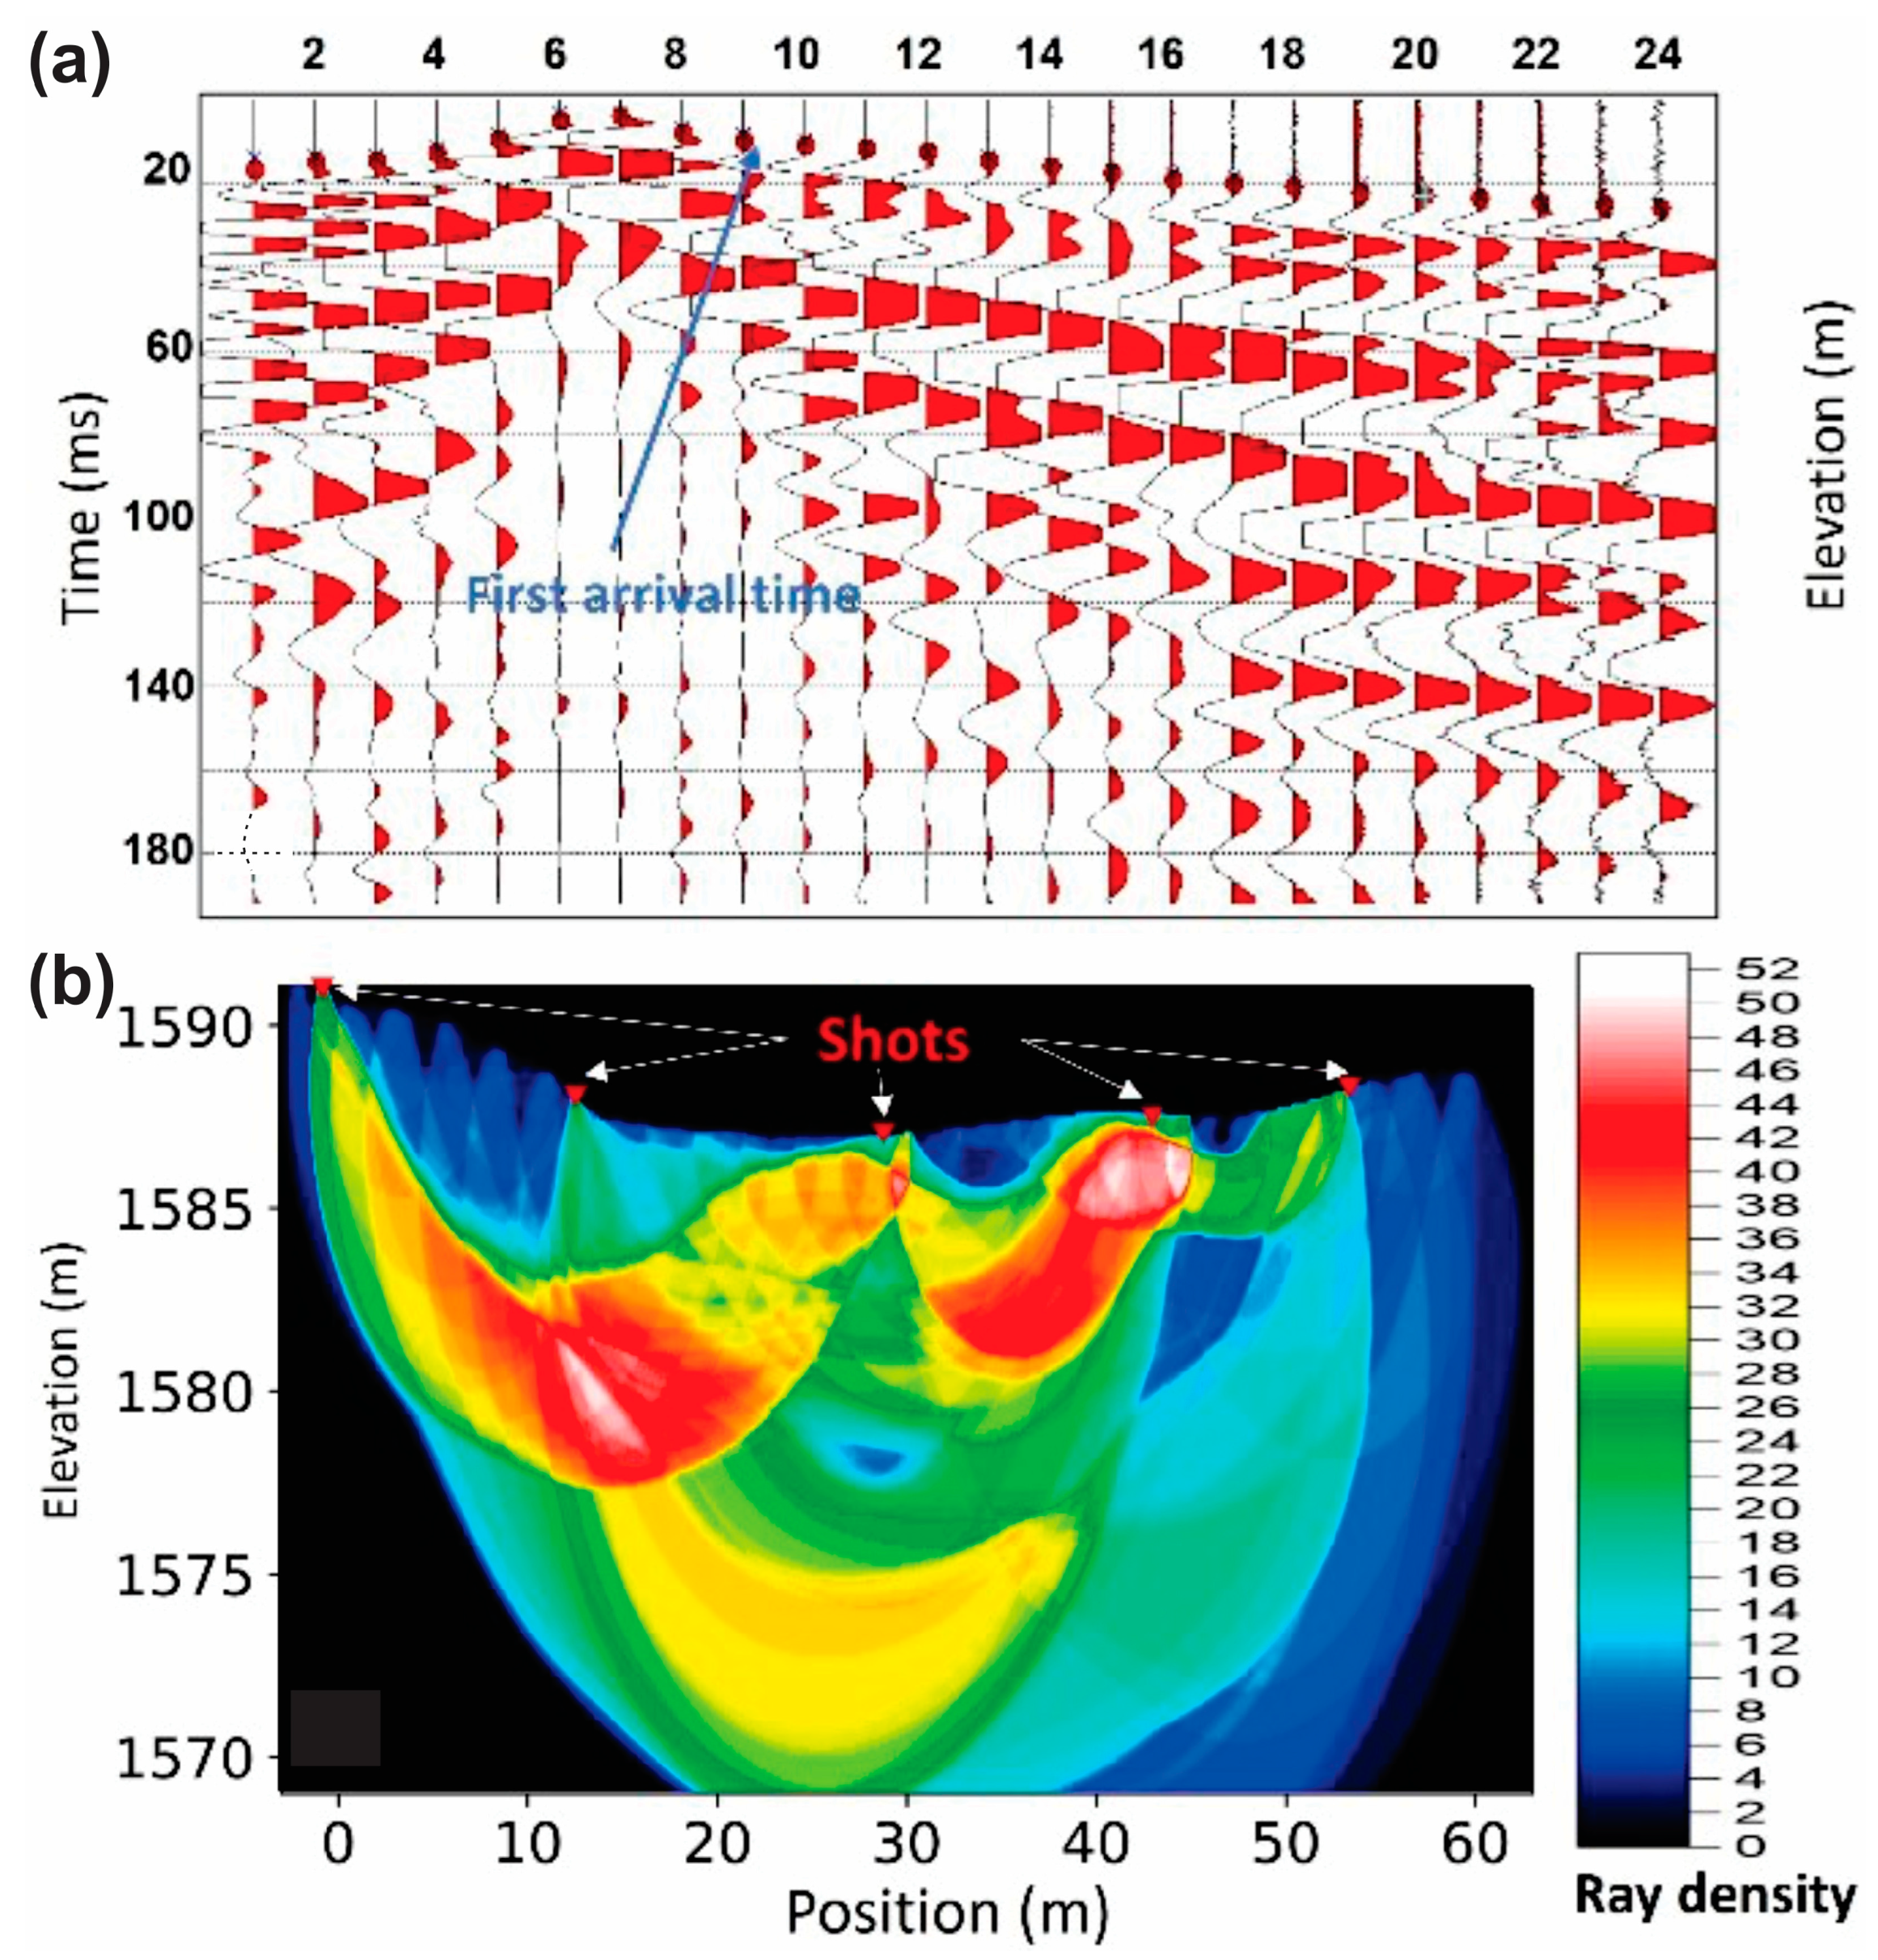
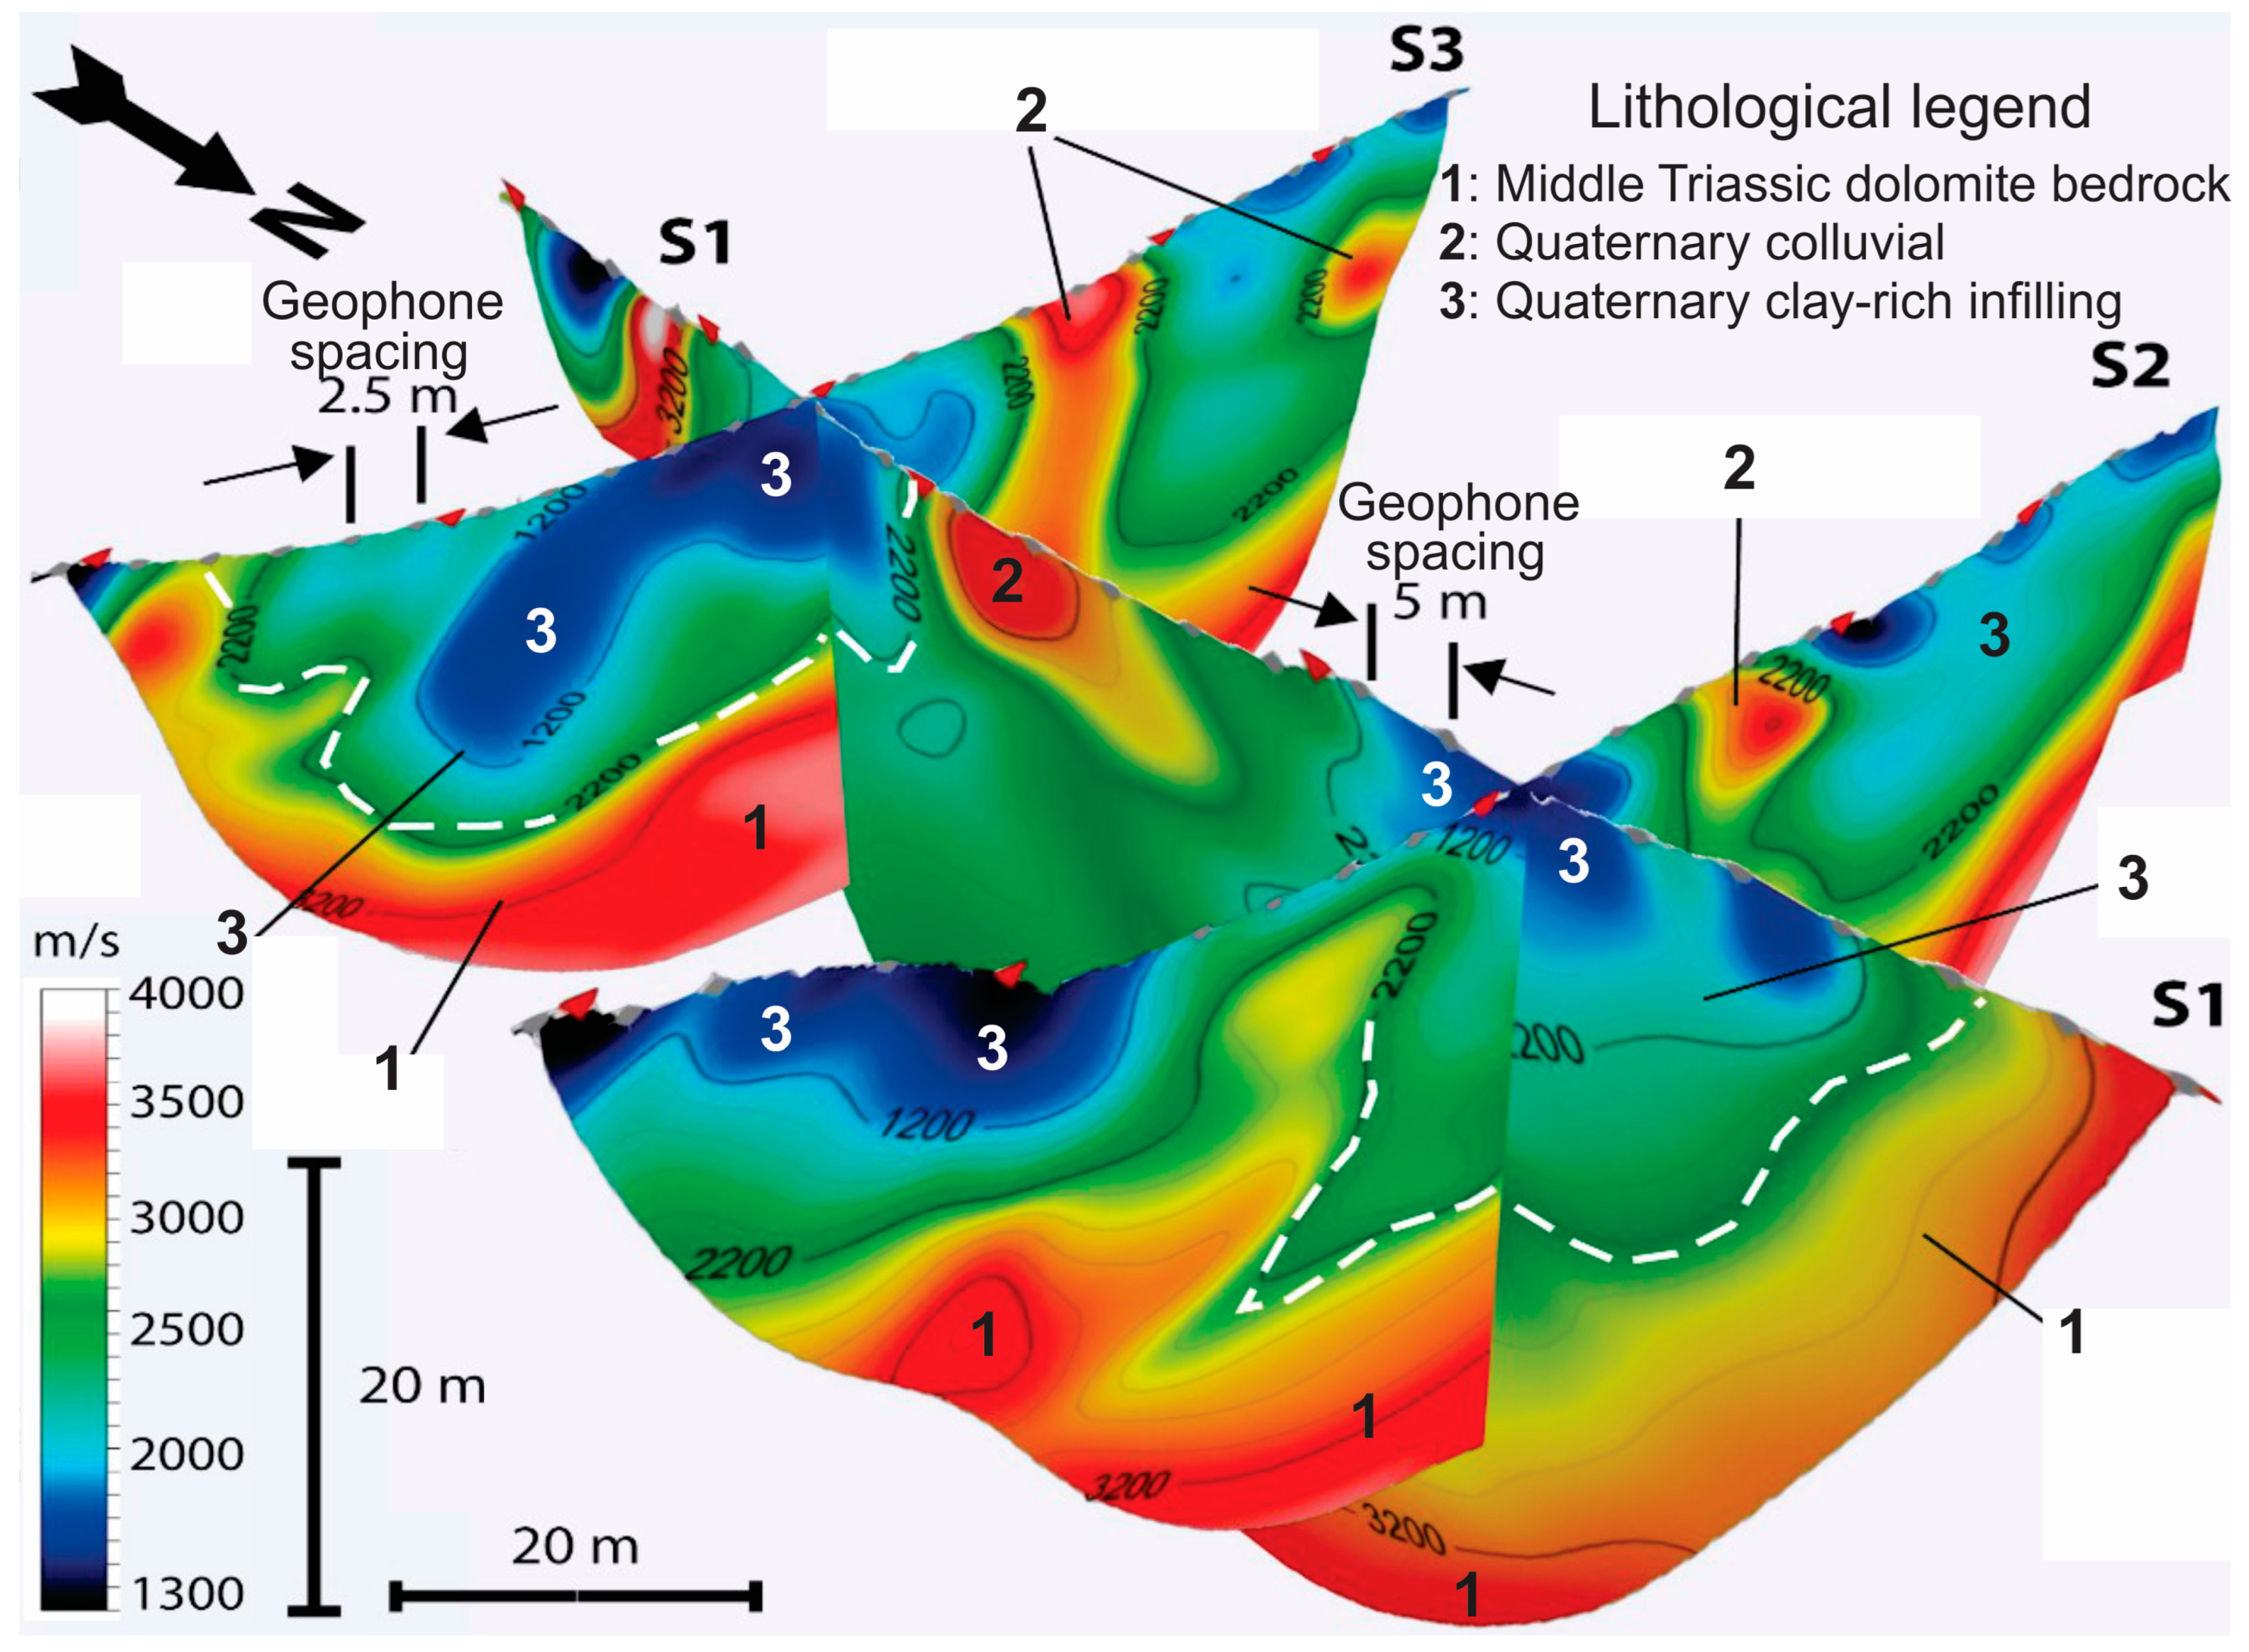
4.2. SRT Surveys
5. Conclusions
Author Contributions
Funding
Data Availability Statement
Conflicts of Interest
References
- Goldscheider, N.; Drew, D. Methods in Karst Hydrogeology; CRC Press: Boca Raton, FL, USA, 2007; Volume 28. [Google Scholar]
- Jourde, H.; Gabrovsek, F. Epikarst. In Treatise on Geomorphology; Karst Geomorphology; Shroder, J.F., Ed.; Elsevier: Amsterdam, The Netherlands, 2013; Volume 6, pp. 201–218. [Google Scholar]
- Sweeting, M.M. Karst Landforms; Macmillan: London, UK, 1972; p. 362. [Google Scholar]
- Bögli, A. Karst Hydrology and Physical Speleology; Springer Science & Business Media: Berlin/Heidelberg, Germany, 1980; pp. 131–132. [Google Scholar]
- White, W.B. Geomorphology and Hydrology of Karst Terrains; Oxford University Press: Oxford, UK, 1988; 464p. [Google Scholar]
- Williams, P.W. Dolines. In Encyclopedia of Caves and Karst Science; Gunn, J., Ed.; Fitzroy Dearborn: New York, NY, USA; London, UK, 2004; pp. 304–310. [Google Scholar]
- Beck, B.F. Soil piping and sinkhole failures. In Enyclopedia of Caves; White, W.B., Ed.; Elsevier: New York, NY, USA, 2005; pp. 523–528. [Google Scholar]
- Waltham, T.; Bell, F.; Culshaw, M. Sinkholes and Subsidence; Springer: Berlin/Heidelberg, Germany, 2005. [Google Scholar]
- Gutiérrez, F. Hazards associated with karst. In Geomorphological Hazards and Disaster Prevention; Alcántara, I., Goudie, A., Eds.; Cambridge University Press: Cambridge, UK, 2010; pp. 161–175. [Google Scholar]
- Nisio, S.; Caramanna, G.; Ciotoli, G. Sinkholes in Italy: First results on the inventory and analysis. In Natural and Anthropogenic Hazards in Karst Areas: Recognition, Analysis and Mitigation; Parise, M., Gunn, J., Eds.; Geological Society Special Publication No. 279; Geological Society: London, UK, 2007; pp. 23–45. [Google Scholar]
- Parise, M.; Gunn, J. Geomorphology and Hydrogeology of Karst Terrains; Oxford University Press: Oxford, UK, 2007. [Google Scholar]
- Gutiérrez, F.; Carbonel, D.; Kirkham, R.M.; Guerrero, J.; Lucha, P.; Matthews, V. Can flexural-slip faults related to evaporite dissolution generate hazardous earthquakes? The case of the Grand Hogback Monocline of west-central Colorado. GSA Bull. 2014, 126, 1481–1494. [Google Scholar] [CrossRef]
- Saribudak, M.; Hawkins, A.; Stoker, K. Do Air-Filled Caves Cause High Resistivity Anomalies? A Six-Case Study from the Edwards Aquifer Recharge Zone in San Antonio, Texas. Houst. Geol. Soc. Bull. 2012, 54, 41–49. [Google Scholar]
- Abdallatif, T.; Khafagy, A.S.A.B.; Khozym, A. Geophysical investigation to delineate hazardous cavities in Al-HassaKarstic Region, Kingdom of Saudi Arabia. Eng. Geol. Soc. Territ. 2015, 5, 507–514. [Google Scholar]
- Martinez-Pagan, P.; Gomez-Ortiz, D.; Martin-Crespo, T.; Manteca, J.I.; Rosique, M. The electrical resistivity tomography method in the detection of shallow mining cavities. A case study on the Victoria Cave, Cartagena (SE Spain). Eng. Geol. 2013, 156, 1–10. [Google Scholar] [CrossRef]
- Vouillamoz, J.-M.; Legchenko, A.; Albouy, Y.; Bakalowicz, M.; Baltassat, J.-M.; Al-Fares, W. Localization of karstaquifer with magnetic resonance sounding and resistivity imagery. J. Ground Water 2003, 41, 578–587. [Google Scholar] [CrossRef] [PubMed]
- Boucher, M.; Favreau, G.; Descloitres, M.; Vouillamoz, J.M.; Massuel, S.; Nazoumou, Y.; Legchenko, A. Contribution of Geophysical Surveys to Groundwater Modelling of a Porous Aquifer in Semiarid Niger: An Overview. Comptes Rendus Geosci. 2009, 341, 10–11. [Google Scholar] [CrossRef]
- Jayeoba, A. 2-D Electrical Resistivity Tomography for Groundwater Exploration in Hard Rock Terrain. Int. J. Sci. Res. 2015, 4, 156–163. [Google Scholar]
- Hussain, Y.; Uagoda, R.; Borges, W.; Nunes, J.; Hamza, O.; Condori, C.; Cárdenas-Soto, M. The potential use of geophysical methods to identify cavities, sinkholes, and pathways for water infiltration. Water 2020, 12, 2289. [Google Scholar] [CrossRef]
- Soriano, M.A.; Simón, J.L. Factors of the Dissolution Process. Historical Changes Observed in Doline Distribution, Geological Reconnaissance, Drilling, Local Subsidence Rates, Analysis of Aerial Photographs, and Site Inspection. Water 1995, 28, 51–74. [Google Scholar]
- Soriano, M.A.; Simón, J.L. Estudio de los procesos kársticos en el término municipal de Jerez de los Caballeros (Badajoz). Boletín Geológico Y Min. 1997, 108, 487–505. [Google Scholar]
- Casas, A.M.; Mochales, T.; Pueyo, E.L.; Soriano, M.A.; Pueyo, Ó.; Pocoví, A. La prospección geofísica en áreas urbanas como instrumento para la cartografía de riesgos kársticos. In Libro de Resúmenes de la Conferencia Regional, Cartografía Geológica Aplicada a Áreas Urbanas. O Caso da Área Metropolitana de Lisboa; Nunes da Costa, C., Ed.; Universidade de Lisboa: Lisbon, Portugal, 2006; pp. 156–166. [Google Scholar]
- Kaufmann, G. Geophysical Mapping of Solution and Collapse Sinkholes. J. Appl. Geophys. 2014, 111, 271–288. [Google Scholar] [CrossRef]
- Butler, D.K. Detection and Characterization of Subsurface Cavities, Tunnels and Abandoned Mines. Near Surf. Geophys. Hum. Act. Sci. 2008, 1, 578–584. [Google Scholar]
- Hauck, C.; Kneisel, C.; Rudolph, S. Geophysical methods in permafrost research: Current use and future potential. Permafr. Periglac. Process. 2020, 31, 222–238. [Google Scholar]
- Strozyk, F.; Gosselin, C.; Chaput, M.; Ménard, Y.; Samson, C. Geophysical characterization of a landfill using electrical resistivity tomography (ERT): A case study from Quebec, Canada. Environ. Earth Sci. 2019, 78, 332. [Google Scholar]
- Gao, Y.; Li, Y.; Hu, X. Geophysical characterization of sinkhole-prone areas in karst regions using ground penetrating radar and electrical resistivity tomography. Environ. Earth Sci. 2021, 80, 1–11. [Google Scholar]
- Jaafar, O.; Ibrahim, Z.; Saad, R.; Sia, L.K. Electrical resistivity imaging and ground-penetrating radar surveys for sinkhole detection in karstic terrain. Environ. Earth Sci. 2020, 79, 1–15. [Google Scholar]
- Han, Y.; Wang, X.; Li, J.; Huang, Q.; Wu, Y. Combined use of ground-penetrating radar and electrical resistivity tomography for sinkhole detection in karst areas. J. Appl. Geophys. 2019, 168, 155–164. [Google Scholar]
- Sheehan, J.R.; Doll, W.E.; Watson, D.B.; Mandell, W.A. Application of Seismic Refraction Tomography to Karst Cavities. In Proceedings of the US Geological Survey Karst Interest Group, Rapid City, SD, USA, 12–15 September 2005; pp. 29–38. [Google Scholar]
- Valois, R.; Bermejo, L.; Guérin, R.; Hinguant, S.; Pigeaud, R.; Rodet, J. Karstic morphologies identified with geophysics around Saulges caves (Mayenne, France). Archaeol. Prospect. 2010, 17, 151–160. [Google Scholar] [CrossRef]
- Riddle, J.D.; Slater, L.D.; Guertal, W.R.; Sholar, J.R. Application of electrical resistivity tomography and time domain reflectometry for detection of sinkholes and anomalous zones at a closed landfill. J. Appl. Geophys. 2010, 70, 244–255. [Google Scholar]
- Gan, H.; Jiang, Y.; Hu, J.; Chen, S.; Lin, H. Detection and spatial analysis of subsidence using electrical resistivity tomography in an area of reclamation land affected by underground coal mining. Mine Water Environ. 2017, 36, 223–230. [Google Scholar]
- Rinaldi, V.A.; Ibarra, H.V.; Viguera, R.F.; Harasimiuk, J.C. Application of Seismic Tomography for Detecting Structural Faults in a Tertiary Formation. E3S Web Conf. 2019, 92, 18008. [Google Scholar] [CrossRef]
- Ariff, M.A.M.; Hashim, M.; Yusoff, Z.M.; Ghazali, A.H. Investigating the morphology and filling material of a sinkhole using geoelectrical resistivity imaging: A case study in Kuala Lumpur, Malaysia. Environ. Earth Sci. 2016, 75, 804. [Google Scholar]
- Wang, Y.; Liu, Q.; Zhou, Z.; Dong, C. Geophysical exploration of sinkholes in karst areas: A review. J. Appl. Geophys. 2019, 167, 80–94. [Google Scholar]
- Molina, J.; Pedrera, A.; Galindo-Zaldívar, J.; González-Castillo, L.; Ruiz-Constán, A. The Sierra de Gádor: A key segment for understanding the Neogene-Quaternary tectonics of the eastern Betics (SE Spain). Geol. Acta 2012, 10, 1–23. [Google Scholar]
- Contreras, E.; Delgado, J.; Jiménez, P.; Bolívar, J.P. Hydrogeological characterization of karst aquifers: An example of the Sierra de Líjar (Southern Spain). Environ. Geol. 2008, 55, 1015–1026. [Google Scholar]
- Pulido-Bosch, A.; Carrasco, F.; Sanz de Galdeano, C.; López-Geta, J.A. Hydrogeological characterization of carbonate aquifers in a Mediterranean mountainous area (Sierra de Gádor, SE Spain). Hydrogeol. J. 2000, 8, 405–416. [Google Scholar]
- Martín Rojas, I. Las Unidades Internas del sector de la sierra de Gádor: Estructura y Evolución Geodinámica. Ph.D. Thesis, Universidad de Alicante, Alicante, Spain, 2006. [Google Scholar]
- Dominguez-Castro, F. Contribution of environmental isotopes to the hydrogeological knowledge of a karst aquifer in a semi-arid region (Campo de Dalias, SE Spain). Isot. Environ. Health Stud. 2000, 36, 237–253. [Google Scholar]
- Marín-Lechado, C.; Jiménez-Sánchez, M.; Rossi, P. Integrated use of electrical resistivity tomography and hydrochemical data to characterize a saline intrusion in a coastal aquifer (Granada, SE Spain). Hydrogeol. J. 2005, 13, 133–144. [Google Scholar]
- Alonso-Zarza, A.M.; Silva, P.G.; Martín-Pérez, A. Palaeoenvironmental significance of palustrine carbonates and calcretes in an intramontane basin: The case of the Miocene of the Granada Basin (SE Spain). Sedimentology 2002, 49, 137–154. [Google Scholar]
- García-Castellanos, D.; Villaseñor, A. Messinian salinity crisis regulated by competing tectonics and erosion at the Gibraltar arc. Nature 2011, 480, 359–363. [Google Scholar] [CrossRef]
- Oyonarte, C.; Valero-Garcés, B.; Delgado, J. Hydrochemical and isotopic characterisation of groundwater in a karstic area: The Sierra de Líjar (Southern Spain). Hydrol. Earth Syst. Sci. 1998, 2, 25–35. [Google Scholar]
- Alcalá, F.J.; Andreo, B.; Carrasco, F.; Pulido-Bosch, A. Karst in gypsum of Sorbas (SE Spain): Hydrogeological behavior and hazards. Geomorphology 2011, 134, 207–220. [Google Scholar]
- Li, X.Y.; Contreras, S.; Solé-Benet, A. Unsaturated hydraulic conductivity in limestone dolines: Influence of vegetation and rock fragments. Geoderma 2008, 145, 288–294. [Google Scholar] [CrossRef]
- Cantón, Y.; Villagaría, L.; Moro, M.J.; Serrano-Ortiz, P.; Were, A.; Alcalá, F.J.; Kowalski, A.S.; Solé-Benet, A.; Lázaro, R.; Domingo, F. Temporal dynamics of soil water balance components in a Mediterranean carbonate range in SE Spain: Estimation of potential recharge. Hydrol. Sci. J. 2010, 5, 737–753. [Google Scholar] [CrossRef] [Green Version]
- Bano, M.; Hasan, M.A.; Bakht, M.; Nawaz, A.; Islam, N. 2D resistivity imaging of subsurface sediments and identification of groundwater contamination in the vicinity of a landfill site. Environ. Earth Sci. 2018, 77, 233. [Google Scholar]
- Dahlin, T.; Loke, M.H. Resolution of 2D Wenner resistivity imaging as assessed by numerical modelling. J. Appl. Geophys. 1998, 38, 237–248. [Google Scholar] [CrossRef] [Green Version]
- Binley, A.; Kemna, A.; Cassiani, G. Electrical methods for imaging and monitoring subsurface processes. Geophys. Res. Lett. 2006, 33, 18. [Google Scholar]
- Dahlin, T.; Zhou, B. Multiple-gradient array measurements for high-resolution imaging of the vadose zone. J. Environ. Eng. Geophys. 2004, 9, 131–144. [Google Scholar]
- Loke, M.H.; Barker, R.D. Rapid least-squares inversion of apparent resistivity pseudosections by a quasi-Newton method. Geophys. Prospect. 1996, 44, 131–152. [Google Scholar] [CrossRef]
- Advanced Geosciences, Inc. AGI Earthimager 2D, Software; Advanced Geosciences, Inc.: Houston, TX, USA, 2022. [Google Scholar]
- Dahlin, T.; Bernstone, C. A roll-along technique for 3D resistivity data acquisition with multi-electrode arrays. In Proceedings of the Symposium on the Application of Geophysics to Engineering and Environmental Problems, Reno, NV, USA, 23–26 March 1997; Volume 2, pp. 927–935. [Google Scholar]
- Kuniansky, E.L. Groundwater Resource Assessment; CRC Press: Boca Raton, FL, USA, 2005. [Google Scholar]
- Sarmiento, C.; Hernandez, W.; Segura, P.; Bernal, A. 2D Seismic Refraction Imaging of the Shallow Subsurface at the Tempisque River Basin, Guanacaste Province, Costa Rica. Pure Appl. Geophys. 2020, 177, 2695–2710. [Google Scholar]
- Yan, Y.; Hao, Q.; Cheng, Y.; Cai, S.; Liu, J.; Qiu, N.; Yang, J. Fault detection by seismic refraction tomography in Guanling fault zone, Guizhou Province. Chin. J. Geophys. 2017, 60, 1124–1134. [Google Scholar]
- SUMMIT II Compact; DMT Group: Essen, Germany, 2020; pp. 1–2. Available online: https://www.summit-system.de/fileadmin/redaktion/microsites/summitsystem/Brochures/PB_SUMMIT_II_Compact.EN_01.20.pdf (accessed on 22 May 2023).
- Telford, W.M.; Geldart, L.P.; Sheriff, R.E.; Keys, D.A. Applied Geophysics, 2nd ed.; Cambridge University Press: Cambridge, UK, 1990. [Google Scholar]
- Chouteau, M.; Mareschal, M.; Giroux, B.; Lines, L. Seismic Refraction Tomography Using Forward Finite Difference Modeling and Waveform Inversion: Application to a Mineral Exploration Site in Quebec, Canada. Geophys. J. Int. 2004, 157, 537–548. [Google Scholar]
- Schuster, G.T. Three-dimensional traveltime computation using eikonal tomography. Geophysics 1993, 58, 1158–1166. [Google Scholar]
- Hagedoorn, J.G. Propagation of elastic waves in multi-layered media. J. Appl. Phys. 1959, 30, 1558–1567. [Google Scholar]


| Profile | Length, m | Depth, m | Spacing, m | L Norm | Iterations | RMS, % |
|---|---|---|---|---|---|---|
| E1 | 120 | 26 | 2.5 | 0.92 | 5 | 2.88 |
| E2 | 60 | 12 | 2.5 | 1.20 | 8 | 3.28 |
| E3 | 60 | 12 | 2.5 | 0.94 | 5 | 2.90 |
| E4 | 70 | 12 | 2.5 | 3.52 | 7 | 5.63 |
| E5 | 70 | 15 | 2.5 | 3.63 | 6 | 5.72 |
| E6 | 70 | 14 | 2.5 | 3.22 | 6 | 3.22 |
| E7 | 70 | 15 | 2.5 | 1.87 | 7 | 4.11 |
| Profile | Length, m | Depth, m | Geophones | Spacing, m | Iterations | RMS, % |
|---|---|---|---|---|---|---|
| S1 | 100 | 25 | 24 | 5 | 20 WET | 2.7 |
| S2 | 60 | 20 | 24 | 2.5 | 20 WET | 4.2 |
| S3 | 60 | 20 | 24 | 2.5 | 20 WET | 5.7 |
Disclaimer/Publisher’s Note: The statements, opinions and data contained in all publications are solely those of the individual author(s) and contributor(s) and not of MDPI and/or the editor(s). MDPI and/or the editor(s) disclaim responsibility for any injury to people or property resulting from any ideas, methods, instructions or products referred to in the content. |
© 2023 by the authors. Licensee MDPI, Basel, Switzerland. This article is an open access article distributed under the terms and conditions of the Creative Commons Attribution (CC BY) license (https://creativecommons.org/licenses/by/4.0/).
Share and Cite
Jabrane, O.; Martínez-Pagán, P.; Martínez-Segura, M.A.; Alcalá, F.J.; El Azzab, D.; Vásconez-Maza, M.D.; Charroud, M. Integration of Electrical Resistivity Tomography and Seismic Refraction Tomography to Investigate Subsiding Sinkholes in Karst Areas. Water 2023, 15, 2192. https://doi.org/10.3390/w15122192
Jabrane O, Martínez-Pagán P, Martínez-Segura MA, Alcalá FJ, El Azzab D, Vásconez-Maza MD, Charroud M. Integration of Electrical Resistivity Tomography and Seismic Refraction Tomography to Investigate Subsiding Sinkholes in Karst Areas. Water. 2023; 15(12):2192. https://doi.org/10.3390/w15122192
Chicago/Turabian StyleJabrane, Oussama, Pedro Martínez-Pagán, Marcos A. Martínez-Segura, Francisco Javier Alcalá, Driss El Azzab, Marco D. Vásconez-Maza, and Mohammed Charroud. 2023. "Integration of Electrical Resistivity Tomography and Seismic Refraction Tomography to Investigate Subsiding Sinkholes in Karst Areas" Water 15, no. 12: 2192. https://doi.org/10.3390/w15122192