
The Comparison of Seven Models to Simulate the Transport and Deposition of Polydisperse Particles under Favorable Conditions in a Saturated Medium
Abstract
:1. Introduction
2. Materials and Methods
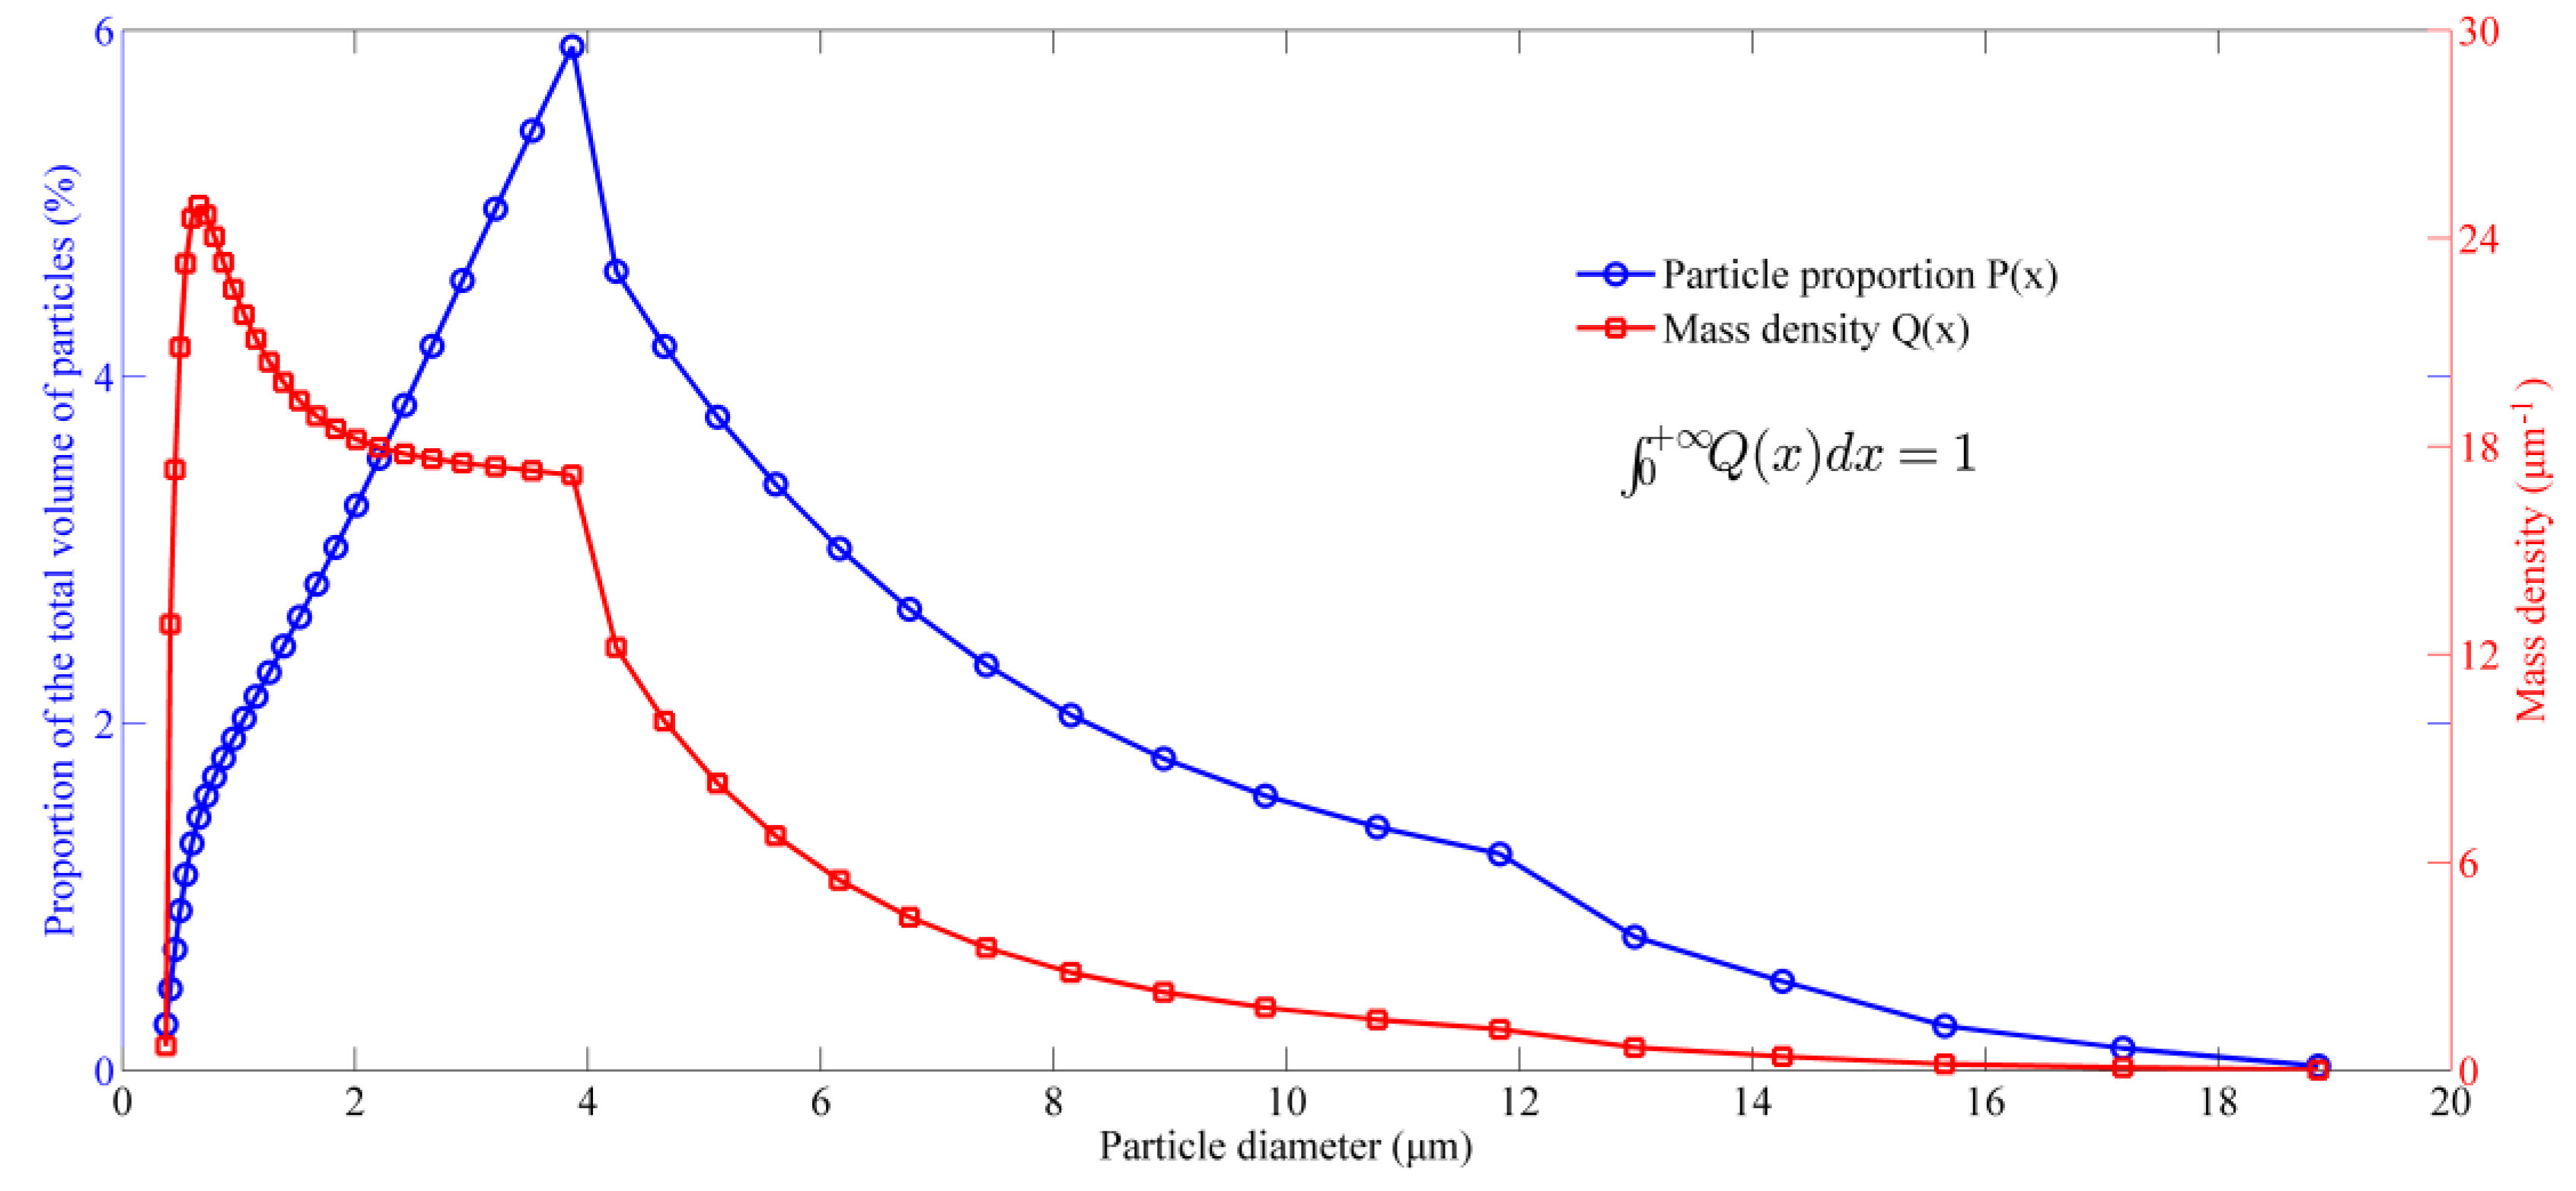
2.1. Polydisperse Particles
2.2. Porous Medium
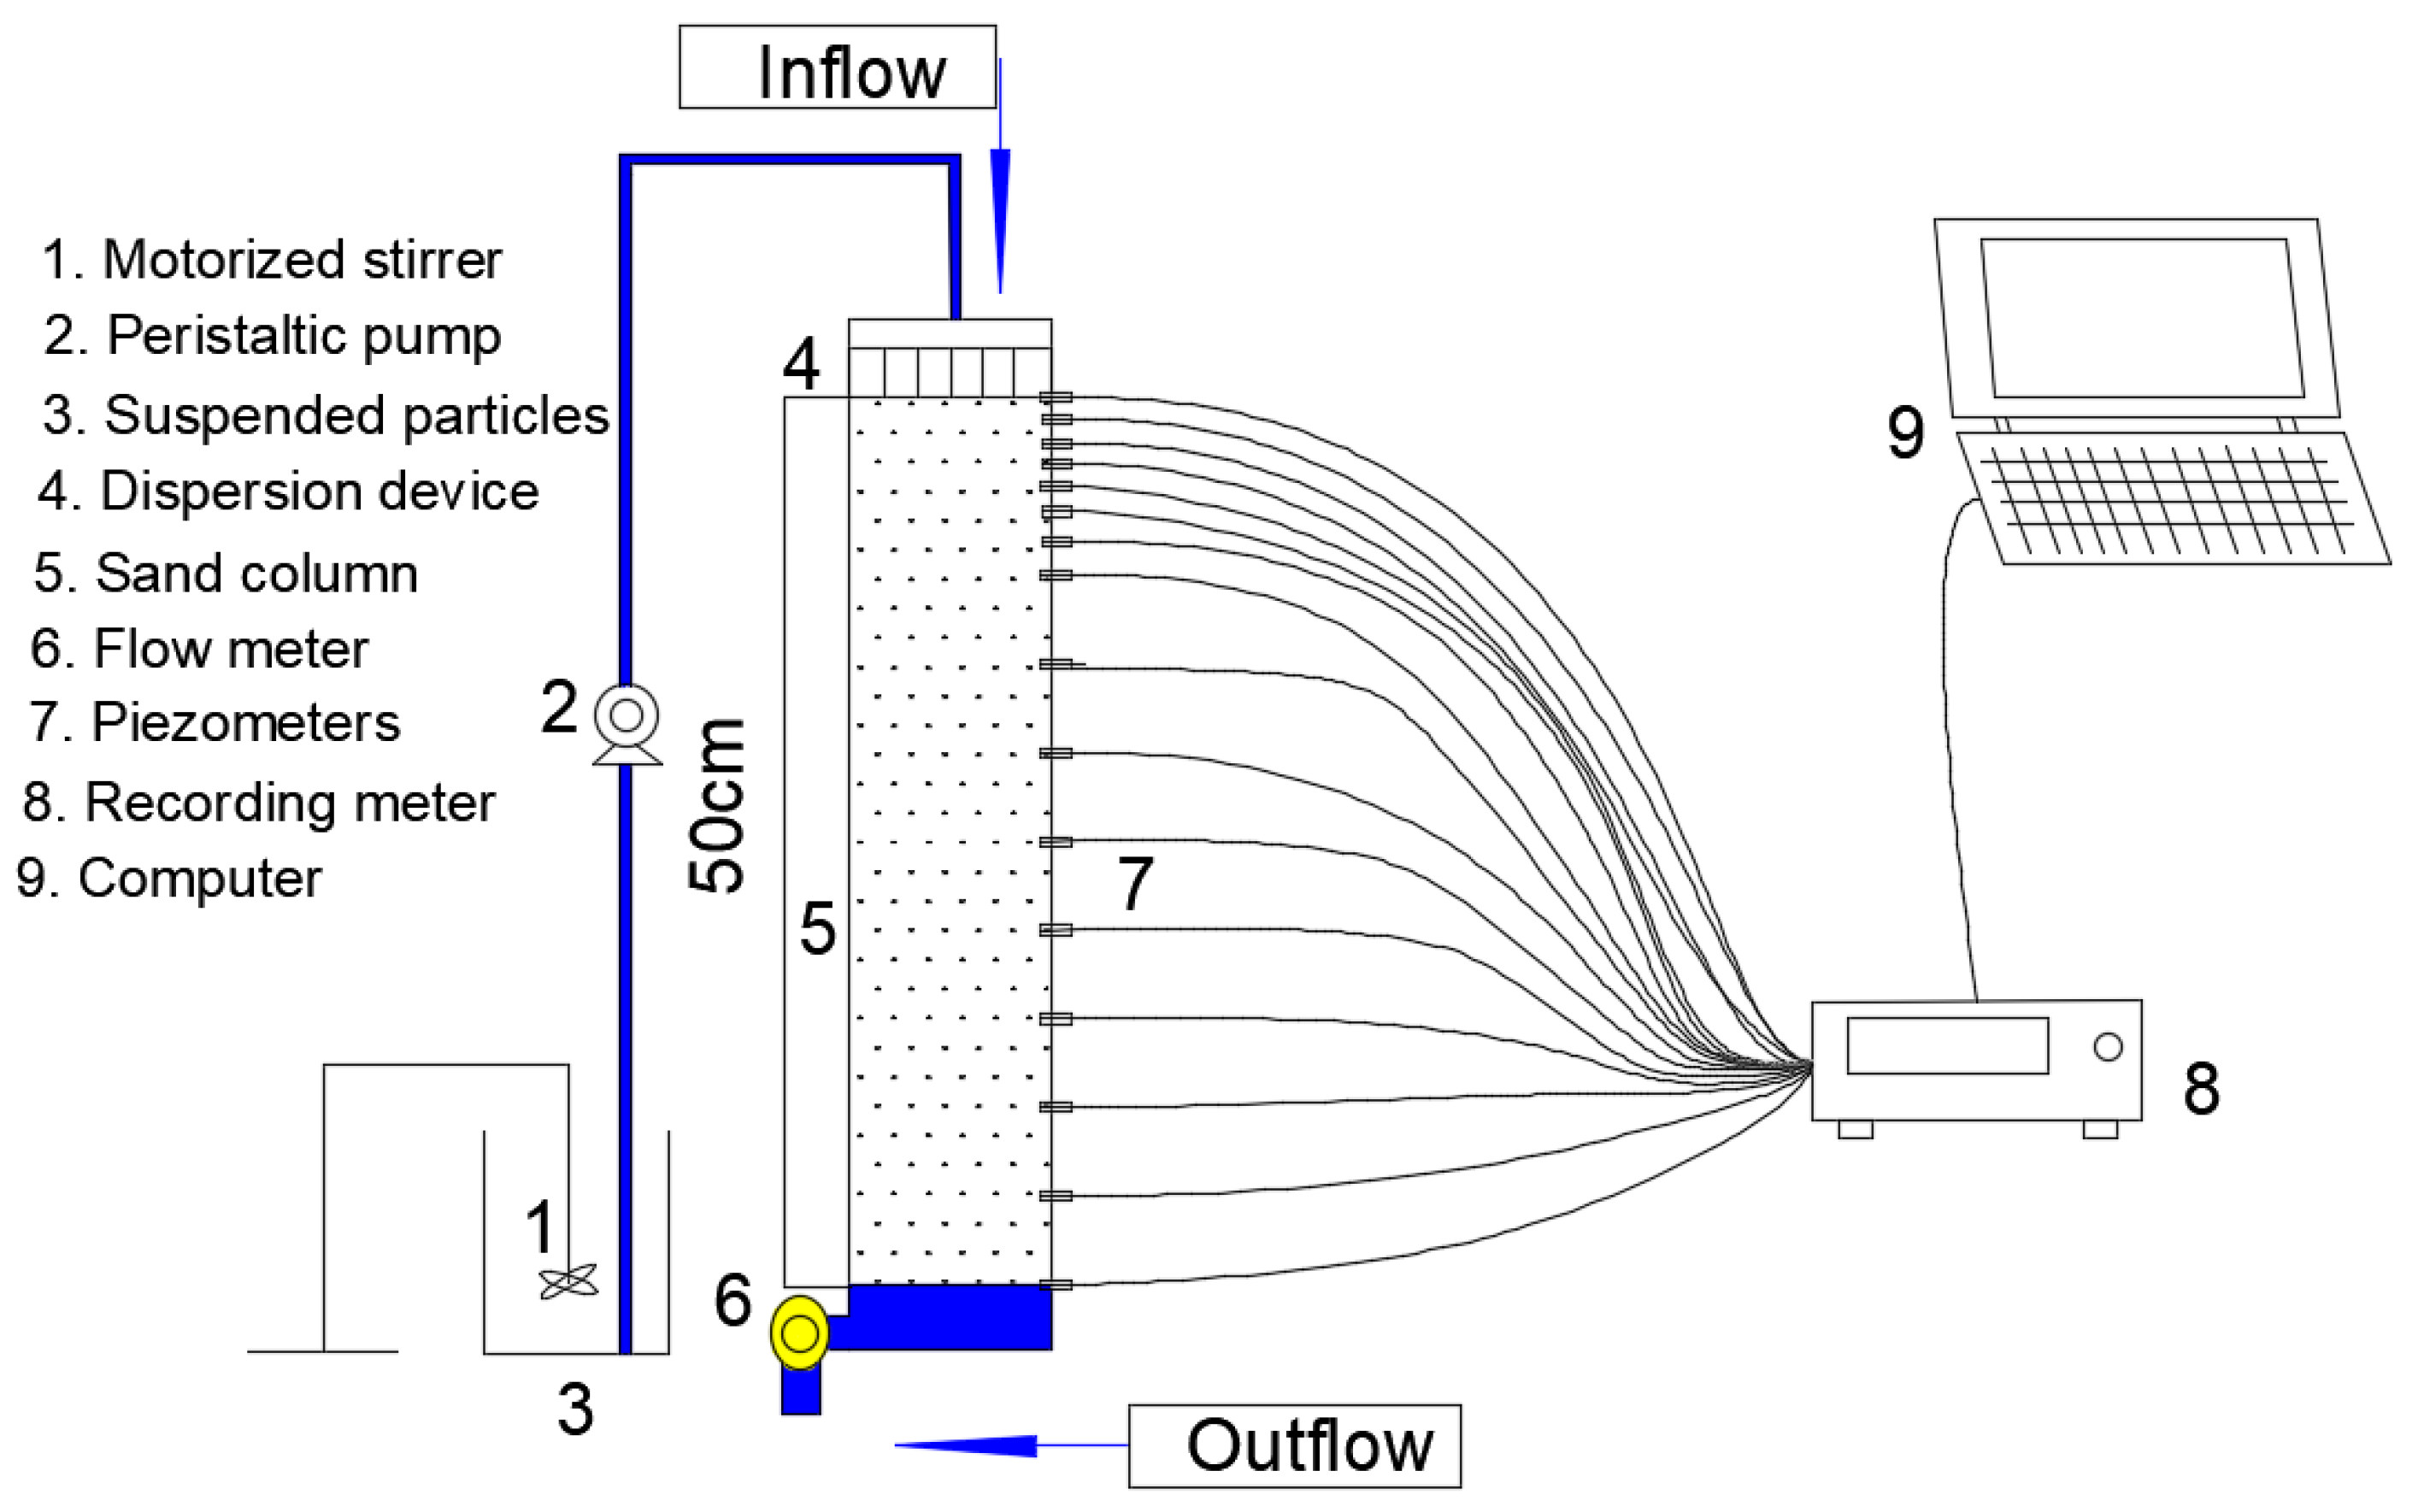
2.3. Experiments for the Transport and Deposition of Polydisperse Particles
2.4. Modeling for the Transport and Deposition Processes of Polydisperse Particles
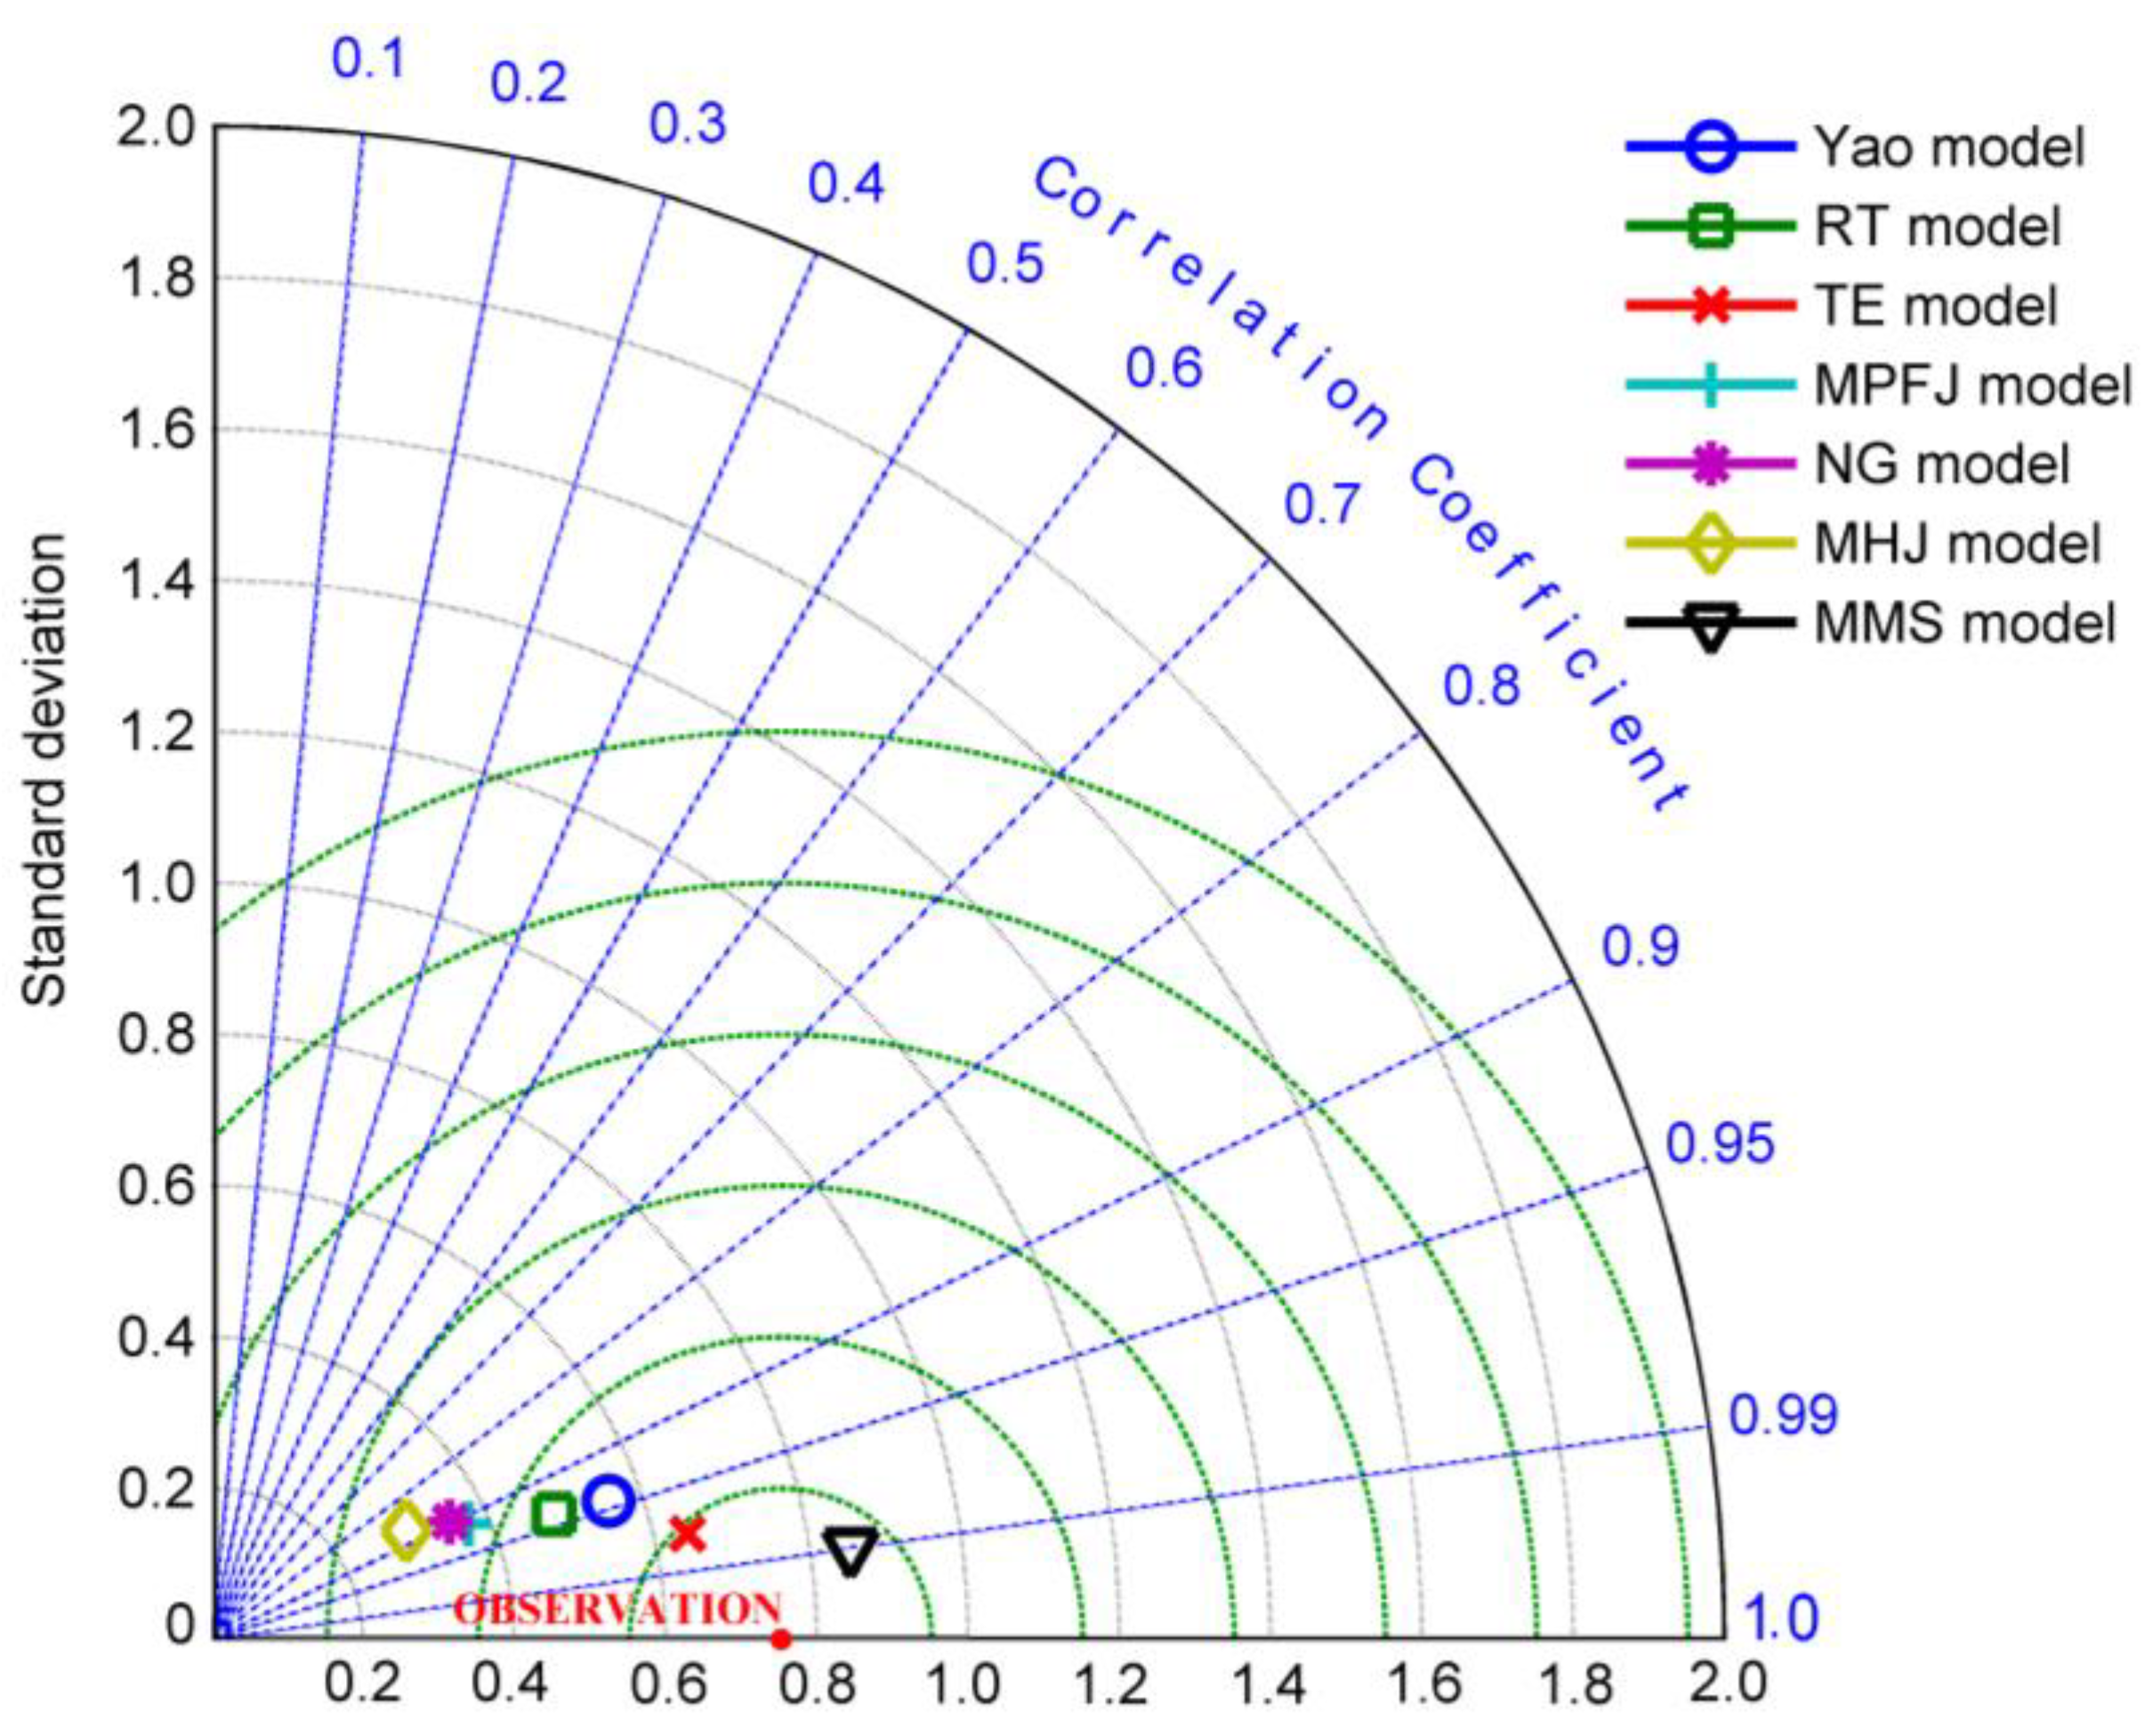
2.5. Evaluation Criterion
3. Results
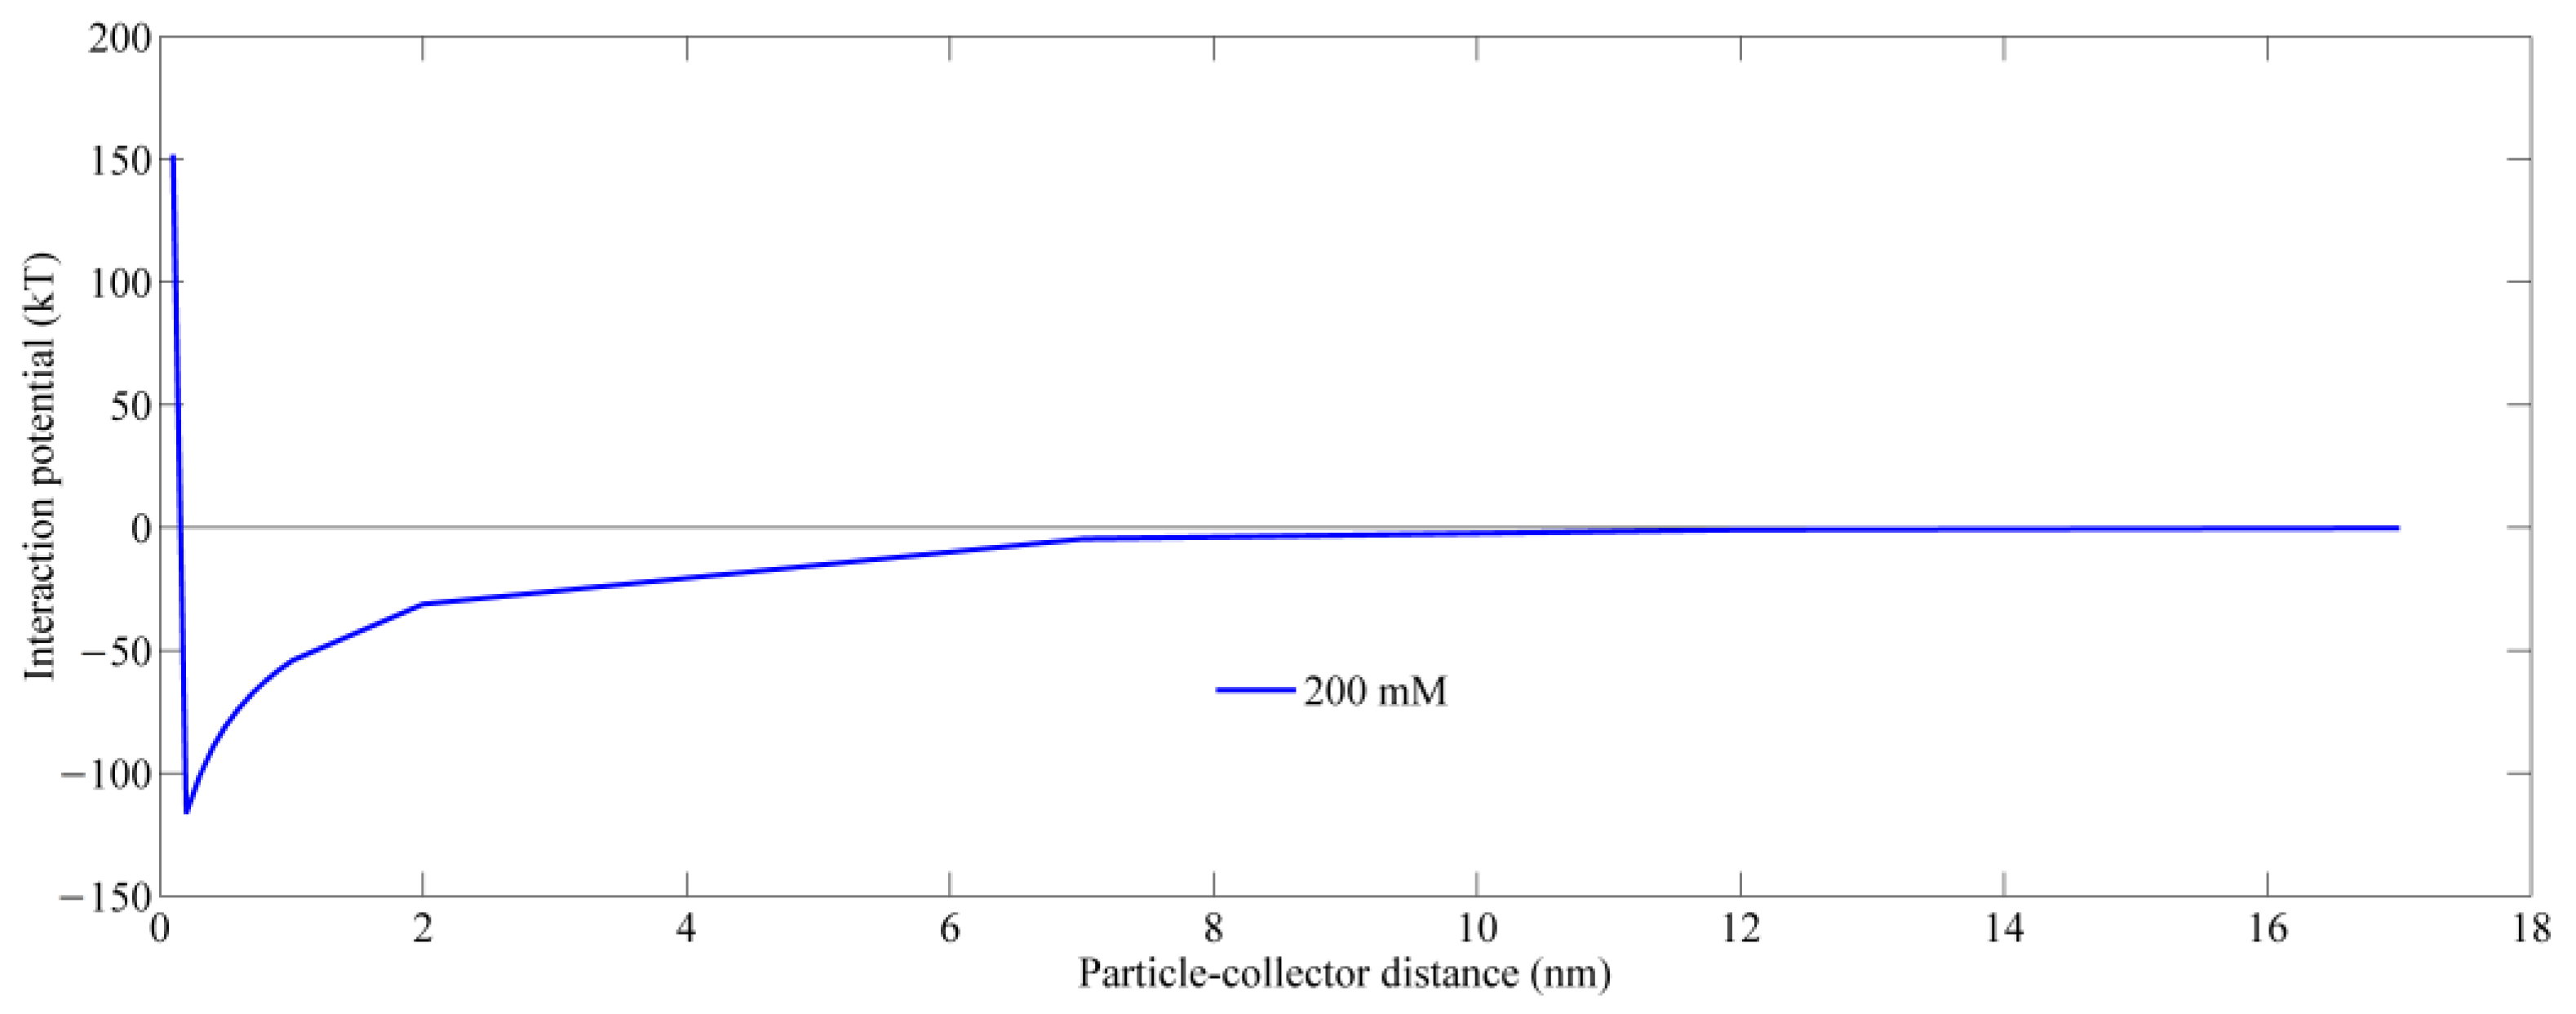
3.1. XDLVO Energy
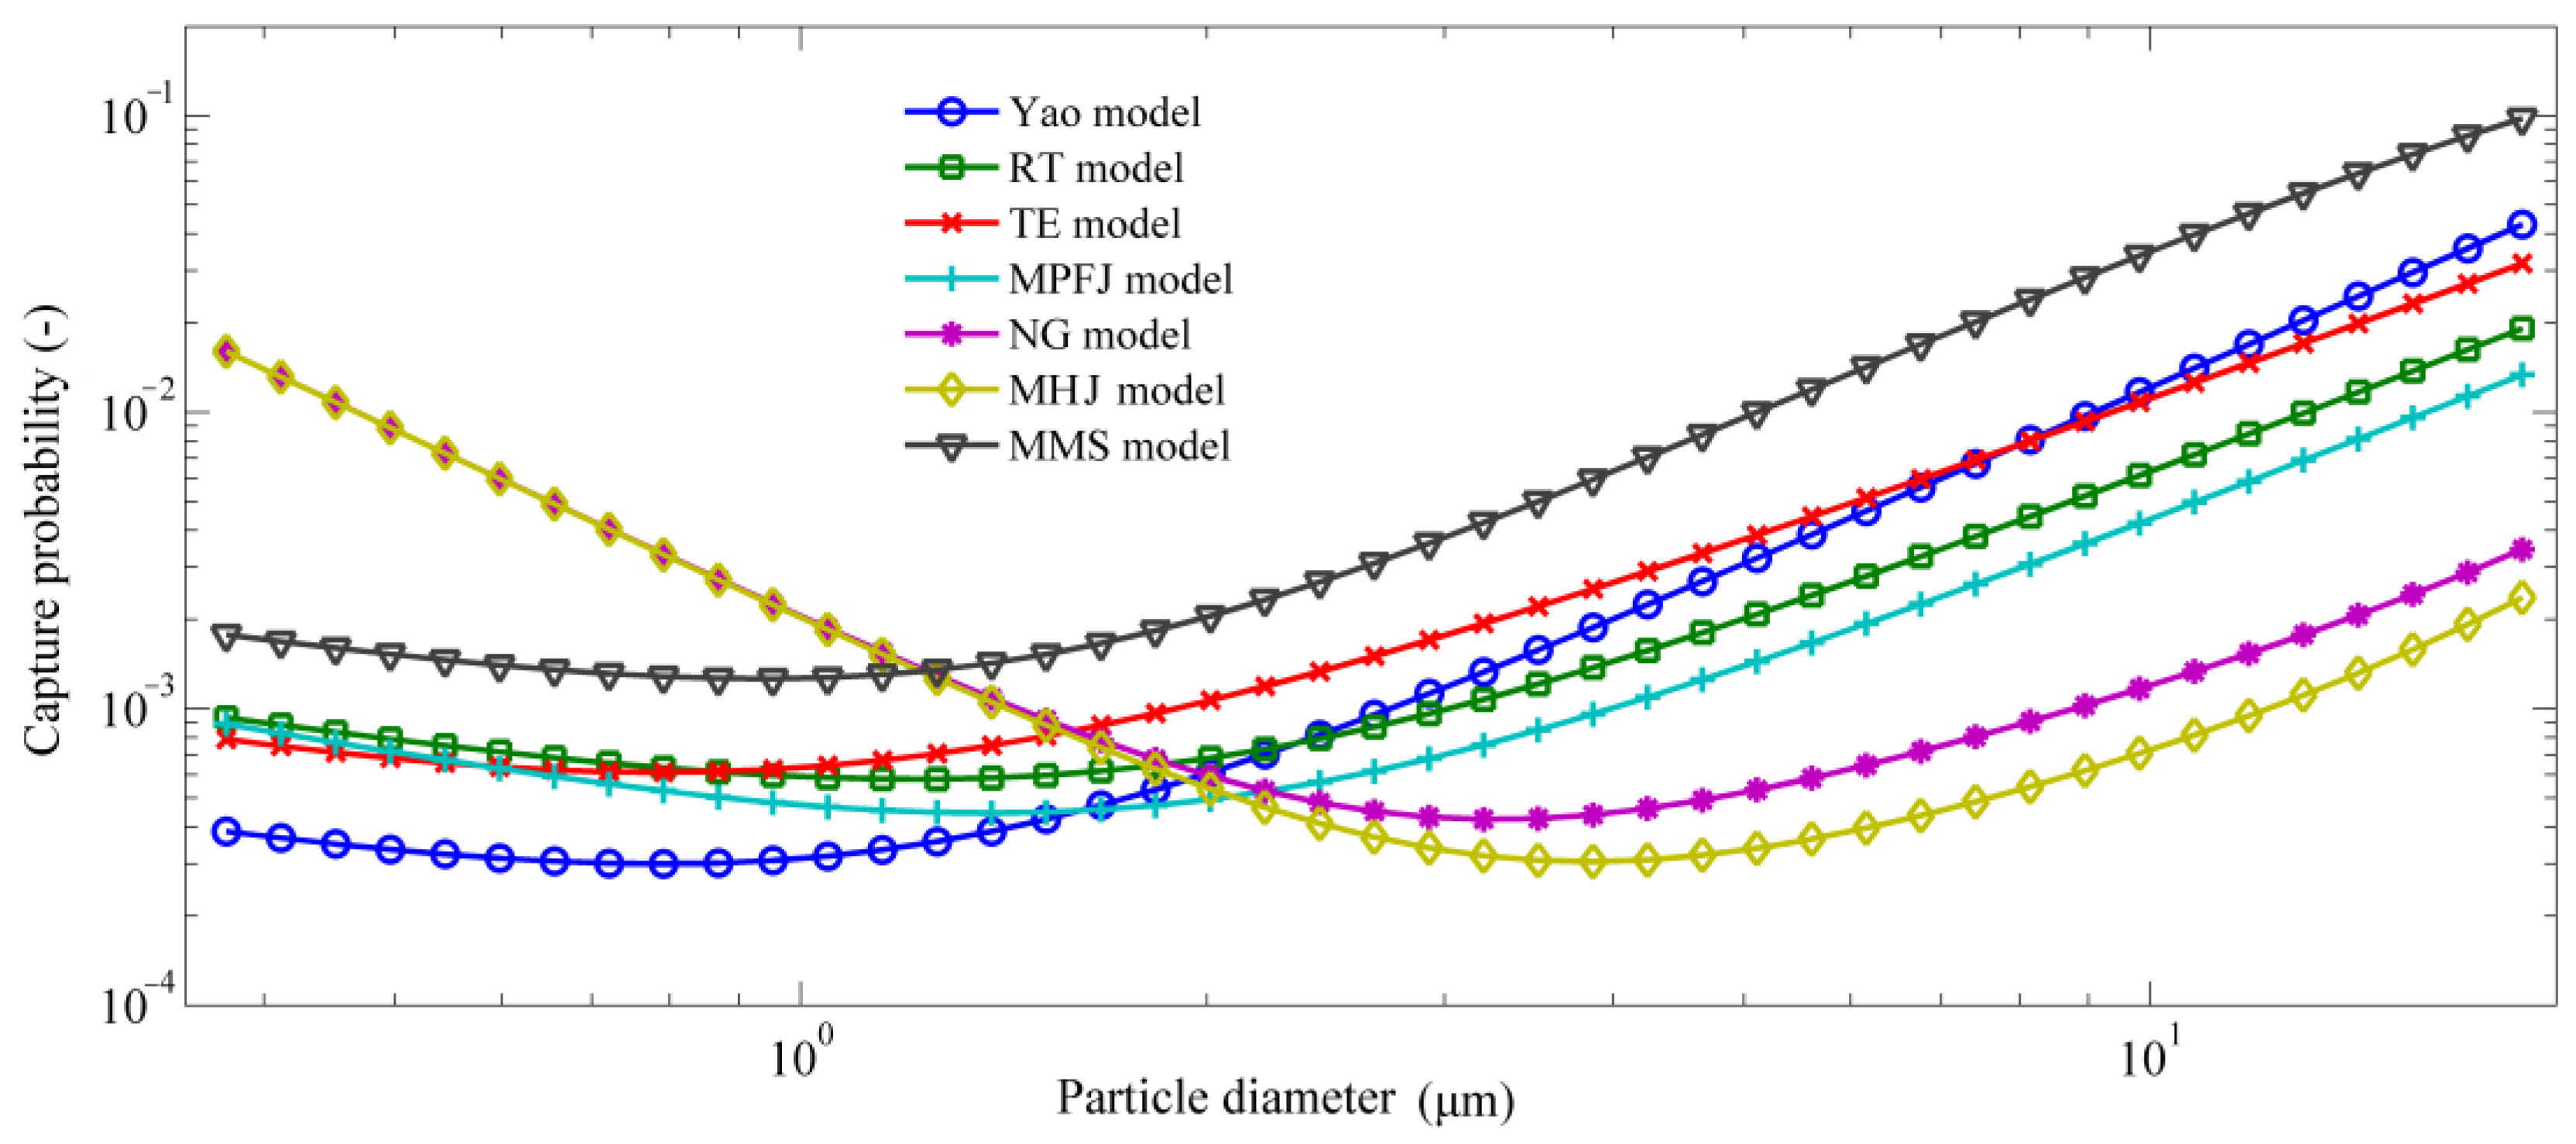
3.2. Seven Correlation Equations for Polydisperse Particles
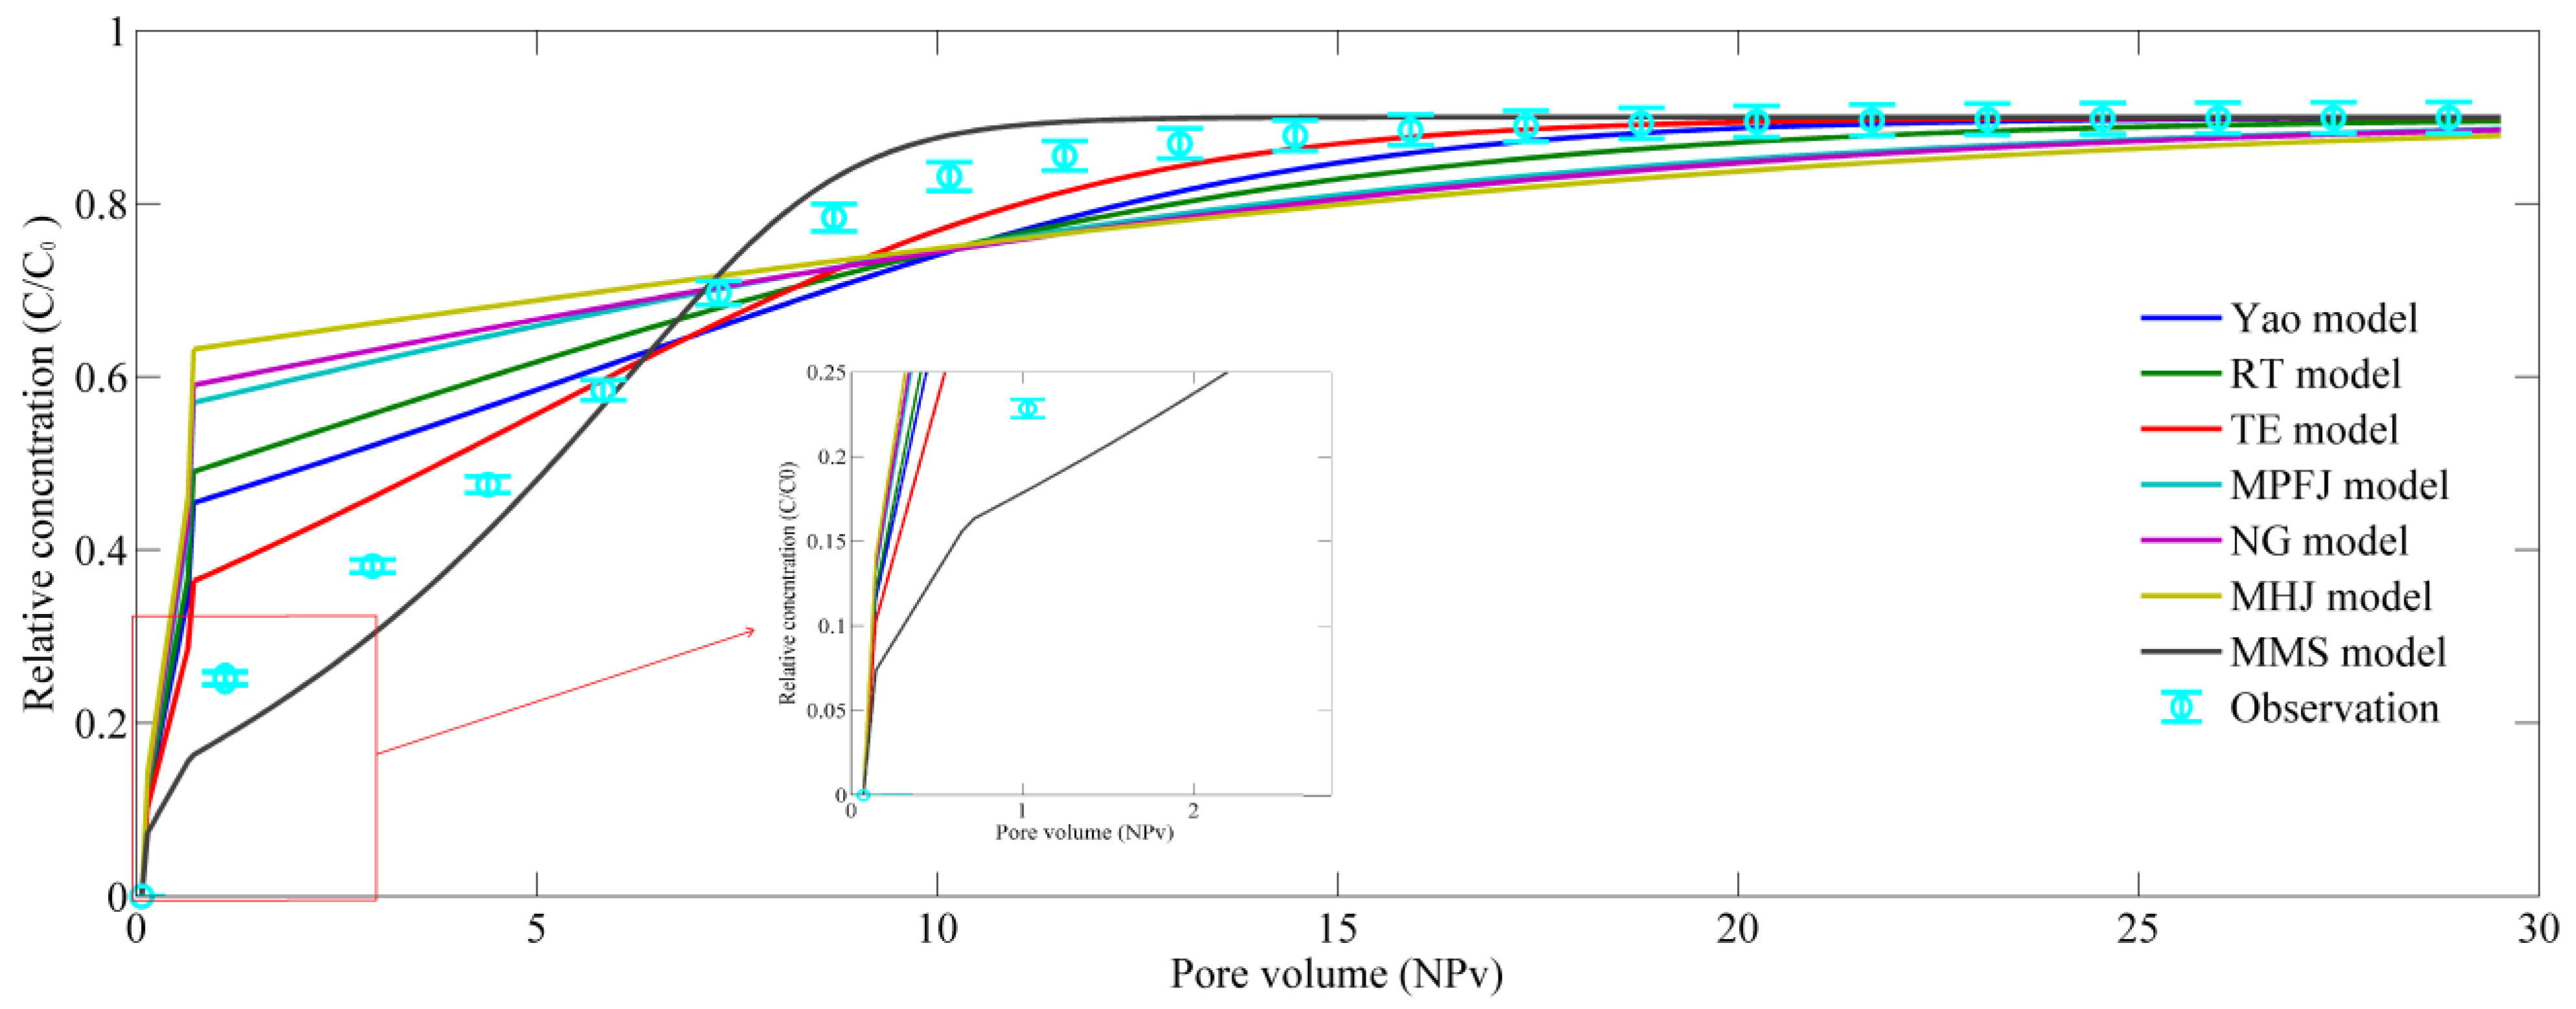
3.3. The Transport of Polydisperse Particles in the Porous Medium
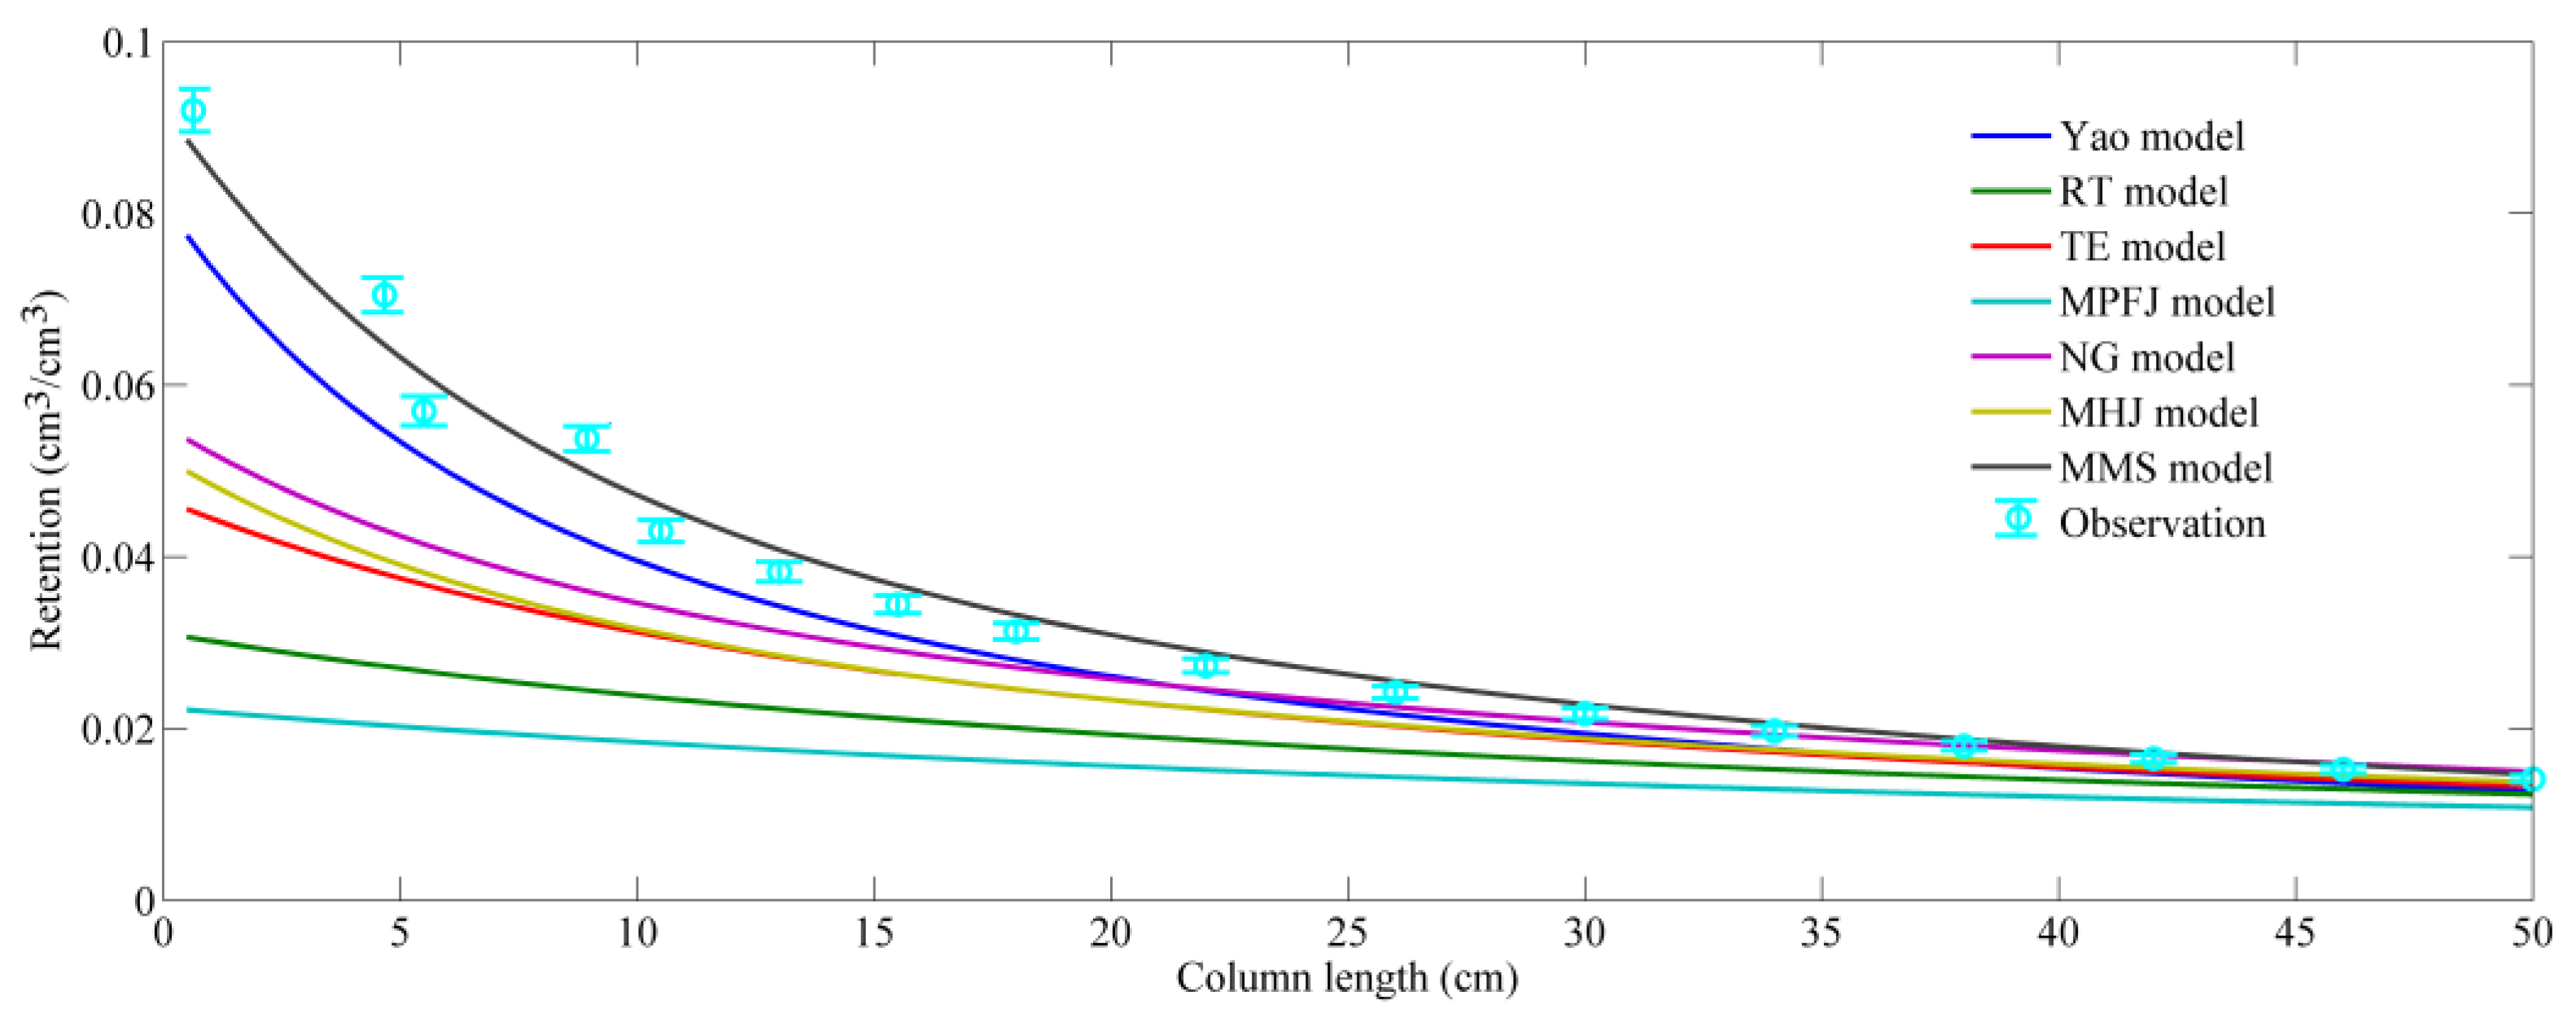
3.4. The Final Retention Profile
4. Discussion
4.1. The Formation of a Hyper-Exponential Deposition Profile
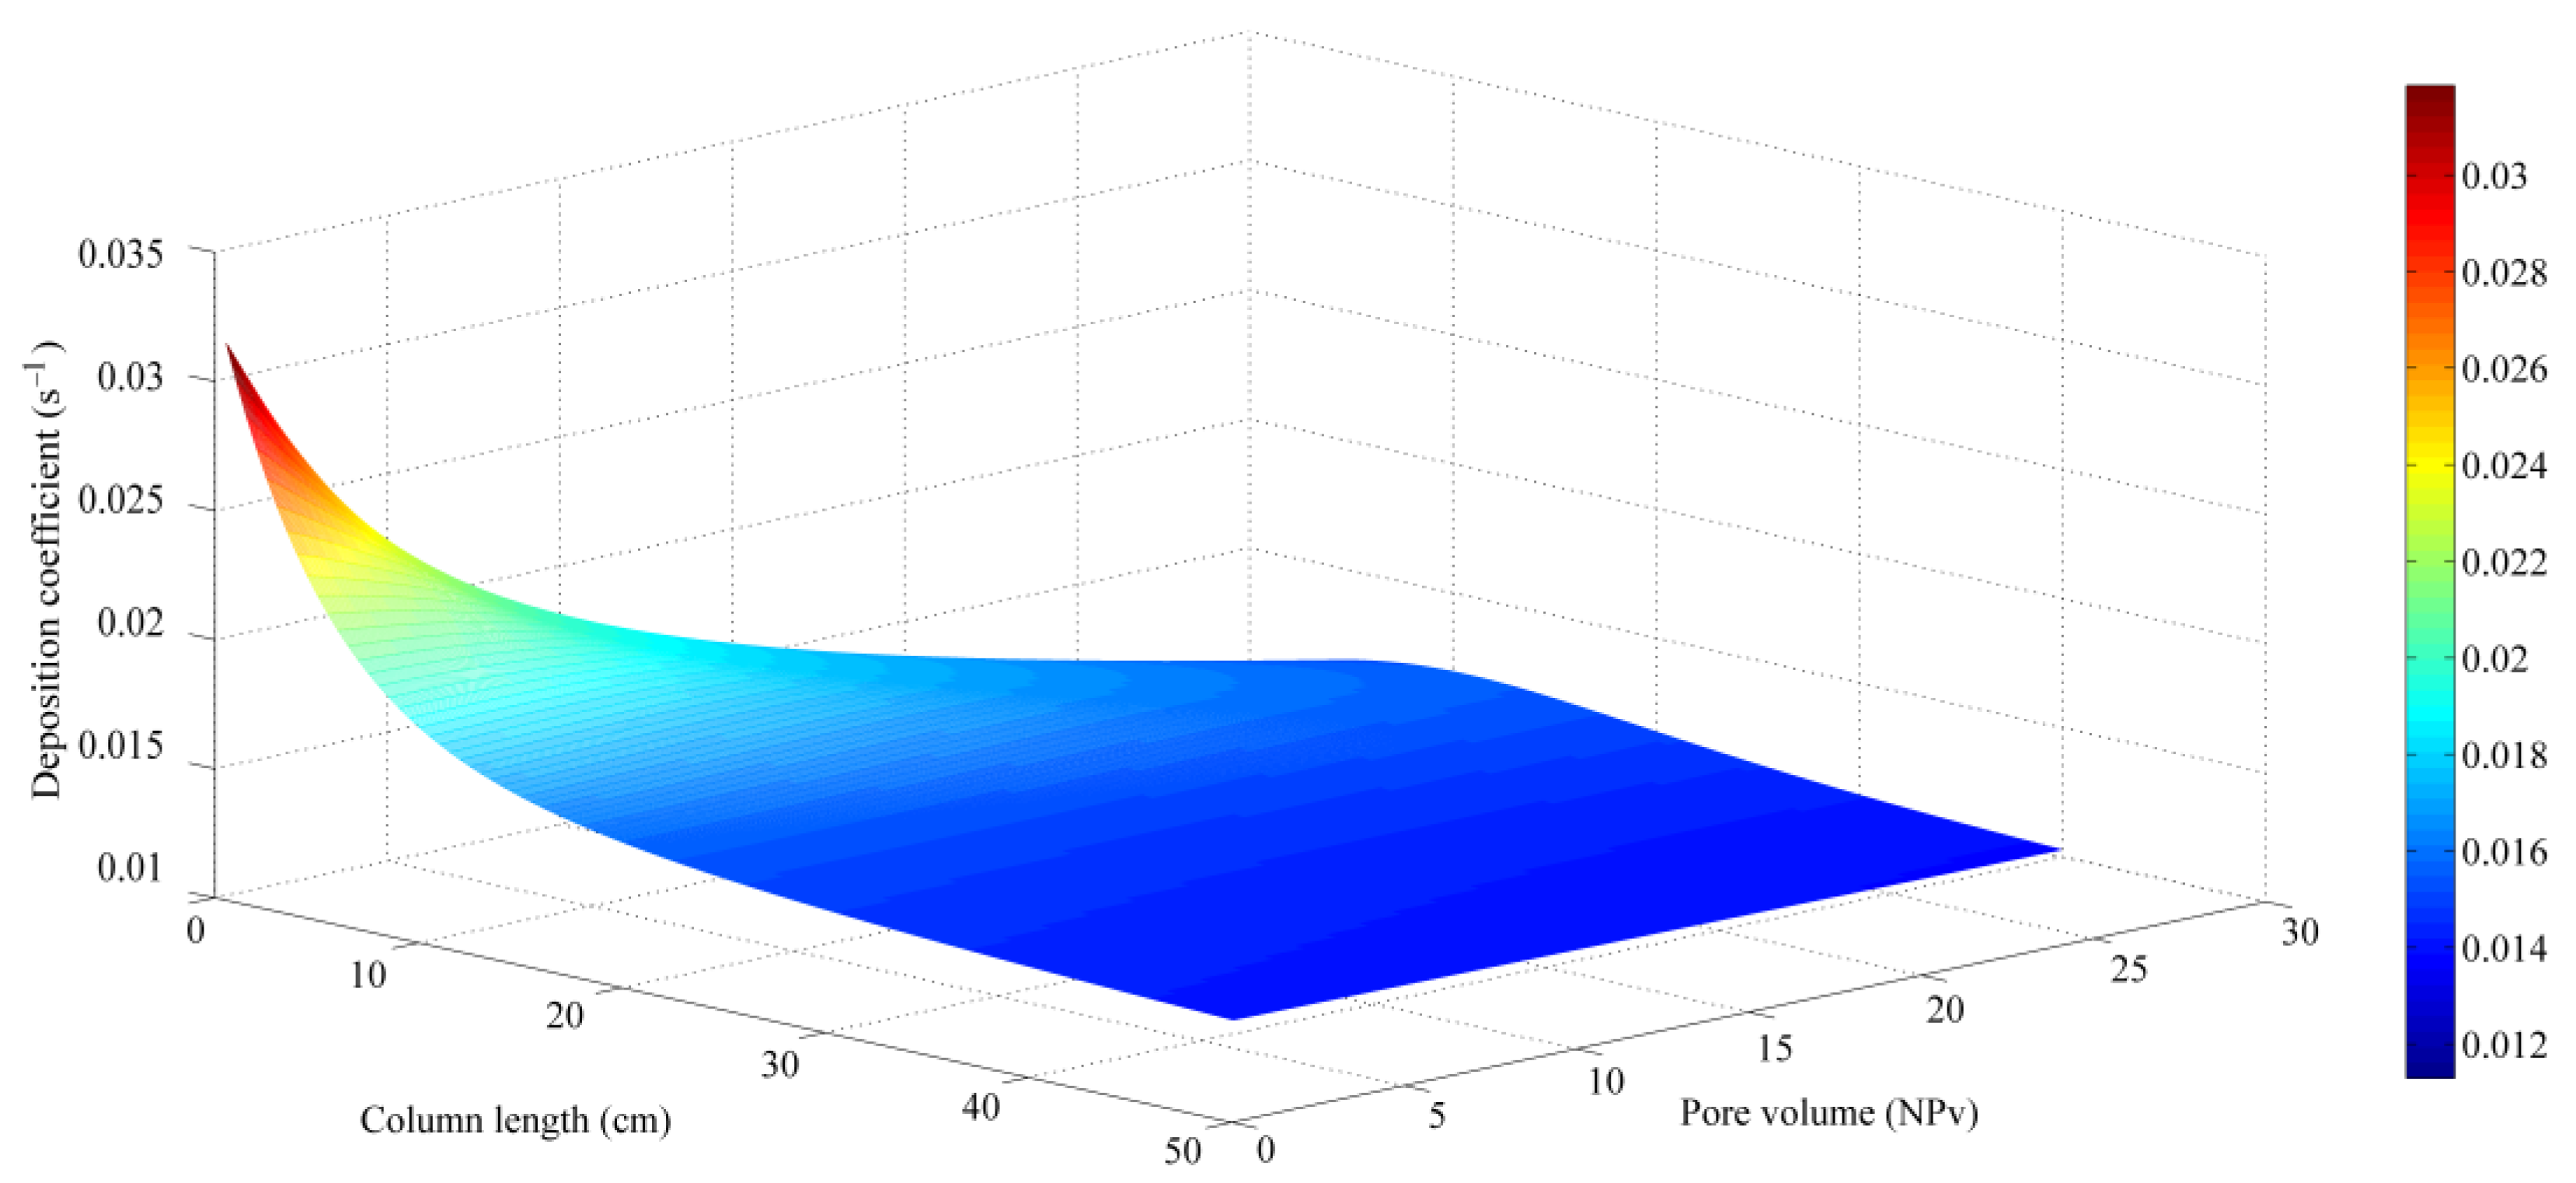
4.2. Spatial and Temporal Evolution of Deposition Coefficient
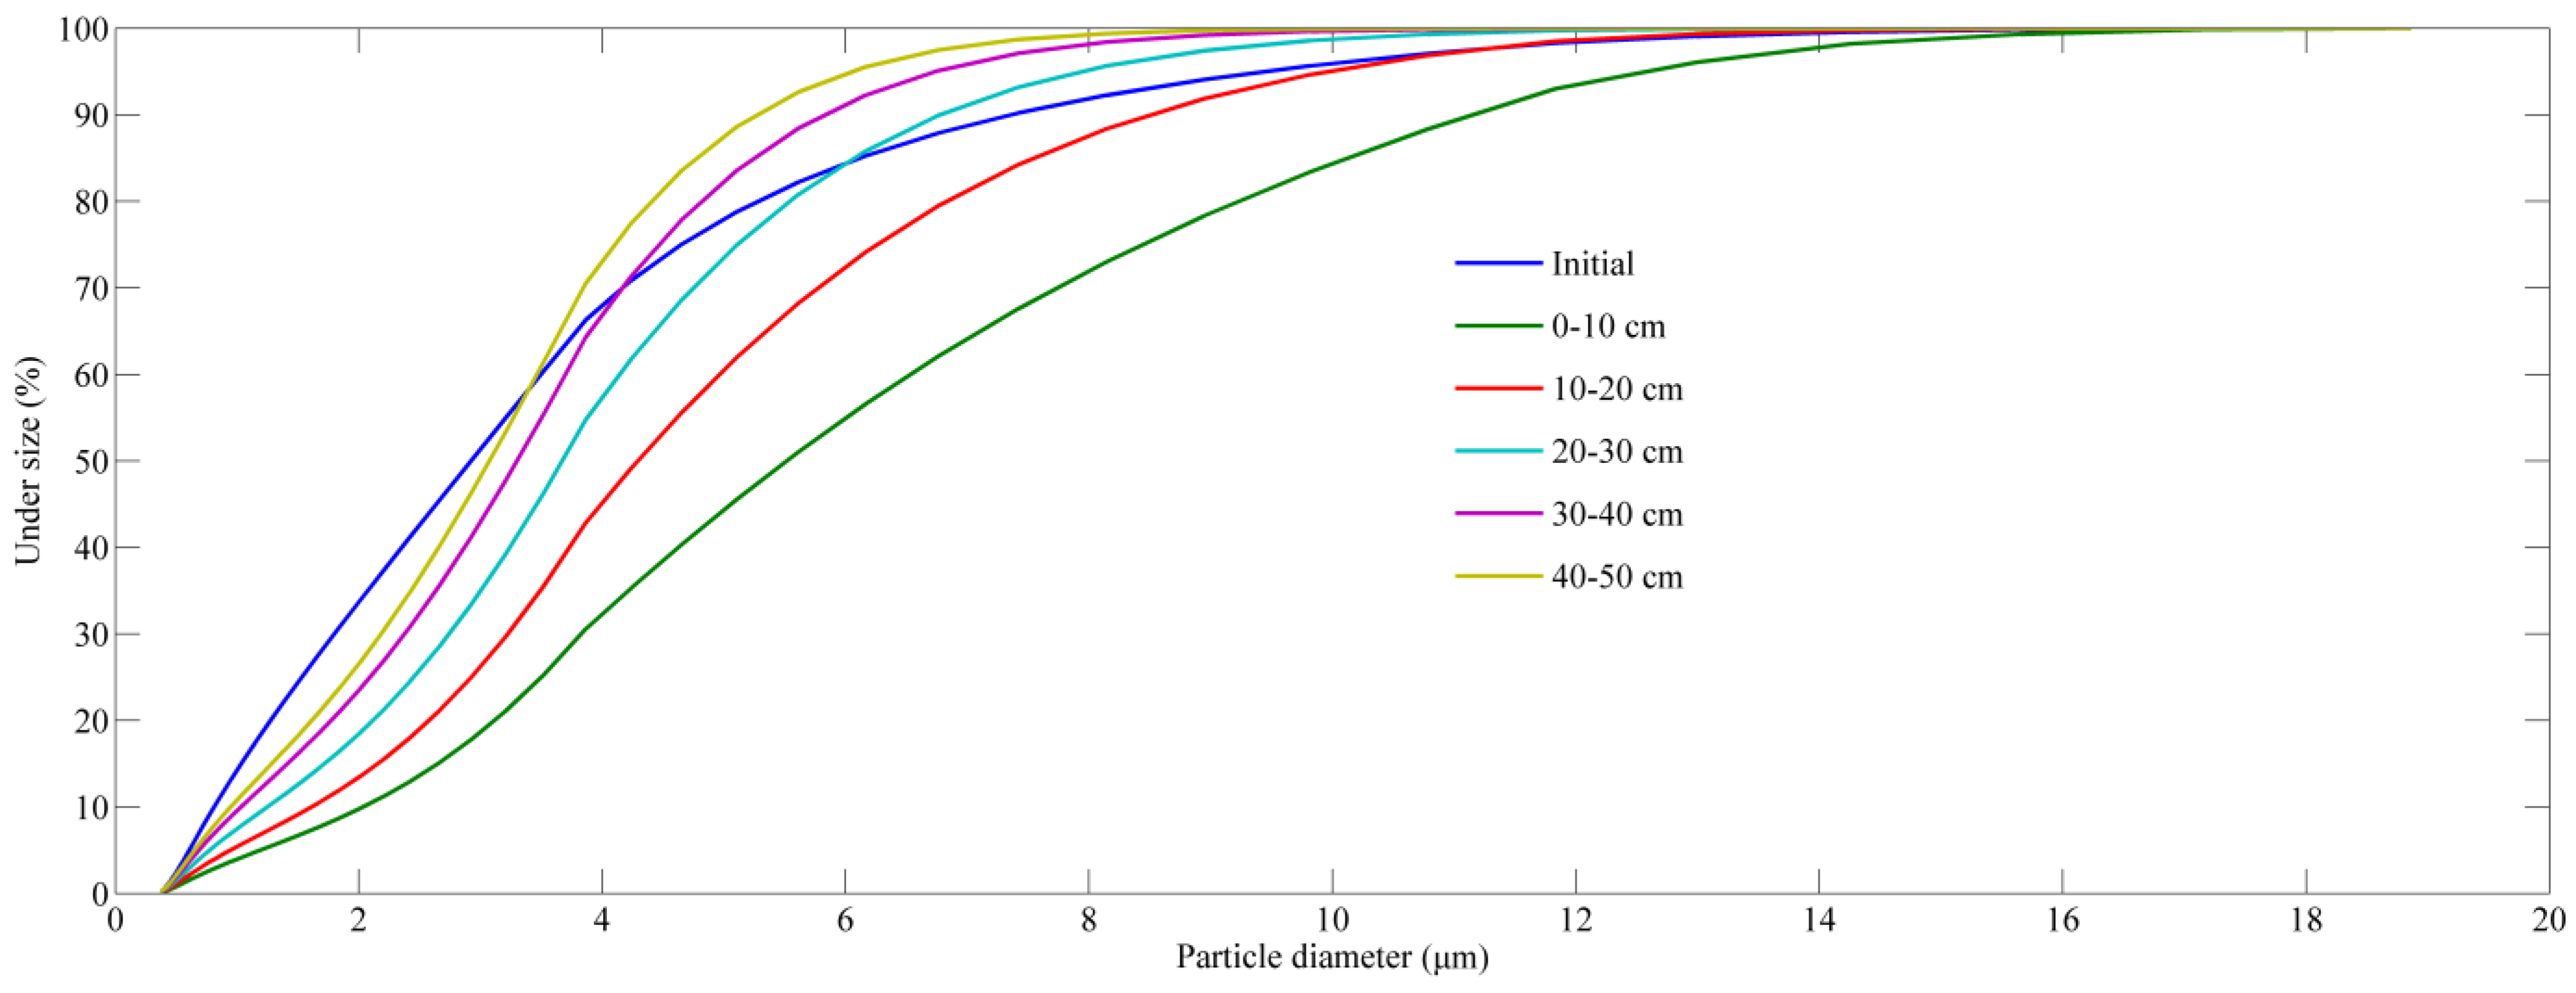
4.3. Particle Size Distribution Analysis of the Retained Particles
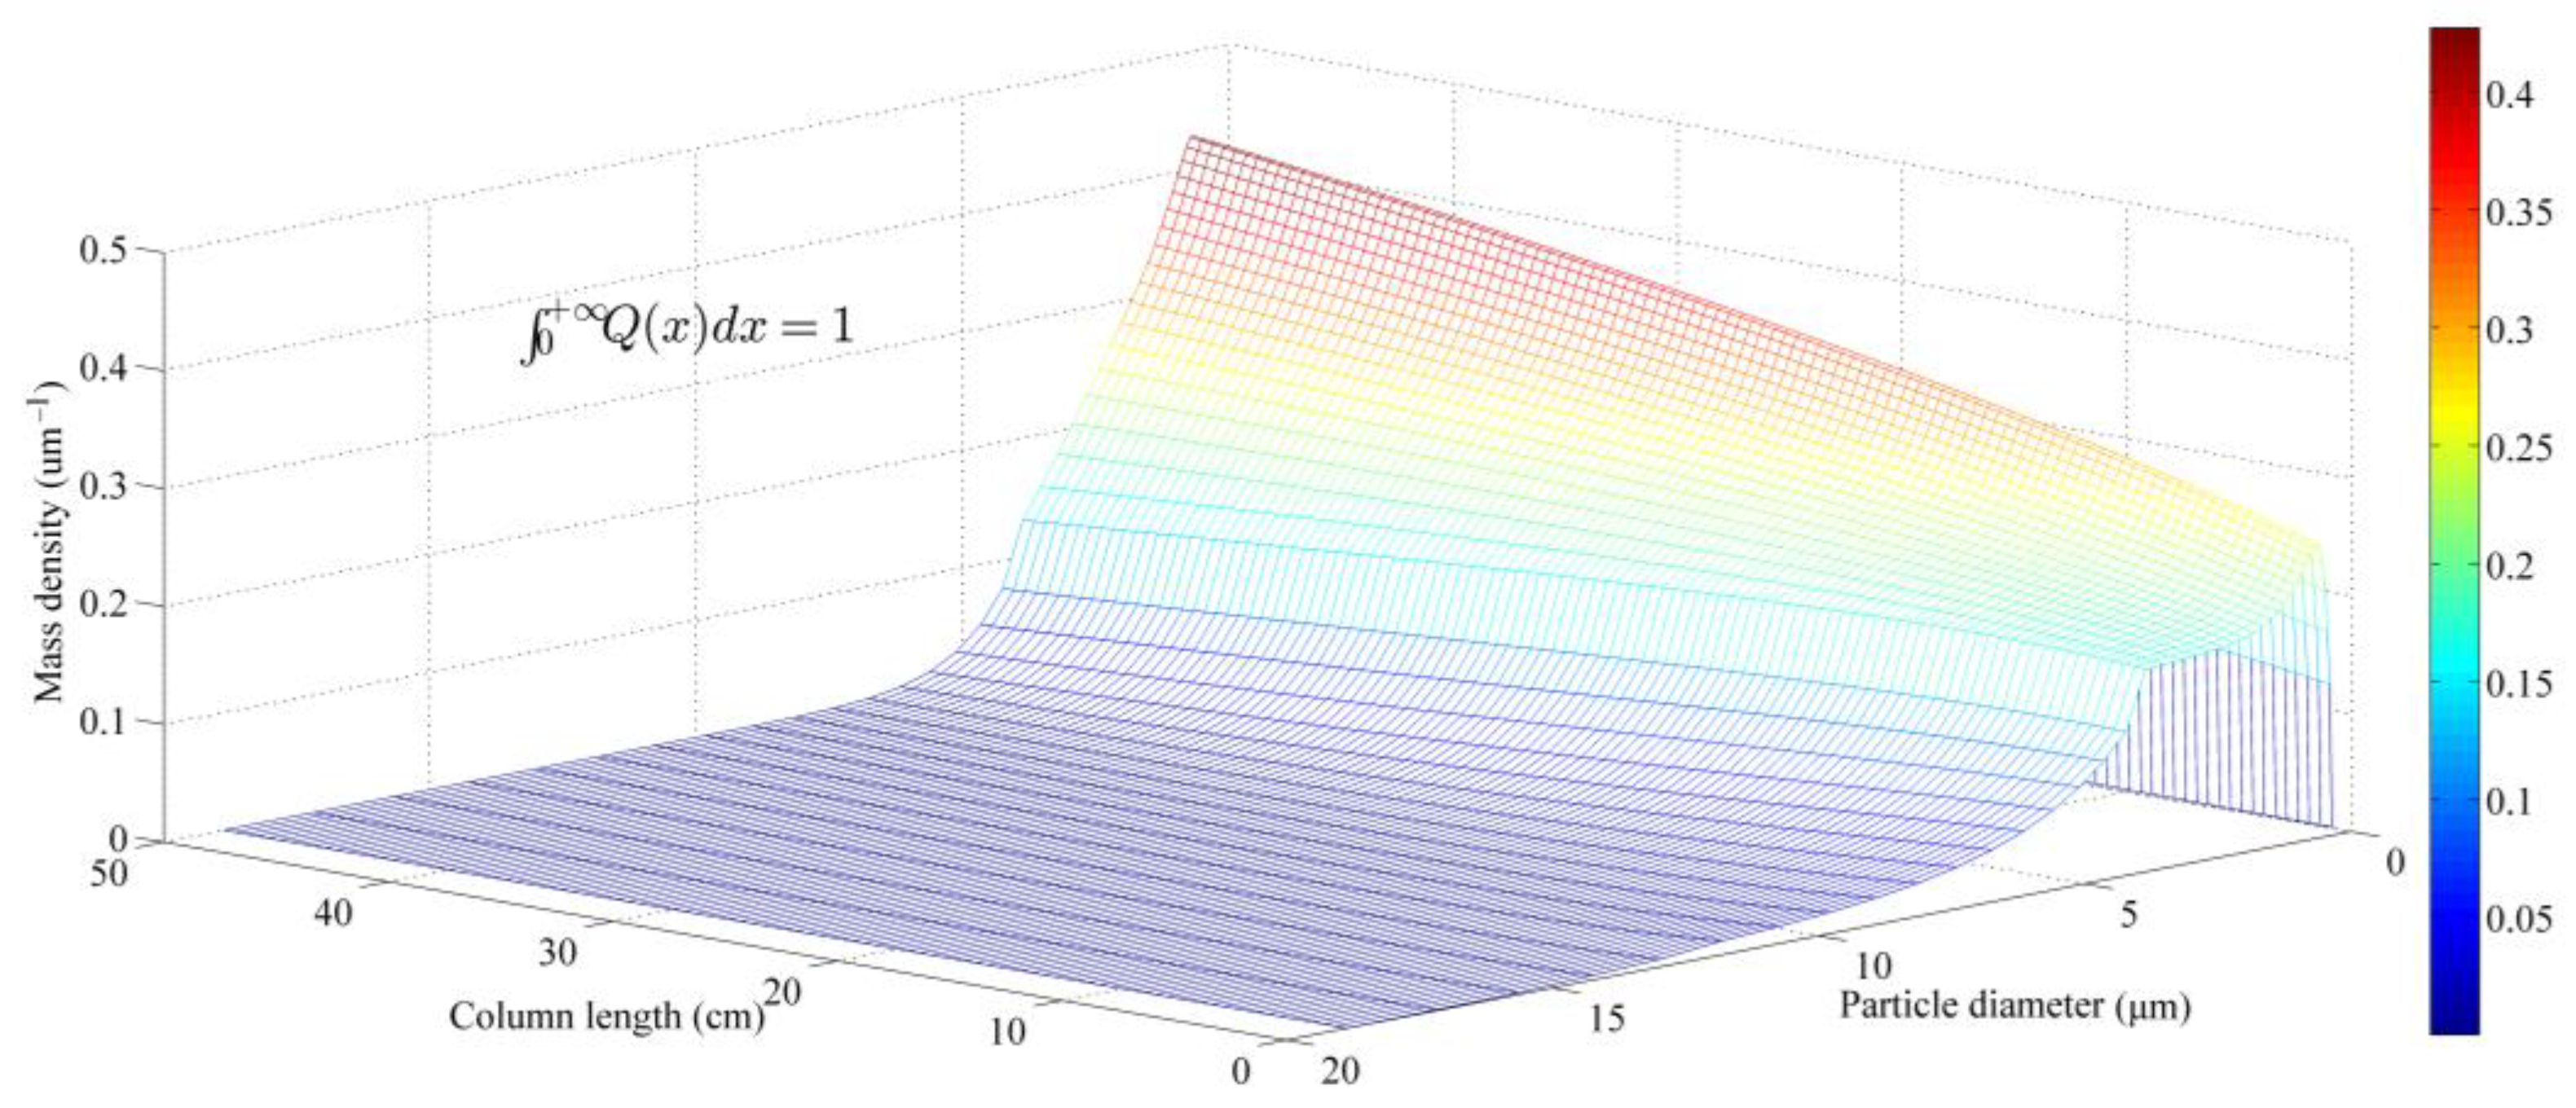
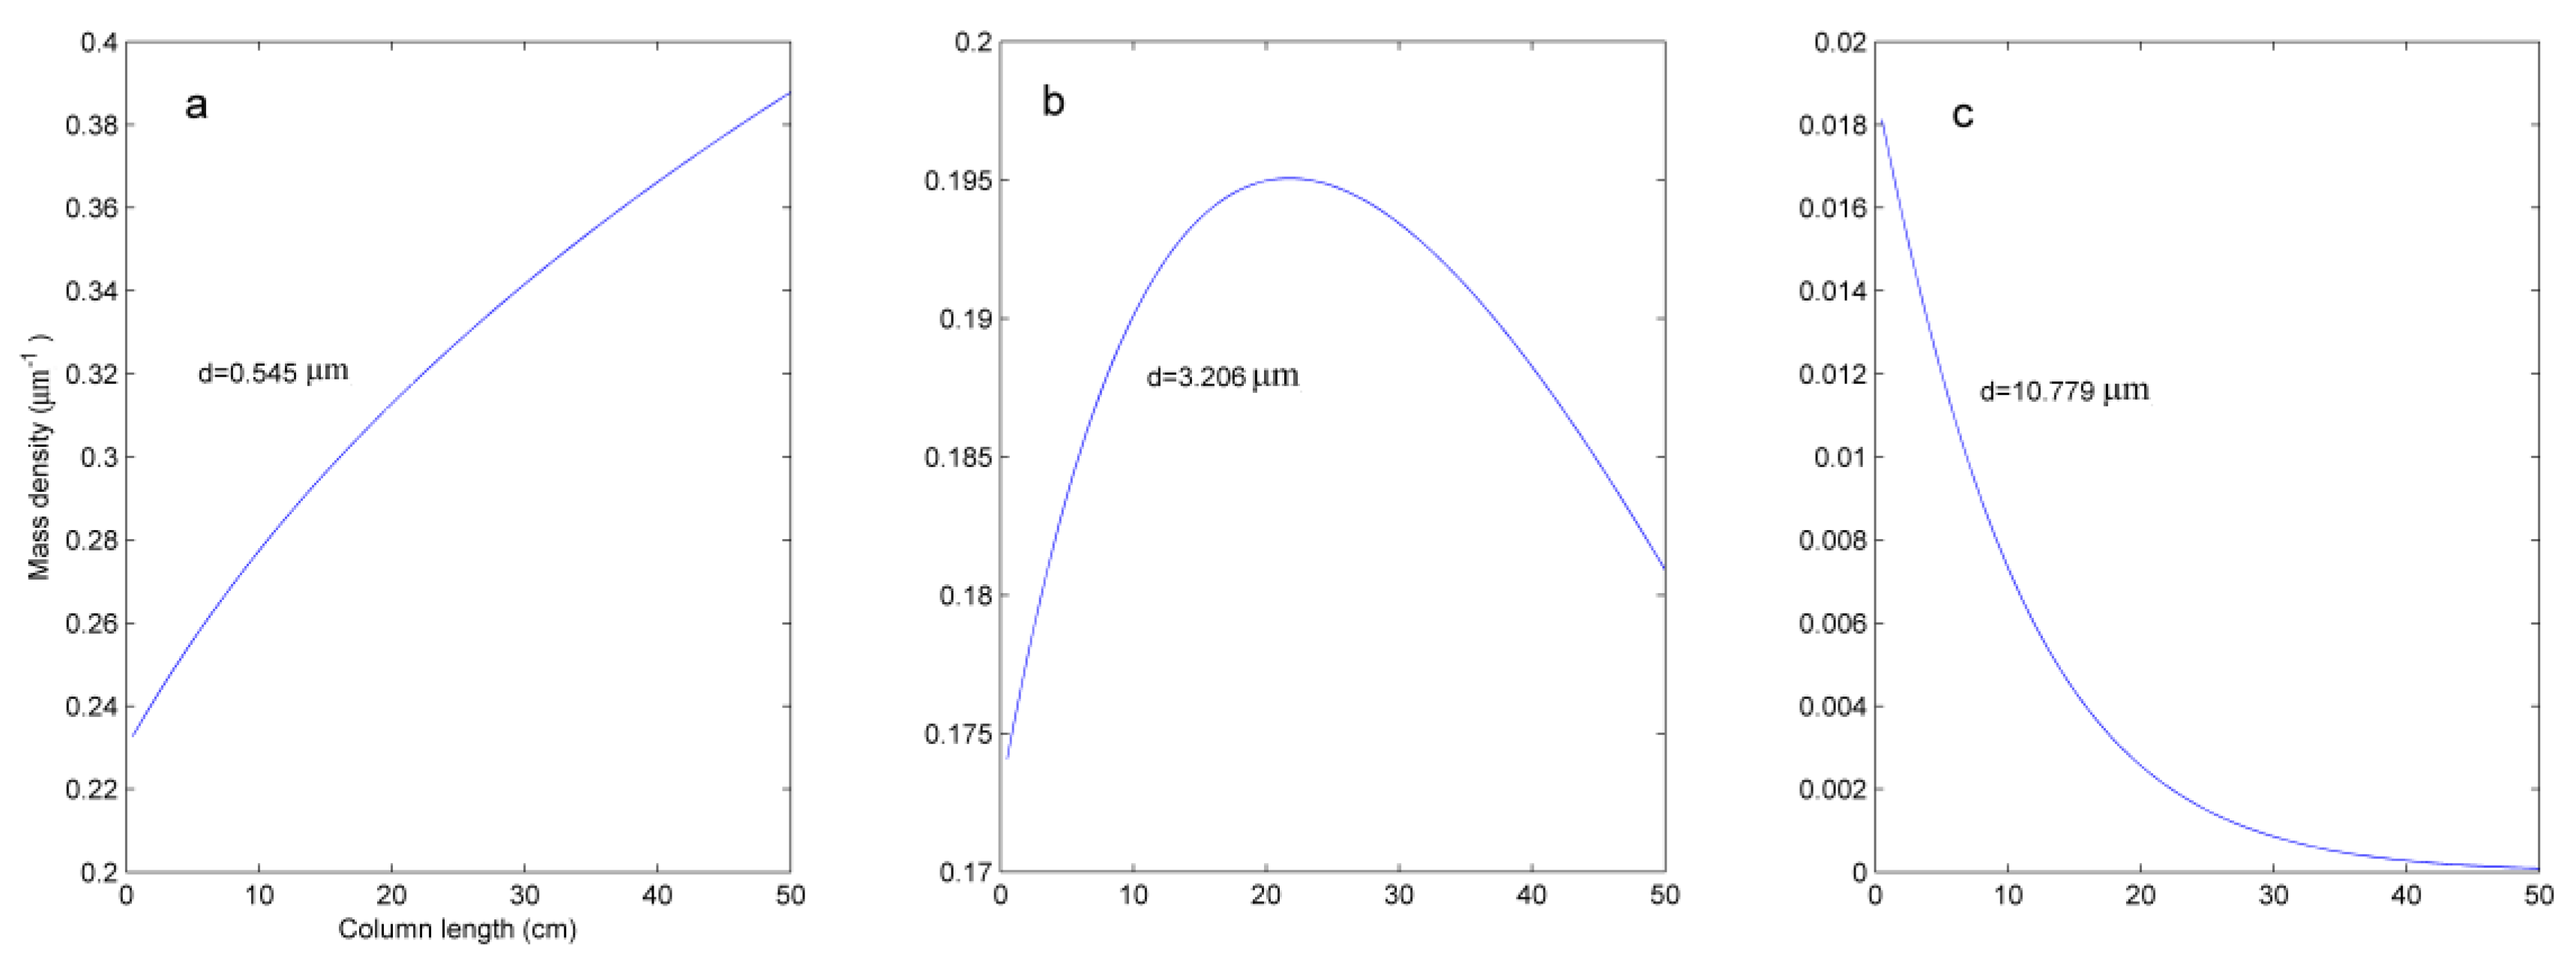
4.4. Spatial Distribution of the Mass Density
5. Conclusions
Supplementary Materials
Author Contributions
Funding
Data Availability Statement
Acknowledgments
Conflicts of Interest
Nomenclature
| C | aqueous phase concentration of the polydisperse particles |
| Cin, Cout | inlet concentration and outlet concentration |
| D | hydrodynamic dispersion coefficient |
| z | space coordinate |
| t | time coordinate |
| S | solid phase concentration of retained particles |
| Sm | maximal value of S |
| u | Darcy velocity |
| ε | porosity of the sand porous medium |
| ρp | bulk density of the particles |
| k0 | initial deposition coefficient |
| dc | average collector diameter |
| Q(x) | mass density of the polydisperse particles |
| η(x) | capture probability of a particle with a diameter of x |
| x | a collection of particle sizes |
| φ | a dimensionless particle deposition function |
References
- Molnar, I.L.; Johnson, W.P.; Gerhard, J.I.; Willson, C.S.; O’Carroll, D.M. Predicting colloid transport through saturated porous media: A critical review. Water Resour. Res. 2015, 51, 6804–6845. [Google Scholar] [CrossRef] [Green Version]
- Dubuis, R.; De Cesare, G. The clogging of riverbeds: A review of the physical processes. Earth Sci. Rev. 2023, 239, 104374. [Google Scholar] [CrossRef]
- Yang, Y.; Yuan, W.; Hou, J.; You, Z. Review on physical and chemical factors affecting fines migration in porous media. Water Res. 2022, 214, 118172. [Google Scholar] [CrossRef] [PubMed]
- Ling, X.; Yan, Z.; Liu, Y.; Lu, G. Transport of nanoparticles in porous media and its effects on the co-existing pollutants. Environ. Pollut. 2021, 283, 117098. [Google Scholar] [CrossRef] [PubMed]
- Wang, Y.; Xie, Y.; Fan, W.; Yang, Z.; Tan, W.; Huo, M.; Huo, Y. Mechanism comparisons of transport-deposition-reentrainment between microplastics and natural mineral particles in porous media: A theoretical and experimental study. Sci. Total Environ. 2022, 850, 157998. [Google Scholar] [CrossRef] [PubMed]
- Hunt, R.J.; Johnson, W.P. Pathogen transport in groundwater systems: Contrasts with traditional solute transport. Hydrogeol. J. 2017, 25, 921. [Google Scholar] [CrossRef]
- Johnson, W.P.; Rasmuson, A.; Ron, C.; Erickson, B.; VanNess, K.; Bolster, D.; Peters, B. Anionic nanoparticle and microplastic non-exponential distributions from source scale with grain size in environmental granular media. Water Res. 2020, 182, 116012. [Google Scholar] [CrossRef]
- Fopa, R.D.; Bianco, C.; Archilha, N.L.; Moreira, A.C.; Pak, T. A pore-scale investigation of the effect of nanoparticle injection on properties of sandy porous media. J. Contam. Hydrol. 2023, 253, 104126. [Google Scholar] [CrossRef]
- Johnson, W.P.; Anna, R.; Eddy, P.; Markus, H. Why variant colloid transport behaviors emerge among identical individuals in porous media when colloid-surface repulsion exists. Environ. Sci. Technol. 2018, 52, 7230–7239. [Google Scholar] [CrossRef]
- Zamani, A.; Maini, B. Flow of dispersed particles through porous media-Deep bed filtration. J. Petrol. Sci. Eng. 2009, 69, 71–88. [Google Scholar] [CrossRef]
- Ahfir, N.D.; Hammadi, A.; Alem, A.; Wang, H.Q.; Bras, G.L.; Ouahbi, T. Porous media grain size distribution and hydrodynamic forces effects on transport and deposition of suspended particles. J. Environ. Sci. China 2017, 53, 161–172. [Google Scholar] [CrossRef]
- Russell, T.; Dinariev, O.Y.; Pessoa Rego, L.A.; Bedrikovetsky, P. Averaged Boltzmann’s kinetics for colloidal transport in porous media. Water Resour. Res. 2021, 57, e2020WR029557. [Google Scholar] [CrossRef]
- Dong, Z.; Qiu, Y.; Zhang, W.; Yang, Z.; Wei, L. Size-dependent transport and retention of micron-sized plastic spheres in natural sand saturated with seawater. Water Res. 2018, 143, 518–526. [Google Scholar] [CrossRef]
- Sun, Y.; Gao, B.; Bradford, S.A.; Wu, L.; Chen, H.; Shi, X.; Wu, J. Transport, retention, and size perturbation of graphene oxide in saturated porous media: Effects of input concentration and grain size. Water Res. 2015, 68, 24–33. [Google Scholar] [CrossRef]
- Gitis, V.; Rubinstein, I.; Livshits, M.; Ziskind, G. Deep-bed filtration model with multistage deposition kinetics. Chem. Eng. J. 2010, 163, 78–85. [Google Scholar] [CrossRef]
- Tosco, T.; Bosch, J.; Meckenstock, R.U.; Sethi, R. Transport of ferrihydrite nanoparticles in saturated porous media: Role of ionic strength and flow rate. Environ. Sci. Technol. 2012, 46, 4008–4015. [Google Scholar] [CrossRef] [PubMed] [Green Version]
- Azimian, M.; Kühnle, C.; Wiegmann, A. Design and optimization of fibrous filter media using lifetime multipass simulations. Chem. Eng. Technol. 2018, 41, 928–935. [Google Scholar] [CrossRef]
- Tiraferri, A.; Tosco, T.; Sethi, R. Transport and retention of microparticles in packed sand columns at low and intermediate ionic strengths: Experiments and mathematical modeling. Environ. Earth Sci. 2011, 63, 847–859. [Google Scholar] [CrossRef]
- Yao, K.M.; Habibian, M.T.; O’Melia, C.R. Water and waste water filtration. Concepts and applications. Environ. Sci. Technol. 1971, 5, 1105–1112. [Google Scholar] [CrossRef]
- Rajagopalan, R.; Tien, C. Trajectory analysis of deep-bed filtration with the sphere-in-cell porous media model. AIChE J. 1976, 22, 523–533. [Google Scholar] [CrossRef]
- Tufenkji, N.; Elimelech, M. Correlation equation for predicting single-collector efficiency in physicochemical filtration in saturated porous media. Environ. Sci. Technol. 2004, 38, 529–536. [Google Scholar] [CrossRef]
- Ma, H.; Pedel, J.; Fife, P.; Johnson, W.P. Hemispheres-in-cell geometry to predict colloid deposition in porous media. Environ. Sci. Technol. 2009, 43, 8573–8579. [Google Scholar] [CrossRef] [PubMed]
- Nelson, K.E.; Ginn, T.R. New collector efficiency equation for colloid filtration in both natural and engineered flow conditions. Water Resour. Res. 2011, 47. [Google Scholar] [CrossRef] [Green Version]
- Ma, H.; Hradisky, M.; Johnson, W.P. Extending applicability of correlation equations to predict colloidal retention in porous media at low fluid velocity. Environ. Sci. Technol. 2013, 47, 2272–2278. [Google Scholar] [CrossRef] [PubMed]
- Messina, F.; Marchisio, D.L.; Sethi, R. An extended and total flux normalized correlation equation for predicting single-collector efficiency. J. Colloid Interf. Sci. 2015, 446, 185–193. [Google Scholar] [CrossRef] [PubMed] [Green Version]
- Wang, Y.; Xu, L.; Chen, H.; Zhang, M. Retention and transport behavior of microplastic particles in water-saturated porous media. Sci. Total Environ. 2022, 808, 152154. [Google Scholar] [CrossRef] [PubMed]
- Johnson, W.P. Quantitative linking of nanoscale interactions to continuum-scale nanoparticle and microplastic transport in environmental granular media. Environ. Sci. Technol. 2020, 54, 8032–8042. [Google Scholar] [CrossRef]
- Bennacer, L.; Ahfir, N.D.; Alem, A.; Huaqing, W. Influence of Particles Sizes and Flow Velocity on the Transport of Polydisperse Fine Particles in Saturated Porous Media: Laboratory Experiments. Water Air Soil Pollut. 2022, 233, 249. [Google Scholar] [CrossRef]
- Ma, E.; Ouahbi, T.; Wang, H.; Ahfir, N.D.; Alem, A.; Hammadi, A. Modeling of the transport and deposition of polydispersed particles: Effects of hydrodynamics and spatiotemporal evolution of the deposition rate. Environ. Pollut. 2017, 237, 1011–1022. [Google Scholar] [CrossRef]
- Min, X.; Shu, L.; Li, W.; Appiah-Adjei, E.K. Influence of particle distribution on filter coefficient in the initial stage of filtration. Korean J. Chem. Eng. 2013, 30, 456–464. [Google Scholar] [CrossRef]
- Zou, Z.; Shu, L.; Min, X.; Mabedi, E.C. Clogging of Infiltration Basin and Its Impact on Suspended Particles Transport in Unconfined Sand Aquifer: Insights from a Laboratory Study. Water 2019, 11, 1083. [Google Scholar] [CrossRef] [Green Version]
- Zou, Z.; Shu, L.; Min, X.; Chifuniro Mabedi, E. Physical experiment and modeling of the transport and deposition of polydisperse particles in stormwater: Effects of a depth-dependent initial filter coefficient. Water 2019, 11, 1885. [Google Scholar] [CrossRef] [Green Version]
- Bradford, S.A.; Toride, N. A stochastic model for colloid transport and deposition. J. Environ. Qual. 2007, 36, 1346–1356. [Google Scholar] [CrossRef] [Green Version]
- Bradford, S.A.; Leij, F.J. Modeling the transport and retention of polydispersed colloidal suspensions in porous media. Chem. Eng. Sci. 2018, 192, 972–980. [Google Scholar] [CrossRef]
- Tufenkji, N.; Elimelech, M. Deviation from the classical colloid filtration theory in the presence of repulsive DLVO interactions. Langmuir 2004, 20, 10818–10828. [Google Scholar] [CrossRef]
- Bianco, C.; Tosco, T.; Sethi, R. A 3-dimensional micro-and nanoparticle transport and filtration model (MNM3D) applied to the migration of carbon-based nanomaterials in porous media. J. Contam. Hydrol. 2016, 193, 10–20. [Google Scholar] [CrossRef] [Green Version]
- Gurunathan, S.; Han, J.W.; Eppakayala, V.; Kim, J.H. Biocompatibility of microbially reduced graphene oxide in primary mouse embryonic fibroblast cells. Colloids Surf. B 2013, 105, 58–66. [Google Scholar] [CrossRef]
- Feriancikova, L.; Xu, S. Deposition and remobilization of graphene oxide within saturated sand pack. J. Hazard Mater. 2012, 235, 194–200. [Google Scholar] [CrossRef]
- Jegatheesan, V.; Vigneswaran, S. The effect of concentration on the early stages of deep bed filtration of submicron particles. Water Res. 1997, 31, 2910–2913. [Google Scholar] [CrossRef]
- Ron, C.A.; Johnson, W.P. Complementary colloid and collector nanoscale heterogeneity explains microparticle retention under unfavorable conditions. Environ. Sci. Nano 2020, 7, 4010–4021. [Google Scholar] [CrossRef]
- Ma, H.; Bolster, C.; Johnson, W.P.; Li, K.; Pazmino, E.; Camacho, K.M.; Mitragotri, S. Coupled influences of particle shape, surface property and flow hydrodynamics on rod-shaped colloid transport in porous media. J. Colloid Interface Sci. 2020, 577, 471–480. [Google Scholar] [CrossRef] [PubMed]
- Shen, C.; Lazouskaya, V.; Zhang, H.; Li, B.; Jin, Y.; Huang, Y. Influence of surface chemical heterogeneity on attachment and detachment of microparticles. Colloid Surf. A 2013, 433, 14–29. [Google Scholar] [CrossRef]
- Xu, S.; Gao, B.; Saiers, J.E. Straining of colloidal particles in saturated porous media. Water Resour. Res. 2006, 42, 1–10. [Google Scholar] [CrossRef]
- Babakhani, P.; Bridge, J.; Doong, R.A.; Phenrat, T. Continuum-based models and concepts for the transport of nanoparticles in saturated porous media: A state-of-the-science review. Adv. Colloid Interface Sci. 2017, 246, 75–104. [Google Scholar] [CrossRef] [PubMed] [Green Version]
- Tong, M.; Johnson, W.P. Colloid population heterogeneity drives hyper-exponential deviation from classic filtration theory. Environ. Sci. Technol. 2007, 41, 493–499. [Google Scholar] [CrossRef]


| Acronym | Authors | Geometry | Transport Mechanisms |
|---|---|---|---|
| Yao model | Yao et al., 1971 [19] | Isolated sphere | Additivity of analytical solutions for D, G, I. |
| RT model | Rajagopalan and Tien, 1976 [20] | Happel sphere-in-cell | Additivity of analytical solutions for D, G, I, V, H. |
| TE model | Tufenkji and Elimelech, 2004 [21] | Happel sphere-in-cell | Numerical solutions for D, G, I, V, H. |
| MPFJ model | Ma et al., 2009 [22] | Hemispheres-in-cell | Numerical solution for D, G, I, V, H allowing for grain-to-grain contact points. |
| NG model | Nelson and Ginn, 2011 [23] | Happel sphere-in-cell | Numerical solutions for D, G, I, V, H for small particles at low velocities. |
| MHJ model | Ma et al., 2013 [24] | Modified hemisphere-in-cell | Numerical solutions for D, G, I, V, H at low fluid velocities. |
| MMS model | Messina et al., 2015 [25] | Isolated sphere | Numerical solution for D, G, I and the mutual interactions among the three. |
| Model | Yao Model | RT Model | TE Model | MPFJ Model | NG Model | MHJ Model | MMS Model |
|---|---|---|---|---|---|---|---|
| SMRE | 0.009 | 0.044 | 0.024 | 0.058 | 0.013 | 0.017 | 0.005 |
| RMSE | 0.003 | 0.015 | 0.010 | 0.019 | 0.007 | 0.009 | 0.002 |
| MAE | 0.058 | 0.123 | 0.099 | 0.138 | 0.083 | 0.095 | 0.047 |
Disclaimer/Publisher’s Note: The statements, opinions and data contained in all publications are solely those of the individual author(s) and contributor(s) and not of MDPI and/or the editor(s). MDPI and/or the editor(s) disclaim responsibility for any injury to people or property resulting from any ideas, methods, instructions or products referred to in the content. |
© 2023 by the authors. Licensee MDPI, Basel, Switzerland. This article is an open access article distributed under the terms and conditions of the Creative Commons Attribution (CC BY) license (https://creativecommons.org/licenses/by/4.0/).
Share and Cite
Zou, Z.; Yu, L.; Li, Y.; Niu, S.; Fan, L.; Luo, W.; Li, W. The Comparison of Seven Models to Simulate the Transport and Deposition of Polydisperse Particles under Favorable Conditions in a Saturated Medium. Water 2023, 15, 2193. https://doi.org/10.3390/w15122193
Zou Z, Yu L, Li Y, Niu S, Fan L, Luo W, Li W. The Comparison of Seven Models to Simulate the Transport and Deposition of Polydisperse Particles under Favorable Conditions in a Saturated Medium. Water. 2023; 15(12):2193. https://doi.org/10.3390/w15122193
Chicago/Turabian StyleZou, Zhike, Lei Yu, Yalong Li, Shuyao Niu, Linlin Fan, Wenbing Luo, and Wei Li. 2023. "The Comparison of Seven Models to Simulate the Transport and Deposition of Polydisperse Particles under Favorable Conditions in a Saturated Medium" Water 15, no. 12: 2193. https://doi.org/10.3390/w15122193