Application of Geophysical Methods for Groundwater Management and Monitoring

A special issue of Water (ISSN 2073-4441). This special issue belongs to the section "Hydrogeology".

Deadline for manuscript submissions: closed (20 January 2024) | Viewed by 12698

Special Issue Editor


E-Mail Website
Guest Editor
Department of Mineralogy, Petrology and Applied Geology, Earth Sciences Faculty, University of Barcelona, Barcelona, Spain
Interests: geophysics; hydrogeology; groundwater; contamination; climate change

Special Issue Information

Dear colleagues,

It is my pleasure to invite you to submit your contribution to the specific volume of Water entitled “Application of Geophysical Methods for Groundwater Management and Monitoring”.

The main objective of this publication is to collect a series of novel works in the field of geophysical techniques applied to groundwater management and monitoring.

Geophysical techniques have evolved a lot in recent years, and research has focused on attempts for them to be applied to different geological and hydrological objectives and for the resolution they offer to be continuously increased.

This Special Issue will gather papers on the application of different geophysical methods to the management and monitoring of groundwater, serving as a useful tool for researchers and company professionals dedicated to this valuable resource.

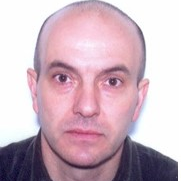
Dr. Lluís Rivero
Guest Editor

Manuscript Submission Information

Manuscripts should be submitted online at www.mdpi.com by registering and logging in to this website. Once you are registered, click here to go to the submission form. Manuscripts can be submitted until the deadline. All submissions that pass pre-check are peer-reviewed. Accepted papers will be published continuously in the journal (as soon as accepted) and will be listed together on the special issue website. Research articles, review articles as well as short communications are invited. For planned papers, a title and short abstract (about 100 words) can be sent to the Editorial Office for announcement on this website.

Submitted manuscripts should not have been published previously, nor be under consideration for publication elsewhere (except conference proceedings papers). All manuscripts are thoroughly refereed through a single-blind peer-review process. A guide for authors and other relevant information for submission of manuscripts is available on the Instructions for Authors page. Water is an international peer-reviewed open access semimonthly journal published by MDPI.

Please visit the Instructions for Authors page before submitting a manuscript. The Article Processing Charge (APC) for publication in this open access journal is 2600 CHF (Swiss Francs). Submitted papers should be well formatted and use good English. Authors may use MDPI's English editing service prior to publication or during author revisions.

Keywords

  • Geophysical methods
  • Monitoring
  • Groundwater
  • Management
  • 4D

Published Papers (6 papers)

Order results
Result details
Select all
Export citation of selected articles as:

Research

Jump to: Review

19 pages, 4220 KiB  
Article
Spatiotemporal Variation and Long-Range Correlation of Groundwater Levels in Odessa, Ukraine
by Dzhema Melkonyan and Sherin Sugathan
Water 2024, 16(1), 147; https://doi.org/10.3390/w16010147 - 30 Dec 2023
Viewed by 920
Abstract
Increasing groundwater levels (GWLs) may become one of the most serious issues for the city of Odessa, Ukraine. This study investigated the spatial distribution characteristics and multifractal scaling behaviour of the groundwater-level/-depth fluctuations for a Quaternary aquifer in the city of Odessa using [...] Read more.
Increasing groundwater levels (GWLs) may become one of the most serious issues for the city of Odessa, Ukraine. This study investigated the spatial distribution characteristics and multifractal scaling behaviour of the groundwater-level/-depth fluctuations for a Quaternary aquifer in the city of Odessa using a geostatistical approach and multifractal detrended fluctuation analysis (MF-DFA). These two methods were applied to monthly GWL fluctuation time series from 1970 to 2020 to monitor 72 hydrogeological wells situated in different parts of the city of Odessa. The spatial distribution of the GWLs revealed an overall trend of decline and recovery from 1970 to 2020 in the study area, except for most of the southern region, where a persistent recovery of the groundwater depth was observed. The MF-DFA results suggest that the dynamics of the GWL fluctuations have multifractal characteristics in the Odessa area. In addition, both long-range correlations and fat-tail probability distribution contribute to the multifractality. However, long-range correlations among the fluctuations made a major contribution to the observed multifractality of the GWL fluctuation time series. The generalised Hurst exponents show a wide range of change (0.20 < h(q) < 2.85), indicating the sensitivity of the GWL fluctuations to changes in small-scale factors and large-scale factors. Regarding the long-range correlations of the GWL depths, the Hurst exponents (q = 2) demonstrated the positive persistence of groundwater-depth recovery in the southern region and the persistence of groundwater-depth variation in the other regions of the study area. The dynamic changes in the GWL depths in the Odessa area may be influenced by both natural and anthropogenic factors. Full article
Show Figures

Figure 1

15 pages, 11164 KiB  
Article
Enhanced Groundwater Protection and Management Using Gravity and Geoelectrical Data (Valls Basin, Spain)
by Alex Sendrós, Mahjoub Himi, Lluís Rivero, Raúl Lovera, Aritz Urruela, Josefina C. Tapias and Albert Casas
Water 2023, 15(23), 4130; https://doi.org/10.3390/w15234130 - 28 Nov 2023
Cited by 1 | Viewed by 1446
Abstract
The basis for the protection and prevention of groundwater pollution lies in the accurate assessment of vulnerability in terms of the exposure of groundwater bodies to contaminants before they are potentially discharged into the environment. The vulnerability assessment consists of calculating the ease [...] Read more.
The basis for the protection and prevention of groundwater pollution lies in the accurate assessment of vulnerability in terms of the exposure of groundwater bodies to contaminants before they are potentially discharged into the environment. The vulnerability assessment consists of calculating the ease with which pollutants can reach the aquifer from the surface through the vadose zone, which effectively reduces the pollutant load when the transit time is long. Index methods are mostly used, as they are based on input data that are readily available, easy to implement and interpret, and which are simple and practical. However, there are also limitations, as some methods are somewhat subjective and provide only a qualitative approximation. This case study aims to develop a methodology that can quantitively estimate the hydrogeological parameters of the aquifer formations of the Valls basin using geophysical methods and the Dar Zarrouk parameters. The specific treatment carried out on data from gravity stations and vertical electric soundings, supported by the available well data, allows for the delineation of the most favourable areas for the exploitation of groundwater resources (higher hydraulic transmissivity) and the areas most susceptible to pollution (with a shorter transit time) on a regional scale. Geophysical methods have proved useful, sustainably providing valuable information without the need to drill new boreholes that could act as preferential pathways for pollutants into the aquifer. Full article
Show Figures

Figure 1

15 pages, 11024 KiB  
Article
Integration of Electrical Resistivity Tomography and Seismic Refraction Tomography to Investigate Subsiding Sinkholes in Karst Areas
by Oussama Jabrane, Pedro Martínez-Pagán, Marcos A. Martínez-Segura, Francisco Javier Alcalá, Driss El Azzab, Marco D. Vásconez-Maza and Mohammed Charroud
Water 2023, 15(12), 2192; https://doi.org/10.3390/w15122192 - 10 Jun 2023
Cited by 2 | Viewed by 1966
Abstract
Operational and safety issues associated with subsiding sinkholes in karst areas start with the definition of fractures and joints, causing ground weakness. Conventional geotechnical boreholes and geological mapping must be complemented with indirect subsurface exploration techniques to detail those structures. This work aims [...] Read more.
Operational and safety issues associated with subsiding sinkholes in karst areas start with the definition of fractures and joints, causing ground weakness. Conventional geotechnical boreholes and geological mapping must be complemented with indirect subsurface exploration techniques to detail those structures. This work aims to use electrical resistivity tomography (ERT) and seismic refraction tomography (SRT) near-surface geophysical techniques to infer the 2D and 3D geometry of sediment-infilled sinkholes formed by the conjunction of fractures and joints in karst areas. Geophysical surveys were performed in a sediment-infilled sinkhole area with two sectors of different subsiding and infilling degrees formed by the conjunction of two fault systems in an experimental research area in the Sierra de Gádor Mountains in southeastern Spain. The ERT survey delimited the geometry of the sinkhole area, including the main fault-boun4ded limits, other minor faults, buried epikarst forms, and the distribution of coarse and clay-rich infilling. The SRT survey corroborated the structure and disambiguated clay-rich and high-moisture-content structures giving similar velocity fields. The integration of the ERT and SRT techniques provides indirect 2D and 3D visualizations of the ground of interest in predicting weakness-triggering mechanisms associated with the regional karst structure. This trial in an experimental uninhabited area, with the possibility of exploring subsiding karst structures is of special interest for designing operational and safety measures in urban areas, where similar karst structures may go undetected and monitoring capability is often more limited. The technological development of the used techniques enables the periodical geophysical monitoring of karst structures, thus making the identification of structural changes modifying the land safety and hydrological mechanisms feasible over time. Full article
Show Figures

Figure 1

14 pages, 10571 KiB  
Article
Mapping Hydrogeological Structures Using Transient Electromagnetic Method: A Case Study of the Choushui River Alluvial Fan in Yunlin, Taiwan
by Lingerew Nebere Kassie, Ping-Yu Chang, Jun-Ru Zeng, Hsin-Hua Huang, Chow-Son Chen, Yonatan Garkebo Doyoro, Ding-Jiun Lin, Jordi Mahardika Puntu and Haiyina Hasbia Amania
Water 2023, 15(9), 1703; https://doi.org/10.3390/w15091703 - 27 Apr 2023
Viewed by 2102
Abstract
We used transient electromagnetic (TEM) to map the hydrogeological structures in the Choushui River Alluvial Fan in Yunlin County of central Taiwan. A total of 63 TEM measurements were collected using the FASTSNAP system with 50 × 50 m in-loop configurations in the [...] Read more.
We used transient electromagnetic (TEM) to map the hydrogeological structures in the Choushui River Alluvial Fan in Yunlin County of central Taiwan. A total of 63 TEM measurements were collected using the FASTSNAP system with 50 × 50 m in-loop configurations in the middle and distal fan. The 1D model, based on prior information, was constructed from the inverted soundings. Results showed a thin, resistive shallow layer and a 40 m low-resistive (6–42 ohm-m) zone beneath it. High-resistive zones (50–170 ohm-m) were found from 50–120 m depth, and low-resistive zones were revealed below 120 m in some areas. Results were consistent with resistivity and lithology logs from nearby wells. The inverted TEM models provide reliable subsurface information when prior informations of vertical electrical sounding and TEM were considered. We interpolated resistivity at 10 m, 50 m, 100 m, and 160 m depth from the 1D model results to produce a slice map of the area, which indicated variations, trends, and depths of the sediment deposits. The TEM method successfully identified the hydrogeological structures, showing that the upper 40 m of sediment acts as a confining layer for the aquifer structure from 50 m to 120 m depth. Full article
Show Figures

Figure 1

18 pages, 5220 KiB  
Article
Integration of Electrical Resistivity and Modified DRASTIC Model to Assess Groundwater Vulnerability in the Surrounding Area of Hulene-B Waste Dump, Maputo, Mozambique
by Bernardino Bernardo, Carla Candeias and Fernando Rocha
Water 2022, 14(11), 1746; https://doi.org/10.3390/w14111746 - 29 May 2022
Cited by 6 | Viewed by 2433
Abstract
In this study, electrical resistivity was applied in six 400 m profiles around the Hulene-B waste dump (Mozambique). Afterwards, an inversion was performed by RES2Dinv. The use of the electrical resistivity method allowed us to characterize in detail some underlying aspects of the [...] Read more.
In this study, electrical resistivity was applied in six 400 m profiles around the Hulene-B waste dump (Mozambique). Afterwards, an inversion was performed by RES2Dinv. The use of the electrical resistivity method allowed us to characterize in detail some underlying aspects of the DRASTIC index by identifying anomalous zones considered to be permeable and prone to leachate migration. The modified DRASTIC index revealed high values in areas near contaminated surface groundwater and surface layers of the vadose zone, characterized by low resistivities. Areas with lower index results were characterized by high resistivity on surface layers and high depth at which groundwater was detected. The overall modified DRASTIC index result revealed medium vulnerability. However, high vulnerability index values were detected in areas with higher surface elevation, suggesting groundwater contamination by horizontal dilution of leachates from the surrounding area of the Hulene-B waste dump. Full article
Show Figures

Figure 1

Review

Jump to: Research

26 pages, 5030 KiB  
Review
Measuring Groundwater Flow Velocities near Drinking Water Extraction Wells in Unconsolidated Sediments
by Wiecher Bakx, Victor F. Bense, Marios Karaoulis, Gualbert H. P. Oude Essink and Marc F. P. Bierkens
Water 2023, 15(12), 2167; https://doi.org/10.3390/w15122167 - 08 Jun 2023
Cited by 1 | Viewed by 2126
Abstract
Groundwater is an important source of drinking water in coastal regions with predominantly unconsolidated sediments. To protect and manage drinking water extraction wells in these regions, reliable estimates of groundwater flow velocities around well fields are of paramount importance. Such measurements help to [...] Read more.
Groundwater is an important source of drinking water in coastal regions with predominantly unconsolidated sediments. To protect and manage drinking water extraction wells in these regions, reliable estimates of groundwater flow velocities around well fields are of paramount importance. Such measurements help to identify the dynamics of the groundwater flow and its response to stresses, to optimize water resources management, and to calibrate groundwater flow models. In this article, we review approaches for measuring the relatively high groundwater flow velocity measurements near these wells. We discuss and review their potential and limitations for use in this environment. Environmental tracer measurements are found to be useful for regional scale estimates of groundwater flow velocities and directions, but their use is limited near drinking water extraction wells. Surface-based hydrogeophysical measurements can potentially provide insight into groundwater flow velocity patterns, although the depth is limited in large-scale measurement setups. Active-heating distributed temperature sensing (AH-DTS) provides direct measurements of in situ groundwater flow velocities and can monitor fluctuations in the high groundwater flow velocities near drinking water extraction wells. Combining geoelectrical measurements with AH-DTS shows the potential to estimate a 3D groundwater flow velocity distribution to fully identify groundwater flow towards drinking water extraction wells. Full article
Show Figures

Figure 1

Back to TopTop