Article

Observations of Nearbed Turbulence over Mobile Bedforms in Combined, Collinear Wave-Current Flows

1
Ocean and Earth Science, National Oceanography Centre Southampton, University of Southampton Waterfront Campus, European Way, Southampton SO14 3ZH, UK
2
Channel Coastal Observatory, National Oceanography Centre, Southampton SO14 3ZH, UK
3
HR Wallingford, Howbery Park, Wallingford, Oxfordshire OX10 8BA, UK
4
Van Oord UK Ltd., Bankside House, Henfield Road, Small Dole BN5 9XQ, UK
*
Author to whom correspondence should be addressed.
Water 2020, 12(12), 3515; https://doi.org/10.3390/w12123515
Submission received: 20 October 2020 / Revised: 30 November 2020 / Accepted: 10 December 2020 / Published: 14 December 2020
(This article belongs to the Special Issue Sediment Transport in Coastal Waters 2.0)

Abstract

:
Collinear wave-current shear interactions are often assumed to be the same for currents following or opposing the direction of regular wave propagation; with momentum and mass exchanges restricted to the thin oscillating boundary layer (zero-flux condition) and enhanced but equal wave-averaged bed shear stresses. To examine these assumptions, a prototype-scale experiment investigated the nature of turbulent exchanges in flows with currents aligned to, and opposing, wave propagation over a mobile sandy bed. Estimated mean and maximum stresses from measurements above the bed exceeded predictions by models of bed shear stress subscribing to the assumptions above, suggesting the combined boundary layer is larger than predicted by theory. The core flow experiences upward turbulent fluxes in aligned flows, coupled with sediment entrainment by vortex shedding at flow reversal, whilst downward fluxes of eddies generated by the core flow, and strong adverse shear can enhance near-bed mass transport, in opposing currents. Current-aligned coherent structures contribute significantly to the stress and energy dissipation, and display characteristics of wall-attached eddies formed by the pairing of counter-rotating vortices. These preliminary findings suggest a notable difference in wave-following and wave-opposing wave-current interactions, and highlight the need to account for intermittent momentum-exchanges in predicting stress, boundary layer thickness and sediment transport.

1. Introduction

Fluid motion in the coastal zone is often characterised by the simultaneous presence of both oscillatory (e.g., surface wind and swell waves) and unidirectional currents (e.g., tidal, fluvial, wind-driven, rip currents, etc.). The interaction between currents and waves is extremely complicated [1], and has direct implications on sediment transport and bedform dynamics, as well as engineering problems such as the design of offshore structures and beach replenishment. Sediment entrainment and transport are often described as a function of bed shear stress, a measure of the fluid force per unit area. In oscillatory flows, bed shear stresses may be an order of magnitude larger than encountered in a current of comparable magnitude, due to sharper vertical velocity gradients associated with much smaller wave boundary layer thicknesses [2]. Non-linear interactions between the steady shear of the current and the oscillating flow often result in enhanced stresses beyond the simple summation of the current-only and wave-only components [1,3]. Thus, a current below the threshold for motion may move significant amounts of sediments in the presence of waves [4]. As a result, combined wave-current flows often result in highly dynamic bedforms and active sediment transport across the continental shelf and shallow coastal waters [5,6].
To model the transport of sediment under the combined action of waves and currents, the maximum bed shear stress is often used to determine the threshold for motion and entrainment of particles, while the flow velocity and suspension of sediment into the upper part of the flow are determined by the time-averaged, combined stresses within a wave cycle [3,7]. The oscillating component of stress is commonly presumed to be confined within a thin wave boundary layer in the direct vicinity of the bed, within which intense turbulence is generated (Figure 1). Its effect on the current profile is felt as enhanced bottom roughness [8,9]. Kemp and Simons observed, experimentally, an enhancement of turbulent intensity within the inner bed layer (which they defined to be within 1–2 roughness lengths) when currents are linearly superposed on waves for rough, rippled beds [10,11]. They showed that maximum turbulence intensities and Reynolds stresses depend upon the magnitude of current and wave-induced velocities rather than the relative direction; whereas mean stresses are enhanced by changes in vortex patterns formed between the bedforms. This implied an increase in sediment pick-up heights and diffusion beyond the combined layer. They concluded, therefore, that the relative direction only influences the outer layer of flow, but not the wave-current interaction near the bed. Following similar arguments, most numerical models used to predict bed shear stress in combined flow employ a linear, vector addition of the individual, enhanced steady (current) and unsteady (wave) components within the near bed region, accounting for the relative angle, ϕ c w , between the two [4,8,12,13,14,15,16,17,18]. This means that the magnitudes of mean (and of maximum) bed shear stresses are equal for collinear flows, since cos ϕ c w = 1 for ϕ c w = 0 o or 180°; irrespective of whether the current follows, or opposes, the direction of wave propagation. Strong non-linear interactions between the wave and current are at their peak in collinear flows in such models [19]. Nonetheless, comparisons between the various models used often reveal significant differences between estimated and measured stresses [1,20,21] and thus the estimate of sediment transport can differ significantly.
In addition, such models also impose a zero-flux condition limiting turbulent quantities; and by consequence sediment concentrations, at the interface of the wave boundary layer with the core flow [22], despite documented evidence of vertical momentum exchanges extending beyond the oscillating layer in the nearshore [23,24,25]. Holmedal et al. contend that such simplification is problematic given production and dissipation of turbulent kinetic energy are taking place within the current boundary layer at the interface with the wave boundary layer [22]. However, they argue that this simplification can still be used as the vertical gradients in both boundary layers are confined near the bed and are very small, exhibiting slow variations with time and decaying rapidly with distance from the bed. Under nonbreaking, regular waves following and opposing a current, combined Reynolds stresses (momentum exchange) decrease slowly with increasing height above the bed in the opposing flow case; while a more rapid decrease and change in sign is observed at mid-depth for the aligned flow case [26]. Such differences between the aligned and opposing cases have been attributed to turbulent mixing by secondary local vortices [27,28,29]. Lumley and Terray linked the spatial structure of such turbulent motions to temporal fluctuations due to advection by the wave motion [30]. Shaw and Trowbridge suggested that wave and turbulence induced fluctuations are incoherent with one another outside the thin wave boundary layer in the nearshore to obtain direct estimates of near-bed turbulent fluxes, which they found to be complicated by the intermittent nature of turbulent motions near the bed [25]. Trowbridge and Elgar measured imbalances in the momentum equation and deviations from the Prandtl-von Kármán logarithmic velocity law near the bed (below the reach of breaking induced turbulence) associated with inaccurate estimates of Reynolds stresses [31]. Such deviations have also been attributed to stratification by suspended sediments [32]. It follows that determining the vertical spatial scales of near-bed momentum-bearing motions is an important research question for modelling currents and sediment transport in the nearshore and on continental shelves.
Little is known about the spatial and temporal scales of momentum fluxes by coherent turbulence structures in combined flows, or about their interaction with bedforms and suspended sediment under such conditions [33]. Accurate estimates of combined wave-current bed shear stress and ensuing sediment transport require robust characterisation of the momentum exchanges by these motions in the near bed region in space and time. This paper examines the two fundamental assumptions used in describing/modelling fluid shear due to wave-current interactions. We assess whether: (i) the mean and maximum combined bed shear stresses—and the nature of intermittent momentum fluxes—are the same irrespective of whether a collinear current flows along or opposing the direction of regular wave propagation; and (ii) the highly-nonlinear interaction is restricted to the thin oscillating boundary layer thus limiting vertical exchanges of mass and moment to the direct vicinity of the bed (zero-flux boundary condition). Prototype-scale flume measurements of near bed flow, turbulence and bed morphology are presented under the combined effects of waves and currents. Two cases are considered: collinear currents aligned with; and opposed to, the direction of wave propagation. We highlight differences in the structural nature of turbulent exchanges and stress-bearing coherent structures as opposed to the deterministic view based on time-averaged quantities used to predict sediment transport.

2. Materials and Methods

Results are presented from an experiment conducted at the HR Wallingford Fast Flow Facility (FFF), UK, a large, dual-channel (racetrack-shaped) flume where combined wave-current-sediment interactions can be studied (Figure 2). A flat, sandy bed section, 0.3 m thick, was constructed in the main (4 m wide) channel, starting at a distance of 27 m from the wave paddles and spanning a length of ~21 m, with the remaining bed lined with smooth concrete. A 10-paddle, HR Wallingford bottom-hinged wave maker was used to generate waves. Currents were generated by two Bedford Pumps Ltd. SA-80.04.08 pumps, operating alternatively in forward (producing currents aligned with direction of wave propagation, counter-clockwise in flume) and reverse (opposing progressive waves, clockwise) modes. The sediment bed was composed of well-sorted, fine to medium fluvial silica sand, with a normal (Gaussian) grain size distribution and a median grain diameter, d50, of 0.247 ± 0.008 mm. A deeper section (the scour pit, 1.0 m thick, 4 × 4 m wide, Figure 2a) within the bed allowed the stable installation of an instrumented frame, equipped to measure flow hydrodynamics and bed morphology in combined wave-current flows at high frequency.
The three-dimensional velocity field was recorded by two frame-mounted, downward-looking, 10-MHz Nortek acoustic Doppler velocimeters (ADV) offset vertically by 10 cm, and horizontally by 8 cm. Each ADV samples a cylindrical volume (7 mm in length), situated 50 mm below the probe, at a rate of 25 Hz. The ADVs logged their sensor heights above the initial bed elevation at the start of each run, and the position of the sampling volume with respect to the dynamic bed morphology was assessed from the centreline of the sonar scans. The local bed morphology was surveyed by a Marine Electronics sector scanning sonar (SSS, 500 kHz) and a single-beam sediment image profiling sonar (SIS, 1.1 MHz), affording a three-dimensional view of the bed. The incident wave field was measured using twin-wire resistance wave probes recording immersed depth through conductivity, with channels located just before, parallel to, and just after the instrumented frame location within the sandy bed section of the flume.

2.1. The Hydrodynamic Forcing

As most models of wave-current interaction require a value for a depth-averaged current velocity, these were derived from pump calibration curves based on discharge, pump frequency and water depth. The non-directional wave parameters (peak wave periods, mean, significant, and maximum wave heights) were computed using zero-crossing and spectral analysis of the surface water elevation following Tucker and Pitt [34]. The wave heights were given as immersed water level variations around the still water level measured at the start of each test, derived from calibrated voltage across each of the twin-wire probes (channels). Two probe channels were available for A2 (Table 1), while three channels were available for the other runs, located just before, at, and just after the instrumented frame. It is suspected, however, that the probes in Runs W2, A1 and A2 were not fully submerged at the troughs of some of the waves, underestimating the wave heights. To this end, a correction was applied to compensate for the apparent truncation in the measurements in these runs, whereby an approximation for water surface elevations was inferred from the measured streamwise velocity, by assuming linear wave theory and therefore re-arranging the wave dispersion equation, whereby the wave celerity is computed (to within 0.1%) following Hunt’s [35] approximation. This approach was applied to cases where no truncation is observed, yielding comparable results to within 4%.
The instantaneous, three-dimensional velocity field ( U ,   V ,   W ) was measured by the ADVs at two discrete points above the bed. This comprises time series of the streamwise ( U , defined as the mean direction of wave propagation along the flume); the cross-wise ( V , perpendicular horizontally to U , transverse across the flume); and the vertical ( W , perpendicular to the ( x y ) plane, positive upwards) velocity components of the flow. Turbulence is extracted from these time series by Reynolds decomposition, following the approach outlined in Kassem et al. [24]. This encompasses a quality check such that no more than 20% of the record in a given ensemble falls below the correlation threshold, set at 70% following Elgar et al. [36] to account for noise arising from signal aliasing [37,38,39]. Values falling below the threshold were replaced by interpolation through a moving average algorithm [40]. Subsequently, the resulting velocity vectors were geometrically rotated to account for sensor misalignment [41], as even a small disparity may subject estimates of stress inferred from velocity fluctuations to significant errors [42,43]. The resulting signals for each run thus comply with the criteria set by Feddersen [44] to estimate turbulence properties from ADV measurements. The records were then zero-meaned and de-trended; with the mean velocity U ¯   calculated from the three components. The mean direction was verified by calculating the relative angle between the two horizontal components to ensure the flow is two-dimensional. The wave signal, defined by an adaptive moving average, zero-phase low-pass digital filter, was subtracted from each velocity vector to obtain the fluctuations, u ,   v ,   a n d   w [40]. These filtered signals were de-spiked using the 3D phase-space method [37,38], resulting in time series of the three turbulent components (velocity fluctuations   u , v , and w ). Less than 5.6% of any given data set was affected by the despiking process, and despiking was realised in less than 8 iterations in all runs.

2.2. Bed Morphology

The bedform geometry was inferred from the acoustic images of the sonars and underwater photography. The SSS backscatter intensity was used in raw acoustic form (in dB) to assess ripple crest shape and orientation, providing a top view of variations in planform. Mean bedform wavelengths, following slant range correction, and rotation of the image to align with the flume walls, were evaluated from the locations of the peaks in backscatter along the central line of the echograms at the start and end of each wave run. The SIS backscatter intensity was range-corrected along each beam of a given pencil-sweep (excluding the near-field), then normalised against the maximum intensity of that beam, with the background noise, defined as the mean backscatter within the water column, removed. The bed was detected as the range-corrected height at which the maximum normalised backscatter occurs, and bed relief thus inferred after de-trending the bed, and despiking to remove outliers resulting from high concentration suspension events. A zero-crossing algorithm was then used to determine ripple heights [45,46].

2.3. Near-Bed, Mean and Maximum Shear Stress

The resulting turbulence components from the ADV processing are used to estimate the turbulent properties of the flow to infer the local shear stresses. The turbulent kinetic energy, k E ( m 2 / s 2 ) per unit mass (for a fluid of density, ρ ), is defined as:
k E   =   0.5 u 2 + v 2 +   w 2
In dynamic terms, the turbulent kinetic energy (TKE) is thus defined as, T K E = ρ k E ; and the Reynolds stress ( τ x z ) in the principal plane of motion ( x z ) is defined by the covariance of the velocity fluctuations [47]:
τ xz   = ρ   u w ¯
The shear stresses can be defined by the measured turbulent kinetic energy at each ADV [40,48]:
τ k E = 0.19   ρ   k E
The mean shear stress at the height of the ADV’s sampling volume for each test run is then defined as the time-average, τ m   = τ k E ¯ ; and τ max as the maximum stress within the time series. The TKE method is used to infer stresses as it provides a more robust measure compared to the Reynolds stress approach, which is particularly sensitive to sensor misalignment, and often underestimates the stresses [40,42,43]. The mean thickness of the combined, wave-current boundary layer, δ cw , m , is estimated as δ cw , m = 2 κ   u cw * / ω where κ   is von Kármán’s constant, and ω   is the orbital frequency; with u cw * = τ cw / ρ defining the combined wave-current shear (friction) velocity [49]. The latter is derived from the bed shear stress using three semi-analytical/empirical models: modified Grant and Madsen (1986) [49,50] (hereafter GM86); Soulsby and Clarke (2005) [3] (hereafter SC05); and the Malarkey and Davies (2012) [20] modification of SC05 (hereafter MD12). MD12 present a modification of SC05, accounting for non-linearity in the maximum stress, whereby τ cw = τ c 2 + τ w 2 + 2 τ c τ w cos ϕ , which assumes the strongest non-linear interaction is at a relative angle of ϕ = 0 o   , or ϕ = 180 o . For the GM86 model, a modification to account for transport and ripple enhanced shear velocity is used [50], as implemented in the numerical model Sedtrans05 [51] whereby u cw * e = u cw * / 1 π η r / λ r , with η r   and λ r   representing height and wavelength of ripples.

2.4. Turbulent Fluxes and Vertical Eddy Scales

The Reynolds stress describes the turbulent vertical advection of streamwise turbulent moment (i.e., the momentum exchange in the main flow plane). The intermittency of these exchanges is quantified using ‘quadrant analysis’, which distributes the momentum transport within a single plane of motion between four types of event structures in four quadrants: violent “Sweeps (S or Q4)” and “Ejections (E or Q2)”, and weaker “Inward (II or Q3)” and “Outward Interactions (OI or Q1)”, collectively termed as “bursting” [52,53]. This does not account for the entire/mean turbulent stress as crosswise fluctuations may contribute to the mean streamwise momentum (ibid.). The fractional contribution to stress of each of the four structural features of flow commonly focusses on the intense events restricted to values that lie above a critical threshold, H, which prescribes the hole between a set of hyperbolae defined by:
u w H .   u w ¯
The contributions of individual u w events in the ( xz ) plane are the ones which occur in each quadrant outside the central “hole” region bounded by these hyperbolae. The choice of H is often arbitrary, and ideally chosen so that it yields the same number of ejections as identified by visualization studies [53].
The number of events (concentration, C H n ) within each quadrant ( i ) in the primary plane ( xz ) is calculated as follows [54,55]:
C H n = 1 N . j = 1 N ϕ H , j i
ϕ H , j n = 1   if   u w j > H . u rms . w rms   and   belongs   to   n th quadrant 0   otherwise  
Meanwhile, the spatial scales of the vertical turbulent eddies can be derived from the spectrum of measured vertical fluctuations at a fixed point by assuming they advect faster than they develop in time, in line with Taylor’s “frozen turbulence” theory [56,57]. Accordingly, the rate of strain of an eddy is a function of its wavenumber ( k = 2 π f / U ¯ ), and the spectral energy of all eddies of a size 2 π / k is proportional to the energy ( E k ) multiplied by the spectrum’s width [58]. The normalised, pre-multiplied turbulence power spectra can thus be presented in non-dimensional wave-number space ( k *   =   kz , where z is the height of measurement) in energy-preserving form such that an equal area under the curve represents equal spectral energy [59]. As the strain rate of a particular eddy is a function of its wavenumber, the peaks of these plots correspond to the dominant spatial scales of motions as they are advected past the fixed ADV sensor [60], and thus these peaks are used to infer the spatial scales of turbulent motion. The length scales, λ , are thereby inferred using λ = 2 π z / k * with k * taken at the peak of the spectrum. The mean vertical turbulence flux is defined as k E w ¯ m 3 / s 3 , and the vertical gradient can therefore be inferred given the vertical and horizontal offsets between the two ADVs were close enough to allow estimates of structure functions (statistical moments) of the flow field following Kolmogorov (1941) theory [23,61].

2.5. Temporal Scales of Turbulent Motions and Active Periods of Flow

To detect coherent turbulent motions in time, we apply a continuous wavelet transform (CWT), to analyse the local variations in power in time-frequency space [62,63,64]. We utilise the common Morlet wavelet function [65] as a “mother” wavelet (wavelet vector ψ t = e ik ψ t . e t 2 / 2 ; k ψ = 6 ) which is then stretched, compressed and shifted to derive “daughter” wavelets that are then used to decompose the signal [66,67]. The continuous and complex nature of CWT allows detection of both amplitude and phase for different frequencies in the time series [68]. This continuous transform maps the time series of the instantaneous Reynolds stress into a 2D portrait of the evolving scales and frequencies in time. The transform can be sped up and the edge effects near large scales removed by padding the time series with zeroes at the start, and removing these afterwards, denoted as a cone of influence [63,64]. The limitation given by the cone of influence is an expression of Heisenberg’s uncertainty principle, which implies that one cannot obtain good localisation in both time and frequency, and a trade-off thus exists with bad temporal resolution at the larger scales, and bad frequency resolution at the smaller scales [69,70]. The temporal scales of turbulence can therefore be inferred from the active periods of flow, derived from the high variance regions within the time-frequency domain. The global spectral power is also calculated as the time average of all local wavelet spectra, and is tested in a time-averaged sense using autocorrelation of background noise to determine the 95% confidence limits. This is a reasonable test of the null-hypothesis at the longer scales, whereby the distribution tends towards Gaussian as we convolute longer wavelets according to the central limit theorem [63].

3. Results

3.1. Flow Properties and the Incident Wave Field

The hydrodynamic forcing, non-directional spectral properties of the incident wave field, namely the peak wave period, T P , and the mean ( H ¯ m ); significant ( H m 0 ); and maximum ( H max ) wave heights inferred from the immersed water depths, and the average flow velocities measured, at each ADV elevation, are presented in Table 1. Runs W1 and W2, represent wave only conditions, A1–A3 indicate aligned conditions, and O1–O4 denote opposing conditions; with variations in current magnitude, and wave period. Runs W2, A3, and O4 were in ‘deeper’ water (1.55 m) with higher “design” waves of 0.3 m, whereas all other runs were forced by 0.2 m design waves in 1.05 m of water. The estimated wave field varied in height from these input (design) values in all the runs, due to paddle and channel geometry. The wave periods were consistently reproduced, with the surface wave spectra dominated by the driving wave frequency, and a secondary peak at half cycle, with small, random deviations at higher frequencies from a regular wave field. The mean wave heights, H m ¯ , were largely consistent across all runs, while the significant wave heights, H m 0 , derived from the zero-order moment (integral of variance), m 0 , of the wave spectrum; showed reduction in height in the aligned cases (up to ~9% in A3) by comparison to corresponding wave only flow conditions. Meanwhile, significant heights in the opposing conditions were 10–30 % higher than the wave-only conditions, particularly when stronger opposing currents were present. A similar, more pronounced trend was observed for maximum wave height, H max . This deviation from the design value can be attributed to wave steepening due to the opposing current, whereby the opposing current causes the wavelengths to shorten and the wave heights to become larger in order to conserve energy, whereas aligned currents cause waves to flatten [71].

3.2. Bed Morphology and Sediment Motion

The observed bed morphology in each run was inferred from the acoustic sonar images and underwater photographs, revealing mobile bedforms and active sediment transport in all the runs. The dimensions of these bedforms, and modes of transport are presented in Table 2, with plan view sonar images of bed morphology at the end of each run, shown in Figure 3. The wave-only test runs were characterised by two-dimensional, symmetric wave ripples, with vortex shedding in shallower water in Run W1 ( λ r   ~   0.08   m ), and much larger, rolling grain ripples in deeper water (W2) with larger waves, with wavelengths ( λ r   ~   0.16   m ) scaling with the bed orbital diameter ( d 0   ~   0.14 m). Run A1 was characterised by 2.5D symmetric [72,73], rolling-grain ripples with equilibrium wavelengths   λ r   ~   0.12 ± 0.001   m , scaling to the wave orbital diameter d 0   ~   0.1   m), and continuous but not straight crest lines with relatively rounded crests and ripple heights η r   ~ 0.056   m . This run was largely limited to bedload transport, active only when the orbital velocity and current were aligned, with vortex shedding entraining small suspensions (~6 cm) at flow reversal. Runs A2 and O2 were characterised by two distinct scales of bedforms: 2D, relatively symmetric combined flow ripples with intermediate equilibrium wavelengths ( λ r   ~   0.19 0.21   m ), rounded crests with local deep scour at the lower end of the stoss side and discontinuous crest lines of irregular planform ( η r   ~   0.056 0.065 ), over which very small current ripples were superimposed. The wavelength of the dominant bedforms is clearly dictated by near-bed orbital diameter   d 0 , cw   ~   0.2   m . The dimensions of the smaller, superimposed ripples were inferred from a continuous wavelet transform applied at the centre-line of the SSS sonar image, revealing small wavelengths of ~ λ r   ~   0.03 ± 0.01 . Such superposition of bedform scales has been described for combined wave and current flow experimentally [72]; and in the field [74,75]. In both test runs, large, intense suspension clouds were observed at flow reversal, indicating entrainment by coherent eddies through vortex shedding. These were more persistent, and extended higher within the water column in the aligned case (A2), while O2 featured more defined, and shorter-lived suspension events. A3 is dominated by current-induced ripples, with pronounced three-dimensionality. This suggests that the strong current ( U c = 0.5   m ) in A3 dominated the transport processes in deeper water, despite the slightly larger waves. In Run O1, the bed featured small, regular bifurcating asymmetric ripples, skewed on the current lee side, with a flatter upstream slope and steeper downstream face, with λ r ~   0.09 ± 0.008   m ; and η r   ~   0.035 ± 0.007   m . In Run O3, where the wave orbital velocities increase in comparison to O1 for similar opposing current, these transition towards more rounded, largely 2.5D with much longer wavelengths λ r   ~   0.165 ± 0.008   m (scaling to d 0   ~   0.16   m ), and much more pronounced scour on the lower end of the stoss, with ripple height η r   ~   0.078 ± 0.009   m . The weaker currents in O2 and O4 have a less significant impact on the morphology, with 2D ripples as opposed to the current-modified geometries in A3 and O3. Sediment transport appears as avalanching down the ripple face when the flows coincide (opposing waves), and reverts to intense vortex shedding at flow reversal entraining large suspension clouds extending several ripple heights into the water column. Despite deeper water and weaker currents in Run O4, enhanced waves resulted in more intense transport, with suspended sediments turning into intermittent sheet flow every half cycle, akin to plug flow conditions, where sediment starts to move instantly as a solid block (few mm deep) due to strong pressure gradients associated with accelerations at flow reversal [76,77].

3.3. Turbulent Flow Properties

3.3.1. Near-Bed Shear Stresses

The time-averaged (test run mean) and maximum, local shear stresses at both ADV elevations are presented together with stresses estimated using the models of GM86, SC05, MD12 and the corresponding maximum oscillating boundary layer thicknesses in Table 3. The maximum, theoretical thickness of the modified oscillating boundary layer, hereafter referred to as the combined wave-current boundary layer, δ cw , was of the order of 0 ( δ cw ) = 1–2 mm for all runs using SC05 and MD12; smaller than estimates using GM86, where 0 ( δ cw ) = 10–30 mm. Note that SC05 and MD12 predict skin-friction only stresses (and hence u *), while GM86 accounts for bedforms through a transport-enhancement term in Nielsen’s modification. Nonetheless, these predicted thicknesses suggest that both ADVs fall outside the theoretical oscillating boundary layer in all runs. Therefore, the measured stresses at the corresponding ADV elevations are smaller than the predicted bed shear stresses, as expected, and increase towards the bed (at ADV2) in all the runs. Predictably, runs with higher mean waves registered larger stresses than those of comparable geometry in the aligned runs. Run O3, characterised by strongest currents, resulted in higher mean and maximum stresses, compared to O1, which, otherwise, has identical forcing, and flow geometry. The measured stresses agree with the observed transport modes, with higher stresses resulting in enhanced transport. In Runs A1, A3, O1 and O3, with similar mean and maximum shear stresses recorded by ADV2, bedload and vortex shedding were observed. Run O4, which registered the highest stresses, featured the most intense transport, with intermittent, plug flow at half cycles.

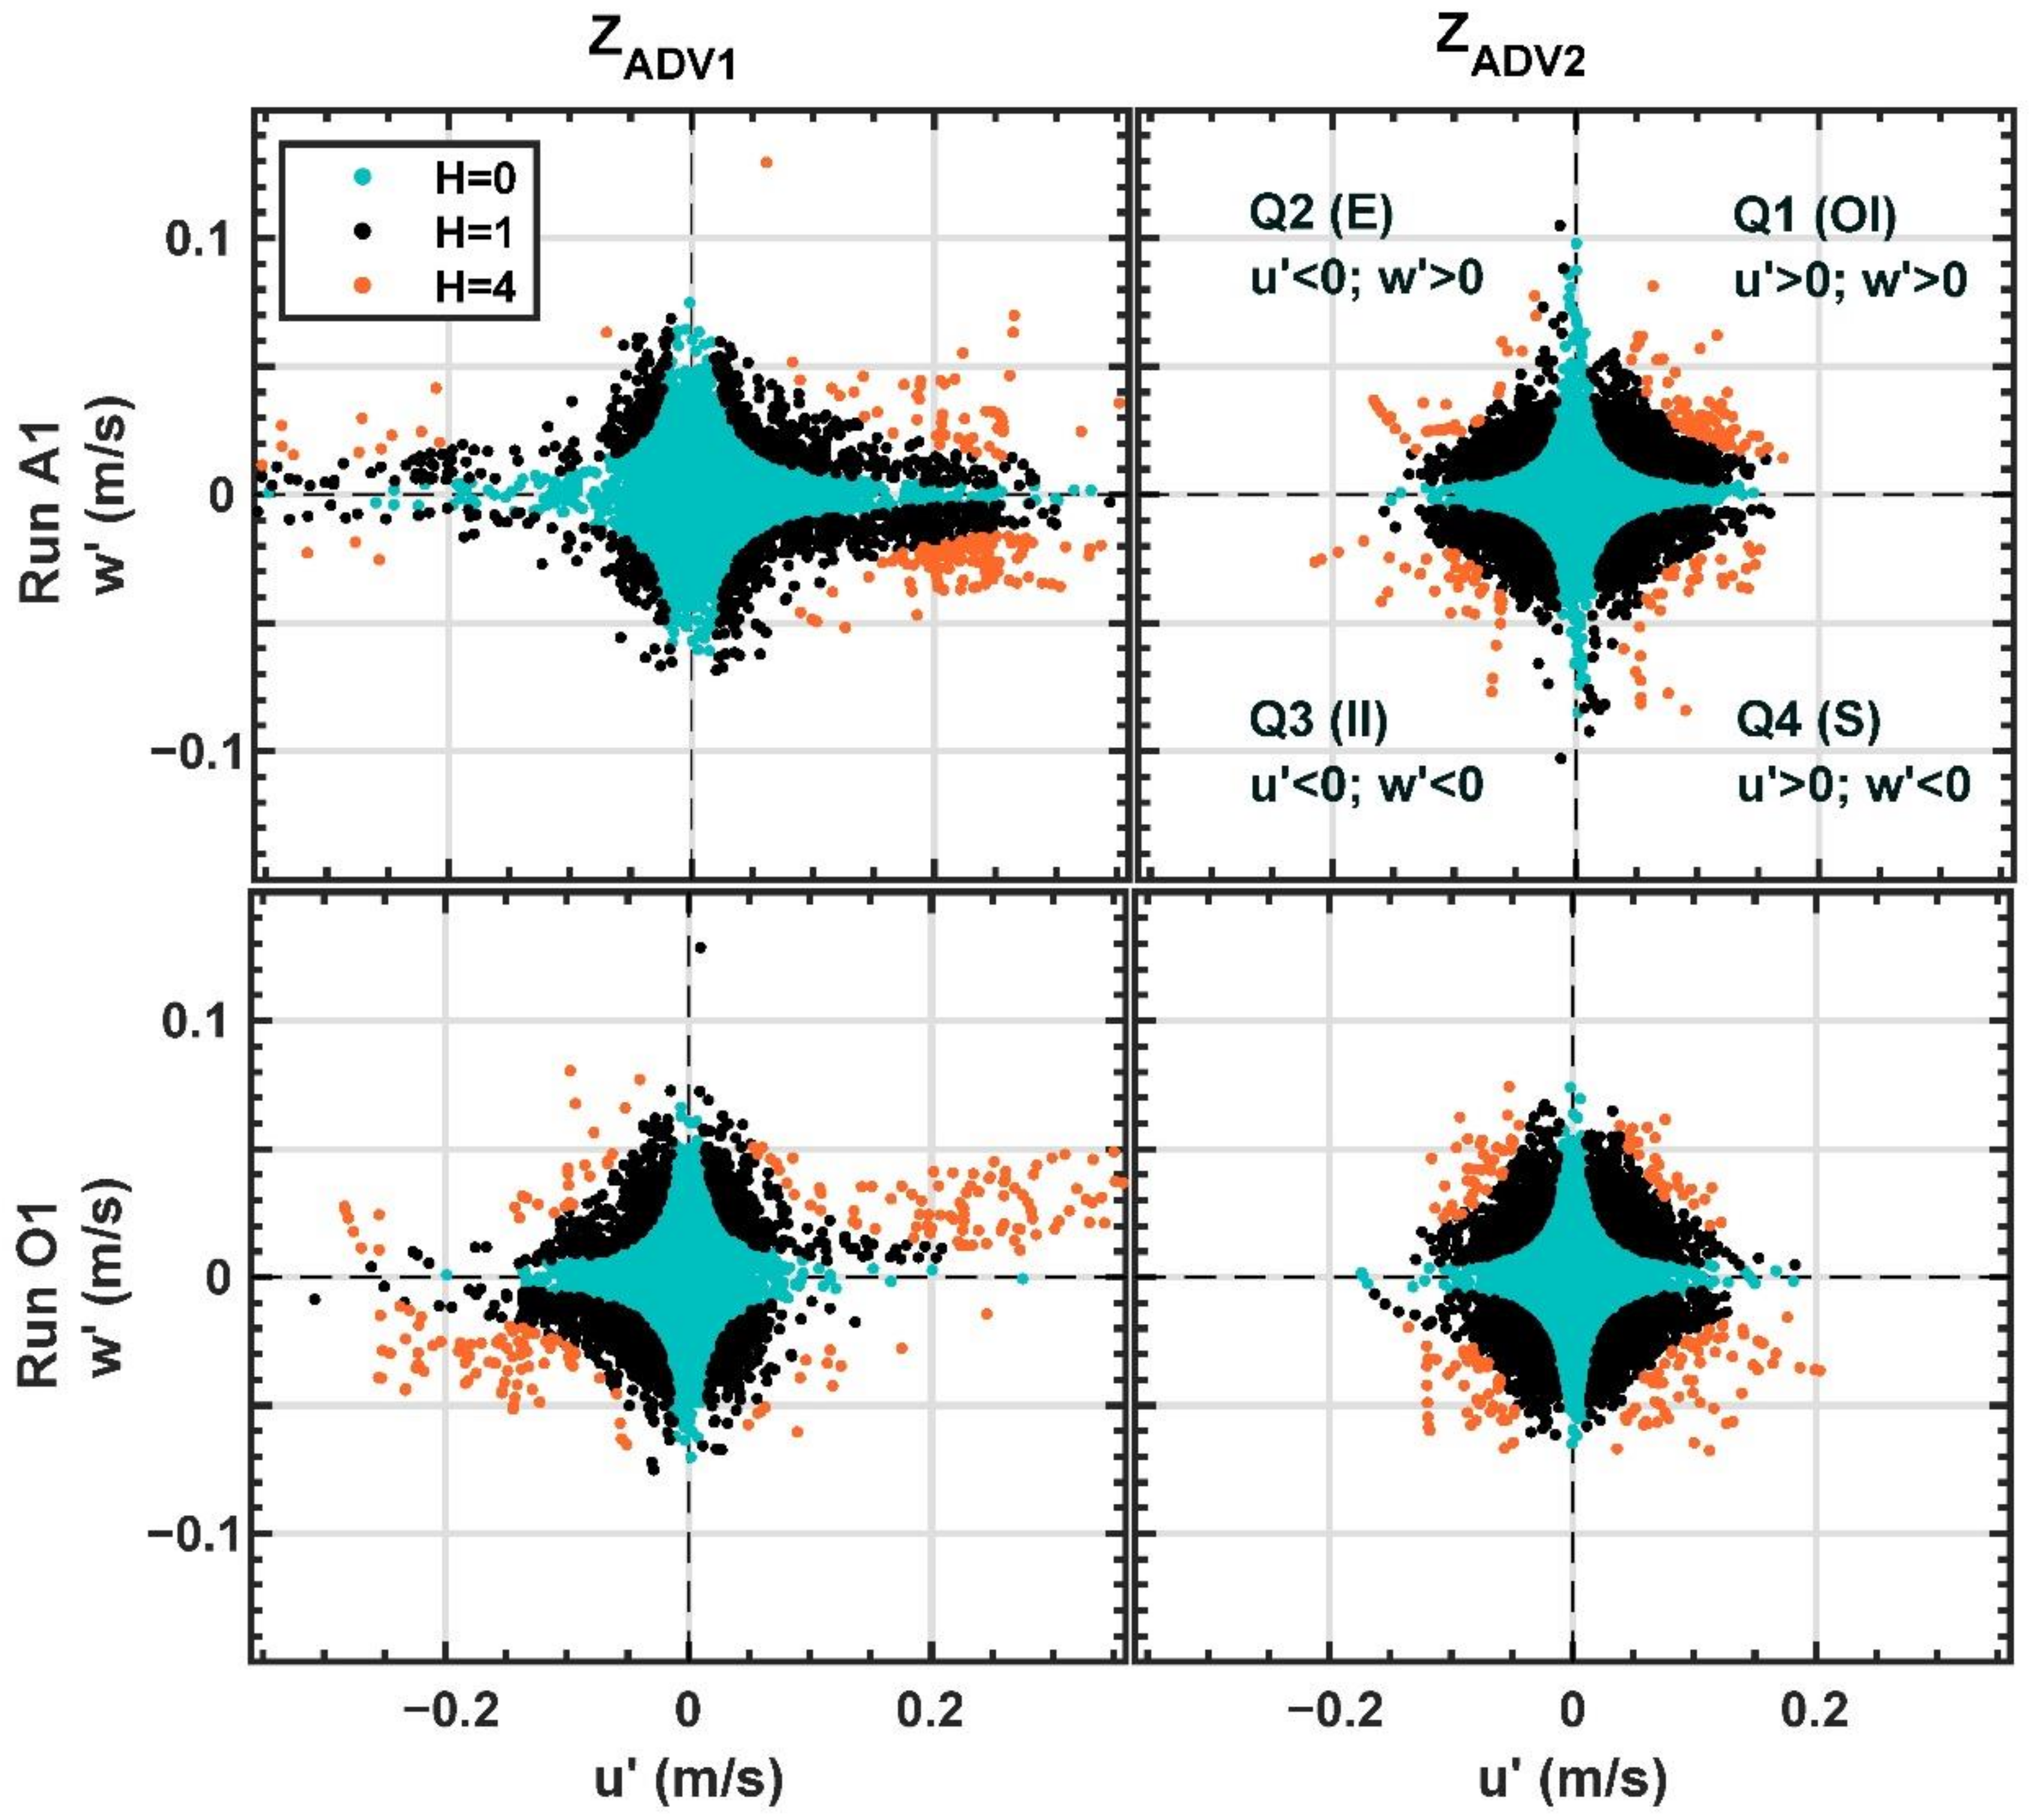
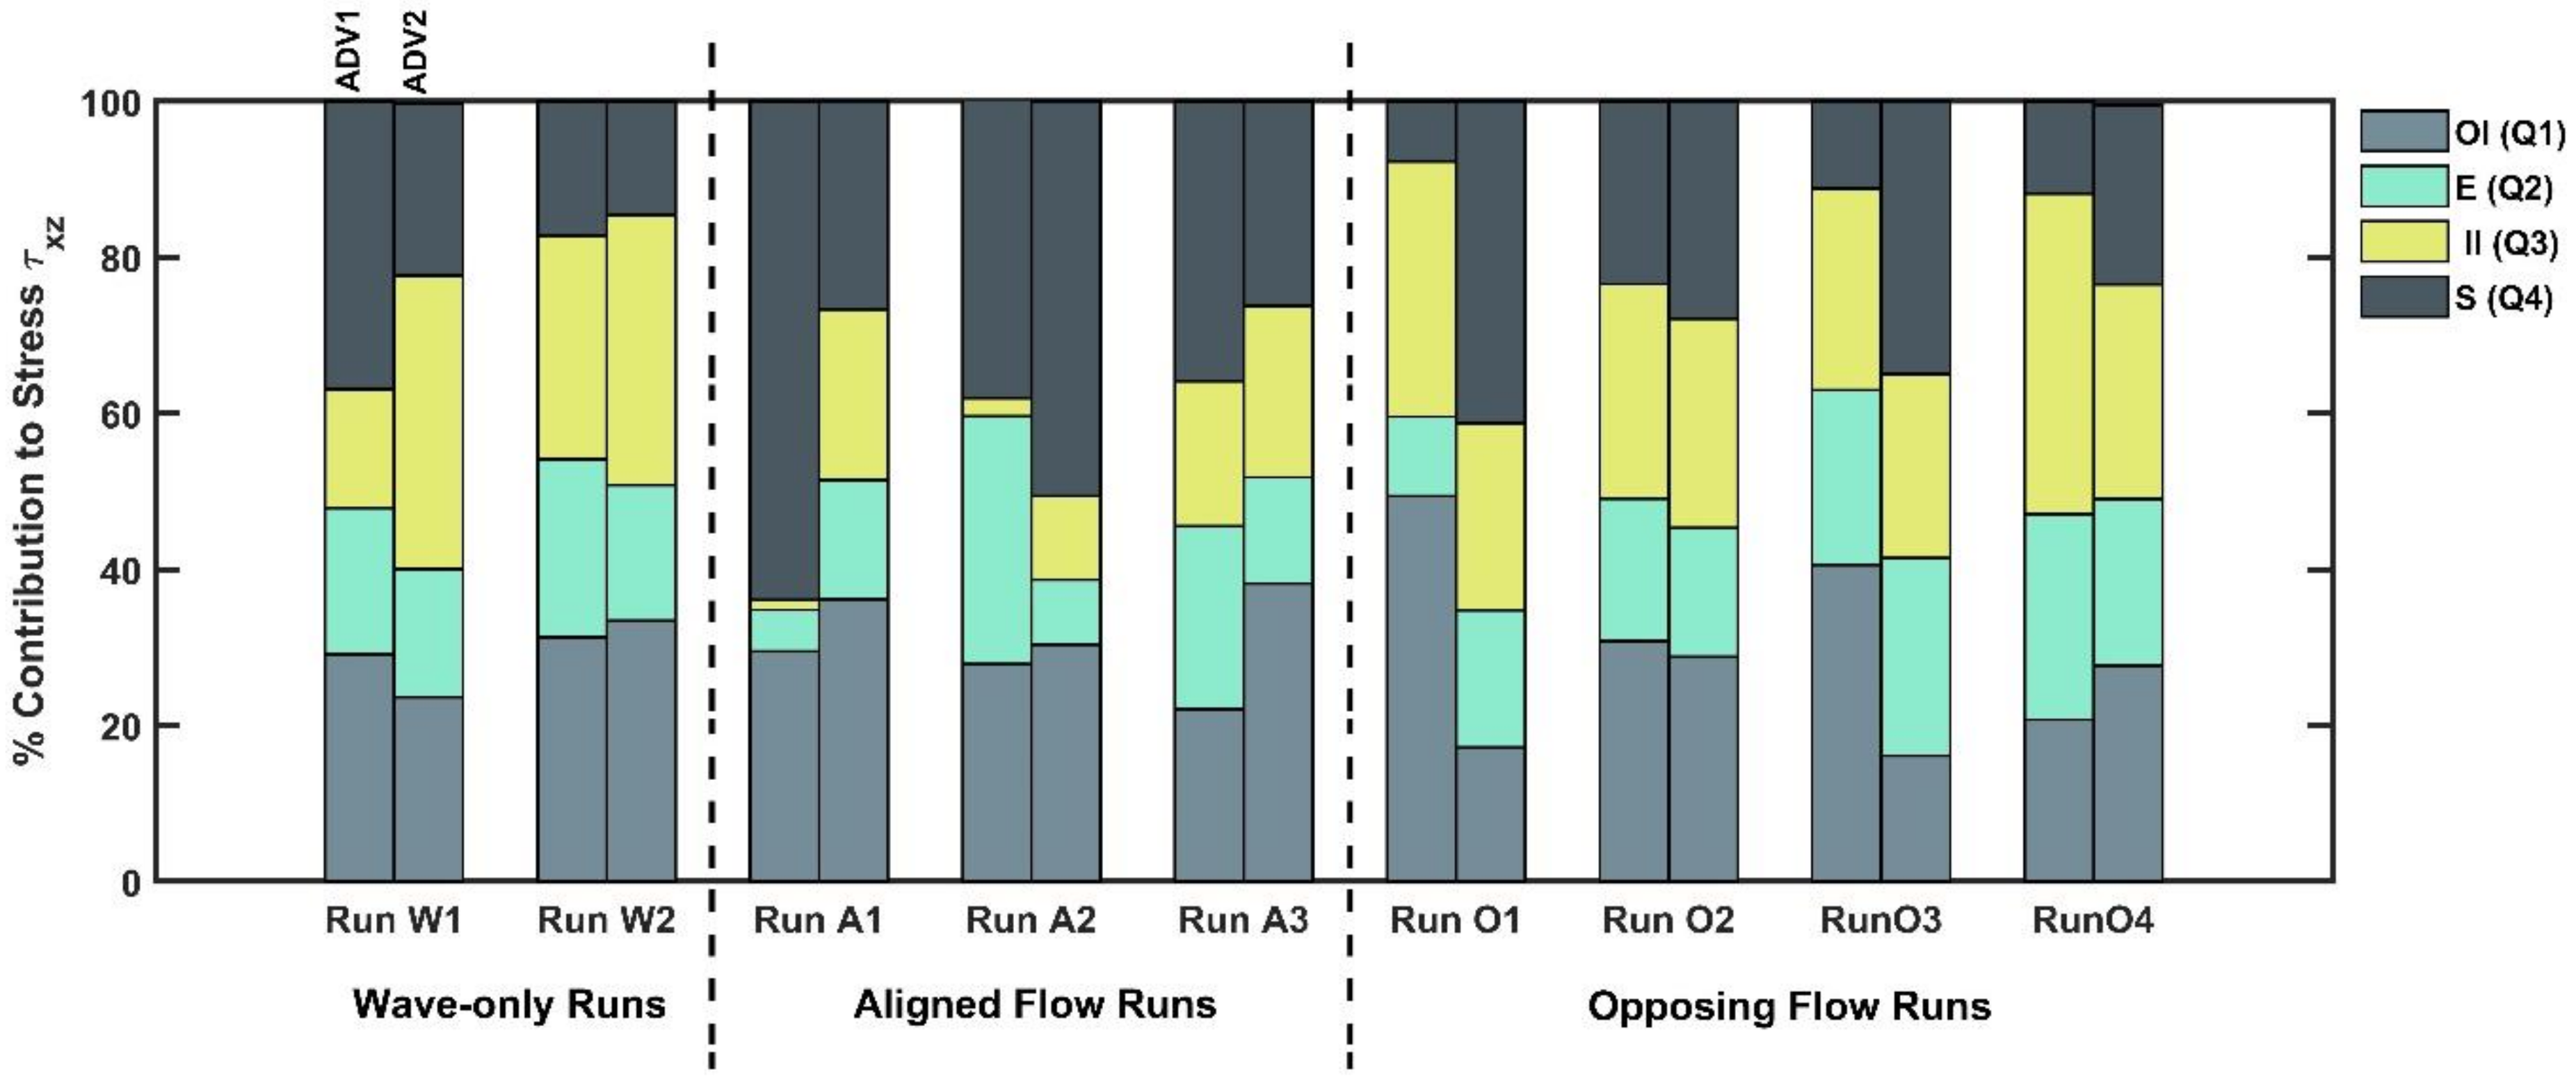
3.3.2. Intermittent Coherent Motions

Quadrant analysis is used to define the intermittent nature of momentum exchange, manifest through the Reynolds stress. Hereafter, ‘intermittency’ refers to the alternate passage of energetic coherent structures, which denote active flow periods identified through quadrant and wavelet analysis [78,79]; rather than the classical phenomenological definition [80,81]. The passage of such motions may result in observed deviations from the classical (Kolmogorov, 1941) description of turbulence in the inertial range [82], but we focus specifically on the implications to shear stresses and momentum exchanges in the vertical. The distribution of the streamwise-vertical Reynolds stresses ( u w in (x-z)) plane, across the four different types of quadrant event structures for each of the test runs is presented in Figure 4, for the exemplary runs A1 and O1. For both cases, the joint distribution of streamwise and vertical velocity fluctuations is presented at the two ADVs, without (blue) and with imposed quadrant thresholds with hyperbolic hole sizes H = 1 (black) and H = 4 (orange), as defined by Equation 5. H = 0 defines all detected events, H = 1 delimits values exceeding the root-mean-square stress, and H = 4 is used to identify extremes (which constitute 1–3% of recorded events, in all runs). From the outset, there are clear differences between the aligned and the opposing cases, and between the ADVs at both elevations in a given run. In Run A1, the streamwise component visibly dominates the flow structure at the higher ADV1, and the most extreme events, highlighted to be outside H = 4, mostly occur in the 1st and 4th quadrants (Outward Interactions and Sweeps), characterised by positive velocity fluctuations (i.e., along the direction of wave propagation and current). This pattern is reproduced in the other aligned cases, and the most extreme events often feature in a chronological sequence manifest within Q2 (Ejection) and Q4 (Sweep) pairs [counter-rotating motions], suggesting intense turbulent events are associated with the passage of spatially defined energetic structure past the sensor. Closer to the bed, the instantaneous Reynolds stresses appear more evenly distributed amongst the 4 quadrant types (isotropic). In the opposing cases (O1 to O4), Inward and Outward Interactions are prevalent in all cases at the higher elevation, while Sweeps and Ejections feature more prominently closer to the bed. The opposing cases exhibit more variance between one another, due to the different current conditions, with runs O1 and O3 (having the strongest currents), featuring more frequent extreme Inner and Outer Interactions, whist O2 and O4 (lowest currents) are more evenly spread across all quadrants. Collectively, the quadrant analysis suggests anisotropic distribution of turbulent Reynolds stresses at the higher elevations, and more isotropic turbulent fluctuations at the lower elevation. This implies that the two ADVs fall into distinct “layers” within the flow, with a stronger current influence at the higher elevation.
The contribution of different types of quadrant events to Reynolds stress (in the streamwise vertical plane) is shown in Figure 5. Without applying a threshold, Outward Interactions (OI) and Sweeps contribute more (29–37%, and 28–43.7% respectively) to the time averaged Reynolds shear stress than the Inward Interactions and Ejections (9–24.1 and 13–19%) in all runs and both elevations above bed. Given that all events appear in nearly equal proportions, then Sweeps and Inward Interactions (both characterised by positive fluctuations in the direction of wave propagation) are therefore the more violent, stress-bearing structures. With a threshold H = 1 applied, the aligned cases are dominated by flow-aligned motions (Q1 and Q4) which contribute 58–93% of stress at both elevations in these runs. Sweeps are also the major contributors to stress in the opposing runs at the lower locations, but collectively, Outward and Inward Interactions comprise 62–77% of the time averaged stress at the higher elevations, and 40–53% in the opposing wave-current cases. Current-aligned motions are more prevalent and dominant at ADV1 elevation, confirming the different nature of vortices between the two heights.

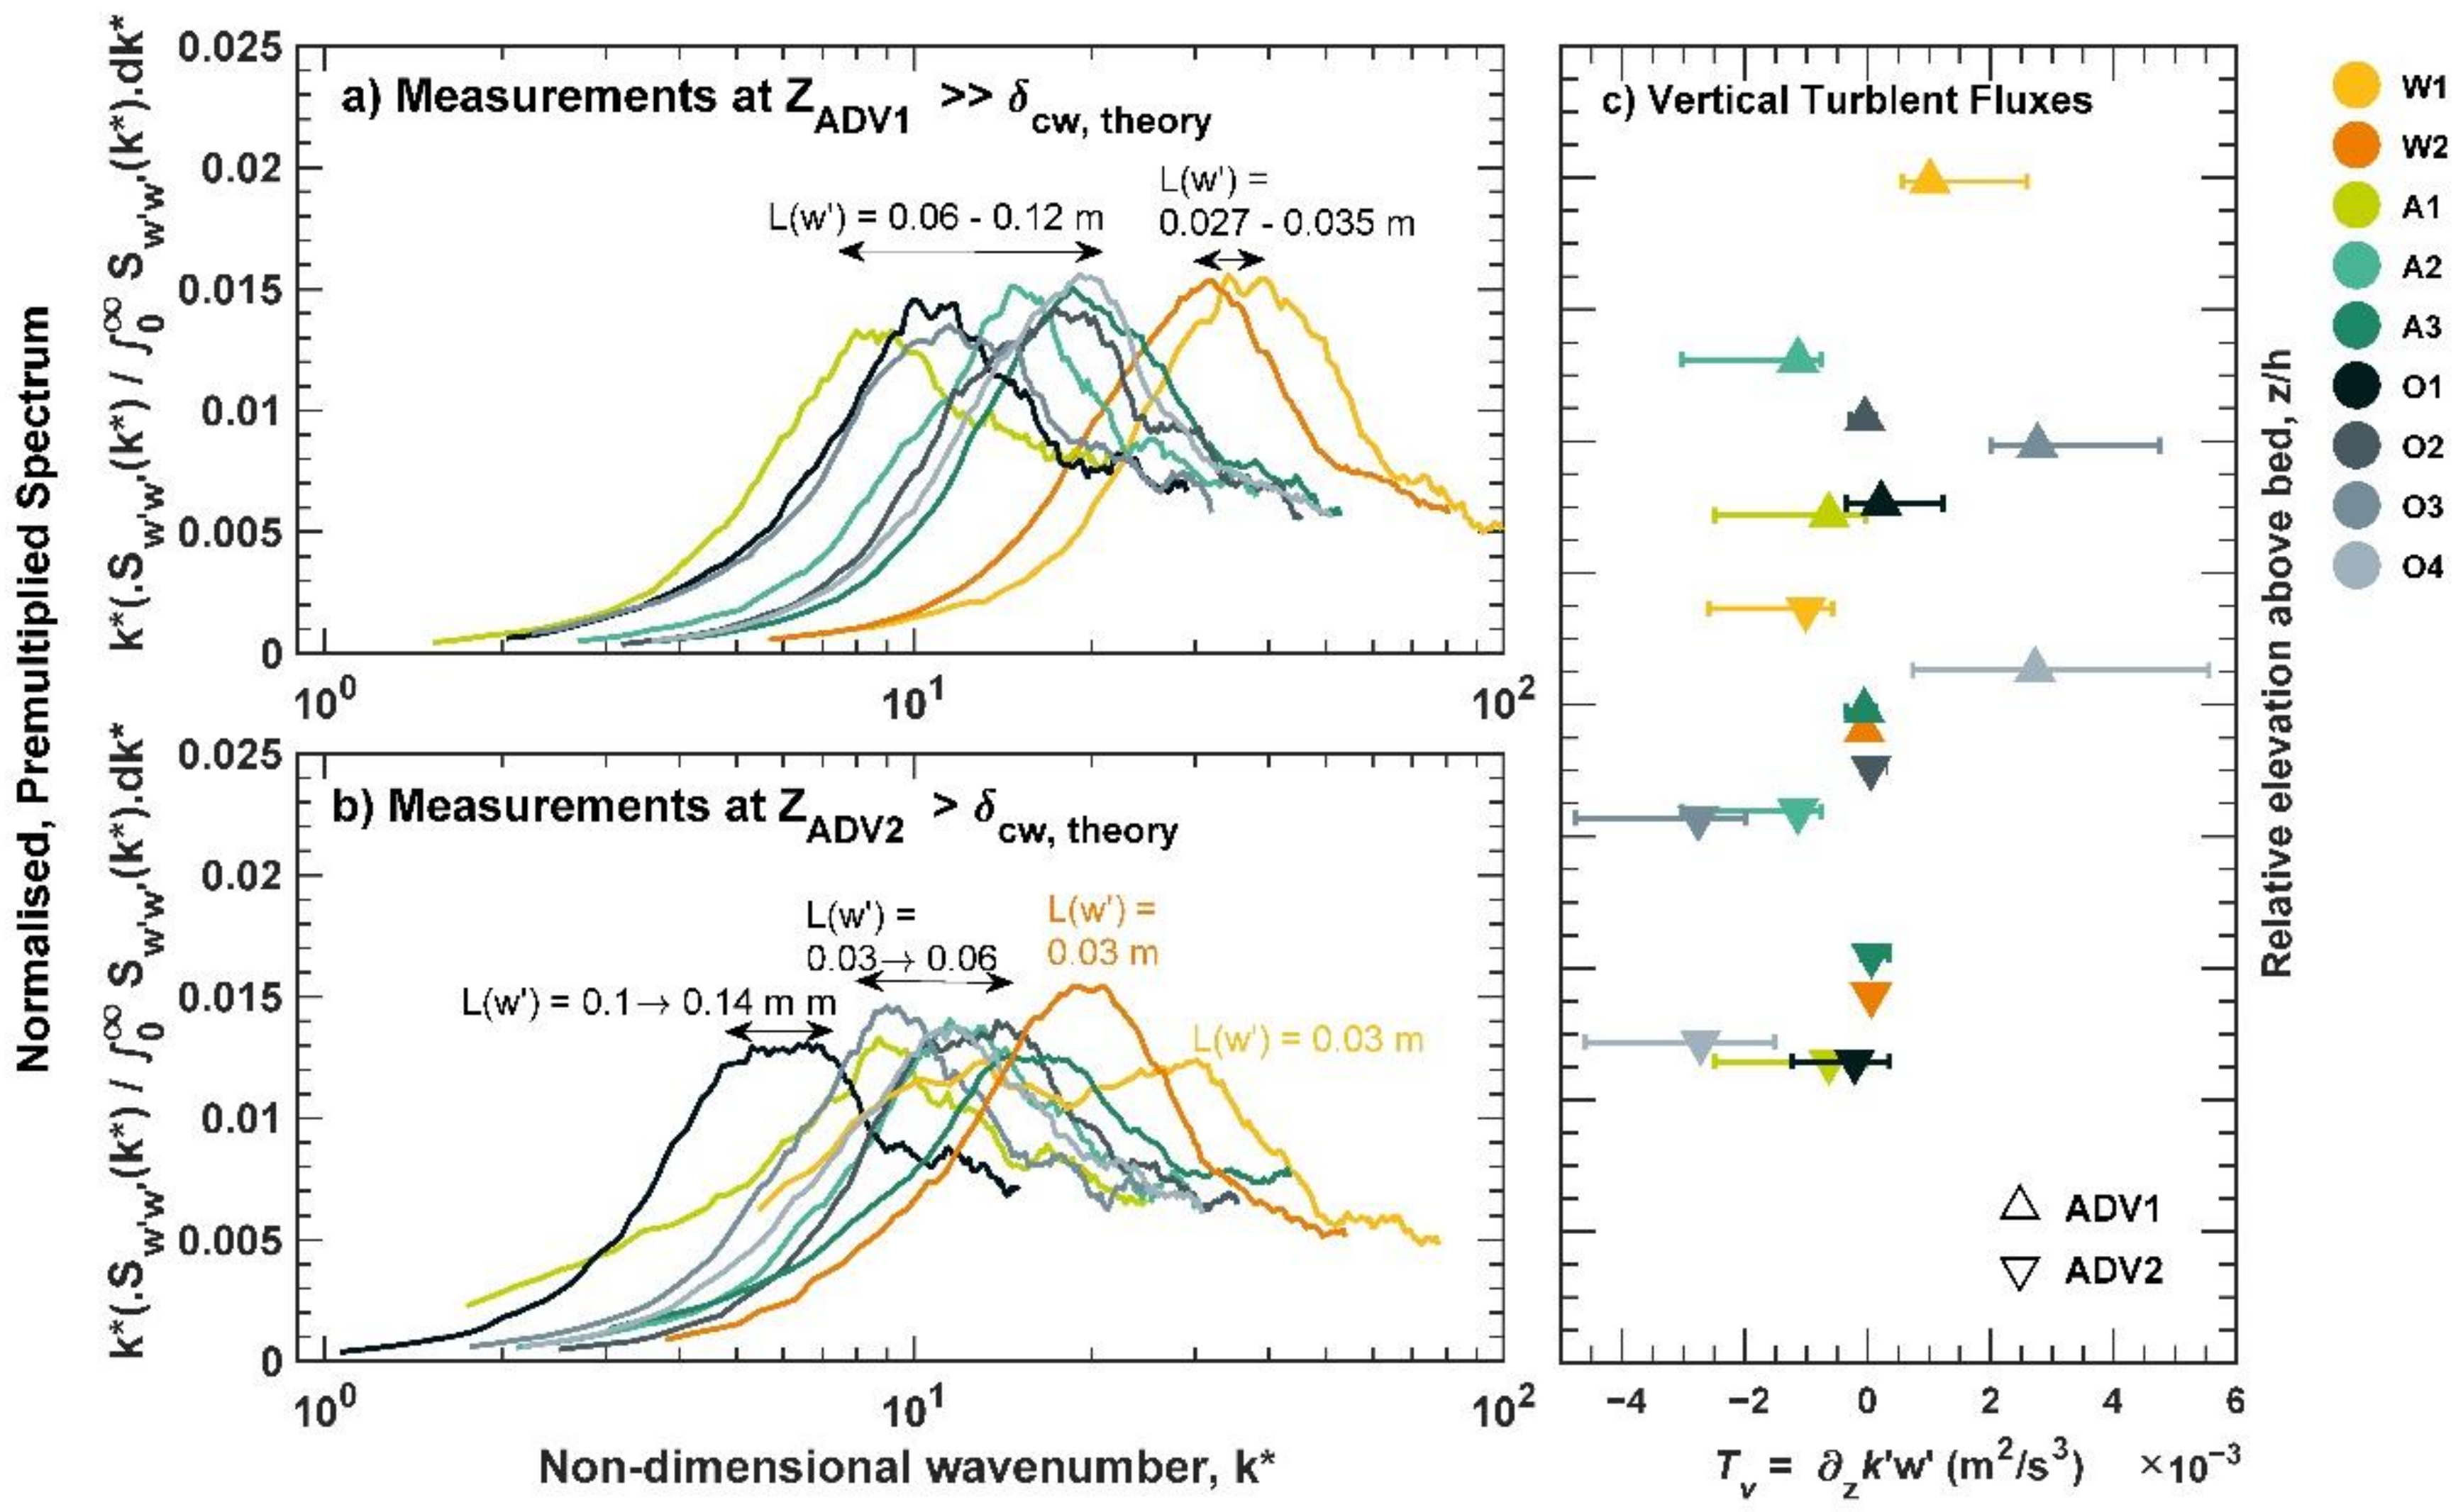
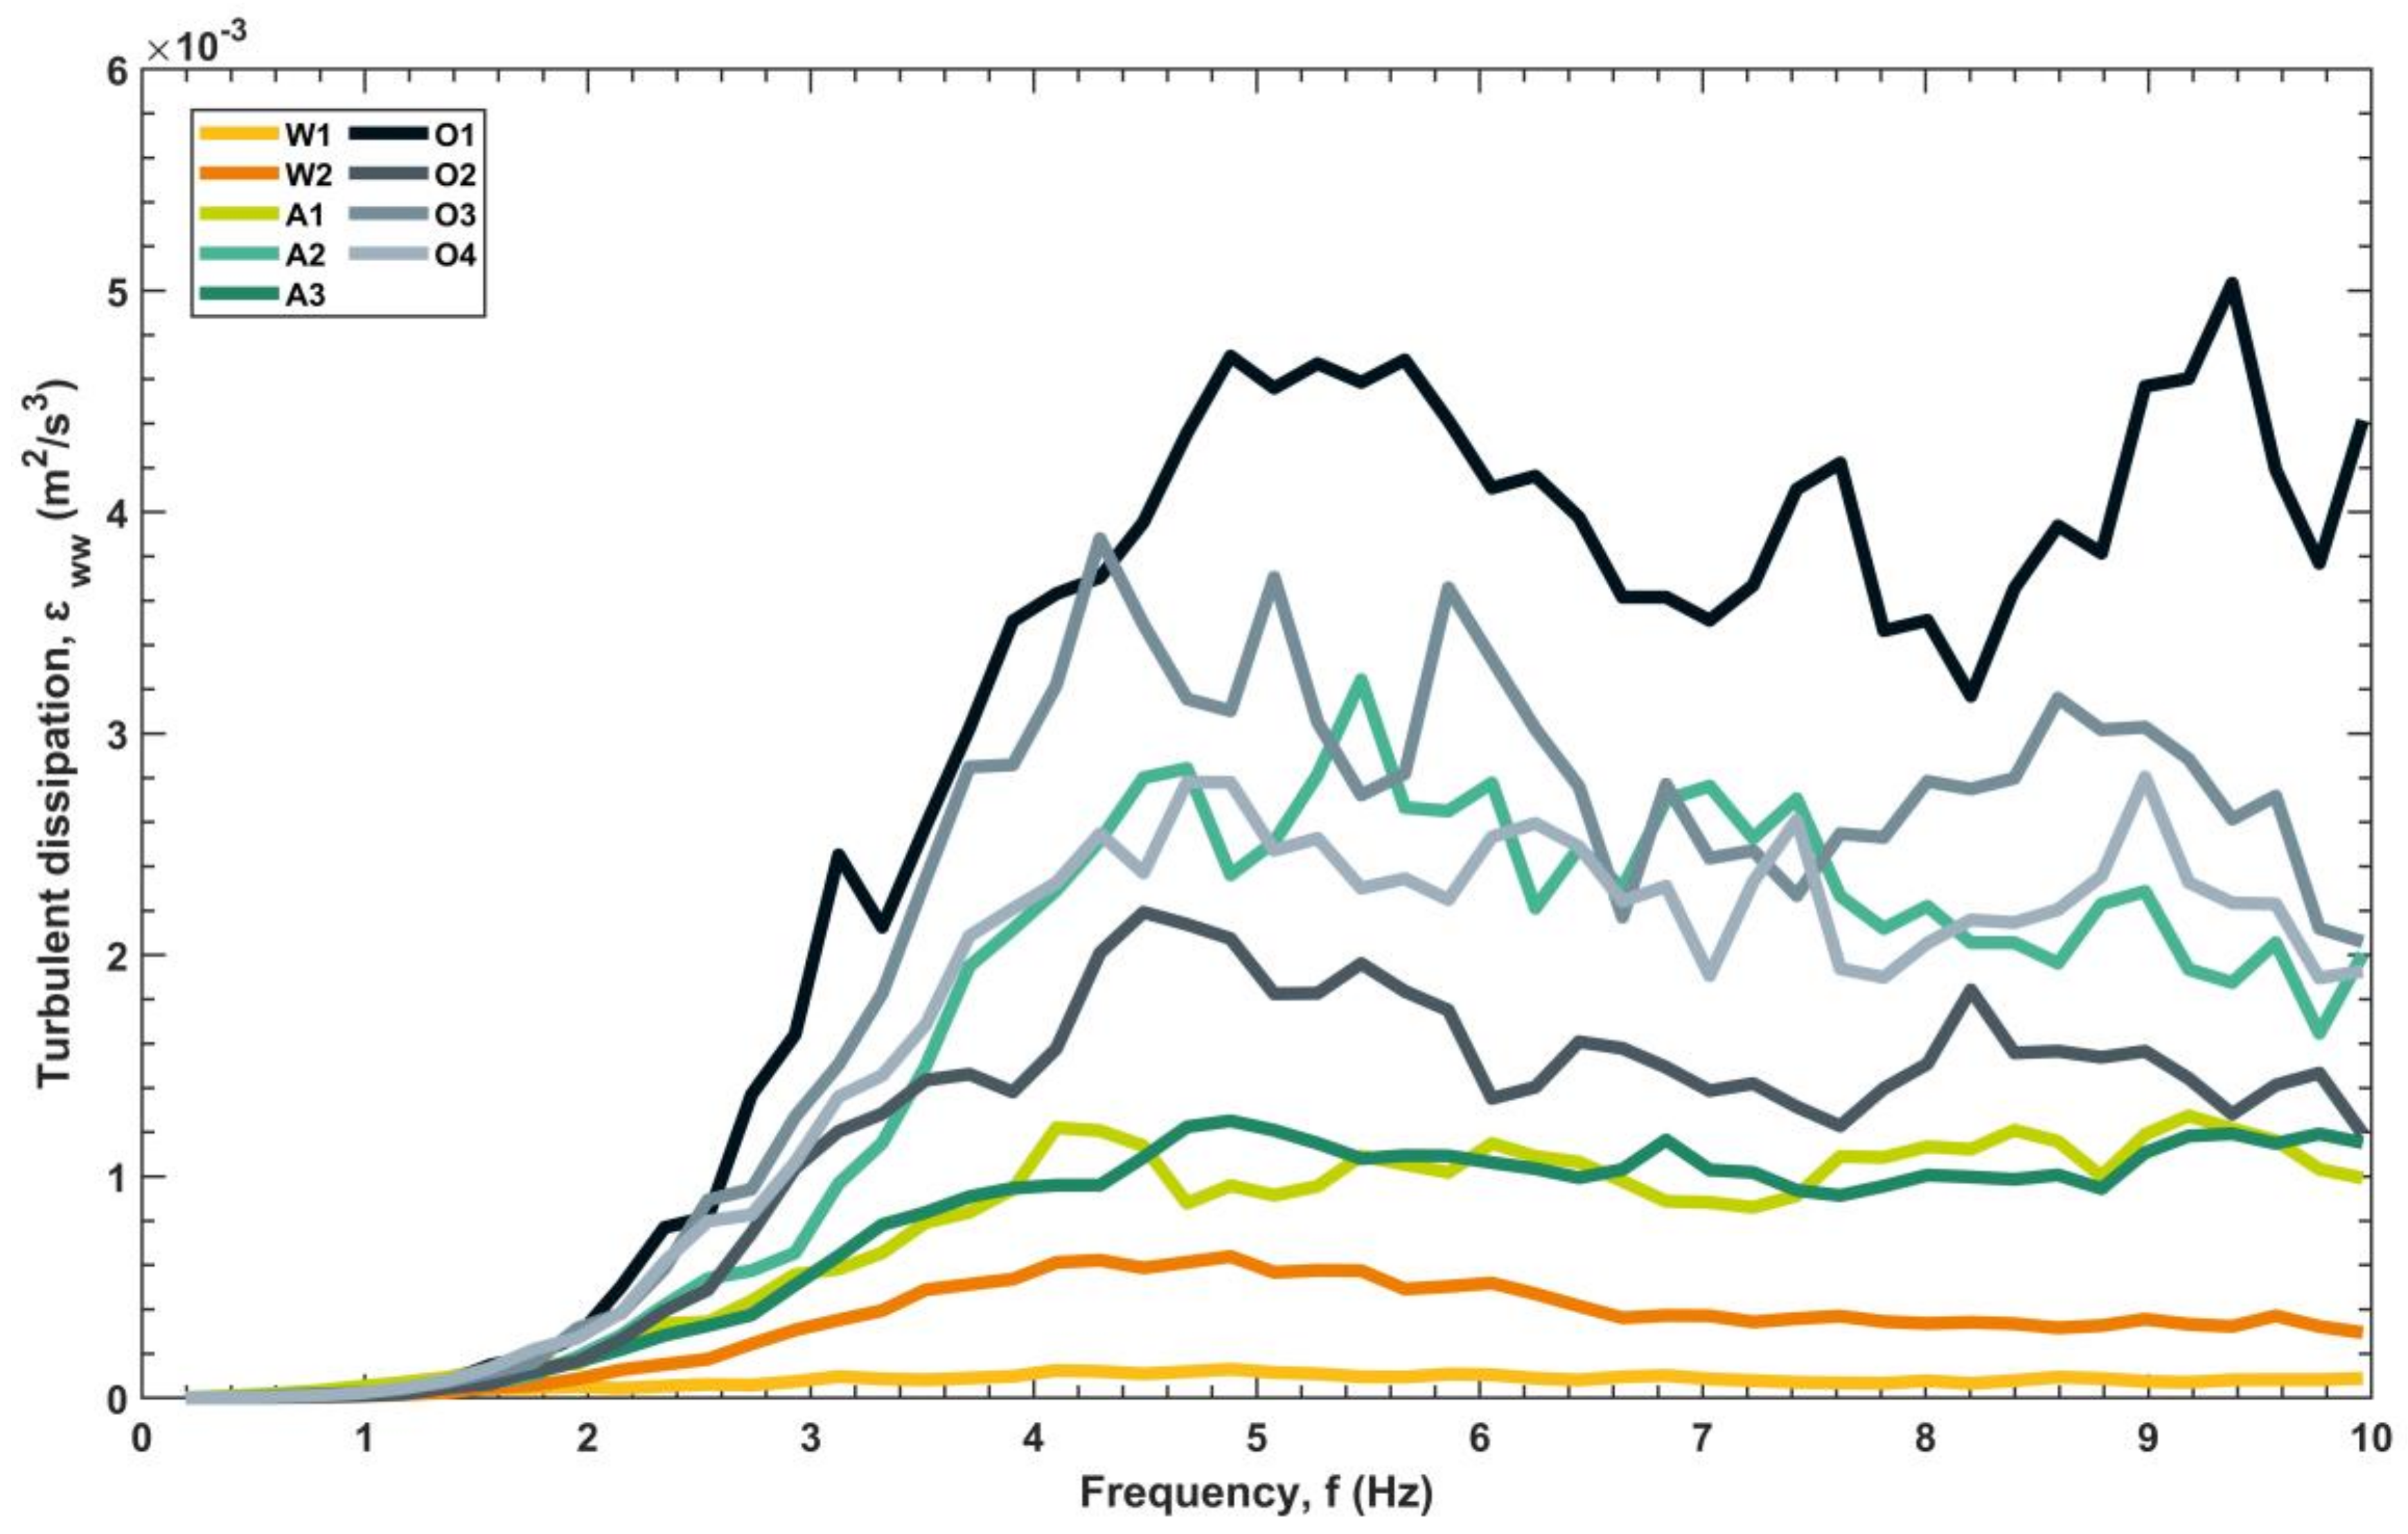
3.3.3. Vertical Turbulent Fluxes and Eddy Scales

To describe the vertical exchanges within the flow, the vertical length scales of turbulent motions are derived from the normalised, wave-number weighted, turbulence power spectra of the vertical turbulent component, w ; constructed using Welch’s method with 50% overlapping Hann windows [83]. These are presented in non-dimensional wave-number space ( k *   =   kz , where z is the height of measurement) in Figure 6; in an energy preserving form such that an equal area under the curve represents equal energy [59]. The peaks are then used to derive spatial scales as outlined in Section 2.4. These spectra show that the bulk of energy in the vertical motions is contained at non-dimensional wavenumbers in the range:   10 0 < k * < 10 2 ; in agreement with previous work in shallow settings [59,84]. For the heights of measurements at ADV2 (between 0.07 and 0.13 m above bed), this corresponds to length scales between 0.01 < λ w < 0.3   m , exceeding the inferred and theoretical thicknesses of the combined wave-current boundary layer predicted by all models. The peak energies correspond to similar length scales in all the runs (presented in Table 4), in the order of λ w = 0.03 0.07   m ; with the exception of Run O1. These integral scales of vertical fluxes exceed the theoretical thicknesses of the combined wave-current boundary layer predicted by all models; scaling to ~1.2–3 times the thicknesses δ cw , max inferred from measurements and the GM86 model, and an order of magnitude larger than predicted by SC05 and MD12. This implies that vertical fluxes are not restricted to within the oscillating region, as suggested by the zero-flux condition imposed in combined flows. Similar scaling is observed in the vertical at the higher elevation, with larger peaks ( λ w = 0.027 0.12   m ). To assess the nature of these exchanges, the rate of vertical turbulent transport (turbulent kinetic energy flux in the vertical), T v = z k w ¯ (where z   denotes the vertical gradient, [23]) is also presented (Figure 6c). T v   represents an estimate of turbulent advection, given molecular diffusion is negligible at high Reynolds numbers (and we cannot calculate the pressure-driven transport). The vertical turbulent flux in the deeper runs (W2, A3 and O4) is largely negligible at both elevations. A clear distinction between the aligned and opposing cases is evident at the higher ADV location, whereby [shallower] aligned cases are characterised by upward diffusion (negative T v ), whereas the opposing cases show downward net transport of momentum (positive T v ). Closer to the bed, all runs display upward diffusion, except those in deeper water suggesting bed generated turbulence dominates. W1 shows significant negative flux at lower ADV2 (upwards transfer of momentum from bed), i.e., eddies from the wave boundary layer transferring momentum into upper flow. This is expected given W1 is characterised by vortex shedding; and these vortices do not reach ADV1 (higher); whereas W2 is characterised by rolling grain ripples. Similarly, runs A2, O1, O3 and O4 exhibit significant negative turbulent fluxes at the lower elevation, indicating upward transport from the bed through vortex shedding. This is not evident at O3, which also features vortex shedding.

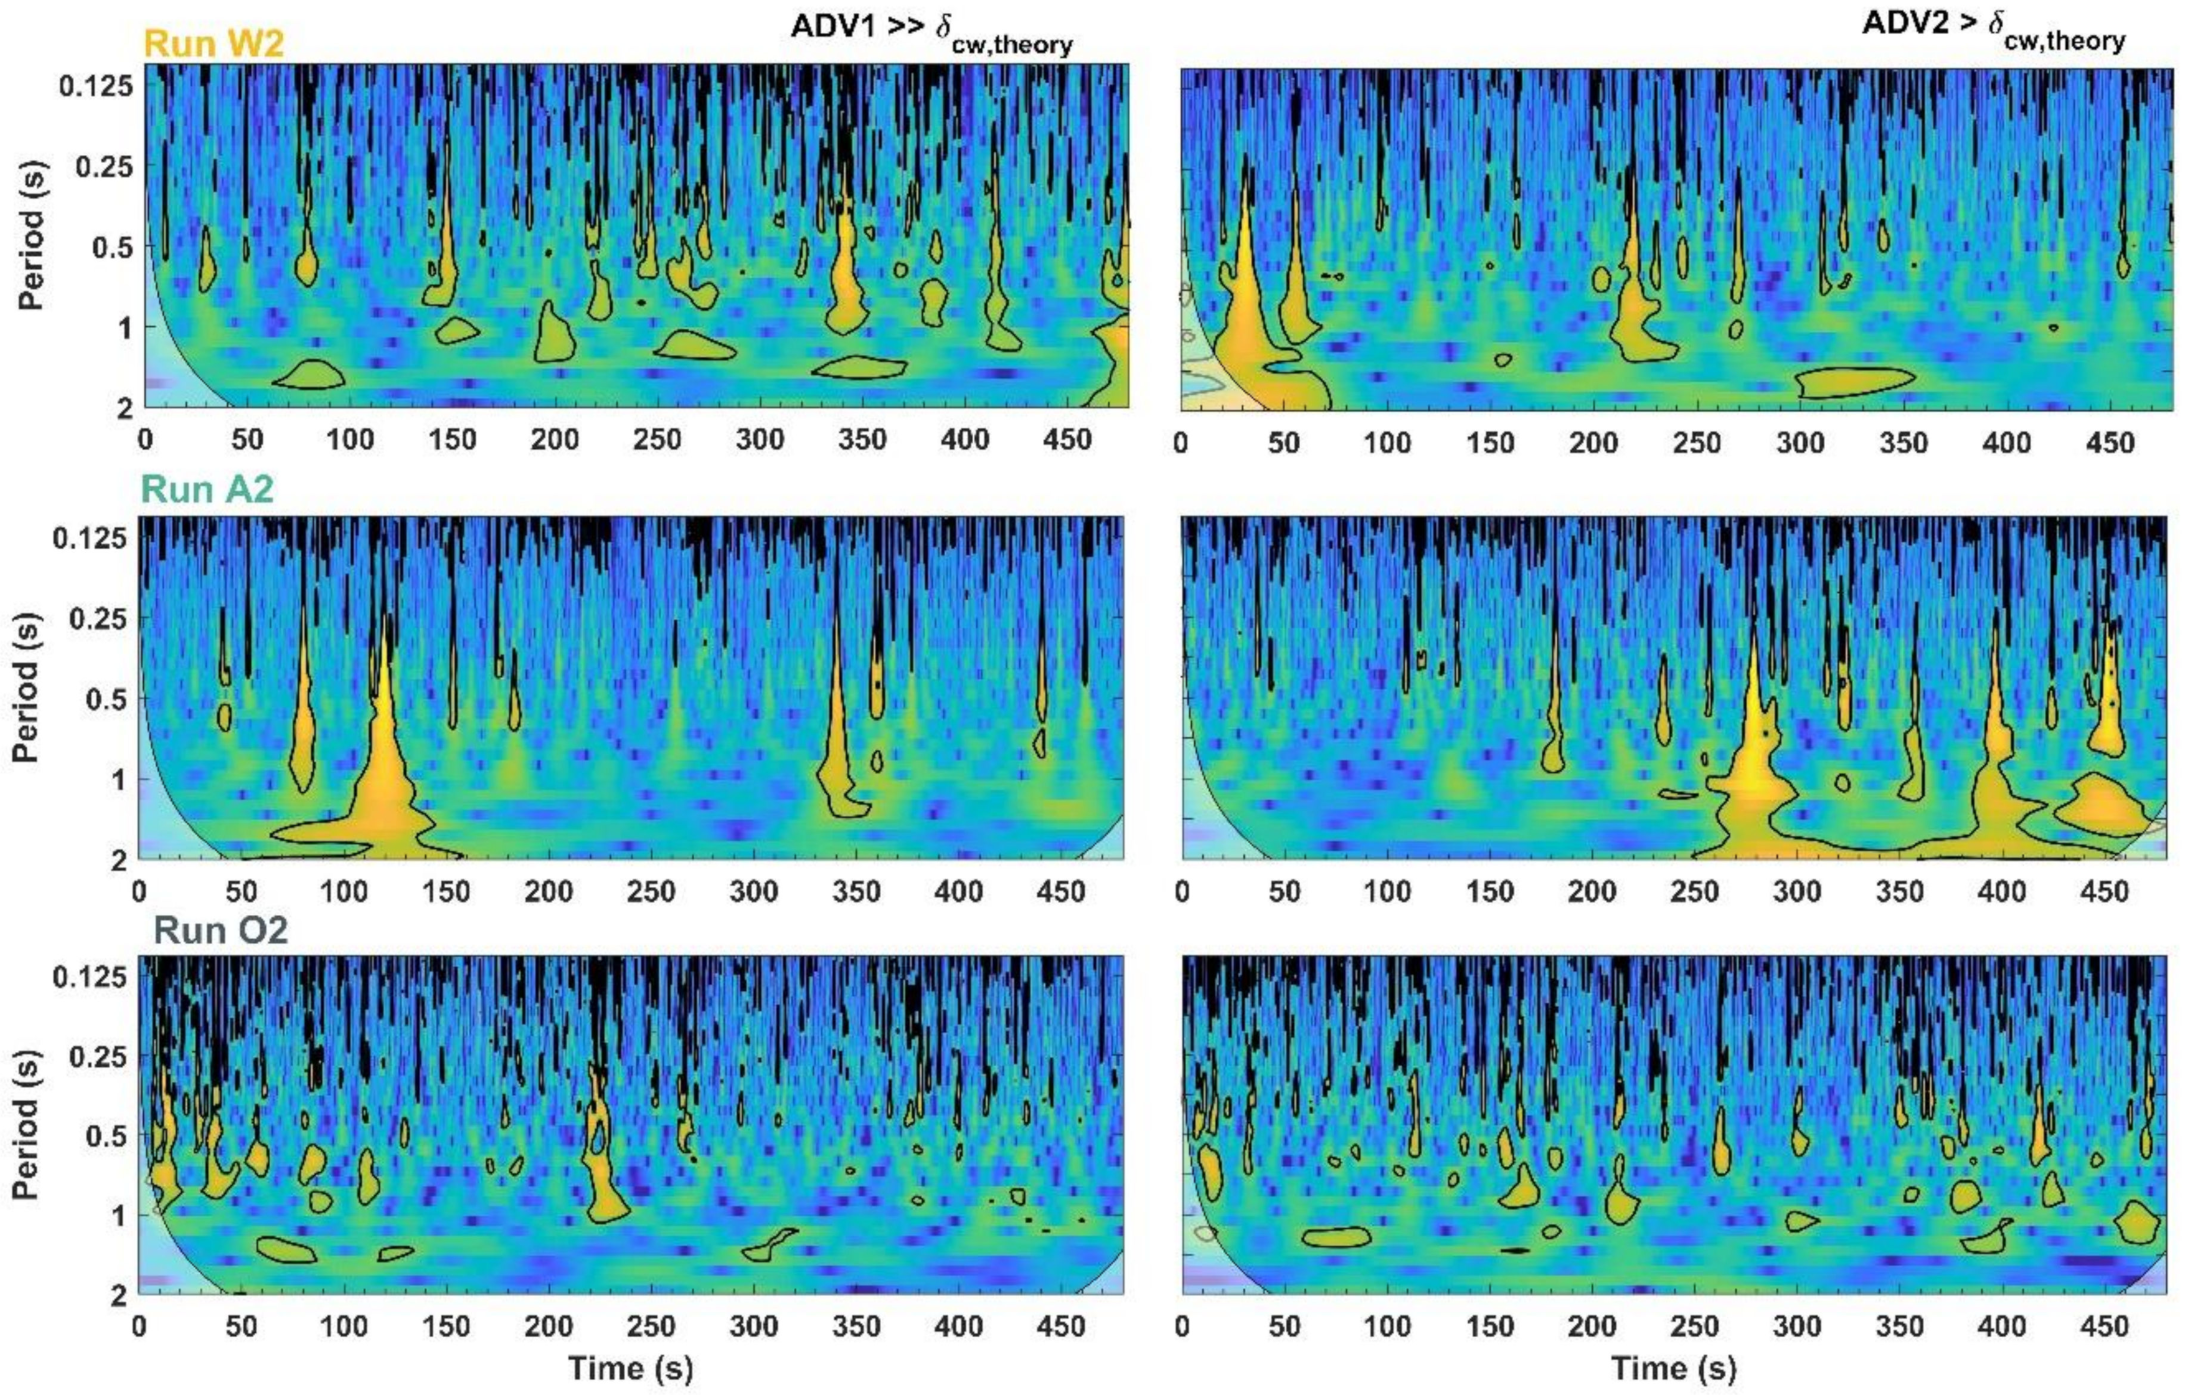
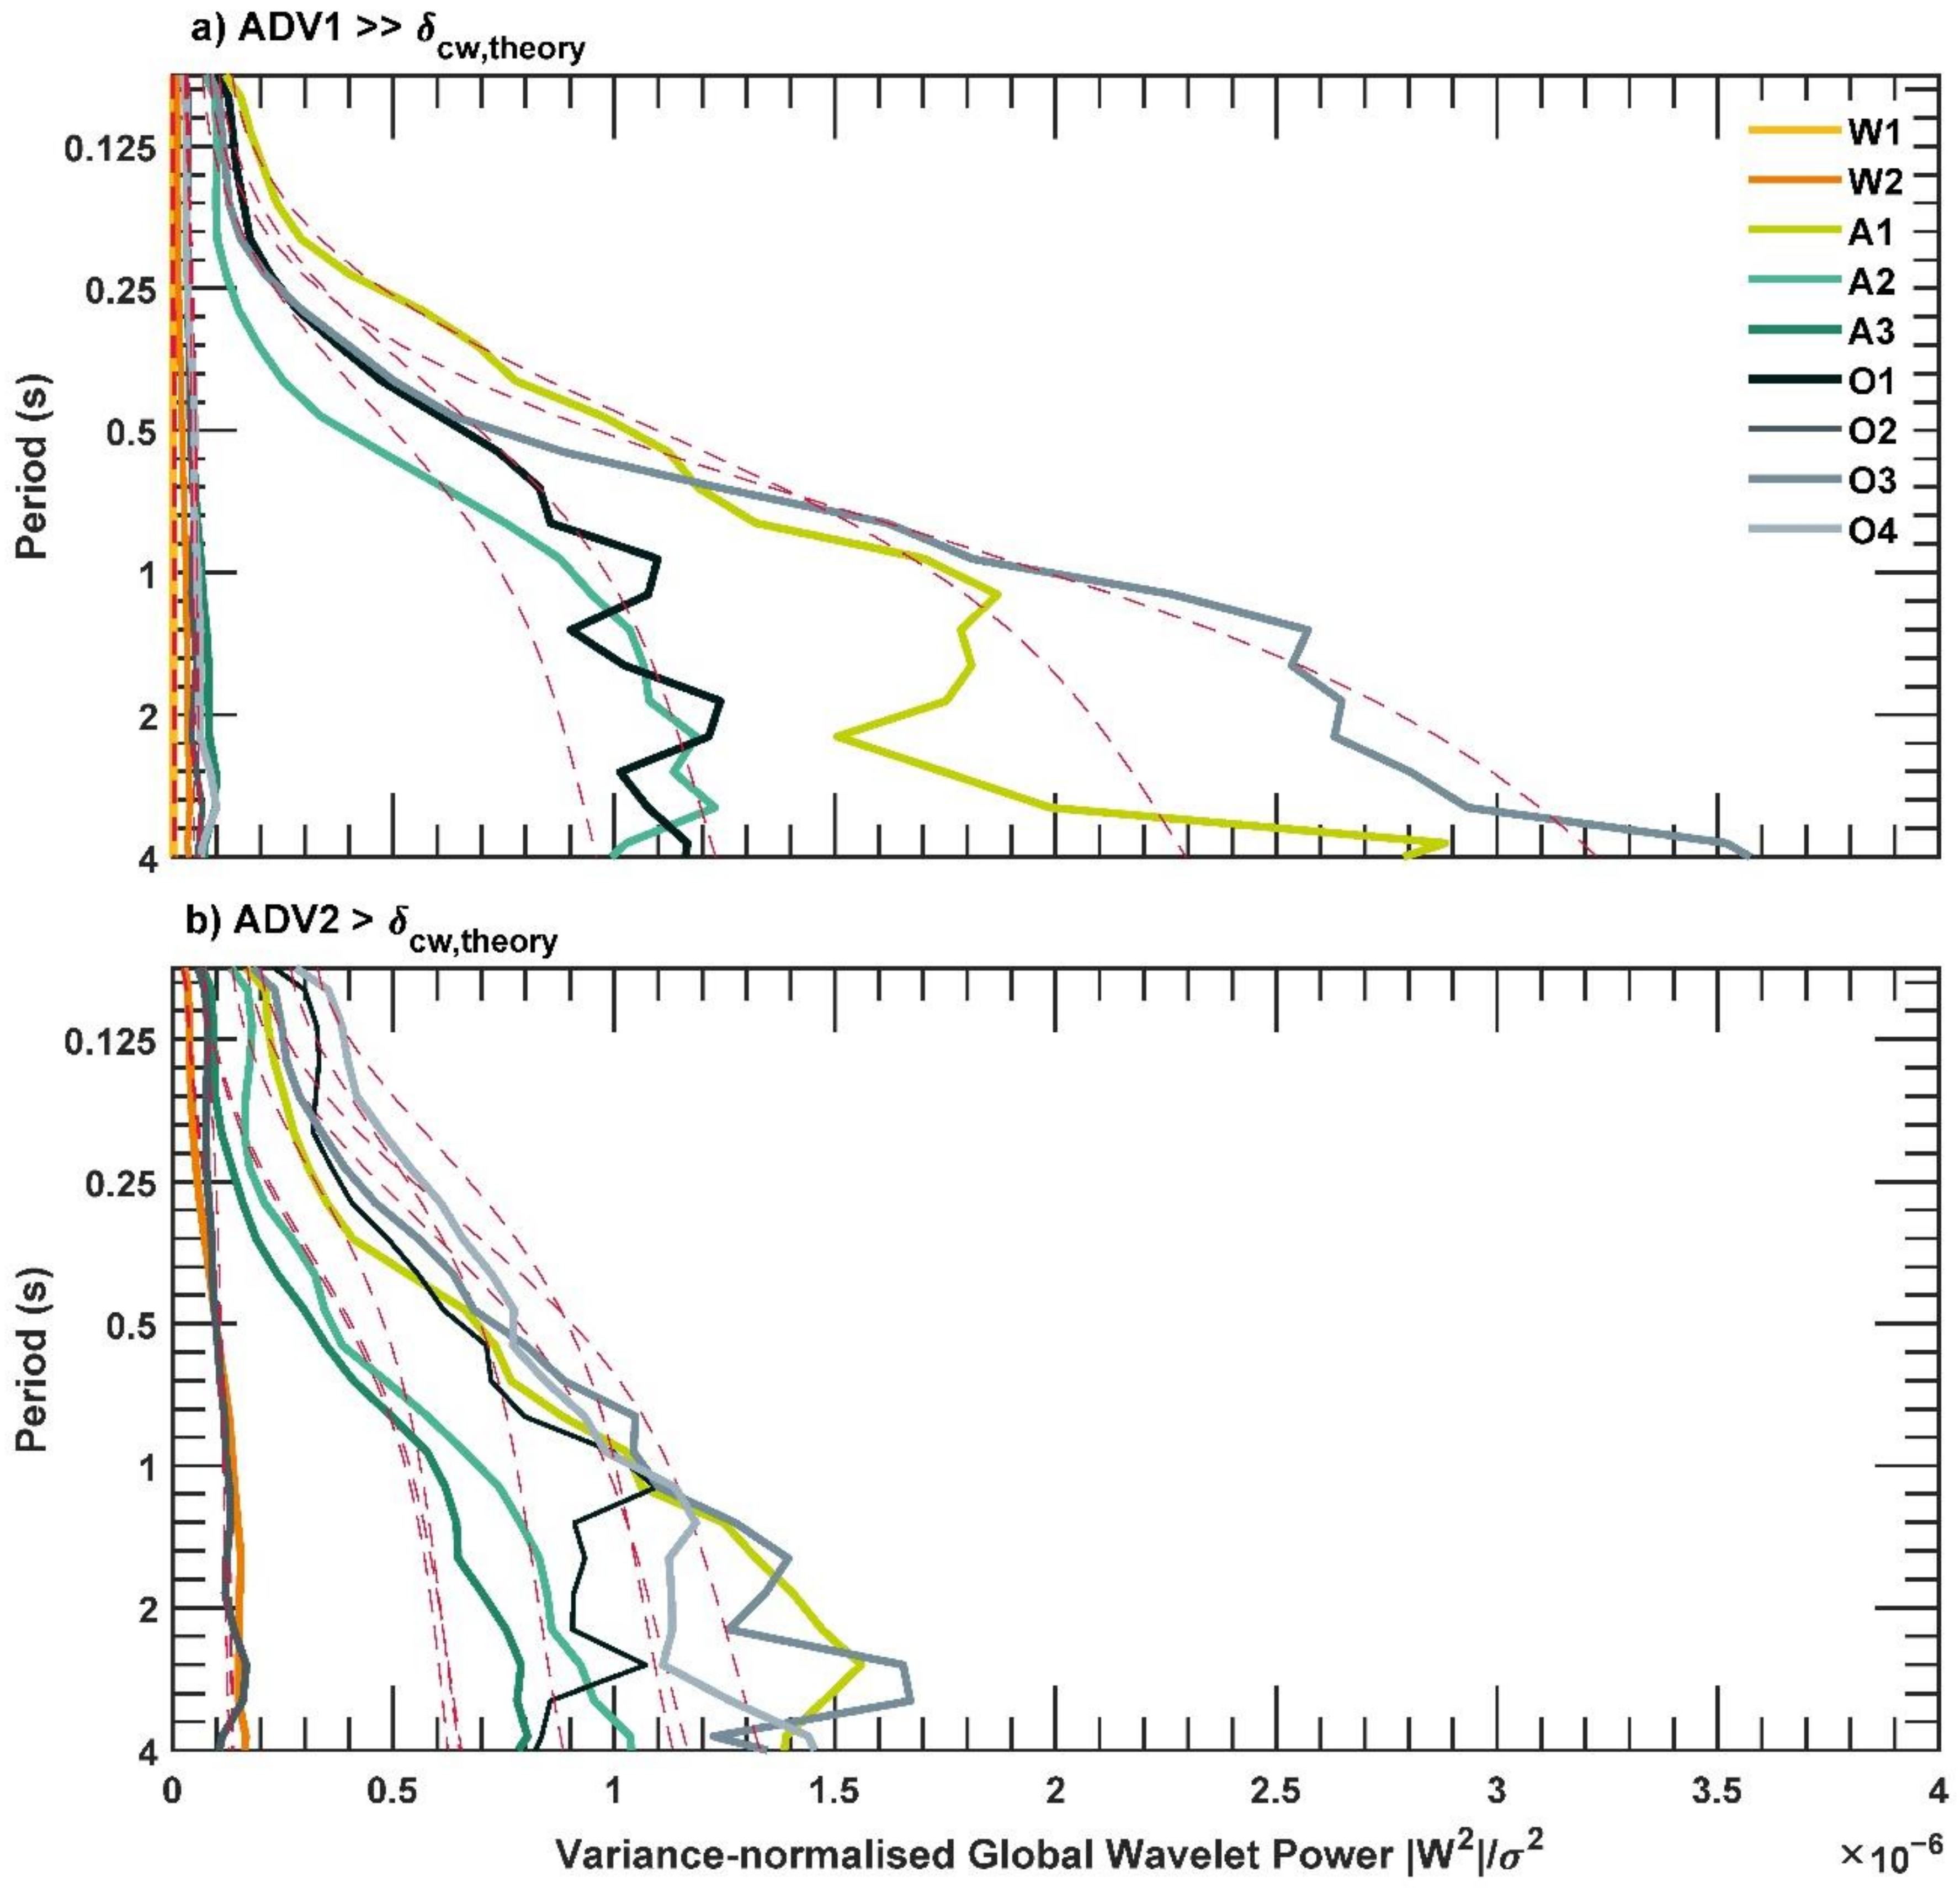
3.3.4. Temporal Scales and Active Periods of the Flow

The temporal scales of turbulent motions and active periods of flow are derived from the high variance regions within the time-frequency domain defined by a continuous wavelet transform (CWT) decomposing the instantaneous streamwise-vertical Reynolds stress ( u w ¯ signal. This is presented for both ADV elevations, for the exemplary runs W2, A2 and O2 in Figure 7 as time-frequency plots, but we opt to represent period (inverse frequency) on the y-axes for clarity. In the CWT time-frequency plots, brighter colours indicate high power (variance), and all the plots were scaled to the same limits to allow comparisons of the magnitude of wavelet variance/power at local and global scales between the different runs and elevations. The global power, for all runs, is presented in Figure 8, and pertains to the time average of all local wavelet spectra (i.e., all the vertical slices through the wavelet plot); with the red lines in these subplots denoting the 95% confidence level for the global wavelet spectra, tested in a time-averaged sense using autocorrelation of background noise. Short-lived, intermittent events are evident at high frequencies (>1 Hz), in all runs, often spanning multiple frequencies and lasting up to a maximum of ~10 seconds, and featuring more prominently at the lower elevation (ADV2), with weaker power higher up (ADV1). While some of these exhibit frequencies that are significant globally within the series, most show significant peaks in the local wavelet power but are less significant globally. Closer to the bed, intermittent, short-term high frequency events occur more commonly throughout the time series and are of both global and local significance. In the wave only runs, lower frequencies (higher periods) pertaining to the wave forcing, occupy significant proportions of the time series; particularly at ADV2. In the aligned flow cases, these are even more prominent, persisting continuously for up to 300 seconds; and thus dominate the global normalised wavelet power. Many of the lower frequency (longer period) events stem from these scales, suggesting higher frequency motions result from breaking of larger coherent clusters, as they dissipate energy. For the opposing runs, the CWT of streamwise-vertical Reynolds stresses generally exhibit active periods with weaker power (lower variance) than in the aligned cases, and often rapidly diminishing. These are characterised by intermittent, very short-lived events across small ranges of high frequencies (1–5 Hz) with active durations of ~3–9 seconds. Low frequencies (periodicity ~1–3 s) feature for shorter durations than in the aligned cases (up to 50 seconds) at half wave cycles (vortex shedding), but last for longer (~200 s) in narrow frequency bands at these scales. The observed events are also weaker in the deeper runs (W2, A3 and O4) than the shallower runs, and are shorter lived in runs where the waves have shorter periods (A1, O1 and O3). Runs O2 and O4, with weaker currents, have the weakest motions.

4. Discussion

In combined wave-current flows, shear stresses near the boundary are often assumed to be independent of whether the current flows with or against the waves, yet some variations in turbulent intensities have been reported in the literature. Experimental results have reported currents aligned with waves result in reduced stresses in the outer flow, suggesting the generation of turbulence is periodic with the waves at the bed and thus “true turbulence” may be lost in the Reynolds decomposition needed to infer stresses [10,11,26]. In opposing flow, turbulence intensities depend on the outer flow velocities generating vortices which peak at the deceleration phase of the wave [11]. Flow reversal against a weak current could be attained each wave cycle, resulting in the generation and ejection of an upstream vortex in addition to the usual downstream vortex. However, stronger currents weaken or inhibit the formation of upstream vortices, ejecting one vortex only each cycle (ibid.). Our results show that an equal magnitude current opposing waves (Run O1) appears to have a more significant impact on time-averaged shear stresses than in the aligned case (Run A1) and high, mean and maximum shear stresses are outside the theoretical oscillatory boundary thickness, which the GM86, SC05 and MD12 models suggest to be confined to a few millimeters in the immediate vicinity of the bed. Yet, we report shear stresses exceeding those predicted by the models at the bed, with measured maximum stresses exceeding those estimated by SC05 and MD12 and the effective stress of GM86, albeit lower than the transport-enhanced bed shear stresses predicted by the latter. The three models use estimates of near-bed orbital velocity to define a wave-only shear stress, and a current velocity (depth-averaged or at a height within a presumed logarithmic velocity distribution) to derive a current only shear stress, then apply a vector summation of the two components to account for the relative angle. For the individual contributions of current and wave, the quadratic stress law is used to calculate mean and maximum bed shear stresses, using the mean current drag coefficient or current-modified wave friction factor. The main difference among these models arises from the treatment of the current-modified wave (oscillatory) shear stress. The near-bed horizontal orbital velocities measured by the lower ADV2 ( U orb ¯ z = var U x 2 + var V z 2 0.5 compared remarkably well (within 10%) to current-modified orbital velocities estimated from independently-measured depth-averaged current, wave height and period, using an efficient Newton-Raphson numerical approximation to solve the wave-current dispersion equation [71,85]. GM86 uses a simplified scaling through a generalised friction factor applied to wave-only shear (friction) velocity, to account for shear stress enhancement, such that   u cw * = C R   u w * ; where the coefficient C R   is slightly larger than unity (enhancement). The model of SC05 uses a combined shear stress defined by τ cw = τ c 2 + τ w 2   , with modified drag coefficients used in the quadratic stress laws, and defines the maximum shear stress τ cw , max   as the period zero-mean stress corresponding to the wave-induced oscillation about the mean shear stress τ cw , m . A comparison on the period zero-mean stress, on a wave-by-wave basis, shows little difference to the ensemble-averaged stresses reported in Table 3. A comparison of wave-only ( τ w ) and current-only ( τ c ) stress components to a linear summation of both, derived following SC05 and MD12 suggest relatively equal contributions ( τ w / τ c + τ w ~   0.4 0.6 ); while using GM86 suggests wave dominance in all runs τ w / τ c + τ w > 0.5 . Predictably, runs with higher mean waves registered larger stresses than those of comparable geometry in the aligned runs. Run O3, characterised by strongest currents, resulted in higher mean and maximum stresses, compared to O1, which, otherwise, has identical forcing, and flow geometry. In all runs, the lower ADV shows non-linear enhancement, suggesting interaction between the wave and current, and thus suggesting the combined oscillatory boundary layer must extend to that elevation. The observed stresses also tally with the observed modes of transport, with higher stresses manifest in enhanced transport. In Runs A1, A3, O1 and O3, with similar mean and maximum shear stresses recorded by ADV2, bedload and vortex shedding were observed. Run O4, which registered highest stresses pertaining to the largest recorded waves, despite a weaker current, featured the most intense transport, with intermittent mass transport (plug flow) at half cycles, and associated with strong pressure gradients at flow reversal.
All three models, used above to predict stresses, assume a two-layer, discontinuous time-invariant eddy viscosity profile, accounting for near-bed modification of the wave orbital velocity by the current, but assuming velocity outside the combined boundary layer must equate to the current only velocity; hence subscribing to the zero-flux condition imposed on vertical momentum exchanges. Our results show momentum exchanges at both ADV elevations. The production of Reynolds stress ( P rey ;   calculated following [23]) was more prominent at the higher ADV1 ( P rey ¯ ~ 0.4 1.8 × 10 5   m 2 s 3 in aligned cases; and lower ( P rey ¯ ~ 6 × 10 6   m 2 s 3 ) in the opposing cases; with opposite patterns closer to the bed at ADV2 ( P rey ¯ ~ 2.8   m 2 s 3 in aligned runs, and negligible in the opposing runs). The rate of production is significantly higher for lower wave periods (A1, O1 and O3). This is reflected in a downward flux of turbulent energy observed in opposing flow in contrast with an upward transfer of momentum in the aligned case (from the oscillatory layer to the outer flow). Quadrant analysis also reveals that the aligned cases were dominated by intense, current-aligned stress bearing structures (Sweeps and Outward Interactions), with counter-rotating vortices (pairs of Ejections and Sweep) being more prominent in longer wave periods, with more time available for the formation of these vortices before flow reversal.
In the opposing case, current aligned motions were also prevalent, but the near bed flow was characterised by counter-rotating pairs of Inward and Outward Interactions, with a downward flux of Reynolds stresses produced within the outer flow and shorter-lived, intermittent active periods characterised by high frequency fluctuations. This could imply higher dissipation of energy imparted by the adverse current upon the eddies formed at flow reversal. An increase in current magnitude resulted in enhanced vertical turbulent fluxes from the boundary layer into the near bed region in the aligned case, and vice-versa in the opposing case. A stronger opposing current also resulted in shorter-lived energetic, turbulent eddies spread across more length and frequency scales; hinting at an enhanced dissipation of the wave energy. To assess this, the turbulent energy dissipation rate, ε , is calculated, at the lower ADV2, following the method of [44], and presented in Figure 9 for frequencies within the inertial and dissipation ranges. The figure shows stronger turbulent energy dissipation associated with the opposing cases compared to aligned flows, and enhanced dissipation linked to stronger currents. Dissipation is stronger in the vertical, and peak dissipation occurs at frequency bands linked to those identified by the CWT in Figure 7. This confirms that the intense motions are correlated with strong dissipation events.
Spatial scales of turbulence indicate well-formed eddies in aligned and opposing flow scaling to the wave orbital motions with vertical excursions beyond the theoretical oscillating layer thickness, but an increase in current magnitude in reverse reduces the extent implying more dissipation of eddies formed at the bed. Wall-attached structures tend to be formed by paired Sweep-Ejection events, often with an associated vortex cluster (detached and isotropically-oriented) embedded within the ejection [86,87] measured the streamwise advection velocity of coherent structures and implied that these are deformed by the mean shear which also controls their lifetime (duration through which they persist before they are completely consumed by viscosity). [88] also suggest that the mean strain rate, which depends on the type of structure considered, is skewed along the positive flow direction, amplifying vorticity. We therefore suggest that in aligned flow of comparable wave and current strengths, the steady current dictates the mean direction of strain, favouring positive streamwise motions (Q1 and Q4 events). This agrees with the observed percentages of occurrence; and, with Q2 and Q4 motions being the most violent, these vortex pairs provide the most significant contributions to stress in the streamwise-vertical plane. This could also explain why, higher up, the maximum normalised shear stresses appear to be a linear superposition in the aligned cases, of nearly equal strengths of the current and waves, in comparison to the nearbed stresses.
Cross-examination of the active periods of flow with the time series of quadrant-event Reynolds stresses (delimited by threshold H = 1) allows us to define sequences of intense bursting motions contributing significantly to stress and momentum exchanges during these periods, and therefore transport of sand. In Run A1, the active, lower-frequency period between t = 230–340 s coincides with a cluster of large-magnitude Outward Interactions and Sweeps, at the higher elevation. These are interspersed with several successions of very intense pairs of Sweeps and Ejections ( τ xz   ¯ S , E 4.9   Pa ) followed by weaker interaction pairs (OI & II) between 238–275 s, and then again between t = 330–340 s, and at t~350 s. Closer to the bed (at ADV2), Outward and Inward Interactions are featured throughout the time series ( τ xz   ¯ OI , II 2.8   Pa ) yet all the significant regions within the CWT plot only coincide with the presence of Sweeps, and the lower frequency active regions are instigated by clusters of strong Ejections and Sweeps. All the Ejections are concurrent with active flows with a wavelet period of ≥1 s. Moreover, comparisons between A1 and A2 highlight the effect of wave period in aligned flows whereby the longer period waves (A2) resulted in a more discernible impact on observed trends, such that active periods of flow better mapped to the wave harmonics, with stronger upwards fluxes from the oscillatory boundary layer into the near bed region, and more symmetric, 2D bedforms associated with oscillatory flows. This is reflected in the observed sediment entrainment by vortex shedding at flow reversal in Runs A1, A2, O1 and O2, which were longer lived, and extended higher up, in the aligned cases; and were shorter, and quickly advected in the opposing cases, particularly under stronger advected currents in Run O1. The observed clouds of suspension corresponded to the inferred vertical turbulence length scales in Section 3.3.3. This possibly highlights the role of the superimposed current, whose mean direction governs the prevalence of a positive or negative streamwise fluctuation (with orbital motion switching signs every half cycle) in defining the predominant types of detected turbulence events and ensuing suspension, while the stronger waves dictated intense bursts of transport, as evident in plug flow transport at the intense stages of stress production where wave and current flows coincided in Run O4. [89] have shown Q4 (sweep) events to dominate near the wall (with Q2 away from the wall) as a result of a “spatial phase difference” between streamwise and wall-normal turbulent fluctuations caused by the advection of a large coherent structure which causes counter-gradient stresses (Q1 and Q3) events above and below the structure. This causes more negative peaks in fluctuations at higher wall units than positive ones, and thus more frequent Q2 motions higher up. Such intense sequences of sweeping motion therefore enhance the mobilisation of sediment, resulting in observed, intermittent sheet flow conditions for much of the wave cycle in Run O4. Collectively, these observations attest to the differences in behaviour between aligned and opposing, collinear wave-current flows. This implies that our present approach to dealing with the problem from a time-averaged perspective is insufficient, because there is a need to capture the time-resolved momentum exchanges throughout the water column.
This work presents a study focusing on stress and momentum exchanges in combined wave-current flows. In the absence of three-dimensional, time-resolved information at field scales, advanced computational techniques are relied upon to extract temporal and spatial information on fluid motion (Reynolds stresses and quadrant events) and suspended particles, measured at discrete locations with the flow. This is warranted given that quadrant events, often considered manifestations of the passage of coherent structures, reside at the top of the turbulent energy cascade, and are important for the transfer of momentum and generation of turbulent energy, and hence sediment entrainment. An assessment of shear stress and its distribution across different quadrant events as well as its variability in time often provides a better account of sediment entrainment and transport [84,90]. What remains to be explained is the feedback of the suspended particles, once entrained, on the vortex structure itself. Unfortunately, the limitations of this experiment meant that no joint analysis of the temporal and spatial attributes of the turbulence and suspension signals could be undertaken.

5. Conclusions

In this study, turbulence measurements at two elevations, outside of the theoretical thickness of the oscillatory boundary layer, are used to examine fundamental assumptions on the nature of shear stresses and momentum fluxes in collinear flows aligned with and opposing the direction of wave propagation over mobile bedforms. Our observations suggest that the core flow (outside of the combined wave-current boundary layer) is not uniform (purely current dominated) with its lower portion comprising eddies both advected downwards/upwards depending on prevailing interaction between the steady and unsteady shear components; as well as locally generated by the bed morphology. This highlights the limitation on existing models which impose a zero-flux condition at the interface. Waves, contribute to pick-up by vortex entrainment, making material readily available for transport by net currents in the nearbed and outer flow regions. The entrainment of sediment and maintaining it in suspension is associated with the passage of convected or locally formed packets of eddies linked to large and intense coherent turbulence structures within the flow [24]. The intermittent nature of both mass and momentum transfers thus warrants a re-assessment of the existing models for wave-current boundary layer thickness (to account for intermittent exchanges of momentum) and the invalidity of the zero-flux condition commonly imposed at its the interface with the outer layer.
The key findings from our experiments can be summarised as follows:
(1)
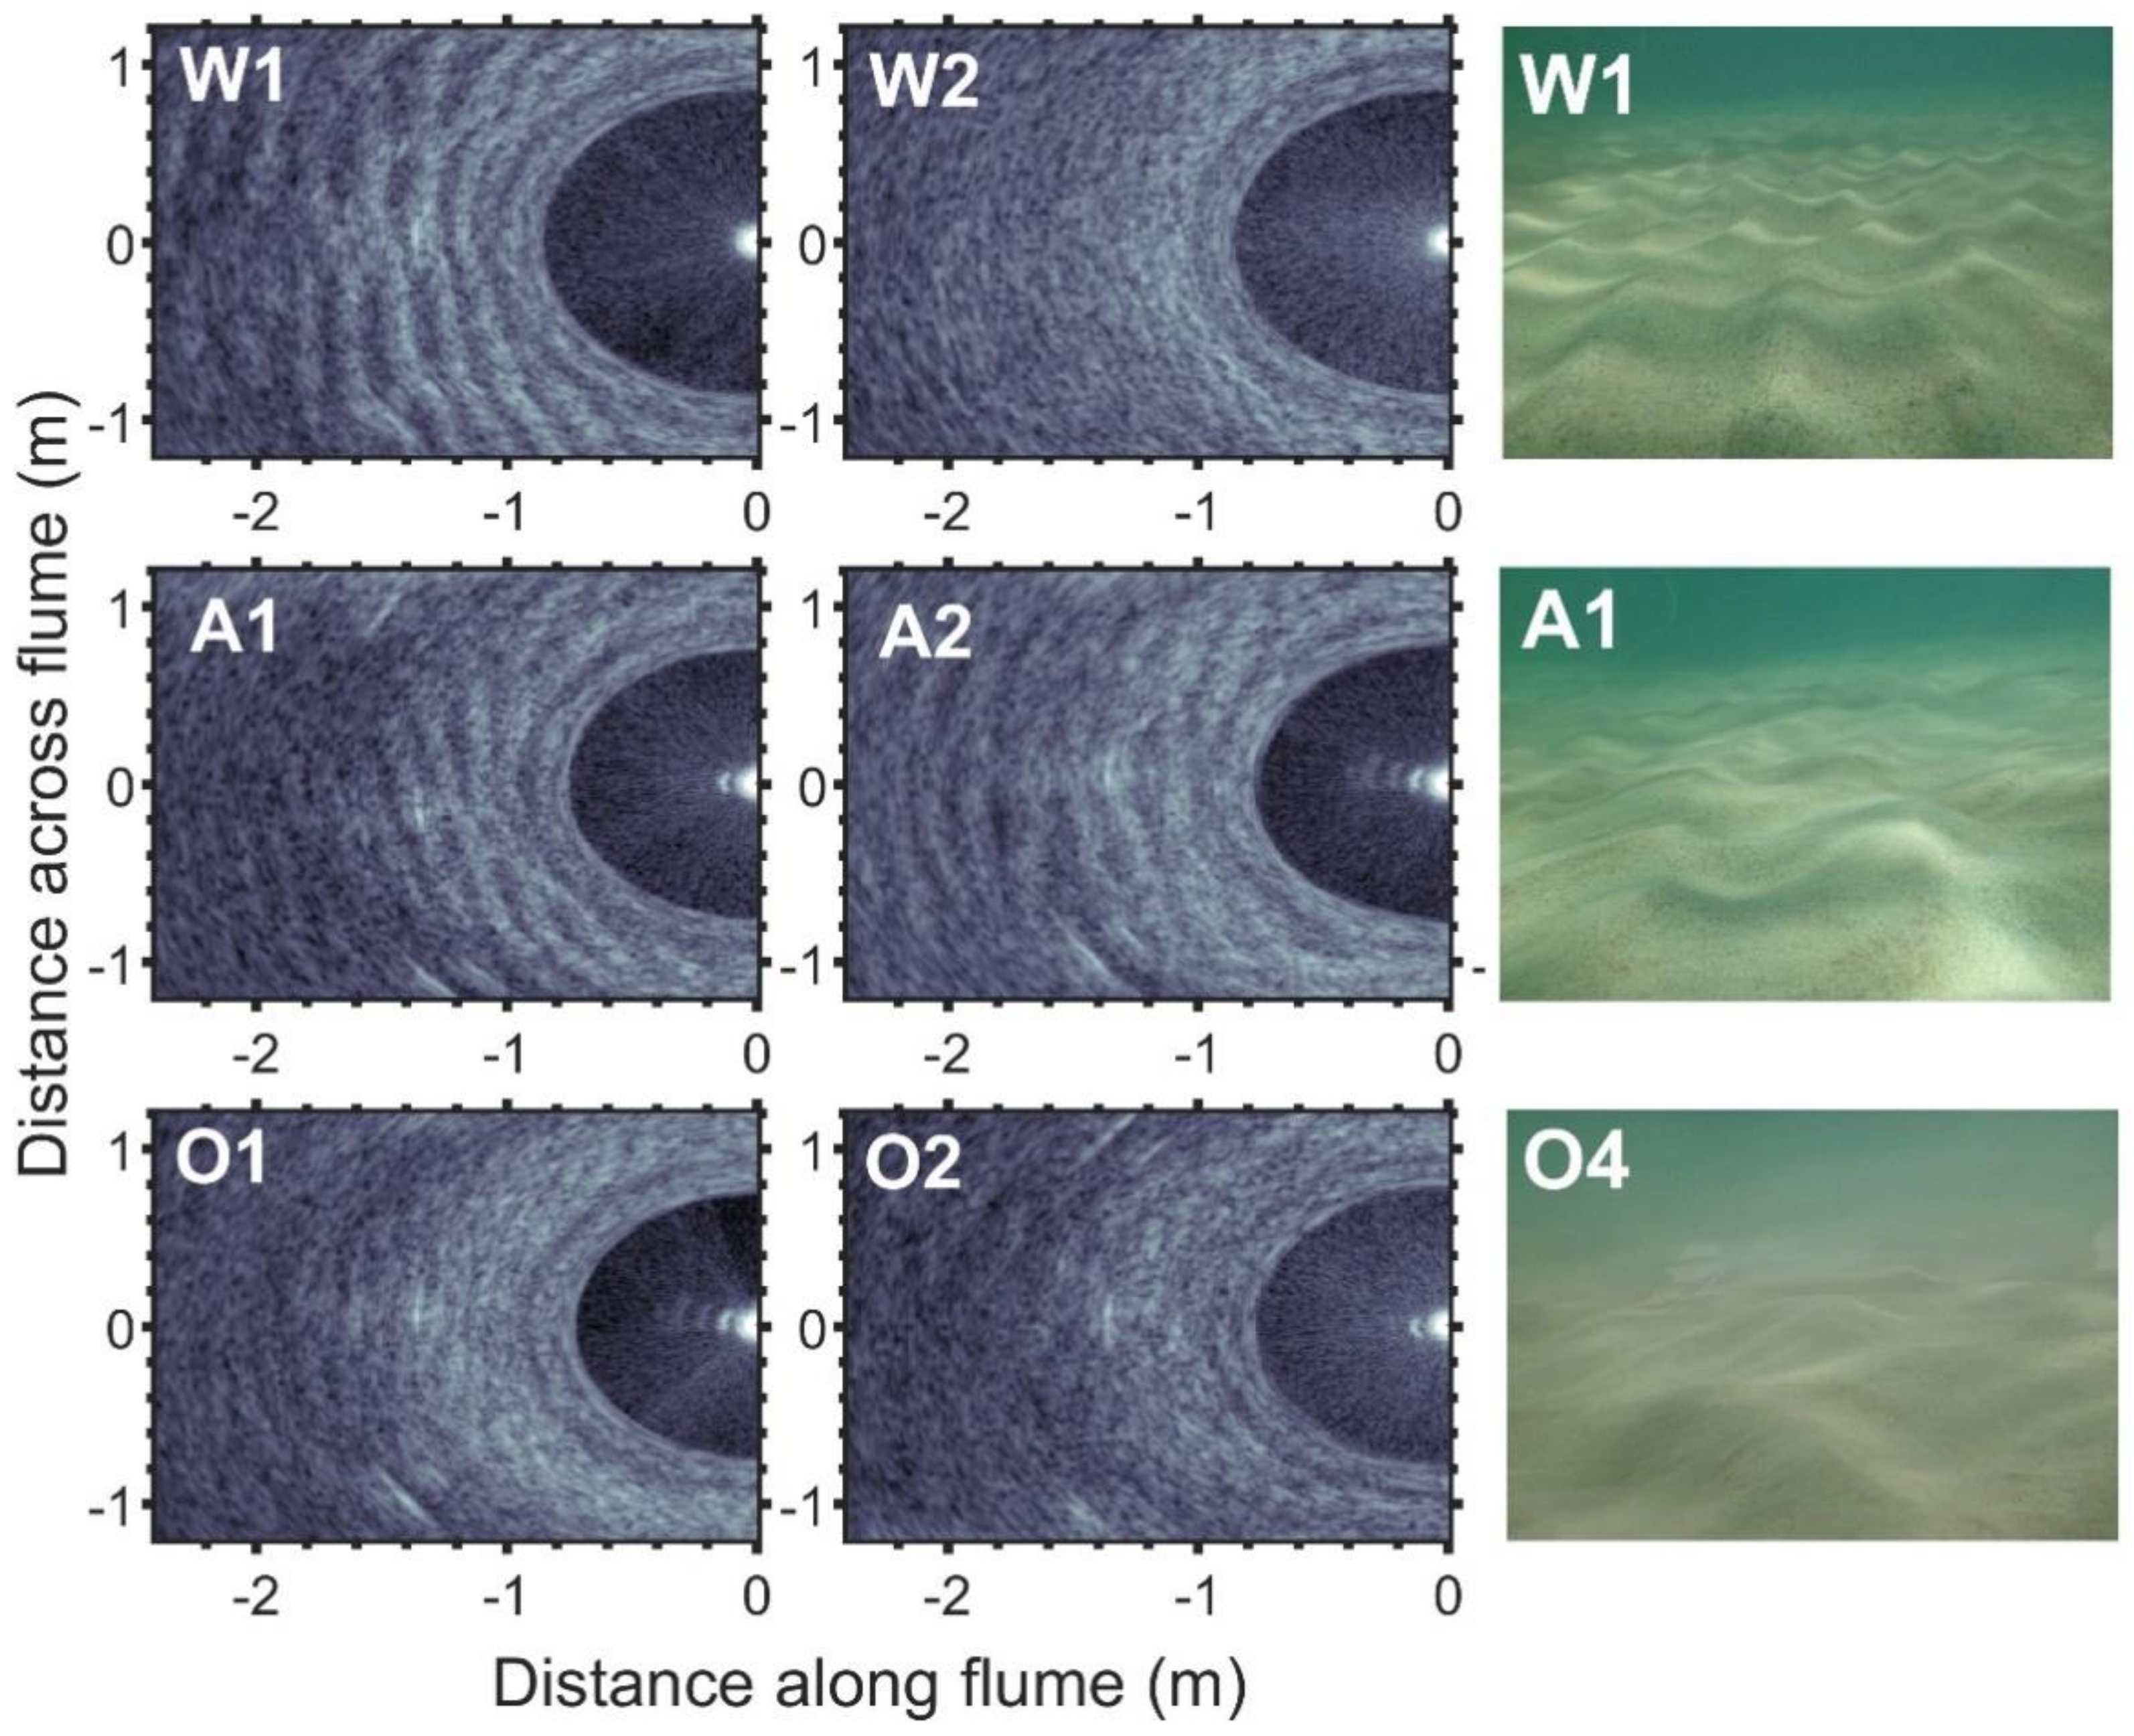
Combined (2.5D) wave-current ripples were observed in all runs with comparable wave and current strengths, with intense suspensions at flow reversal that persist-longer in aligned flows.
(2)
Near-bed interactions outside of the theoretical combined flow boundary layer were not uniform throughout the outer flow region, with discernible difference in flow structure and momentum exchange at the two elevations.
(3)
The aligned flows are characterised by upward turbulent fluxes with Reynolds stresses produced throughout the outer layer, whilst opposing flows featured downward turbulent flux of eddies generated in the core flow.
(4)
Spatial scales of turbulence indicate similar vertical scaling of eddies with fluxes extending beyond the theoretical thickness of the combined layer, often imposed as a zero-flux boundary in numerical models. It follows that the oscillatory (combined wave-current) boundary must be thicker than predicted by commonly used combined flow models.
(5)
In aligned flow, active lower-frequency (wave-related) periods of flow are characterised by pairs of counter-rotating vortices implying longer-lived wall-aligned structures prevail. Opposing flows are characterised by shorter-lived intense stress-bearing structures, hinting at higher dissipation rates. Intense momentum exchanges (with vortex shedding inducing suspension clouds) and plug flow sediment transport conditions are observed when strong adverse currents correspond with the reversing wave motion within each cycle.

Author Contributions

Conceptualization: H.K., I.H.T., C.E.L.T., C.L.A., R.J.S.W.; methodology, H.K., D.T., E.C., C.E.L.T., C.L.A., I.H.T.; formal analysis, H.K.; resources, H.K., R.J.S.W., I.H.T., C.E.L.T.; data curation, H.K.; writing—original draft preparation, H.K.; writing—review and editing, H.K., C.L.A., C.E.L.T., R.J.S.W.; visualization, H.K.; supervision, C.E.L.T., C.L.A., I.H.T.; project administration, H.K.; funding acquisition, H.K., I.H.T., C.E.L.T., C.L.A., R.J.S.W. All authors have read and agreed to the published version of the manuscript.

Funding

This work was undertaken during the lead author’s PhD candidacy at the University of Southampton, through a scholarship funded jointly by the Graduate School at the National Oceanography Centre Southampton, the Faculty of Engineering and the Environment and the Southampton Marine and Maritime Institute at the University of Southampton, and HR Wallingford Ltd. Access to the Fast Flow Facility was granted during its inaugural testing by HR Wallingford, as part of their contribution to the PhD.

Conflicts of Interest

The authors declare no conflict of interest.

References

  1. Soulsby, R.L.; Hamm, L.; Klopman, G.; Myrhaug, D.; Simons, R.R.; Thomas, G.P. Wave-current interaction within and outside the bottom boundary layer. Coast. Eng. 1993, 21, 41–69. [Google Scholar] [CrossRef]
  2. Soulsby, R. Dynamics of Marine Sands—A Manual for Practical Applications; Thomas Telford: London, UK, 1997; p. 249. [Google Scholar]
  3. Soulsby, R.L.; Clarke, S. Bed Shear Stress under Combined Waves and Currents on Smooth and Rough Beds; HR Wallingford: Wallingford, UK, 2005; p. 52. [Google Scholar]
  4. Davies, A.G.; Soulsby, R.L.; King, H.L. A numerical model of the combined wave and current bottom boundary layer. J. Geophys. Res. Oceans 1988, 93, 491–508. [Google Scholar] [CrossRef]
  5. Li, M.Z.; Amos, C.L. Sheet flow and large wave ripples under combined waves and currents: Field observations, model predictions and effects on boundary layer dynamics. Cont. Shelf Res. 1999, 19, 637–663. [Google Scholar] [CrossRef]
  6. Li, M.Z.; Amos, C.L. Field observations of bedforms and sediment transport thresholds of fine sand under combined waves and currents. Mar. Geol. 1999, 158, 147–160. [Google Scholar] [CrossRef]
  7. Wiberg, P.; Smith, J.D. A comparison of field data and theoretical models for wave-current interactions at the bed on the continental shelf. Cont. Shelf Res. 1983, 2, 147–162. [Google Scholar] [CrossRef]
  8. Grant, W.D.; Madsen, O.S. Combined wave and current interaction with a rough bottom. J. Geophys. Res. Oceans 1979, 84, 1797–1808. [Google Scholar] [CrossRef]
  9. Holmedal, L.E.; Myrhaug, D.; Rue, H. The sea bed boundary layer under random waves plus current. Cont. Shelf Res. 2003, 23, 717–750. [Google Scholar] [CrossRef]
  10. Kemp, P.H.; Simons, R.R. The interaction between waves and a turbulent current: Waves propagating with the current. J. Fluid Mech. 1982, 116, 227–250. [Google Scholar] [CrossRef] [Green Version]
  11. Kemp, P.H.; Simons, R.R. The interaction of waves and a turbulent current: Waves propagating against the current. J. Fluid Mech. 1983, 130, 73–89. [Google Scholar] [CrossRef] [Green Version]
  12. Bijker, E.W. The increase of bed shear in a current due to wave motion. In Proceedings of the 10th Conference Coastal Engineering, Tokyo, Japan, 5–8 September 1966; American Society of Civil Engineers: Tokyo, Japan, 1966. [Google Scholar]
  13. Jonsson, I.G. The Friction Factor for a Current Superimposed by Waves, in Coastal Engineering Lab Basic Research Progress Report; Technical University of Denmark: Copenhagen, Denmark, 1966; pp. 1–12. [Google Scholar]
  14. Christoffersen, J.B.; Jonsson, I.G. Bed friction and dissipation in a combined current and wave motion. Ocean Eng. 1985, 12, 387–423. [Google Scholar] [CrossRef]
  15. Fredsøe, J. Turbulent Boundary Layer in Wave-current Motion. J. Hydraul. Eng. 1984, 110, 1103–1120. [Google Scholar] [CrossRef]
  16. Huyng-Thanh, S.; Temperville, A. A numerical model of the rough boundary layer in combined wave and current interaction. In Proceedings of the 22nd International Conference on Coastal Engineering, Delft, The Netherlands, 2–6 July 1990. [Google Scholar]
  17. Myrhaug, D.; Slaattelid, O.H. Combined wave and current boundary layer model for fixed rough seabeds. Ocean Eng. 1989, 16, 119–142. [Google Scholar] [CrossRef]
  18. Van Kesteren, W.G.M.; Bakker, W.T. Near bottom velocities in waves with a current; analytical and numerical computations. In Proceedings of the 19th International Conference on Coastal Engineering, Houston, TX, USA, 3–7 September 1984. [Google Scholar]
  19. Malarkey, J.; Davies, A.G. Modelling wave–current interactions in rough turbulent bottom boundary layers. Ocean Eng. 1998, 25, 119–141. [Google Scholar] [CrossRef]
  20. Malarkey, J.; Davies, A.G. A simple procedure for calculating the mean and maximum bed stress under wave and current conditions for rough turbulent flow based on Soulsby and Clarke’s (2005) method. Comput. Geosci. 2012, 43, 101–107. [Google Scholar] [CrossRef]
  21. Dyer, K.R.; Soulsby, R.L. Sand Transport on the Continental Shelf. Annu. Rev. Fluid Mech. 1988, 20, 295–324. [Google Scholar] [CrossRef]
  22. Holmedal, L.E.; Johari, J.; Myrhaug, D. The seabed boundary layer beneath waves opposing and following a current. Cont. Shelf Res. 2013, 65, 27–44. [Google Scholar] [CrossRef]
  23. Grasso, F.; Ruessink, B.G. Turbulent viscosity in natural surf zones. Geophys. Res. Lett. 2012, 39, L23603. [Google Scholar] [CrossRef] [Green Version]
  24. Kassem, H.; Thompson, C.E.L.; Amos, C.L.; Townend, I.H. Wave-induced coherent turbulence structures and sediment resuspension in the nearshore of a prototype-scale sandy barrier beach. Cont. Shelf Res. 2015, 109, 78–94. [Google Scholar] [CrossRef] [Green Version]
  25. Shaw, W.J.; Trowbridge, J.H. The Direct Estimation of Near-Bottom Turbulent Fluxes in the Presence of Energetic Wave Motions. J. Atmos. Ocean. Technol. 2001, 18, 1540–1557. [Google Scholar] [CrossRef]
  26. Umeyama, M. Reynolds Stresses and Velocity Distributions in a Wave-Current Coexisting Environment. J. Waterw. Port Coast. Ocean Eng. 2005, 131, 203–212. [Google Scholar] [CrossRef]
  27. Dingemans, M.W.; van Kester, J.A.T.M.; Radder, A.C.; Uittenbogaard, R.E. The effect of the CL-vortex force in 3D wave-current interaction. In Proceedings of the 25th International Conference on Coastal Engineering, Orlando, FL, USA, 2–6 September 1996; ASCE: Orlando, FL, USA, 1996. [Google Scholar]
  28. Glenn, S.M.; Grant, W.D. A suspended sediment stratification correction for combined wave and current flows. J. Geophys. Res. Oceans 1987, 92, 8244–8264. [Google Scholar] [CrossRef]
  29. Klopman, G. Secondary circulation of the flow due to waves—Laser-doppler flow measurements following or opposing a current. In Hydraulic Engineering Reports; Rijkswaterstaat National Institute for Coastal and Marine Management (RIKZ): Delft, The Netherlands, 1997; p. 77. [Google Scholar]
  30. Lumley, J.L.; Terray, E.A. Kinematics of Turbulence Convected by a Random Wave Field. J. Phys. Oceanogr. 1983, 13, 2000–2007. [Google Scholar] [CrossRef] [Green Version]
  31. Trowbridge, J.; Elgar, S. Turbulence Measurements in the Surf Zone. J. Phys. Oceanogr. 2001, 31, 2403–2417. [Google Scholar] [CrossRef]
  32. Sherwood, C.R.; Lacy, J.R.; Voulgaris, G. Shear velocity estimates on the inner shelf off Grays Harbor, Washington, USA. Cont. Shelf Res. 2006, 26, 1995–2018. [Google Scholar] [CrossRef]
  33. Hare, J.; Hay, A.E.; Zedel, L.; Cheel, R. Observations of the space-time structure of flow, turbulence, and stress over orbital-scale ripples. J. Geophys. Res. Oceans 2014, 119, 1876–1989. [Google Scholar] [CrossRef]
  34. Tucker, M.J.; Pitt, E.G. Waves in ocean engineering. In Elsevier Ocean Engineering Book Series; Elsevier: Amsterdam, The Netherlands, 2001; Volume 5. [Google Scholar]
  35. Hunt, J.N. Direct solution of wave dispersion equation. J. Waterw. Ports Coast. Ocean Eng. Eng. Div. ASCE 1979, 105, 457–459. [Google Scholar]
  36. Elgar, S.; Raubenheimer, B.; Guza, R.T. Quality control of acoustic Doppler velocimeter data in the surfzone. Meas. Sci. Technol. 2005, 16, 1889. [Google Scholar] [CrossRef]
  37. Mori, N.; Suzuki, T.; Kakuno, S. Noise of Acoustic Doppler Velocimeter Data in Bubbly Flows. J. Eng. Mech. 2007, 133, 122–125. [Google Scholar]
  38. Goring, D.; Nikora, V. Despiking Acoustic Doppler Velocimeter Data. J. Hydraul. Eng. 2002, 128, 117–126. [Google Scholar] [CrossRef] [Green Version]
  39. Nikora, V.; Goring, D. ADV Measurements of Turbulence: Can We Improve Their Interpretation? J. Hydraul. Eng. 1998, 124, 630–634. [Google Scholar] [CrossRef]
  40. Thompson, C.E.L.; Williams, J.J.; Metje, N.; Coates, L.E.; Pacheco, A. Turbulence based measurements of wave friction factors under irregular waves on a gravel bed. Coast. Eng. 2012, 63, 39–47. [Google Scholar] [CrossRef]
  41. Elgar, S.; Raubenheimer, B.; Guza, R.T. Current Meter Performance in the Surf Zone. J. Atmos. Ocean. Technol. 2001, 18, 1735–1746. [Google Scholar] [CrossRef]
  42. Soulsby, R.L.; Humphery, J.D. Field Observations of Wave-Current Interaction at the Sea Bed. In Water Wave Kinematics; Tørum, A., Gudmestad, O.T., Eds.; Springer: Amsterdam, The Netherlands, 1990; pp. 413–428. [Google Scholar]
  43. Ruessink, B.G. Observations of Turbulence within a Natural Surf Zone. J. Phys. Oceanogr. 2010, 40, 2696–2712. [Google Scholar] [CrossRef] [Green Version]
  44. Feddersen, F. Quality Controlling Surf Zone Acoustic Doppler Velocimeter Observations to Estimate the Turbulent Dissipation Rate. J. Atmos. Ocean. Technol. 2010, 27, 2039–2055. [Google Scholar] [CrossRef]
  45. Doucette, J.S.; O’Donoghue, T. Response of sand ripples to change in oscillatory flow. Sedimentology 2006, 53, 581–596. [Google Scholar] [CrossRef]
  46. O’Donoghue, T.; Doucette, J.S.; van der Werf, J.; Ribberink, J.S. The dimensions of sand ripples in full-scale oscillatory flows. Coast. Eng. 2006, 53, 997–1012. [Google Scholar] [CrossRef]
  47. Pope, S.B. Turbulent Flows; Cambridge University Press: Cambridge, UK, 2000; p. 771. [Google Scholar]
  48. Thompson, C.E.L.; Amos, C.L.; Jones, T.E.R.; Chaplin, J. The Manifestation of Fluid-Transmitted Bed Shear Stress in a Smooth Annular Flume-a Comparison of Methods. J. Coast. Res. 2003, 19, 1094–1103. [Google Scholar]
  49. Grant, W.D.; Madsen, O.S. The Continental-Shelf Bottom Boundary Layer. Annu. Rev. Fluid Mech. 1986, 18, 265–305. [Google Scholar] [CrossRef]
  50. Nielsen, P. Suspended sediment concentrations under waves. Coast. Eng. 1986, 10, 23–31. [Google Scholar] [CrossRef]
  51. Neumeier, U.; Ferrarin, C.; Amos, C.L.; Umgiesser, G.; Li, M.Z. Sedtrans05: An improved sediment-transport model for continental shelves and coastal waters with a new algorithm for cohesive sediments. Comput. Geosci. 2008, 34, 1223–1242. [Google Scholar] [CrossRef]
  52. Willmarth, W.W.; Lu, S.S. Structure of the Reynolds stress near the wall. J. Fluid Mech. 1972, 55, 65–92. [Google Scholar] [CrossRef]
  53. Bogard, D.G.; Tiederman, W.G. Burst detection with single-point velocity measurements. J. Fluid Mech. 1986, 162, 389–413. [Google Scholar] [CrossRef]
  54. Cellino, M.; Lemmin, U. Influence of Coherent Flow Structures on the Dynamics of Suspended Sediment Transport in Open-Channel Flow. J. Hydraul. Eng. 2004, 130, 1077–1088. [Google Scholar] [CrossRef]
  55. Longo, S.; Chiapponi, L.; Clavero, M.; Mäkelä, T.; Liang, D. Study of the turbulence in the air-side and water-side boundary layers in experimental laboratory wind induced surface waves. Coast. Eng. 2012, 69, 67–81. [Google Scholar] [CrossRef]
  56. Taylor, G.I. The Spectrum of Turbulence. Proc. R. Soc. Lond. Ser. A Math. Phys. Sci. 1938, 164, 476–490. [Google Scholar] [CrossRef] [Green Version]
  57. Wyngaard, J.C.; Clifford, S.F. Taylor’s Hypothesis and High–Frequency Turbulence Spectra. J. Atmos. Sci. 1977, 34, 922–929. [Google Scholar] [CrossRef] [Green Version]
  58. Tennekes, H.; Lumley, J.L. A First Course in Turbulence; MIT Press: Cambridge, MA, USA, 1972; p. 300. [Google Scholar]
  59. Soulsby, R.L. Similarity Scaling of Turbulence Spectra in Marine and Atmospheric Boundary Layers. J. Phys. Oceanogr. 1977, 7, 934–937. [Google Scholar]
  60. Soulsby, R.L.; Salkield, A.P.; le Good, G.P. Measurements of the turbulence characteristics of sand suspended by a tidal current. Cont. Shelf Res. 1984, 3, 439–454. [Google Scholar] [CrossRef]
  61. Grasso, F.; Castelle, B.; Ruessink, B.G. Turbulence dissipation under breaking waves and bores in a natural surf zone. Cont. Shelf Res. 2012, 43, 133–141. [Google Scholar] [CrossRef]
  62. Daubechies, I. The wavelet transform, time-frequency localization and signal analysis. IEEE Trans. Inf. Theory 1990, 36, 961–1005. [Google Scholar] [CrossRef] [Green Version]
  63. Torrence, C.; Compo, G.P. A Practical Guide to Wavelet Analysis. Bull. Am. Meteorol. Soc. 1998, 79, 61–78. [Google Scholar] [CrossRef] [Green Version]
  64. Grinsted, A.; Moore, J.C.; Jevrejeva, S. Application of the cross wavelet transform and wavelet coherence to geophysical time series. Nonlinear Process. Geophys. 2004, 11, 561–566. [Google Scholar] [CrossRef]
  65. Morlet, J. Sampling Theory and Wave Propagation. In Issues in Acoustic Signal—Image Processing and Recognition; Chen, C.H., Ed.; Springer: Berlin/Heidelberg, Germany, 1983; pp. 233–261. [Google Scholar]
  66. Morlet, J.; Arens, G.; Fourgeau, E.; Giard, D. Wave propagation and sampling theory; Part I, Complex signal and scattering in multilayered media. Geophysics 1982, 47, 203–221. [Google Scholar] [CrossRef] [Green Version]
  67. Morlet, J.; Arens, G.; Fourgeau, E.; Giard, D. Wave propagation and sampling theory; Part II, Sampling theory and complex waves. Geophysics 1982, 47, 222–236. [Google Scholar] [CrossRef]
  68. Lau, K.M.; Weng, H. Climate Signal Detection Using Wavelet Transform: How to Make a Time Series Sing. Bull. Am. Meteorol. Soc. 1995, 76, 2391–2402. [Google Scholar] [CrossRef] [Green Version]
  69. Foufoula-Georgiou, E.; Kumar, P. Wavelets in Geophysics; Academic Press: San Diego, CA, USA, 1994; p. 373. [Google Scholar]
  70. Farge, M.; Kevlahan, N.; Perrier, V.; Goirand, E. Wavelets and turbulence. Proc. IEEE 1996, 84, 639–669. [Google Scholar]
  71. Soulsby, R.L. Simplified Calculation of Wave Orbital Velocities; HR Wallingford: Wallingford, UK, 2006; p. 28. [Google Scholar]
  72. Dumas, S.; Arnott, R.W.C.; Southard, J.B. Experiments on Oscillatory-Flow and Combined-Flow Bed Forms: Implications for Interpreting Parts of the Shallow-Marine Sedimentary Record. J. Sediment. Res. 2005, 75, 501–513. [Google Scholar] [CrossRef]
  73. Perillo, M.M.; Best, J.L.; Yokokawa, M.; Sekiguchi, T.; Takagawa, T.; Garcia, M.H. A unified model for bedform development and equilibrium under unidirectional, oscillatory and combined-flows. Sedimentology 2014, 61, 2063–2085. [Google Scholar] [CrossRef] [Green Version]
  74. Amos, C.L.; Bowen, A.J.; Huntley, D.A.; Lewis, C.F.M. Ripple generation under the combined influences of waves and currents on the Canadian continental shelf. Cont. Shelf Res. 1988, 8, 1129–1153. [Google Scholar] [CrossRef]
  75. Li, M.Z.; Amos, C.L. Predicting ripple geometry and bed roughness under combined waves and currents in a continental shelf environment. Cont. Shelf Res. 1998, 18, 941–970. [Google Scholar] [CrossRef]
  76. Sleath, J.F.A. Conditions for plug formation in oscillatory flow. Cont. Shelf Res. 1999, 19, 1643–1664. [Google Scholar] [CrossRef]
  77. Foster, D.L.; Bowen, A.J.; Holman, R.A.; Natoo, P. Field evidence of pressure gradient induced incipient motion. J. Geophys. Res. Oceans 2006, 111. [Google Scholar] [CrossRef]
  78. Keylock, C.J. A criterion for delimiting active periods within turbulent flows. Geophys. Res. Lett. 2008, 35, L11804. [Google Scholar] [CrossRef]
  79. Keylock, C.J.; Singh, A.; Foufoula-Georgiou, E. The influence of migrating bed forms on the velocity-intermittency structure of turbulent flow over a gravel bed. Geophys. Res. Lett. 2013, 40, 1351–1355. [Google Scholar] [CrossRef]
  80. Frisch, U. Turbulence: The Legacy of A.N. Kolmogorov; Cambridge University Press: Cambridge, UK, 1995; p. 296. [Google Scholar]
  81. Arneodo, A.; Benzi, R.; Berg, J.; Biferale, L.; Bodenschatz, E.; Busse, A.; Calzavarini, E.; Toschi, F. Universal Intermittent Properties of Particle Trajectories in Highly Turbulent Flows. Phys. Rev. Lett. 2008, 100, 254504. [Google Scholar] [CrossRef] [Green Version]
  82. Paret, J.; Tabeling, P. Intermittency in the two-dimensional inverse cascade of energy: Experimental observations. Phys. Fluids 1998, 10, 3126–3136. [Google Scholar] [CrossRef]
  83. Welch, P. The use of fast Fourier transform for the estimation of power spectra: A method based on time averaging over short, modified periodograms. IEEE Trans. Audio Electroacoust. 1967, 15, 70–73. [Google Scholar] [CrossRef] [Green Version]
  84. Heathershaw, A.D. The turbulent structure of the bottom boundary layer in a tidal current. Geophys. J. R. Astron. Soc. 1979, 58, 395–430. [Google Scholar] [CrossRef] [Green Version]
  85. Southgate, H.N.; Oliver, N. Efficient Solution to the Current-Depth Dispersion Equation; Hydraulic Research Wallingford: Wallingford, UK, 1989; p. 55. [Google Scholar]
  86. Lozano-Duran, A.; Flores, O.; Jimenez, J. The three-dimensional structure of momentum transfer in turbulent channels. J. Fluid Mech. 2012, 694, 100–130. [Google Scholar] [CrossRef]
  87. Lozano-Durán, A.; Jiménez, J. Time-resolved evolution of coherent structures in turbulent channels: Characterization of eddies and cascades. J. Fluid Mech. 2014, 759, 432–471. [Google Scholar] [CrossRef] [Green Version]
  88. Buchner, A.J.; Lozano-Durán, A.; Kitsios, V.; Atkinson, C.; Soria, J. Local topology via the invariants of the velocity gradient tensor within vortex clusters and intense Reynolds stress structures in turbulent channel flow. J. Phys. Conf. Ser. 2016, 708, 012005. [Google Scholar] [CrossRef] [Green Version]
  89. Jeong, J.; Hussain, F.; Schoppa, W.; Kim, J. Coherent structures near the wall in a turbulent channel flow. J. Fluid Mech. 1997, 332, 185–214. [Google Scholar] [CrossRef] [Green Version]
  90. Keylock, C.J.; Lane, S.N.; Richards, K.S. Quadrant/octant sequencing and the role of coherent structures in bed load sediment entrainment. J. Geophys. Res. Earth Surf. 2014, 119, 264–286. [Google Scholar] [CrossRef]
Figure 1. An illustration of boundary layer structure under regular waves ( δ w ) and steady currents ( δ c ), and the associated shear stresses. The vectorial addition of mean ( τ m ) and maximum ( τ c w , m a x ) stresses in combined oscillatory (Uw) and steady (Uz) flows is shown, as is the zero-flux boundary condition, whereby k : kinetic energy, ϵ : energy dissipation, ν T : eddy viscosity, w s : sediment settling velocity, and C : sediment concentration.
Water 12 03515 g001
Figure 2. (a) Layout and dimensions of the Fast Flow Facility, showing the wave paddle, the sandy bed section and the scour pit within the primary channel, and the two pumps in the secondary channel; (b) cross-sectional view of the instrumented frame showing instrument configuration and vertical offsets; (c) plan view of the instrumented frame with distances from the central flume wall. ADV: acoustic Doppler velocimeter, SIS: sediment imaging sonar, SSS: sector scanning sonar.
Water 12 03515 g002
Figure 3. Plan view of bed morphology observed through SSS scans at the end of each test run, and underwater photographs of selected runs.
Water 12 03515 g003
Figure 4. Unconditioned and conditional, instantaneous, joint probability density function of the streamwise-vertical Reynolds stresses ( u w in (x–z)) plane, distributed across 4 quadrant types Q1 (Outward interaction, OI); Q2 (Ejection, E); Q3 (Inward Interaction, II); and Q4 (Sweep, S). The effect of the threshold is shown for H = 1 and H = 4 (see text for information on colour coding).
Water 12 03515 g004
Figure 5. Contribution of the four types of quadrant events: Outward interactions (OI); Ejections (E); Inward Interactions (II) and Sweeps (S) to the Reynolds stress ( τ xz ). A threshold H = 1 is applied. Note the dominance of flow aligned motions (Q1 and Q4 in the aligned flow cases; and Q2 and Q3 in the opposing flow cases).
Water 12 03515 g005
Figure 6. Non-dimensional, pre-multiplied wave number spectra of vertical fluctuations ( w ), normalised in an energy preserving form (equal area under the curve represents equal energy) for (a) measurements at the higher ADV1 elevation; and (b) measurements at the lower ADV2 elevation. (c) Rate of vertical turbulent transport (turbulent kinetic energy flux in the vertical), T v .
Water 12 03515 g006
Figure 7. Continuous wavelet transforms (CWT) of the instantaneous turbulent momentum flux (Reynolds stress u w ¯ in the stream-wise vertical plane), measured at two elevations: ADV1 (higher) and ADV2 (lower), located outside the theoretical thickness of the oscillatory boundary layer δ cw , theory ; for exemplary runs W1 (waves-only); A2 (current aligned with waves); and O2 (current opposing wave). In each panel, the warmer colours (yellows) indicate higher spectral power (variance); the white shaded region represents the cone of influence, and the thicker, black contour lines delimit the 95% confidence limits (5% significance against red noise given by a Monte Carlo simulation). The y-axes defines the frequency scales of turbulent momentum exchanges in the streamwise-vertical plane, represented here as periods (inverse frequency) for clarity.
Water 12 03515 g007
Figure 8. Variance-normalised, global wavelet power of the instantaneous, turbulent momentum flux (Reynolds stress u w in the stream-wise vertical plane), measured at two elevations: (a) ADV1 (higher) and (b) ADV2 outside the theoretical thickness of the oscillatory boundary layer ( δ cw , theory ) for all test runs. The global power pertains to the time average of all local wavelet spectra (i.e., all the vertical slices through the wavelet plot); and the red lines in these subplots denote the 95% confidence level for the global wavelet spectra, tested in a time-averaged sense using autocorrelation of background noise.
Water 12 03515 g008
Figure 9. Turbulence dissipation rate, ε   m 2 / s 3 against frequency calculated for ADV2.
Water 12 03515 g009
Table 1. Hydrodynamic forcing during the experimental runs. Symbols   h : mean water dept   U c ¯ h;: depth-averaged, mean current speed (from pump calibration); ϕ cw relative angle between the mean current and the direction of wave propagation;   H m ¯ : mean wave height; H m 0 : zero-moment significant wave height; H max : maximum wave height (* indicates values derived from measured velocities using linear wave theory); T p : peak wave period; Z ADV : height of ADV measurement (sampling volume) above bed at start of run; U Z ADV : mean (ensemble-averaged) flow velocity at height of ADV sampling volume.
Test Run h m U ¯ c m / s ϕ c w (°) H m ¯   (m) H m 0   (m) H m a x   (m) T p   (s)ADV Z A D V
(m)
U Z A D V
(m/s)
Run W11.050--0.18 *0.17 *0.18 *3.04ADV10.160.17
ADV20.090.14
Run W21.550--0.220.230.253.03ADV10.180.18
ADV20.120.17
Run A11.050.4800.17 *0.17 *0.23 *2.00ADV10.160.40
ADV20.070.31
Run A21.050.4800.17 *0.17 *0.20 *3.03ADV10.180.38
ADV20.070.29
Run A31.550.5000.200.210.263.04ADV10.180.28
ADV20.130.23
Run O11.060.501800.17 0.190.27 2.00ADV10.160.45
ADV20.110.38
Run O21.050.381800.17 0.170.20 3.03ADV10.170.30
ADV20.110.26
Run O31.060.561800.18 0.220.27 2.00ADV10.170.42
ADV20.110.34
Run O41.550.301800.170.260.323.04ADV10.190.27
ADV20.100.24
Table 2. Observed bed morphology and mode of sediment transport in each test run: λ r ¯ : mean ripple wavelength; η r ¯ : mean ripple height.
Test Run λ r ¯
(m)
η r ¯ (m)Ripple GeometryTransport Mode
Run W10.080.042D symmetric vortex-type, wave ripplesBedload
Run W20.160.072D symmetric rolling grain wave ripples Bedload
Run A10.1230.0562.5D, symmetric, rolling-grain ripplesBedload, vortex shedding
Run A20.200.062D, symmetric, round-crested ripplesBedload, vortex-shedding & intermittent suspension
Run A30.23–0.27 0.063D current-dominated, sharp crested, asymmetric ripples, sinuous transitioning to linguoidBedload, vortex shedding
Run O10.090.0352D, asymmetric current-skewed ripplesBed load, vortex shedding
Run O20.200.062D, symmetric round-crested ripplesBedload, vortex-shedding
Run O30.1650.0782.5D, symmetric, round-crested bi-convex profile with pronounced scour on lower end of stossBedload, intermittent suspension
Run O40.0280.062D, symmetric round-crestedSuspension, with avalanching along stoss at flow reversal (plug flow)
Table 3. Estimated and predicted mean and maximum shear stresses, and corresponding maximum oscillating (/combined wave-current) boundary layer thickness, δ cw , max derived from shear velocities inferred through the turbulent kinetic energy method for ADV1 and ADV2; and the models of GM86 (effective: τ 0 , cw ¯ eff , and transport-enhanced, τ 0 , cw , tr ¯ ), SC05, and MD12.
Test RunEstimated from MeasurementPredictions
ADV1ADV2 δ m a x = k u 2 * / ω
(m)
Nielsen-modified Grant & Madsen (1986)—GM86Soulsby & Clarke (2005)—SC05Malarkey & Davies (2012)—MD12
τ ¯ k E (Pa) τ k E , max (Pa) τ ¯ k E (Pa) τ k E , max (Pa) τ 0 , cw ¯ eff
(Pa)
Transport-enhanced
τ 0 , cw , tr ¯ (Pa)
δ cw max
(m)
τ 0 , cw ¯
(Pa)
τ 0 , cw max
(Pa)
δ cw max
(m)
τ 0 , cw ¯
(Pa)
τ 0 , cw max
(Pa)
δ cw max
(m)
Run W10.0170.420.395.50.020.342.90.01900.310.00200.450.004
Run W20.0260.500.081.70.0140.292.70.01900.40.002300.350.002
Run A10.222.360.343.780.0112.60.020.461.10.00140.471.20.009
Run A20.122.170.162.880.0111.23.70.0190.440.930.0020.430.80.0011
Run A30.0621.120.142.720.0151.175.180.0170.430.880.00160.420.950.0019
Run O10.173.290.193.420.011.054.620.030.541.50.0020.61.00.008
Run O20.0611.120.11.670.0140.964.290.0250.290.720.00180.320.920.012
Run O30.162.600.193.750.011.457.40.010.661.70.00190.621.50.001
Run O40.061.060.254.90.0161.317.220.0250.190.590.00190.220.880.0023
Table 4. Integral vertical length scales, L w (m), derived from non-dimensional wave-number spectra.
RunWave-OnlyAligned-Flow RunsOpposing Flow Runs
W1W2A1A2A3O1O2O3O4
ADV10.027 to 0.03 m0.036 m0.126 m0.08 m0.06 m0.08 to 0.1 m0.06 m0.09 m0.062 m
ADV20.03 m0.03; 0.06 m0.05 m0.04 m0.055 m0.1; 0.14 m0.06 m0.07 m0.05 m
Publisher’s Note: MDPI stays neutral with regard to jurisdictional claims in published maps and institutional affiliations.

